CIITS: School & District Reports - edtech.fcps.net · School & District Data 1.Access depends on...
34
CIITS: School & District Reports Ed Bonhaus, Instructional Technology Consultant, Kenton County Schools Lyndsey Robinson, CIITS Integration Specialist, Kentucky Department of Education
Transcript of CIITS: School & District Reports - edtech.fcps.net · School & District Data 1.Access depends on...

CIITS: School & District Reports
Ed Bonhaus, Instructional Technology Consultant, Kenton County Schools
Lyndsey Robinson, CIITS Integration Specialist, Kentucky Department of Education

Agenda
1. School & District Data Overview2. Report Bank3. Pre-Formatted Reports4. Custom Reports5. Analysis Spreadsheets6. Student Performance7. Publishing Reports to School & District Banks8. Publishing Reports to Teachers

School & District Data
1.Access depends on your roles and permissions within CIITS
5.District level allow access to all
schools
3.Analyst can view Aggregate Level Data
2.Leadership & Specialist can view Student & Aggregate Level Data
6.School level only allows access to the schools you
are assigned
4.Teachers can view Student Level Data
7.Teachers can only view their students

School & District Reports
Users with Leadership, Specialist & Analyst roles have access to School & District Data in CIITSScroll over the School & District Data tab to see the different report options available
Benchmark Tests –allow the user to run
reports for school and district interim
assessments that were created,
assigned and taken in CIITS
Course/Section Lists – allow the user to run reports for students enrolled in specific courses and/or sections (by teacher)
Saved Reports –reports a user has
created and saved
QRC: School & District Data
Module Overview

Report Bank
Access the Report Bank Roll cursor over School & District Data click on Report Bank
Depending on your role you may choose to view District Level (County) Reports or Select a specific
school to view School Level Reports

Report Bank
Report Bank Available Categories
Click on Plus Sign to Drill Down and
view available Reports
Example:
Updated 2014-2015
MAP Reports
* Most updated reports on top
May be additional Reports in Uncategorized

Report Bank
Report Bank Updated Reports Available
2013-2014 Gifted & Talented (GT) K-Prep & K-Prep End-Of-Course Reports
2013-2014 Limited English Proficiency (LEP) K-Prep & K-Prep End-Of-
Course Reports
2014-2015 STAR Reports
2013-2014 Student Growth Reports
Report Bank
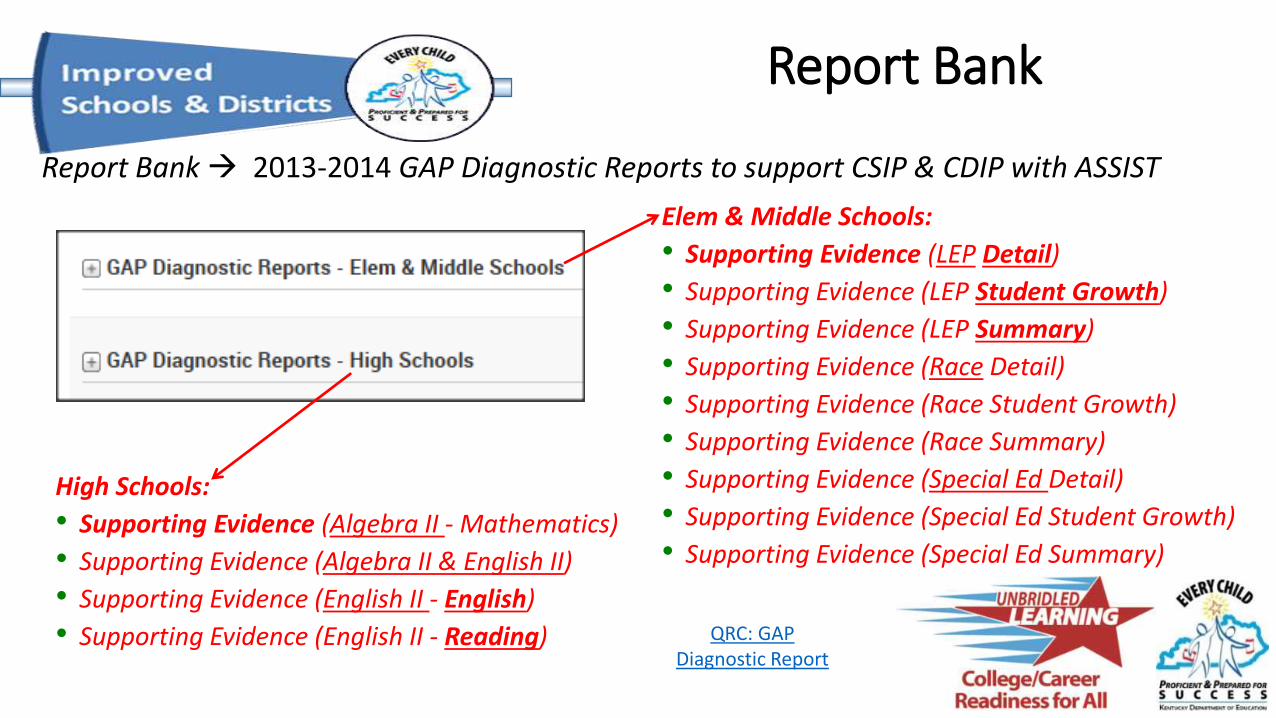
Report Bank 2013-2014 GAP Diagnostic Reports to support CSIP & CDIP with ASSIST
Elem & Middle Schools:
• Supporting Evidence (LEP Detail)
• Supporting Evidence (LEP Student Growth)
• Supporting Evidence (LEP Summary)
• Supporting Evidence (Race Detail)
• Supporting Evidence (Race Student Growth)
• Supporting Evidence (Race Summary)
• Supporting Evidence (Special Ed Detail)
• Supporting Evidence (Special Ed Student Growth)
• Supporting Evidence (Special Ed Summary)
High Schools:
• Supporting Evidence (Algebra II - Mathematics)
• Supporting Evidence (Algebra II & English II)
• Supporting Evidence (English II - English)
• Supporting Evidence (English II - Reading) QRC: GAP Diagnostic Report

Report Bank

Pre-Formatted Reports
Access Pre-formatted Reports Roll cursor over School & District Data click on Pre-Formatted Reports

Pre-Formatted ReportsPre-Formatted Reports Available
“Test Year” will determine which “Test Name” options are available (depending if
data has been loaded to CIITS)
Current Enrollment (students enrolled at the point in time when you run the report)
Total Enrollment for a year (all students enrolled during that school year)
Click on name of report Choose Report Parameters

Pre-Formatted Reports
Pre-formatted Report for MAP: Aggregated 2014-2015 MAP Data for an
entire District
Options to Save, Create PDF or Export to Excel
Parameters for Report (click edit to change the
parameters)
Click on any number within the table to drill down and view a student listing for that group
(only available for leadership and specialist)Recommended Reports Student Growth Reports
My Reports Any Reports You Have Created & Saved
Advanced Create Your Own Report From Scratch
QRC: Creating Pre-Formatted Reports

Pre-Formatted Reports

Custom Reports
Access Custom Reports Roll cursor over School & District Data click on Custom Reports

Custom ReportsCustom Reports or Analysis Spreadsheets start with a
Student Set
Create the filters needed to define your
student set
After defining each filter click Apply Filter (student set numbers
will update after applying a filter)
Watch this number to
determine how many students
are in your current set
After defining your student set
choose one of the following options
Custom Report – Aggregate Analysis Spreadsheet –Student Listing / Columns
*Student Set – is NOT the Data you want on
the report, but the set of students you want to be
used for the data
ClickGo

Custom Reports
Custom Reports (Aggregate) Analysis Spreadsheet (Student Listing / Columns)
Add up to 26 columns
Choose how you would like to view your spreadsheet, or you can save
and use later
Choose your viewing option
Choose your data
Run your
report
QRC: Creating Custom Reports

Why Analysis Spreadsheets in CIITS?
• Student data in one location
• Easier to create CIITS Analysis Spreadsheets than IC Ad Hoc Reports
• Easily publish to Leadership & Teachers
• Contextualized by school and teacher
• Export into Excel for further data manipulation

Building an Analysis Spreadsheet
CIITS Analysis Spreadsheet Planning• Plan out the report columns
beforehand
• Who do you want in your analysis spreadsheet? (student set)
• What data do you want and how do you want it displayed?

Building the Spreadsheet
• School & District Data
• Report Builder
• Build a Custom Report
• Build a Student Set
Build a Student Set – allow the user to create a filtered list of students (grade
level, race, gender, etc.)

Define Student Set
• Select your Filter• Course/Section Enrollment
• School Type, School, Grade
• Demographic Data• Gender, Race, etc.
• After designing the filters, select Continue to Analysis Spreadsheet, then Go.
Tip – if you want to save your student filter, select Save
Student Set.

Build the Spreadsheet
• Using your planning document to begin building your columns.• School Years – most recent or
specify the school year
• Columns can NOT be renumbered or moved. Plan ahead carefully.• If you want column renumbering
please use the CIITS Suggestion Box
• As you build your Spreadsheet use Preview Spreadsheet to check data

Save Columns
• To Save the Analysis Spreadsheet Columns, select Save Columns.
• Enter a Report Name and Description.• If this will be published to
teachers, select Report Parameters only, otherwise select Complete Report.
• Category, Grade Range, and Subject are optional.

Export to Excel
• Analysis Spreadsheet data is limited to 50 students at a time. To view all students, Export the spreadsheet to Excel.• Data is more easily manipulated in Excel.
CIITS
Excel

Accessing Published Analysis Spreadsheets
Classroom Teachers
School & District
These directions are available on the IFL page.

Custom Reports

Student Performance
Leadership, Specialist & Teacher roles have access to Student Performance in CIITSScroll over the Classrooms tab and click on Student Performance

Student PerformanceChoose the Section to view student performance
(order will vary based on your role)
Choose the Section or
All Sections
May choose Prior year data
Choose the
Teacher
Choose the School
Click on the Student Analysis TabWhere Teachers can find Reports
(Column Sets) published to them
Click to create an Analysis Spreadsheet (set of columns) to go with this list of students

Student Performance

Steps to Publishing Reports (To District or School Bank)
1. Create Custom Report
2. Run Report or view Spreadsheet
3. Save Report or Columns
4. Fill out all *Required Fields
5. Chose Complete Report
6. Save Report
Publishing ReportsLeadership can publish reports to the District or School Bank

Steps to Publishing Reports (To District or School Bank) Cont.
7. Go to Saved Reports
8. Click Publish next to the report you want to publish
9. Choose to Publish to District (county) or All School Banks
10. Choose the Users you want to have access to the report
11. Publish Report
Publishing Reports
Remember the following:Leadership & Specialist can view Aggregate & Student Level Data
Analyst can only view Aggregate Data
You can only publish to 1 bank at a time. If you wish to publish to both, run the
report, resave it and publish it to the other bank.

Steps to Publishing Reports (To Teachers)
1. Create Custom Report
2. Continue to Analysis Spreadsheet and Click Go
3. Define the Columns
4. Go to Spreadsheet or Preview Spreadsheet
5. Save Columns
6. Fill out all *Required Fields & Choose “Report Parameters Only”
7. Save Report
Publishing ReportsLeadership can publish reports to Teachers
You can only publish Analysis Spreadsheets to
Teachers
Click “Define a Student Set”, but don’t worry about defining it

Steps to Publishing Reports (To Teachers) Cont.
8. Go to Saved Reports
9. Click Publish next to the report you want to publish
10.Choose to Publish to All School Banks
11.Choose Teacher
12.Click Publish Report
Publishing Reports
Remember the following:Teachers can find and run these reports
by going to Student Performance and the Student Analysis Tab
QRC: Publishing
Reports

Publishing Reports

For Questions regarding Running, Creating & Publishing Reports in CIITS please contact Lyndsey Robinson at [email protected]
School & District Reports