CIGARETTE BRAND PREFERENCES AMONG ADOLESCENTS...
41
CIGARETTE BRAND PREFERENCES AMONG ADOLESCENTS Monitoring the Future Occasional Paper 45 Lloyd D. Johnston Patrick M. O’Malley Jerald G. Bachman John E. Schulenberg Institute for Social Research The University of Michigan 1999
Transcript of CIGARETTE BRAND PREFERENCES AMONG ADOLESCENTS...

CIGARETTE BRAND PREFERENCES AMONG ADOLESCENTS
Monitoring the Future Occasional Paper 45
Lloyd D. JohnstonPatrick M. O’MalleyJerald G. Bachman
John E. Schulenberg
Institute for Social ResearchThe University of Michigan
1999


i
TABLE OF CONTENTS
LIST OF FIGURES . . . . . . . . . . . . . . . . . . . . . . . . . . . . . . . . . . . . . . . . . . . . . . . . . . . . . . . iii
LIST OF TABLES . . . . . . . . . . . . . . . . . . . . . . . . . . . . . . . . . . . . . . . . . . . . . . . . . . . . . . . . iii
BACKGROUND . . . . . . . . . . . . . . . . . . . . . . . . . . . . . . . . . . . . . . . . . . . . . . . . . . . . . . . . . . . 1
MAIN FINDINGS . . . . . . . . . . . . . . . . . . . . . . . . . . . . . . . . . . . . . . . . . . . . . . . . . . . . . . . . . . 1
Levels of Cigarette Smoking . . . . . . . . . . . . . . . . . . . . . . . . . . . . . . . . . . . . . . . . . . . . . 2Brand Preferences . . . . . . . . . . . . . . . . . . . . . . . . . . . . . . . . . . . . . . . . . . . . . . . . . . . . . 2Level of Smoking . . . . . . . . . . . . . . . . . . . . . . . . . . . . . . . . . . . . . . . . . . . . . . . . . . . . . . 3Purchasing Their Own Cigarettes . . . . . . . . . . . . . . . . . . . . . . . . . . . . . . . . . . . . . . . . . . 3Age of Smoking Initiation . . . . . . . . . . . . . . . . . . . . . . . . . . . . . . . . . . . . . . . . . . . . . . . 3
DIFFERENCES AMONG DEMOGRAPHIC SUBGROUPS . . . . . . . . . . . . . . . . . . . . . . . . 4
Gender Differences . . . . . . . . . . . . . . . . . . . . . . . . . . . . . . . . . . . . . . . . . . . . . . . . . . . . 4Racial/Ethnic Differences . . . . . . . . . . . . . . . . . . . . . . . . . . . . . . . . . . . . . . . . . . . . . . . . 4Region . . . . . . . . . . . . . . . . . . . . . . . . . . . . . . . . . . . . . . . . . . . . . . . . . . . . . . . . . . . . . . 5Population Density . . . . . . . . . . . . . . . . . . . . . . . . . . . . . . . . . . . . . . . . . . . . . . . . . . . . . 6College Plans . . . . . . . . . . . . . . . . . . . . . . . . . . . . . . . . . . . . . . . . . . . . . . . . . . . . . . . . . 6Parental Education . . . . . . . . . . . . . . . . . . . . . . . . . . . . . . . . . . . . . . . . . . . . . . . . . . . . . 6
SUMMARY . . . . . . . . . . . . . . . . . . . . . . . . . . . . . . . . . . . . . . . . . . . . . . . . . . . . . . . . . . . . . . . 7
APPENDIX A: TEXT OF QUESTIONS . . . . . . . . . . . . . . . . . . . . . . . . . . . . . . . . . . . . . . . 23
APPENDIX B: CONFIDENCE INTERVALS AND SELECTED SIGNIFICANCE TESTS FOR THREE CIGARETTE BRANDS . . . . . . . . . . . . . . . . . . . . . . . . . . . . . . . . . 27

ii

iii
LIST OF FIGURES
Figure 1. Grade 8: Brands Usually Smoked by Current Smokers, 1998 . . . . . . . . . . . . . . . . . . 9
Figure 2. Grade 10: Brands Usually Smoked by Current Smokers, 1998 . . . . . . . . . . . . . . . . 10
Figure 3. Grade 12: Usually Smoked by Current Smokers, 1998 . . . . . . . . . . . . . . . . . . . . . . 11
LIST OF TABLES
Table 1. Long-Term Trends in Prevalence of Cigarettes for Eighth, Tenth,and Twelfth Graders . . . . . . . . . . . . . . . . . . . . . . . . . . . . . . . . . . . . . . . . . . . . 12
Table 2. 1998 Cigarette Brand Preference for Past Thirty-Day Smokers . . . . . . . . . . . . 13Table 3. 1998 Cigarette Brand Preference by Smoking Frequency
for Past Thirty-Day Smokers . . . . . . . . . . . . . . . . . . . . . . . . . . . . . . . . . . . . . 14Table 4. 1998 Cigarette Brand Preference by Self-Purchase
for Past Thirty-Day Smokers . . . . . . . . . . . . . . . . . . . . . . . . . . . . . . . . . . . . . . 15Table 5. 1998 Cigarette Brand Preference by Grade of Smoking First Cigarette
for Past Thirty-Day Smokers . . . . . . . . . . . . . . . . . . . . . . . . . . . . . . . . . . . . . . 16Table 6. 1998 Cigarette Brand Preference by Gender for Past Thirty-Day Smokers . . . . 17Table 7. 1998 Cigarette Brand Preference by Race/Ethnicity
for Past Thirty-Day Smokers . . . . . . . . . . . . . . . . . . . . . . . . . . . . . . . . . . . . . . 18Table 8. 1998 Cigarette Brand Preference by Region for Past Thirty-Day Smokers . . . . 19Table 9. 1998 Cigarette Brand Preference by Population Density
for Past Thirty-Day Smokers . . . . . . . . . . . . . . . . . . . . . . . . . . . . . . . . . . . . . . 20Table 10. 1998 Cigarette Brand Preference by Four-Year College Plans
for Past Thirty-Day Smokers . . . . . . . . . . . . . . . . . . . . . . . . . . . . . . . . . . . . . . 21Table 11. 1998 Cigarette Brand Preference by Parental Education
for Past Thirty-Day Smokers . . . . . . . . . . . . . . . . . . . . . . . . . . . . . . . . . . . . . . 22Table B-1. Marlboro Use at Eighth Grade, 1998 . . . . . . . . . . . . . . . . . . . . . . . . . . . . . . . . 29Table B-2. Marlboro Use at Tenth Grade, 1998 . . . . . . . . . . . . . . . . . . . . . . . . . . . . . . . . 30Table B-3. Marlboro Use at Twelfth Grade, 1998 . . . . . . . . . . . . . . . . . . . . . . . . . . . . . . . 31Table B-4. Newport Use at Eighth Grade, 1998 . . . . . . . . . . . . . . . . . . . . . . . . . . . . . . . . 32Table B-5. Newport Use at Tenth Grade, 1998 . . . . . . . . . . . . . . . . . . . . . . . . . . . . . . . . . 33Table B-6. Newport Use at Twelfth Grade, 1998 . . . . . . . . . . . . . . . . . . . . . . . . . . . . . . . 34Table B-7. Camel Use at Eighth Grade, 1998 . . . . . . . . . . . . . . . . . . . . . . . . . . . . . . . . . . 35Table B-8. Camel Use at Tenth Grade, 1998 . . . . . . . . . . . . . . . . . . . . . . . . . . . . . . . . . . . 36Table B-9. Camel Use at Twelfth Grade, 1998 . . . . . . . . . . . . . . . . . . . . . . . . . . . . . . . . . 37

1
BACKGROUND
Monitoring the Future is an ongoing study of American young people, based in part onannual surveys of nationally representative samples of eighth, tenth, and twelfth-grade studentsattending public or private secondary schools in the coterminous 48 states. Since its inception in1975, it has been funded through a series of investigator-initiated research grants from theNational Institute on Drug Abuse to a team of social scientists at the University of Michigan’sInstitute for Social Research. The epidemiological results of these surveys are published in anannual series of monographs (see Johnston, O’Malley, & Bachman, 1998). The most recentsurvey, conducted in the spring of 1998, involved nearly 50,000 respondents in 422 schools.
The 1998 survey contained a new question about the brand preferences of thoserespondents who indicated smoking one or more cigarettes in the prior 30 days – that is, “currentsmokers.” The question read, “What brand of cigarettes do you usually smoke? (Brands are inalphabetical order. Mark only one.)” This question was followed by a list of 23 of the largest-selling brands. The options of “Other” brand and “No usual brand” were also provided torespondents. (See Appendix A for the question and full answer set.)
Between two- and three-thousand current smokers answered the brand preferencequestion at each grade level (2,048 eighth graders, 2,708 tenth graders, and 2,335 twelfthgraders). Not all participants in the study were asked this question because it was contained ononly three of the four questionnaire forms used in eighth and tenth grade, and on three of the sixquestionnaire forms used in twelfth grade.
A number of interesting findings have emerged from the initial analyses of thisquestion—particularly those having to do with the degree of market concentration found, and theextent of differences among subgroups. These findings are presented below.
It should be noted that it is illegal in virtually all states for young people below the age of18 to purchase, or to be sold, cigarettes. While approximately half of the twelfth graders hadreached their 18th birthday by the time the survey was conducted, virtually none of the eighth- ortenth graders had done so.
MAIN FINDINGS
Data are presented here for the total samples of current smokers at each of the three gradelevels, as well as for selected subgroups at each of the three grade levels. Some of the tablescontain a column of data labeled “all grades” which is a simple unweighted mean of thepercentages observed at each of the three grade levels. This is to provide at a glance a summaryof relationships, but should not be interpreted as representing all smokers in grades 8 through 12.

Occasional Paper No. 45
2
The numbers of cases in the analyses sometimes are small, particularly for certainsubgroups, so the reader is cautioned to attend to the sample sizes which are presented in eachtable and figure. Confidence intervals (95% level) around point estimates are given for each ofthe three grades in Appendix B, separately for each of the three major brands smoked by youngpeople.
Levels of Cigarette Smoking
In 1998 the proportion of students reporting smoking any cigarettes in the prior 30 dayswas 19.1% of the eighth graders, 27.6% of the tenth graders, and 35.1% of the twelfth graders. These comprise the current smokers who answered the questions regarding brand preference. Other statistics on levels and trends in smoking at the three grade levels are presented in Table 1.
Brand Preferences
By the time they finish high school, nearly two-thirds (65.2%) of American young peoplewho are current smokers say they usually smoke Marlboro. Two other brands account for mostof the remainder–Newport (13.3%) and Camel (9.6%). These three brands account for 88.1% ofthe current smokers in twelfth grade (another 4.1% say they have “no usual brand”). Each of theother brands is smoked by less than 2% of current smokers in twelfth grade, usually by much less. (Table 2 and Figure 3).
Among younger smokers (Figures 1 and 2) these three brands also predominated: Theyare the usual brand for 81.6% of the current smokers in eighth grade (another 9.7% have no usualbrand), and 86.1% of current smokers in tenth grade (where 6.4% say they have no usual brand). Note that the proportion saying they have no usual brand declines with age.
While Marlboro is the predominant brand at all three grade levels, it accounts for anincreasing proportion of smokers at each higher grade level: 53.7% of the eighth graders; 61.1%of the tenth graders, and 65.2% of the twelfth graders. In part, this may be due to the increasingproportion of students who have a brand preference at older ages.
The second most widely-used brand of cigarettes at all three grade levels is Newport. Itaccounts for 22.5% of the eighth-grade smokers, but its market share declines to 17.7% amongtenth-grade smokers, and 13.3% among twelfth-grade smokers.
The third-ranked brand in all three grades is Camel. Like Marlboro, Camel’s share of theyouth market appears to increase with grade level: 5.4% of the current smokers in grade 8 saythey usually smoke Camel cigarettes, 7.3% in grade 10, and 9.6% in grade 12.

Cigarette Brand Preferences
3
Level of Smoking
Among current smokers at all grade levels, those who have an established smoking habitare more likely to have a brand that they usually smoke (Table 3). For example, among eighthgraders, 15% of the current smokers who do not yet smoke daily said they have no usual brandthat they smoke, vs. only 2.5% of those who smoke one-half pack per day. Similar differences arefound at grades 10 and 12. In fact, by twelfth grade practically none of the daily (but less thanhalf-pack a day) smokers (1.3%) and half-pack-a-day smokers (0.7%) are without a usual brandof cigarettes. Thus, it appears that brand loyalty begins to be established very early. This strikingfact helps to show why tobacco companies might have a strong motivation to induce youngpeople to establish a preference for their brands at an early age.
Purchasing Their Own Cigarettes
Whether a student purchases his or her own cigarettes was determined by answers toquestions about the source of the cigarettes they smoke. Those who indicated that they made anypurchase in the past 30 days from any of the following sources were coded as having purchasedtheir own cigarettes: from a vending machine, through the mail, picked them up at a store, or washanded them in a store by a clerk. (See Appendix A for the exact question wording.)
As would be expected, the proportion of adolescents who purchase their own cigarettesrises with age; only 35% of the eighth graders who are current smokers report purchasingcigarettes in the prior 30 days, whereas 75% of twelfth graders do. (See the numericaldistributions at the bottom of Table 4.)
Students who purchase their own cigarettes are a bit more likely to report having a usualbrand (Table 4). For example, among eighth graders, only 6% of those who purchase their owncigarettes say they do not have a usual brand, vs. 12% of those who do not purchase their own. A similar difference exists at the higher grades, as well (2% vs. 10% in tenth grade, respectively,and 2% vs. 13% in twelfth grade).
Age of Smoking Initiation
We examined the grade of initiation of smoking a first cigarette among current smokers ingrades 10 and 12 to determine whether those who initiated smoking earlier were more or lesslikely to develop a particular brand preference. There is no indication that the grade level at whicha current smoker first began smoking cigarettes affects his or her current brand preferences (seeTable 5).

Occasional Paper No. 45
4
DIFFERENCES AMONG DEMOGRAPHIC SUBGROUPS
Differences among subgroups were examined across a number of demographiccharacteristics including gender, race/ethnicity, region, population density, college plans, and levelof parents’ education. Tables 6 through 11 provide the brand preference data for the varioussubgroups defined on these dimensions, and Appendix B present the confidence intervals aroundthese estimates for the three predominant brands (Marlboro, Newport, and Camel) along withsignificance tests for the differences observed among the groups. Some very important differenceswere found, as well as some surprising similarities.
Gender Differences
One of the more surprising findings is that Marlboro appears to be at least as popularamong girls as among boys at all three grade levels, despite the virtually exclusively maledepictions in Marlboro advertising. Among current smokers at eighth grade, 55.4% of girls vs.51.7% of boys say they smoke Marlboro cigarettes; at tenth grade, 64.1% vs. 58.0%; and attwelfth grade, 66.2% of girls vs. 64.6% of boys (Table 6). (None of these gender differences isstatistically significant: See Appendix B.)
Gender differences with respect to Camel cigarettes are more in line with conventionalwisdom. In eighth grade, 7.3% of boys who are current smokers vs. 4.2% of such girls say theirusual brand is Camel; in tenth grade, 9.9% vs. 5.0%; and in twelfth grade, 11.2% for boys vs.8.3% for girls. Still, considering the strong emphasis on male themes in the Camel ads, asignificant proportion of girls say that Camel is the brand they usually smoke. (The genderdifference is statistically significant at tenth grade only, but the consistency of the findings acrossall three grades increases our confidence in their validity.)
Newport shows rather little gender difference. At all grades slightly more females thanmales report this as their preferred brand, although none of these grade-specific differencesreaches statistical significance.
Racial/Ethnic Differences
The sample sizes for the two largest minority groups—African Americans andHispanics—are quite small at each grade level. The numbers of African American respondentsreporting brand preference are only 166 at grade eight, 178 at grade ten, and 106 at grade twelve,for a total of 450 respondents. The numbers of Hispanic respondents on the brand preferencequestion are 257 in grade eight, 245 in grade ten, and 156 in grade twelve, for a total of 658. (The numbers of African American respondents are lower, because African American teens havemuch lower smoking rates than either whites or Hispanics.)

Cigarette Brand Preferences
5
The ethnic differences in brand preference are dramatic (see Table 7). While the greatmajority (from 61%-70%) of white adolescents at all three grade levels say they smokeMarlboro–as do a smaller, but still substantial, majority of Hispanics (from 57%-65%)–fewer than10% of the African American adolescents at any grade level smoke Marlboro. Instead, theirpredominant brand is Newport (from 71%-82%). Virtually none of the African Americanadolescents smoke Camels (1.7% at eighth grade and 0.0% at tenth and twelfth grade).
Hispanic students at all grade levels appear to be a bit more likely to smoke Newport thanwhite student respondents, but their preference rates for Newport are not nearly as high as amongAfrican Americans. They also appear to be a bit less likely than white students to smokeMarlboro or Camel, although Marlboro is still the choice of the majority of Hispanic students.
Among white respondents, fully 70.2% smoke Marlboro by twelfth grade. Theproportion increases from 61.1% in eighth grade to 66.1% in tenth grade. This means that theoverall increase by grades noted earlier for the popularity of Marlboros is highly unlikely to beexplained by differential dropout rates among ethnic groups.
Of the three ethnic groups, whites are the most likely to smoke Camel cigarettes.
Region
Because of the limited numbers of cases, the regional differences presented here are notalways definitive. To the extent that a finding replicates across the three grades–the samples forwhich are drawn independently of one another–it is considerably more credible.
Marlboro is the leading brand in all four regions, although at all grade levels it tends toaccount for a lower percent of the brand choices in the Northeast than in the other three regions(see Table 8). (An analysis of variance shows a significant difference among the regions at tenthand twelfth grades in Marlboro use.)
At all grade levels the West shows the lowest proportion of students who report smokingNewport and the Northeast shows the highest proportion. (The differences among regions inNewport use are significant in tenth and twelfth grades and very close to significant in eighth.) Additionally, from 3% to 7% of the students in the Northeast report smoking Parliament—farhigher than any of the other three regions (where less than 1% at any grade level smoke thatbrand).
Marlboro accounts for the majority of smokers in all grades for all regions, except theNortheast, where it accounts for 40% of the eighth-grade current smokers, 47% in tenth grade,and 54% in twelfth grade.

Occasional Paper No. 45
6
Population Density
Marlboro is the most popular brand at all three population density levels, but it is mostdominant in the non-metropolitan areas (see Table 9). (The differences in Marlboro use aresignificant for grades 8 and 10.) Newport is more prevalent among the metropolitan areas ateighth and tenth grades, whereas differences by urbanicity are rather small by twelfth grade. (These differences are significant at grade 10 and just short of significant at grade 8.)
There are not large or consistent differences in the use of Camel cigarettes associated withpopulation density.
College Plans
Among current smokers of the major brands, there is very little difference in brandpreference at any of the three grade levels as a function of whether respondents expect tocomplete four years of college or not (Table 10).
Parental Education
Parental education is used as an indicator of socioeconomic status. An index based on thelevel of education attained by both parents is used, or the level of education of the single parent ifonly one is present. (For a full description of the question and procedures see Johnston et al.,1998.)
Table 11 provides an overview of these findings based on a three-level index of parentaleducation. The analyses discussed below are based on the full five-level index of parentaleducation and are presented in Appendix B. Table B-3 shows that the use of Marlboro cigarettestends to be negatively associated with social class among twelfth graders (an analysis of varianceis significant at the .05 level) with the only exception being the relatively small lowest stratumwhere race composition is likely having an effect. The rates array ordinally from 54% in thehighest stratum to 71% in the next-to-lowest. (The lowest is at 63%.) There is much less of adifferential at earlier grades, although Marlboro use appears to be lowest in the top stratum evenat earlier grades.
Newport shows high preference rates in the bottom two strata at twelfth grade–21% in thelowest stratum and 15% in the next to lowest, vs. 9% to 11% in the other strata (Table B-6). (The analysis of variance is significant. Again, racial composition is likely to account for much ofthis difference.) However, there is much less variability at grades 8 and 10 except that the topstratum still has rates lower than the others.
Camel use also varies with social class, as represented by parental education level. Ingeneral, it is a positive association, with the top one or two strata having the highest preference

Cigarette Brand Preferences
7
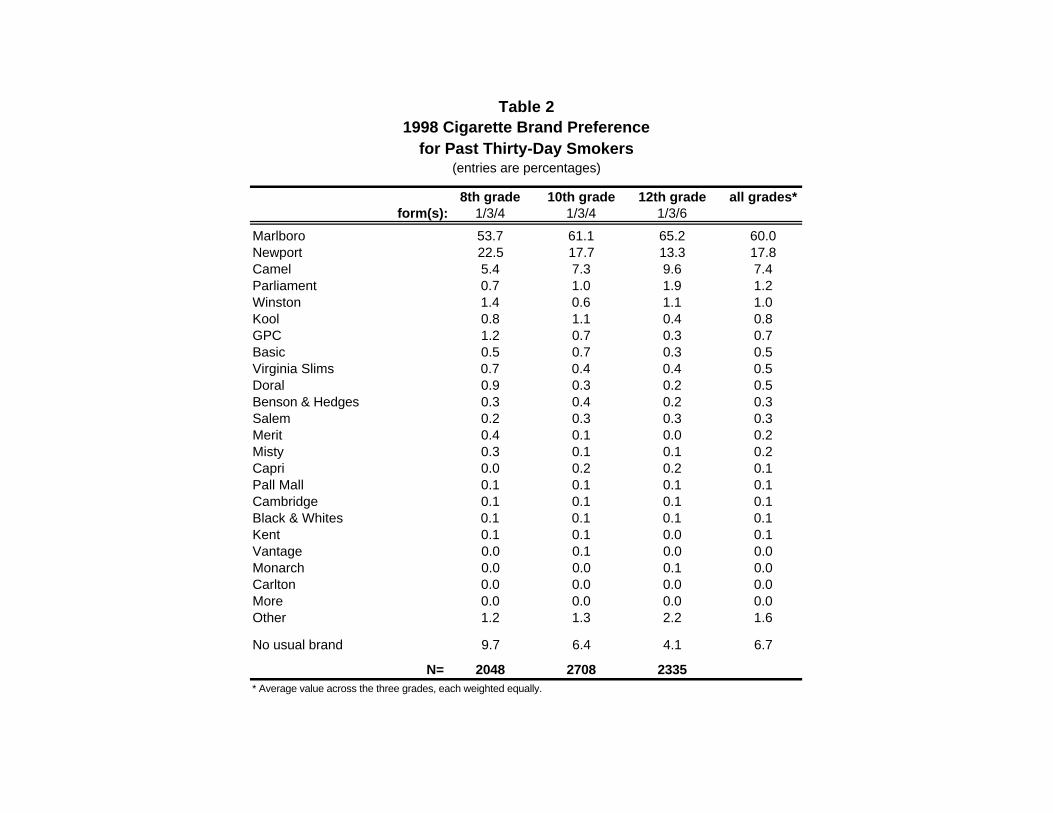
for Camel cigarettes at all three grade levels. (The analysis of variance shows significantdifferences among the strata at all grade levels, though they are not specifically testing forordinality or linearity in the relationship.) Again, the differences are most striking at twelfthgrade, where 22% of the top stratum reports Camel use vs. about 4% or 5% of the bottom twostrata (Table B-9).
SUMMARY
In sum, the very high rates of cigarette smoking found among American teenagers in thelate 1990s are associated with the popularity of just three brands: Marlboro (a Philip Morrisproduct), Newport (a Lorillard product), and Camel (an RJR/Nabisco product). Perhaps notcoincidentally, these have been among the most heavily advertised and promoted cigarette brands,in particular Marlboro; and also perhaps not coincidentally, two of them (Newport and Camel)have aggressively pursued youth-oriented themes in their advertising–the “Alive with pleasure”theme and the Joe Camel theme, respectively.
The clearly dominant brand, however, is Marlboro, which has successfully identified itselfwith the American icon of the Western cowboy, as well as with certain competitive sports, likeFormula One racing. By twelfth grade, nearly two-thirds of students who are current smokers(65%) smoke Marlboro. Despite the strongly male orientation of the Marlboro advertisingthemes, however, Marlboro is at least as popular among girls in their teens as among boys.
Just as there are dramatic racial/ethnic differences in rates of smoking among adolescents(with African American teenagers having by far the lowest rates), there also are dramaticracial/ethnic differences in brand preferences among those who do smoke. Newport, amentholated cigarette, predominates among African American teenage smokers to an even greaterextent than Marlboro predominates among white teenage smokers.
Finally, the fact that so few of the current smokers in their teen years do not already havea brand that they usually smoke (10% of eighth graders, 6% of tenth graders, and 4% of twelfth-grade current smokers) helps to illustrate why tobacco companies might have a compellinginterest in having their advertising and promotion reach underage children.

Occasional Paper No. 45
8
REFERENCES
Johnston, L.D., O'Malley, P.M., & Bachman, J.G. (1998). National survey results on drug usefrom the Monitoring the Future study, 1975-1997. Volume I: Secondary school students.(NIH Publication No. 98-4345) and Volume II: College students and young adults. (NIHPublication No. 98-4346). Rockville, MD: National Institute on Drug Abuse.

Marlboro
Newport
Camel
GPC
Parliament
Winston
Kool
Doral
Virginia Slims
Basic
Other
No Usual Brand
0 10 20 30 40 50 60 70
Percent
53.7
22.5
5.4
1.2
0.7
1.4
0.8
0.9
0.7
0.5
53.7
76.2
81.6
82.8
83.5
84.9
85.7
86.6
87.3
87.8
100.0
2.5
9.7
90.3
Cigarette Brand Preferences
9
Figure 1
Grade 8: Brands Usually Smokedby Current Smokers, 1988
(entries are percentages)Approx. N = 2050
Cumulative
Percent

Marlboro
Newport
Camel
GPC
Parliament
Winston
Kool
Doral
Virginia Slims
Basic
Other
No Usual Brand
0 10 20 30 40 50 60 70
Percent
61.1
17.7
7.3
0.7
1.0
0.6
1.1
0.3
0.4
0.7
6.4
61.1
78.8
86.1
86.8
87.8
88.4
89.5
89.8
90.2
90.9
100.0
2.7 93.6
Occasional Paper No. 45
10
Figure 2
Grade 10: Brands Usually Smokedby Current Smokers, 1988
(entries are percentages)Approx. N = 2710
Cumulative
Percent

Marlboro
Newport
Camel
GPC
Parliament
Winston
Kool
Doral
Virginia Slims
Basic
Other
No Usual Brand
0 10 20 30 40 50 60 70
Percent
65.2
13.3
9.6
0.3
1.9
1.1
0.4
0.2
0.4
0.3
4.1
65.2
78.5
88.1
88.4
90.3
91.4
91.8
92.0
92.4
92.7
100.0
3.2 95.9
Cigarette Brand Preferences
11
Figure 3
Grade 12: Brands Usually Smokedby Current Smokers, 1988
(entries are percentages)Approx. N = 2340
Cumulative
Percent

TABLE 1
Long-Term Trends in Prevalence of Cigarettes for Eighth, Tenth, and Twelfth Graders
(entries are percentages)
1975 1976 1977 1978 1979 1980 1981 1982 ‘97-‘98
1996 1997 1998 Lifetime 1983 1984 1985 1986 1987 1988 1989 1990 1991 1992 1993 1994 1995 change
8th Grade 44.0 45.2 45.3 46.1 46.4 49.2 47.3 45.7 -1.6 10th Grade 55.1 53.5 56.3 56.9 57.6 61.2 60.2 57.7 -2.5s 12thGrade 73.6 75.4 75.7 75.3 74.0 71.0 71.0 70.1 70.6 69.7 68.8 67.6 67.2 66.4 65.7 64.4 63.1 61.8 61.9 62.0 64.2 63.5 65.4 65.3 -0.1
Thirty-Day
8th Grade 14.3 15.5 16.7 18.6 19.1 21.0 19.4 19.1 -0.3 10th Grade 20.8 21.5 24.7 25.4 27.9 30.4 29.8 27.6 -2.2s 12thGrade 36.7 38.8 38.4 36.7 34.4 30.5 29.4 30.0 30.3 29.3 30.1 29.6 29.4 28.7 28.6 29.4 28.3 27.8 29.9 31.2 33.5 34.0 36.5 35.1 -1.4
Daily 8th Grade 7.2 7.0 8.3 8.8 9.3 10.4 9.0 8.8 -0.2 10th Grade 12.6 12.3 14.2 14.6 16.3 18.3 18.0 15.8 -2.2s~ 12thGrade 26.9 28.8 28.8 27.5 25.4 21.3 20.3 21.1 21.2 18.7 19.5 18.7 18.7 18.1 18.9 19.1 18.5 17.2 19.0 19.4 21.6 22.2 24.6 22.4 -2.2~
l/2 pack+ per day
8th Grade 3.1 2.9 3.5 3.6 3.4 4.3 3.5 3.6 +O.l 10th Grade 6.5 6.0 7.0 7.6 8.3 9.4 8.6 7.9 -0.7 12thGrade 17.9 19.2 19.4 18.8 16.5 14.3 13.5 14.2 13.8 12.3 12.5 11.4 11.4 10.6 11.2 11.3 10.7 10.0 10.9 11.2 12.4 13.0 14.3 12.6 -1.7s
Approx. Ns
8th Grade 17500 18600 18300 17300 17500 17800 18600 18100 10th Grade 1480014800153001580017000 15600 1550015000 12thGrade 940015400 1710017800155001590017500177001630015900160001520016300 1630016700 152001500015800 16300 15400 15400 14300 15400 15200
NOTE: SOURCE:
Level of significance of difference between the two years indicated: s = .05, ss = .Ol, sss = ,001. The Monitoring the Future Study, The University of Michigan.
8th grade 10th grade 12th grade all grades*form(s): 1/3/4 1/3/4 1/3/6
Marlboro 53.7 61.1 65.2 60.0Newport 22.5 17.7 13.3 17.8Camel 5.4 7.3 9.6 7.4Parliament 0.7 1.0 1.9 1.2Winston 1.4 0.6 1.1 1.0Kool 0.8 1.1 0.4 0.8GPC 1.2 0.7 0.3 0.7Basic 0.5 0.7 0.3 0.5Virginia Slims 0.7 0.4 0.4 0.5Doral 0.9 0.3 0.2 0.5Benson & Hedges 0.3 0.4 0.2 0.3Salem 0.2 0.3 0.3 0.3Merit 0.4 0.1 0.0 0.2Misty 0.3 0.1 0.1 0.2Capri 0.0 0.2 0.2 0.1Pall Mall 0.1 0.1 0.1 0.1Cambridge 0.1 0.1 0.1 0.1Black & Whites 0.1 0.1 0.1 0.1Kent 0.1 0.1 0.0 0.1Vantage 0.0 0.1 0.0 0.0Monarch 0.0 0.0 0.1 0.0Carlton 0.0 0.0 0.0 0.0More 0.0 0.0 0.0 0.0Other 1.2 1.3 2.2 1.6
No usual brand 9.7 6.4 4.1 6.7
N= 2048 2708 2335* Average value across the three grades, each weighted equally.
Table 21998 Cigarette Brand Preference
for Past Thirty-Day Smokers(entries are percentages)

form(s):<1/day 1-5/day 1/2 pk+/day <1/day 1-5/day 1/2 pk+/day <1/day 1-5/day 1/2 pk+/day <1/day 1-5/day 1/2 pk+/day
Marlboro 48.2 58.2 63.6 57.6 64.8 62.6 61.4 65.1 69.0 55.7 62.7 65.1Newport 19.6 26.6 25.0 13.8 19.9 21.3 11.9 13.7 14.2 15.1 20.1 20.2Camel 6.0 5.0 4.2 6.2 6.6 9.6 7.5 12.5 9.1 6.6 8.0 7.6Parliament 0.5 1.1 0.8 0.8 1.4 0.9 1.8 2.7 1.3 1.0 1.7 1.0Winston 1.3 1.9 0.7 0.5 0.8 0.5 0.7 0.8 1.6 0.8 1.2 0.9Kool 1.2 0.2 0.5 1.6 0.9 0.6 0.3 0.7 0.2 1.0 0.6 0.4GPC 1.5 0.3 1.5 1.0 0.3 0.5 0.1 0.0 0.8 0.9 0.2 0.9Basic 0.9 0.2 0.0 0.9 0.2 1.1 0.3 0.0 0.7 0.7 0.1 0.6Virginia Slims 1.2 0.1 0.0 0.6 0.1 0.3 0.4 0.3 0.3 0.7 0.2 0.2Doral 1.3 0.6 0.3 0.0 0.6 0.5 0.4 0.1 0.3 0.6 0.4 0.4Benson & Hedges 0.5 0.2 0.2 0.6 0.4 0.2 0.2 0.3 0.1 0.4 0.3 0.2Salem 0.2 0.1 0.0 0.5 0.4 0.0 0.7 0.3 0.0 0.5 0.3 0.0Merit 0.5 0.5 0.0 0.2 0.0 0.0 0.0 0.0 0.0 0.2 0.2 0.0Misty 0.3 0.5 0.0 0.2 0.0 0.0 0.0 0.0 0.2 0.2 0.2 0.1Capri 0.0 0.0 0.0 0.1 0.4 0.0 0.3 0.2 0.0 0.1 0.2 0.0Pall Mall 0.0 0.0 0.3 0.0 0.2 0.0 0.1 0.0 0.2 0.0 0.1 0.2Cambridge 0.0 0.2 0.0 0.1 0.0 0.0 0.0 0.0 0.2 0.0 0.1 0.1Black & Whites 0.2 0.0 0.0 0.1 0.0 0.0 0.0 0.0 0.2 0.1 0.0 0.1Kent 0.1 0.0 0.0 0.2 0.0 0.0 0.0 0.0 0.0 0.1 0.0 0.0Vantage 0.0 0.0 0.0 0.2 0.0 0.0 0.0 0.0 0.0 0.1 0.0 0.0Monarch 0.0 0.0 0.0 0.0 0.0 0.0 0.2 0.0 0.0 0.1 0.0 0.0Carlton 0.0 0.0 0.0 0.0 0.1 0.0 0.0 0.0 0.0 0.0 0.0 0.0More 0.0 0.0 0.0 0.0 0.0 0.0 0.0 0.0 0.0 0.0 0.0 0.0Other 1.9 0.5 0.2 1.8 1.2 0.8 3.7 2.0 1.0 2.5 1.2 0.7
No usual brand 14.9 3.8 2.5 13.0 1.9 1.2 10.1 1.3 0.7 12.7 2.3 1.5
N= 1125 545 378 1148 784 776 809 690 837* Average value across the three grades, each weighted equally.
1/3/4 1/3/4 1/3/612th grade all grades*
Table 3
(entries are percentages)
1998 Cigarette Brand Preference by Smoking Frequencyfor Past Thirty-Day Smokers
8th grade 10th grade

No Yes No Yes No Yes No Yes
Marlboro 53.4 54.5 62.7 60.8 59.9 68.9 58.7 61.4Newport 17.3 28.9 11.6 24.9 11.4 12.5 13.4 22.1Camel 6.3 4.0 7.6 6.5 7.3 9.3 7.1 6.6Parliament 0.3 1.0 1.0 0.4 2.2 1.1 1.2 0.8Winston 2.2 0.2 0.8 0.2 1.3 1.4 1.4 0.6Kool 1.3 0.3 1.5 1.2 0.0 0.5 0.9 0.7GPC 1.4 1.1 0.7 0.2 1.2 0.7 1.1 0.7Basic 0.8 0.0 0.7 0.6 0.0 0.5 0.5 0.4Virginia Slims 0.7 2.0 0.4 0.4 1.3 0.2 0.8 0.9Doral 1.0 0.5 0.1 0.8 0.0 0.1 0.4 0.5Benson & Hedges 0.3 0.3 0.4 0.5 0.5 0.0 0.4 0.3Salem 0.0 0.2 0.3 0.1 0.3 0.1 0.2 0.1Merit 0.7 0.3 0.0 0.0 0.0 0.0 0.2 0.1Misty 0.6 0.0 0.2 0.0 0.0 0.2 0.3 0.1Capri 0.0 0.0 0.1 0.1 0.0 0.0 0.0 0.0Pall Mall 0.2 0.0 0.2 0.0 0.0 0.0 0.1 0.0Cambridge 0.0 0.0 0.2 0.0 0.8 0.0 0.3 0.0Black & Whites 0.0 0.3 0.0 0.1 0.0 0.0 0.0 0.1Kent 0.0 0.0 0.0 0.2 0.0 0.0 0.0 0.1Vantage 0.0 0.0 0.3 0.0 0.0 0.0 0.1 0.0Monarch 0.0 0.0 0.0 0.0 0.0 0.3 0.0 0.1Carlton 0.0 0.0 0.1 0.0 0.0 0.0 0.0 0.0More 0.0 0.0 0.0 0.0 0.0 0.0 0.0 0.0Other 1.7 0.7 1.6 0.7 1.1 2.7 1.5 1.4
No usual brand 11.8 5.7 9.7 2.4 12.8 1.6 11.4 3.2
N= 669 359 739 582 211 626* Answered that they had bought cigarettes at least once in the past 30 days by at least one of the following methods:
from a vending machine, through the mail, picked them up at a store, or was handed them in a store by a clerk.
** Average value across the three grades, each weighted equally.
forms 3 & 4 forms 3 & 4 form 6
1998 Cigarette Brand Preference by Self-Purchase*for Past Thirty-Day Smokers
8th grade 10th grade 12th grade all grades**
(entries are percentages)
Table 4

Grade 1st used: by 8th in 9th/10th by 8th in 9th/10th in 11th/12th
Marlboro 62.4 62.7 66.5 66.2 65.4Newport 16.8 14.7 12.2 11.9 10.4Camel 7.6 5.9 10.5 9.2 9.2Parliament 1.1 0.8 1.8 2.3 1.0Winston 0.6 0.8 1.3 0.7 1.1Kool 0.9 1.9 0.4 0.2 0.6GPC 0.6 1.0 0.2 0.7 0.0Basic 0.7 0.5 0.4 0.3 0.0Virginia Slims 0.4 0.4 0.4 0.2 0.3Doral 0.3 0.0 0.3 0.1 0.7Benson & Hedges 0.4 0.0 0.2 0.2 0.0Salem 0.4 0.2 0.3 0.3 0.5Merit 0.0 0.6 0.0 0.0 0.0Misty 0.1 0.0 0.0 0.2 0.0Capri 0.2 0.0 0.2 0.1 0.0Pall Mall 0.0 0.3 0.2 0.0 0.0Cambridge 0.1 0.0 0.1 0.0 0.0Black & Whites 0.1 0.0 0.0 0.0 0.0Kent 0.1 0.0 0.0 0.0 0.0Vantage 0.1 0.0 0.0 0.0 0.0Monarch 0.0 0.0 0.2 0.0 0.0Carlton 0.0 0.2 0.0 0.0 0.0More 0.0 0.0 0.0 0.0 0.0Other 1.4 0.7 1.6 2.7 3.4
No usual brand 5.8 9.4 3.2 4.9 7.3
N= 2110 414 1163 627 214
Table 51998 Cigarette Brand Preference by Grade of Smoking First Cigarette
for Past Thirty-Day Smokers(entries are percentages)
forms 1/3/4 forms 1/3/610th grade 12th grade

form(s):male female male female male female male female
Marlboro 51.7 55.4 58.0 64.1 64.6 66.2 58.1 61.9Newport 21.0 23.0 15.6 19.1 12.1 13.7 16.2 18.6Camel 7.3 4.2 9.9 5.0 11.2 8.3 9.5 5.8Parliament 0.8 0.7 0.9 1.1 0.9 3.0 0.9 1.6Winston 1.5 1.3 0.8 0.4 1.5 0.6 1.3 0.8Kool 0.8 0.7 1.2 1.1 0.2 0.5 0.7 0.8GPC 1.6 0.5 1.1 0.4 0.2 0.4 1.0 0.4Basic 0.6 0.6 0.8 0.6 0.2 0.5 0.5 0.6Virginia Slims 0.3 1.0 0.3 0.4 0.1 0.6 0.2 0.7Doral 0.8 1.1 0.2 0.4 0.2 0.3 0.4 0.6Benson & Hedges 0.4 0.3 0.3 0.5 0.0 0.4 0.2 0.4Salem 0.2 0.1 0.5 0.2 0.5 0.1 0.4 0.1Merit 0.5 0.4 0.1 0.1 0.0 0.0 0.2 0.2Misty 0.3 0.3 0.0 0.2 0.0 0.1 0.1 0.2Capri 0.0 0.0 0.0 0.3 0.0 0.3 0.0 0.2Pall Mall 0.1 0.0 0.1 0.0 0.0 0.1 0.1 0.0Cambridge 0.0 0.1 0.0 0.1 0.0 0.2 0.0 0.1Black & Whites 0.2 0.0 0.1 0.0 0.0 0.0 0.1 0.0Kent 0.1 0.0 0.2 0.0 0.0 0.0 0.1 0.0Vantage 0.0 0.0 0.0 0.1 0.0 0.0 0.0 0.0Monarch 0.0 0.0 0.0 0.0 0.2 0.0 0.1 0.0Carlton 0.0 0.0 0.0 0.1 0.0 0.0 0.0 0.0More 0.0 0.0 0.0 0.0 0.0 0.0 0.0 0.0Other 1.8 0.8 1.8 1.0 2.6 1.9 2.1 1.2
No usual brand 9.9 9.6 8.1 5.0 5.5 2.8 7.8 5.8
N= 863 1092 1209 1460 1118 1087* Average value across the three grades, each weighted equally.
10th grade1/3/4
12th grade
Table 6
(entries are percentages)
1/3/6all grades*
1998 Cigarette Brand Preference by Genderfor Past Thirty-Day Smokers
8th grade1/3/4

form(s):
black white Hispanic black white Hispanic black white Hispanic black white Hispanic
Marlboro 9.0 61.1 56.7 9.7 66.1 64.9 5.2 70.2 57.7 8.0 65.8 59.8Newport 71.1 14.8 22.0 70.7 12.7 15.9 82.3 7.6 23.0 74.7 11.7 20.3Camel 1.7 6.3 4.1 0.0 8.3 0.4 0.0 10.9 3.4 0.6 8.5 2.6Parliament 0.0 0.8 0.7 0.0 1.2 0.3 0.0 2.0 0.6 0.0 1.3 0.5Winston 1.5 1.4 0.7 0.0 0.7 0.6 0.0 1.3 0.0 0.5 1.1 0.4Kool 1.4 0.7 0.4 5.3 0.6 3.6 1.5 0.2 1.2 2.7 0.5 1.7GPC 0.5 0.9 0.8 0.0 0.6 1.8 0.0 0.4 0.4 0.2 0.6 1.0Basic 0.0 0.8 0.4 0.0 0.8 0.3 0.0 0.4 0.5 0.0 0.7 0.4Virginia Slims 0.4 0.5 1.4 0.2 0.3 0.6 0.0 0.3 0.2 0.2 0.4 0.7Doral 1.4 0.9 1.5 0.0 0.4 0.0 0.5 0.2 1.0 0.6 0.5 0.8Benson & Hedges 1.0 0.1 0.4 5.0 0.0 0.5 0.0 0.1 0.6 2.0 0.1 0.5Salem 0.0 0.2 0.0 0.4 0.4 0.5 0.0 0.3 0.4 0.1 0.3 0.3Merit 0.0 0.6 0.0 0.0 0.1 0.0 0.0 0.0 0.0 0.0 0.2 0.0Misty 0.9 0.2 0.0 0.0 0.1 0.4 0.0 0.1 0.0 0.3 0.1 0.1Capri 0.0 0.0 0.0 0.0 0.1 0.5 1.5 0.1 0.4 0.5 0.1 0.3Pall Mall 0.0 0.0 0.0 0.0 0.0 0.0 0.0 0.1 0.0 0.0 0.0 0.0Cambridge 0.0 0.0 0.4 0.0 0.1 0.0 0.0 0.1 0.0 0.0 0.1 0.1Black & Whites 0.7 0.0 0.3 0.2 0.0 0.2 0.0 0.0 0.0 0.3 0.0 0.2Kent 0.0 0.0 0.0 0.0 0.1 0.0 0.0 0.0 0.0 0.0 0.0 0.0Vantage 0.0 0.0 0.0 0.0 0.0 0.8 0.0 0.0 0.0 0.0 0.0 0.3Monarch 0.0 0.0 0.0 0.0 0.0 0.0 0.0 0.1 0.0 0.0 0.0 0.0Carlton 0.0 0.0 0.0 0.0 0.0 0.0 0.0 0.0 0.0 0.0 0.0 0.0More 0.0 0.0 0.0 0.0 0.0 0.0 0.0 0.0 0.0 0.0 0.0 0.0Other 3.7 0.5 0.9 3.1 1.1 0.8 3.5 1.9 2.7 3.4 1.2 1.5
No usual brand 6.8 10.3 9.4 5.4 6.3 7.8 5.4 4.0 7.9 5.9 6.9 8.4
N= 166 1319 257 178 2029 245 106 1818 156* Average value across the three grades, each weighted equally.
10th grade 12th grade all grades*
Table 7
(entries are percentages)
1/3/61/3/41/3/4
1998 Cigarette Brand Preference by Race/Ethnicityfor Past Thirty-Day Smokers
8th grade

form(s):NE NC S W NE NC S W NE NC S W NE NC S W
Marlboro 39.9 50.9 58.4 58.0 47.2 66.9 62.7 68.3 54.1 72.7 68.6 56.9 47.1 63.5 63.2 61.1Newport 32.2 24.8 22.5 10.1 30.9 13.1 18.0 4.8 21.7 9.1 15.5 5.9 28.3 15.7 18.7 6.9Camel 4.0 6.8 3.3 9.5 7.4 10.7 5.4 6.2 8.3 8.3 7.6 17.9 6.6 8.6 5.4 11.2Parliament 3.0 0.4 0.4 0.0 4.3 0.0 0.0 0.2 7.3 0.9 0.4 0.7 4.9 0.4 0.3 0.3Winston 1.4 1.9 1.5 0.0 0.4 0.2 0.9 0.5 0.7 1.6 0.7 1.4 0.8 1.2 1.0 0.6Kool 0.8 0.8 0.3 2.0 0.4 0.4 1.6 2.5 0.0 0.4 0.3 0.8 0.4 0.5 0.7 1.8GPC 2.0 0.8 0.8 2.1 0.4 0.9 0.6 1.0 0.0 0.8 0.0 0.4 0.8 0.8 0.5 1.2Basic 0.4 0.4 0.5 1.0 0.4 0.7 0.9 0.8 0.0 0.6 0.2 0.6 0.3 0.6 0.5 0.8Virginia Slims 0.4 0.2 1.1 0.6 0.4 0.2 0.3 0.7 0.7 0.2 0.4 0.2 0.5 0.2 0.6 0.5Doral 0.0 1.0 1.4 0.4 0.5 0.3 0.3 0.0 0.0 0.4 0.3 0.0 0.2 0.6 0.7 0.1Benson & Hedges 0.0 0.3 0.2 1.0 0.1 0.2 0.3 1.6 0.4 0.0 0.3 0.1 0.2 0.2 0.3 0.9Salem 0.0 0.2 0.3 0.0 0.2 0.2 0.2 1.0 0.9 0.1 0.2 0.4 0.4 0.2 0.2 0.5Merit 0.8 0.3 0.3 0.6 0.0 0.4 0.0 0.0 0.0 0.0 0.0 0.0 0.3 0.2 0.1 0.2Misty 0.8 0.0 0.4 0.0 0.0 0.2 0.0 0.3 0.3 0.0 0.0 0.0 0.4 0.1 0.1 0.1Capri 0.0 0.0 0.0 0.0 0.0 0.1 0.3 0.2 0.0 0.0 0.2 0.6 0.0 0.0 0.2 0.3Pall Mall 0.0 0.2 0.0 0.0 0.0 0.0 0.0 0.3 0.4 0.0 0.1 0.0 0.1 0.1 0.0 0.1Cambridge 0.0 0.0 0.0 0.3 0.0 0.0 0.2 0.0 0.0 0.3 0.0 0.0 0.0 0.1 0.1 0.1Black & Whites 0.0 0.0 0.2 0.0 0.0 0.0 0.2 0.0 0.0 0.0 0.2 0.0 0.0 0.0 0.2 0.0Kent 0.0 0.0 0.0 0.3 0.0 0.2 0.1 0.0 0.0 0.0 0.0 0.0 0.0 0.1 0.0 0.1Vantage 0.0 0.0 0.0 0.0 0.0 0.0 0.2 0.0 0.0 0.0 0.0 0.0 0.0 0.0 0.1 0.0Monarch 0.0 0.0 0.0 0.0 0.0 0.0 0.0 0.0 0.0 0.0 0.2 0.0 0.0 0.0 0.1 0.0Carlton 0.0 0.0 0.0 0.0 0.0 0.0 0.1 0.0 0.0 0.0 0.0 0.0 0.0 0.0 0.0 0.0More 0.0 0.0 0.0 0.0 0.0 0.0 0.0 0.0 0.0 0.0 0.0 0.0 0.0 0.0 0.0 0.0Other 1.3 0.7 1.6 1.0 1.4 0.9 1.4 1.7 2.0 1.5 1.7 5.0 1.6 1.0 1.6 2.6
No usual brand 13.2 10.4 6.7 12.9 5.9 4.5 6.6 10.0 3.2 3.1 3.3 9.2 7.4 6.0 5.5 10.7
N= 284 577 851 336 600 688 1028 392 433 677 855 370* Census regions: NE = Northeast, NC = North Central, S = South, W = West.
** Average value across the three grades, each weighted equally.
Table 8
(entries are percentages)
1998 Cigarette Brand Preference by Region*for Past Thirty-Day Smokers
1/3/4 1/3/4 1/3/68th grade 10th grade 12th grade all grades**

form(s):
Lg MSA Other MSA Non-MSA Lg MSA Other MSA Non-MSA Lg MSA Other MSA Non-MSA Lg MSA Other MSA Non-MSA
Marlboro 43.2 50.7 65.2 53.8 57.4 71.5 58.6 67.2 68.8 51.9 58.4 68.5Newport 30.8 24.8 13.5 27.1 18.8 9.4 16.2 11.7 13.1 24.7 18.4 12.0Camel 6.6 5.0 5.0 5.5 7.8 8.0 9.7 11.1 6.7 7.3 8.0 6.6Parliament 1.5 0.6 0.3 1.2 1.5 0.1 4.4 1.1 0.5 2.4 1.1 0.3Winston 1.4 1.1 1.7 0.8 0.4 0.6 1.2 0.6 1.8 1.1 0.7 1.4Kool 0.4 1.6 0.1 0.9 1.8 0.4 0.8 0.2 0.2 0.7 1.2 0.2GPC 0.8 1.1 1.6 0.1 0.9 0.8 0.0 0.1 1.0 0.3 0.7 1.1Basic 0.4 0.1 1.2 0.2 0.5 1.5 0.5 0.3 0.1 0.4 0.3 0.9Virginia Slims 0.4 1.0 0.3 0.3 0.3 0.5 0.5 0.4 0.2 0.4 0.6 0.3Doral 0.4 0.7 1.6 0.1 0.4 0.4 0.7 0.1 0.0 0.4 0.4 0.7Benson & Hedges 0.6 0.4 0.0 1.0 0.4 0.0 0.3 0.2 0.1 0.6 0.3 0.0Salem 0.0 0.2 0.2 0.8 0.2 0.2 0.2 0.5 0.2 0.3 0.3 0.2Merit 0.2 0.6 0.3 0.4 0.0 0.0 0.0 0.0 0.0 0.2 0.2 0.1Misty 0.3 0.5 0.0 0.0 0.2 0.0 0.0 0.0 0.2 0.1 0.2 0.1Capri 0.0 0.0 0.0 0.3 0.2 0.0 0.3 0.1 0.1 0.2 0.1 0.0Pall Mall 0.3 0.0 0.0 0.0 0.0 0.2 0.0 0.2 0.0 0.1 0.1 0.1Cambridge 0.2 0.0 0.0 0.0 0.0 0.2 0.0 0.2 0.0 0.1 0.1 0.1Black & Whites 0.2 0.0 0.2 0.1 0.1 0.0 0.0 0.1 0.0 0.1 0.1 0.1Kent 0.0 0.1 0.0 0.2 0.1 0.0 0.0 0.0 0.0 0.1 0.1 0.0Vantage 0.0 0.0 0.0 0.3 0.0 0.0 0.0 0.0 0.0 0.1 0.0 0.0Monarch 0.0 0.0 0.0 0.0 0.0 0.0 0.0 0.2 0.0 0.0 0.1 0.0Carlton 0.0 0.0 0.0 0.0 0.0 0.1 0.0 0.0 0.0 0.0 0.0 0.0More 0.0 0.0 0.0 0.0 0.0 0.0 0.0 0.0 0.0 0.0 0.0 0.0Other 1.2 1.1 1.3 1.3 2.2 0.2 2.1 1.8 3.1 1.5 1.7 1.5
No usual brand 11.3 10.3 7.7 5.6 7.0 6.1 4.3 4.2 3.9 7.1 7.2 5.9
N= 483 892 673 636 1197 876 642 1091 603* Census categories: Lg MSA = the 18 largest Standard Metropolitan Statistical Areas, Other MSA = all other Metropolitan Statistical Areas, Non-MSA = areas not designated as Metropolitan Statistical Areas.
** Average value across the three grades, each weighted equally.
1/3/4 1/3/4 1/3/610th grade 12th grade
Table 9
(entries are percentages)
all grades**
1998 Cigarette Brand Preference by Population Density*for Past Thirty-Day Smokers
8th grade

form(s):No Yes No Yes No Yes No Yes
Marlboro 57.4 52.9 61.5 61.4 68.5 64.6 62.5 59.6Newport 22.4 21.5 20.6 16.4 13.2 12.3 18.7 16.7Camel 3.4 6.2 7.9 7.1 8.3 10.5 6.5 7.9Parliament 1.0 0.7 0.0 1.3 0.3 2.6 0.4 1.5Winston 1.0 1.5 0.5 0.6 1.0 1.1 0.8 1.1Kool 1.1 0.8 1.6 1.0 0.4 0.4 1.0 0.7GPC 1.2 1.1 0.6 0.7 1.0 0.1 0.9 0.6Basic 1.0 0.4 0.8 0.7 0.7 0.2 0.8 0.4Virginia Slims 0.3 0.8 0.3 0.4 0.1 0.5 0.2 0.6Doral 0.3 1.1 0.3 0.3 0.4 0.2 0.3 0.5Benson & Hedges 0.2 0.4 0.4 0.4 0.1 0.2 0.2 0.3Salem 0.2 0.1 0.2 0.4 0.2 0.3 0.2 0.3Merit 0.3 0.5 0.0 0.1 0.0 0.0 0.1 0.2Misty 0.2 0.3 0.0 0.1 0.0 0.0 0.1 0.1Capri 0.0 0.0 0.2 0.1 0.0 0.2 0.1 0.1Pall Mall 0.0 0.1 0.0 0.1 0.3 0.0 0.1 0.1Cambridge 0.0 0.1 0.0 0.1 0.3 0.0 0.1 0.1Black & Whites 0.5 0.0 0.1 0.1 0.0 0.0 0.2 0.0Kent 0.0 0.1 0.0 0.1 0.0 0.0 0.0 0.1Vantage 0.0 0.0 0.0 0.1 0.0 0.0 0.0 0.0Monarch 0.0 0.0 0.0 0.0 0.0 0.1 0.0 0.0Carlton 0.0 0.0 0.0 0.0 0.0 0.0 0.0 0.0More 0.0 0.0 0.0 0.0 0.0 0.0 0.0 0.0Other 1.0 1.3 1.3 1.2 2.3 2.3 1.5 1.6
No usual brand 8.6 10.1 3.9 7.3 3.1 4.4 5.2 7.3
N= 409 1538 653 2003 641 1474* "Yes" indicates that the respondent expects to complete four years of college.
** Average value across the three grades, each weighted equally.
Table 10
(entries are percentages)
1/3/4 1/3/4 1/3/6
1998 Cigarette Brand Preference by Four-Year College Plans*for Past Thirty-Day Smokers
8th grade 10th grade 12th grade all grades**

form(s):1-3 low 3.5-4 4.5-6 hi 1-3 low 3.5-4 4.5-6 hi 1-3 low 3.5-4 4.5-6 hi 1-3 low 3.5-4 4.5-6 hi
Marlboro 56.7 52.5 53.1 63.1 63.4 56.7 69.0 67.8 60.4 62.9 61.2 56.7Newport 24.4 22.4 18.1 18.6 15.8 17.2 16.3 10.8 10.2 19.8 16.3 15.2Camel 3.8 4.1 9.6 4.3 8.5 10.1 5.0 8.9 15.4 4.4 7.2 11.7Parliament 0.6 0.7 1.1 0.3 0.4 2.5 1.3 1.4 3.1 0.7 0.8 2.2Winston 0.7 1.1 2.2 0.6 0.4 0.7 0.7 1.1 1.4 0.7 0.9 1.4Kool 0.6 0.0 1.5 1.2 0.8 1.4 0.6 0.4 0.0 0.8 0.4 1.0GPC 1.5 1.2 0.6 1.6 0.0 0.2 0.1 0.9 0.0 1.1 0.7 0.3Basic 1.5 0.0 0.1 0.8 0.3 0.9 0.4 0.5 0.2 0.9 0.3 0.4Virginia Slims 0.1 0.3 1.7 0.4 0.4 0.3 0.2 0.6 0.3 0.2 0.4 0.8Doral 1.1 0.8 0.7 0.7 0.0 0.1 0.3 0.4 0.1 0.7 0.4 0.3Benson & Hedges 0.1 0.6 0.5 0.3 0.7 0.4 0.2 0.1 0.2 0.2 0.5 0.4Salem 0.2 0.1 0.2 0.6 0.2 0.2 0.2 0.5 0.3 0.3 0.3 0.2Merit 0.4 0.2 0.4 0.0 0.2 0.1 0.0 0.0 0.0 0.1 0.1 0.2Misty 0.0 0.8 0.0 0.1 0.0 0.2 0.0 0.0 0.2 0.0 0.3 0.1Capri 0.0 0.0 0.0 0.4 0.1 0.0 0.4 0.1 0.0 0.3 0.1 0.0Pall Mall 0.0 0.0 0.2 0.0 0.0 0.2 0.2 0.0 0.1 0.1 0.0 0.2Cambridge 0.0 0.2 0.0 0.0 0.2 0.0 0.0 0.3 0.0 0.0 0.2 0.0Black & Whites 0.1 0.0 0.2 0.1 0.0 0.1 0.0 0.0 0.0 0.1 0.0 0.1Kent 0.0 0.0 0.2 0.0 0.0 0.2 0.0 0.0 0.0 0.0 0.0 0.1Vantage 0.0 0.0 0.0 0.0 0.3 0.0 0.0 0.0 0.0 0.0 0.1 0.0Monarch 0.0 0.0 0.0 0.0 0.0 0.0 0.0 0.0 0.2 0.0 0.0 0.1Carlton 0.0 0.0 0.0 0.0 0.0 0.1 0.0 0.0 0.0 0.0 0.0 0.0More 0.0 0.0 0.0 0.0 0.0 0.0 0.0 0.0 0.0 0.0 0.0 0.0Other 1.5 1.6 0.8 1.4 0.9 1.6 1.9 2.2 2.7 1.6 1.6 1.7
No usual brand 7.0 13.3 8.9 5.5 7.4 6.9 3.2 4.0 5.3 5.2 8.2 7.0
N= 743 539 590 1047 687 864 766 660 761* Parental education is an average score of mother's education and father's education reported on the following scale: (1) Completed grade school or less, (2) Some high school, (3) Completed high school, (4) Some college, (5) Completed college, (6) Graduate or professional school after college. Missing data was allowed on one of the two variables.
** Average value across the three grades, each weighted equally.
10th grade 12th grade all grades**
(entries are percentages)
Table 11
1/3/4 1/3/4 1/3/6
1998 Cigarette Brand Preference by Parental Education*for Past Thirty-Day Smokers
8th grade

Cigarette Brand Preferences
23
APPENDIX A: TEXT OF QUESTIONS

Occasional Paper No. 45
24

Appendix A
Monitoring the Future Cigarette Question Text
Question on lifetime smoking:
I I. Have you ever smoked cigarettes?
@ Never-GO TO CWESTION 13 @ Once or twice @ Occasionally but not regularly @ Regularty in the past @I Regularly now
Question on 30day smoking:
2 How frequently have you smoked cigarettes durtng the past 30 days?
@ Not at a&GO TO QUESTION 6 @ Less than one cigarette per day @ One to five cigarettes per day @ About one-hatt pack per day @ About one pack per day @ About one and one-half packs per day @ Two packs or more oer day
Question on cigarette brand preference:
5. What brand of cigarettes do you usually smoke? (Brands are in alphabetical order. Mark only one.)
0 Basic 0 Kent 0 Parliament 0 Benson 8 Hedges 0 Kool 0 Salem 0 Black & Whites
OMisty 0 Winston 0 Monarch 0 More 0 Other
0 Dora1 0 No usual brand 0 GPC 8 ;d’Jm;
Questions on how cigarettes were purchase&
3. Durfng the last 30 m abut how many times (ff aniij have you bought c@m... iMari&e cirtile for each Ii&)
gPI w
L n xs8 b. . ..on your own from vending
machines? _. . . . . . . . . . . . . . . . . .~~~~~~
C. Ahrough the mait? . . . , . . . . . . . .0000~0
d. . ..in a store where you pick up $ , the pack (or carton) and bring it .. to the check-out counter? . . . . . . .oooooo
8. . . .in a store where the cterk has tohandyouthepackorcarton? . .OOOOOO

Occasional Paper No. 45
26

Cigarette Brand Preferences
27
APPENDIX B: CONFIDENCE INTERVALS AND
SELECTED SIGNIFICANCE TESTS
FOR THREE CIGARETTE BRANDS

Table B-1
Marlboro use at 8th Grade, 1998
95% Confidence Interval* Significance tests*Lower Observed Upper
N limit estimate limit p-value signif.** Test
Total 2048 48.0 53.6 59.0
Gender: Male 863 46.4 51.7 57.1 0.4010 (t-test)
Female 1092 48.8 55.4 61.8
College Plans: None or under 4 Yrs. 409 49.7 57.4 64.7 0.3072 (t-test)
Complete 4 Yrs. 1538 47.5 52.9 58.2
Region: Northeast 284 25.9 39.9 55.8 0.2118 (ANOVA)
North Central 577 40.6 50.9 61.2 South 851 49.6 58.4 66.7 West 336 47.1 58.0 68.2
Population Density: Large MSA 483 33.9 43.1 52.9 0.0011 ss (ANOVA)
Other MSA 892 41.5 50.7 59.9 Non-MSA 673 57.6 65.2 72.0
Parental Education: 1.0-2.0 (Low) 205 48.8 58.4 67.4 0.5687 (ANOVA)
2.5-3.0 538 47.8 56.0 63.9 3.5-4.0 539 45.1 52.5 59.9 4.5-5.0 392 49.0 55.2 61.3 5.5-5.0 (High) 199 40.9 49.0 57.2
Race (1-Year average): White 1319 56.5 61.1 65.5 (t-test)
Black 166 4.4 8.9 17.3 0.0001 sss vs. White
Hispanic 257 45.9 56.7 66.9 0.4592 vs. White
* Confidence intervals and Significance tests incorporate clustered sampling design. t-test tests the difference between the prevalences of two sub-categories. ANOVA tests the hypothesis that the prevalences of all sub-categories are the same.
**level of significance: s=.05, ss=.01, sss=.001

Table B-2
Marlboro use at 10th Grade, 1998
95% Confidence Interval* Significance tests*Lower Observed Upper
N limit estimate limit p-value signif.** Test
Total 2708 56.8 61.1 65.2
Gender: Male 1209 53.7 58.0 62.2 0.0818 (t-test)
Female 1460 58.6 64.1 69.3
College Plans: None or under 4 Yrs. 653 55.9 61.5 66.7 0.9760 (t-test)
Complete 4 Yrs. 2003 56.7 61.4 65.8
Region: Northeast 600 37.2 47.2 57.4 0.0025 ss (ANOVA)
North Central 688 61.1 66.9 72.2 South 1028 55.4 62.7 69.4 West 392 62.5 68.3 73.5
Population Density: Large MSA 636 44.4 53.8 62.9 0.0011 ss (ANOVA)
Other MSA 1197 50.2 57.4 64.3 Non-MSA 876 65.4 71.5 76.9
Parental Education: 1.0-2.0 (Low) 244 55.8 62.3 68.5 0.3522 (ANOVA)
2.5-3.0 803 57.8 63.4 68.7 3.5-4.0 687 58.4 63.4 68.1 4.5-5.0 593 50.5 56.8 62.9 5.5-5.0 (High) 271 46.6 56.4 65.8
Race (1-Year average): White 2029 62.3 66.1 69.7 (t-test)
Black 178 5.4 9.7 16.8 0.0001 sss vs. White
Hispanic 245 56.8 64.9 72.3 0.7794 vs. White
* Confidence intervals and Significance tests incorporate clustered sampling design. t-test tests the difference between the prevalences of two sub-categories. ANOVA tests the hypothesis that the prevalences of all sub-categories are the same.
**level of significance: s=.05, ss=.01, sss=.001

Table B-3
Marlboro use at 12th Grade, 1998
95% Confidence Interval* Significance tests*Lower Observed Upper
N limit estimate limit p-value signif.** Test
Total 2334 61.4 65.3 68.9
Gender: Male 1118 60.1 64.6 68.8 0.6100 (t-test)
Female 1086 61.6 66.3 70.6
College Plans: None or under 4 Yrs. 642 63.0 68.5 73.4 0.2584 (t-test)
Complete 4 Yrs. 1472 60.6 64.6 68.5
Region: Northeast 432 41.7 54.2 66.2 0.0012 ss (ANOVA)
North Central 677 67.6 72.7 77.3 South 855 63.3 68.6 73.4 West 370 48.5 56.9 64.9
Population Density: Large MSA 641 49.3 58.5 67.2 0.1816 (ANOVA)
Other MSA 1089 62.3 67.3 71.9 Non-MSA 603 59.7 68.8 76.7
Parental Education: 1.0-2.0 (Low) 170 54.2 63.2 71.4 0.014 s (ANOVA)
2.5-3.0 596 65.4 70.7 75.4 3.5-4.0 659 63.8 67.9 71.8 4.5-5.0 487 58.5 63.8 68.8 5.5-5.0 (High) 273 45.6 54.3 62.8
Race (1-Year average): White 1816 66.7 70.3 73.6 (t-test)
Black 106 2.0 5.2 12.9 0.0001 sss vs. White
Hispanic 156 45.7 57.7 68.8 0.0340 s vs. White
* Confidence intervals and Significance tests incorporate clustered sampling design. t-test tests the difference between the prevalences of two sub-categories. ANOVA tests the hypothesis that the prevalences of all sub-categories are the same.
**level of significance: s=.05, ss=.01, sss=.001

Table B-4
Newport use at 8th Grade, 1998
95% Confidence Interval* Significance tests*Lower Observed Upper
N limit estimate limit p-value signif.** Test
Total 2048 17.5 22.5 28.3
Gender: Male 863 16.2 21.0 26.7 0.6170 (t-test)
Female 1092 17.6 23.0 29.4
College Plans: None or under 4 Yrs. 409 16.2 22.4 30.1 0.8414 (t-test)
Complete 4 Yrs. 1538 16.7 21.5 27.2
Region: Northeast 284 20.3 32.2 46.9 0.0616 (ANOVA)
North Central 577 14.5 24.8 39.0 South 851 15.7 22.5 31.3 West 336 4.5 10.1 21.2
Population Density: Large MSA 483 19.1 30.8 45.6 0.0505 ~ (ANOVA)
Other MSA 892 17.4 24.8 34.0 Non-MSA 673 7.7 13.5 22.4
Parental Education: 1.0-2.0 (Low) 205 14.0 21.4 31.2 0.2953 (ANOVA)
2.5-3.0 538 18.6 25.5 33.9 3.5-4.0 539 16.5 22.4 29.6 4.5-5.0 392 14.5 20.3 27.6 5.5-5.0 (High) 199 8.6 13.8 21.4
Race (1-Year average): White 1319 10.9 14.8 19.7 (t-test)
Black 166 60.4 71.1 79.9 0.0001 sss vs. White
Hispanic 257 12.6 22.0 35.5 0.2076 vs. White
* Confidence intervals and Significance tests incorporate clustered sampling design. t-test tests the difference between the prevalences of two sub-categories. ANOVA tests the hypothesis that the prevalences of all sub-categories are the same.
**level of significance: s=.05, ss=.01, sss=.001

Table B-5
Newport use at 10th Grade, 1998
95% Confidence Interval* Significance tests*Lower Observed Upper
N limit estimate limit p-value signif.** Test
Total 2708 13.7 17.7 22.5
Gender: Male 1209 11.7 15.6 20.3 0.3124 (t-test)
Female 1460 14.3 19.1 25.0
College Plans: None or under 4 Yrs. 653 15.0 20.6 27.8 0.2584 (t-test)
Complete 4 Yrs. 2003 12.7 16.4 20.8
Region: Northeast 600 19.9 30.8 44.5 0.0001 sss (ANOVA)
North Central 688 8.6 13.1 19.5 South 1028 12.1 18.0 26.0 West 392 2.4 4.8 9.3
Population Density: Large MSA 636 18.2 27.1 38.4 0.0117 s (ANOVA)
Other MSA 1197 12.4 18.8 27.4 Non-MSA 876 5.2 9.4 16.6
Parental Education: 1.0-2.0 (Low) 244 10.8 15.6 21.9 0.4932 (ANOVA)
2.5-3.0 803 14.1 19.5 26.4 3.5-4.0 687 11.6 15.8 21.3 4.5-5.0 593 14.0 19.2 25.7 5.5-5.0 (High) 271 8.7 12.9 18.7
Race (1-Year average): White 2029 9.4 12.7 17.0 (t-test)
Black 178 60.4 70.7 79.2 0.0001 sss vs. White
Hispanic 245 10.7 15.9 22.9 0.3682 vs. White
* Confidence intervals and Significance tests incorporate clustered sampling design. t-test tests the difference between the prevalences of two sub-categories. ANOVA tests the hypothesis that the prevalences of all sub-categories are the same.
**level of significance: s=.05, ss=.01, sss=.001

Table B-6
Newport use at 12th Grade, 1998
95% Confidence Interval* Significance tests*Lower Observed Upper
N limit estimate limit p-value signif.** Test
Total 2334 10.3 13.2 16.9
Gender: Male 1118 9.0 12.1 16.1 0.5686 (t-test)
Female 1086 10.2 13.6 18.0
College Plans: None or under 4 Yrs. 642 9.8 13.2 17.5 0.7338 (t-test)
Complete 4 Yrs. 1472 9.2 12.3 16.2
Region: Northeast 432 11.3 21.5 37.1 0.0033 ss (ANOVA)
North Central 677 6.2 9.0 13.0 South 855 10.9 15.5 21.6 West 370 3.2 5.9 10.8
Population Density: Large MSA 641 9.8 16.2 25.7 0.5934 (ANOVA)
Other MSA 1089 8.3 11.6 15.9 Non-MSA 603 7.3 13.1 22.3
Parental Education: 1.0-2.0 (Low) 170 13.6 20.8 30.6 0.0443 s (ANOVA)
2.5-3.0 596 11.2 15.0 19.8 3.5-4.0 659 7.9 10.7 14.2 4.5-5.0 487 7.4 11.0 16.0 5.5-5.0 (High) 273 4.6 8.7 15.9
Race (1-Year average): White 1816 5.6 7.6 10.1 (t-test)
Black 106 68.5 82.3 90.9 0.0001 sss vs. White
Hispanic 156 13.6 23.0 36.1 0.0001 sss vs. White
* Confidence intervals and Significance tests incorporate clustered sampling design. t-test tests the difference between the prevalences of two sub-categories. ANOVA tests the hypothesis that the prevalences of all sub-categories are the same.
**level of significance: s=.05, ss=.01, sss=.001

Table B-7
Camel use at 8th Grade, 1998
95% Confidence Interval* Significance tests*Lower Observed Upper
N limit estimate limit p-value signif.** Test
Total 2048 3.8 5.4 7.5
Gender: Male 863 5.0 7.3 10.6 0.0718 (t-test)
Female 1092 2.6 4.2 6.7
College Plans: None or under 4 Yrs. 409 1.9 3.4 5.9 0.0702 (t-test)
Complete 4 Yrs. 1538 4.4 6.2 8.8
Region: Northeast 284 1.5 4.0 9.9 0.0709 (ANOVA)
North Central 577 3.9 6.8 11.5 South 851 1.8 3.3 5.8 West 336 5.1 9.5 17.0
Population Density: Large MSA 483 2.8 6.6 14.5 0.8364 (ANOVA)
Other MSA 892 3.3 5.0 7.4 Non-MSA 673 2.9 5.0 8.7
Parental Education: 1.0-2.0 (Low) 205 1.7 4.6 12.2 0.0051 ss (ANOVA)
2.5-3.0 538 1.5 3.4 7.5 3.5-4.0 539 2.3 4.1 7.3 4.5-5.0 392 4.7 7.7 12.4 5.5-5.0 (High) 199 8.4 13.3 20.4
Race (1-Year average): White 1319 4.4 6.3 8.9 (t-test)
Black 166 0.6 1.7 5.1 0.0244 ss vs. White
Hispanic 257 2.5 4.1 6.7 0.1738 vs. White
* Confidence intervals and Significance tests incorporate clustered sampling design. t-test tests the difference between the prevalences of two sub-categories. ANOVA tests the hypothesis that the prevalences of all sub-categories are the same.
**level of significance: s=.05, ss=.01, sss=.001

Table B-8
Camel use at 10th Grade, 1998
95% Confidence Interval* Significance tests*Lower Observed Upper
N limit estimate limit p-value signif.** Test
Total 2708 5.7 7.3 9.3
Gender: Male 1209 7.5 9.9 13.0 0.0028 ss (t-test)
Female 1460 3.4 4.9 7.2
College Plans: None or under 4 Yrs. 653 5.9 7.9 10.6 0.5754 (t-test)
Complete 4 Yrs. 2003 5.3 7.0 9.3
Region: Northeast 600 5.0 7.4 10.8 0.0873 (ANOVA)
North Central 688 7.7 10.7 14.7 South 1028 2.9 5.4 9.8 West 392 4.1 6.2 9.4
Population Density: Large MSA 636 2.7 5.5 10.6 0.6975 (ANOVA)
Other MSA 1197 5.5 7.8 10.8 Non-MSA 876 5.2 8.0 12.1
Parental Education: 1.0-2.0 (Low) 244 0.8 2.5 7.1 0.0012 ss (ANOVA)
2.5-3.0 803 3.4 4.9 6.9 3.5-4.0 687 6.2 8.5 11.5 4.5-5.0 593 5.9 8.7 12.8 5.5-5.0 (High) 271 8.6 13.1 19.5
Race (1-Year average): White 2029 6.5 8.3 10.7 (t-test)
Black 178 0.0 0.0 2.1 0.0008 sss vs. White
Hispanic 245 0.1 0.4 1.8 0.0001 sss vs. White
* Confidence intervals and Significance tests incorporate clustered sampling design. t-test tests the difference between the prevalences of two sub-categories. ANOVA tests the hypothesis that the prevalences of all sub-categories are the same.
**level of significance: s=.05, ss=.01, sss=.001
Table B-9
Camel use at 12th Grade, 1998
95% Confidence Interval* Significance tests*Lower Observed Upper
N limit estimate limit p-value signif.** Test
Total 2334 7.9 9.6 11.6
Gender: Male 1118 8.6 11.2 14.6 0.1188 (t-test)
Female 1086 6.5 8.4 10.8
College Plans: None or under 4 Yrs. 642 6.4 8.3 10.8 0.1836 (t-test)
Complete 4 Yrs. 1472 8.4 10.6 13.2
Region: Northeast 432 5.7 8.3 12.0 0.0060 ss (ANOVA)
North Central 677 5.9 8.3 11.7 South 855 5.5 7.6 10.3 West 370 11.7 17.9 26.4
Population Density: Large MSA 641 6.5 9.7 14.3 0.2451 (ANOVA)
Other MSA 1089 8.8 11.1 13.8 Non-MSA 603 3.7 6.7 11.9
Parental Education: 1.0-2.0 (Low) 170 1.5 3.6 8.3 0.0001 sss (ANOVA)
2.5-3.0 596 3.7 5.4 7.8 3.5-4.0 659 6.6 8.9 11.8 4.5-5.0 487 9.2 12.0 15.4 5.5-5.0 (High) 273 16.9 21.6 27.2
Race (1-Year average): White 1816 9.0 10.9 13.2 (t-test)
Black* 106 0.0 0.0 3.5 0.0001 sss vs. White
Hispanic 156 1.2 3.4 9.2 0.0214 s vs. White
* Confidence intervals and Significance tests incorporate clustered sampling design. t-test tests the difference between the prevalences of two sub-categories. ANOVA tests the hypothesis that the prevalences of all sub-categories are the same.
**level of significance: s=.05, ss=.01, sss=.001