CIF Sector Recommendation Report (Spring 2013) · CIF Sector Recommendation Report (Spring 2013)...
35
1 Date: 3/20/13 Analyst: Brady Parsons CIF Sector Recommendation Report (Spring 2013) Sector: Technology Review Period: February 28 st – March 13 th Section (A) Sector Performance Review Copy/paste “Sector Review Spreadsheet” (the entire spreadsheet) here As one can see from the graph presented above and the chart presented below the XLK performed fairly similar to the S&P500 for the two week time period consisting of February 28 th -March 13 th . That being said the market as a whole did see 0.7% more growth for the period observed which was somewhat surprising to me because the XLK is much more volatile than the market implying larger price changes. I would have speculated that the XLK would have experienced more growth or regression in response to the recent cyber-attacks on American business. Technology began to see growth after it had dropped in the last period examined but did not see significant growth because these attacks still had not been fixed which increased uneasiness among these technology companies as open market vulnerability became an increasing reality. According to Michael Chertoff, the former secretary of Homeland Security companies needs to use a strategy which he deemed “active defense”. This is the idea that states companies should not just erect walls to prevent cyber-attacks, but instead make it more difficult for hackers to climb into your systems and pursue aggressively those who do. All of our
Transcript of CIF Sector Recommendation Report (Spring 2013) · CIF Sector Recommendation Report (Spring 2013)...

1
Date: 3/20/13
Analyst: Brady Parsons
CIF Sector Recommendation Report (Spring 2013)
Sector: Technology Review Period: February 28st – March 13th
Section (A) Sector Performance Review
Copy/paste “Sector Review Spreadsheet” (the entire spreadsheet) here
As one can see from the graph presented above and the chart presented below the XLK
performed fairly similar to the S&P500 for the two week time period consisting of February
28th-March 13th. That being said the market as a whole did see 0.7% more growth for the period
observed which was somewhat surprising to me because the XLK is much more volatile than the
market implying larger price changes. I would have speculated that the XLK would have
experienced more growth or regression in response to the recent cyber-attacks on American
business. Technology began to see growth after it had dropped in the last period examined but
did not see significant growth because these attacks still had not been fixed which increased
uneasiness among these technology companies as open market vulnerability became an
increasing reality. According to Michael Chertoff, the former secretary of Homeland Security
companies needs to use a strategy which he deemed “active defense”. This is the idea that
states companies should not just erect walls to prevent cyber-attacks, but instead make it more
difficult for hackers to climb into your systems and pursue aggressively those who do. All of our

2
holdings except for Visa did see slight growth in the time period which did show that there is
progress being made to resolve these security breaches. Visa did not improve as they are a
company that relies heavily on the security that they can provide their customers in terms of
credit card and debit card security. Once the storm settles I believe Visa will rebound and
outperform their competition. The performance of the XLK leans heavily on the economy as a
whole (GDP) which improved by 0.1% in quarter 4 of 2012. This leads me to believe that the
technology sector will outperform the market for the year of 2013 once these cyber-attacks
have been resolved.
An industry that is on the rise within the technology sector is the tablet industry. In
recent time companies such as Apple have been releasing alternative smaller models which in
turn results in lower prices for the product. This has helped boost the industry because dollar
votes are critical in the retail industry where consumers are always looking for affordable
Market Research Firm International Data Corporation stated that they expect the worldwide
tablet market to reach 190.9 million units in 2013, which is a significant increase compared to
its previous forecast of 172.4 million units. Between 2013 and 2016, the tablet industry is
expected to grow at a rate equal to 11% annually. Tablet shipments are forecast to be upwards
of 350 million units by the end of 2017, due to the popularity of smaller tablets.
(Wallstcheatsheet.com)
Our first holding Qualcomm experienced fairly constant slight growth for the time
period. The company did see a large price spike on March 4th but two days later on March 6th

3
they saw an equal price decrease. The increase was due to the announcement that they would
launch a strategic collaboration with WebMD to form mHealth. Then two days later the
company announced an increase in their quarterly dividend by 40% which caused the stock to
then fall. EMC Corp saw their stock price increase by two dollars for the two week period
examined. It was a positive sign to see the stock performing well because prior to this time the
stock had lost value since we had purchased it. Many fund managers do believe that the stock is
undervalued and is now bouncing back from its sub-par guidance for VMware. Visa saw a slight
decrease in their price but not to a significant degree. That being said we are still in the green
for Visa and their new mobile phone system shows signs of significant growth in the future. In
regards to Cisco the newest holding for the XLK, they have seen positive growth which is a
positive sign because of their underperformance in 2012.
GAINERS +
Cree, Inc. (CREE): +19%
o Unveiled their new $10 LED light bulb which will make them a low cost leader
which caused unusually high volume.
Affymetrix Inc. (AFFX): +14%
o Beat analyst estimates by a significant margin and also signed a partnership with
DNA Link which resulted in an upgrade for the stock.
Hewlett Packard (HPQ): +8%
o Rode the momentum of beating analyst estimations and the unveiling of their
new media player.
LOSERS –
AVG Technologies (AVG): -24.5%
o They received many downgrades after their CEO J.R. Smith stepped down.
Maxwell Technologies (MXWL): -17%
o On March 9th Faruqi & Faruqi LLP which is a national law firm began an investigation on MXWL concerning possible breaches of fiduciary duty and other violations of law related to their financial statements.
Apple Inc. (AAPL): -4% o Apple’s downward spiral continued leaving them wondering how much farther
their share price will fall.

4
Highlight the largest two holdings from the sector and note any headline news on the
companies
When examining the XLK it is important to look at its largest holding Apple Inc. because
of the large influence they have on the ETF. After hitting its $705 peak in the fall of 2012, Apple
hit a fresh 52-week low on March 1st. The stock has now fallen 39% from its peak to the $430
range. According to finance.yahoo.com a 20% price decline is the definition of a bear market.
The drop to the bottom was a result of the recent lawsuit David Einhorn filed against the
company for hoarding cash on the balance sheet. Mr. Einhorn wants Apple to offer preferred
stock to its shareholders for $50. This would offer investors high yields as well as help to
improve the state of their common stock. Also I believe this dramatic decline could be an
indicator for what the future holds for the rest of the stock market.
The second largest holding within the technology sector is International Business
Machines (IBM). Over the time period examined they saw their share price increase by
approximately $10 even though they saw a decrease in volume. The company has positioned
itself in the front of the pack for the big data market. According to themotleyfool.com they
have beaten Teradata and Oracle to the major data storage marketplace. IBM’s data storage
unit is growing at a rate of 60% a year which shows where the company is focusing its assets.
The company believes that they will unlock $16 billion in revenue by 2015 in this big data
market.
I expect that technology sector to perform very well in the near future and outperform
the market as a whole. Very few companies have been experiencing consistent decreases and
most companies have relatively low valuation ratios showing the potential for future growth.
Because this sector is affected so largely by the domestic GDP I am watching very intently on
the consequences of the sequester budget cuts. If these cuts decrease the consumer sentiment
it will affect the sales volume of these companies which will drive down their share prices.
Because the XLK experienced a 2% increase in my two week period I believe that these cuts
impact will not be felt to significant degree which will continue the growth of technology
companies.

5
Section (B) Sector Holding Updates
Company #1: Qualcomm (QCOM)
Date Recommended: 12-6-12
Date Re-evaluated: 3-20-13
Company Update
Over the two weeks Qualcomm saw relatively no changes as their price changed from
$65.64 to $66.75. Qualcomm’s future looks bright as they surpassed estimates for the first
quarter of 2013 which caused them to raise their guidance for the fiscal year 2013. The
company is dominating the LTE market and controls 86% of the market currently. This
stranglehold looks like it will not end as they recently released their next generation of
processor which they call Snapdragon. The company already has secured contracts to be in 50
different products already. The company is excited about the release of the Samsung Galaxy S4
which will feature these chips. This phone is expected to become the most popular on the
market which would be huge for Qualcomm.
Relative Performance
Qualcomm saw close to 2% growth for the two weeks which was less significant than both the
XLK and the market as a whole. The company did start fast and saw a large price spike on March 4th but
two days later on March 6th they saw an equal price decrease. The increase was due to the
announcement that they would launch a strategic collaboration with WebMD to form mHealth. Then

6
two days later the company announced an increase in their quarterly dividend by 40% which caused the
stock to then fall. Investors seemed to be reluctant within the technology sector in the wake of the
cyber-attacks which caused the market to grow faster than QCOM as well as the XLK.
Price Charts
3 Month
1 Year

7
Valuations Analysis
Original Analysis
Re-evaluation Analysis
P/E Ratio (TTM) 19.48 24.46 23.61
Price to Sales (TTM) 5.46 1.30 3.16
Price to Book (MRQ) 3.16 1.62 3.95
Price to Tangible Book (MRQ) 3.91 2.37 4.90
Price to Cash Flow (TTM) 16.62 20.09 15.26
Qualcomm has seen all of its valuation ratios decrease since the time that it was first
examined. This means that the company is now more undervalued than it was when it was first
recommended. That being said the valuations are not very attractive for Qualcomm because
they still suggest that they are more overvalued than their industry and sector.
8
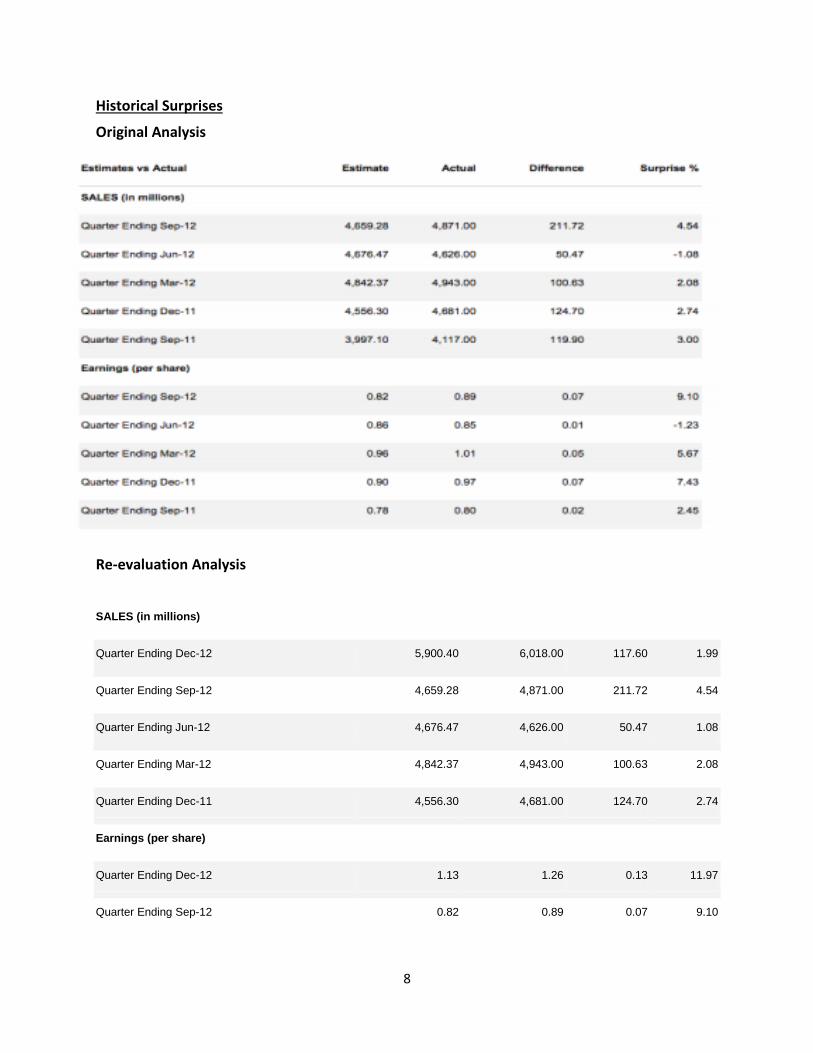
Historical Surprises
Original Analysis
Re-evaluation Analysis
SALES (in millions)
Quarter Ending Dec-12 5,900.40 6,018.00 117.60 1.99
Quarter Ending Sep-12 4,659.28 4,871.00 211.72 4.54
Quarter Ending Jun-12 4,676.47 4,626.00 50.47 1.08
Quarter Ending Mar-12 4,842.37 4,943.00 100.63 2.08
Quarter Ending Dec-11 4,556.30 4,681.00 124.70 2.74
Earnings (per share)
Quarter Ending Dec-12 1.13 1.26 0.13 11.97
Quarter Ending Sep-12 0.82 0.89 0.07 9.10

9
Quarter Ending Jun-12 0.86 0.85 0.01 1.23
Quarter Ending Mar-12 0.96 1.01 0.05 5.67
Quarter Ending Dec-11 0.90 0.97 0.07 7.43
There have been no new earnings reports since the last time the stock was evaluated by
Taylor Woodruff in his sector report. That being said the report is fairly new and is the end of
the fourth fiscal quarter of the year 2012. They positively surprised in the revenue department
by approximately 2% and for earnings they had a positive surprise of approximately 12%. This is
actually the most significant surprise that the company has seen in the trailing 4 quarters which
is a bullish indicator going forward.
Consensus Estimates
Original Analysis

10
Re-Evaluation Analysis
Analyst estimates are trending upwards in both the short and long term. Analysts have
increased their expectations in both sales and earnings for not only the first two quarters of
fiscal 2013 but also the next two fiscal years. This is due to their recent positive surprise in the
fourth quarter of 2012 showing bullish potential moving forward.
Estimate Revision Analysis

11
Re-Evaluation Analysis
In terms of the last four weeks QCOM is seeing far fewer up revisions but is still seeing
no down revisions. That being said this week the stock is receiving one up revision in all time
periods in terms of earnings and revenue except for the current quarter. It appears as though
the stock was in a much larger stage of growth when first recommended compared to now.
Analysts’ Recommendations

12
Re-Evaluation Analysis
The analysts’ recommendation and revisions have stayed fairly unchanged. They have
the same amount of sell votes and only 1 fewer buy vote compared to the original evaluation.
They also have three fewer votes for outperform, which shows yet again that the stock is not in
as bullish of a position that it was when first purchased.
Company #2: EMC Corporation (EMC)
Company Update
Over the two weeks examined EMC saw its stock price grow almost two dollars from
$23.28 to $24.90. This was a positive sign for the company because they had been declining in
the weeks prior to this primarily due to the cyber-attacks and a skeptical outlook on economic
growth in the year 2013. A good strategic move the company made to boost its price was
deciding to separate EMC from the cloud based service VMware which had been dragging the
price down. They plan to separate them to form a web-based software business but do not
currently plan on striving for an IPO. (wallstreetjournal.com)

13
Relative Performance
As can be seen in the chart EMC has outperformed the market as well as the XLK. The
company’s decision to part ways with VMware has changed the sentiment of the stock which
can be seen in its 8% increase in this short time period. This move allowed them to grow at a
higher rate than most of its competition within the technology sector.
Price Charts

14
Valuations Analysis
Re-evaluation Analysis
P/E Ratio (TTM) 20.53 17.94 23.61
Price to Sales (TTM) 2.46 0.81 3.16
Price to Book (MRQ) 2.39 1.91 3.95
Price to Tangible Book (MRQ) 8.23 2.28 4.90
Price to Cash Flow (TTM) 11.95 9.55 15.26
All of EMC’s valuation ratios have increased showing that the stock is more expensive
now than when it was first recommended. The stock seems to be undervalued in respect to the
sector as a whole but what I find troubling is that it is overvalued in all categories in respect to
its direct competitors that compete in its industry.

15
Historical Surprises
Re-evaluation Analysis
Because there have been no new earnings reports released since we purchased EMC the
estimates have remained unchanged.

16
Consensus Estimates
Re-Evaluation Analysis
While the consensus estimates have been revised upward for the upcoming two
quarters they have been revised down for both the next two years in terms of revenues. The
analysts seem to believe the company will perform better in the short run while their
performance will decline in the long run. In terms of earnings the estimates remain fairly
unchanged with no notable changes.

17
Estimate Revision Analysis
Original Analysis
Re-Evaluation Analysis
When the stock was first recommended it had an incredibly higher amount of revisions
both up and down for revenues and earnings. The majority of these revisions were down when
the stock was recommended as compared to now where most of the revisions are up. I believe
this shows that the stock has made it through a turbulent time and is poised to grow moving
forward.

18
Analysts’ Recommendations
Re-Evaluation Analysis
1-5 Linear Scale Current 1 Month
Ago 2 Month
Ago 3 Month
Ago
(1) BUY 15 17 18 17
(2) OUTPERFORM 19 17 15 19
(3) HOLD 7 7 8 5
(4) UNDERPERFORM 0 0 0 0
(5) SELL 0 0 0 0
No Opinion 0 0 0 0
Mean Rating 1.80 1.76 1.76 1.71
EMC’s mean rating increased by 0.07 which shows how little analysts’ opinion on the
stock has changed. Three analysts changed their vote from buy to outperform which means

19
they are not as confident in the company as they once were but this move is not significant
enough to raise concern with me.
Company #3: VISA (V)
Company Update
Visa saw its stock price decrease by fifty cents for the two weeks observed which is not
concerning considering its stock price which is slightly below $160. Zacks.com stayed neutral on
Visa for the time period even though they have experienced negative growth and have
experienced problems in its payment system. The company is improving its product portfolio
and has good operating leverage which will help it deal with increasing regulatory challenges.
The stock has also received a downgrade recently in response to bearish outlook for the
industry. The company does compete in a very competitive industry and faces increasing
expenses which is giving me a bearish outlook on the stock.
Relative Performance
Visa has been largely underperforming in respect to the XLK and the market as a whole.
It is troubling that in a time when most stocks are growing and the market is performing well
that Visa is experiencing negative growth. Visa is a volatile stock that does experience larger
price changes than other stocks which is a positive indicator that the stock will possibly
rebound. The fact that Visa is such a dominant force in its industry and the massive growth it
has seen in the last year leads me to believe that they will be able to solve their problems and
grow in the future.

20
Price Charts
3 month
1 Year
Valuations Analysis
Original Analysis

21
Re-evaluation Analysis
P/E Ratio (TTM) 72.50 24.99 36.05
Price to Sales (TTM) 11.88 11.56 5.53
Price to Book (MRQ) 3.80 0.54 1.48
Price to Tangible Book (MRQ) 28.28 1.01 3.53
Price to Cash Flow (TTM) 46.27 110.60 18.49
Visa’s ratios have decreased for the most part showing that it is possibly more
undervalued now than when we purchased it. The only ratio that increased was the P/E; its
increase was severe by approximately 22% showing that investors are paying more for the
earnings that the company is producing. It is troubling that such a crucial valuation has become
so expensive but the overall downtrend keeps me confident in Visa.
Historical Surprises
Original Analysis
Re-evaluation Analysis
SALES (in millions)
Quarter Ending Dec-12 2,817.16 2,846.00 28.84 1.02
Quarter Ending Sep-12 2,675.59 2,731.00 55.41 2.07

22
Quarter Ending Jun-12 2,521.88 2,565.00 43.12 1.71
Quarter Ending Mar-12 2,477.63 2,578.00 100.37 4.05
Quarter Ending Dec-11 2,434.14 2,547.00 112.86 4.64
Earnings (per share)
Quarter Ending Dec-12 1.79 1.82 0.03 1.88
Quarter Ending Sep-12 1.50 1.54 0.04 2.91
Quarter Ending Jun-12 1.45 1.56 0.11 7.65
Quarter Ending Mar-12 1.50 1.60 0.10 6.60
Quarter Ending Dec-11 1.45 1.49 0.04 2.8
There has been an earnings report released since the stock was recommended and Visa
was able to beat estimates in terms of both earnings and revenue. The margin was significant
which was interesting considering the stock has not seen a jump in its share price. This could
possibly be due to the bearish outlook on the industry that Visa competes.
Consensus Estimates
Original Analysis

23
Re-Evaluation Analysis
Quarter Ending Mar-13 30 2,854.29 2,920.30 2,772.28 2,729.31
Quarter Ending Jun-13 29 2,867.78 2,922.00 2,816.60 2,805.19
Year Ending Sep-13 31 11,577.10 11,707.00 11,437.00 11,322.60
Year Ending Sep-14 29 12,905.40 13,237.00 12,529.50 12,649.50
Earnings (per share)
Quarter Ending Mar-13 31 1.81 1.88 1.74 1.72
Quarter Ending Jun-13 30 1.78 1.92 1.73 1.71
Year Ending Sep-13 31 7.34 7.46 7.20 6.95
Year Ending Sep-14 32 8.51 8.97 8.05 8.10
LT Growth Rate (%) 7 18.57 20.00 15.00 19.31
Analysts have recently become more bullish on Visa as it has seen its estimates increase
in all periods except for the current quarter’s earnings. This shows the faith that analysts have
in the operation that Visa conducts. They seem to be confident that Visa is on the verge of
surprising the original estimates.

24
Estimate Revision Analysis
Original Analysis
Re-Evaluation Analysis
For the two week period observed Visa has not seen a single revision. Also in the last
month the company has seen very few changes. There was a single down revision for all of the
revenue periods projected but up revisions for all earnings periods being projected. This is a
positive sign that even though sales might not be as strong as the company hopes they are still
conducting business in a way that they will see positive surprises in terms of earnings. The

25
revisions have calmed a great deal since it was first recommended showing that it is in a stable
position.
Analysts’ Recommendations
Original Analysis
Re-Evaluation Analysis
The mean rating for Visa has remained unchanged since it was recommended. That
being said one analyst from both the buy and outperform vote changed their stance to a hold
vote while the analyst who recommended a sell is no longer giving an opinion.

26
Company #4: Cisco Systems (CSCO)
Company Update
Over the two weeks I examined CSCO’s share price grew by slightly more than 3% to
$21.58. The stock hit a new 52-week high during the time period and has seen impressive
volume. According to Thestreetwire.com the company’s strengths can be seen in many facets
including its impressive record of earnings per share growth, solid growth in net income, good
revenue growth, and notable return on equity. The company emerged from the pack in terms
of computer networking companies in the 1990’s and controls 85% of the computer networking
hardware market. That being said the company is struggling to adapt to the new age where
customers demand their suppliers to offer more sophisticated services than just equipment. In
order to adapt the company is trying to differentiate itself from other players by becoming
what they call “the internet of everything” (newyorktimes.com). Also fairly recent acquisitions
are boosting their value and are part of their plans in creating a new internet experience.
Relative Performance

27
Price Charts
3 Month
1 Year

28
Valuations Analysis
Original Analysis
Re-evaluation Analysis
P/E Ratio (TTM) 12.62 24.46 23.61
Price to Sales (TTM) 2.47 1.30 3.16
Price to Book (MRQ) 2.10 1.62 3.95
Price to Tangible Book (MRQ) 3.82 2.37 4.90
Price to Cash Flow (TTM) 9.68 20.09 15.26
While CSCO’s P/E ratio has remained fairly unchanged its industry has become much
less expensive by the large margin of 36%. While its competitors significantly increased the
amount they earn for investors dollars CSCO still is about half of the industry average in terms
of price to equity. Like the P/E all of CSCO’s ratios have remained fairly unchanged because of
how recently we purchased it.

29
Historical Surprises
Original Analysis
Re-evaluation Analysis
Quarter Ending Jan-13 12,063.10 12,098.00 34.89 0.29
Quarter Ending Oct-12 11,773.20 11,876.00 102.85 0.87
Quarter Ending Jul-12 11,609.00 11,690.00 80.98 0.70
Quarter Ending Apr-12 11,577.30 11,588.00 10.71 0.09
Quarter Ending Jan-12 11,232.30 11,527.00 294.66 2.62
Earnings (per share)

30
Quarter Ending Jan-13 0.48 0.51 0.03 6.43
Quarter Ending Oct-12 0.46 0.48 0.02 4.35
Quarter Ending Jul-12 0.46 0.47 0.01 2.87
Quarter Ending Apr-12 0.47 0.48 0.01 2.83
Quarter Ending Jan-12 0.43 0.47 0.04 8.27
There have not been any new earnings reports released since the stock was
recommended thus there has been no change. That being said it I would like to reemphasize
this company’s ability to surprise the estimates in terms of revenues and earnings in each of the
last 5 quarters. This is a trend that I believe will continue in the future.
Consensus Estimates
Original Analysis
Re-Evaluation Analysis
SALES (in millions)
Quarter Ending Apr-13 34 12,193.20 12,286.00 12,100.00 12,358.10
Quarter Ending Jul-13 34 12,513.90 12,994.60 12,253.00 12,817.60
Year Ending Jul-13 36 48,686.30 49,137.50 48,352.00 49,157.30

31
Year Ending Jul-14 35 51,382.90 53,347.20 49,220.00 52,513.70
Earnings (per share)
Quarter Ending Apr-13 36 0.49 0.51 0.48 0.50
Quarter Ending Jul-13 36 0.51 0.55 0.49 0.53
Year Ending Jul-13 39 1.99 2.04 1.95 1.98
Year Ending Jul-14 37 2.11 2.28 2.00 2.15
LT Growth Rate (%) 5 8.40 12.00 5.00 9.43
Since the stock has been recommended the estimate for revenues has dropped in all of
the time periods. This is troubling but on the upside the estimates for their earnings has
remained unchanged so hopefully they are able to prove the analysts wrong and have solid
sales figures.
Estimate Revision Analysis
Original Analysis

32
Re-Evaluation Analysis
In the month prior to the stock recommendation the company saw a substantial amount
of up and downgrades showing the uncertainty that surrounded the company’s performance.
That being said during my re-evaluation I discovered that there had been no revisions in the last
week and only one up revision for the year ending 2013 in earnings. This shows that since we
have owned this security they have stabilized their business which has led to no analyst
changes.
Analysts’ Recommendations
Original Analysis

33
Re-Evaluation Analysis
(1) BUY 13 15 14 13
(2) OUTPERFORM 14 13 14 14
(3) HOLD 8 8 10 14
(4) UNDERPERFORM 3 3 3 2
(5) SELL 1 1 1 1
No Opinion 0 0 0 0
Mean Rating 2.10 2.05 2.12 2.18
Since the stock was recommended analysts have taken on a slightly more bearish
outlook. One analyst who originally said buy failed to speculate from last time and one analyst
changed his stance to outperform which caused the mean rating to rise 0.05. I do not believe
that this is a significant change to cause any panic and things should turn around for CSCO.
Section (C) Sector Recommendations
Currently the CIF owns four stocks within the technology sector and the sector ETF
(XLK). There are 6,690 shares of the ETF, 620 shares of QCOM, 1,420 shares of EMC, 290 shares
of V, and 1,940 shares of CSCO. All of the stocks have performed well and are currently all in
positive growth figures from when the analysts executed their respective trades. I believe that
we should continue to hold all of the stocks because of their ability to maintain strong valuation
metrics. They are all strong companies that differ in the business they conduct which brings
strong diversity to our portfolio, specifically within the technology sector. I am bullish on the
technology sector as its valuation metrics are currently significantly lower than historical
figures. Also very few technology companies are currently struggling within the sector and most
are growing right in line with the market average which leads me to my decision that we should
1) Stay put with our current holdings and 2) not sell out of our sector. With that being said I
think it is very important for our analysts in the technology sector to choose wisely with their

34
stock choices for round two of investment meetings because there are a ton of great options
and values that currently exist in the sector. This would get some weight out of the ETF which is
not experiencing as much growth as could be realized.
Section (D) Sector Holding Recommendations
Company Name
Ticker
Symbol
Date
Recommended
Date Re-evaluated
Recommendation
(Explain Why)
Sell
Adjust “Target Price”
Adjust “Stop-
loss Price”
Qualcomm QCOM 12/6/12 3/20/13 No No No
EMC Corporation EMC 2/3/13 3/20/13 No No No
Visa V 2/7/13 3/20/13 No No No
Cisco Systems CSCO 2/24/13 3/20/13 No No No
I recommend that we do not sell any of our stocks nor would I recommend adjusting the
current target or stop-loss prices. The securities are all in positive figures for the CIF and show
signs of continuing to grow according to plan which makes me uneasy to make changes to our
plan. I believe we need to stay the course and wait to see earnings reports before making any
changes. As stated earlier hopefully we are able to add more securities to our portfolio as a
good amount of these companies are experiencing positive growth.

35
Sources
http://finance.yahoo.com/q/h?s=CSCO&t=2013-03-05
http://money.cnn.com/2013/03/12/technology/google-privacy-settlement/index.html
http://wallstcheatsheet.com/stocks/price-tags-and-screen-sizes-are-driving-tablet-
growth.html/?ref=YF
http://seekingalpha.com/article/1256201-qualcomm-this-stock-will-be-a-champion-in-
2013?source=yahoo
http://www.marketconsensus.com/news/market-update-382013-headlines-biggest-stock-
losers-winners
http://www.nytimes.com/2013/02/14/business/cisco-tops-expectations-with-rise-in-profit-of-
44.html?ref=ciscosystemsinc&_r=0
http://www.reuters.com/finance/stocks/analyst?symbol=CSCO.O