CIF LEARNING Assessing “Leverage” in the Climate ... · ASSESSING “LEVERAGE” IN THE CLIMATE...
42
June 2014 Assessing “Leverage” in the Climate Investment Funds CIF LEARNING
Transcript of CIF LEARNING Assessing “Leverage” in the Climate ... · ASSESSING “LEVERAGE” IN THE CLIMATE...

June 2014
Assessing “Leverage” in the Climate Investment Funds
CIF LEARNING

Assessing “Leverage” in the Climate Investment Funds
June 2014
CTF Leverage text 6-5-14.indd 1 6/5/14 11:40 AM

Copyright 2014
World Bank
1818 H Street NW
Washington, DC 20433 USA
All Rights Reserved
Manufactured in the United States of America
First printing March 2013
Acknowledgments
This paper was prepared by Michelle de Nevers, Senior Associate at the Center for Global Development, under the guidance of Patricia Bliss-Guest, Program Manager of the Climate Investment Funds (CIF) Administrative Unit. Helpful comments in preparing the paper were received from col-leagues in the CIF Administrative Unit and the CIF’s multilateral develop-ment bank partners: Philippe Ambrosi, Preety Bhandari, Andreas Biermann, Mafalda Duarte, Shaanti Kapila, Joyita Mukherjee, Funke Oyewole, Shilpa Patel, Doug Proctor, Gevorg Sargsyan, Andrey Shlyakhtenko, Stacy Swann and Gloria Visconti.
CTF Leverage text 6-5-14.indd 2 6/5/14 11:40 AM

Contents
INTRODUCTION .....................................................................................1
BACKGROUND: DEFINITIONS OF LEVERAGE AND CLIMATE FINANCE IN THE LITERATURE .......................................................5
DEFINING LEVERAGE AND CLIMATE FINANCE IN MDB PORTFOLIOS: CURRENT PRACTICE ...............................................9
MEASURING LEVERAGE IN CIF PROJECTS .......................................15
ANNEXES .............................................................................................25
REFERENCES ........................................................................................33
CTF Leverage text 6-5-14.indd 3 6/5/14 11:40 AM

CTF Leverage text 6-5-14.indd 4 6/5/14 11:40 AM

Introduction
The Climate Investment Funds (CIF) are a pair of multilateral trust funds that provide funding to 48 developing and middle income countries in support of low carbon and climate resilient develop-
ment. The CIF are implemented by the five multilateral development banks (MDBs): the African Development Bank (AfDB), Asian Development Bank (ADB), European Bank for Reconstruction and Development (EBRD), Inter-American Development Bank (IDB); and the World Bank Group—including the International Bank for Reconstruction and Development (IBRD) and the International Finance Corporation (IFC).
The purpose of this paper is to assess “leverage” in projects that receive funding from the CIF. This paper flows from discussions within the Clean Technology Fund Trust Fund Committee seeking clarification on how issues such as attribution, leverage, and transformational impact should be understood and measured. This paper addresses the query about understanding leverage.
Why do we care about leverage?
The term leverage appears frequently in the growing literature on climate finance. It is most commonly used to describe the use of funds from public budgets to trigger complementary investment in climate action in develop-ing countries, especially from private sources. The term suggests that public climate funds can be catalytic in scaling up the total funding available for a project or program with climate-related objectives and can help to “crowd-in” private finance. The term leverage is also used to infer a causal role by one agency or funding source in organizing the overall financing package. The term leverage is often used interchangeably with other terms including mobilizing, catalyzing, co-financing, and co-investment.
Leverage is commonly considered to be one indicator of the effective use of scarce public resources to achieve desirable climate outcomes.1 Other dimensions of effectiveness may include reductions in greenhouse gas (GHG) emissions, increased resilience, achieving “transformational” impact or accelerating climate action. Public funders of international climate
1 (Clapp, November 2012).
CTF Leverage text 6-5-14.indd 1 6/5/14 11:40 AM

2 A S S E S S I N G “ L E V E R A G E ” I N T H E C L I M AT E I N V E S T M E N T F U N D S
programs would like to be able to understand how to assess the benefits of their own contribution to climate programs, in part to be able to reassure taxpayers that their funds are being used effectively. The idea is to evaluate the effectiveness of funds contributed from donor country public budgets in promoting climate action that might not have occurred, or might have occurred more slowly or on a smaller scale, without this contribution. The desire to assess the effectiveness of the contributed public funds has led to a focus on the leverage of public funds in international climate programs.
It should be understood that leverage is only one measure of the effective-ness of climate finance and other measures are also important. For example, a project could be very transformative—completely shifting an area of eco-nomic activity from a high carbon to low carbon pathway—but may have very low leverage. This is particularly true when it involves new or emerging technologies, where investment is dependent on regulatory or policy support (like feed-in-tariffs), where informational barriers pose high transaction costs, or where impacts are small relative to overall project costs and revenues.
Evaluating leverage in CIF projects can contribute to understanding how limited public resources can be best used. This paper explores the ques-tion: How shall we assess the performance of CIF projects in leveraging other sources of finance?
The Approach to Measuring Leverage in This Paper
The CIF are meant to promote climate action in developing countries on a large scale. Individual CIF-financed projects and programs are part of larger investment plans, country-led strategies for the use of CIF resources developed by governments in partnership with MDBs.2 In this paper lever-age is measured at the level of MDB-financed projects as defined in project documents approved by MDB Executive Boards.3
We assess three measures of leverage. The first measure is co-financing leverage: the total co-finance found in CIF projects. The second measure
2 Projects identified through the Clean Technology Fund Dedicated Private Sector Programs and Strategic Climate Fund private sector set asides are not included in country investment plans but should align with them.3 The CIF portfolio includes a number of private sector programs to which CIF funds are com-mitted to achieve a specified set of objectives—e.g., removing barriers to sustainable finance among local banks. Program funds are then used by the implementing MDB to finance multiple sub-projects. In this paper, the sub-projects would be considered as projects.
CTF Leverage text 6-5-14.indd 2 6/5/14 11:40 AM

A S S E S S I N G “ L E V E R A G E ” I N T H E C L I M AT E I N V E S T M E N T F U N D S 3
is private finance leverage: the ratio of CIF funding to total private finance in a CIF project. The third measure is the share of private finance in total CIF project financing: the share of private funding relative to the entire CIF project. Whereas the private finance leverage ratio looks at the nar-row relationship between CIF funds and private co-financing, the share of private finance is a broader measure that looks at the contribution of private finance relative to the entire project, including finance mobilized from all other sources.
The CIF model relies heavily on the involvement of MDBs in organizing financing packages. CIF funds are channeled through MDBs to benefit from established procedures, systems and relationships (such as environmental and social safeguards, robust monitoring and evaluation, technical due diligence, etc.), as well as to benefit from the capacity of the MDBs to mobilize co-finance from other public and private sources.4 This explains why CIF funds were channeled through MDBs in the first place, rather than transferred directly to recipient countries as loans, grants or through some other mechanism.
The guiding principle in assessing leverage in CIF projects is to be as trans-parent as possible (as to definitions and data quality) and also to be modest, refraining from making unwarranted claims about the role of CIF funds in attracting co-finance or the influence of CIF funds in structuring operations.
This paper has three sections: a background section reviewing defini-tions of leverage and climate finance in the literature; a review of current practice in defining and measuring leverage and climate finance in the MDBs involved in the CIF; and a section assessing the experience with leverage in the CIFs.
4 UN AGF Workstream 7 Paper, 2010.
CTF Leverage text 6-5-14.indd 3 6/5/14 11:40 AM

CTF Leverage text 6-5-14.indd 4 6/5/14 11:40 AM

Background: Definitions of leverage and climate finance in the literature5
At the United Nations Framework Convention on Climate Change (UNFCCC) climate summit in Copenhagen in 2009, developed countries committed to “a goal of mobilizing jointly USD 100 billion
per year by 2020 to address the needs of developing countries” (UNFCCC 2011). This has led to a burst of initiatives to define, measure, track and assess the quality of climate finance, including the terms “leverage” and “mobilization.” These terms have not been defined by the UNFCCC.
Climate Finance. Attempts to assess leverage often start by defining “climate finance.” The notion of treating climate finance differently than other sources of finance relates in part to the proposal that cli-mate finance should be “new and additional” to development finance. There does not exist yet an agreed definition of climate finance (ADB et al., 2011; World Bank Group, 2011, October – 2). And it is not always simple to distinguish “climate finance” from other types of finance. In a 2011 paper prepared for the G20 Finance Ministers, climate finance was defined as a term that “broadly refers to resources that catalyze low-carbon and climate-resilient development.” This definition is also used by some of the MDBs. See Section III for a discussion of the treatment of climate finance in this paper.
Leverage. As with the term climate finance, there is not yet an agreed definition of leverage in the context of climate finance (Brown et al., 2011, December; Clapp et al, 2012, May). While the discussion of leverage focuses mainly on how much private finance is mobilized, some agen-cies talk of leveraging both public and private finance; some count only financing mobilized by public concessional (or below market rate) funds; and others include both concessional and non-concessional funds. (See the section on MDB definitions of leverage.) The terms “mobilized” and “leveraged” are often used interchangeably (Caruso, 2013).
5 In this paper we refer to only to financial leverage as costed and quantified in project docu-ments (ie., not including in-kind leverage unless it is included in project cost). It’s also possible to consider “Indirect leverage,” that is, leveraging ideas and new models of program design, new approaches, technologies or project designs which can be transformational when they are scaled up. These dimensions of leverage will be covered in future work.
CTF Leverage text 6-5-14.indd 5 6/5/14 11:40 AM
6 A S S E S S I N G “ L E V E R A G E ” I N T H E C L I M AT E I N V E S T M E N T F U N D S
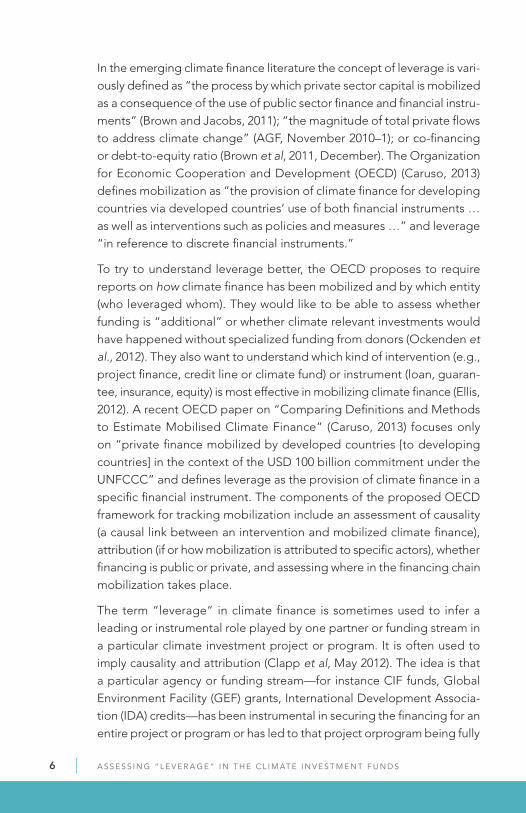
In the emerging climate finance literature the concept of leverage is vari-ously defined as “the process by which private sector capital is mobilized as a consequence of the use of public sector finance and financial instru-ments” (Brown and Jacobs, 2011); “the magnitude of total private flows to address climate change” (AGF, November 2010–1); or co-financing or debt-to-equity ratio (Brown et al, 2011, December). The Organization for Economic Cooperation and Development (OECD) (Caruso, 2013) defines mobilization as “the provision of climate finance for developing countries via developed countries’ use of both financial instruments … as well as interventions such as policies and measures …” and leverage “in reference to discrete financial instruments.”
To try to understand leverage better, the OECD proposes to require reports on how climate finance has been mobilized and by which entity (who leveraged whom). They would like to be able to assess whether funding is “additional” or whether climate relevant investments would have happened without specialized funding from donors (Ockenden et al., 2012). They also want to understand which kind of intervention (e.g., project finance, credit line or climate fund) or instrument (loan, guaran-tee, insurance, equity) is most effective in mobilizing climate finance (Ellis, 2012). A recent OECD paper on “Comparing Definitions and Methods to Estimate Mobilised Climate Finance” (Caruso, 2013) focuses only on “private finance mobilized by developed countries [to developing countries] in the context of the USD 100 billion commitment under the UNFCCC” and defines leverage as the provision of climate finance in a specific financial instrument. The components of the proposed OECD framework for tracking mobilization include an assessment of causality (a causal link between an intervention and mobilized climate finance), attribution (if or how mobilization is attributed to specific actors), whether financing is public or private, and assessing where in the financing chain mobilization takes place.
The term “leverage” in climate finance is sometimes used to infer a leading or instrumental role played by one partner or funding stream in a particular climate investment project or program. It is often used to imply causality and attribution (Clapp et al, May 2012). The idea is that a particular agency or funding stream—for instance CIF funds, Global Environment Facility (GEF) grants, International Development Associa-tion (IDA) credits—has been instrumental in securing the financing for an entire project or program or has led to that project orprogram being fully
CTF Leverage text 6-5-14.indd 6 6/5/14 11:40 AM

A S S E S S I N G “ L E V E R A G E ” I N T H E C L I M AT E I N V E S T M E N T F U N D S 7
funded; that a particular source of public climate finance was a critical element in a project finance structure needed to get the project off the ground. The implication is that without these special funds the project/program would not have come about at all or would not have reached financial closure. The “special” climate funds are considered to play a catalytic role in mobilizing or “leveraging” other financing streams. According to the OECD, many financial institutions assume that their particular interventions have mobilized all other sources of the external capital in a program (Caruso et al., 2013).
In reality the question of “who is leveraging whom” is more complicated. “Determining whether a specific intervention has ‘mobilized’ climate finance is not an exact science” (Caruso, 2013). This is particularly true in the case of the CIF. CIF projects usually include co-financing from an array of public and private sources including MDBs, bilateral official agencies, international and national development banks, recipient government national and municipal budgets, and commercial and investment banks. The public sector CIF projects are often part of a multi-year government investment program or plan. The design of public sector CIF projects may have evolved through a process of interaction between funders, MDBs and recipients. Private sector CIF projects are initiated and organized by the private sector arm of the MDBs, in partnership with a financial intermedi-ary, a client company, or other private investors. The question of who was in the lead in proposing and securing a funding package is not a simple one, and varies from case to case.
As discussed above, the MDBs were selected as implementing partners for the CIF because of their well-established ability to draw in financing from a wide array of official and private co-financiers. Because of the important role of the MDBs, it would be incorrect to attribute a causal role in organizing a financing package exclusively to the CIF financing stream.
A related question concerns the role of policy interventions in mobilizing climate finance. These can range from the establishment of a legal frame-work for independent power producers to the provision of incentives such as feed-in-tariffs to developing a legal framework for foreign investment in renewable energy to eliminating price distortions between existing and clean technologies. Ideally a very limited amount of funding from donor country public budgets could lead to policy reforms or regulatory changes that spark large amounts of private investment in climate action (either
CTF Leverage text 6-5-14.indd 7 6/5/14 11:40 AM

8 A S S E S S I N G “ L E V E R A G E ” I N T H E C L I M AT E I N V E S T M E N T F U N D S
mitigation or adaptation).6 The approach needed to measure the mobili-zation of private finance in response to changes in public policies differs considerably from the measurement of private co-financing linked with public financing instruments. A methodological framework to understand the impact of CIF public funding on policy change in recipient countries has not yet been developed and therefore the role of CIF funding in policy leverage will not be discussed in this paper. Similarly the specific leverag-ing potential of different financial instruments (loan, grant, guarantee, insurance) will not be assessed in this paper.
6 It can also be the case that a regulatory reform that requires modest public funding, such as the introduction of a feed-in tariff, can lay the groundwork for ramping up private invest-ment but requires continued public funding to make the private projects commercially viable.
CTF Leverage text 6-5-14.indd 8 6/5/14 11:40 AM

Defining Leverage and Climate Finance in MDB Portfolios: Current Practice
Before looking at leverage in CIF projects we looked at the current practice in defining leverage in the MDBs. Many MDBs tracked and reported on leverage in their operations before they became involved
in climate finance and before the CIFs were created. They have recently also adopted a joint approach to reporting on climate finance.7 This section summarizes the current practice in MDBs in defining both climate finance and leverage.
Identifying Climate Finance in MDB Operations. In 2011 the MDBs pub-lished two joint reports that describe their agreed approach to reporting on mitigation and adaptation activities within their own portfolios. Climate finance is defined as “resources mobilized for a set of commonly agreed mitigation and adaptation activities.”8 Development activities can provide climate change co-benefits when they contribute to climate change adap-tation and/or mitigation, even when adaptation or mitigation is not their main objective(s). An activity provides direct adaptation co-benefits if it reduces the vulnerability of human or natural systems to the impacts of climate variability and change and related risks by maintaining or increas-ing adaptive capacity and resilience. It provides mitigation co-benefits if it reduces or avoids GHG emissions or enhances their sequestration and increases carbon stocks in reference to a no-project situation.
Following the adoption of the joint reports, a climate finance tracking system was rolled out in the World Bank in 2012 to report on the World Bank’s lending commitments aimed at low carbon and climate-resilient development. Similar efforts are underway in the other MDBs. The system covers projects financed by the World Bank as well as external resources including carbon finance, the CIF, and the GEF. The system tracks direct climate change co-benefits. For example, financing climate-resilient roads in an area impacted by chronic floods, which could increase in frequency/severity due to climate change, provides adaptation co-benefits. Building a road that gives people access to markets to sell their goods and helps to increase incomes, which in turn increases the adaptive capacity of the
7 AfDB et al., 2011.8 The reports are “Joint MDB Report on Mitigation Finance 2011” and “Joint MDB Report on Adaptation Finance 2011.” See AfDB et al., 2011.
CTF Leverage text 6-5-14.indd 9 6/5/14 11:40 AM

1 0 A S S E S S I N G “ L E V E R A G E ” I N T H E C L I M AT E I N V E S T M E N T F U N D S
beneficiaries, has indirect co-benefits, so would not get recorded as an adaptation activity. The World Bank system tracks co-benefits at the lowest level of financing information available, examining individual components of the project. For example, if only $10 million of a $100 million power project tackles energy efficiency, then only $10 million would be recorded as having mitigation co-benefits.
The other MDBs also measure climate finance. For example, IFC tracks the climate component (defined as renewable energy (RE), energy efficiency (EE), and other climate-related activity) of its financing separately from other components. The EBRD differentiates climate finance from other kinds of finance as illustrated in the following example, the Ukraine Renew-able Energy Lending Facility:
Climate finance:GEF €5mCTF €20mEBRD €44m
Total Climate Finance €69mNot climate finance: €44m from local sponsorsTotal facility: €113m
Total climate finance within facility: €69m
In this example, financing from specialized climate funds (GEF, CTF) and EBRD finance are identified as climate finance.
Since the process of classifying climate finance in MDB portfolios has just begun, data is not yet available to differentiate climate finance within CIF projects so this paper will not assess the extent to which CIF projects lever-age climate finance. This may be possible at a future date.
Definitions of Leverage in the MDBs.9 Most MDBs currently assess leverage in certain components of their portfolios. Different MDBs use leverage measures for different purposes and they differ in the extent to which they impute a causal role in raising co-financing to their own efforts. The ADB has an explicit goal to mobilize co-financing and it reports on the amount of co-financing (both loans and grants) which it has been instrumental in raising, implying a causal role for ADB financ-ing. The IDB reports on total co-financing and private sector loans
9 Definitions provided through private correspondence with MDB staff.
CTF Leverage text 6-5-14.indd 10 6/5/14 11:40 AM

A S S E S S I N G “ L E V E R A G E ” I N T H E C L I M AT E I N V E S T M E N T F U N D S 11
(“B-loans”) relative to IDB loans in its non-sovereign guaranteed (private sector arm) operations, without indicating a “causal” role for IDB. The EBRD measures concessional or grant funding relative to total program funding to have an indication of the impact of donor contributions. At IFC, leverage is referred to as “mobilization” and it is typically used to refer to the marshaling of resources from other investors alongside an IFC investment, usually through its syndicated lending program or “B loans”, implying a causal role by IFC in mobilizing resources. The World Bank (IBRD) recently introduced a flag and core indicator to measure “private capital mobilized” (IBRD, May 2013), without necessarily indi-cating a causal role.
The following section describes leverage/mobilization indicators in use at MDBs that participate in the CIF.
AfDB: With respect to climate change the AfDB considers co-financing and computes leverage in two ways:
• Co-financing from climate finance vis-à-vis AfDB’s own resources: the ratio of external climate finance (e.g. CIF) excluding project prepara-tion grants or technical assistance to AfDB financing from its statutory resources.
• Co-financing leveraged from private sector sources vis-à-vis AfDB’s own resources: the ratio of private sector financing to AfDB’s financing. To the extent that AfDB financing includes an element of climate finance it would be considered as part of AfDB’s financing.
ADB: In mobilizing co-financing, the ADB reports on what it calls “direct value-added co-financing” (DVA) as a measure of leverage in cases where its intervention is “instrumental,” or causal, in mobilizing the co-financing. ADB’s presence is considered to have been instrumental where there is a common terms agreement, common security arrangement, or a memo-randum of understanding or other framework co-financing agreement. The ADB measures the amount of co-financing from other public official partners (bilateral and multilateral development assistance agencies, public sector lending windows of export credit agencies for grants and loans, and grants for technical assistance) as well as from private sector “commercial” sources. The latter are mainly through credit enhancement improvements and risk sharing arrangements, where the concept of net DVA is applied. Net DVA includes DVA co-financing that does not use an allocation of ADB’s ordinary capital resources, and guidelines are provided for each modality which falls under this category.
CTF Leverage text 6-5-14.indd 11 6/5/14 11:40 AM

1 2 A S S E S S I N G “ L E V E R A G E ” I N T H E C L I M AT E I N V E S T M E N T F U N D S
The classification criteria for co-financing are: (1) Contractual co-financing which may be joint or parallel untied with full or partial administration by ADB; (2) Collaborative (non-contractual) co-financing which is parallel, tied or untied without administration by ADB; and (3) Discrete or non-direct value added which would apply when ADB joins non-project specific ini-tiatives led by others. In this case the financing provided by others is not considered co-financing.
EBRD: The EBRD differentiates between concessional climate finance and other concessional finance in its programs. The EBRD has a Sustainable Energy Initiative (SEI) which is the umbrella under which climate finance is mainstreamed in the EBRD. It has two targets: (i) the number of tons of carbon dioxide emissions reduced (through its projects) and (ii) maintaining financing under the Sustainable Energy Initiative at 25% or more of EBRD’s portfolio. In the context of donor co-financing, the EBRD measures the share of CIF funding as it relates to total climate finance as well as rela-tive to total project value (total climate-related investment by all parties contributing to a project, e.g. CIF, EBRD, or sponsor co-financing where this can be ascertained with reasonable certainty). The EBRD uses three measures of leverage, both for loans and for TA. There is no inference as to causality or an assessment as to which funding agency or stream was instrumental in organizing the combined total financing, and EBRD has in some operations under the CIFs combined CIF funding with other donor funding, e.g. from the GEF or the European Union. Project-related technical assistance (TA) is TA directly associated with a project, e.g. an energy audit or implementation support for a credit line. TA leverage is computed in three ways:
• TA leverage on EBRD SEI finance (EBRD’s share of the financing) is the ratio of EBRD SEI financing from TA supported projects divided by project-related TA value.
• TA leverage on (total) SEI project finance is the ratio of SEI project value derived from TA supported projects divided by project-related TA value.
• TA leverage on total project value: ratio of total project value from TA supported projects divided by project-related TA value.
Project-related grant or concessional finance is the amount of grant or concessional loan (e.g., CIF loan) directly associated with a project, e.g. as co-investment or an incentive payment. Concessional loan or grant leverage is also computed in three ways:
CTF Leverage text 6-5-14.indd 12 6/5/14 11:40 AM

A S S E S S I N G “ L E V E R A G E ” I N T H E C L I M AT E I N V E S T M E N T F U N D S 13
• Concessional loan or grant leverage on EBRD SEI finance is the ratio of EBRD SEI finance from projects with concessional loans or grants divided by project-related concessional loan or grant value.
• Concessional loan or grant leverage on SEI project finance is the ratio of SEI project value derived from projects that use concessional loans or grants divided by project-related concessional loan or grant value.
• Concessional loan or grant leverage on total project value: ratio of total project value from projects that use Concessional Finance/Grant divided by project-related Concessional Finance/Grant value.
IDB: The IDB considers leverage in its non-sovereign guaranteed (ie. pri-vate sector arm) operations. Leverage is assessed in two ways:
The first indicator is the “B loan mobilization ratio”, which refers to the amount of private debt resources (in the form of B loans) that are leveraged with IDB’s own capital (in the form of A-loans).
The second indicator is the “total mobilization ratio”, which includes all forms of debt (private through B-loans or co-financing, as well as public through co-financing; the latter of which includes official agency debt).
IFC: At IFC, mobilization is traditionally used to refer to the marshaling of resources from other investors alongside an IFC investment, typically through its syndicated lending program or “B loans”. Leverage is generally used to denote the ratio of total project cost (as represented by the financ-ing plan) to IFC’s portion of the financing.10 For donor-funded investments, IFC reports on leverage using two measures that assess the total amount of funding in a project relative to the donor’s share:
• Amount leveraged ($) is total funds invested in a project by all sources (including IFC, sponsor, other investors) LESS donor funds in the project
• Leverage ratio (#) is the total funds invested in a project by all sources (including IFC, sponsor, other investors) LESS Donor funds in the project, DIVIDED BY Donor funds in the project—the donor’s share of total financing.
World Bank. The World Bank (IBRD, IDA) does not have a definition of leverage, however it has recently introduced a “flag” in its reporting systems to indicate private capital directly mobilized by IBRD (imply-ing a causal role). It tracks the amount of private capital mobilized, so a
10 IFC, 2013.
CTF Leverage text 6-5-14.indd 13 6/5/14 11:40 AM
1 4 A S S E S S I N G “ L E V E R A G E ” I N T H E C L I M AT E I N V E S T M E N T F U N D S
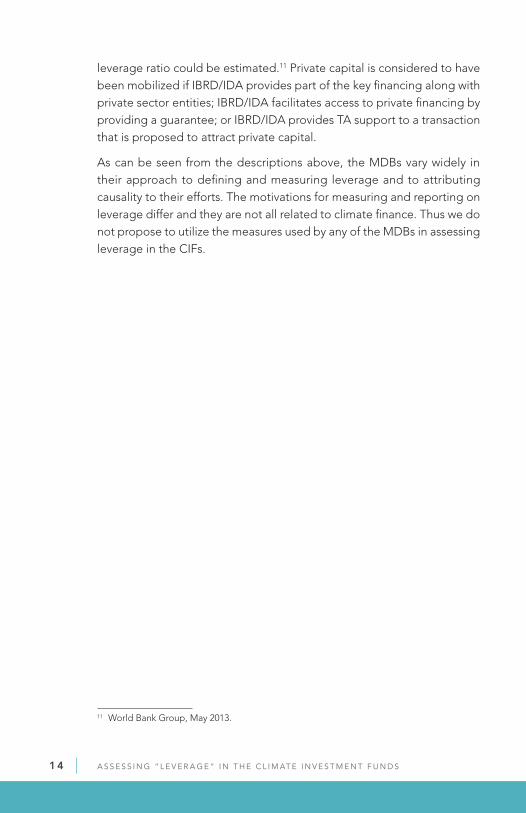
leverage ratio could be estimated.11 Private capital is considered to have been mobilized if IBRD/IDA provides part of the key financing along with private sector entities; IBRD/IDA facilitates access to private financing by providing a guarantee; or IBRD/IDA provides TA support to a transaction that is proposed to attract private capital.
As can be seen from the descriptions above, the MDBs vary widely in their approach to defining and measuring leverage and to attributing causality to their efforts. The motivations for measuring and reporting on leverage differ and they are not all related to climate finance. Thus we do not propose to utilize the measures used by any of the MDBs in assessing leverage in the CIFs.
11 World Bank Group, May 2013.
CTF Leverage text 6-5-14.indd 14 6/5/14 11:40 AM

Measuring Leverage in CIF Projects
Tracking Climate Finance. The purpose of the Clean Technology Fund (CTF) is “to provide scaled-up financing to contribute to demonstra-tion, deployment and transfer of low-carbon technologies with a
significant potential for long-term greenhouse gas emissions savings.” That of the Strategic Climate Fund (SCF) is “to provide financing to pilot new development approaches or scale-up activities aimed at a specific climate change challenge or sectoral response.” Given the goals of the CIF, it could be considered that all resources in a CIF project (CIF, MDB, official bilateral, international and domestic private and domestic public) are “resources mobilized for a set of commonly agreed mitigation and adaptation activi-ties” and thus could be considered climate finance.
As mentioned earlier, the MDBs have agreed on a joint methodology to track climate finance. However since implementation of this classification is in the early stages, data on climate vs. non-climate finance in CIF projects is not yet available. In future, if the MDBs were able to report to the CIF Administrative Unit on the breakdown of what is considered climate finance (e.g., the climate components mentioned in the EBRD renewable energy example) and non-climate finance in their CIF projects, it would be possible to construct a fourth measure to reflect the amount of climate finance mobi-lized in CIF projects. The indicator would be CIF funding as a percentage of total climate finance (total finance less non-climate finance) in CIF projects.
CIF funds have a motivating and signaling role. The presence of CIF funding signals a public commitment by the recipient government to low carbon or climate resilient strategies and programs. It raises public expectations about the scale of ambition and action that recipient countries will make.
As stated above, we do not attribute leverage or mobilization of co-financing in CIF projects to the mere presence of CIF funding. While in general the MDBs play an important role in coordinating the contributions of various co-financiers, other official or recipient government agencies may also be important or may have taken the lead. We do not try to define what the OECD calls the “point of estimation” (the moment or moments in the financing chain when mobilization takes place).
Leverage Indicators. We measure three indicators of leverage in CIF projects:
CTF Leverage text 6-5-14.indd 15 6/5/14 11:40 AM

1 6 A S S E S S I N G “ L E V E R A G E ” I N T H E C L I M AT E I N V E S T M E N T F U N D S
• Co-financing leverage: CIF funds/total CIF project cost. This is the simple ratio of CIF funding to total project funding (less CIF funding) and can be considered a measure of “total leverage” in CIF projects. The denominator would include all sources of finance reported by the implementing MDB (less CIF funds), including all official sources (other public sources, e.g. bilateral finance), private finance, recipient government and development bank finance, and MDB funding. The indicator helps measure how much total capital was raised as a result of successful implementation of the project supported by the CIFs. The measure provides information about the scale of CIF projects, which is relevant because achieving climate-related results on a large scale is an overall goal of the CIFs.
• Private finance leverage: CIF funds/Private sector finance. This measure reflects the relative contributions of public donor funds (CIF) and private finance in CIF projects. Private finance includes funding from all private sources. It does not include funding from MDB private sector arms, which is considered MDB finance, even though this fund-ing may be on commercially based market terms.
Private finance share: Private sector finance/total CIF project. This mea-sure represents the share of private finance (excluding MDB private sector finance as described above) as a share of total finance in CIF projects. In projects funded by the private sector arms of the MDBs the share of private finance is generally larger than in public sector projects, although private sector projects also may include financing from other official public sources. To illustrate the above indicators, consider a hypothetical project with a total project size of $100 million, including $15 million in CIF funding, $20 million in MDB funding, $15 million in official bilateral funding, and $50 million in private commercial funding. In this case, we would see the following ratios:
• Co-financing leverage ratio: 1 : 5.6
• Private finance leverage ratio: 1 : 3.3
• Private finance share: 50%
Issues with Measuring Leverage in CIF Projects
Data Quality. Financing data is reported to the CIF Administrative Unit when CIF funding for a project is submitted for approval by the Trust Fund Commit-tee or Sub-Committee and again when projects are submitted for approval
CTF Leverage text 6-5-14.indd 16 6/5/14 11:40 AM

A S S E S S I N G “ L E V E R A G E ” I N T H E C L I M AT E I N V E S T M E N T F U N D S 17
by MDB Executive Boards. Financing data is also reported for annual results monitoring and reporting and to the Trustee. In the case of the CTF, countries must report on the volume of direct finance leveraged at the level of the investment plan through CTF funding. Ideally the assessment of financing leveraged in CIF projects would take place after the project is completed, when actual financing flows could be verified. However, since the CIF is in the early stages of implementation it will not be practical to wait until project completion to carry out an independent verification of the actual financing. For the purpose of this exercise the assessment of leverage is based on the ex ante amount of expected financing of the CIF project as reported to the CIF Administrative Unit by MDBs. The MDB-approved project documents for public sector projects are publicly available on MDB websites. For private sector projects, details of the financing package are usually confidential and not publicly available but the financing plan is provided to the Trustee by the private sector arms of the MDBs. The financing plan outlined in the document approved by the MDB may undergo changes before final com-mitment (the time when private sector investment documents are signed) and during the course of project implementation.
We look at leverage in the CIF pipeline (planned projects and programs) and in projects that have already been approved by the MDBs. At the time CIF funds are approved by the relevant CIF committee the structure of the financing package may not be fully fleshed out. In public sector projects the financing contributions are fairly well established at the time the project is submitted to the MDB for approval, and there are few changes after MDB approval. In private sector operations, particularly financial intermediary operations, the various sources of co-financing may only be confirmed after financial closure, which is after MDB approval. Even at financial closure there is potential for variation of both the shares of individual contribu-tors and the total value of project finance. It is even more difficult to know at the time of MDB approval what leverage will be achieved in financial intermediation operations (through national commercial or development banks) and whether all or any of this is can be considered “climate finance.”
Scope. Other complications that affect the assessment of leverage in CIF projects include scope. There are two dimensions to this problem. One is defining the project boundary. Public sector CIF projects often take place as part of a broad public investment program. The data reported to the CIF Administrative Unit only reflects the MDB-financed project, not the broader investment program. If the latter were included the leverage ratios would
CTF Leverage text 6-5-14.indd 17 6/5/14 11:40 AM

1 8 A S S E S S I N G “ L E V E R A G E ” I N T H E C L I M AT E I N V E S T M E N T F U N D S
be higher. Whereas public sector CIF projects generally include all co-financiers, the IFC only reports (to the Trustee) on the “climate component” of a project with CIF funding; the project may also include non-climate financing. Questions arise as to whether domestic government (national and sub-national) financing or household equity contributions should be included. In this analysis we use the project boundary as defined in the project documents approved by the MDB.
The issue of scope is also complicated in the case of a financial interme-diary program, revolving fund, credit line or fund-of-funds instrument managed by the private sector MDB arms, where funds may be recycled or replenished. Again we would rely on the definition provided by MDB staff in the project/program document approved by the MDB. Reflows are not included.
Results
As of March 2014 a total of $3.4 billion in CIF financing was in projects and programs already approved by the MDB Boards, out of a total of $8 billion in total CIF funding (42% of total CIF funding). The remaining $4.6 billion is in CIF projects that are in the pre-MDB approval stage. We use the term “public sector” for projects managed by the public sector arms of the MDBs and “private sector” for projects and programs managed by the private sector arms of the MDBs.
Approved CIF projects and programs. The leverage indicators for approved CIF projects and programs are shown in the tables that are attached as annexes to this paper. These indicators are based on data for projects that have already been approved by MDB Boards or have reached the internal approval stage in the private sector arm of the MDB, and have been reported to the CIF Administrative Unit. It does not include forward looking projections from the project pipeline. For example the $50 million IFC Indonesia Geothermal Electricity Finance program has been approved and targets to support financing a total project cost of $2,270 million. How-ever most projects within this program have not yet reached the internal IFC approval stage; leverage calculations only reflect approved projects.
• The overall co-financing ratio for the total CIF program is 1 : 7.0; each dollar of CIF leveraged $7 in co-financing from both public and private sources.
CTF Leverage text 6-5-14.indd 18 6/5/14 11:40 AM

A S S E S S I N G “ L E V E R A G E ” I N T H E C L I M AT E I N V E S T M E N T F U N D S 19
• The overall private sector co-financing ratio is 1 : 1.6 of private finance; for the CIF as a whole, each dollar of CIF investment leveraged $1.60 in private finance. In the private sector projects and programs, private co-financing is 1 : 3.4 and in public sector projects it is 1 : 1.1.
The private sector share of total financing is 23.5%. This means that of all financial resources mobilized through CIF projects and programs, 23.5% of these were from the private sector.
Co-financing leverage. The highest leverage ratios are found in the two programs that mainly finance infrastructure—the SREP and the CTF. Based on a very small sample size of only four MDB-approved projects, co-financing leverage in the SREP is 1 : 11.8. The high level of leverage is due to the Kenya Menengai geothermal project in which $25 million in SREP funds leveraged $245 million in government finance, $124 million in AfDB loans and $109 million from bilateral sources. However the SREP program has an exceedingly small sample size, so the results cannot be considered to be representative of the CIF as a whole and it would be inappropriate to draw conclusions based on the portfolio at this time. The Menengai project is considered to be an outlier for the SREP portfolio.
The second largest co-financing leverage is in the CTF, where leverage was 1 : 7.9. In terms of total funding, the largest CIF program is the CTF, with a total of $2.6 billion in CIF funding committed to MDB-approved projects and programs. In the CTF the large shares of co-financing are from government, MDB own resources, private, bilateral and other co-financing. The small-est co-financing ratio is found in the PPCR; with 34 MDB-approved PPCR projects to date, the co-financing leverage ratio is 1 : 2.6. The co-financing leverage ratio in the FIP is 1 : 5.7.The extent of co-financing leverage is higher overall in projects managed by the private sector arms of the MDBs, at 1 : 8. Co-financing leverage is 1 : 6.6 for public sector CIF projects. The composition of co-financing is quite different between the public and private projects. In the public CIF projects the largest sources of co-financing are the MDBs themselves (35%) and government budgets (29%). Private co-financing is 20% and bilateral co-financing is 13% of the total. In the private sector CIF projects the largest co-financier is the private sector (48%) and “other” co-financing (25%). MDB co-financing in private sector arm projects accounts for 24%. Co-financing from government resources is nil and from official bilateral sources is very low (3%). In the CTF, private sector co-financing accounts for the largest share of the total (31%) followed by MDB co-finance (30%). In the FIP, with only two small private sector projects, the co-financing
CTF Leverage text 6-5-14.indd 19 6/5/14 11:40 AM

2 0 A S S E S S I N G “ L E V E R A G E ” I N T H E C L I M AT E I N V E S T M E N T F U N D S
is roughly equally split between government and MDB co-financing. In the PPCR, also with only two small private sector advisory services projects, private co-finance is lacking altogether; 74% of co-finance is from MDBs and the remainder is from government, official bilateral sources, and the Global Agriculture and Food Security Program.
Private finance leverage in MDB approved projects. The ratio of co-financing from private sources for the CIFs overall is 1 : 1.6. The total share of private finance in the CIF is 23.5%. There is no private co-finance in the SREP and PPCR and very little ($3.4 million) in the FIP.12 Thus most of the private sector co-financing is found in the CTF, where the private co-finance ratio is 1 : 2.1. Private co-finance accounts for 26.8% in CTF projects. In the public sector CIF projects, private co-finance is found in the CTF, where the private co-finance leverage ratio is 1 : 1.6. In the private sector CIF projects, the overall private sector co-finance leverage ratio is 1 : 3.4, and private co-finance accounts for 42% of total financing, almost exclusively in CTF projects.
Comparison of MDB Approved Projects with Pipeline. The tables attached at the end of the document provide data on expected co-financing in projects in the CIF pipeline (prior to MDB approval). These projects are in the early stages of project development and co-financing has not been finalized. However, they indicate that the projected co-financing in future CIF programs is largely consistent with co-financing in the already approved MDB projects and significant changes are not expected. In the current pipeline, the CTF and SREP are expected to draw the largest share of total co-finance and private sector co-finance, with modest co-financing in the FIP projects and almost no private co-financing in the PPCR projects. This is not surprising as mitigation projects generally attract more private finance than adaptation or forestry projects. Mitigation projects, such as those in the CTF and SREP, are more likely to involve creditworthy private sector borrowers and they are often larger in scale than adaptation projects. Forestry projects may be perceived by private financiers as higher risk than projects in other sectors due to governance concerns around land tenure and social issues with regard to indigenous peoples and other forest dwellers.
Interpreting the Results. This paper looked at the extent of co-financing and private financing leverage in the CIFs. As we mentioned in the first part
12 It should remember that these ratios are based on projects already approved by MDB Boards. Both the SREP and PPCR show private co-financing in projects that are still in the pipeline.
CTF Leverage text 6-5-14.indd 20 6/5/14 11:40 AM

A S S E S S I N G “ L E V E R A G E ” I N T H E C L I M AT E I N V E S T M E N T F U N D S 21
of this paper, the reason for examining leverage in the CIFs is to contribute to understanding how limited public budget resources can best be used for climate action in developing countries. But how does leverage in CIF projects compare to that of other MDB projects?
This early look at leverage in the CIFs finds that co-financing leverage ratios in CIF projects are consistent with the leverage results normally found in other MDB projects and programs. On the one hand this is not surprising since CIF projects are intermediated by the MDBs. On the other hand, because these are not “normal” MDB operations or fully commercially viable projects (hence the need for CIF funding), if CIF projects are leverag-ing about the same amount of finance as “normal” MDB projects this result can indicate a high level of accomplishment for the CIF-blended projects. The overall co-finance ratio of 1 : 7.7 in the CIF compares favorably with the overall co-finance ratio of the GEF (which also channels concessional public funds for climate action); leverage in the GEF was 1 : 6.6 on cumula-tive investments through 2012.13 The private co-financing ratios are also consistent with normal development finance institution experience despite the fact that some projects would not be commercially viable without CIF funding. The 2010 UN High Level Advisory Group on Climate Change Financing report noted that “Each dollar of [MDB] lending is estimated to generate three dollars of private capital investment.”14 This report also estimated that leverage in MDB non-concessional lending would on average be 1 : 2 – 1 : 5 and on concessional lending would be 1 : 1 – 1 : 1.5. A 2013 World Economic Forum report estimated leverage in carbon finance to be 1 : 3 – 1 : 4.5 (CER revenue : total capital investment).15 CIF performance is consistent with these estimates.
The lower levels of overall co-financing and private co-financing in the PPCR are not unusual since recipients are generally low income countries; as in the case of IDA, co-financing and private investment are limited by constraints on creditworthiness and limited institutional capacity. By comparison, whereas total leverage in the PPCR was 1 : 2.6, leverage in two similar GEF programs was higher.16 The GEF Least Developed Countries Fund (LDCF) was established in 2001 to support adaptation planning (National Adaptation Programs of Action) and implementation
13 http://unfccc.int/resource/docs/2012/cop18/eng/06.pdf14 http://www.un.org/wcm/webdav/site/climatechange/shared/Documents/AGF_reports/AGF%20Report.pdf15 http://reports.weforum.org/green-investing-2013/leveraging-private-investment/16 http://unfccc.int/resource/docs/2012/cop18/eng/06.pdf
CTF Leverage text 6-5-14.indd 21 6/5/14 11:40 AM

2 2 A S S E S S I N G “ L E V E R A G E ” I N T H E C L I M AT E I N V E S T M E N T F U N D S
in low-income countries and to complement multilateral and bilateral programs. The Special Climate Change Fund (SCCF-A) was set up to fund adaptation in all developing countries, again as a complement to bilateral and multilateral sources. The leverage in these two funds as of 2012 was 1 : 4.6 in the LDCF and 1 : 7.7 in the SSCF-A. This may be due in part to the explicit goal to complement bilateral and multilateral financing in the GEF funds. Whereas the average project size of PPCR, LDCF and SCCF projects is similar ($24 million, $25 million and $34 million each, respec-tively), the GEF projects explicitly targeted co-financing from bilateral and multilateral sources. In the PPCR funding from bilateral sources is only 7% of the total. The GEF programs have also been functioning for about eight years longer than the CIF.
Conclusion and Next Steps
CIF projects help to achieve low carbon and climate resilient actions in developing countries in a number of different ways. The provision of concessional funds may help to address climate externalities, reduce investment risk, or address informational or other externalities. This paper looked at leverage as one indicator of the effectiveness of achieving climate results. Early indications are that CIF funds have indeed played an important role in accelerating, scaling up, or influencing the design of climate-related investments in CIF countries. Part of the influence of CIF funding is in signaling the importance that recipient countries give to climate action and their commitment to low carbon and climate resilient investments. It should be remembered that leverage is only one indicator of effectiveness in CIF programs. It should not be considered the only or most important parameter in assessing the effectiveness of CIF funding. It should also be noted that the CIF program is relatively new, the sample size of projects is small and projects are in the early stages of implementation.
As was anticipated when the decision was made to implement the CIF through the MDBs, the MDBs can work effectively with partners to coor-dinate comprehensive climate projects and programs that can draw in finance from a range of both official and private funders.
The CIF were intended to adopt a programmatic approach to support cli-mate action in developing countries. CIF projects are deliberately embed-ded in broad country investment plans and programs. Once CIF programs
CTF Leverage text 6-5-14.indd 22 6/5/14 11:40 AM

A S S E S S I N G “ L E V E R A G E ” I N T H E C L I M AT E I N V E S T M E N T F U N D S 23
are fully implemented it may be interesting to collect data on the country investment plan supported by the CIF projects to try to assess leverage created at the level of the entire investment plan and to assess the syner-gies and benefits beyond the project level. It would be useful to reassess the leverage in CIF projects after another year or two of implementation to see whether the leverage results change, especially with respect to the levels of private financing.
The CIF may want to commission further analysis on “indirect” leverage to assess the extent to which CIF project designs and approaches are replicated or scaled up in future by CIF recipient countries and other countries or sub-national investment programs and whether the ideas and concepts introduced through CIF projects gain wider traction and spread to new areas. However, the difficulties in collecting the needed data for this analysis should be well understood. In addition to leverage, as proj-ect implementation moves ahead it may be possible to do an analysis of “attribution” to address the question of which actors and institutions play key roles in mobilizing resources.
CTF Leverage text 6-5-14.indd 23 6/5/14 11:40 AM

CTF Leverage text 6-5-14.indd 24 6/5/14 11:40 AM

Annexes
CTF Leverage text 6-5-14.indd 25 6/5/14 11:40 AM

2 6 A S S E S S I N G “ L E V E R A G E ” I N T H E C L I M AT E I N V E S T M E N T F U N D S
Annex I: Co-financing Leverage in CIF Projects and Programs Approved by MDB Boards
TABLE 1: CO-FINANCING FOR MDB APPROVED PROJECTS IN THE CIF PORTFOLIO
CIF Program
Total CIF Financing
Total Co-financing
Govern-ment Co-financing
Private Sector
Co- financing
MDB Co-financing
Bilateral Co-
financingOther Co-financing
CTF 2628.3 18103.3 3525.9 5551.9 5388.0 1893.4 1744.1
FIP 155.5 736.2 349.1 3.4 372.8 0.0 11.0
PPCR 564.8 882.4 111.8 0.0 652.8 100.4 17.4
SREP 44.2 478.3 245.3 0.0 124.1 108.7 0.2
CIF Total
3392.7 20200.2 4232.1 5555.3 6537.7 2102.5 1772.7
TABLE 2: CO-FINANCING FOR MDB APPROVED PUBLIC SECTOR PROJECTS AND PROGRAMS IN THE CIF PORTFOLIO
CIF Program
Total CIF Financing
Total Co-financing
Govern-ment Co-financing
Private Sector
Co-financing
MDB Co-financing
Bilateral Co-
financingOther Co-financing
CTF 1875.3 12704.6 3525.5 2962.5 4096.5 1733.2 386.9
FIP 149.2 727.9 348.6 0.0 369.0 0.0 10.4
PPCR 555.4 881.8 111.8 0.0 652.6 100.4 17.1
SREP 1.3 478.3 245.3 0.0 124.1 108.7 0.2
CIF Total
2621.1 14792.6 4231.1 2962.5 5242.2 1942.3 414.6
CTF Leverage text 6-5-14.indd 26 6/5/14 11:40 AM

A S S E S S I N G “ L E V E R A G E ” I N T H E C L I M AT E I N V E S T M E N T F U N D S 27
TABLE 3: CO-FINANCING FOR MDB APPROVED PRIVATE SECTOR PROJECTS AND PROGRAMS IN THE CIF PORTFOLIO
CIF Program
Total CIF Financing
Total Co-financing
Govern-ment Co-financing
Private Sector
Co-financing
MDB Co-financing
Bilateral Co-
financingOther Co-financing
CTF 753.0 5398.7 0.5 2589.4 1291.5 160.2 1357.2
FIP 6.3 8.3 0.5 3.4 3.8 0.0 0.7
PPCR 9.4 0.6 0.0 0.0 0.3 0.0 0.3
SREP 3.0 0.0 0.0 0.0 0.0 0.0 0.0
CIF Total
771.6 5407.6 1.0 2592.8 1295.5 160.2 1358.2
TABLE 4: LEVERAGE CO-EFFICIENTS FOR CIF PROGRAMSTABLE
CIF Program
Measure 1: # CIF Financing to # Total (CIF+Co-financing)
(#:#)
Measure 2: # CIF Financing to # Private Sector Co-financing
(#:#)
Measure 3: (Private Sector Financing /
Total CIF Financing) (%)
CTF 1 : 7.9 1 : 2.1 26.8%
FIP 1 : 5.7 1 : 0.0 0.4%
PPCR 1 : 2.6 1 : 0.0 0.0%
SREP 1 : 11.8 1 : 0.0 0.0%
CIF Total 1 : 7.0 1 : 1.6 23.5%
TABLE 5: LEVERAGE CO-EFFICIENTS FOR PUBLIC SECTOR CIF PROJECTS AND PROGRAMS
CIF Program
Measure 1: # CIF Financing to # Total (CIF+Co-financing)
(#:#)
Measure 2: # CIF Financing to # Private Sector Co-financing
(#:#)
Measure 3: (Private Sector Financing /
Total CIF Financing) (%)
CTF 1 : 7.8 1 : 1.6 20.3%
FIP 1 : 5.9 1 : 0.0 0.0%
PPCR 1 : 2.6 1 : 0.0 0.0%
SREP 1 : 12.6 1 : 0.0 0.0%
CIF Total 1 : 6.6 1 : 1.1 17.0%
CTF Leverage text 6-5-14.indd 27 6/5/14 11:40 AM

2 8 A S S E S S I N G “ L E V E R A G E ” I N T H E C L I M AT E I N V E S T M E N T F U N D S
TABLE 6: LEVERAGE CO-EFFICIENTS FOR PRIVATE SECTOR CIF PROJECTS AND PROGRAMS
CIF Program
Measure 1: # CIF Financing to # Total (CIF+Co-financing)
(#:#)
Measure 2: # CIF Financing to # Private Sector Co-financing
(#:#)
Measure 3: (Private Sector Financing /
Total CIF Financing) (%)
CTF 1 : 8.2 1 : 3.4 42.1%
FIP 1 : 2.3 1 : 0.5 23.3%
PPCR 1 : 1.1 1 : 0.0 0.0%
SREP 1 : 1.0 1 : 0.0 0.0%
CIF Total 1 : 8.0 1 : 3.4 42.0%
Notes: Figures are in USD million and are rounded to nearest hundred thousand.
Figures are based on co-financing information from MDB project documentation and reporting as of March 31, 2014.
CTF Leverage text 6-5-14.indd 28 6/5/14 11:40 AM

A S S E S S I N G “ L E V E R A G E ” I N T H E C L I M AT E I N V E S T M E N T F U N D S 29
Annex II: Co-financing Leverage in CIF Overall Pipeline
TABLE 7: CO-FINANCING FOR COMPLETE PIPELINE OF CIF PROJECTS
CIF Program
Total CIF Financing
Total Co-financing
Govern-ment Co-financing
Private Sector
Co- financing
MDB Co-financing
Bilateral Co-
financingOther Co-financing
CTF 5495.0 48004.3 4709.3 17740.0 11253.0 2438.4 11863.5
FIP 420.0 1059.1 377.2 69.4 447.7 10.6 154.3
PPCR 1005.1 1490.3 196.2 15.0 969.7 15.3 158.1
SREP 338.8 2380.2 435.7 322.3 681.5 123.0 817.7
CIF Total
7258.9 52933.9 5718.3 18146.7 13351.9 2723.2 12993.6
TABLE 8: CO-FINANCING FOR COMPLETE PIPELINE OF PUBLIC SECTOR CIF PROJECTS AND PROGRAMS
CIF Program
Total CIF Financing
Total Co-financing
Govern-ment Co-financing
Private Sector
Co-financing
MDB Co-financing
Bilateral Co-
financingOther Co-financing
CTF 3855.7 36004.1 4575.3 11825.0 8186.9 2135.2 9281.5
FIP 368.7 925.8 376.7 0.0 384.9 10.6 153.7
PPCR 933.6 1403.1 196.2 0.0 897.9 151.3 157.8
SREP 275.9 2208.5 427.1 289.3 581.5 123.0 787.6
CIF Total
5433.8 40541.5 5575.3 12114.4 10051.1 2420.0 10380.5
CTF Leverage text 6-5-14.indd 29 6/5/14 11:40 AM

3 0 A S S E S S I N G “ L E V E R A G E ” I N T H E C L I M AT E I N V E S T M E N T F U N D S
TABLE 9: CO-FINANCING FOR COMPLETE PIPELINE OF PRIVATE SECTOR CIF PROJECTS AND PROGRAMS
CIF Program
Total CIF Financing
Total Co-financing
Govern-ment Co-financing
Private Sector
Co-financing
MDB Co-financing
Bilateral Co-
financingOther Co-financing
CTF 1639.4 12000.2 134.0 5915.0 3066.1 303.2 2582.0
FIP 51.3 133.3 0.5 69.4 62.8 0.0 0.7
PPCR 75.1 87.2 0.0 15.0 71.9 0.0 0.3
SREP 63.0 171.7 8.6 3.0 100.0 0.0 30.2
CIF Total
1828.7 12392.4 143.0 6032.4 3300.7 303.2 2613.1
TABLE 10: LEVERAGE CO-EFFICIENTS OF CIF PROGRAMS
CIF Program
Measure 1: # CIF Financing to # Total (CIF+Co-financing)
(#:#)
Measure 2: # CIF Financing to # Private Sector Co-financing
(#:#)
Measure 3: (Private Sector Financing /
Total CIF Financing) (%)
CTF 1 : 9.7 1 : 3.2 33.2%
FIP 1 : 3.5 1 : 0.2 4.7%
PPCR 1 : 2.5 1 : 0.0 0.6%
SREP 1: 8.0 1 : 1.0 11.9%
CIF Total 1 : 8.3 1 : 2.5 30.1%
TABLE 11: LEVERAGE CO-EFFICIENTS FOR PUBLIC SECTOR CIF PROJECTS AND PROGRAMS
CIF Program
Measure 1: # CIF Financing to # Total (CIF+Co-financing)
(#:#)
Measure 2: # CIF Financing to # Private Sector Co-financing
(#:#)
Measure 3: (Private Sector Financing /
Total CIF Financing) (%)
CTF 1 : 10.3 1 : 3.1 29.7%
FIP 1 : 3.5 1 : 0.0 0.0%
PPCR 1 : 2.5 1 : 0.0 0.0%
SREP 1 : 9.0 1 : 1.0 11.6%
CIF Total 1 : 8.5 1 : 2.2 26.3%
CTF Leverage text 6-5-14.indd 30 6/5/14 11:40 AM

A S S E S S I N G “ L E V E R A G E ” I N T H E C L I M AT E I N V E S T M E N T F U N D S 31
TABLE 11: LEVERAGE CO-EFFICIENTS FOR PRIVATE SECTOR CIF PROJECTS AND PROGRAMSTABLE
CIF Program
Measure 1: # CIF Financing to # Total (CIF+Co-financing)
(#:#)
Measure 2: # CIF Financing to # Private Sector Co-financing
(#:#)
Measure 3: (Private Sector Financing /
Total CIF Financing) (%)
CTF 1 : 8.3 1 : 3.6 43.4%
FIP 1 : 3.6 1 : 1.4 37.6%
PPCR 1 : 2.2 1 : 0.2 9.2%
SREP 1 : 3.7 1 : 0.5 14.1%
CIF Total 1 : 7.8 1 : 3.3 42.4%
Notes: Figures are in USD million and are rounded to nearest hundred thousand.
Figures are based on co-financing information from MDB project documentation and reporting as of March 31, 2014.
CTF Leverage text 6-5-14.indd 31 6/5/14 11:40 AM

CTF Leverage text 6-5-14.indd 32 6/5/14 11:40 AM

References
AfDB, ADB, EBRD, EIB, IDB, WB, & IFC (2012, December). Joint MDB Report on Mitigation Finance 2011 and Joint MDB Report on Adapta-tion Finance 2011. Retrieved from http://climatechange.worldbank.org/sites/default/files/MMF_2011_version_21.pdf
Buchner, B., Falconer, A., Trabacchi, C., & Wilkinson, J. (2012, July). Public Climate Finance: A Survey of Systems to Monitor and Evaluate Climate Finance Effectiveness. Climate Policy Initiative. Retrieved from http://cli-matepolicyinitiative.org/wp-content/uploads/2012/07/Public-Climate-Finance-Survey.pdf
Brown, J. & Jacobs, M. (2011, April). Leveraging Private Investment: the Role of Public Sector Climate Finance. Overseas Development Institute. Retrieved from http://www.odi.org.uk/sites/odi.org.uk/files/odi-assets/publications-opinion-files/7082.pdf
Brown, J., Buchner, B., Wagner, G., & Sierra, K. (2011, December). Improving the Effectiveness of Climate Finance: A Survey of Leveraging Method-ologies. Retrieved from http://climatepolicyinitiative.org/wp-content/uploads/2011/11/Effectiveness-of-Climate-Finance-Methodology.pdf
Caruso, R. & Ellis, J. (2013, May). Comparing Definitions and Methods to Esti-mate Mobilised Climate Finance. OECD. Retrieved from http://www.oecd.org/env/cc/Comparing%20Definitions%20and%20Methods%20to%20Estimate%20Mobilised%20Climate%20Finance_Caruso%20&%20Ellis.pdf
Clapp, C. (2012, November). Climate Change Finance: If You Can’t Measure It, You Can’t Manage It. FNI Climate Policy Perspective 7. Fridtjof Nan-sen Institute. Retrieved from http://www.fni.no/doc&pdf/FNI-Climate-Policy-Perspectives-7.pdf
Clapp, C., Ellis, J., Benn, J., & Corfee-Morlot, J. (2012, May). Tracking Climate Finance: What and How?. OECD/IEA. Retrieved from http://www.oecd.org/env/cc/50293494.pdf
Climate Investment Funds (2011, October). Climate Investment Funds: Lessons Learned from Private Sector Interventions through MDB Intermediaries. Retrieved from https://www.climateinvestmentfunds.org/cif/sites/climateinvestmentfunds.org/files/Joint%20Inf%204%20Lessons%20Learned%20Private%20Sector.pdf
Climate Investment Funds (2012, April). Proposal for Additional Tools and Instruments to Enhance Private Sector Investments in the CIF. Retrieved
CTF Leverage text 6-5-14.indd 33 6/5/14 11:40 AM

3 4 A S S E S S I N G “ L E V E R A G E ” I N T H E C L I M AT E I N V E S T M E N T F U N D S
from http://www.climateinvestmentfunds.org/cif/sites/climateinvest-mentfunds.org/files/CTF_SCF_8_Proposal_for_Additional_Tools_and_instruments_for_private_sector.pdf
de Nevers, M. and Beppu, M. (2013, March). Private Funding in Public-led Programs of the CTF: Early Experience. Climate Investment Funds. Retrieved from https://www.climateinvestmentfunds.org/cif/sites/climateinvestmentfunds.org/files/Private_Funing_in_Public-led_Pro-grams_of_the_CTF_Early_Experience_0.pdf
Deutsche Bank Group (2011, April). De-Risking Clean Energy Business Models in a Developing Country Context. Retrieved from http://europa.eu/epc/pdf/workshop/background_get_fit_plus_final_040711_en.pdf
Ellis, J. & Regan, C. (2012, September). Climate Finance: Annotated Questions Document. Climate Change Expert Group (CCXG) Global Forum. Retrieved from http://www.oecd.org/env/cc/Discussion%20Document_Climate%20Finance.pdf
Ebinger, J. (2012, July). Mobilizing Climate Finance. Retrieved from http://unfccc.int/files/cooperation_support/financial_mechanism/long-term_finance/application/pdf/ebinger10july2012.pdf
Hallet, M. (2011, April). Leveraging Private Finance for Climate Actions in Developing Countries. Retrieved from http://europa.eu/epc/pdf/work-shop/1-4_jwg_workshop_dg_ecfin_2011-04-12_en.pdf IFC (2012, June).
Private Investment in Inclusive Green Growth and Climate-Related Activi-ties: Key Messages from the Literature and Bibliography. Retrieved from www.enterprise-development.org/download.ashx?id=2066
IFC. Scaling Up Climate Finance in the Private Sector – Leveraging Public Funding to Catalyze the Private Sector. Retrieved from http://europa.eu/epc/pdf/workshop/4-6_ajay_narayanan_presentation_-__brus-sels_april_12_2011_en.pdf
IFC. Climate-Related Investment at the International Finance Corporation: A review of 8 years of investment activity (2005–2012), Version 2.0, 2013 (fortcoming)
Neuhoff, K., Fankhauser, S., Guerin, E., Hourcade, J., Jackson, H., Rajan, R., & Ward, J. (2009, September). Structuring International Financial Support to Support Domestic Climate Change Mitigation in Develop-ing Countries. Climate Strategies. Retrieved from http://www.iddri.com/Publications/Publications-scientifiques-et-autres/isda_financial-support_september-2009-report.pdf
CTF Leverage text 6-5-14.indd 34 6/5/14 11:40 AM

A S S E S S I N G “ L E V E R A G E ” I N T H E C L I M AT E I N V E S T M E N T F U N D S 35
OECD (2011, October). “Fossil-Fuel Support” – OECD Secretariat Back-ground Report to Support the Report on “Mobilizing Climate Finance.” Retrieved from http://climatechange.worldbank.org/sites/default/files/Annex%203%20-%20Fossil-fuel%20support.pdf
Ockenden, S., Warrander, G., Eales, R., & Streatfeild, D. (2012, September). UK Working Paper: A project Level Approach to Forecast and Moni-tor Private Climate Finance Mobilised. OECD Climate Change Expert Group Global Forum.
Patel, Shilpa (2010, October). Climate Finance: Engaging the Private Sector. International Finance Corporation (IFC). Retrieved from http://www1.ifc.org/wps/wcm/connect/5d659a804b28afee9978f908d0338960/ClimateFinance_G20Report.pdf?MOD=AJPERES
Sitorus, S. & Sips, H. (2012, September). Climate Finance Summary Slides. Retrieved from http://www.oecd.org/env/cc/Climate%20finance%20summary%20slides%20-%20FOR%20WEB.pdf
UNFCCC http://unfccc.int/resource/docs/2012/cop18/eng/06.pdf
UN High-Level Advisory Group on Climate Change Financing Report (AGF, November 2010–1). Retrieved from: http://www.un.org/wcm/webdav/site/climatechange/shared/Documents/AGF_reports/AGF%20Report.pdf
UN High-Level Advisory Group on Climate Change Financing (AGF), Work Stream 7 Paper: Public Interventions to Stimulate Private Investment in Adaptation and Mitigation (AGF, November 2010–2). Retrieved from http://www.un.org/wcm/webdav/site/climatechange/shared/Documents/AGF_reports/Work_Stream_7%20_Public_Private.pdf
Venugopal, S. & Srivastava, A. (2012, August). Moving the Fulcrum: A Primer on Public Climate Financing Instruments Used to Leverage Private Capital. World Resources Institute. Retrieved from http://pdf.wri.org/moving_the_fulcrum.pdf
World Bank Group (May 2013). Implementing “Private Capital Mobilized” Flag and Core Indicator (forthcoming).
World Bank Group (2011, October – 1). The Scope for MDB Leverage and Innovation in Climate Finance. Retrieved from http://climat-echange.worldbank.org/sites/default/files/Annex%206%20-%20The%20Scope%20for%20MDB%20Leverage%20and%20Innovation%20in%20Climate%20Finance.pdf
CTF Leverage text 6-5-14.indd 35 6/5/14 11:40 AM

3 6 A S S E S S I N G “ L E V E R A G E ” I N T H E C L I M AT E I N V E S T M E N T F U N D S
World Bank Group (2011, October – 2). Mobilizing Climate Finance – A Paper Prepared at the Request of G20 Finance Ministers. Retrieved from http://www.imf.org/external/np/g20/pdf/110411c.pdf
World Economic Forum (2012). The Green Investment Report: Leverag-ing private investment. Retrieved from: http://reports.weforum.org/green-investing-2013/leveraging-private-investment/
CTF Leverage text 6-5-14.indd 36 6/5/14 11:40 AM

Assessing “Leverage” in the Climate Investment Funds
Cover photo: © Weerapat Kiatdumrong