
CIENA Corporation 920 Elkridge Landing Road Linthicum ... · 2 It is with great pleasure that I...
44
CIENA Corporation 920 Elkridge Landing Road Linthicum, Maryland 21090 410-865-8500 800-921-1144 ® 1562-AR-98
-
Upload
hoangkhanh -
Category
Documents
-
view
214 -
download
1
Transcript of CIENA Corporation 920 Elkridge Landing Road Linthicum ... · 2 It is with great pleasure that I...

CIENA Corporation
920 Elkridge Landing Road
Linthicum, Maryland 21090
410-865-8500
800-921-1144
®
1562-AR-98

W h at D o e s M e a n ?
1997 Annual Report
®

C I E N A

Customer Focus
Innovative Technology
Manufacturing Excellence
Commitment
Network Bandwidth
m e a n s

2
It is with great pleasure that I report on CIENA’s first year as a public company. While
we didn’t realize it at the time, our Initial Public Offering on February 7, 1997 set the
tone for the year at CIENA. Following that first day’s trading, CIENA achieved a market
capitalization of $3.4 billion – the largest first-day market capitalization of any venture-
funded startup company in history.
Like our IPO, our financial results for the year were exceptional. For our fiscal year end-
ing October 31, 1997, we recorded revenue of $373.8 million, an increase of $319 million
over the $54.8 million reported for fiscal year 1996. Net income for fiscal year 1997
was $112.9 million, or $1.09 per share. This compares to $14.7 million, or $0.15 per
share, in fiscal year 1996.
CIENA’s MultiWave® products, utilizing dense wavelength division multiplexing (DWDM)
technology, make it possible for service providers like Sprint Corporation and WorldCom,
Inc. to expand the capacity of their long-distance networks without the expensive and
time-consuming process of laying new fiber optic cable.
Why do service providers need more capacity in their networks? What is driving this
bandwidth demand? The answer is simple: the explosive growth of information exchange.
In the past, telecommunications networks handled voice traffic – the telephone calls from
office-to-office and from home-to-home. As a result, the networks grew fairly steadily
according to population growth. New applications such as facsimile transmission and cel-
lular service accelerated growth, but not so much that network operators could not plan
for anticipated demand.
In recent years, we’ve begun to see a dramatic departure from past network growth patterns.
Two things are causing this change. First, as predicted by Moore’s Law, the processing
power of personal computers (PCs) has continued to double every 12 to 18 months.
At the same time, PC prices have steadily declined. As a result, we have a growing num-
ber of PCs in our homes and offices, and these machines “talk” faster every year (that
is, the pace at which they are able to exchange information increases rapidly as internal
processing power grows). The second contributor to escalating traffic can be described
in a word: Internet.
The Internet has emerged as a broadly accepted medium that enables us to connect our
homes and businesses to the world. Even more, the Internet allows us to interact with the
world. No longer mere word processing and number crunching tools, PCs are fast becoming one
To Our Shareholders

3
of our primary communication devices. The resulting growth of data traffic – transmissions
from computers-to-computers – has been far more rapid than historical voice traffic
growth. As if this weren’t enough, the Internet also has opened the possibilities for new
applications, such as electronic commerce, that will only drive traffic growth faster.
Now service providers are faced with an entirely different challenge. Not only is network
traffic growing far more rapidly than historic growth patterns would suggest, but the traffic
fueling that growth is different, and it is stressing the networks built to carry telephone
traffic in different ways. PCs “talk” faster than humans. Computers also transmit infor-
mation in larger bursts. Faster traffic in greater bursts requires more network bandwidth.
That’s where CIENA comes in.
CIENA’s timely application of optical technology in products that enable service providers
to deploy additional bandwidth – without disrupting existing traffic flows – made it possible
for CIENA to enter and impact the telecommunications equipment market in a way usually
reserved for much larger and longer-established companies.
While our financial results this first year are notable, they don’t tell the whole story.
Underlying these results are hard-fought battles to develop robust supply chains, to build
scaleable manufacturing facilities, to maintain exceptional quality, and to form enduring
customer relationships.
One of the goals we set for ourselves in 1997 was broadening our customer base. Sales to
Sprint and WorldCom accounted for the significant majority of our revenues for the year.
However, we also were pleased to announce several new customers including Teleway
Japan Corporation, Japan Telecom Co., Ltd., Mercury Communications Limited (a sub-
sidiary of Cable & Wireless Communications Group) and Digital Teleport, Inc.
(in thousands, except net income per common share) 1997 1996
Revenue $373,827 $54,838
Gross profit $237,640 $32,994
Gross margin 63.6% 60.2%
Operating income $176,702 $16,387
Operating margin 47.3% 29.9%
Net income $112,945 $14,718
Net income per common share $ 1.09 $ 0.15
Total assets $447,228 $67,301
Total stockholders’ equity $363,584 $ 4,970
Financial Highlights
Patrick H. NettlesPresident and
Chief Executive Officer

4
A significant customer announcement came in June, 1997 when AT&T selected CIENA
as one of two DWDM suppliers for its network. Though product shipments to AT&T are
dependent upon successful completion of certain test requirements and are not likely to
occur until mid-1998, we believe AT&T’s selection of CIENA was another important val-
idation of the quality of our products, the robustness of our manufacturing processes and
systems, and our ability to execute.
Our product development efforts during the year reflect another important change in the
telecommunications equipment industry: shorter product development cycles. Since the
advent of the Internet, the telecommunications world has changed and continues to
change rapidly. As a supplier to customers in this swiftly moving industry, we too must
move quickly. In a single year, we’ve expanded our long-distance product line to include
the next generation of our original 16-channel MultiWave® 1600 system, MultiWave
Sentry™, designed to simplify service providers evolving networks, and the higher-capacity
40-channel MultiWave® 4000.
CIENA’s future growth will be driven by a combination of our core long-distance products
and new products – products that solve different problems for new customers. During the
year, we focused a portion of our engineering efforts on diversifying our product line,
developing products for short-distance DWDM applications.
In October 1997, we introduced MultiWave® Firefly, a 24-channel, point-to-point system
for interoffice applications, and announced the forthcoming MultiWave Metro™, a product
designed to enable carriers to meet the challenges of building network capacity in congested
and growing metropolitan areas. We expect these products to bring the economies and flex-
ibility of DWDM technology to a broader customer base, addressing the bandwidth con-
straints faced by regional Bell operating companies and competitive local exchange carriers.
In anticipation of additional customers and new products coming on-line, we also
invested in our manufacturing infrastructure during the year. Achieving ISO 9001 certi-
fication in July was a significant milestone, but not the end of our efforts by any means.
Our “building block” approach to manufacturing and assembly offers inherent scaleability
Price Range
Fiscal Year 1997 High Low
Period of February 7 to April 30, 1997 $44.00 $22.25
Third Quarter ended July 31, 1997 $57.25 $28.50
Fourth Quarter ended October 31, 1997 $63.62 $43.00
Common Stock Market Data

and flexibility that enables us to continuously refine and improve the process, growing
and changing as customer and product demands require. However, processes are nothing
without skilled people to implement them. As we grow, we also will continue to emphasize
the ongoing training and development of our workforce.
In all, CIENA had a busy year, filled with accomplishments, but what’s past is past. What
matters now is what we do going forward. We will look to differentiate ourselves through
continued technological innovation and a demonstrated top-quality, scaleable manufactur-
ing capability, as well as by maintaining the high level of service our customers have come
to expect. In executing this strategy, we will continue to invest in our growing organization,
its technology and resources.
As a fellow shareholder, I ask myself, “What makes CIENA different?” “What makes us
confident we can succeed?” Success is more than being in the right place at the right time;
it is having the forethought to ask, “Where should we be next?” It also is possessing the
desire and commitment to take you there. Vision without execution is meaningless. At
CIENA, we believe we have both: the vision that enables us to anticipate where our cus-
tomers will need us to be and the ability to execute to fulfill that vision.
In closing, I extend my thanks to CIENA’s employees. Their tireless enthusiasm and unfail-
ing dedication have made this company what it is today, and with them lies the promise of
what CIENA can be tomorrow. I believe I speak for them when I also thank our customers,
fellow shareholders, suppliers and partners for their support and continued confidence.
We look forward to 1998 and to the opportunities and challenges we will create.
Sincerely,
Patrick H. Nettles
President and Chief Executive Officer
Revenue
Net Income
Net Income per Common Share
Research and DevelopmentExpenditures
$150
$120
$100
$ 75
$ 50
$ 25
$ 0
in millions
in millions
in millions
$ 40
$ 30
$ 20
$ 10
$ 0
$ -10
$ .40
$ .30
$ .20
$ .10
$ 0
$-.10
$ 10
$ 8
$ 6
$ 4
$ 2
$ 0
1997Jan Apr Jul Oct
1996Jan Apr Jul Oct
1997Jan Apr Jul Oct
1996Jan Apr Jul Oct
1997Jan Apr Jul Oct
1996Jan Apr Jul Oct
1997Jan Apr Jul Oct
1996Jan Apr Jul Oct
in dollars

Bandwidth is a critical resource for long-distance carriers like
WorldCom. Greater bandwidth opens the door for new appli-
cations, and new applications mean revenue opportunities.
With the growth we’ve seen over the last few years, it seems
impossible to believe that there will ever be enough network
capacity. More and more people are using the Internet. Traffic
is no longer simple text messages; it contains high resolution
images, full-motion graphics and audio. New technologies make
access to the network faster and less expensive. Not so far in
the future, it is generally accepted that the Internet will carry
traditional services like fax and voice. Increased bandwidth will
open possibilities we can only dream of now.
Greater Possibilities
Larry MurphyDirector of Program Management
WorldCom Network Services

7
Today’s business is information driven. Behind what seems to be an
ever increasing demand for bandwidth are the applications and
services that provide information. As PC processing power and speed
escalate, traditional telecommunications carriers are challenged with
building the infrastructure required to carry this burgeoning flow
of information – the Internet. Once considered a technical curios-
ity, the Internet today is fueling the communications revolution,
changing the way we do business, get news, entertain ourselves.
Networks in Transition
While the bulk of a carrier’s traffic continues to be plain old telephone
service, the growth rate of data services outpaces voice by four to one.
At this rate, data traffic soon will eclipse voice traffic. As tradi-
tional capabilities, like fax and voice, migrate to the Internet, the
transition will accelerate.
This shift from voice-centric to data-centric traffic impacts
carriers fundamentally. Today’s networks were built to handle
voice traffic. Yet, the changeover in traffic mix is occurring at
an unprecedented rate. This shift has a profound impact on net-
work operators’ planning cycles, technology choices and capital
deployment decisions.
Networks continue to evolve to meet the changing demands of
the new information age. At the core of this evolution is a massive
increase in network bandwidth required to meet the new data-centric
service requirements. Bandwidth is being deployed at an astonishing
rate. Still, as bottlenecks are addressed in one portion of the network,
new bandwidth constraints appear elsewhere.
New Problems/New Solutions
Today, CIENA addresses the demand for bandwidth at the core of
the network. As bottlenecks are pushed out into the network,
CIENA will look to address those new bottlenecks with products
designed specifically to meet the requirements of the application. At
CIENA, we continually strive to deliver innovative solutions by
working with our customers to gain a better understanding of the
problems they face in building their networks. Today, the challenge
they face is deploying more bandwidth.
Network Bandwidth

When Sprint faced the enviable challenge of rapidly growing
voice and data traffic on its network, they looked to CIENA’s
DWDM products to help them meet that demand.
Sprint recognized early on its pending need for more network
bandwidth. Projections of Sprint’s increasing traffic growth meant
either costly fiber construction projects or worse, lost revenues.
Both were out of the question.
CIENA responded by delivering a solution, our MultiWave®
1600 DWDM system. We created a best-in-class product that
was a price/performance breakthrough. As a result of Sprint’s
collaboration and feedback throughout the MultiWave 1600’s
development cycle, CIENA was able to deliver a system to meet
Sprint’s requirements faster than even Sprint thought
possible. With CIENA’s bandwidth solutions, Sprint
continues to grow its business to meet the market
demands of its customers.
Collaborative Relationships
Neil GrenfellSprint, Vice President of Engineering
Doug McKinleySprint, Director of Network Engineering

9
Customer Focus
CIENA’s customers are not only in the communications business;
communications is their business. CIENA’s bandwidth solutions
enable our customers to profit in the highly competitive telecommu-
nications industry. Listening closely to our customers’ needs and
delivering products to meet those needs have been key factors
in CIENA’s success.
We Listen
We listen to our customers. It may sound simplistic, but our mission
is to provide solutions our customers need to meet the demanding
challenges they face. Only by developing a thorough understanding
of these challenges can we begin to design products that better
allow our customers to succeed. CIENA’s products have their genesis
in solving practical problems – not solely in the interesting applica-
tion of technology. As a result, our products are far more likely to
meet with early customer acceptance and commercial success.
We Anticipate
We also observe the direction both the industry and our customers’
businesses are heading. Watching the environment enables us to
anticipate what will be needed next.
The key to helping our customers maximize their opportunities
is being ready to deliver business solutions. By anticipating future
requirements, research and design efforts can be launched ahead of
market demand, resulting in solutions when customers need them.
We Deliver
Being customer focused means more than listening; it means
being responsive without being reactive, enabling our customers
to leverage the competitive advantage our products provide. It
means working in partnership with our customers to fine-tune
solutions and providing quality products and services that help
them achieve their business goals.

A key to CIENA’s success has been the Company’s ability to
bring to market products based on diverse innovative tech-
nologies, including erbium-doped fiber amplifiers and in-fiber
Bragg gratings. Leading edge technology is critical to our suc-
cess, as is top-notch optical systems engineering. But innovation
per se is not the goal. CIENA’s research and development
efforts focus on creating products to solve customer problems.
Our innovative systems combine a wide range of component
technologies, yielding the best mix of robust technical perfor-
mance, economic benefit and timeliness of market availability.
Only within the larger context of practical applications can inno-
vation make a difference. Novel technology by itself is not
sufficient. At CIENA, our engineers ask themselves
every day, “What am I able to do that adds value
for our customers?”
Making a Difference
CIENA’s in-fiber Bragggratings laboratory

11
Market analysts suggest that the Internet continues to grow at over
75% per year. More and more information is traversing the world
at ever increasing speeds. While Internet-based information sources
and Internet usage are skyrocketing, carriers’ networks struggle to
meet current demands. Bandwidth limitations are restricting the
development and deployment of services that will enable the Internet
to fulfill its potential for global information exchange and commerce.
The First Step
CIENA’s MultiWave® 1600 was introduced in 1996 to allow long-
distance carriers to expand the capacity of existing fiber optic cable
by 16-fold. Employing dense wavelength division multiplexing
(DWDM) technology, MultiWave 1600 sends up to 16 independent
information streams (channels), each on a different wavelength
or color of light, along a single fiber. With this technology, a single
strand of fiber can carry the amount of information that used to
require 16 separate fibers.
Rapid Product Cycle
In 1997, CIENA introduced MultiWave Sentry™, a second generation
16-channel system offering enhanced transmission, network man-
agement and performance monitoring features. With commercial
availability anticipated by mid-1998, CIENA’s MultiWave® 4000
system will further expand transport capacity up to 40 channels per
fiber, a total capacity of 100 gigabits per second.
New Customers/New Applications
Also during 1997, CIENA introduced a solution optimized for the
regional Bell operating companies and competitive local exchange
carriers. MultiWave® Firefly offers 24 channels (wavelengths) of
capacity at distances of up to 65 kilometers (32 miles). The price/
performance of this solution is ideally suited for the high-capacity,
short-distance needs of the local exchange carriers.
CIENA’s MultiWave Metro™ has the potential to change the way
service providers build their networks. Currently under develop-
ment, MultiWave Metro directly addresses the need for flexible
provisioning of bandwidth capacity in metropolitan areas. Using
DWDM ring technology, CIENA expects MultiWave Metro will
offer carriers a significant cost breakthrough in building broad-
band access networks.
Innovative Technology

ISO 9000 is a series of quality systems standards defined by
the International Standards Organization. ISO 9001 applies to
all facets of product design, manufacturing, installation, testing
and servicing. Increasingly, both domestic and international
corporations are relying on ISO 9001 standards to ensure
consistent high-quality products and services from their sup-
pliers. Understanding the importance of ISO 9001 certification
in the telecommunications market, particularly for large carriers,
in the latter part of 1996, CIENA launched efforts to adhere
to these standards.
CIENA proudly received its ISO 9001 certification in July,
1997, less than a year after beginning the registration process.
The certification assures quality conscious carriers
and potential customers that consistent practices
are in place and followed throughout CIENA’s
organization, enabling reliable delivery of high-
quality products and services.
ISO 9001 Certified

13
Manufacturing Excellence
The manufacturing and assembly of precision DWDM systems
demands extremely stringent processes. The unique requirements
of major carriers, volume production and CIENA’s commitment to
unfaltering product quality add to the complexity. Few manufac-
turing facilities in the world could meet this challenge. At CIENA, we
recognized the inherent difficulty of the task we’d undertaken from
the onset. The emphasis we place on achieving excellence in man-
ufacturing is reflected in our investment in processes, facilities,
new innovations, suppliers and, most importantly, our people.
Process
Building excellence into our manufacturing process begins at the
component level. Suppliers are required to measure and record
the performance of key components shipped to CIENA. During
system assembly, sub-systems undergo automated testing where
test data is measured against higher than industry acceptable
targets. Entire systems are optimized for performance from the
component level up. The result is higher yield, lower deviation,
improved performance and consistent quality.
People
Driving this process are CIENA’s highly trained production spe-
cialists. Each individual receives six weeks of training at CIENA’s
dedicated training facility where they achieve certification before
moving to the manufacturing floor. Supporting the specialist on
the production line are workstations with step-by-step graphic
work instructions and automated data collection. Continuous
training ensures a rigid adherence to quality standards and cross-
training enables flexibility.
Results
One of the keys to our continued success is our unwavering com-
mitment to manufacturing excellence. Customers who visit our
manufacturing facilities leave with a new standard by which they
measure other vendors. Consistent quality throughout the manu-
facturing process, combined with the personal commitment of each
member of the production team, makes a discernible difference...
the CIENA difference.

Things tend to move quickly at CIENA – the world of commu-
nications is changing faster than it ever has before. The days of
multi-year product development cycles are behind us. Today,
products are conceived, refined and brought to market in a
period of months instead of years. As a supplier to some of the
largest service providers in the world, it is not enough to
merely keep pace with the change – CIENA must anticipate it,
instigate it.
Early on, we recognized that in order to effect change in the
outside world, our organization needed the ability to handle
change as well. CIENA has grown rapidly, from 225 people at
the end of our fiscal year 1996, to more than 900 by the end
of December 1997. To accommodate our growth,
office and lab expansions are nearly routine. No
longer a small company, we’ve worked hard to
build scaleability – the ability to grow larger without
adversely affecting critical processes – into our
organization. And we are doing it all at the quicken-
ing pace of the industry – what we call “CIENATime.”
“CIENA Time”

15
Commitment
How is it possible that a new company like CIENA, in only a short
time, can change the landscape of an industry dominated by large,
established players? When we embarked on this endeavor, many
counseled us that the task was too difficult, the competitors too
strong. Since then, we believe we’ve proved the nay-sayers wrong.
Indeed, the task proved to be herculean and the competitors
remain formidable. Yet, despite conventional wisdom, we have
succeeded in establishing a major role for CIENA in the new era of
communications. In large measure, we believe this is the result of
our commitment to rapid product development cycles, manufacturing
excellence and long-term customer relationships.
Entrepreneurial Spirit
The commitment of CIENA’s workforce at both the individual
and collective level, reflects the organization’s core values. We
believe these shared values are the true embodiment of the entre-
preneurial spirit: taking ownership and responsibility for the
goals of the enterprise, and making those goals synonymous with
personal objectives. Long hours, late nights, difficult challenges
and tight schedules all somehow become more manageable in this
context. Behind each achievement, there is undoubtedly a host of
extraordinary individual contributions. The commitment and
dedication of CIENA’s employees is truly one of our most visible
and valuable assets.
As CIENA grows, we will strive to maintain our entrepreneurial
spirit and an environment that fosters personal growth, encourages
independent thinking coupled with cooperative problem solving,
and values those that question the status quo.
Commitment Shows
When customers, suppliers or investors visit CIENA, they often
comment on the sense of spirit and camaraderie that permeates
the environment. Whether it is in a development lab, on the manu-
facturing floor or at a customer installation site, commitment
shows – in everything we do.

16
Management Team
(left to right) Michael Kelly, Michael Fagen, Joseph Berthold, Stephen Alexander, Stephen Whitt, Guy Van Buskirk, Jesús León, Daniel McCurdy, Howard Lukens,Eric Georgatos, Steve Chaddick, Joseph Chinnici, Patrick Nettles, Andy Petrik, Rebecca Seidman, Gary Smith, Larry Huang, Mark Cummings
Stephen B. AlexanderVice President, Transport Products
Joseph BertholdVice President, Network Architecture
Steve W. ChaddickSenior Vice President, Products and Technologies
Joseph R. ChinniciSenior Vice President, Finance and Chief Financial Officer
Mark CummingsSenior Vice President, Operations
W. Michael FagenVice President, New Market Development
G. Eric Georgatos, Esq.Vice President, General Counsel and Secretary
Lawrence P. HuangSenior Vice President, Sales and Marketing
Michael Kelly Vice President, Quality Assurance
Jesús LeónVice President, Access Products
Howard LukensVice President, North American Sales
Daniel P. McCurdyVice President, Corporate Development
Patrick H. Nettles, Ph.D.President and Chief Executive Officer
Andrew C. PetrikVice President, Finance and Controller
Rebecca K. SeidmanVice President, Human Resources
Gary SmithVice President, International Sales
Guy R. Van BuskirkVice President, Customer Service
Stephen WhittVice President, Intellectual Property
17
Table of Contents
18 Selected Financial Data
19 Management’s Discussion and Analysis of
Financial Condition and Results of Operations
25 Consolidated Balance Sheets
26 Consolidated Statements of Operations
27 Consolidated Statements of Changes
in Stockholders’ Equity (Deficit)
28 Consolidated Statements of Cash Flows
29 Notes to Consolidated Financial Statement
39 Report of Independent Accountants
40 Executive Officers, Outside Board Members

18
CIENA CORPORATION
For the period from inception
(November 2, 1992) through October 31,(1) Year Ended October 31,(1)
1993 1994 1995 1996 1997
(in thousands except share and per share data)
Statement of OperationsData:Revenue $ — $ — $ — $54,838 $373,827Cost of goods sold — — — 21,844 136,187_______________________ ______________________________ ______________________________ ________________________________ ____________________________________
Gross Profit — — — 32,994 237,640Operating expenses
Research and development — 1,287 6,361 8,922 23,308Selling and marketing — 295 481 3,780 20,899General and administrative 123 787 896 3,905 16,731_______________________ ______________________________ ______________________________ ________________________________ ____________________________________
Total operating expenses 123 2,369 7,738 16,607 60,938_______________________ ______________________________ ______________________________ ________________________________ ____________________________________Income (loss) from operations (123) (2,369) (7,738) 16,387 176,702Other income (expense), net — (38) 109 581 7,256_______________________ ______________________________ ______________________________ ________________________________ ____________________________________Income (loss) before income taxes (123) (2,407) (7,629) 16,968 183,958Provision for income taxes — — — 2,250 71,013_______________________ ______________________________ ______________________________ ________________________________ ____________________________________Net income (loss) $(123) $(2,407) $(7,629) $14,718 $112,945_______________________ ______________________________ ______________________________ ________________________________ ___________________________________________________________ ______________________________ ______________________________ ________________________________ ____________________________________Pro forma net income per common and
common equivalent share(2) — — — $ 0.15 $ 1.09_______________________ ______________________________ ______________________________ ________________________________ ___________________________________________________________ ______________________________ ______________________________ ________________________________ ____________________________________
October 31,(1)
1993 1994 1995 1996 1997
(in thousands)
Balance Sheet Data:Cash and cash equivalents $ 10 $ 1,908 $ 5,032 $22,557 $263,085Working capital (35) 932 3,069 35,856 325,050Total assets 13 2,497 7,383 67,301 447,228Long-term obligations,
excluding current portion — 392 856 2,673 1,200Mandatorily redeemable preferred stock — 3,492 14,454 40,404 —Stockholders’ equity (deficit) (35) (2,388) (9,930) 4,970 363,584
(1) The Company has a 52 or 53 week fiscal year which ends on the Saturday nearest to the last day of October in each year. For purposes of financialstatement presentation, each fiscal year is described as having ended on October 31. Fiscal 1994, 1995, and 1997 comprised 52 weeks and fiscal1996 comprised 53 weeks.
(2) The pro forma weighted average common and common equivalent shares outstanding for year ended October 31, 1996 and 1997 was 99,111,000and 103,765,000, respectively. Net income per common and common equivalent share is computed using the pro forma weighted average numberof common and common equivalent shares outstanding. Pro forma weighted average common and common equivalent shares outstanding includeCommon Stock, stock options and warrants using the treasury stock method and the assumed conversion of all outstanding shares of ConvertiblePreferred Stock into Common Stock. See Note 1 of Notes to Consolidated Financial Statements.
Selected Financial Data

19
CIENA CORPORATION
The following discussion and analysis should be read in conjunction with the consolidated financial state-ments and related notes included elsewhere in this report. The information in the annual report contains certain forward-looking statements that involve risks and uncertainties. The Company’s actual results may differ materially from the results discussed in the forward-looking statements due to risk factors discussedbriefly in the “Risk Factors” section of this annual report and in detail in the Company’s Form 10-K andsubsequent Form 8-K, filed with the Securities and Exchange Commission (SEC) on December 10, 1997and December 29, 1997, respectively.
Overview
CIENA Corporation is a leading supplier of DWDM systems for fiberoptic communications networks. CIENA’sDWDM systems alleviate capacity constraints and enable flexible provisioning of additional bandwidth onhigh-traffic routes in carriers’ networks.
The Company completed its initial public offering of 5,750,000 shares, inclusive of 750,000 shares fromthe exercise of the underwriters’ over-allotment option, at a price of $23 per share on February 12, 1997. Netproceeds from the initial public offering were approximately $121.8 million with an additional $0.6 millionreceived from the exercise of certain outstanding warrants. On July 8, 1997 the Company completed a publicoffering of 10,477,216 shares of which 1,252,060 shares were sold by the Company, inclusive of 252,060 sharesfrom the exercise of the underwriters’ over-allotment option, at a price of $44 per share. Net proceeds to theCompany from the July public offering were approximately $52.2 million. The Company has added the netproceeds from the public offerings and from the exercise of the warrants to working capital. Pending use of thenet proceeds, the Company has invested such funds in short-term, interest bearing investment grade obligations.
The Company recognizes product revenue in accordance with the shipping terms specified. For transactionswhere the Company has yet to obtain customer acceptance, revenue is deferred until the terms of acceptanceare satisfied. Revenue for installation services is recognized as the services are performed unless the terms ofthe supply contract combine product acceptance with installation, in which case revenues for installation servicesare recognized when the terms of acceptance are satisfied and installation is completed. Amounts received inexcess of revenue recognized are recorded as deferred revenue. For distributor sales where risks of ownershiphave not transferred, the Company recognizes revenue when the product is shipped through to the end user.
All of the Company’s revenue of $54.8 million through October 31, 1996 was derived from MultiWave1600 system sales to Sprint. Revenue for the fiscal year ended October 31, 1997 was $373.8 million and con-sisted primarily of MultiWave 1600 systems sales to Sprint, WorldCom, DTI, and through the Company’sJapanese distributor Nissho, to Teleway. The DTI installation represented the Company’s first deployment of the MultiWave 1600 as part of a newly built long distance fiberoptic route.
In June 1997, the Company signed an agreement to supply MultiWave 1600 systems to Mercury, a U.K.based subsidiary of Cable and Wireless Communications Group. The agreement calls for delivery and installa-tion beginning in August 1997 and continuing through December 1997. The Company also entered into anagreement with BICC Cables, plc, to assist the Company in the delivery of service and support to Mercury inconnection with this installation and operation. Revenue recognition for the entirety of the Mercury shipmentshas been deferred until completion of field testing.
In June 1997, the Company announced a next generation version of the MultiWave 1600 system, the Multi-Wave Sentry, which includes enhancements that significantly expand the ability of the MultiWave system to inter-face with data communications equipment in addition to other types of transmission equipment and increasethe distance which can be spanned between transmission terminals. The Company also announced a trial evaluationagreement with AT&T, which calls for the Company to supply six 16-channel MultiWave Sentry systems for labo-ratory interoperability testing. In August 1997, the Company reached agreement on a five-year supply contractwith AT&T. The supply agreement does not obligate AT&T to make any minimum purchases from the Company.
Management’s Discussion and Analysis of Financial Condition and Results of Operations

20
CIENA CORPORATION
In September 1997, the Company signed an agreement through Nissho to supply MultiWave Sentry to JapanTelecom. The agreement calls for delivery and installation over several months beginning in October 1997. Revenuerecognition for the Japan Telecom shipments has been deferred until completion of field testing and product acceptance.
The Company is engaged in continuing efforts to expand its manufacturing capabilities. In April 1997 theCompany moved its non-manufacturing operating functions to an approximately 96,000 square foot facility nearthe Baltimore/Washington International Airport in Linthicum, Maryland. During the third quarter ended July 1997,the Company completed the process of renovating the vacated areas of the 50,500 square foot facility in Savage,Maryland for manufacturing capabilities. In March 1997, the Company signed a lease for an additional facilityof approximately 57,000 square feet located in Linthicum to be used for manufacturing and support functions.
In September 1997 the Company leased an additional non-manufacturing facility of approximately68,000 square feet in the Linthicum area, which it will use to transfer its principal executive offices in the secondand third quarter of fiscal 1998. The Company’s current 96,000 square foot facility would then be convertedalmost entirely to research and product development functions. The Company added leased non-manufacturingfacilities during the fourth quarter of fiscal 1997 in Atlanta, Georgia and in Middletown, New Jersey. Thesefacilities will be used for product development, customer support and other selling and marketing activities.The Company also expects to lease additional manufacturing facilities in the Linthicum area of approximately50,000 to 100,000 square feet during fiscal 1998.
As of October 31, 1997 the Company and its subsidiaries employed 841 persons, which was an increase of 616 persons over the 225 employed on October 31, 1996.
Results of Operations
Fiscal Years Ended 1995, 1996 and 1997
Revenue. During the fiscal year ended October 31, 1995 the Company was in the development stage and gener-ated no revenue. The Company recognized $373.8 million and $54.8 million in MultiWave 1600 system revenuefor the years ended October 31, 1997 and 1996, respectively. Revenue from installation services was $0.3 millionfor fiscal 1997 compared to no installation service revenue in fiscal 1996. The Company began shipping the Multi-Wave 1600 system for field testing in May 1996 with customer acceptance by Sprint occurring in July 1996.The MultiWave 1600 system began carrying live traffic in the Sprint network in October 1996. Initial field trials,customer acceptance, and the carrying of live traffic each occurred during fiscal 1997 in the WorldCom, Teleway,and DTI networks.
Sprint and WorldCom accounted for $179.4 million (48.0%) and $184.5 million (49.4%), respectively ofthe Company’s revenue during fiscal 1997. Revenue derived from foreign sales accounted for less than 2% ofthe Company’s revenues during fiscal 1997. The Company expects fiscal 1998 revenue from both Sprint andWorldCom to account for a lower percentage of the Company’s total fiscal 1998 revenue and also expects anincrease over the fiscal 1997 in the percentage of 1998 revenue derived from foreign sales.
The Company expects a decrease in the amount of revenues from MultiWave 1600 systems in fiscal 1998as compared to fiscal 1997. The Company expects this decline in MultiWave 1600 revenue will be offset by theinitial product acceptance and revenue recognition from system sales of MultiWave Sentry, MultiWave FireFly,MultiWave 4000 and additional installation services but given the recent introduction of these products, therecan be no assurance that this will be the case. See “Risk Factors.”
Gross Profit. Cost of goods sold consists of component costs, direct compensation costs, warranty andother contractual obligations, royalties, license fees, and overhead related to the Company’s manufacturing andinstallation operations. Gross profit was $237.6 million and $33.0 million for fiscal years 1997 and 1996,respectively, with no comparable gross profit for fiscal 1995. Gross margin was 63.6% and 60.2% for fiscal1997 and 1996, respectively. The increase in gross margin was affected by fixed overhead costs being allocatedover a larger revenue base, an improvement in manufacturing efficiencies, and reductions in component costs.

21
CIENA CORPORATION
The Company’s gross margins in the future may be under pressure by a number of factors, including com-petitive market pricing, manufacturing volumes and efficiencies and fluctuations in component costs. See “RiskFactors.” During fiscal 1998 the Company expects that future gross margins may be affected by the mix ofproduct features and configurations sold in a period as well as the extent of installation services provided.
Research and Development Expenses. Research and development expenses were $23.3 million, $8.9 mil-lion, and $6.4 million for fiscal 1997, 1996, and 1995, respectively. The approximate $14.4 million or 161%increase from fiscal 1996 to 1997 and the approximate $2.6, million or 40% increase from fiscal 1995 to fiscal1996 in research and development expenses related to increased staffing levels, purchases of materials used indevelopment of new or enhanced product prototypes, and outside consulting services in support of certain develop-ments and design efforts. During fiscal 1997 and 1996 , research and development expenses were 6.2% and 16.3%of revenue, respectively. The Company expects that its research and development expenditures will continue toincrease in absolute dollars and perhaps as a percentage of revenue during fiscal 1998 to support the continueddevelopment of the various DWDM products, the exploration of new or complementary technologies, and the pur-suit of various cost reduction strategies. The Company has expensed research and development costs as incurred.
Selling and Marketing Expenses. Selling and marketing expenses were $20.9 million, $3.8 million, and$0.5 million for fiscal 1997, 1996, and 1995, respectively. The approximate $17.1 million or 453% increasefrom fiscal 1996 to 1997 and the approximate $3.3 million or 686% increase from fiscal 1995 to fiscal 1996 inselling and marketing expenses was primarily the result of increased staffing levels in the areas of sales, technicalassistance and field support, and increases in commissions earned, trade show participation and promotionalcosts. During fiscal 1997 and 1996, selling and marketing expenses were 5.6% and 6.9% of revenue, respec-tively. The Company anticipates that its selling and marketing expenses will increase in absolute dollars andperhaps as a percentage of revenue during fiscal 1998 as additional personnel are hired and additional officesare opened to allow the Company to pursue new market opportunities. The Company also expects the portionof selling and marketing expenses attributable to technical assistance and field support will increase as theCompany’s installed base of operational MultiWave systems increases.
General and Administrative Expenses. General and administrative expenses were $16.7 million, $3.9 mil-lion, and $0.9 million for fiscal 1997, 1996, and 1995, respectively. The approximate $12.8 million or 328%increase from fiscal 1996 to 1997 in general and administrative expenses was primarily the result of a $7.5 mil-lion charge for actual and estimated legal and related costs associated with ongoing and pending litigation. SeeItem 3. “Legal Proceedings.” The remaining $5.3 million increase was primarily the result of increased staffinglevels and outside consulting services. The approximate $3.0 million or 336% increase from fiscal 1995 to 1996in general and administrative expenses was also the result of increased staffing levels and outside consultingservices. During fiscal 1997 and 1996, general and administrative expenses were 4.5% and 7.1% of revenue,respectively. The Company believes that its general and administrative expenses will increase in absolute dollarsand perhaps as a percentage of revenue during fiscal 1998 as a result of the expansion of the Company’s admini-strative staff required to support its expanding operations and legal expenses associated with pending litigation.
Operating Profit. During fiscal 1995 the Company was in the development stage and generated no reve-nue and had a loss from operations of $7.7 million. The Company’s operating profit for fiscal 1997 and 1996was $176.7 million or 47.3% of revenue and $16.4 million or 29.9% of revenue, respectively. The Companyexpects that its operating profit will decrease as a percentage of revenue as it continues to hire additional per-sonnel and increase operating expenses to support its business.
Other Income (Expense), Net. Other income (expense), net, consists of interest income earned on theCompany’s cash and cash equivalents, net of interest expense associated with the Company’s debt obligations.Other income (expense), net, was $7.3 million, $0.6 million, and $0.1 million for fiscal 1997, 1996, and 1995,respectively. The year to year increase in other income (expense), net, was primarily the result of the invest-ment of the net proceeds of the Company’s stock offerings.
22
CIENA CORPORATION
Provision (Benefit) For Income Taxes. During fiscal 1995, a valuation allowance had been recorded tooffset the Company’s net deferred tax assets, including possible future benefit from realization of tax operatingloss carryforwards. The recording of such valuation allowance was based upon management’s determinationthat realization of the net deferred tax assets was not “more likely than not” ( as defined in Statement ofFinancial Accounting Standards No. 109, “Accounting for Income Taxes”). During fiscal 1996, the Companyreceived product acceptance from its initial customer and started profitable operations, at which time theCompany fully reversed its previously established deferred tax valuation allowance. The provision for incometaxes for fiscal 1996 of $2.3 million is net of an approximate tax benefit of $4.6 million related to the reversalof the deferred tax valuation allowance. See Note 7 of Notes to Consolidated Financial Statements. The Company’sprovision for income taxes was 38.6% of pre-tax earnings, or $71.0 million for fiscal 1997.
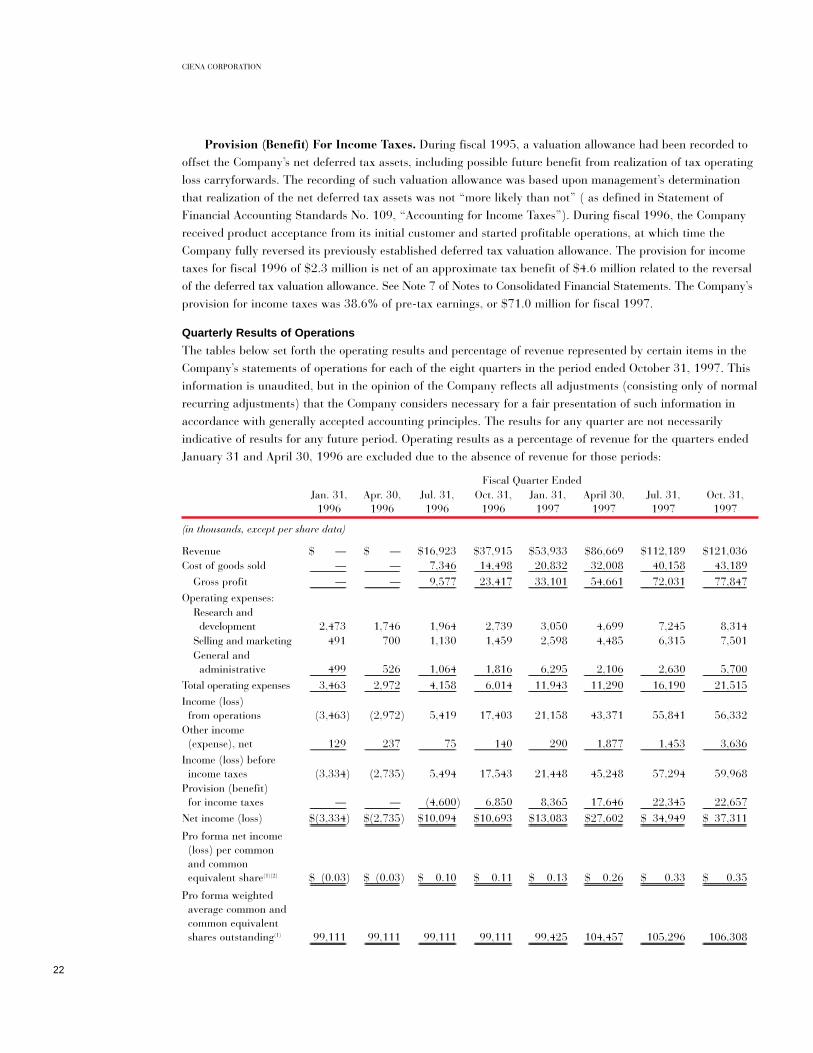
Quarterly Results of Operations
The tables below set forth the operating results and percentage of revenue represented by certain items in theCompany’s statements of operations for each of the eight quarters in the period ended October 31, 1997. Thisinformation is unaudited, but in the opinion of the Company reflects all adjustments (consisting only of normalrecurring adjustments) that the Company considers necessary for a fair presentation of such information inaccordance with generally accepted accounting principles. The results for any quarter are not necessarilyindicative of results for any future period. Operating results as a percentage of revenue for the quarters endedJanuary 31 and April 30, 1996 are excluded due to the absence of revenue for those periods:
Fiscal Quarter EndedJan. 31, Apr. 30, Jul. 31, Oct. 31, Jan. 31, April 30, Jul. 31, Oct. 31,
1996 1996 1996 1996 1997 1997 1997 1997
(in thousands, except per share data)
Revenue $ — $ — $16,923 $37,915 $53,933 $86,669 $112,189 $121,036Cost of goods sold — — 7,346 14,498 20,832 32,008 40,158 43,189____________________________ ___________________________ _____________________________ _____________________________ ______________________________ ______________________________ __________________________________ __________________________________
Gross profit — — 9,577 23,417 33,101 54,661 72,031 77,847____________________________ ___________________________ _____________________________ _____________________________ ______________________________ ______________________________ __________________________________ __________________________________Operating expenses:
Research and development 2,473 1,746 1,964 2,739 3,050 4,699 7,245 8,314
Selling and marketing 491 700 1,130 1,459 2,598 4,485 6,315 7,501General and
administrative 499 526 1,064 1,816 6,295 2,106 2,630 5,700____________________________ ___________________________ _____________________________ _____________________________ ______________________________ ______________________________ __________________________________ __________________________________Total operating expenses 3,463 2,972 4,158 6,014 11,943 11,290 16,190 21,515____________________________ ___________________________ _____________________________ _____________________________ ______________________________ ______________________________ __________________________________ __________________________________Income (loss)
from operations (3,463) (2,972) 5,419 17,403 21,158 43,371 55,841 56,332Other income
(expense), net 129 237 75 140 290 1,877 1,453 3,636____________________________ ___________________________ _____________________________ _____________________________ ______________________________ ______________________________ __________________________________ __________________________________Income (loss) before
income taxes (3,334) (2,735) 5,494 17,543 21,448 45,248 57,294 59,968Provision (benefit)
for income taxes — — (4,600) 6,850 8,365 17,646 22,345 22,657____________________________ ___________________________ _____________________________ _____________________________ ______________________________ ______________________________ __________________________________ __________________________________Net income (loss) $(3,334) $(2,735) $10,094 $10,693 $13,083 $27,602 $ 34,949 $ 37,311____________________________ ___________________________ _____________________________ _____________________________ ______________________________ ______________________________ __________________________________ ______________________________________________________________ ___________________________ _____________________________ _____________________________ ______________________________ ______________________________ __________________________________ __________________________________Pro forma net income
(loss) per common and common equivalent share(1)(2) $ (0.03) $ (0.03) $ 0.10 $ 0.11 $ 0.13 $ 0.26 $ 0.33 $ 0.35____________________________ ___________________________ _____________________________ _____________________________ ______________________________ ______________________________ __________________________________ ______________________________________________________________ ___________________________ _____________________________ _____________________________ ______________________________ ______________________________ __________________________________ __________________________________
Pro forma weighted average common and common equivalent shares outstanding(1) 99,111 99,111 99,111 99,111 99,425 104,457 105,296 106,308____________________________ ___________________________ _____________________________ _____________________________ ______________________________ ______________________________ __________________________________ ______________________________________________________________ ___________________________ _____________________________ _____________________________ ______________________________ ______________________________ __________________________________ __________________________________

23
CIENA CORPORATION
Fiscal Quarter EndedJan. 31, Apr. 30, Jul. 31, Oct. 31, Jan. 31, April 30, Jul. 31, Oct. 31,1996 1996 1996 1996 1997 1997 1997 1997
(as a percentage of revenue)
Revenue — — 100.0% 100.0% 100.0% 100.0% 100.0% 100.0%Cost of goods sold — — 43.4 38.2 38.6 36.9 35.8 35.7_______________ _______________ ____________________ ____________________ ____________________ ____________________ ___________________ ___________________
Gross profit — — 56.6 61.8 61.4 63.1 64.2 64.3Operating expenses:
Research and development — — 11.6 7.2 5.7 5.5 6.5 6.9Selling and marketing — — 6.7 3.8 4.8 5.2 5.6 6.2General and administrative — — 6.3 4.8 11.7 2.4 2.3 4.7_______________ _______________ ____________________ ____________________ ____________________ ____________________ ___________________ ___________________
Total operating expenses — — 24.6 15.8 22.2 13.1 14.4 17.8_______________ _______________ ____________________ ____________________ ____________________ ____________________ ___________________ ___________________Income (loss) from operations — — 32.0 46.0 39.2 50.0 49.8 46.5Other income (expense), net — — 0.4 0.3 0.6 2.2 1.3 3.0_______________ _______________ ____________________ ____________________ ____________________ ____________________ ___________________ ___________________Income (loss) before
income taxes — — 32.4 46.3 39.8 52.2 51.1 49.5Provision (benefit) for
income taxes — — (27.2) 18.1 15.5 20.3 19.9 18.7_______________ _______________ ____________________ ____________________ ____________________ ____________________ ___________________ ___________________Net income (loss) — — 59.6% 28.2% 24.3% 31.9% 31.2% 30.8%_______________ _______________ ____________________ ____________________ ____________________ ____________________ ___________________ __________________________________ _______________ ____________________ ____________________ ____________________ ____________________ ___________________ ___________________
(1) The pro forma net income (loss) per common and common equivalent share are presented on a pro forma basis for all periods stated, except forthe quarters ended July 31, 1997 and October 31, 1997, which is presented on a historical basis. Pro forma weighted average common and com-mon equivalent shares outstanding include Common Stock, stock options and warrants using the treasury stock method and the assumed conver-sion of all outstanding shares of Convertible Preferred Stock into Common Stock. See Note 1 of Notes to Consolidated Financial Statements.
(2) The sum of the quarterly earnings per share for fiscal 1997 does not equal the reported annual earnings per share for fiscal 1997 due to the effectof the Company’s stock issuances during the year.
The Company’s quarterly operating results have varied and are expected to vary significantly in the future.These fluctuations may be caused by many factors, including, among others, the size and timing of customerorders and the related field testing and product acceptance cycle times; increases in manufacturing and operat-ing expenses in anticipation of expected customer demand; effective transition and market acceptance of newand multiple product lines; competitive pricing pressures; mix of products and services sold; intellectual prop-erty litigation; and general economic conditions. As a result of the foregoing and other factors, the Companybelieves that period-to-period comparisons of its results of operations are not necessarily meaningful andshould not be relied upon as indications of future performance.
The Company’s revenue increased significantly on a quarter-to-quarter basis since the Company’s initialcustomer acceptance during the quarter ended July 31, 1996 to the quarter ended July 31, 1997. The fourthquarter ended October 31, 1997 posted an increase in revenue as compared to the third quarter ended July 31,1997 with moderating sequential growth in percentage terms as compared to the previous quarters. The mod-erating revenue growth in the fourth quarter of fiscal 1997 was attributable to a year-end wind-down of theannual capital equipment procurement cycle of one of the two primary customers of the Company.
The Company currently expects revenue for the first quarter of fiscal 1998 to show sequential growth,with the rate to be comparable or perhaps modestly above that experienced between the third and fourth quar-ters of fiscal 1997. However, due to the evolving nature of the markets for the Company’s products and otherfactors, there can be no assurance that the Company’s revenues will increase on a quarter-to-quarter basis or atall in future periods.
Operating expenses have generally increased in absolute dollars over the quarters shown as the Companyhas increased staffing and related infrastructure costs in its research and development, selling and marketing,and administrative functions. Quarter-to-quarter growth in research and development was primarily attribut-able to increased staffing levels, purchases of materials used in the development of new or enhanced prototypes,

24
CIENA CORPORATION
and outside services in support of certain developments and design efforts. Quarter-to-quarter growth in sellingand marketing was primarily the result of increased staffing levels in the areas of sales, technical assistanceand field support, and increases in commissions earned, trade show participation and promotional costs. Forthe quarters ended January 31, 1997 and October 31, 1997, the increases in general and administrative costswere primarily the result of a $5.0 and $2.5 million charge, respectively, to accrue estimated legal and relatedcosts associated with pending litigation. See Note 9 of Notes to Consolidated Financial Statements.
Liquidity and Capital Resources
The Company financed its operations and capital expenditures from inception through fiscal 1996 prin-cipally through the sale of Convertible Preferred Stock for proceeds totaling $40.6 million and capitallease financing totaling $4.1 million. The Company completed its initial public offering of Common Stockin February 1997 and realized net proceeds of approximately $121.8 million with an additional $0.6 mil-lion received from the exercise of certain outstanding warrants. In July 1997, the Company completed apublic offering of Common Stock and realized net proceeds of approximately $52.2 million. During fiscal1997 the Company also realized approximately $53.1 million in tax benefits from the exercise of stockoptions and certain stock warrants. As of October 31, 1997, the Company had $263.1 million in cash and cash equivalents.
The Company’s operating activities used cash of $6.6 million in fiscal 1995 and provided cash of $80.1 million and $0.6 million for fiscal 1997 and 1996, respectively. The cash used in operations in fiscal1995 was accounted for primarily by the Company’s development stage operating losses. Cash provided byoperations in fiscal 1997 and 1996 was principally attributable to net income adjusted for the non-cashcharges of depreciation, amortization, provisions for inventory obsolescence and warranty, increases inaccounts payable, accrued expenses and income tax payable; offset by increases in accounts receivable andinventories due to increased revenue and to the general increase in business activity.
Cash used in investing activities in fiscal 1995, 1996 and 1997 were $2.0 million, $11.5 million and $66.6 million, respectively. Included in investment activities were capital equipment expenditures in fiscal1995, 1996 and 1997 of $1.9 million, $9.8 million and $51.7 million, respectively. These capital equipmentexpenditures were primarily for test, manufacturing and computer equipment. The Company expects addi-tional capital equipment expenditures to be made during fiscal 1998 to support selling and marketing, manu-facturing and product development activities. In addition, since its inception the Company’s investing activitieshave included the use of $17.3 million for the construction of leasehold improvements and expects to use anadditional $9.9 million of capital in the construction of leasehold improvements for its new facilities. TheCompany intends to lease additional facilities of 50,000 to 100,000 square feet in mid-1998 and may spend up to $5.0 million to $10.0 million in improving such facilities as and to the extent necessary to meet expan-sion requirements.
The Company believes that its existing cash balance and cash flows expected from future operations willbe sufficient to meet the Company’s capital requirements for at least the next 18 to 24 months.
Risk Factors
Investors are reminded that this document contains forward-looking statements that should be considered inthe context of the risks described in the Company’s Form-10K and subsequent Form 8-K, on file with the SECas of December 10, 1997 and December 29, 1997 respectively. Risk factors that may cause the Company’sresults to differ materially from those discussed in forward-looking statements include, but are not limited to: a dependence on major customers, a dependence on an effective transition to multiple product lines, the poten-tial for new product development delays and competitive pressures.

25
CIENA CORPORATION
October 31,1996 1997
(in thousands, except share data)
AssetsCurrent assets:
Cash and cash equivalents $22,557 $263,085Accounts receivable (net of allowance of $— and $200) 16,759 63,227Inventories, net 13,228 41,109Deferred income taxes 1,834 9,006Prepaid expenses and other 634 2,220_______________________________ _____________________________________
Total current assets 55,012 378,647Equipment, furniture and fixtures, net 11,863 67,412Other assets 426 1,169_______________________________ _____________________________________
Total assets $67,301 $447,228_______________________________ ____________________________________________________________________ _____________________________________
Liabilities, Mandatorily Redeemable Preferred Stock and Stockholders’ EquityCurrent liabilities:
Accounts payable $ 6,278 $ 20,373Accrued liabilities 5,242 31,463Income taxes payable 3,342 —Deferred revenue 3,265 776Other current obligations 1,029 985_______________________________ _____________________________________
Total current liabilities 19,156 53,597Deferred income taxes — 28,167Other long-term obligations 2,771 1,880_______________________________ _____________________________________
Total liabilities 21,927 83,644Commitments and contingencies — —Mandatorily redeemable preferred stock—par value $.01 16,250,000 shares authorized:Series A—4,500,000 shares authorized; 3,590,157 and zero shares issued and outstanding 3,492 —
Series B—8,000,000 shares authorized; 7,354,092 and zero shares issued and outstanding 10,962 —
Series C—3,750,000 shares authorized; 3,718,899 and zero shares issued and outstanding 25,950 —
Stockholders’ equity:Preferred stock—par value $.01; 20,000,000 shares authorized; zero shares issued and outstanding — —
Common stock—par value $.01; 180,000,000 shares authorized; 13,191,585 and 99,287,653 shares issued and outstanding 132 993
Additional paid-in capital 339 245,151Notes receivable from stockholders (60) (64)Retained earnings 4,559 117,504_______________________________ _____________________________________
Total stockholders’ equity 4,970 363,584_______________________________ _____________________________________Total liabilities, mandatorily redeemable preferred stock and stockholders’ equity $67,301 $447,228_______________________________ ____________________________________________________________________ _____________________________________
The accompanying notes are an integral part of these consolidated financial statements.
Consolidated Balance Sheets

26
CIENA CORPORATION
Year Ended October 31,1995 1996 1997
(in thousands, except per share data)
Revenue $ — $54,838 $373,827Cost of goods sold — 21,844 136,187______________________________ _______________________________ ____________________________________
Gross profit — 32,994 237,640______________________________ _______________________________ ____________________________________Operating expenses:
Research and development 6,361 8,922 23,308Selling and marketing 481 3,780 20,899General and administrative 896 3,905 16,731______________________________ _______________________________ ____________________________________
Total operating expenses 7,738 16,607 60,938______________________________ _______________________________ ____________________________________Income (loss) from operations (7,738) 16,387 176,702Interest and other income (expense), net 195 877 7,599Interest expense (86) (296) (343)______________________________ _______________________________ ____________________________________Income (loss) before income taxes (7,629) 16,968 183,958Provision for income taxes — 2,250 71,013______________________________ _______________________________ ____________________________________Net income (loss) $(7,629) $14,718 $112,945______________________________ _______________________________ __________________________________________________________________ _______________________________ ____________________________________Pro forma net income per common and common equivalent share $ 0.15 $ 1.09_______________________________ ___________________________________________________________________ ____________________________________Pro forma weighted average common and common equivalent shares outstanding 99,111 103,765_______________________________ ___________________________________________________________________ ____________________________________
The accompanying notes are an integral part of these consolidated financial statements.
Consolidated Statements of Operations

27
CIENA CORPORATION
Notes Retained TotalCommon Stock Additional Receivable From Earnings Stockholders’
Shares Amount Paid-in-Capital Stockholders (Deficit) Equity (Deficit)
(dollars in thousands)
Balance at October 31, 1994 10,816,665 $108 $ 99 $(65) $ (2,530) $ (2,388)Exercise of warrants 1,075,000 11 11 — — 22Exercise of stock options 43,750 — — — — —Repayment of receivables from stockholders — — — 65 — 65
Net loss — — — — (7,629) (7,629)____________________________________________ ___________________ ____________________________________ _________________ ___________________________________ ____________________________________Balance at October 31, 1995 11,935,415 119 110 — (10,159) (9,930)Exercise of warrants 676,425 7 — — — 7Exercise of stock options 579,745 6 71 (60) — 17Compensation cost of stock options — — 2 — — 2Issuance of warrant for settlementof certain equity rights — — 156 — — 156
Net income — — — — 14,718 14,718____________________________________________ ___________________ ____________________________________ _________________ ___________________________________ ____________________________________Balance of October 31, 1996 13,191,585 132 339 (60) 4,559 4,970Issuance of common stock, net of issuance costs 7,002,060 70 173,947 — — 174,017
Conversion of Preferred Stock 74,815,740 748 40,256 — — 41,004Exercise of warrants 666,086 7 — — — 7Exercise of stock options 3,612,182 36 859 (73) — 822Tax benefit from the exercise of stock options — — 29,709 — — 29,709
Repayment of receivables from stockholders — — — 69 — 69
Compensation cost of stock options — — 41 — — 41Net income — — — — 112,945 112,945____________________________________________ ___________________ ____________________________________ _________________ ___________________________________ ____________________________________Balance at October 31, 1997 99,287,653 $993 $245,151 $(64) $117,504 $363,584____________________________________________ ___________________ ____________________________________ _________________ ___________________________________ ________________________________________________________________________________ ___________________ ____________________________________ _________________ ___________________________________ ____________________________________
The accompanying notes are an integral part of these consolidated financial statements.
Consolidated Statements of Changes in Stockholders’ Equity (Deficit)

28
CIENA CORPORATION
Year Ended October 31,1995 1996 1997
(in thousands)
Cash flows from operating activities:Net income (loss) $ (7,629) $ 14,718 $112,945Adjustments to reconcile net income (loss) to net cash provided by (used in) operating activities:Non-cash charges from equity transactions — 158 41Write down of leasehold improvements and equipment — 883 923Depreciation and amortization 355 1,007 10,155Provision for doubtful accounts — — 200Provision for inventory excess and obsolescence — 1,937 7,585Provision for warranty and other contractual obligations — 1,584 11,866Changes in assets and liabilities:
Increase in accounts receivable (8) (16,753) (46,668)Increase in inventories — (15,165) (35,466)Increase in deferred income tax assets — (1,834) (7,172)Increase in prepaid expenses and other assets (72) (955) (2,329)Increase in accounts payable and accruals 757 8,311 28,450(Decrease) increase in income taxes payable — 3,342 (3,342)Increase in deferred income tax liabilities — — 4,793(Decrease) increase in deferred revenue and other obligations (11) 3,353 (1,907)_______________________________ _________________________________ ___________________________________
Net cash provided by (used in) operating activities (6,608) 586 80,074Cash flows from investing activities:
Additions to equipment, furniture and fixtures (2,036) (11,514) (66,627)_______________________________ _________________________________ ___________________________________Net cash used in investing activities (2,036) (11,514) (66,627)_______________________________ _________________________________ ___________________________________
Cash flows from financing activities:Net proceeds from (repayment of) other obligations 719 2,479 (1,517)Net proceeds from issuance of or subscription to mandatorily redeemable preferred stock 10,962 25,950 —
Net proceeds from issuance of common stock 22 24 175,446Tax benefit related to exercise of stock options and warrants — — 53,083Repayment of notes receivable from stockholders 65 — 69_______________________________ _________________________________ ___________________________________
Net cash provided by financing activities 11,768 28,453 227,081_______________________________ _________________________________ ___________________________________Net increase in cash and cash equivalents 3,124 17,525 240,528
Cash and cash equivalents at beginning of period 1,908 5,032 22,557_______________________________ _________________________________ ___________________________________Cash and cash equivalents at end of period $ 5,032 $ 22,557 $263,085_______________________________ _________________________________ __________________________________________________________________ _________________________________ ___________________________________Supplemental disclosure of cash flow information:
Cash paid during the period for:Interest $ 86 $ 296 $ 343_______________________________ _________________________________ __________________________________________________________________ _________________________________ ___________________________________Income taxes $ — $ 742 $ 24,825_______________________________ _________________________________ __________________________________________________________________ _________________________________ ___________________________________
Supplemental disclosure of non-cash financing activities:Issuance of common stock for notes receivable from stockholders $ — $ 60 $ 73_______________________________ _________________________________ __________________________________________________________________ _________________________________ ___________________________________
The accompanying notes are an integral part of these consolidated financial statements.
Consolidated Statements of Cash Flows

29
CIENA CORPORATION
(1) The Company and Significant Accounting Policies
Description of Business
CIENA Corporation (the “Company” or “CIENA”), a Delaware corporation, designs, manufactures and sellsdense wavelength division multiplexing systems for fiberoptic telecommunications networks. During the periodfrom November 2, 1992 to October 31, 1995, CIENA was a development stage company as defined in State-ment of Financial Accounting Standards No. 7, “Development Stage Enterprises.” Planned principal operationscommenced during fiscal 1996 and, accordingly, CIENA is no longer considered a development stage company.
Principles of Consolidation
During the fiscal year ended October 31, 1997, the Company formed four wholly owned subsidiaries for thepurpose of segregating aspects of the Company’s business. The accompanying consolidated financial statementsinclude the accounts of the Company and its wholly-owned subsidiaries. All material intercompany accountsand transactions have been eliminated in consolidation.
Fiscal Year
The Company has a 52 or 53 week fiscal year which ends on the Saturday nearest to the last day of October ineach year (November 1, 1997; November 2, 1996; and October 28, 1995). For purposes of financial statementpresentation, each fiscal year is described as having ended on October 31. Fiscal 1997 and 1995 comprised 52 weeks and fiscal 1996 comprised 53 weeks.
Use of Estimates
The preparation of financial statements in conformity with generally accepted accounting principles requiresthe Company to make estimates, judgments and assumptions that affect the reported amounts of assets, liabilities,revenue and expenses, together with amounts disclosed in the related notes to the financial statements. Particu-larly sensitive estimates include reserves for warranty and other contractual obligations and for excess andobsolete inventories. Actual results could differ from the recorded estimates.
Cash and Cash Equivalents
The Company considers all highly liquid investments purchased with original maturities of three months orless to be cash equivalents.
Inventories
Inventories are stated at the lower of cost or market, with cost determined on the first-in, first-out basis. TheCompany records a provision for excess and obsolete inventory whenever such an impairment has been identified.
Equipment, Furniture and Fixtures
Equipment, furniture and fixtures are recorded at cost. Depreciation and amortization are computed using thestraight-line method over useful lives of 2-5 years for equipment, furniture and fixtures and of 6-10 years forleasehold improvements.
Concentrations
Substantially all of the Company’s cash and cash equivalents are custodied with four major U.S. financial insti-tutions. The majority of the Company’s cash equivalents include U.S. Government Federal Agency Securitiesand overnight repurchase agreements. Deposits held with banks may exceed the amount of insurance providedon such deposits. Generally these deposits may be redeemed upon demand and therefore, bear minimal risk.
Notes to Consolidated Financial Statements

30
CIENA CORPORATION
Historically, the Company has relied on a limited number of customers for a substantial portion of its reve-nue. In terms of total revenue, the Company’s largest two customers have been Sprint and WorldCom whocombined for greater than 90% of the Company’s fiscal 1997 revenue. The Company expects that a significantportion of its future revenue will continue to be generated by a limited number of customers. The loss of any of these customers or any substantial reduction in orders by any of these customers could materially adverselyaffect the Company’s operating results. Additionally, the Company’s access to certain raw materials is depen-dent upon single and sole source suppliers. The inability of any supplier to fulfill supply requirements of theCompany could impact future results.
The Company performs ongoing credit evaluations of its customers and generally does not require collateralfrom its customers. The Company maintains allowances for potential losses, and has not incurred any significantlosses to date. As of October 31, 1996 all of the Company’s trade accounts receivable were derived from Sprint, andboth Sprint and WorldCom accounted for more than 90% of the trade accounts receivable as of October 31, 1997.
Revenue Recognition
The Company recognizes product revenue in accordance with the shipping terms specified. For transactionswhere the Company has yet to obtain customer acceptance, revenue is deferred until the terms of acceptanceare satisfied. Revenue for installation services is recognized as the services are performed unless the terms ofthe supply contract combine product acceptance with installation, in which case revenues for installation ser-vices are recognized when the terms of acceptance are satisfied and installation is completed. Amounts receivedin excess of revenue recognized are recorded as deferred revenue. For distributor sales where risks of ownershiphave not transferred, the Company recognizes revenue when the product is shipped through to the end user.
Revenue-Related Accruals
The Company provides for the estimated costs to fulfill customer warranty and other contractual obligationsupon the recognition of the related revenue. Such reserves are determined based upon actual warranty costexperience, estimates of component failure rates, and management’s industry experience. The Company’s con-tractual sales arrangements generally do not permit the right of return of product by the customer after theproduct has been accepted.
Research and Development
The Company charges all research and development costs to expense as incurred.
Income Taxes
The Company accounts for income taxes in accordance with Statement of Financial Accounting Standards No. 109 (SFAS No. 109), “Accounting for Income Taxes.” SFAS No. 109 is an asset and liability approach thatrequires the recognition of deferred tax assets and liabilities for the expected future tax consequences attributableto differences between the carrying amounts of assets and liabilities for financial reporting purposes and theirrespective tax bases, and for operating loss and tax credit carryforwards. In estimating future tax consequences,SFAS No. 109 generally considers all expected future events other than the enactment of changes in tax laws orrates. Tax savings resulting from deductions associated with stock options and certain stock warrants are crediteddirectly to additional paid in capital when realization of such benefit is fully assured and to deferred tax liabilitiesprior to such point. See Note 7.
Foreign Currency Translation
The Company’s foreign branches and subsidiaries use the U.S. dollar as their functional currency as the U.S.parent exclusively funds the branches and subsidiaries’ operations with U.S. dollars. The net gain (loss) on for-eign currency remeasurement and exchange rate changes for fiscal 1995 , 1996, and 1997 was immaterial.

31
CIENA CORPORATION
Computation of Pro Forma Net Income per Share
Pro forma net income per common and common equivalent share is computed using the pro forma weightedaverage number of common and common equivalent shares outstanding. Pro forma weighted average commonand common equivalent shares include Common Stock, stock options and warrants using the treasury stockmethod and the assumed conversion of all outstanding shares of Convertible Preferred Stock into CommonStock. Since the conversion of the Convertible Preferred Stock at the initial public offering date had a signifi-cant effect on the earnings per share calculation, historical loss per share for the fiscal year ended October 31,1995 has not been calculated on the basis that it is irrelevant.
Pursuant to the rules and regulations of the Securities and Exchange Commission, Common Stock, stockoptions, warrants and Convertible Preferred Stock issued by the Company during the twelve months immedi-ately preceding the filing of the initial registration statement and through the effective date of such registrationstatement have been included in the calculation of the pro forma weighted average shares outstanding usingthe treasury stock method based on the initial public offering price.
Software Development Costs
Statement of Financial Accounting Standards No. 86, “Accounting for the Costs of Computer Software to beSold, Leased or Otherwise Marketed,” requires the capitalization of certain software development costs incurredsubsequent to the date technological feasibility is established and prior to the date the product is generally availa-ble for sale. The capitalized cost is then amortized over the estimated product life. The Company defines tech-nological feasibility as being attained at the time a working model is completed. To date, the period betweenachieving technological feasibility and the general availability of such software has been short and softwaredevelopment costs qualifying for capitalization have been insignificant. Accordingly, the Company has not capi-talized any software development costs.
Accounting for Stock Options
In October 1995, the Financial Accounting Standards Board issued Statement of Financial Accounting StandardsNo. 123 (SFAS No. 123), “Accounting for Stock-Based Compensation,” which is effective for the Company’sconsolidated financial statements for fiscal years 1996 and 1997. SFAS No. 123 allows companies to eitheraccount for stock-based compensation under the new provision of SFAS No. 123 or using the intrinsic valuemethod provided by Accounting Principles Board Opinion No. 25 (APB No. 25), “Accounting for Stock Issuedto Employees,” but requires pro forma disclosure in the footnotes to the financial statements as if the measure-ment provisions of SFAS No. 123 had been adopted. The Company has elected to continue to account for itsstock based compensation in accordance with the provisions of APB No. 25 and present pro forma disclosuresrequired by SFAS No. 123. See Note 6.
Newly Issued Accounting Standards
In February 1997, the Financial Accounting Standards Board issued Statement of Financial Accounting StandardsNo. 128, “Earnings per Share” (SFAS No. 128). SFAS No. 128 simplifies the earnings per share (EPS) compu-tation and replaces the presentation of primary EPS with a presentation of basic EPS. This statement also requiresdual presentation of basic and diluted EPS on the face of the income statement for entities with a complexcapital structure and requires a reconciliation of the numerator and denominator used for the basic and dilutedEPS computations. The Company will implement SFAS No. 128 in fiscal 1998, as required. Accordingly, allprior period EPS data will be restated. To illustrate the effect of adoption, the Company has elected to disclosepro forma basic and diluted EPS amounts computed using SFAS No. 128, as permitted by the standard. On apro forma basis, the weighted average shares outstanding for basic EPS and the resulting EPS would be 12,840,000and $1.15 for the fiscal year ended October 31, 1996, and 95,357,000 and $1.18 for the fiscal year endedOctober 31, 1997. Diluted EPS under SFAS No. 128 would be the same as currently presented.

32
CIENA CORPORATION
In June 1997, the FASB issued SFAS No. 130, “Comprehensive Income.” SFAS No. 130 becomes effective forthe Company’s fiscal year 1999 and requires reclassification of earlier financial statements for comparative pur-poses. SFAS No. 130 requires that changes in the amounts of certain items, including foreign currency translationadjustments and gains and losses on certain securities be shown in the financial statements. SFAS No. 130 doesnot require a specific format for the financial statement in which comprehensive income is reported, but doesrequire that an amount representing total comprehensive income be reported in that statement. The Companybelieves the adoption of SFAS No. 130 will not have a material effect on the consolidated financial statements.
Also in June 1997, the FASB issued SFAS No. 131, “Disclosures about Segments of an Enterprise andRelated Information.” This Statement will change the way public companies report information about segmentsof their business in annual financial statements and requires them to report selected segment information intheir quarterly reports issued to stockholders. It also requires entity-wide disclosures about the products andservices an entity provides, the material countries in which it holds assets and reports revenues, and its majorcustomers. The Statement is effective for the Company’s fiscal year 1999. The Company believes the adoptionof SFAS No. 131 will not have a material effect on the consolidated financial statements.
Reclassification
Certain prior year amounts have been reclassified to conform to current year consolidated financial state-ment presentation.
(2) Inventories
Inventories are comprised of the following (in thousands):October 31,
1996 1997
Raw materials $ 8,585 $27,716Work-in-process 3,629 5,679Finished goods 2,951 15,180_______________________________ _______________________________
15,165 48,575Less reserve for excess and obsolescence (1,937) (7,466)_______________________________ _______________________________
$13,228 $41,109_______________________________ ______________________________________________________________ _______________________________
The following is a table depicting the activity in the Company’s reserve for excess and obsolescence (in thousands):
October 31,1996 1997
Beginning balance $ — $ 1,937Provision charged to operations 1,937 7,585Amounts written off to reserve — (2,056)__________________________ _____________________________Ending balance $1,937 $ 7,466__________________________ _______________________________________________________ _____________________________
(3) Equipment, Furniture and Fixtures
Equipment, furniture and fixtures are comprised of the following (in thousands):
October 31,1996 1997
Equipment, furniture and fixtures $11,647 $ 64,502Leasehold improvements 1,141 13,953________________________________ __________________________________
12,788 78,455Accumulated depreciation and amortization (1,388) (11,543)Construction-in-progress 463 500________________________________ __________________________________
$11,863 $ 67,412________________________________ __________________________________________________________________ __________________________________

33
CIENA CORPORATION
(4) Accrued Liabilities
Accrued liabilities are comprised of the following (in thousands):October 31,
1996 1997
Warranty and other contractual obligations $1,584 $12,205Accrued compensation 2,314 7,725Legal and related costs 300 4,577Consulting and outside services — 3,219Unbilled construction-in-process and leasehold improvements 50 1,427
Other 994 2,310__________________________ _______________________________$5,242 $31,463__________________________ _________________________________________________________ _______________________________
(5) Line of Credit
In November 1996, the Company entered into an unsecured line of credit agreement with a bank, which pro-vided for borrowings of up to $15,000,000. The Company had no borrowings against the line of credit duringfiscal 1997. In November 1997, the line of credit agreement expired.
(6) Stockholders’ Equity
Changes in and Conversion of Mandatorily Redeemable Convertible Preferred Stock
As a result of the February 1997 initial public offering, all shares of Convertible Preferred Stock converted into73,315,740 shares of Common Stock and warrants to purchase 300,000 shares of Convertible Preferred Stockwere exercised for $600,000 and converted into 1,500,000 shares of Common Stock.
Public Offerings
In February 1997, the Company successfully completed its initial public offering of Common Stock. The Companysold 5,750,000 shares, inclusive of 750,000 shares from the exercise of the underwriters over-allotment option,at a price of $23 per share. Net proceeds from the offering were approximately $121,800,000 with an additional$600,000 received from the exercise of 300,000 shares of outstanding Convertible Preferred Stock warrants.
In July 1997 the Company completed a public offering of 10,477,216 shares of Common Stock of which1,252,060 shares were sold by the Company inclusive of 252,060 shares from the exercise of the underwritersover-allotment option, at a price of $44 per share. Net proceeds to the Company from the public offering wereapproximately $52,200,000.
Stock Incentive Plans
The Company has an Amended and Restated 1994 Stock Option Plan (the “1994 Plan”). Under the 1994Plan, 20,050,000 shares of the Company’s authorized but unissued Common Stock are reserved for optionsissuable to employees. These options are immediately exercisable upon grant, and both the options and theshares issuable upon exercise of the options generally vest to the employee over a four year period. The Com-pany has the right to repurchase any exercised and non-vested shares at the original purchase price from theemployees upon termination of employment. In June 1996 the Company approved the 1996 Outside DirectorsStock Option Plan (the “1996 Plan”). Under the 1996 Plan, 750,000 shares of the Company’s authorized butunissued Common Stock are reserved for options issuable to outside members of the Company’s Board of Direc-tors. These options vest to the director over periods from one to three years, depending on the type of optiongranted, and are exercisable once vested. Under the 1994 Plan and the 1996 Plan, options may be incentivestock options or non-statutory options, and the exercise price for each option shall be established by the Boardof Directors provided, however, that the exercise price per share shall not be not less than the fair market valuefor incentive stock options and not less than 85% of fair market value for non-statutory stock options.

34
CIENA CORPORATION
Following is a summary of the Company’s stock option activity:
Shares Weighted Average(in thousands) Exercise Price
Balance at October 31, 1994 3,560 $ 0.02Granted 3,856 0.03Exercised (44) 0.02Canceled (431) 0.02_________________________
Balance at October 31, 1995 6,941 0.03Granted 5,901 1.85Exercised (579) 0.14Canceled (1,180) 0.18_________________________
Balance at October 31, 1996 11,083 0.97Granted 1,737 32.81Exercised (3,612) 0.27Canceled (98) 0.52_________________________
Balance at October 31, 1997 9,110 $ 7.33__________________________________________________
At October 31, 1997 approximately 156,000 shares of Common Stock subject to repurchase by theCompany had been issued upon the exercise of options and approximately 1.7 million of the total outstandingoptions were vested and not subject to repurchase by the Company upon exercise.
The following table summarizes information with respect to stock options outstanding at October 31, 1997:
Options Not Subject toOptions Outstanding Repurchase Upon Exercise
WeightedNumber Average Weighted Weighted
Range of Outstanding Remaining Average Number AverageExercise at Oct. 31, Contractual Exercise at Oct. 31, Exercise
Price 1997 Life (Years) Price 1997 Price
$ 0.02–$ 0.03 2,586,000 7.14 $ 0.03 1,203,000 $0.03$ 0.06–$ 0.40 810,000 8.22 $ 0.26 165,000 $0.28$ 0.52–$ 1.66 983,000 8.53 $ 1.18 152,000 $1.21$ 2.34–$ 4.34 2,839,000 8.66 $ 2.52 89,000 $3.12$ 4.44–$18.00 935,000 9.07 $15.52 47,000 $9.17$23.88–$58.88 957,000 9.71 $45.61 — $0.00_______________________________________ ______________________________________
9,110,000 8.33 $ 7.33 1,656,000 $0.58_______________________________________ _____________________________________________________________________________ ______________________________________
Pro Forma Stock-Based Compensation
The Company has elected to continue to follow the provisions of APB No. 25 for financial reporting purposes andhas adopted the disclosure-only provisions of SFAS No. 123. Accordingly, no compensation cost has been recog-nized for the Company’s stock option plans. Had compensation cost for the Company’s stock option plans beendetermined based on the fair value at the grant date for awards in fiscal years 1996 and 1997 consistent with theprovisions of SFAS No. 123, the Company’s net income and net income per share for fiscal years 1996 and 1997would have been decreased to the pro forma amounts indicated below (in thousands, except per share amounts):
Fiscal Years1996 1997
Net income applicable to common stockholders—as reported $14,718 $112,945_______________________________ ____________________________________________________________________ _____________________________________Net income applicable to common stockholders—pro forma $14,225 $107,382_______________________________ ____________________________________________________________________ _____________________________________Net income per share—as reported $ 0.15 $ 1.09_______________________________ ____________________________________________________________________ _____________________________________Net income per share—pro forma $ 0.14 $ 1.03_______________________________ ____________________________________________________________________ _____________________________________
The above pro forma disclosures are not necessarily representative of the effects on reported net income orloss for future years.

35
CIENA CORPORATION
The aggregate fair value and weighted average fair value of each option granted in fiscal years 1996 and1997 were approximately $6.7 million and $33.6 million, and $1.14 and $19.33, respectively. The fair valueof each option grant is estimated on the date of grant using the Black-Scholes Option Pricing Model with thefollowing weighted average assumptions for fiscal years 1996 and 1997:
1996 1997
Expected volatility 60% 60%Risk-free interest rate 6.1% 5.8%Expected life 3 yrs. 3 yrs.Expected dividend yield —% —%
(7) Income Taxes
Income before income taxes and the provision for income taxes consists of the following (in thousands):October 31,
1996 1997
Income before income taxes $16,968 $183,958_______________________________ ____________________________________________________________________ _____________________________________Provision for income taxes:Current:
Federal $ 3,452 $ 66,154State 632 7,238_______________________________ _____________________________________
Total current 4,084 73,392_______________________________ _____________________________________Deferred:
Federal (1,690) (1,882)State (144) (497)_______________________________ _____________________________________
Total deferred (1,834) (2,379)_______________________________ _____________________________________Provision for income taxes $ 2,250 $ 71,013_______________________________ ____________________________________________________________________ _____________________________________
In fiscal 1995, the tax provision was comprised primarily of a tax benefit of approximately $3.1 millionwhich was offset by a valuation allowance of the same amount.
In fiscal 1995, the tax provision differed from the expected tax benefit, computed by applying the U.S.federal statutory rate of 35% to the loss before income taxes, principally due to the effect of increases in thevaluation allowance. In fiscal 1997 and 1996, the tax provision reconciles to the amount computed by multi-plying income before income taxes by the U.S. federal statutory rate of 35% as follows:
October 31,1996 1997
Provision at statutory rate 35.0% 35.0%Reversal of valuation allowance (24.3) —State taxes, net of federal benefit 2.9 2.6Other (0.3) 1.0___________________ __________________
13.3% 38.6%___________________ _____________________________________ __________________
The significant components of deferred tax assets and liabilities were as follows (in thousands):October 31,
1996 1997
Deferred tax assets:Reserves and accrued liabilities $1,452 $ 9,006Depreciation and other 382 —___________________________ ________________________________
Deferred tax assets $1,834 $ 9,006___________________________ ___________________________________________________________ ________________________________Deferred tax liabilities:
Equipment leases $ — $ 3,985Services — 19,389Depreciation and other — 4,793___________________________ ________________________________
Deferred tax liabilities $ — $28,167___________________________ ___________________________________________________________ ________________________________

36
CIENA CORPORATION
The income tax provisions do not reflect the tax savings resulting from deductions associated with the Com-pany’s stock option plans or the exercise of certain stock warrants. Tax benefits of approximately $29.7 millionand $23.4 million from exercises of stock options and certain stock warrants, respectively, were credited directlyto additional paid-in-capital and to long-term deferred income taxes for fiscal 1997, respectively.
(8) Employee Benefit Plans
In January 1995, the Company adopted a 401(k) defined contribution profit sharing plan. The plan covers allfull-time employees who are at least 21 years of age, have completed three months of service and are not coveredby a collective bargaining agreement where retirement benefits are subject to good faith bargaining. Participantsmay contribute up to 15% of pre-tax compensation, subject to certain limitations. The Company may makediscretionary annual profit sharing contributions of up to the lesser of $30,000 or 25% of each participant’scompensation. In fiscal 1997 the Company revised the plan to include an employer matching contributionequal to 100% of the first 3% of participating employee contributions, with a five year vesting plan applicableto the Company’s contribution. The Company has made no profit sharing contributions to date. During fiscal1997 the Company made matching contributions of approximately $300,000.
(9) Commitments and Contingencies
Operating Lease Commitments
The Company has certain minimum obligations under noncancelable operating leases expiring on various datesthrough 2006 for equipment and facilities. Future annual minimum rental commitments under noncancelableoperating leases at October 31, 1997 are as follows (in thousands):
Fiscal year ending October 31,
1998 $ 4,4291999 4,9002000 4,8052001 4,6272002 4,003Thereafter 13,015______________________________
$35,779____________________________________________________________
Rental expense for fiscal 1995, 1996 and 1997 was approximately $111,000, $602,000 and$2,511,000, respectively.
Litigation
Pirelli Litigation. On December 20, 1996, a U.S. affiliate of Pirelli SpA (“Pirelli”) filed suit in U.S. District Court inDelaware, alleging willful infringement by the Company of five U.S. patents held by Pirelli. The lawsuit seeks trebledamages, attorneys’ fees and costs, as well as preliminary and permanent injunctive relief against the allegedinfringement. On February 10, 1997, the Company filed its answer denying infringement, alleging inequitable con-duct on the part of Pirelli in the prosecution of certain of its patents, and stating a counterclaim against the relevantPirelli parties for a declaratory judgment finding the Pirelli patents invalid and/or not infringed. Two of the fivepatents in suit have since been removed from the litigation. Discovery proceedings are ongoing, and are currentlyexpected to be completed by January 31, 1998, with trial expected no earlier than mid 1998.
On March 14, 1997, the Company filed suit against Pirelli in U.S. District Court in the Eastern District ofVirginia, alleging willful infringement by Pirelli of three U.S. patents held or co-owned by the Company, one of
37
CIENA CORPORATION
which was withdrawn in September 1997. The lawsuit seeks treble damages, attorneys’ fees and costs, as well aspermanent injunctive relief against the alleged infringement. The patents relate to certain of Pirelli’s cable televisionequipment and fiberoptic communications equipment. Motions for summary judgment by both parties are currentlypending on the issue of infringement as it relates to the cable television patent, and Pirelli has also filed a motion forsummary judgment of invalidity on this patent. As to the second of the two patents, on December 5, 1997, the courtissued an order granting partial summary judgment for Pirelli on the issue of non-infringement, and denying Pirelli’smotion for summary judgment of invalidity of this patent. Trial is currently scheduled for January 1998.
In February 1997, the Company filed a complaint against Pirelli with the International Trade Commission(“ITC”), based on the Company’s belief that a 32 channel DWDM system announced by Pirelli infringed at leasttwo of the Company’s patents. The Company’s complaint sought a ban on the importation of this product into theU.S. A formal investigative proceeding was instituted by the ITC on April 3, 1997. On November 24, 1997, the partiessettled the matter by entry of a Consent Order. Under the Consent Order, Pirelli has agreed not to import into theUnited States WDM systems which infringe upon the Company’s patented in fiber Bragg gratings-based WDM systems.
The Company has accrued $7.5 million for legal fees associated with their involvement in the above litigation;$4.3 million of that accrual is remaining at October 31, 1997, which the Company considers sufficient to accountfor all anticipated legal fees. The Company continues to believe its MultiWave systems do not infringe any validclaim of the three remaining Pirelli patents and believes certain Pirelli patents and/or claims are invalid. TheCompany is defending itself vigorously and is planning on all remaining litigation proceeding through trial.
However, there can be no assurance that the Company will be successful in the Pirelli litigation, and an adversedetermination in the Delaware court could result from a finding of infringement of only one claim of a single patent.The Company may consider settlement due to the costs and uncertainties associated with litigation in general andpatent infringement litigation in particular and due to the fact that an adverse determination in the litigation couldpreclude the Company from producing the MultiWave 1600 system until it were able to implement a non-infringingalternative design to any portion of the system to which such determination applied. There can be no assurancethat any settlement will be reached by the parties. An adverse determination in, or settlement of, the Pirelli litiga-tion could involve the payment of significant amounts, or could include terms in addition to such payments, whichcould have a material adverse effect on the Company’s business, financial condition and results of operations.
Kimberlin Litigation. On November 20, 1996, a stockholder and entities controlled by that stockholder (the“plaintiffs”) who provided initial equity capital during the formation of the Company and participated in theSeries C Preferred Stock financing, filed suit in U. S. District Court for the Southern District of New York against theCompany and certain directors of the Company (the “defendants”), alleging that the plaintiffs were entitled to pur-chase additional shares of Series C Preferred Stock at the time of the closing of the Series C Preferred Stock financ-ing, but were denied that opportunity by the defendants. The lawsuit claims breach of contract, breach of fiduciaryduty and violation of Securities Commission Rule 10b-5 by the defendant. On January 6, 1997, the Company filedits answer to the plaintiffs’ complaint, and filed a counterclaim. The plaintiffs amended their complaint in May1997 alleging a violation of federal insider trading laws. There has not been a trial date set by the judge.
The Company believes that the Plaintiffs’ claims and amended claims are without merit and intends todefend itself vigorously. The Company has moved for summary judgment on the entire matter, but there is noassurance the judgment will be granted.
The Company has agreed to indemnify its customers for liability incurred in connection with the infringementof a third-party’s intellectual property rights. Although the Company has not received notice from any customeradvising the Company of any alleged infringement of a third-party’s intellectual property rights, there can be noassurance that such indemnification of alleged liability will not be required from the Company in the future.

38
CIENA CORPORATION
(10) Foreign Sales
The Company has sales and marketing operations located outside the United States in the United Kingdom,Belgium and Japan. The Company has distributor or marketing representative arrangements covering Austria,Germany, Italy and Switzerland in Europe, and the Republic of Korea and Japan in Asia. The Company alsohas representative support in Brazil. Included in revenues are export sales of approximately $0 and $5.5 millionin fiscal years 1996 and 1997, respectively.
(11) Subsequent Events (unaudited)
Acquisitions
The Company has signed a letter of intent to enter into an Agreement and Plan of Merger with Astracom, Inc.(“Astracom”), an early stage telecommunications company which was incorporated on November 20, 1996, andis located in Atlanta, Georgia. The transaction is expected to be completed during the December 1997 period.The purchase price is expected to be approximately $13.1 million and consists of the issuance of 169,754 sharesof CIENA common stock, the payment of $2.4 million in cash, and the assumption of certain stock options.Based on preliminary estimates, the Company believes the purchase price represents approximately $11.4 millionin goodwill and other intangibles, and approximately $1.7 million in net assets assumed, and that the amorti-zation period for the intangibles, based on management’s estimate of the useful life of the acquired technology,is between five to seven years.
The operations of the acquired company are not material to the consolidated financial statements of theCompany, and accordingly, separate pro forma financial information has not been presented for fiscal year1997 as if Astracom had been acquired as of November 20, 1996.

39
CIENA CORPORATION
To the Board of Directors andStockholders of CIENA Corporation
In our opinion, the accompanying consolidated balance sheets and the related consolidated statements of operations, ofcash flows and of changes in stockholders’ equity (deficit) present fairly, in all material respects, the financial position ofCIENA Corporation and subsidiaries at October 31, 1997 and 1996, and the results of their operations and their cashflows for each of the three years in the period ended October 31, 1997, in conformity with generally accepted account-ing principles. These financial statements are the responsibility of the Company’s management; our responsibility is toexpress an opinion on these financial statements based on our audits. We conducted our audits of these statements inaccordance with generally accepted auditing standards which require that we plan and perform the audit to obtainreasonable assurance about whether the financial statements are free of material misstatement. An audit includesexamining, on a test basis, evidence supporting the amounts and disclosures in the financial statements, assessingthe accounting principles used and significant estimates made by management, and evaluating the overall financialstatement presentation. We believe that our audits provide a reasonable basis for the opinion expressed above.
Falls Church, VANovember 26, 1997
Report of Independent Accountants

40
CIENA CORPORATION
Patrick H. Nettles, Ph.D.
President, Chief Executive Officer and Director
Steve W. Chaddick
Senior Vice President, Products and Technologies
Joseph R. Chinnici
Senior Vice President, Finance and Chief Financial Officer
Lawrence P. Huang
Senior Vice President, Sales and Marketing
Stephen B. Alexander
Vice President, Transport Products
Mark Cummings
Senior Vice President, Operations
G. Eric Georgatos, Esq.
Vice President, General Counsel and Secretary
Andrew C. Petrik
Vice President, Finance and Controller
Rebecca K. Seidman
Vice President, Human Resources
Executive Officers
Jon W. Bayless, Ph.D.
Chairman of the Board of Directors,General Partner,Sevin Rosen Funds
Harvey B. Cash
General Partner, InterWest Partners
Clifford W. Higgerson
General Partner, Vanguard Venture Partners
Billy B. Oliver
Communications Consultant
Michael J. Zak
General Partner,The Charles River Partnerships
Outside Board Members

Corporate Headquarters
CIENA Corporation920 Elkridge Landing Rd.Linthicum, MD 21090 U.S.A.Telephone: (800) 921-1144 or (410) 865-8500Website: http://www.CIENA.com
Annual Meeting
CIENA’s first annual shareholder meeting will be held at 3:00 p.m. on Wednesday, March 11 at the Harbor Inn Pier 5, Baltimore, MD.
Independent Certified Public Accountants
Price Waterhouse LLPFalls Church, VA
General Counsel
Hogan & HartsonBaltimore, MD
Transfer Agent
First National Bank of Bostonc/o Boston Equiserve LPBoston, MA
Common Stock Market Data
Since its Initial Public Offering on February 7, 1997, the Company’s Common Stock has traded on theNasdaq Stock Market under the symbol CIEN and appears in most daily newspaper stock tables as Ciena. As of January 12, 1998, there were approximately 561 stockholders of record and 99,982,487 shares of Common Stock outstanding.
Investor Relations
For a copy of the Company’s Form 10-K or additional copies of this report or other financial information, contact:
Investor RelationsCIENA Corporation920 Elkridge Landing Rd.Linthicum, MD 21090(888) 243-6223 or (410) 865-8500
Additional information is available on CIENA’s Internet website at http://www.CIENA.com
Corporate Information
Des
ign:
Fin
anci
al C
omm
unic
atio
ns, I
nc.
Bet
hesd
a, M
Dw
ww
.fin
com
inc.
com
©19
98 C
IEN
A C
orpo
rati
on
CIENA CORPORATION


![[David S. Linthicum] Enterprise Application Integr(BookFi.org)](https://static.fdocuments.in/doc/165x107/5695d0861a28ab9b0292ce69/david-s-linthicum-enterprise-application-integrbookfiorg.jpg)