CID Working Paper No. 132 :: Competition and Productivity ...
52
Competition and Productivity Growth in South Africa Philippe Aghion, Matias Braun, and Johannes Fedderke CID Working Paper No. 132 August 2006 © Copyright 2006 Philippe Aghion, Matias Braun, Johannes Fedderke, and the President and Fellows of Harvard College at Harvard University Center for International Development Working Papers
Transcript of CID Working Paper No. 132 :: Competition and Productivity ...

Competition and Productivity Growth in South Africa
Philippe Aghion, Matias Braun, and Johannes Fedderke
CID Working Paper No. 132 August 2006
© Copyright 2006 Philippe Aghion, Matias Braun, Johannes Fedderke, and the President and Fellows of Harvard College
at Harvard UniversityCenter for International DevelopmentWorking Papers

Competition and Productivity Growth in South Africa Philippe Aghion1, Matias Braun2, and Johannes Fedderke3 DRAFT, August 2006. Subject to further revision Abstract: Using three different panel data sets, the authors show: (i) that mark-ups are significantly higher in South African manufacturing industries than they are in corresponding industries worldwide; (ii) that competition policy (i.e. a reduction of mark-ups) should have largely positive effects on productivity growth and employment in South Africa. Keywords: South Africa, Competition, Mark-ups JEL Codes: O55, L40, O40 This paper is part of the South Africa Growth Initiative. The Center for International Development has convened an international panel of economists and international experts from Harvard University, the Massachusetts Institute of Technology, the University of Michigan, and other institutions to work with South African economists to study that country’s constraints to and opportunities for accelerated growth. This project is an initiative of the National Treasury of the Republic of South Africa within the government’s Accelerated and Shared Growth Initiative (ASGI-SA), which seeks to consolidate the gains of post-transition economic stability and accelerate growth in order to create employment and improve the livelihoods of all South Africans. 1) Harvard University 2) UCLA 3) University of Cape Town

Competition and Productivity Growth in South AfricaPhilippe Aghion∗, Matias Braun†, and Johannes Fedderke‡
June 2006§
Abstract
Using three different panel data sets, we show: (i) that mark-ups aresignificantly higher in South African manufacturing industries than theyare in corresponding industries worldwide; (ii) that competition policy (i.ea reduction of mark-ups) should have largely positive effects on productivitygrowth and employment in South Africa.
1. Introduction
Recent empirical studies (e.g Nickell (1996), Blundell et al (1999),Aghion et al (2005)), have pointed to a positive effect of productmarket competition on productivity growth, particularly at low lev-els of competition. In this paper we explore three different data setsto: (i) first, compare product market competition in South Africanmanufacturing firms and sectors to that in the corresponding sectorsworldwide; (ii) second, assess the effect on productivity growth andaggregate employment in South Africa of increasing product marketcompetition.The three data sets are respectively: (i) industry-level panel data
for SA and more than 100 countries since the mid-1960s, from UNIDO;(ii) industry-level panel data over the period 1970-2004 from the TIPSdatabase; (iii) firm-level panel data since the early 1980’s from publiclylisted companies. Product market competition is measured inverselyby the ratio of value added (net of total wages) over output or salesor assets. Productivity growth is computed as the growth rate of reallocal currency value added per worker.Our main findings can be summarized as follows: (a) consistently
over the three data sets, mark-ups are significantly higher in SouthAfrican industries than they are in corresponding industries world-wide. In particular, the profitability margins as computed from the
∗Harvard University†UCLA‡University of Cape Town§First draft - subject to further revision.

Competition and Productivity Growth in South Africa 2
listed firms sample, is more than twice as large in South Africa than itis in other countries. Moreover, there is no declining trend in the mark-up differential between SA and other countries over the recent period;(b) higher past mark ups are associated with lower current productiv-ity growth rates and with lower current employment. In particular,a ten percent reduction in SA mark-ups would increase productivitygrowth in SA by 2 to 2.5% per year, and a 0.1 unit reduction in theLerner index should increase SA employment by 3400 employees; (c)finally, when introducing a quadratic term on the RHS of the growthregression, we find the same kind of inverted-U relationship betweencompetition and growth as for the UK and other countries.The paper is organized as follows. Section 2 presents a simple
model to analyze the relationship between competition and growth,and to describe the ”escape competition” effect that underlies the pos-itive correlation between competition and growth. Section 3 presentsthe empirical methodology, the three data sets and the measures usedin our regressions. Section 4 shows the mark-up comparisons. Section5 outlays our growth and employment regressions. Finally, Section 6outlays some preliminary conclusions.
2. Theory: the escape competition effect
We consider a domestic economy which takes as given the rateof innovation in the rest of the world.1 Thus the world technologyfrontier is also moving at a constant rate, with productivity At at theend of period t, satisfying:
At = γAt−1,
where γ > 1.
1This section borrows unrestrainedly from Aghion-Howitt (2004), which itselfbuilds on Aghion-Harris-Vickers (1997), Aghion-Harris-Howitt-Vickers (2001), andthe discrete time version of the Schumpeterian growth model (see Acemoglu et al.(2002)) used in the previous chapters.

Competition and Productivity Growth in South Africa 3
In each country, the final good is produced using the same kind oftechnology as in the previous sections, with a continuum of interme-diate inputs and we normalize the labor supply at L = 1, so that:
yt =
Z 1
0
A1−αit xαitdi,
where, in each sector i, only one firm produces intermediate input iusing final good as capital according to a one-for-one technology.In each sector, the incumbent firm faces a competitive fringe of
firms that can produce the same kind of intermediate good, althoughat a higher unit cost. More specifically, we assume that at the endof period t, at unit cost χ, where we assume 1 < χ < 1/α < γχ, acompetitive fringe of firms can produce one unit of intermediate inputi of a quality equal to min(Ait, At−1), where Ait is the productivitylevel achieved in sector i after innovation has had the opportunity tooccur in sector i within period t.In each period t, there are three types of sectors, which we refer to
as type-j sectors, with j ∈ {0, 1, 2}. A type-j sector starts up at thebeginning of period t with productivity Ait−1 = At−1−j, that is, j stepsbehind the current frontier At−1. The profit flow of an incumbent firmin any sector at the end of period t, will depend upon the technologicalposition of that firm with regard to the technological frontier at theend of the period.Between the beginning and the end of the current period t, the
incumbent firm in any sector i has the possibility of innovating withpositive probability. Innovations occur step-by-step: in any sector aninnovation moves productivity upward by the same factor γ. Incum-bent firms can affect the probability of an innovation by investingmore in R&D at the beginning of the period. Namely, by investingthe quadratic R&D effort 1
2γAit−1μ
2 incumbent an firm i in a type-0or type-1 sector, innovates with probability μ. However, innovationis assumed to be automatic in type-2sectors, which in turn reflects aknowledge externality from more advanced sectors which limits themaximum distance of any sector to the technological frontier.

Competition and Productivity Growth in South Africa 4
Now, consider the R&D incentives of incumbent firms in the dif-ferent types of sectors at the beginning of period t. Firms in type-2sectors have no incentive to invest in R&D since innovation is auto-matic in such sectors. Thus
μ2 = 0,
where μj is the equilibrium R&D choice in sector j.Firms in type-1 sectors, that start one step behind the current
frontier at Ait−1 = At−2 at the beginning of period t, end up withproductivity At = At−1 if they successfully innovate, and with pro-ductivity At = At−2 otherwise. In either case, the competitive fringecan produce intermediate goods of the same quality but at cost χ in-stead of 1, which in turn, as in section 2 above, the equilibrium profitis equal to
πt = Atδ(χ),
withδ (χ) = (χ− 1) (χ/α)
1α−1 .
2. Thus the net rent from innovating for a type-1 firm is equal to
(At−1 −At−2)δ(χ)
2This, in turn, follows immediately from the fact that
∂yt∂xit
= χ = pit,
which in turn implies that in equilibrium
xit = (χ
α)
1α−1Ait.
We then simply substitute for xit in the expression for profit πt, namely
πt = (pit − 1)xit = (χ− 1)(χ
α)
1α−1Ait.

Competition and Productivity Growth in South Africa 5
and therefore a type-1 firm will choose its R&D effort to solve:
maxμ{(At−1 −At−2)δ(χ)μ−
1
2γAt−2μ
2},
which yields
μ1 = (1−1
γ)δ(χ).
In particular an increase in product market competition, measuredas an reduction in the unit cost χ of the competitive fringe, will re-duce the innovation incentives of a type-1 firm. This we refer to asthe Schumpeterian effect of product market competition: competitionreduces innovation incentives and therefore productivity growth by re-ducing the rents from innovations of type-1 firms that start below thetechnological frontier. This is the dominant effect, both in IO modelsof product differentiation and entry, and in basic endogenous growthmodels. Note that type-1 firms cannot escape the fringe by innovat-ing: whether they innovate or not, these firms face competitors thatcan produce the same quality as theirs at cost χ. As we shall now see,things become different in the case of type-0 firms.Firms in type-0 sectors, that start at the current frontier, end
up with productivity At if they innovate, and stay with their initialproductivity At−1 if they do not. But the competitive fringe can neverget beyond producing quality At−1. Thus, by innovating, a type-0incumbent firm produces an intermediate good which is γ times betterthan the competing good the fringe could produce, and at unit cost1 instead of χ for the fringe. Our assumption 1
α< γχ then implies
that competition by the fringe is no longer a binding constraint for aninnovating incumbent, so that its equilibrium profit post-innovation,will simply be the profit of an unconstrained monopolist, namely:
πt = Atδ(1/α).
On the other hand, a type-0 firm that does not innovate, will keep itsproductivity equal to At−1. Since the competitive fringe can produce

Competition and Productivity Growth in South Africa 6
up to this quality level at cost χ, the equilibrium profit of a type-0firm that does not innovate, is equal to
πt = At−1δ(χ).
A type-0 firm will then choose its R&D effort to:
maxμ{[Atδ(1/α)−At−1δ(χ)]μ−
1
2γAt−1μ
2},
so that in equilibrium
μ0 = δ(1/α)− 1γδ(χ).
In particular an increase in product market competition, i.e a reduc-tion in χ, will now have a fostering effect on R&D and innovation.This, we refer to as the escape competition effect: competition re-duces pre-innovation rents of type-0 incumbent firms, but not theirpost-innovation rents since by innovating these firms have escaped thefringe. This, in turn. induces those firms to innovate in order to escapecompetition with the fringe.The combination of these two effects explains the inverted-U rela-
tionship between competition and growth which we observe in mostcountries. However, if we just look for a linear relationship betweenproductivity growth and product market competition, we generallyfind that the escape competition effect dominates. Both findings areconfirmed when restricting attention to SA industry- or firm-levelpanel data as we shall see in the next sections.
3. Empirical methodology, data, and measurement
3.1. Productivity growth, pricing power and mark-ups
Our interest lies in the link between productivity growth and com-petitive pressure in industries. We proceed by the estimation of thegeneral empirical specification given by:
Pgrowthit = α+ βPCMit + Ii + It + εit, (1)

Competition and Productivity Growth in South Africa 7
where Pgrowthit denotes a measure of productivity growth in sectori at time t, PCMit is a measure of competitive pressure in sector i,and Ii and It stand for industry and year fixed effects.Two empirical measures for productivity growth are employed in
the analysis: labour productivity growth, as well as total factor pro-ductivity growth as given by the Solow residual.The extent of competitive pressure in an industry is proxied by the
pricing power evident in the industry. We pay atention to the possbil-ity of alternative measures of pricing power, as well as the existenceof a literature devoted to the estimation of the precise magnitude ofthe mark-up. Thus we follow Aghion et al (2005) in computing theextent of pricing power in an industry directly, by means of a proxy ofthe Lerner index. The study employs two proxies of the Lerner index,one given by the differential between value added and the total wagebill as a proportion of gross output:
PCM1 =valueadded − totalwages
sales(2)
the second as the difference between output and both wage and capitalcosts as a proportion of output::
PCM2 =pY − wL− rK
pY(3)
where pY denotes nominal GDP, w the nominal wage rate, L thenumber of workers, r denotes the nominal interest rate less inflationplus the sectoral depreciation rate of capital,andK the nominal capitalstock.In addition, following the contributions by Hall (1990) and Roeger
(1995) we also estimate the magnitude of the mark-up by means of:
NSR = ∆ (p+ q)− α ·∆ (w + l)− (1− α) ·∆ (r + k) (4)
= (μ− 1) · α · [∆ (w + l)−∆ (r + k)]
where μ = P/MC, with P denoting price, andMC denoting marginalcost. Under perfect competition μ = 1, while imperfectly competitive

Competition and Productivity Growth in South Africa 8
markets allow μ > 1. ∆ denotes the difference operator, lower casedenotes the natural log transform, q, l, and k denote real value-added,labour, and capital inputs, and α is the labour share in value-added.Details are provided in an Appendix on methodolgical issues surround-ing the estimation of mark-ups - see section 7. below.Finally, for firm level data we also add a range of measures of
profitability.
3.2. Data
This study employs three distinct sources of data. Confronted withgaps in firm-level data over the past ten years, we use:
1. Industry-level panel data for South Africa and for more than 100countries since the mid 1960s is obtained from UNIDO’s Inter-national Industry Statistics 2004. This dataset contains yearlyinformation on output, value added, total wages, and employ-ment for 27 different manufacturing industries in more than 100countries since the mid 1960s. >From these data we computeprice-cost margins by means of equation (2). Real labor pro-ductivity growth is measured as the growth rate of real localcurrency value added per worker.
2. Firm-level (Worldscope) evidence from publicly listed compa-nies. The firm-level evidence is based on Worldscope data forpublicly-listed companies in 56 different countries since the early1980s. The dataset contains yearly balance sheet and P&Litems, and other basic firm characteristics. Margins are com-puted by means of equation (2), and real labor productivitygrowth as the growth rate of real local currency sales per worker.The firm-level data are truncated at the 5% level in order toavoid the results being driven by a few outliers.
3. Industry-level panel data for South Africa from the TIPS data-base. The data employed for this study focus on the three digit

Competition and Productivity Growth in South Africa 9
manufacturing industries, over the 1970-2004 period. Variablesfor the manufacturing sector include the output, capital stock,and labour force variables and their associated growth rates.Data are obtained from the Trade and Industrial Strategies database. We employ a panel data set for purposes of estimation,with observations from 1970 through 2004. The panel employsdata for the 28 three-digit SIC version 5 manufacturing indus-tries in the South African economy for which data is available.Due to problems with data availability a number of sectors havebeen omitted. These sectors are Tobacco, Coke and refined pe-troleum products, Television & communications equipment, Pro-fessional & scientific equipment and Other transport equipment.In addition, due to missing concentration ratios we have alsoomitted the Other chemicals sector. The list of sectors includedin the panel is that specified in Table 1. This provides a 28× 28panel with a total of 784 observations.
One may question our use of two alternative industry-level paneldata sets, namely UNIDO and TIPS. The advantage of the former isthat it covers a larger number of countrries. The advantage of thelatter is that it is more detailed on South Africa.INSERT TABLE 1 ABOUT HERE.There are questions over the reliability of industry data post-1996.
Since the last manufacturing survey was undertaken in 1996, datapost-1996 have been disaggregated from the 2-digit sector level on thebasis of a single input-output table. The large sample manufacturingsurvey of 2001 does not appear to have been incorporated into thedata, and moreover the 2001 survey has not released the labour com-ponent of the survey. The reliability of the data has suffered as a resultof this data collection strategy. This is evident from the evidence pre-sented in Table 2, which reports standard deviations of the computedmark-ups for this study. We report only the standard deviations forcomputed mark-ups, since the measure summarises the output, capitaland labour dimensions in the manufacturing sector. Standard devia-tions increase substantially post-1996 for all sectors, and increase even

Competition and Productivity Growth in South Africa 10
mnore markedly after 2000. In the instance of some sectors (eg. Rub-ber propducts), the increase is of very substantial magnitude. Thisreflects increased underlying volatitility in the underlying series fromwhich the mark-ups are computed.INSERT TABLE 2 ABOUT HERE.In interpreting the results that follow, it must be borne in mind
that reliability of all results based on industry data are likely to declinesubstantially after 1996. There is no adequate means of compensatingfor the absence of data collection for the manufacturing sector, andafter having collected manufacturing censuses on a bi-annual basissince 1917, South Africa simply ceased doing do since 1996.
4. Higher mark-ups in South Africa
The objective of this section is to explore the intensity of com-petition in South African manufacturing industry.We find consistentevidence of pricing power in South African industry that is greaterthan international comparators, and which is non-declining over time.In this our results are consistent with those reported in Fedderke,Kularatne and Mariotti (2006). Results prove to be robust across:
• Three distinct data sets, covering both industry level data aswell as firm-level evidence.
• Two proxies of the Lerner index, given either by the differentialbetween value added and the total wage bill as a proportion ofoutput, or the difference between output and both wage andcapital costs as a proportion of output.
• Alternative measures of firm profitability.
• The measure of mark-up of price over marginal cost of produc-tion as suggested by section 3..
• The level of aggregation for industry, or firm size.

Competition and Productivity Growth in South Africa 11
4.1. The Industry-level (UNIDO) panel data for South Africa
We compute price-cost margins as given by equation (2), while reallabor productivity growth is measured as the growth rate of real localcurrency value added per worker.Table 3 presents the measures of competition and productivity for
each manufacturing industry in South Africa. Due to data availabilitythe price-cost margins we compute differ in two mayor respects fromthe Lerner index traditionally used to gauge the degree of competition:the fact that we use average instead of marginal costs, and that we donot take into account the payment to physical capital.3
INSERT TABLE 3 ABOUT HERE.The price-cost margins of Table 3 suggest that there is no signif-
icant time variation in the magnitude of the computed mark-up forSouth African manufacturing industries.
4.2. Firm-level (Worldscope) evidence from publicly listed companies
In order to explore the degree of competition in South Africa weanalyze firm-level data corresponding to listed firms in 60 countriesin the period 1980-2004. We investigate a number of indicators ofprofitability across industries and over time. In order to make theanalysis robust to influential outliers we truncate all the variables atthe 5% level and report the median.Results are reported in Table 4 through 6.INSERT TABLE 4, 5 AND 6 ABOUT HERE.While listed firms in South Africa exhibit around 50% higher prof-
itability when this is measured with Net Income/Sales, Net Income/Assets,
3As outlined in section 3., an approach deriving from Hall (1990) proposes amore structured way of measuring markups that is based on Solow residuals. In thepresent section we favor our measure because Solow residuals are a noisy measureof markups (capturing all errors in the measurement of labor and capital), butalso because our measure can be readily computed for a large number of countries,firms, industries, and years. Indeed, in the UNIDO database we do not havesufficient investment data for South African industries to be able to compute thecapital stock.

Competition and Productivity Growth in South Africa 12
and Net Income Equity, their Gross-Margin, Market to Book Ratio,and Price-Earnings Ratios are markedly lower - see the results of Ta-ble 4. These patterns do not show systematic variation in time - seethe results of Table 5. These differences are in general statisticallysignificant and robust to controlling for total and per capita GDP.In Table 6 we report separately the median net income over sales
ratio for those firms that have a size (based on sales) above and belowthe median within each industry-country-year cluster. In most sectorsthere is no significant difference between large and small firms neitherin South Africa nor in the world as a whole - see the results reportedin Table 6. In particular, there is no evidence that large firms in SouthAfrica are relatively more profitable than small ones, at least in thecorporate sector. The profitability of large firms until the mid-90s usedto be around 10% lower than that of small firms. Since the late 1990sthis pattern has reversed with particular strength in South Africa -see Table 6. In the first half of the 2000s large firms in South Africaappear with ratios that are around 50% higher than those of smallfirms after controlling for what happened in the world. nor is theresignificant variation between large and small firms in the sample - seeTable 6.INSERT TABLE 7 ABOUT HERE.Finally, we compare the aggregate industry price-cost margins in
the manufacturing sector, as computed for the UNESCO industry database with that of the listed firms in the Worldscope data set. Price-cost margin is defined as value added over output for the industryaggregates and as operating income over sales for listed firms. Resultsare reported in Table 7. The ratio between the margins for listedfirms and all firms is about twice as large in South Africa as in theworld as a whole. The difference is observed across virtually all thesectors, although is especially large in Tobacco, Furniture and ElectricMachinery.

Competition and Productivity Growth in South Africa 13
4.3. Industry-level panel data results from the TIPS database
In this section we explore both average manufacturing industrymark-ups, as well as industry level mark-ups in terms of the method-ology outlined by section 3..4 For the average manufacturing sectormark-up we employ the pooled mean group dynamic heterogeneouspanel estimation methodology of Pesaran, Shin and Smith (1999),5
thus controlling for both industry effects and dynamic adjustment toequilibrium over time. For individual sectors, estimation is by meansof the cointegration-consistent ARDL methodology of section 8.0.2..In Table 8 we report the PMGE results for the manufacturing
sectors given by the specification:
NSRit = γ0i + γ1ROEGERit + εit (6)
where ROEGERit = αit · [∆ (w + l)−∆ (r + k)]
with αit denoting the share of labour in value-added of sector i,∆ (w + l)itthe log change in nominal labour cost for sector i, ∆ (r + k)it the logchange in total capital stock for sector i, andNSRit the nominal Solowresidual. γ1 now measures (μ− 1), where μ = P/MC is the mark-up.6
INSERT TABLE 8 ABOUT HERE.4We also computed the magnitude of the mark-up. Rearrangement of equation
(14) gives:
μ− 1 = ∆(p+ q)− α∆(w + l)− (1− α)∆(r + k)
α[∆(w + l)− (r + k)](5)
allowing for ready computation of the mark-up. Given the noise, and other sys-tematic components of the Solow residual, the series requires smoothing. Weemployed both moving average and Hodrick-Prescott filter smoothing, and splitthe full sample period into several overlapping ten-year sub-periods and calculatethe average computed mark-up for each sub-period as a moving average. Thegeneral trend structure to emerge is broadly consistent with that reported for theestimated results, though they prove subject to greater volatility.
5See also the discussion in Fedderke (2004). The Estimation MethodologyAppendix (section 8.) provides the detail.
6See the discussion in section 7. for the derivation of this specification.

Competition and Productivity Growth in South Africa 14
Results are for the average manufacturing sector mark-up, bothover the full sample period, as well as rolling decade-long sub-periods,estimated from the TIPS panel data set. Results indicate the presenceof an aggregate mark-up for the manufacturing sector over the fullsample period of 54%. The error-correction term (the φ-parameter),indicates that adjustment to the long-run equilibrium is rapid. TheHausman test statistic accepts the inference of an homogenous mark-up across all manufacturing sectors for the long run specification.The declining trend in the aggregate manufacturing sector mark-up
reported by Edwards and Van Tijl (2005) does not prove to be robustin our estimates - and appears to be drive largely by the relativelylow estimate that emerges for the 1991-2000 sub-sample period. Bothprior, and subsequent sample periods report higher mark-ups, sug-gesting that evidence of declining pricing power in the South Africaneconomy is not robust. More plausible is that the evidence is of astable and non-declining level of pricing power, consistent with thefirm-level evidence reported in section 4.2..INSERT TABLE 9 ABOUT HERE.For the sectoral evidence, we note that regressors are almost with-
out exception stationary. Table 9 reports relevant ADF test statistics.ARDL remains an appropriate estimation strategy (with efficiencygains over OLS in the presence of dynamics). In Table 10 we reportthe individually estimated three digit manufacturing sector mark-upestimates obtained from the PSS ARDL cointegration estimations.7
Again, estimated mark-ups are reported both for the full sample pe-riod, as well as for rolling decade-long sub-periods.INSERT TABLE 10 ABOUT HERE.The mark-up is consistently statistically significant across all 3-
digit manufacturing sectors.8 Consistent with the aggregate evidence
7For details, see the explanation contained in the estimation methodology ap-pendix, section 8.0.2..
8Standard errors and diagnostics for the full sample period estimation are con-sistently statistically sound with the exception of the Glass and Glass Productssector. Full results available from the authors on request.

Competition and Productivity Growth in South Africa 15
for the average mark-up in the manufacturing sector as a whole, theevidence suggests that mark-ups in manufacturing industry have in-creased rather than decreased toward the end of the sample period.In Table 11 we summarize by placing sectors into six main categories:high mark-ups that either decline, rise or stay the same into thelast within-sample decade (1995-2004); or low mark-ups that eitherdecline, rise or stay the same into the last within-sample decade (1995-2004). We find that for 16 sectors the mark-up increases, for seven itdeclines, while for four sectors there is little change.INSERT TABLE 11 ABOUT HERE.As a final consistency check of our results, given the potential for
excessive volatility in the Solow residual, we computed the alternativemeasure of pricing power provided by the proxy for the Lerner indexgiven by equation (3). Results are reported by three digit manufac-turing sector, and by ten year sample sub-period in Table 12. Con-sistent with the remainder of the results reported thus far, the resultsconsistently indicate a non-declining pricing power in South Africanmanufacturing industry.9
INSERT TABLE 12 ABOUT HERE.
5. Market competition, productivity growth and employ-ment in SA
The objective of this section is to explore the impact of the in-tensity of competition on productivity growth in the South Africanmanufacturing sector. We find that pricing power in South Africanindustry is associated with lower productivity growth, and with loweremployment in South African manufacturing. Results prove to berobust across:
• Three distinct data sets, covering both industry level data aswell as firm-level evidence.
9The sole exceptions are Printing, Plastics and Other transport equipment.

Competition and Productivity Growth in South Africa 16
• Two proxies of the Lerner index, given either by the differentialbetween value added and the total wage bill as a proportion ofoutput, or the difference between output and both wage andcapital costs as a proportion of output.
5.1. Competition and growth, using the industry-level (UNIDO) andfirm-level (Worldscope) panel data
We deal with the difference between average and marginal costsby estimating the relationship between growth and margins using thetime variation in margins within each industry or sector. We estimateequation (1) such that:
Pgrowthit = α+ βPCM1it−1 + Ii + It + εit,
such that Pgrowthit is given by average labor productivity growth insector i at time t, PCMit−1 is the lagged average mark-up in sector i,as computed in equation (2).We present results referred to the world as a whole and to South
Africa alone. In the world regressions we add the specification coun-try indicators. The observations are not assumed to be independentwithin each country and year, so that we compute significance lev-els using errors that are clustered at the country and year level. Ifcompetition spurs innovation and growth, we would expect a negativecoefficient for PCM.This specification allows us to shield the results from either indus-
try or firm characteristics that may affect measured price-cost marginsbut that are nonetheless not related to the degree of competition itfaces. One such characteristic is the fact that the divergence betweenmarginal and average costs may differ across industries due to differ-ential economies of scale. Another possibility is that the exclusion offinancial costs from the PCM measure may have a differential effectacross industries sorted on capital intensity. If for some reason laborproductivity growth is correlated with these characteristics, estima-tion using cross-industry data will suffer from omitted variable bias.

Competition and Productivity Growth in South Africa 17
However, as long as these characteristics do not vary systematically intime, the approach we propose solves the issue.We also run firm-level regressions not controlling for firm fixed
effects but only for industry fixed effects. In this case part of thevariation comes from the difference of PCMs across firms and notonly in time within firms.Tables 13 and 14 present the basic results using industry and firm-
level data, respectively. In the first and fourth columns of Table 13we use aggregates for the entire manufacturing sector. In the rest ofthe columns we use the variation of the 27 different manufacturingindustries. Columns one through three correspond to the estimationover the data for the full set of 115 countries in the UNIDO data set,while the rest use data for South Africa alone.INSERT TABLES 13 AND 14 ABOUT HERE.The results very strongly suggest that there is a positive effect of
product market competition on productivity growth. All the coeffi-cients for margins are negative and statistically significant at conven-tional values. The economic magnitude of the effect is also very large.A 10% increase from the mean margin of 0.24 on the 115-country sam-ple implies a decrease in productivity growth of 2.4% per year. Forthe typical industry this would mean reducing growth from 2.6% ayear to a mere 0.2%. A similar change on margins in South Africa isassociated with a decline of 1.6% per year, which would reduce themedian growth from 1% to -0.6%.Figures 1 and 2 depict graphically the relationship between mar-
gins and productivity found in the aggregate and the industry-leveldata. It is clear from these that the relationship is not driven byinfluential outliers but is a robust pattern in the data.INSERT FIGURES 1 AND 2 ABOUT HERE.Table 14 presents results with firm (columns one through three
and seven through nine) and industry fixed effects (the rest of thecolumns) for a sample of 56 countries (left panel) and South Africaalone (right panel). As in the industry data, the coefficient for thePCM is in all cases negative and very significant in statistical terms,

Competition and Productivity Growth in South Africa 18
both on average across countries and in South Africa in particular.The economic magnitude of the effect is somewhat larger that whatwe found in the industry data. Here a 10% increase in margins (overthe mean of 0.11 for the 56-country sample and 0.12 for South Africa)is associated with a decrease in productivity growth of 3.3% in the56-country sample and 2.4% in South Africa. Again, these are veryrelevant magnitudes since the median productivity growth rate is 1.2%and 1.8% in each sample.The results are virtually unchanged when we include the financial
costs into cost (see columns 2, 5, 8, and 11).Interestingly, the relationship between margins and productivity
although negative on average, is U-shaped. These results are in linewith Aghion et al (2005)´s theoretical predictions and extend theirresults for patenting activity by British publicly-listed firms.INSERT TABLE 15 ABOUT HERE.Even if we use lagged margins and control for industry and year
fixed effects, the results above may still be due to spurious correlation.In particular, our computed margins may be caused to some extentby shocks to productivity growth. We attempt to control for thisendogeneity by instrumenting margins with industry import penetra-tion, which is assumed to affect productivity only through their effecton product market competition. Import penetration is computed foreach industry, country, year observation as total imports over output.The raw data are taken from Mayer and Zignano (2005). Table 15shows that import penetration is not a particularly good instrumentfor margins in the sense that its correlation with margins is typicallynot significantly negative. Not surprisingly, then, the second-stageIV estimates of the effect of margins on productivity growth are alsotypically not significantly negative. However, in the case that importpenetration appears to be a good instrument (firm-level, all coun-tries sample in column three) the IV estimate of the effect of margins—although smaller than before- enters negative and statistically signif-icant. This suggests that at least part of the relation between marginsand growth is caused by margins affecting growth and not the other

Competition and Productivity Growth in South Africa 19
way around.We experimented with some other instruments such as the opening
of the economy to trade, the degree of tradability of the industry, andthe level of tariffs. In each case the results were similar to thosereported in Table 15. The instruments are not particularly good, andthe IV estimate of the coefficient of margins on growth typically entersnegatively but not significantly so.
5.2. Competition, growth and employment using the industry-levelpanel data from the TIPS database
Given the discussion of section ??, we estimate equation (1) suchthat:
Pgrowthit = α+ βPCM2it + Ii + εit
where Pgrowthit is the Solow residual in sector i at time t, PCM2 isthe proxy for the Lerner index as given by equation (3), and Ii standsfor industry fixed effects.INSERT TABLE 16 ABOUT HERE.Table 16 reports results both for the manufacturing industry aver-
age (under the PMGE coefficient), as well as for individual industries(under the MGE coefficients).The Hausman test statistic confirms the inference of an homoge-
nous mark-up across all manufacturing sectors for the long run spec-ification. The error-correction term (the φ-parameter), indicates thatadjustment to the long-run equilibrium is rapid.The PMGE coefficient of −0.10 coefficient means that on average
across all manufacturing sectors, a 0.1 unit increase in LPROXY isassociated with a 1% reduction in the real growth rate as measuredby growth in total factor productivity. For individual industries, thegeneral finding of a negative impact of the proxy for the industryspecific Lerner index on sectoral productivity growth is confirmed.We also explored the impact of competitive pressure on employ-
ment. Thus we estimated:
Lit = α+ βPCM2it + Ii + εit

Competition and Productivity Growth in South Africa 20
where Lit denotes employment in sector i at time t, and PCM2 is theproxy for the Lerner index as given by equation (3).INSERT TABLE 17 ABOUT HERE.Table 17 reports results both for the manufacturing industry aver-
age (under the PMGE coefficient), as well as for individual industries(under the MGE coefficients).Once again the Hausman test statistic confirms homogeneity across
industry groups, though in the instance of employment adjustment tolong run equilibrium, is relative slow (see the error-correction termgiven by the φ-parameter).The economic interpretation is that a 0.1 unit increase in LPROXY
results in a reduction in employment of 3400 workers. For individualindustries, the general finding of a negative impact of the industryspecific Lerner index proxy on sectoral employment is confirmed.
5.3. Labour flexibility
As a final empirical contribution in this paper, we explore the linkbetween industry mark-ups and the flexibility of labour markets.The theory relating productivity residuals to the mark-up is based
on a first-order Taylor approximation (in logs) of the primal and dualSolow residuals. This is appropriate when estimating the steady-statemark-up. However it does not allow for the investigation of cycli-cal effects which are second-order. An adaptation of a result derivedby Oliviera Martins and Scarpetta (1999) shows us that under thecondition of a two-input production function (we ignore intermediateinputs) and with Hicks neutrality in technical progress, the equationfor the variable mark-up is given by:
∆ logμ = (∆q +∆p)−∆w +
µ1
σ− 1¶μ(1− α)∆k (7)
−1σ
L
L− Lμ(1− α)∆l − μα∆l
where σ denotes the elasticity of substitution between capital and

Competition and Productivity Growth in South Africa 21
labour, μ the steady-state mark-up and L the amount of labour de-voted to fixed costs.The L
L−L term, representing the ratio of labour employed to theproportion of total labour employed which is variable, can be inter-preted as an indicator of the degree of downward rigidities in adjust-ments of labour time. The feasible range is from unity (no rigidity) toinfinity (complete rigidity).Rearrangement of (7) provides the following expression:
LF =1
1− α
µ∆ logμ− ((∆q +∆p)−∆w)
μ− α∆l
¶(8)
=
µ1
σ− 1¶∆k − 1
σ
L
L− L∆l
which leads to the specification that is estimated and discussed below.In order to econometrically investigate the relationship between the
mark-up and labour adjustment, equation (8) suggests a specificationof the form:
yit = β0i + β1∆kit + β2∆lit + εit (9)
where yit =1
1− αit
µ∆ logμit − ((∆q +∆p)it −∆wit)
μi− αit∆lit
¶under the now standard notation.Two of the required variables are not available directly from the
original panel data set: the steady-state mark-up and the growth rateof the mark-up. We use the mark-up that was estimated over thefull sample period under the Hall-Roeger methodology in section 4.3.as the steady-state mark-up for each sector, and use the smoothedcomputed mark-up series to calculate the growth rate of the mark-upfor each sector.A simple manipulation of coefficient estimates allows us to obtain
an estimate of the labour flexibility coefficient, LL−L . We use
cβ1 toobtain an estimate of the elasticity of substitution between capital andlabour as in equation (10). Then we use cβ2 along with the estimate

Competition and Productivity Growth in South Africa 22
of the elasticity of substitution to obtain an estimate of the labouradjustment coefficient as in equation (11).
cβ1 = µ1bσ − 1¶⇒ bσ = 1cβ1 + 1 (10)
cβ2 = 1bσ dLL− L
⇒dL
L− L= bσcβ2 = cβ2cβ1 + 1 (11)
Under circumstances in whichcβ1 is not significantly different fromzero, we infer an elasticity of substitution of unity in the calculation ofthe labour adjustment coefficient as this follows directly fromcβ1 = 0.Note that when we calculate the labour adjustment coefficient, the“correct” elasticity of substutition is defined to be bσ as in (11) ifcβ1 issignificantly different from zero, and else as unity.Recall that L
L−L → 1 implies perfect flexibility of the labour mar-ket, while L
L−L →∞ implies inflexibility.INSERT TABLE 18 ABOUT HERE.We report the PMGE results for the manufacturing sector in Ta-
ble 18. The error-correction term, the φ-parameter, indicates thatadjustment to the long-run equilibrium is rapid, and increasing withan increase in the adopted lag structure. The Hausman test acceptsthe inference of an homogenous labour adjustment coefficient acrosssectors for the long run.Results indicate an estimate of an aggregate labour adjustment
coefficient for the manufacturing sector over the full sample period ofbetween 2.84 and 3.43, depending on which lag structure is adopted.This would suggest that of the total labour employed in manufacturingin South Africa, two-thirds is effectively allocated to fixed costs andonly one-third is attributable to variable costs.In order to investigate the trend of the aggregate manufacturing
sector labour adjustment coefficient over time, we run the estimation ofour specification on fifteen-year sub-periods and roll these through thefull sample period year-by-year. The results are reported in Table 19.

Competition and Productivity Growth in South Africa 23
The general pattern that emerges is a decreasing labour adjustmentcoefficient through the first half of the sample followed by an increasinglabour flexibility coefficient in the second half of the sample.INSERT TABLE 19 ABOUT HERE.The inference is thus of increasing flexibility in the adjustment
of labour time in the first half of the sample, which is substantiallyreversed in the second half of the sample period.
6. Conclusion
In this paper we have explored three alternative panel data sets tofirst assess the degree of product market competition in South Africanmanufacturing industries, and then to estimate the effect of productmkarket competition on growth and employment. Consistently acrossthe three data set, we found that: (i) mark-ups remain significantlyhigher in SA industries than in corresponding industries worldwide;(ii) that a reduction in mark-ups (that is, an increase in product mar-ket competition) should have large positive effects on productivitygrowth and employment in South Africa.The analysis in this paper can be extended in several interesting
direction. A first extension is to push further on the search for goodinstruments for product market competition. A second extension is tolook for entry data and perform the same kind of comparative analysisof entry measures and regression analysis of entry and growth as whatwe did for mark-ups in this paper. A third extension is to look at theservice sector. These and other extensions of the paper shall await forfurther research.

Competition and Productivity Growth in South Africa 24
7. Estimation of Mark-ups Methodology Appendix
Under the assumption of constant returns to scale, the primal com-putation of the Solow Residual (SR), or growth in Total Factor Pro-ductivity (TFP ), is related to the mark-up of prices over marginalcost. Hall (1990) demonstrates that:
TFP = SR = ∆q − α ·∆l − (1− α) ·∆k
= (μ− 1) · α · (∆l −∆k) + θ (12)
where μ = P/MC, with P denoting price, andMC denoting marginalcost. Under perfect competition μ = 1, while imperfectly competitivemarkets allow μ > 1. ∆ denotes the difference operator, lower casedenotes the natural log transform, q, l, and k denote real value-added,labour, and capital inputs, α is the labour share in value-added, and
θ =•A/A denotes exogenous (Hicks-neutral) technological progress,
where is A is the technology parameter.Estimation of equation (12) faces the difficulty that the explana-
tory variables (∆l −∆k) will themselves be correlated with the pro-ductivity shocks θ, and hence result in bias and inconsistency in es-timates of μ. One solution is to instrument.10 Unfortunately instru-mentation for the US has led to the estimation of mark-ups that aregenerally implausibly high.An alternative approach to avoid the endogeneity bias and instru-
mentation problems has been suggested by Roeger (1995). By com-puting the dual of the Solow Residual (DSR), we can again obtain a
10This in turn raises the requirement that the instruments are correlated withthe factor inputs, but not technological change and hence the error term (θ). Inthe case of applications to the US, instruments employed have been pure aggregatedemand shifters. In particular, the variables employed have been aggregate realGDP, military expenditure, the world oil price, and the political party of thepresident. See for instance Hall (1990) and the discussion in Oliveira Martins andScarpetta (1999).

Competition and Productivity Growth in South Africa 25
relation of the price-based productivity measure to the mark-up:
DSR = α ·∆w − (1− α) ·∆r −∆p
= (μ− 1) · α · (∆w −∆r) + θ (13)
with w, r denoting the natural logs of the wage rate and rental priceof capital respectively. While equation (13) is subject to the sameendogeneity problems and hence instrumentation problems as equa-tion (12), Roeger’s insight was that subtraction of equation (13) fromequation (12) would give us the nominal Solow residual (NSR), givenby:
NSR = ∆ (p+ q)− α ·∆ (w + l)− (1− α) ·∆ (r + k)
= (μ− 1) · α · [∆ (w + l)−∆ (r + k)] (14)
in which the productivity shocks (θ) have cancelled out, removing theendogeneity problem, and hence the need for instrumentation. Themark-up is now accessible either to simple OLS estimation, or to directcomputation.Extensions of the framework for identifying the extent of mark-up
pricing provided by equation (14), include relaxing the assumption ofconstant returns to scale, incorporating the impact of business cycles,import and export competition, market structure, and the use of al-ternative measures of output. Any estimate of mark-up that followsfrom Solow Residuals should be interpreted as lower-bound values ifincreasing returns to scale are present.11 Since tariff and other restric-tions clearly carry implications for the degree of international compe-tition to which domestic industry is exposed, and hence the magnitudeof the feasible mark-up that domestic industry can maintain, import
11Specifically, one can show that where the assumption of constant returns toscale is dropped, equation (14) is actually:
NSR =³μλ− 1´· α · [∆ (w + l)−∆ (r + k)]
where λ > 1 denotes increasing returns to scale. Effectively equation (14) assumesλ = 1. See Oliviera Martins and Scarpetta (1999).

Competition and Productivity Growth in South Africa 26
and export competition is relevant to the pricing power of industry.12
Market structure similarly carries implications for competitive pres-sure and hence pricing behaviour in markets.13 Finally, both cyclicalfluctuations and the use of gross output accounting for intermediateinpus, or value added in the absence of intermediate inputs carriesimplications for the magnitude of the mark-up.14
8. Estimation Methodology Appendix
8.0.1. The Panel Estimator: Pooled Mean Group Estimator
Consider the unrestricted error correction ARDL(p, q) representa-tion:
∆yit = φiyi,t−1 + β0ixi,t−1 +
p−1Xj=1
λij∆yi,t−j +
q−1Xj=0
δ0ij∆xi,t−j + μi + εit,(15)
where i = 1, 2, ..., N, t = 1, 2, ..., T , denote the cross section units andtime periods respectively. Here yit is a scalar dependent variable, xit(k × 1) a vector of (weakly exogenous) regressors for group i, and μirepresents fixed effects. Allow the disturbances εit’s to be indepen-dently distributed across i and t, with zero means and variances σ2i> 0, and assume that φi < 0 for all i. Then there exists a long-runrelationship between yit and xit:
yit = θ0ixit + ηit, i = 1, 2, ..., N, t = 1, 2, ..., T, (16)
where θi = −β0i/φi is the k × 1 vector of the long-run coefficients,and ηit’s are stationary with possibly non-zero means (including fixedeffects). This allows equation (15) to be written as:
∆yit = φiηi,t−1 +
p−1Xj=1
λij∆yi,t−j +
q−1Xj=0
δ0ij∆xi,t−j + μi + εit, (17)
12See the discussion in Hakura (1998), and the extensions and empirical appli-cation in Fedderke, Kularatne and Mariotti (2006).13See the discussion in Fedderke, Kularatne and Mariotti (2006).14See Oliviera Martins and Scarpetta (1999).

Competition and Productivity Growth in South Africa 27
where ηi,t−1 is the error correction term given by equation (16), andthus φi is the error correction coefficient measuring the speed of ad-justment towards the long-run equilibrium.This general framework allows the formulation of the PMGE, which
allows the intercepts, short-run coefficients and error variances to dif-fer freely across groups, but the long-run coefficients to be homoge-nous; i.e. θi = θ ∀ i. Group-specific short-run coefficients andthe common long-run coefficients are computed by the pooled max-imum likelihood estimation. Denoting these estimators by φ̃i, β̃i,
λ̃ij, δ̃ij and θ̃, we obtain the PMG estimators by φ̂PMG =Ni=1 φ̃iN
,
β̂PMG =Ni=1 β̃iN
, λ̂jPMG =Ni=1 λ̃ijN
, j = 1, ..., p − 1, and δ̂jPMG =Ni=1 δ̃ijN
, j = 0, ..., q − 1, θ̂PMG = θ̃.PMGE provides an intermediate case between the dynamic fixed
effects (DFE) estimator which imposes the homogeneity assumptionfor all parameters except for the fixed effects, and the mean group es-timator (MGE) proposed by Pesaran and Smith (1995), which allowsfor heterogeneity of all parameters. It exploits the statistical power of-fered by the panel through long-run homogeneity, while still admittingshort-run heterogeneity.The crucial question is whether the assumption of long-run homo-
geneity is justified, given the threat of inefficiency and inconsistencynoted by Pesaran and Smith (1995). We employ a Hausman (1978)test (hereafter h test) on the difference between MG and PMG es-timates of long-run coefficients to test for long run heterogeneity.15
Note that as long as the homogeneity Hausman test is passed in ourestimations, we report only PMG estimation results.16
Finally, it is worth pointing out that a crucial advantage of theestimation approach of the present paper, is that the dynamics of
15An alternative is offered by Log-Likelihood Ratio tests. However, the finitesample performance of such tests are generally unknown and thus unreliable. Wetherefore employ the h-test instead.16The authors thank Yongcheol Shin for the provision of the appropriate GAUSS
code for estimation purposes.
Competition and Productivity Growth in South Africa 28
adjustment in the mark-up are explicitly modelled, while recognizingthe presence of a long run equilibrium relationship underlying the dy-namics. Thus the justification for the use of the PMG estimator isthat it is consistent both with the underlying theory of a homoge-nous long-run mark-up of price over marginal cost relationship andthe possibly heterogeneous dynamic time series nature of the data.As long as sector-homogeneity is assured, the PMGE offers efficiencygains over the MGE, while granting the possibility of dynamic hetero-geneity across sectors unlike the DFE estimator. In the presence oflong run homogeneity, therefore, our preference is for the use of thePMGE.
8.0.2. The ARDL Approach to Cointegration
Pesaran, Shin and Smith (1996, 2001) (hereafter PSS) advocatethe use of autoregressive distributed lag models for the estimation oflong run relations.17 The PSS bounds testing approach proceeds byestimating the error correction model given by:
yt = α0 +
pXi=1
βi∆yt−i +kX
j=1
pXi=1
γji∆xj,t−i +
⎛⎝δ1yt−1 +kX
j=1
δj+1xj
⎞⎠ (18)
Tests of significance of joint zero restrictions on the δ0s of the errorcorrection model establish the presence of a long run relationship,and its directionality. Confirmation of a unique long run relationshipallows for estimation in a two step strategy, selecting the ARDL orderson the basis of the Akaike Information criterion (AIC), then estimatingthe long and short run coefficients on the basis of the selected model.Estimation of the long run relationship yt = ζ + ηt+ θxt + νt can beshown to be feasible on the basis of the “Bewley regression:”
yt = ζ + ηt+kXi=1
θixi +
p−1Xj=0
γj∆yt−j +
q−1Xm=0
δm∆xt−m (19)
17See also the discussion in Pesaran (1997).

Competition and Productivity Growth in South Africa 29
by the instrumental variables method, where 1, t,Pk
i=1 xi,Pp−1
j=0∆yt−j,Pq−1m=0∆xt−m, serve as instruments,.18
18The mthodology outlined presumes that the xi and are uncorrelated. Wherethey are correlated, the methodology remains valid, but the “Bewley regression”requires augmentation.

Competition and Productivity Growth in South Africa 30
References
Aghion, P., Bloom, N., Blundell, R., Griffith, R., and Howitt, P.,2005, Competition and Innovation: An Inverted-U Relationship,Quarterly Journal of Economics, 120(2), 701-728.
Blundell, R., Griffith, R. and J. Van Reenen (1995), “Dynamic CountData Models of Technological Innovation”, Economic Journal, Vol.105, March 1995, 333-344
Blundell, R., Griffith, R. and J. Van Reenen (1999), “Market Share,Market Value and Innovation in a Panel of British ManufacturingFirms”, Review of Economic Studies, vol. 66, 529-554.
Fedderke, J.W., 2004, Investment in Fixed Capital Stock: testing forthe impact of sectoral and systemic uncertainty, Oxford Bulletin ofEconomics and Statistics, 66(2), 165-87.
Fedderke J.W., Kularatne, C., and Mariotti, M., 2006, Mark-up Pric-ing in South African Industry, Journal of African Economies,forthcoming.
Hakura, D.S., 1998, The Effects of European Economic Integration onthe Profitability of Industry, International Monetary Fund Work-ing Paper WP/98/85.
Hall, R.E., 1988, The Relation between Price and Marginal Cost inUS Industry, Journal of Political Economy, 96(5), 921-47.
Hall, R.E., 1990, The Invariance Properties of Solow’s ProductivityResidual, in P. Diamond (Ed..) Growth, Productivity, Unemploy-ment, Cambridge MA: MIT Press.
Hausman, J.A., 1978, Specification tests in economics, Econometrica,46, 1251-70.
Nickell, S. (1996) “Competition and Corporate Performance”, Journalof Political Economy, 104:4, 724-746

Competition and Productivity Growth in South Africa 31
Oliveira Martins, J., and Scarpetta, S., 1999, The Levels and CyclicalBehaviour of Mark-ups Across Countries and Market Structures,OECD Economics Department Working Papers No. 213.
Pesaran, M.H., 1997, The Role of Economic Theory in Modelling theLong Run, Economic Journal, 107, 178-91.
Pesaran, M.H. and Smith, R., 1995, Estimating Long-Run Relation-ships from Dynamic Heterogeneous Panels, Journal of Economet-rics, Vol. 68, pp. 79-113.
Pesaran, M.H., Shin, Y. and Smith, R.J., 1996, Testing for the ex-istence of a long run relationship, DAE Working Paper No.9622,Department of Applied Economics, University of Cambridge.
Pesaran, M.H., Shin, Y. and Smith, R., 1999, Pooled Mean Group Es-timation of Dynamic Heterogeneous Panels, Journal of the Amer-ican Statistical Association, Vol. 94, pp. 621-634.
Pesaran, M.H., Shin, Y., and Smith, R.P., 2001, Bounds testing ap-proaches to the analysis to the testing of level relationships, Jour-nal of Applied Econometrics, 16, 289-326.
Roeger, W., 1995, Can Imperfect Competition explain the Differencebetween Primal and Dual Productivity Measures? Estimates forUS Manufacturing, Journal of Political Economy, 103, 316-30.

Table 1: Three Digit Manufacturing Sectors Included in Study Food Beverages Tobacco Textiles Wearing apparel Leather & leather products Footwear Wood & wood products Paper & paper products Printing, publishing & recorded media Coke & refined petroleum products Basic chemicals Other chemicals Plastic products
Rubber products Glass & glass products Non-metallic minerals Basic iron & steel Basic non-ferrous metals Metal products excluding machinery Machinery & equipment Electrical machinery Television & other communications equipment Professional equipment Motor vehicles, parts & accessories Other transport equipment Furniture Other manufacturing industry
Table 2: Standard deviations of computed mark-ups across subperiods
1971-1980
1975-1984
1981-1990
1985-1994
1991-2000
1995-2004
Food 0.54 0.23 0.14 0.13 1.26# 1.30# Beverages 5.00 3.70 1.68 1.63 1.00 3.52 Tobacco 10.64 8.31 8.22 14.16 19.92 259.31# Textiles 1.91 0.21 0.52 0.50 1.37# 2.39# Wearing apparel 0.18 0.10 0.29 0.27 9.49# 9.67# Leather & leather products 0.08 0.09 0.10 0.11 1.47# 3.42# Footwear 0.06 0.04 0.12 0.15 3.40# 3.85# Wood & wood products 0.67 0.41 0.64 0.62 1.99# 1.95# Paper & paper products 0.51 0.39 11.34 11.33 4.04 4.30 Printing, publishing & recorded media 0.20 0.09 0.63 0.60 2.20# 2.15# Coke & refined petroleum 11.47 2.74 7.31 8.39 44.10# 42.85# Basic chemicals 1.38 0.45 0.41 0.36 2.04# 3.57# Other chemicals & man-made fibers 0.63 0.28 0.61 0.59 1.78# 8.69# Rubber products 0.29 0.13 0.23 0.24 2.41# 6555.49# Plastic products 0.83 0.71 5.01 5.00 1.28 4.00 Glass & glass products 0.16 0.11 0.49 0.49 0.76 7.70# Non-metallic minerals 0.54 0.29 4.25 4.23 3.71 4.39 Basic iron & steel 1.01 0.22 0.14 0.12 1.44# 6.33# Basic non-ferrous metals 1.10 0.63 0.97 0.94 13.78# 18.53# Metal products excluding machinery 0.21 0.14 0.65 1.22 1.19 2.33# Machinery & equipment 0.69 0.26 0.43 0.41 1.96# 2.10# Electrical machinery & apparatus n/a n/a n/a n/a n/a n/a Television, & communications equipment 0.53 0.47 7.79 8.70 9.44 8.53 Professional & scientific equipment 0.96 0.93 0.39 0.91 2.05# 4.76# Motor vehicles, parts & accessories 0.20 0.17 2.21 2.24 19.30# 20.27# Other transport equipment 2.39 1.12 1.05 1.35 5.56# 5.76# Furniture 0.55 0.54 0.31 0.32 1.61# 1.67# Other manufacturing 1.97 1.94 1.74 1.92 1.89 2.95#

Table 3: South African UNIDO Industry Data: Price-Cost Margins and Labor Productivity Growth
IndustryPC Margin Prod Growth PC Margin Prod Growth PC Margin Prod Growth PC Margin Prod Growth PC Margin Prod Growth
Beverages 0.359 0.0075 0.364 0.0263 0.373 0.0700 0.377 0.0656 0.361 0.0487Fabricated metal products 0.222 0.0062 0.211 0.0084 0.212 0.0348 0.216 0.0256 0.215 0.0318Food products 0.170 -0.0048 0.167 0.0090 0.180 0.0439 0.190 0.0534 0.182 0.0223Footwear, except rubber or plastic 0.234 0.0210 0.216 0.0104 0.192 0.0341 0.197 -0.0139 0.186 0.0303Furniture, except metal 0.228 0.0229 0.212 0.0021 0.216 0.0232 0.210 0.0398 0.206 0.0528Glass and products 0.275 0.0452 0.265 0.0168 0.285 0.0393 0.300 0.0646 0.290 0.0423Industrial chemicals 0.255 -0.0049 0.231 0.0288 0.255 0.0454 0.250 0.0597 0.255 0.0214Iron and steel 0.189 0.0372 0.186 0.0267 0.214 0.0577 0.219 0.0345 0.193 0.0047Leather products 0.204 0.0093 0.197 0.0134 0.180 0.0322 0.189 0.0326 0.159 0.0128Machinery, electric 0.230 0.0133 0.239 0.0339 0.236 0.0523 0.240 0.0457 0.230 0.0615Machinery, except electrical 0.233 0.0148 0.226 0.0148 0.223 0.0457 0.235 0.0563 0.209 0.0214Misc. petroleum and coal products 0.209 0.0388 0.196 -0.0136 0.222 0.0422 0.231 0.0629 0.204 0.0241Non-ferrous metals 0.198 0.0283 0.188 0.0047 0.200 0.0570 0.198 0.0612 0.182 0.0027Other chemicals 0.256 0.0174 0.259 0.0265 0.259 0.0454 0.275 0.0489 0.285 0.0401Other manufactured products 0.266 0.0244 0.244 -0.0005 0.227 0.0024 0.223 0.0271 0.239 0.0487Other non-metallic mineral products 0.277 0.0306 0.266 0.0172 0.284 0.0561 0.285 0.0339 0.282 0.0334Paper and products 0.226 0.0229 0.206 0.0156 0.215 0.0697 0.222 0.0591 0.217 0.0107Petroleum refineries 0.191 0.0289 0.168 -0.0233 0.239 0.0725 0.272 0.0158 0.237 0.0240Plastic products 0.246 0.0115 0.236 0.0203 0.237 0.0495 0.237 0.0515 0.230 0.0350Pottery, china, earthenware 0.300 0.0201 0.278 0.0054 0.293 0.0482 0.284 0.0365 0.295 0.0205Printing and publishing 0.265 0.0187 0.244 0.0047 0.246 0.0470 0.254 0.0668 0.244 0.0513Professional & scientific equipment 0.269 0.0086 0.266 0.0350 0.268 0.0577 0.257 -0.0041 0.250 0.0433Rubber products 0.224 0.0327 0.233 0.0168 0.231 0.0257 0.237 0.0741 0.239 0.0203Textiles 0.213 0.0141 0.204 0.0097 0.211 0.0395 0.225 0.0411 0.202 0.0244Tobacco 0.396 0.0058 0.426 0.0477 0.464 0.0823 0.478 0.0329 0.419 0.0691Transport equipment 0.198 0.0156 0.189 0.0193 0.190 0.0430 0.192 0.0932 0.189 0.0678Wearing apparel, except footwear 0.205 0.0175 0.197 -0.0010 0.182 0.0286 0.206 0.0215 0.207 0.0226Wood products, except furniture 0.233 0.0298 0.214 -0.0042 0.213 0.0456 0.223 0.0526 0.213 0.0197
Total manufacturing 0.224 0.0198 0.212 0.0155 0.231 0.0437 0.242 0.0449 0.233 0.0445
1996-20001976-80 1981-85 1986-90 1991-95

Table 4: Firm Level (Worldscope) Evidence on Profitability: The Level of Profitability Employing Alternative Measures of Firm Profitability by Three Digit Manufacturing Industry
Net Income/Sales Net Income/Assets Net Income/Equity Gross Margin Market to Book Assets Price/Earnings Ratio
ZAF World Diff ZAF World Diff ZAF World Diff ZAF World Diff ZAF World Diff ZAF World DiffAPPAREL 0.036 0.032 0.004 0.056 0.037 0.020 0.099 0.090 0.009 0.131 0.288 -0.157 0.84 1.11 -0.27 5.81 9.57 -3.76AUTOMOTIVE 0.032 0.021 0.011 0.054 0.024 0.029 0.113 0.076 0.037 0.096 0.196 -0.099 0.79 1.10 -0.31 6.59 11.55 -4.96BEVERAGES 0.063 0.046 0.017 0.078 0.041 0.037 0.148 0.094 0.053 0.189 0.392 -0.203 1.15 1.31 -0.16 9.63 15.46 -5.83CHEMICALS 0.070 0.032 0.038 0.080 0.029 0.051 0.172 0.080 0.092 0.244 0.274 -0.029 1.24 1.18 0.06 8.07 13.24 -5.17CONSTRUCTION 0.035 0.023 0.012 0.043 0.022 0.021 0.116 0.075 0.042 0.214 0.192 0.022 0.93 1.07 -0.13 6.79 11.39 -4.61DIVERSIFIED 0.040 0.031 0.009 0.057 0.026 0.032 0.159 0.086 0.073 0.110 0.254 -0.144 1.01 1.11 -0.10 8.63 12.27 -3.64DRUGS, COSMETICS & HEALTH CARE 0.080 0.046 0.034 0.046 0.027 0.019 0.169 0.073 0.097 0.276 0.520 -0.245 1.85 2.10 -0.25 11.60 10.41 1.19ELECTRICAL 0.041 0.029 0.012 0.071 0.029 0.042 0.158 0.078 0.080 0.155 0.264 -0.109 1.21 1.24 -0.03 10.14 12.16 -2.01ELECTRONICS 0.043 0.028 0.015 0.053 0.024 0.029 0.183 0.069 0.113 0.154 0.370 -0.217 1.32 1.58 -0.26 8.29 11.07 -2.78FINANCIAL 0.060 0.078 -0.017 0.028 0.010 0.018 0.130 0.084 0.045 0.577 0.472 0.105 1.05 1.02 0.04 8.77 12.48 -3.71FOOD 0.037 0.025 0.013 0.059 0.032 0.026 0.146 0.082 0.064 0.126 0.245 -0.119 1.07 1.16 -0.09 7.70 13.34 -5.64MACHINERY & EQUIPMENT 0.027 0.025 0.002 0.059 0.024 0.035 0.176 0.070 0.105 0.110 0.263 -0.153 1.06 1.19 -0.13 6.31 12.69 -6.38METAL PRODUCERS 0.128 0.028 0.101 0.053 0.012 0.042 0.123 0.039 0.084 0.242 0.220 0.022 1.22 1.12 0.10 8.86 6.52 2.33METAL PRODUCT MANUFACTURERS 0.034 0.024 0.010 0.052 0.025 0.027 0.131 0.068 0.063 0.093 0.215 -0.122 0.83 1.09 -0.26 6.63 11.69 -5.06MISCELLANEOUS 0.040 0.023 0.017 0.052 0.026 0.026 0.151 0.076 0.076 0.179 0.285 -0.106 1.18 1.28 -0.10 6.53 11.51 -4.99OIL, GAS, COAL & RELATED SERVICES 0.056 0.041 0.015 0.051 0.025 0.026 0.129 0.070 0.059 0.250 0.383 -0.133 1.04 1.24 -0.20 6.12 10.47 -4.35PAPER 0.056 0.028 0.028 0.066 0.025 0.041 0.172 0.075 0.097 0.149 0.240 -0.091 1.17 1.07 0.10 8.65 11.24 -2.59PRINTING & PUBLISHING 0.075 0.048 0.027 0.074 0.045 0.029 0.154 0.114 0.040 0.142 0.355 -0.213 1.49 1.44 0.05 8.61 14.12 -5.51RECREATION 0.068 0.032 0.035 0.047 0.027 0.021 0.138 0.071 0.067 0.301 0.395 -0.093 1.21 1.34 -0.13 7.67 12.44 -4.77RETAILERS 0.028 0.018 0.011 0.065 0.033 0.032 0.181 0.093 0.088 0.151 0.272 -0.121 1.17 1.21 -0.03 9.04 13.58 -4.54TEXTILES 0.048 0.022 0.026 0.060 0.020 0.039 0.112 0.060 0.052 0.127 0.219 -0.091 0.90 1.01 -0.11 6.23 8.85 -2.63TOBACCO 0.051 0.073 -0.023 0.090 0.059 0.031 0.175 0.183 -0.009 0.121 0.278 -0.158 0.86 1.45 -0.59 5.57 11.18 -5.61TRANSPORTATION 0.049 0.024 0.025 0.066 0.022 0.045 0.159 0.072 0.087 0.187 0.239 -0.051 1.17 1.10 0.07 7.87 11.88 -4.01UTILITIES 0.057 0.064 -0.007 0.047 0.033 0.015 0.134 0.108 0.026 0.264 0.423 -0.159 1.42 1.14 0.27 11.89 11.22 0.67
Average 0.052 0.035 0.017 0.059 0.028 0.030 0.147 0.083 0.064 0.191 0.302 -0.111 1.13 1.24 -0.10 8.00 11.68 -3.68

Table 5: Firm Level (Worldscope) Evidence on Profitability: The Level of Profitability – Variation Across Time
Net Income/Sales Net Income/Assets Net Income/Equity Gross Margin Market to Book Assets Price/Earnings RatioZAF World Diff ZAF World Diff ZAF World Diff ZAF World Diff ZAF World Diff ZAF World Diff
1980 0.063 0.038 0.025 0.074 0.037 0.037 0.210 0.128 0.082 0.821 0.254 0.568 1.20 1.01 0.19 6.45 8.42 -1.971981 0.062 0.035 0.027 0.079 0.035 0.044 0.239 0.123 0.116 0.811 0.253 0.558 1.10 1.00 0.10 5.54 8.33 -2.791982 0.059 0.030 0.029 0.070 0.028 0.042 0.185 0.104 0.081 0.514 0.258 0.256 0.98 1.02 -0.04 5.51 10.23 -4.721983 0.047 0.031 0.016 0.049 0.029 0.020 0.158 0.103 0.055 0.286 0.253 0.033 1.03 1.11 -0.08 8.22 12.39 -4.171984 0.048 0.036 0.013 0.059 0.034 0.025 0.151 0.114 0.037 0.374 0.253 0.121 1.01 1.09 -0.08 8.56 10.98 -2.421985 0.037 0.034 0.003 0.036 0.030 0.006 0.136 0.107 0.028 0.247 0.252 -0.005 1.01 1.16 -0.15 8.18 13.63 -5.451986 0.039 0.033 0.006 0.039 0.028 0.011 0.141 0.102 0.040 0.254 0.254 0.000 1.03 1.23 -0.20 9.24 14.78 -5.541987 0.052 0.039 0.013 0.063 0.031 0.032 0.177 0.105 0.072 0.145 0.269 -0.124 1.19 1.18 0.01 9.87 12.59 -2.721988 0.060 0.043 0.017 0.075 0.032 0.043 0.190 0.113 0.077 0.155 0.272 -0.117 1.08 1.22 -0.14 6.63 12.36 -5.731989 0.068 0.041 0.027 0.080 0.031 0.049 0.212 0.107 0.105 0.157 0.269 -0.112 1.16 1.27 -0.11 7.84 13.62 -5.781990 0.054 0.034 0.020 0.067 0.026 0.040 0.199 0.090 0.109 0.150 0.264 -0.114 1.14 1.13 0.01 8.30 11.88 -3.591991 0.055 0.030 0.025 0.064 0.021 0.042 0.166 0.078 0.088 0.136 0.268 -0.131 1.21 1.17 0.04 10.07 14.34 -4.281992 0.048 0.028 0.020 0.053 0.020 0.033 0.136 0.074 0.062 0.128 0.269 -0.141 1.12 1.14 -0.02 11.20 14.45 -3.241993 0.052 0.032 0.020 0.057 0.019 0.038 0.127 0.077 0.049 0.130 0.273 -0.143 1.12 1.22 -0.09 11.32 16.11 -4.791994 0.055 0.038 0.017 0.057 0.023 0.033 0.128 0.085 0.043 0.131 0.281 -0.150 1.35 1.22 0.13 14.85 14.61 0.241995 0.056 0.040 0.015 0.064 0.024 0.040 0.141 0.086 0.055 0.136 0.282 -0.146 1.32 1.19 0.13 12.61 13.99 -1.381996 0.053 0.040 0.013 0.063 0.024 0.040 0.158 0.083 0.074 0.129 0.288 -0.159 1.33 1.24 0.09 12.62 14.70 -2.081997 0.056 0.038 0.018 0.056 0.022 0.035 0.143 0.083 0.060 0.158 0.297 -0.139 1.28 1.22 0.06 12.54 15.19 -2.641998 0.056 0.030 0.026 0.048 0.016 0.032 0.117 0.070 0.046 0.165 0.308 -0.143 1.18 1.12 0.07 8.20 11.38 -3.181999 0.060 0.032 0.028 0.043 0.016 0.027 0.129 0.069 0.060 0.166 0.312 -0.146 1.12 1.14 -0.02 7.98 10.36 -2.382000 0.042 0.032 0.010 0.039 0.016 0.023 0.129 0.065 0.064 0.250 0.314 -0.064 1.05 1.09 -0.03 6.29 8.37 -2.092001 0.036 0.024 0.011 0.039 0.012 0.027 0.126 0.053 0.072 0.290 0.310 -0.020 1.01 1.07 -0.06 5.34 7.44 -2.102002 0.034 0.024 0.010 0.039 0.012 0.027 0.115 0.051 0.064 0.321 0.308 0.014 1.01 1.06 -0.04 5.88 7.44 -1.572003 0.033 0.029 0.003 0.041 0.016 0.024 0.126 0.061 0.065 0.315 0.314 0.002 1.07 1.16 -0.09 6.26 10.74 -4.482004 0.048 0.021 0.027 0.062 0.019 0.043 0.138 0.050 0.088 0.382 0.231 0.151 1.06 1.01 0.05 6.89 16.79 -9.90
Average 0.051 0.033 0.018 0.057 0.024 0.032 0.155 0.087 0.068 0.270 0.276 -0.006 1.13 1.14 -0.01 8.66 12.20 -3.55

Table 6: Firm Level (Worldscope) Evidence on Profitability: The Level of Profitability – Variation Across Firm Size and Time
Net Income/SalesZAF World
Large Small Diff Large Small Diff Diff in Diff1980 0.053 0.064 -0.012 0.037 0.041 -0.004 -0.0081981 0.055 0.090 -0.035 0.035 0.038 -0.003 -0.0331982 0.034 0.068 -0.035 0.028 0.035 -0.006 -0.0281983 0.031 0.081 -0.050 0.029 0.036 -0.008 -0.0431984 0.034 0.067 -0.033 0.033 0.040 -0.007 -0.0251985 0.031 0.051 -0.020 0.030 0.039 -0.009 -0.0121986 0.041 0.043 -0.002 0.031 0.038 -0.007 0.0051987 0.051 0.060 -0.008 0.036 0.042 -0.006 -0.0031988 0.055 0.082 -0.027 0.042 0.046 -0.004 -0.0231989 0.059 0.090 -0.031 0.039 0.044 -0.005 -0.0261990 0.049 0.074 -0.024 0.032 0.037 -0.004 -0.0201991 0.050 0.068 -0.018 0.028 0.031 -0.004 -0.0141992 0.045 0.055 -0.010 0.027 0.030 -0.003 -0.0071993 0.047 0.057 -0.010 0.030 0.033 -0.003 -0.0071994 0.049 0.058 -0.009 0.038 0.038 0.000 -0.0091995 0.059 0.054 0.005 0.041 0.039 0.002 0.0031996 0.050 0.052 -0.002 0.041 0.039 0.002 -0.0041997 0.061 0.054 0.007 0.040 0.035 0.006 0.0011998 0.057 0.051 0.007 0.033 0.025 0.008 -0.0011999 0.067 0.040 0.027 0.035 0.025 0.010 0.0162000 0.057 0.013 0.043 0.035 0.027 0.008 0.0352001 0.045 0.013 0.032 0.027 0.020 0.006 0.0262002 0.042 0.020 0.022 0.027 0.019 0.007 0.0142003 0.048 0.008 0.040 0.033 0.023 0.011 0.0292004 0.054 0.035 0.020 0.021 0.021 0.000 0.019
Average 0.049 0.054 -0.005 0.033 0.034 0.000 -0.005

Table 7: Listed Firm vs. Industry (All Firm) Profitability by Industry
Operating Income (Listed) /Sales & Value Added/Output (All)ZAF World
Listed All Ratio Listed All Ratio Ratio of RaFood products 0.084 0.126 0.67 0.050 0.162 0.31 2.1Beverages 0.110 0.227 0.49 0.077 0.361 0.21 2.3Tobacco 0.099 0.082 1.21 0.129 0.463 0.28 4.3Textiles 0.056 0.145 0.39 0.052 0.205 0.25 1.5Footwear, except rubber or plastic 0.097 0.170 0.57 0.070 0.187 0.37 1.5Wood products, except furniture 0.047 0.107 0.44 0.049 0.205 0.24 1.9Furniture, except metal 0.067 0.065 1.03 0.066 0.209 0.32 3.3Paper and products 0.098 0.192 0.51 0.067 0.206 0.32 1.6Printing and publishing 0.081 0.158 0.51 0.086 0.232 0.37 1.4Industrial chemicals 0.140 0.198 0.70 0.077 0.237 0.32 2.2Other chemicals 0.082 0.136 0.60 0.074 0.259 0.29 2.1Misc. petroleum and coal products 0.054 0.228 0.24 0.078 0.207 0.37 0.6Rubber products 0.115 0.173 0.66 0.055 0.225 0.25 2.7Plastic products 0.080 0.157 0.51 0.063 0.227 0.28 1.8Pottery, china, earthenware 0.116 0.201 0.58 0.060 0.289 0.21 2.8Glass and products 0.175 0.368 0.48 0.093 0.277 0.34 1.4Other non-metallic mineral products 0.098 0.209 0.47 0.065 0.267 0.24 1.9Iron and steel 0.091 0.277 0.33 0.050 0.187 0.27 1.2Non-ferrous metals 0.077 0.379 0.20 0.049 0.169 0.29 0.7Machinery, except electrical 0.045 0.199 0.23 0.051 0.222 0.23 1.0Machinery, electric 0.066 0.067 0.98 0.056 0.226 0.25 3.9Transport equipment 0.054 0.115 0.47 0.050 0.184 0.27 1.7Professional & scientific equipment 0.084 0.409 0.20 0.068 0.252 0.27 0.8Other manufactured products 0.071 0.454 0.16 0.059 0.223 0.26 0.6Wearing apparel and Leather Products 0.050 0.136 0.37 0.059 0.183 0.32 1.2
Average 0.085 0.199 0.52 0.059 0.234 0.29 1.9

Table 8: PMGE Results for Average Manufacturing Sector Mark-up
μ-1 φ
(ECM) h-test RLL LR
1971-2004
0.54* (0.02)
-0.87* (0.07)
0.98 [0.32]
951.06 364.39[0.00]
1971-1980
0.79* (0.02)
-1.02* (0.06)
0.40 [0.53]
327.57 332.29[0.00]
1975-1984
0.50* (0.01)
-1.01* (0.02)
1.91 [0.17]
245.47 425.16[0.00]
1981-1990
0.57* (0.01)
-0.94* (0.04)
0.74 [0.39]
281.41 333.49[0.00]
1985-1994
0.70* (0.01)
-0.98* (0.09)
0.96 [0.33]
393.46 368.42[0.00]
1991-2000
0.50* (0.03)
-1.12* (0.08)
1.93 [0.16]
258.80 122.53[0.00]
1995-2004
0.62* (0.06)
-1.05* (0.06)
0.98 [0.32]
228.63 91.16 [0.00]
Note: * denotes significance at the 5% level, (s.e.), [p-value]

Variable: Table 9: ADF Test Statistic (using AIC(5) to select lag order) NSR ROEG Manufacturing 3-digit Sectors I(0) I(1) I(0) I(1) Food -4.66 -5.45 Beverages -4.67 -5.35 Tobacco -5.07 -6.61 Textiles -3.95 -5.84 Wearing apparel -4.03 -5.78 Leather & leather products -4.55 -5.82 Footwear -3.00 -5.61 Wood & wood products -4.67 -5.16 Paper & paper products -4.10 -4.71 Printing, publishing & recorded media -4.55 -4.54 Coke & refined petroleum -5.62 -5.55 Basic chemicals -4.73 -5.98 Other chemicals & man-made fibers -4.76 -5.84 Rubber products -4.67 -4.80 Plastic products -3.91 -4.86 Glass & glass products -3.57 -5.59 Non-metallic minerals -3.81 -5.44 Basic iron & steel -2.77* -6.48 -5.64 Basic non-ferrous metals -5.02 -5.20 Metal products excluding machinery -4.41 -5.52 Machinery & equipment -4.92 -5.46 Electrical machinery & apparatus Television, & communication equipment -4.47 -4.94 Professional & scientific equipment -4.77 -7.31 Motor vehicles, parts & accessories -3.26 -5.31 Other transport equipment -5.07 -4.21 Furniture -3.93 -5.32 Other manufacturing -5.62 -5.73 Note: * denotes rejection of the null of no unit root

Table 10: Estimated (ARDL) Mark-up by Individual Three Digit Sector Manufacturing 3-digit Sectors 1971-2004 (s.e.) 1971-1980 1975-1984 1981-1990 1985-1994 1991-2000 1995-2004Food 0.86* (0.10) 0.79 0.87 0.61 0.70 0.68 1.08 Beverages 1.07* (0.12) 1.45 1.47 0.97 1.30 1.17 2.29 Tobacco 4.05* (0.58) 4.27 0.73 5.03 3.79 2.16 -7.79 Textiles 0.51* (0.06) 0.49 0.56 0.30 0.39 0.82 1.26 Wearing apparel 0.29* (0.07) 0.35 0.29 0.19 0.26 0.24 0.63 Leather & leather products 0.16* (0.03) 0.17 0.13 0.21 0.26 0.07 -0.25 Footwear 0.14* (0.04) 0.10 0.14 0.10 0.15 -0.69 0.47 Wood & wood products 0.55* (0.06) 0.93 0.79 0.59 0.77 -0.24 0.22 Paper & paper products 0.84* (0.09) 0.17 0.81 0.73 0.81 1.02 1.19 Printing, publishing & recorded media 0.28* (0.06) 0.35 0.39 0.31 0.45 1.19 0.07 Coke & refined petroleum 3.31* (0.60) 1.55 2.90 2.93 2.98 4.74 2.12 Basic chemicals 0.83* (0.11) 0.89 0.79 0.34 0.84 5.05 0.59 Other chemicals & man-made fibers 0.70* (0.06) 0.40 0.93 0.61 0.76 0.29 0.29 Rubber products 0.52* (0.06) 0.58 0.60 0.42 0.48 0.03 0.07 Plastic products 0.69* (0.09) 0.45 0.75 0.50 0.56 1.82 0.85 Glass & glass products ** 0.28 0.40 0.58 0.65 0.84 1.36 Non-metallic minerals 0.96* (0.25) 0.70 0.79 0.58 0.62 0.29 1.03 Basic iron & steel 0.60* (0.11) 0.54 0.54 0.24 0.24 0.24 1.52 Basic non-ferrous metals 0.77* (0.12) 2.75 1.35 0.76 1.16 0.62 1.55 Metal products excluding machinery 0.41* (0.05) 0.44 0.46 0.32 0.40 0.30 0.79 Machinery & equipment 0.29* (0.05) 0.14 0.23 0.25 0.39 0.36 0.27 Electrical machinery & apparatus 0.49* (0.05) 0.93 0.72 0.45 0.62 0.38 -0.01 Television, & communication equipment 0.46* (0.05) 0.28 0.39 0.44 0.42 0.53 0.52 Professional & scientific equipment 0.52* (0.06) 0.74 0.61 0.53 0.82 0.98 1.12 Motor vehicles, parts & accessories 0.39* (0.10) 0.46 0.42 0.19 0.51 0.74 1.41 Other transport equipment 0.36* (0.08) 0.70 0.49 0.46 0.50 -0.04 0.11 Furniture 0.20* (0.03) 0.42 0.28 0.18 0.26 0.30 0.42 Other manufacturing 2.16* (0.19) 3.12 2.00 2.09 3.28 5.73 4.50 Note: * denotes significance at the 5% level, ** denotes case in which statistically reliable results were not available

Table 11: Summary of Recent Mark-up Behaviour Change in mark-up from 1991-2000 to 1995-2004
Level of mark-up in 1991-2000
Increase Decrease Less than 10% change
High (above 80%)
Beverages Textiles Paper Glass
Pro and sci eq Furniture
Tobacco Printing**
Coke* Basic chemicals**
Plastic* Other
manufacturing**
Medium Food Basic non-ferrous metals**
Motor
Television, & comm eq
Low (below 40%)
Wearing apparel Footwear
Wood* Non-metallic minerals Basic iron and steel
Metal Other transport eq
Leather Chemicals** Rubber** Machinery
Note: * change is off singular low or high ** change does not reflect trend - entire series should be looked at

Table 12: LProxy Measures by Industry Average 10-yr Moving Averages
1970-2004
1970-1979
1975-1984
1980-1989
1985-1994
1990-1999
1995-2004
Food 0.33 0.33 0.35 0.35 0.33 0.30 0.32 Beverages 0.48 0.48 0.47 0.47 0.48 0.48 0.47 Tobacco 0.82 0.83 0.79 0.79 0.79 0.80 0.84 Textiles 0.19 0.22 0.23 0.21 0.20 0.13 0.12 Wearing Apparel 0.15 0.14 0.14 0.15 0.18 0.16 0.15 Leather & leather products 0.20 0.05 0.07 0.13 0.20 0.29 0.39 Footwear 0.16 0.05 0.07 0.09 0.12 0.19 0.36 Wood & wood products 0.29 0.23 0.28 0.34 0.36 0.33 0.26 Paper & paper products 0.33 0.28 0.32 0.32 0.34 0.34 0.37 Printing & publishing 0.20 0.17 0.19 0.22 0.25 0.27 0.18 Coke & refined petroleum 0.22 0.43 0.43 0.41 0.21 -0.18 -0.07 Basic chemicals 0.23 0.30 0.26 0.16 0.15 0.18 0.25 Other chemicals 0.29 0.29 0.29 0.28 0.29 0.29 0.30 Rubber products 0.25 0.26 0.27 0.27 0.25 0.25 0.23 Plastic products 0.29 0.30 0.33 0.33 0.33 0.29 0.20 Glass & glass products 0.22 0.16 0.22 0.26 0.29 0.20 0.21 Non metallic mineral products 0.24 0.24 0.26 0.22 0.17 0.16 0.28 Basic iron & steel 0.12 0.16 0.16 0.13 0.09 -0.02 0.10 Basic non-ferrous metals 0.32 0.19 0.31 0.36 0.35 0.32 0.42 Metal products 0.23 0.19 0.21 0.23 0.24 0.25 0.26 Machinery & equipment 0.21 0.20 0.19 0.20 0.23 0.22 0.21 Electrical machinery 0.31 0.30 0.31 0.31 0.29 0.31 0.33 Television & comms equipment 0.26 0.20 0.26 0.29 0.29 0.25 0.26 Professinal & scientific equip. 0.32 0.26 0.28 0.33 0.37 0.33 0.35 Motor vehicles 0.21 0.15 0.15 0.14 0.22 0.27 0.30 Other transport industry 0.26 0.38 0.31 0.34 0.33 0.16 0.07 Furniture 0.19 0.14 0.15 0.17 0.20 0.23 0.23 Other manufacturing 0.71 0.62 0.65 0.70 0.75 0.77 0.77

Table 13: Margins and Growth. Industry Evidence.
Dependent Variable: Real Labor Productivity Growth
Sample of 115 countries South Africa
Price-Cost Margin t-1 -0.996 *** -0.638 *** -0.835 *** -0.798 * -0.767 *** -1.279 ***0.181 0.073 0.130 0.413 0.212 0.441
(Price-Cost Margin t-1)2 0.330 * 0.992 *0.169 0.556
Country Fixed Effects Yes Yes Yes - - -Industry Fixed Effects No Yes Yes No Yes YesYear Fixed Effects Yes Yes Yes No Yes Yes
# Observations 1615 38520 38520 27 630 630# Industries 1 27 27 1 27 27R2 0.40 0.15 0.15 0.13 0.22 0.23
Note: Significance level: * 10%, ** 5%, *** 1%.Errors are clustered at the country level and at the year level for the Sample of 115 countries and South Africa regressions, respectively.

Table 14: Margins and Growth. Firm-Level Evidence.
Dependent Variable: Real Labor Productivity Growth
Sample of 56 countries South Africa
Price-Cost Margin t-1 -2.542 *** -5.211 *** -0.662 *** -1.676 *** -1.860 *** -3.575 *** -0.758 *** -1.843 ***0.145 0.313 0.029 0.080 0.377 0.707 0.185 0.517
Price-Cost Margin t-1 -1.740 *** -0.677 *** -1.906 *** -0.914 ***with Financial Costs 0.186 0.060 0.356 0.245
(Price-Cost Margin t-1)2 7.335 *** 2.805 *** 4.095 ** 2.703 *0.650 0.194 1.606 1.526
Country Fixed Effects - - - Yes Yes Yes - - - - - -Industry Fixed Effects - - - Yes Yes Yes - - - Yes Yes YesYear Fixed Effects Yes Yes Yes Yes Yes Yes Yes Yes Yes Yes Yes YesFirm Fixed Effects Yes Yes Yes No No No Yes Yes Yes No No No
# Observations 68735 66436 68735 68735 66436 68735 760 729 760 760 729 760# Firms 10502 10347 10502 10502 10347 10502 96 92 96 96 92 96R2 0.25 0.23 0.26 0.04 0.04 0.05 0.28 0.28 0.29 0.14 0.15 0.14
Note: Significance level: * 10%, ** 5%, *** 1%.Errors are clustered at the country level and at the year level for the Sample of 56 countries and South Africa regressions, respectively.
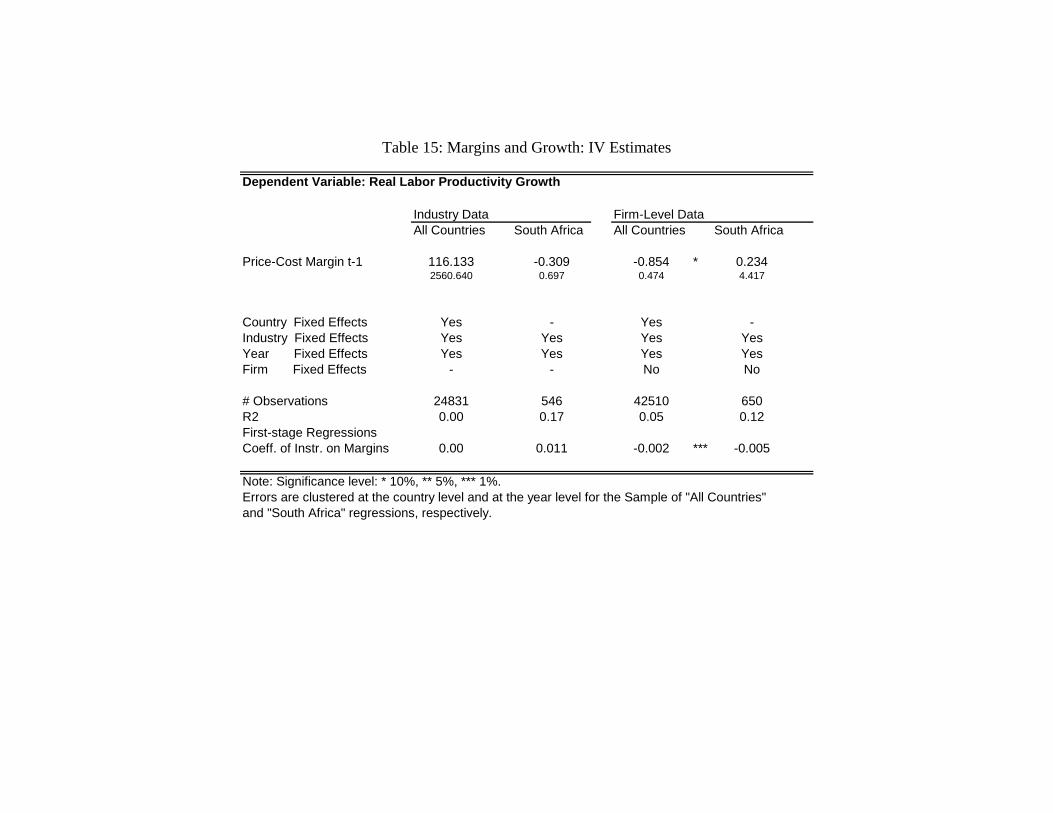
Table 15: Margins and Growth: IV Estimates
Dependent Variable: Real Labor Productivity Growth
Industry Data Firm-Level DataAll Countries South Africa All Countries South Africa
Price-Cost Margin t-1 116.133 -0.309 -0.854 * 0.2342560.640 0.697 0.474 4.417
Country Fixed Effects Yes - Yes -Industry Fixed Effects Yes Yes Yes YesYear Fixed Effects Yes Yes Yes YesFirm Fixed Effects - - No No
# Observations 24831 546 42510 650R2 0.00 0.17 0.05 0.12First-stage RegressionsCoeff. of Instr. on Margins 0.00 0.011 -0.002 *** -0.005
Note: Significance level: * 10%, ** 5%, *** 1%.Errors are clustered at the country level and at the year level for the Sample of "All Countries" and "South Africa" regressions, respectively.

Figure 1: Margins and Growth in South Africa: Aggregate Industry Data
.14
.16
.18
.2.2
2La
gged
Pric
e-C
ost M
argi
n
-.05
0.0
5.1
.15
Labo
r Pro
duct
ivity
Gro
wth
1970 1980 1990 2000Year...
Labor Productivity Growth Lagged Price-Cost Margin

Figure 2: Margins and Growth in South Africa: Disaggregated Industry Data
-1-.5
0.5
1e(
gth
_lab
prod
va |
X )
-.2 -.1 0 .1 .2e( pcmgm1 | X )
coef = -.76720503, (robust) se = .21286283, t = -3.6

Table 16: Impact of Competitive Pressure on Productivity Growth PMGE φ
(ECM) h-test RLL ULL
-0.10* -0.71* (0.03) (0.12) MGE MGE ARDL lag
structure MGE MGE ARDL lag
structure Food -0.27 3 1 Plas -0.19 0 1 (0.19) (0.17) Beve -0.65 0 2 Glas -0.10 0 2 (0.34) (0.12) Toba -0.02 1 1 Nonm -0.21 3 3 (0.57) (0.11) Text 0.13 0 0 Iron -0.33 0 3 (0.14) (0.12) Wear 0.21 1 0 Nonf -0.07 2 2 (0.14) (0.09) Leat 0.23 0 0 Meta -0.43 0 1 (0.14) (0.28) Foot 0.08 0 1 Mach -0.14 1 1 (0.08) (0.18) Wood -0.01 0 1 Elec 0.11 0 0 (0.14) (0.24) Pape -0.27 0 1 Tele 0.64 2 0 (0.16) (0.15) Prin -0.04 0 0 Prof -0.10 1 1 (0.12) (0.27) Coke -0.13 1 0 Moto 0.09 2 1 (0.13) (0.12) Chem -0.22 3 3 Ottr -0.06 0 1 (0.08) (0.14) Otch -0.71 1 3 Furn 1.01 3 3 (0.22) (0.73) Rubb -0.09 0 0 Otma -0.47 1 1 (0.45)

Table 17: Impact of Competitive Pressure on Employment
PMGE φ (ECM)
h-test RLL ULL
-0.34 -0.06 (0.07) (0.05) MGE MGE ARDL lag structure MGE MGE ARDL lag structure
Food 1.32 2 0 Plas -0.13 1 0 (3.64) (0.75)
Beve 1.88 3 0 Glas -5.14 1 0 (4.92) (103.54)
Toba -1.50 1 2 Nonm -1.61 1 0 (30.82) (0.42)
Text 4.88 1 0 Iron -26.12 2 0 (8.27) (244.00)
Wear -0.49 2 0 Nonf 1.13 1 3 (0.69) (2.04)
Leat -0.02 3 1 Meta -3.94 1 3 (0.05) (3.84)
Foot -0.49 2 1 Mach -2.06 3 3 (0.24) (0.94)
Wood -2.10 1 2 Elec 8.94 2 0 (6.83) (31.86)
Pape 1.29 2 2 Tele -0.22 1 0 (1.17) (0.12)
Prin -0.07 3 2 Prof -16.27 1 0 (0.28) (589.18)
Coke 0.18 2 0 Moto -0.34 2 2 (0.13) (0.38)
Chem -0.21 1 0 Ottr 0.24 2 0 (0.11) (0.29)
Otch 0.30 3 2 Furn -1.66 1 2 (0.74) (4.85)
Rubb -0.48 2 0 Otma 5.28 3 0 (0.29) (3.73)

Table 18: PMGE Results for Manufacturing Sector Labour Adjustment
1972-2004 β1 β2 σ-hat Lab adj (σ-
hat) Lab adj (σ=1)
AIC(1) 0.42* -4.88* 0.70 3.43 4.88 (0.15) (0.15) AIC(2) 0.67* -4.74* 0.60 2.84 4.74 (0.14) (0.15) AIC(3) 0.59* -4.76* 0.63 2.99 4.76 (0.14) (0.15) Note: * denotes significance at the 5% level
Table 19: PMGE Results for Manufacturing Sector Labour Adjustment
Lab adj ("correct" σ)* Lab adj (σ=1)
Sub-period AIC(1) AIC(2) AIC(1) AIC(2) 1972-1986 3.54 2.76 4.63 4.25 1973-1987 3.51 3.36 4.56 4.27 1974-1988 3.71 4.06 4.40 4.06 1975-1989 3.35 2.75 4.34 4.33 1976-1990 3.28 2.17 4.32 3.35 1977-1991 2.35 1.75 3.61 2.59 1978-1992 2.50 2.02 4.13 2.77 1979-1993 2.42 1.68 4.29 5.46 1980-1994 2.43 1.13 4.84 1.87 1981-1995 2.58 2.80 4.94 4.79 1982-1996 2.62 2.78 4.63 4.77 1983-1997 3.29 2.27 5.00 2.27 1984-1998 2.72 2.43 4.84 4.19 1985-1999 5.69 1.96 5.69 1.50 1986-2000 6.79 3.66 3.69 1.56 1987-2001 3.50 3.40 3.50 2.62 1988-2002 2.45 1.83 4.58 3.76 1989-2003 4.23 ** 4.23 ** 1990-2004 ** ** ** ** * See text for interpretation of "correct" ** Statistically reliable results not available