CIAT/AEAT/IEF Tax Administration Review · Luis Cremades Ugarte Márcio Ferreira Verdi ... Neila...
92
Transcript of CIAT/AEAT/IEF Tax Administration Review · Luis Cremades Ugarte Márcio Ferreira Verdi ... Neila...
CIAT/AEAT/IEF Tax Administration
Review
Editorial Policy
The Technical Cooperation Agreement signed by CIAT and the State Secretariat of Finance and Budgets, the State Agency of Tax Administration (AEAT) and the Institute of Fiscal Studies (IEF) of Spain, provided for the commitment of editing a review that would serve to disseminate the different tax approaches in force in Latin America and Europe.
An Editorial Board formed by CIAT officials (The Executive Secretary, the Director of Tax Studies and Research, a Consultant and the Heads of the Spanish and Italian Missions) is responsible for determining the topics and select the articles for each edition of the Review.
The articles are selected by the Editorial Board, through a public announcement made by the CIAT Executive Secretariat for each edition of the review. It is open to all officials of the Tax, Customs Administrations and/or Ministries of Economy and Finance of the CIAT member countries and associate member countries. Likewise, those members of the MyCIAT Community not belonging to any of the aforementioned entities may also participate, following evaluation by the Editorial Council
Correspondence
Every communication must be addressed to: [email protected] or to P.O. Box 0834-02129, Panama, Republic of Panama. Author’s Responsibility
The opinions expressed by the authors do not represent those of the institutions for whom they work or those of the CIAT Executive Secretariat.
Copyright
No part of this publication may be reproduced without the written authorization from the CIAT Executive Secretariat.
Sponsoring Organizations
Inter-American Center ofTax Administrations - CIAT
Institute of Fiscal Studies - IEFMinistry of Economy and Finance of Spain
State Agency of Tax Administration - AEAT
No. 36January 2014
Director of the Review
Márcio Ferreira Verdi
Editorial Council
Fernando Herrero Luis Cremades Ugarte Márcio Ferreira Verdi Miguel Eduardo Pecho Trigueros Stefano Gesuelli
Editorial Secretary
Neila Jaén Arias

CIAT/AEAT/IEF Tax Administration
Review No. 36
January 2014 ContentMárcio Ferreira VerdiMessage from the Executive Secretary .................................................................................. iii
Methodologies
Dina Pomeranz, Cristóbal Marshall and Pamela CastellónRandomized Tax Enforcement Messages: A Policy Tool for Improving Audit Strategies ..................................................................................................... 1
Marvin Cardoza and Nelissa AybarFiscal Invoices: Dominican Experience ................................................................................ 22
Edgardo Héctor Ferré OliveTaxes, Social Responsibility and Tax Administrations ........................................................ 41
Strategy
Atila GomesStrategy and Action of the Brazilian Tax Authority: An empirical research founded on Resources Based View (RBV) ................................................................................................ 53
International Taxation
Harry Aquije and Andres RemezzanoTransfer pricing: Examining the gross margins ................................................................... 74
jbermudez
Texto escrito a máquina
jbermudez
Texto escrito a máquina
jbermudez
Texto escrito a máquina
jbermudez
Texto escrito a máquina
jbermudez
Texto escrito a máquina


Message from the Executive Secretary
It is a pleasure to present to you, dear reader, this new issue of the Tax Administration Review.
As you may see, with this issue we are implementing a change in the authors of the Review. The tax debate involves a great diversity of individuals from different spheres whose ideas, analyses and opinions further enrich the knowledge of taxation. It is for this reason that we have afforded others, besides the authors from the tax administrations, as it has been done traditionally, the opportunity for intervening in the debate; namely: the academic community, other national and international public institutions, tax counseling businesses and professionals and interested citizens registered in MyCiat.
This edition includes significant contributions on methodologies, strategies and international taxation.
In the section on Methodologies, Pomeranz, Marshall and Castellón, analyze the impact of sending dissuasive measures, of a random nature, in the case of Income Tax in Chile. The results are promising and the authors provide sufficient elements for the experience to be used advantageously by other countries. Cardoza and Aybar, on their part, analyze the impact of the use of tax receipts for controlling intermediate sales in the Dominican Republic and conclude that they were a very effective instrument for improving value added tax control. The third article, of a methodological nature, analyzes corporate social responsibility, not only within the tax administrations (where some could think that this is not a relevant concept), but mainly as a way of encouraging companies to assist each other for improving collection.
The paper by Atila Gomes analyzes the strategies followed by the federal administration of Brazil in facing the financial crisis in recent years. The author uses the Resource-Based View, an approach which originated in business administration to conclude with an empirical model that shows, first, the critical importance, of the examination staff and second, the use of Internet for managing said entity.
Márcio Ferreira VerdiExecutive Secretary
Finally, with respect to transfer pricing the article by Aquije and Remezzano empirically evaluates whether the differences in intensity in general expenses of comparable businesses are associated to differences in the gross margins. They use a data base with over 65,000 businesses in 110 countries since 1979. As a result, they are able to establish that in the wholesale and retail distribution sectors that is actually the case, for which reason, they should not use the gross margin based methods for determining transfer prices. The opposite result is achieved in the case of mining, while in the case of the business service and manufacturing industries the results are inconclusive.
These articles show the richness of tax debate in our countries, as well as the use of ever more sophisticated methodological instruments for analyzing the proposed options. Again, it is a great pleasure to present them to you.
Márcio Ferreira Verdi Executive Secretary
The Authors: Dina Pomeranz has a PhD in Economics from Harvard University and is an Assistant Professor at the Harvard Business School. She is a faculty research fellow at the National Bureau of Economic Research (NBER) and an affiliate professor at the Abdul Latif Jameel Poverty Action Lab (J-PAL). Cristobal Marshall has a B.A. in Economics from the Catholic University of Chile and a Master’s degree in Public Administration in International Development from the Harvard Kennedy School. Pamela Castellón is an industrial engineer and has a master’s degree in Operations Management from the University of Chile. She is a professional in the Department of Economic and Taxation Studies at the Internal Revenue Service of Chile (SII).
SYNOPSIS Reducing tax evasion is a key challenge for governments around the world, particularly in developing countries. This paper presents a methodology to generate information to optimize audit strategies. Randomly selected taxpayers receive a deterrence message. Comparing their subsequent tax payments to a control group allows estimating what types of taxpayers are more likely to respond to an increase in perceived audit probability. This information can be used to target audits toward taxpayers that respond particularly strongly, and to construct risk indicators to predict taxpayers’ responses. We show results from an application in Chile and describe lessons learned during the implementation.
RANDOMIZED TAX ENFORCEMENT MESSAGES: A POLICY TOOL FOR IMPROVING AUDIT STRATEGIES Dina Pomeranz, Cristóbal Marshall and Pamela Castellón
CIAT/AEAT/IEF Tax Administration Review No. 362
Contents1. Methodology2. Implementation: The case of Chile3. Implementation lessons learned4. Cost-benefit analysis5. Conclusions6. References7. Appendix
Conducting successful and cost-effective audits is no easy task. Audits are costly for both tax administrators and taxpayers, and tax administrations often have limited information and resources to design and optimize their audit strategies. Audit performance is often reported to be a particularly weak element of tax administration (Ebrill et al., 2001).
In this paper, we present a methodology for a critical component of an audit strategy: the selection of taxpayers to be audited.1 Risk-based selection methods are increasingly used by tax administrators as a tool to allocate their audit activities. The goal of these methods is to identify those taxpayers who are most likely to respond strongly to an increase in the audit probability. Audits are then conducted based on that assessment, rather than randomly or on an ad-hoc basis. Various analytical prediction techniques such as data matching, data mining, and parametric and non-parametric models are used to identify high-risk cases.2 A score can then be assigned to each individual or business based on their identified characteristics. This is similar, for example, to risk indicators created in the financial industry for credit risks. For the construction of such risk indicators, we also
present a way to overcome the methodological challenge of combining data obtained from randomized interventions with data-mining-based prediction models.
A key challenge when using these methods, however, is to accurately identify what information to use as input into the risk prediction models. For that purpose, we present a methodology to improve the allocation of audits using randomized deterrence messages. This approach avoids both the high costs of randomized audits, and the problems of selection bias inherent in using information based on non-randomized past audit histories as input for the prediction models. We illustrate our method based on a randomized impact evaluation conducted by Pomeranz (2013) in collaboration with the Chilean Tax Authority, Servicio de Impuestos Internos (SII). This approach can be implemented in many different settings and for different types of taxes, at a very low cost compared to the gains in revenue. Furthermore, a similar strategy can also be used in other contexts, for example in the case of organizations that use audits or similar monitoring processes as part of their operations.
Developing a risk-based model or a scoring technique faces two main challenges. First, the variable of interest is not easily observable. For some risk-based indicators in other contexts, such as credit scoring, the outcome of interest – credit default – is easily observable. Financial institutions have direct access to the information of credit default for all their clients, which, when combined with clients’ characteristics, can be used to develop a scoring model that predicts creditworthiness. Tax non-compliance, on the other hand, similar to corruption or crime activities, is an act of concealing information. Collecting data on this variable requires measurement efforts which, as in the case of audits, are often very costly.
1. This project would not have been possible without the generous support of the following institutions: Chilean Tax Authority - Servicio de Impuestos Internos (SII), the Center for International Development at the Harvard Kennedy School, the David Rockefeller Center for Latin American Studies, the Project on Justice Welfare and Economics at Harvard University and the Swiss Study Foundation. All errors are our own, and we are available for any questions about the implementation of the study and the potential application of the method in other contexts.
2. For a detailed description of risk-based methodologies see Vellutini (2011).
Dina Pomeranz, Cristóbal Marshall and Pamela Castellón
January 2014 3
Second, when data exists, for example from prior audits, it is often difficult to gather conclusive insights because of selection bias. Audits are usually not randomly conducted. An analysis that compares data from audited taxpayers with that from non-audited taxpayers faces such selection problems, since taxpayers in the two groups are not necessarily comparable. Firms that have been selected for audits in the past are different from those that have not, which can result in erroneous interpretations about what type of taxpayer has the highest risk. A high-quality prediction method therefore requires an identification strategy that can determine a causal relation between compliance and a set of taxpayer characteristics. However, most risk-based analysis on taxes lacks external variation in a variable that can potentially affect compliance.
Our methodology addresses both of these challenges. We use a randomized control trial in which the perceived audit probability of randomly selected taxpayers is increased through a notice from the tax authority informing them that they are under special scrutiny. The response to the notice is measured by comparing the subsequent tax payments of those randomly assigned to receive the notice, to those in the control group, who did not receive the notice. Furthermore, analyzing the differences in the responses allows us to investigate what types of taxpayer characteristics are associated with a stronger response. These characteristics, in turn, can be fed into the risk indicator calculation, which helps identify the most optimal candidates for an audit. The goal of this study is to target resources where the expected increase in tax payments is the highest.
Our proposed methodology also addresses a common concern related to the implementation costs of randomized audits. Randomized deterrence messages can capture similar information to what would have been obtained by conducting an actual audit, but at a fraction of the cost. Sending a deterrence letter from the tax authority measures the response of
a taxpayer to the perceived probability of being audited. The letter thereby increases the expected cost of non-compliance, thus increasing the incentive to declare more taxes. As taxpayers may also vary in how they react to the threat of an audit, this strategy does not necessarily capture taxpayers who are evading the most, but rather those who respond the most to an increase in the probability of being audited. The results are thus aligned with strategy of increasing revenues. In addition, the low cost associated with sending the letters allows authorities to work with data for a large number of individuals, thereby increasing the precision of the analysis.
The issue of selection bias is addressed by sending the letters in a randomly selected manner. We can thus obtain an unbiased estimation of taxpayer responses to an increase in the threat of being audited, and of how different taxpayer characteristics are associated with stronger responses. Once that information is collected, we construct a very simple risk indicator for each taxpayer that provides the probability of responding to the higher threat. In practice, more complex risk indicators can also be employed.
The methodology consists of three steps:
1. Deterrence notice: The first and most involved step consists of a randomized controlled trial in which the perceived audit probability of randomly selected taxpayers is increased through a notice from the tax authority informing them that they are under special scrutiny.
2. Estimating the reaction to the notice: The response to the notice can be measured by comparing the subsequent tax payments of those randomly assigned to receive the notice to those in the control group, who did not receive any notice.
3. Extracting information for improved audit targeting: Comparing the different responses allows tax administrators to investigate what types of taxpayer characteristics are associated with a stronger response to the
CIAT/AEAT/IEF Tax Administration Review No. 364
increase in the perceived audit probability. This information can also be summarized in an overall risk indicator that estimates for each taxpayer, the likelihood of responding positively to an increased audit probability.
The remainder of this paper is organized as follows: Section 1 describes the methodology
and the steps involved in its implementation. Section 2 provides background information and basic results from the intervention in Chile. Section 3 outlines some of the lessons learned during this implementation. Section 4 discusses the costs and benefits associated with the implementation of this methodology, and Section 5 concludes.
1. METHODOLOGY
This section describes the three steps involved in the process of setting up and analyzing randomized deterrence message to optimize tax enforcement.
1.1. Implementation of the deterrence notice
The first step toward estimating taxpayers’ responses to an increase in perceived audit probability requires a credible strategy to change their expectations. This can be achieved through an official message from the tax authority informing them that they have been selected for special scrutiny. The credibility of the deterrence message is of great importance, both to ensure the effectiveness of this strategy to gain information to optimize tax enforcement, and to avoid undermining the credibility of the tax authority in the process of this intervention (the latter will be discussed in more detail in Section 4).
The implementation of randomized deterrence messages involves a number of key steps that lead to a valid analysis:3
• Choice of the universe of taxpayers to be studied: The process should start by identifying the universe of taxpayers for which information about the response to audits will be analyzed. In the selection of the relevant
universe, tax authorities should consider their capacity and limitations in order to tailor their audit efforts based on the information that will be obtained. For example, the analysis could be based on all individuals subject to the personal income tax, or all independent entrepreneurs, etc. However, it is important that the universe be large enough to allow for the detection of statistically significant effects (see below).
• Choice of the content of the deterrence notice: Once the target universe has been selected, the content of the deterrence message can be developed. For practical reasons, two issues should be kept in mind when choosing the wording of the message. First, the message should credibly and effectively communicate an increase in the perceived probability of being audited. Second, the message should be straightforward and minimize possible confusion on the part of the recipient in order to avoid an influx of inquiries, concerns, or complaints to the tax authority’s helpline or offices. It is advisable to conduct a series of qualitative pre-tests and informal interviews with taxpayers in order to ensure that the message has the intended effect and that the wording is clear to a broad range of taxpayers with varying backgrounds.
3. These steps usually also apply to the implementation of randomized evaluations in many other areas and contexts.
Dina Pomeranz, Cristóbal Marshall and Pamela Castellón
January 2014 5
• Choice of the number of taxpayers to receive the deterrence notice: To be able to detect a statistically significant impact of the deterrence message and gather information on differences between different types of taxpayers, the sample size in both the treatment and the control groups needs to be sufficiently large. The method used to determine the minimum number of observations required for statistical significance is called power calculations.4
Power calculations should always be performed as a key initial step. In general, the higher the number of characteristics and subgroups for which one would like to estimate differential effects, the larger the required sample size. In other words, the more fine-tuned the analysis is intended to be, the larger the required number of taxpayers in the analysis. Note that the number of taxpayers in the treatment and control groups need not necessarily be the same. In fact, it is advisable that all taxpayers who were randomly selected not to receive the notice be included in the control group, even if the number of individuals in this group is many times larger than the number in the treatment group.
• Random selection of those taxpayers slated to receive the deterrence notice: It is crucial for the validity of the analysis that taxpayers be selected in a random process from among the universe selected for the analysis. The randomization creates two groups of taxpayers that are identical in all observable and non-observable characteristics, except for the receipt of the deterrence notice. All differences in terms of subsequent tax payments between the treatment and the control group can therefore be attributed to the deterrence notice.5 For this to remain true, it is important
that subsequent to the random assignment, taxpayers in both the treatment and control groups continue to be treated exactly the same in all aspects except for the deterrence notice. Also, the control group has to consist only of taxpayers that were randomly selected not to receive the message. Any taxpayers who were not part of the original universe for which the randomization was performed cannot be included in the analysis.
• Pilot: Before the mass mailing or distribution of the deterrence notice, it is highly advisable to conduct a pilot of the intervention with a small sub-sample in order to verify whether all the required actions can be implemented as planned. Typically, important lessons are learned during the pilot phase and unexpected obstacles can be discovered and removed before the large scale distribution is implemented. Pilots can therefore contribute significantly to the successful implementation of the proposed methodology.
• Ensuring that the random selection is respected in the implementation: For the validity and success of the analysis, it is important that the original random assignment be preserved and not tampered with. This means two things in practice: first, ensuring that as much as possible, those taxpayers that have been selected to receive the notice indeed receive one, and those, who have been selected to be in the control group, do not receive it (see discussion in Section 4 below on why that might not always be possible); second, where this is not fully possible, taking care to maintain the information about who was originally assigned to the treatment and control groups. In order to ensure the validity of the analysis, it is imperative that all estimation be conducted based on this original random assignment.
4. Power calculation can be applied through programs such as “Optimal Design” http://www.wtgrantfdn.org/resources/research-tools. For more details on power calculation see also Duflo et al. (2007).
5. For more details on the rationale and benefits of using randomization see Duflo et al. (2007).
CIAT/AEAT/IEF Tax Administration Review No. 366
1.2 Estimating the reaction to the notice
The second step of the methodology is to estimate the magnitude of taxpayers’ reactions to the higher expected probability of being audited. To obtain an unbiased estimate of this reaction, we rely on the randomized assignment of the notice, as discussed above. Due to this random assignment, the effect of the deterrence notice can be measured by simply comparing the tax payments in the period following the distribution of the notice, of those who were selected to receive the notice, with those in the control group.6
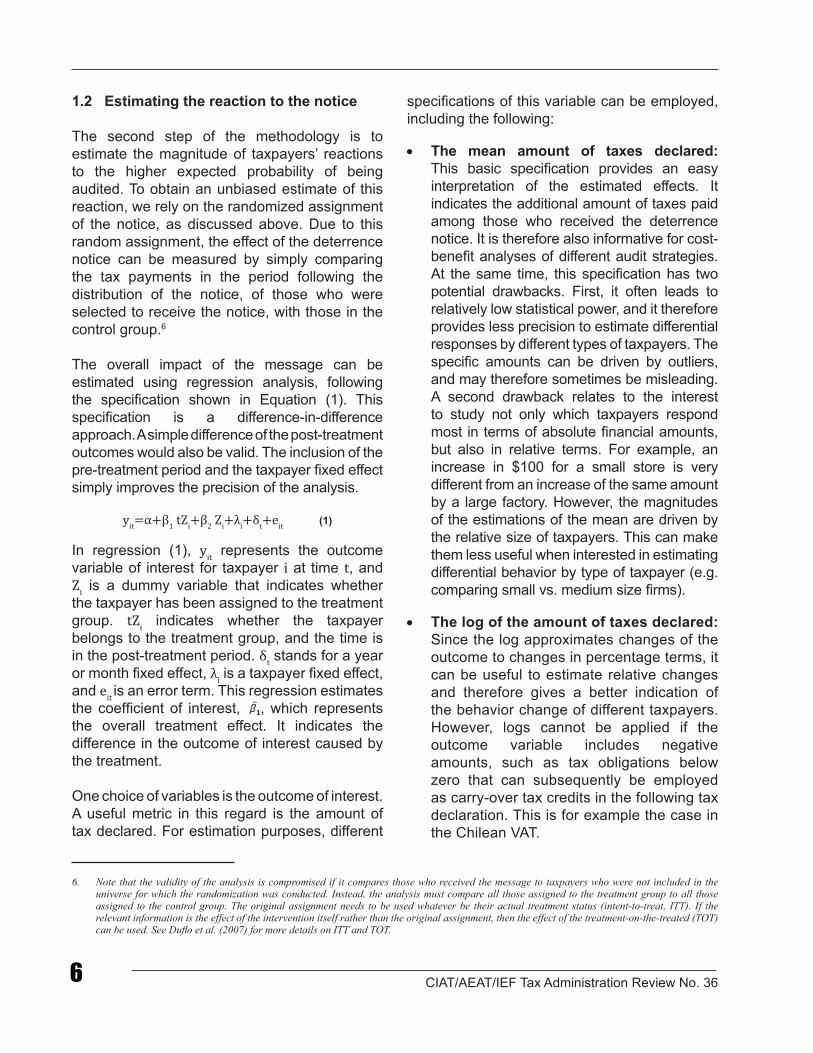
The overall impact of the message can be estimated using regression analysis, following the specification shown in Equation (1). This specification is a difference-in-difference approach. A simple difference of the post-treatment outcomes would also be valid. The inclusion of the pre-treatment period and the taxpayer fixed effect simply improves the precision of the analysis.
yit=α+β1 tZi+β2 Zi+λi+δt+eit (1)
In regression (1), yit represents the outcome variable of interest for taxpayer i at time t, and Zi is a dummy variable that indicates whether the taxpayer has been assigned to the treatment group. tZi indicates whether the taxpayer belongs to the treatment group, and the time is in the post-treatment period. δt stands for a year or month fixed effect, λi is a taxpayer fixed effect, and eit is an error term. This regression estimates the coefficient of interest, , which represents the overall treatment effect. It indicates the difference in the outcome of interest caused by the treatment.
One choice of variables is the outcome of interest. A useful metric in this regard is the amount of tax declared. For estimation purposes, different
specifications of this variable can be employed, including the following:
• The mean amount of taxes declared: This basic specification provides an easy interpretation of the estimated effects. It indicates the additional amount of taxes paid among those who received the deterrence notice. It is therefore also informative for cost-benefit analyses of different audit strategies. At the same time, this specification has two potential drawbacks. First, it often leads to relatively low statistical power, and it therefore provides less precision to estimate differential responses by different types of taxpayers. The specific amounts can be driven by outliers, and may therefore sometimes be misleading. A second drawback relates to the interest to study not only which taxpayers respond most in terms of absolute financial amounts, but also in relative terms. For example, an increase in $100 for a small store is very different from an increase of the same amount by a large factory. However, the magnitudes of the estimations of the mean are driven by the relative size of taxpayers. This can make them less useful when interested in estimating differential behavior by type of taxpayer (e.g. comparing small vs. medium size firms).
• The log of the amount of taxes declared: Since the log approximates changes of the outcome to changes in percentage terms, it can be useful to estimate relative changes and therefore gives a better indication of the behavior change of different taxpayers. However, logs cannot be applied if the outcome variable includes negative amounts, such as tax obligations below zero that can subsequently be employed as carry-over tax credits in the following tax declaration. This is for example the case in the Chilean VAT.
6. Note that the validity of the analysis is compromised if it compares those who received the message to taxpayers who were not included in the universe for which the randomization was conducted. Instead, the analysis must compare all those assigned to the treatment group to all those assigned to the control group. The original assignment needs to be used whatever be their actual treatment status (intent-to-treat, ITT). If the relevant information is the effect of the intervention itself rather than the original assignment, then the effect of the treatment-on-the-treated (TOT) can be used. See Duflo et al. (2007) for more details on ITT and TOT.
Dina Pomeranz, Cristóbal Marshall and Pamela Castellón
January 2014 7
• The median of declared taxes: A quantile regression is a specification that can also be used when there is large dispersion in the data, since the median is less sensitive to extreme values than the mean. It has the benefit of still being applicable when there are negative values in the data. However, similar to the mean, the magnitude of the estimates is driven by the relative size of the taxpayers.
• The probability of declaring positive taxes: In many cases, a margin of interest can be whether taxpayers are declaring any taxes at all, either by submitting a declaration or not, or if a declaration is submitted, declaring a positive amount. The impact of the deterrence notice on this behavior can be measured by a linear probability regression. This is a regular OLS regression, where a dummy variable indicating whether the taxpayer declares positive taxes is the outcome variable.
• The probability of declaring higher taxes compared to last year: Another specification that can be very useful is a linear probability regression, where the outcome variable is a dummy indicating whether declared taxes are higher than in the previous year. This specification is robust to outliers and large variances in the data, is not driven by the taxpayer’s size, and can deal with negative amounts of the tax variable.
The choice of the outcome variable to be used for estimation purposes can be made on a case-by-case basis, depending on the data available, the distribution of the data, and the type of analysis the tax authority is interested in. In Section 3, we discuss the variable chosen for our implementation in Chile and the reason behind that choice.
How should the responses to the letter be interpreted? Can the magnitude of the taxpayers’
reactions be used as a good estimation of overall tax evasion? Not necessarily. While paying higher taxes in response to an increased audit probability suggests that taxpayers might have been underreporting tax liabilities before receiving the deterrence notice, the amount of increased payments may not be a good estimator of the amount of taxes evaded. Taxpayers may still engage in evasion after receiving the notice if, for example, they are confident that their evasion cannot be detected, if they expect the fine to be low or non-enforced, or if they doubt the credibility of the deterrence message. On the other hand, some taxpayers may respond to the audit notice by over-declaring taxes. Therefore, the response to the letter should not be interpreted as an accurate estimate of tax evasion but instead as the response to a higher expected probability of being audited.
1.3 Extracting information for improved audit targeting
1.3.1 What types of taxpayers respond more?
The goal of this approach is not merely to estimate the magnitude of taxpayers’ overall reactions to the message, but also the kinds of taxpayer characteristics that are associated with a stronger reaction to the notice, such as firm size, industry, geographical location, or past behavior.
Similar to an actual audit, the response of taxpayers to a deterrence notice will vary. The variables that can influence the magnitude of taxpayers’ response to the threat of audits include: (i) the amount of tax currently being evaded, (ii) the expected audit probability prior to receiving the notice of increased scrutiny, (iii) the expected penalty and the extent to which it is anticipated to be actually enforced, (iv) the expected likelihood that an audit will reveal evasion, and (v) the taxpayer’s degree of risk aversion, to name a few.
CIAT/AEAT/IEF Tax Administration Review No. 368
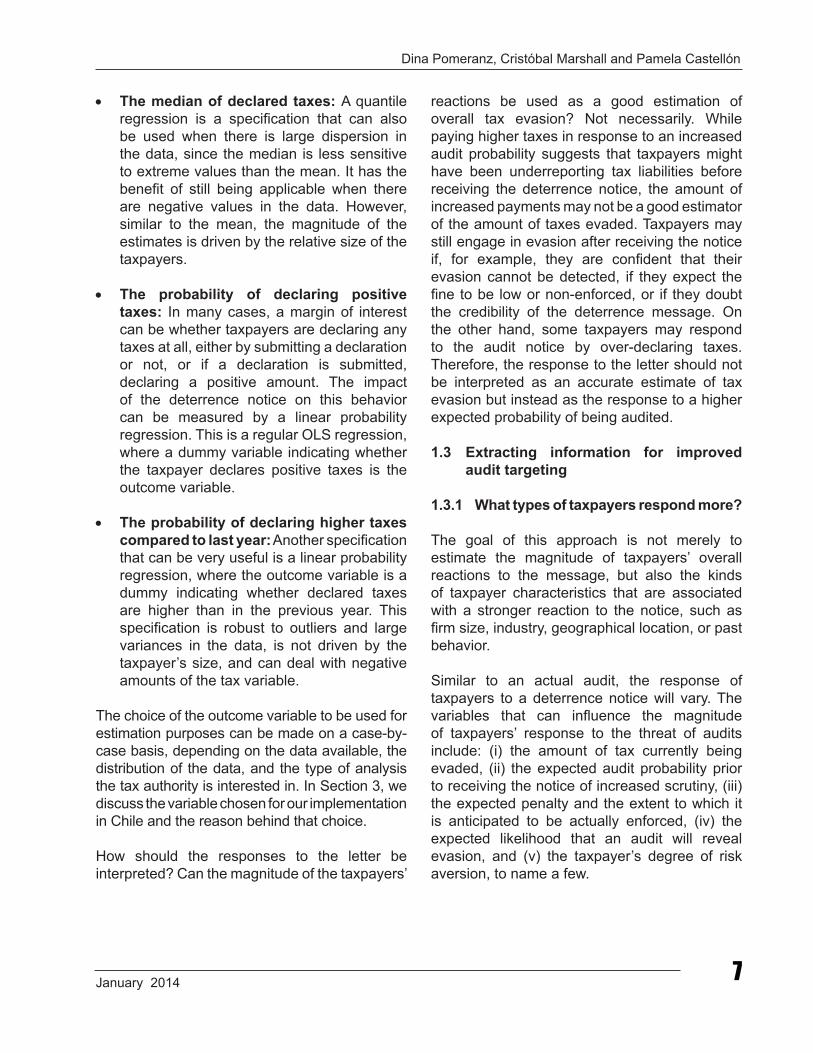
For the estimation of the differential response by type of taxpayer, we use a variation of regression (1), which is captured by the following specification:
yit=α+β1 tZi+β2 tXi+β3 tZi Xi+δt+λi+eit, (2)
where Xi is a vector of taxpayer characteristics, and tZiXi is an interaction term of taxpayer characteristics Xi and the post-treatment indicator described above. From this regression, we can estimate the coefficient of interest, , which represents the interactions of the treatment effect with taxpayer-specific characteristics.7 For example, if the taxpayers that are analyzed are firms, we can classify them by level of sales according to five categories: no sales, micro size, small, medium or large. Then, Xm, Xs, XM XL represent dummy variables indicating the respective firm sizes (“no sales” is the omitted category). In this case, the estimated coefficient for the tZi Xm variable would show the differential impact of the deterrence letter for micro size firms compared to the effect on firms that had no sales. A positive estimated coefficient means that, all else equal, micro size firms react comparatively more than those with no sales. If the goal of a tax authority is to increase tax revenues, then audits should target micro firms more heavily than firms with no sales. This is precisely what will be captured by our proposed risk indicator.
1.3.2 Constructing a risk indicator
Rather than analyzing the differential effects for specific taxpayer characteristics in isolation, one can also aggregate the information on how taxpayer characteristics interact with the treatment into one single risk indicator. One
very simple way in which this can be done is by using the estimated coefficients for β1 and the differential effects by taxpayers’ types β3 from regression (2). Together, these predict the response to the deterrence notice by all taxpayers based on their characteristics. This information is often available and continually collected by most tax authorities, allowing a regular calculation of the risk indicator for all taxpayers.
The risk indicator is therefore calculated as follows:
(3)
where ri provides a numerical value for each taxpayer, indicating the expected response to an increase in the audit probability. This risk indicator can be directly applied to the design of an audit strategy. A tax authority could, for example, rank taxpayers in term of and then audit those with the highest values of the indicator.
It is worth noting that in the case that the independent variable is defined as the probability of paying positive taxes or higher taxes than the previous year, ri is independent of the relative size of taxes paid, and higher values of ri do not necessarily represent higher additional revenues. If a tax authority wants to target taxpayers with a higher probability of responding to the deterrence notice as a way to target those taxpayers most suspicious of tax evasion, then ri is the appropriate indicator to use. If instead the tax authority is interested in maximizing tax revenues, it might want to multiply ri by a variable that captures taxpayers’ size, such as past revenues or taxable income, and use this new value as the risk indicator.
7. If the specification employed is not a panel regression and therefore does not include taxpayer fixed effects, Xi needs to be included on its own in the regression as well, in place of λi.
Dina Pomeranz, Cristóbal Marshall and Pamela Castellón
January 2014 9
This methodology has been implemented in close collaboration with the Chilean Tax Authority, Servicio de Impuestos Internos de Chile (SII). SII has the reputation of being highly effective and is one of the most respected institutions in the country (Adimark, 2006). This reputation has been obtained over time through various factors, such as the provision of high-quality public service, constant service improvement, and application of cutting-edge methods and technologies. Following this tradition, SII decided to implement the method of randomized deterrence notices as part of a continuous effort to improve its processes and identify new mechanisms in order to make tax collection and administration more effective.
In the following, we discuss how each of the implementation steps laid out in Section 2 was put into practice in Chile.
2.1 Implementation of the deterrence notice
• Choice of the universe of taxpayers to be studied: The analysis in Chile focuses on the Value Added Tax (VAT), which represents approximately half of tax revenues of the country (Servicio de Impuestos Internos, 2012). Although the VAT is believed to have distinctive features that make it less vulnerable to evasion and fraud, in recent years there has been an increasing concern regarding VAT revenue losses associated with non-compliance in both developed and developing countries (Keen and Lockwood, 2010). The universe of taxpayers included in the Chilean analysis consisted of all small and medium size firms in the country that were operating in June 2008, had declared a positive amount of VAT for at least one
month between July 2007 and June 2008, and had valid postal addresses. Larger taxpayers were not included in the analysis because they face a different audit process, administered by a separate unit within SII.
• Choice of the content of the deterrence notice: With the aim of increasing taxpayers’ perceived audit probabilities, SII sent deterrence letters to a randomly selected group of small and medium size firms.8 In particular, the letters informed taxpayers that in a random selection process among micro, small and medium size firms, they had been selected for analysis, and in case of any detected irregularities, they could be summoned to an audit. In order to ensure that the message had the intended impact, a series of informal interviews were conducted with firm representatives prior to the mailing. During these interviews, owners or accountants of small and medium size firms were asked how they would interpret the message and what they would do if they received one. These pre-tests helped fine-tune the message. They also alerted the tax authority as to the usefulness of mentioning in the letter that taxpayers did not need to take any immediate action or come to the tax authority office to inquire for further information. The content of the messages was also vetted by the internal legal and communications departments of SII.
• Choice of the number of taxpayers to receive the deterrence notice: Power calculations showed that among the selected sample of 445,734 taxpayers in Chile, mailing of the deterrence message to 102,000 was required to have a high enough probability
2. IMPLEMENTATION: THE CASE OF CHILE
8. To test whether the impact of the letter was due to the deterrence message or due to the simple fact of receiving mail from the tax authority, motivational and placebo letters that contained information irrelevant for tax compliance, were also sent to randomly selected taxpayers. For more details see (Pomeranz, 2013).
CIAT/AEAT/IEF Tax Administration Review No. 3610
to obtain statistically significant results. As described in Section 2, treatment and control groups do not necessarily have to have the same number of units. Since the control group in this case has no cost, and since the notice might lose credibility if too large a share of firms receives it, it can often result that the treatment group is smaller than the control group in this type of intervention.
• Random selection of the taxpayers slated to receive the deterrence notice: The random selection of taxpayers was conducted electronically in order to avoid any possible human interference and therefore ensure the validity of the process. To increase the precision of the randomization process at making treatment and control groups comparable in all characteristics, the sample was stratified by a few key firm characteristics, such as size, region, past audits, etc. Randomization then took place within these subgroups.
• Pilot: A pilot of 250 letters was sent out two months prior to the large-scale mailing, helping detect wrinkles in the process. It allowed adjusting several internal procedures, as well as the wording of the letters, and ensured a smooth implementation of the large-scale mailing.
• Ensuring that the random selection is respected in the implementation: The letter messages were mailed in envelopes by the VAT department of the tax administration.
The notice was sent using certified mail, so that information could be obtained on which taxpayers actually received the letter and by what date. In order to minimize the cases where taxpayers in the treatment group received no letter, taxpayers with invalid postal addresses were excluded from the universe. It was very important to exclude those with invalid mailing addresses both from the treatment and the control group. If they had been excluded only from the treatment group, this would have rendered the comparison between the remaining treatment group and the control group invalid. The exclusion of those with invalid addresses allowed for a substantial increase in the statistical power of the experiment by significantly reducing non-compliance with treatment assignment.9
2.2 Estimating the reaction to the notice
2.2.1 Summary statistics at baseline
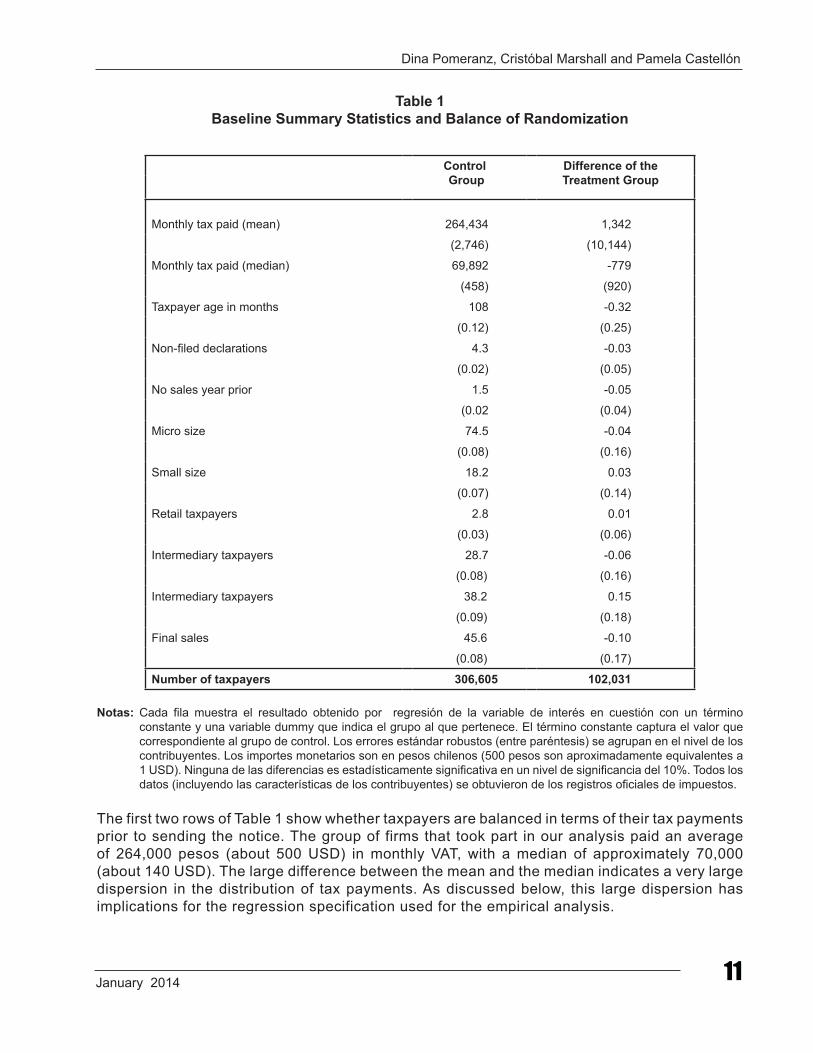
The first step of the analysis in any randomized control trial is to verify that the randomization has been done properly, and that the treatment and control groups are not statistically significantly different from each other prior to the intervention. Table 1 presents such baseline summary statistics for the taxpayers in the treatment group and the difference with respect to the control group. As one would expect given the random assignment, average characteristics between the two groups look very similar, and none of the differences are statistically significant.
9. Partial compliance (i.e. if not all those assigned to treatment actually receive treatment, or if some assigned to the control group still receive the treatment) strongly reduces the statistical power of randomized evaluations. The higher the non-compliance rate, the higher the sample size that is required to estimate a minimum effect. To estimate the direct effect on the compliers, a treatment-on-the-treated (TOT) estimation needs to be applied in these cases.
Dina Pomeranz, Cristóbal Marshall and Pamela Castellón
January 2014 11
Table 1 Baseline Summary Statistics and Balance of Randomization
Control Group
Difference of the Treatment Group
Monthly tax paid (mean) 264,434 1,342
(2,746) (10,144)
Monthly tax paid (median) 69,892 -779
(458) (920)
Taxpayer age in months 108 -0.32
(0.12) (0.25)
Non-filed declarations 4.3 -0.03
(0.02) (0.05)
No sales year prior 1.5 -0.05
(0.02 (0.04)
Micro size 74.5 -0.04
(0.08) (0.16)
Small size 18.2 0.03
(0.07) (0.14)
Retail taxpayers 2.8 0.01
(0.03) (0.06)
Intermediary taxpayers 28.7 -0.06
(0.08) (0.16)
Intermediary taxpayers 38.2 0.15
(0.09) (0.18)
Final sales 45.6 -0.10
(0.08) (0.17)
Number of taxpayers 306,605 102,031
Notas: Cada fila muestra el resultado obtenido por regresión de la variable de interés en cuestión con un término constante y una variable dummy que indica el grupo al que pertenece. El término constante captura el valor que correspondiente al grupo de control. Los errores estándar robustos (entre paréntesis) se agrupan en el nivel de los contribuyentes. Los importes monetarios son en pesos chilenos (500 pesos son aproximadamente equivalentes a 1 USD). Ninguna de las diferencias es estadísticamente significativa en un nivel de significancia del 10%. Todos los datos (incluyendo las características de los contribuyentes) se obtuvieron de los registros oficiales de impuestos.
The first two rows of Table 1 show whether taxpayers are balanced in terms of their tax payments prior to sending the notice. The group of firms that took part in our analysis paid an average of 264,000 pesos (about 500 USD) in monthly VAT, with a median of approximately 70,000 (about 140 USD). The large difference between the mean and the median indicates a very large dispersion in the distribution of tax payments. As discussed below, this large dispersion has implications for the regression specification used for the empirical analysis.
CIAT/AEAT/IEF Tax Administration Review No. 3612
Next, we look at potential differences in terms of size. There are five official firm size categories in Chile, based on the amount of sales in the previous tax year: firms with no sales, micro-sized, small-sized, medium-sized and large-sized firms.10 The micro-sized taxpayers are by far the largest group, comprising 74.5% of the universe. The second largest group is the small-sized taxpayers (18.2%), followed by the medium-sized taxpayers (2.8%) and taxpayers with no sales in the preceding year (1.5%). The remaining 3% are those new taxpayers that have not yet been classified. Taxpayers in treatment and control groups are balanced in terms of the proportion of firms of each size.
Taxpayers are also balanced across treatment groups with respect to their position in the production chain: 28.8% are retailers that sell only to final consumers, and 38.2% are intermediary taxpayers that sell only to other taxpayers. Overall, the share of sales to the final consumer is 45.6%. Finally, the treatment and the control groups are similar in terms of age. On average, firms started operating approximately 9 years before the baseline data was collected. 2.2.2 Overall impact of the deterrence letter
Once treatment-control balance has been verified, we estimate the effect of the deterrence letter using regression (1). Given the large dispersion in the distribution of declared taxes, analyzing the impact of the intervention on the mean of declared VAT does not lead to statistically significant results, as the variance is extremely large. Thus, we estimate a linear probability version of regression (1), where the outcome variable is the probability of paying higher VAT after receiving the notice, compared
to the same month of the previous year. This specification has several benefits compared to alternative measures. First, as opposed to a log specification, it can be applied to variables that include zero or negative values, which is the case for declared taxes.11 Second, it is robust to outliers and high variances, as is the case with our fat-tailed distribution of declared taxes. Third, it takes into account firms in all parts of the distribution of VAT payments (as opposed to measures such as the probability of declaring positive taxes, the mean, or the median, which are all sensitive to taxpayers’ size), making it useful to compare the treatment effect between different types of firms.12
The results show a significant impact of the deterrence message. The estimated overall treatment effect is a 1.40 percentage point increase in the probability of paying higher VAT than the same month of the previous year. The result is statistically significant at the 1% level (Pomeranz, 2013). Two other interesting results from the evaluation, also shown in Pomeranz (2013), are worth noting. First, the impact in terms of higher taxes seems to be very persistent. The initial impact in the treatment group is immediate and decreases only slowly over the following months. It reaches the same level as the control group again after about 18 months. In the first six months of the implementation of the enforcement letter, the increase in tax revenue is estimated to be about 3.3 million USD. Second, increasing the audit probability of firms generated spillovers up the VAT paper trail that lead to an increase of their suppliers’ tax payments. This result suggests that when designing audit strategies, tax authorities should not only consider the effect on the audited firm, but also the spillover effects on the firm´s trading network.
10. Large firms are not included in this study.11. In Chile, firms can declare negative VAT amounts. In this case, they pay zero VAT for the corresponding month, and carry the negative tax amount
over to their next declaration in form of a tax credit.12. See Pomeranz (2013) for a detailed discussion on the use of alternative dependent variables, and why this particular outcome variable was chosen
in the Chilean case.
Dina Pomeranz, Cristóbal Marshall and Pamela Castellón
January 2014 13
2.3 Extracting information for improved audit targeting
2.3.1 What types of taxpayers respond more?
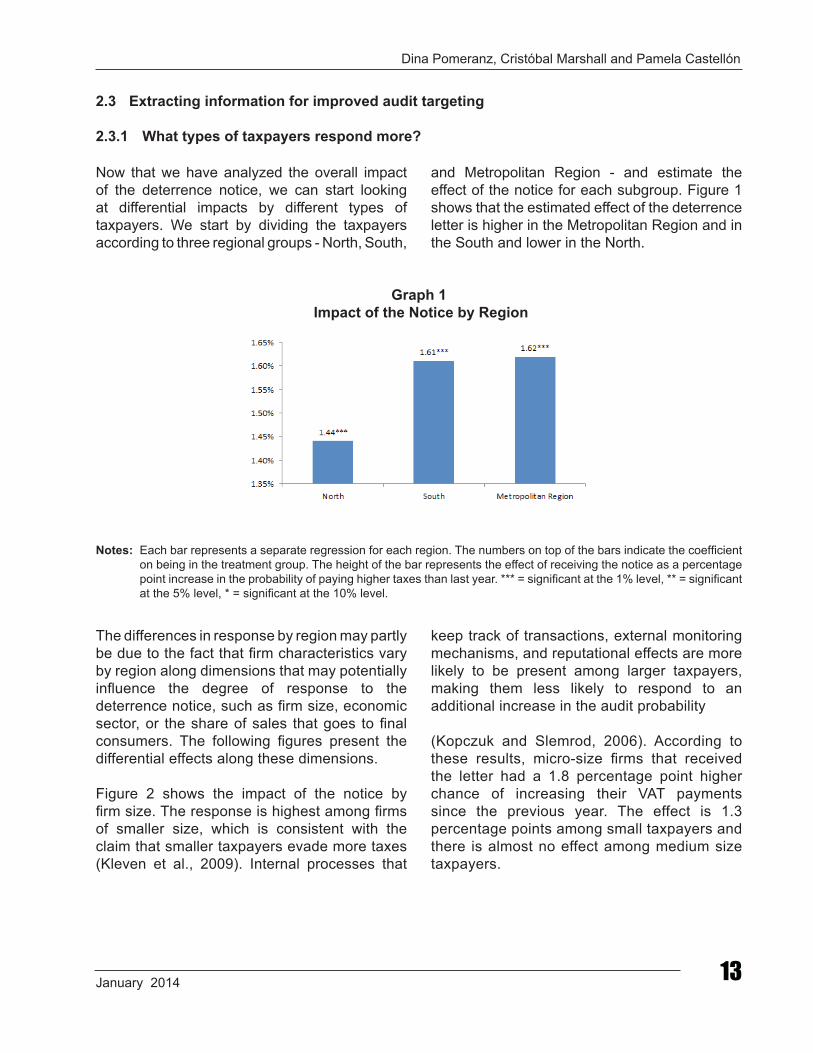
Now that we have analyzed the overall impact of the deterrence notice, we can start looking at differential impacts by different types of taxpayers. We start by dividing the taxpayers according to three regional groups - North, South,
and Metropolitan Region - and estimate the effect of the notice for each subgroup. Figure 1 shows that the estimated effect of the deterrence letter is higher in the Metropolitan Region and in the South and lower in the North.
Graph 1 Impact of the Notice by Region
Notes: Each bar represents a separate regression for each region. The numbers on top of the bars indicate the coefficient on being in the treatment group. The height of the bar represents the effect of receiving the notice as a percentage point increase in the probability of paying higher taxes than last year. *** = significant at the 1% level, ** = significant at the 5% level, * = significant at the 10% level.
The differences in response by region may partly be due to the fact that firm characteristics vary by region along dimensions that may potentially influence the degree of response to the deterrence notice, such as firm size, economic sector, or the share of sales that goes to final consumers. The following figures present the differential effects along these dimensions.
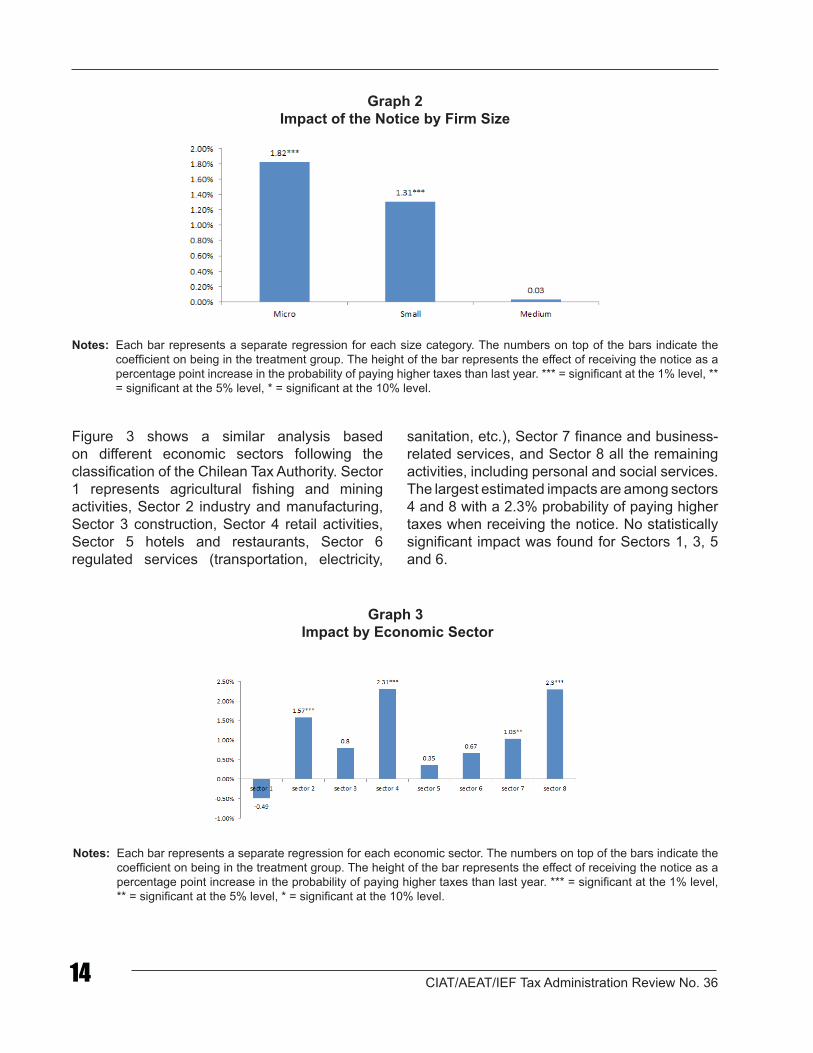
Figure 2 shows the impact of the notice by firm size. The response is highest among firms of smaller size, which is consistent with the claim that smaller taxpayers evade more taxes (Kleven et al., 2009). Internal processes that
keep track of transactions, external monitoring mechanisms, and reputational effects are more likely to be present among larger taxpayers, making them less likely to respond to an additional increase in the audit probability
(Kopczuk and Slemrod, 2006). According to these results, micro-size firms that received the letter had a 1.8 percentage point higher chance of increasing their VAT payments since the previous year. The effect is 1.3 percentage points among small taxpayers and there is almost no effect among medium size taxpayers.
CIAT/AEAT/IEF Tax Administration Review No. 3614
Graph 2Impact of the Notice by Firm Size
Notes: Each bar represents a separate regression for each size category. The numbers on top of the bars indicate the coefficient on being in the treatment group. The height of the bar represents the effect of receiving the notice as a percentage point increase in the probability of paying higher taxes than last year. *** = significant at the 1% level, ** = significant at the 5% level, * = significant at the 10% level.
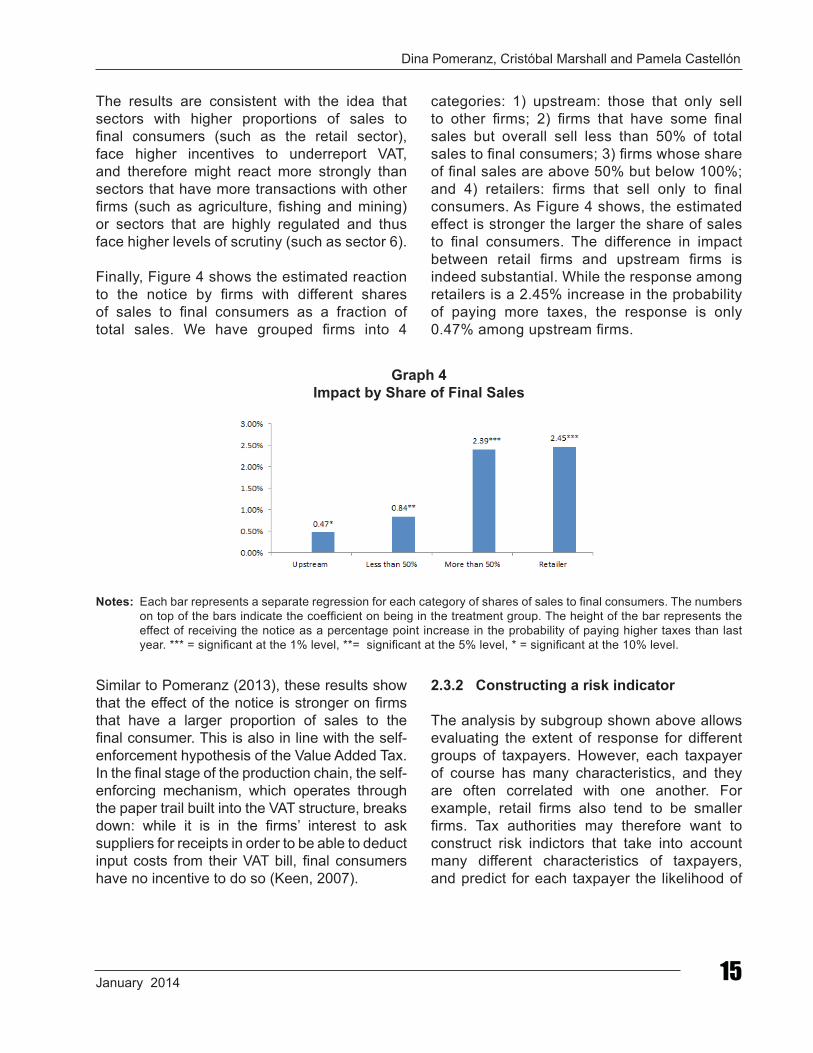
Figure 3 shows a similar analysis based on different economic sectors following the classification of the Chilean Tax Authority. Sector 1 represents agricultural fishing and mining activities, Sector 2 industry and manufacturing, Sector 3 construction, Sector 4 retail activities, Sector 5 hotels and restaurants, Sector 6 regulated services (transportation, electricity,
sanitation, etc.), Sector 7 finance and business-related services, and Sector 8 all the remaining activities, including personal and social services. The largest estimated impacts are among sectors 4 and 8 with a 2.3% probability of paying higher taxes when receiving the notice. No statistically significant impact was found for Sectors 1, 3, 5 and 6.
Graph 3 Impact by Economic Sector
Notes: Each bar represents a separate regression for each economic sector. The numbers on top of the bars indicate the coefficient on being in the treatment group. The height of the bar represents the effect of receiving the notice as a percentage point increase in the probability of paying higher taxes than last year. *** = significant at the 1% level, ** = significant at the 5% level, * = significant at the 10% level.
Dina Pomeranz, Cristóbal Marshall and Pamela Castellón
January 2014 15
The results are consistent with the idea that sectors with higher proportions of sales to final consumers (such as the retail sector), face higher incentives to underreport VAT, and therefore might react more strongly than sectors that have more transactions with other firms (such as agriculture, fishing and mining) or sectors that are highly regulated and thus face higher levels of scrutiny (such as sector 6).
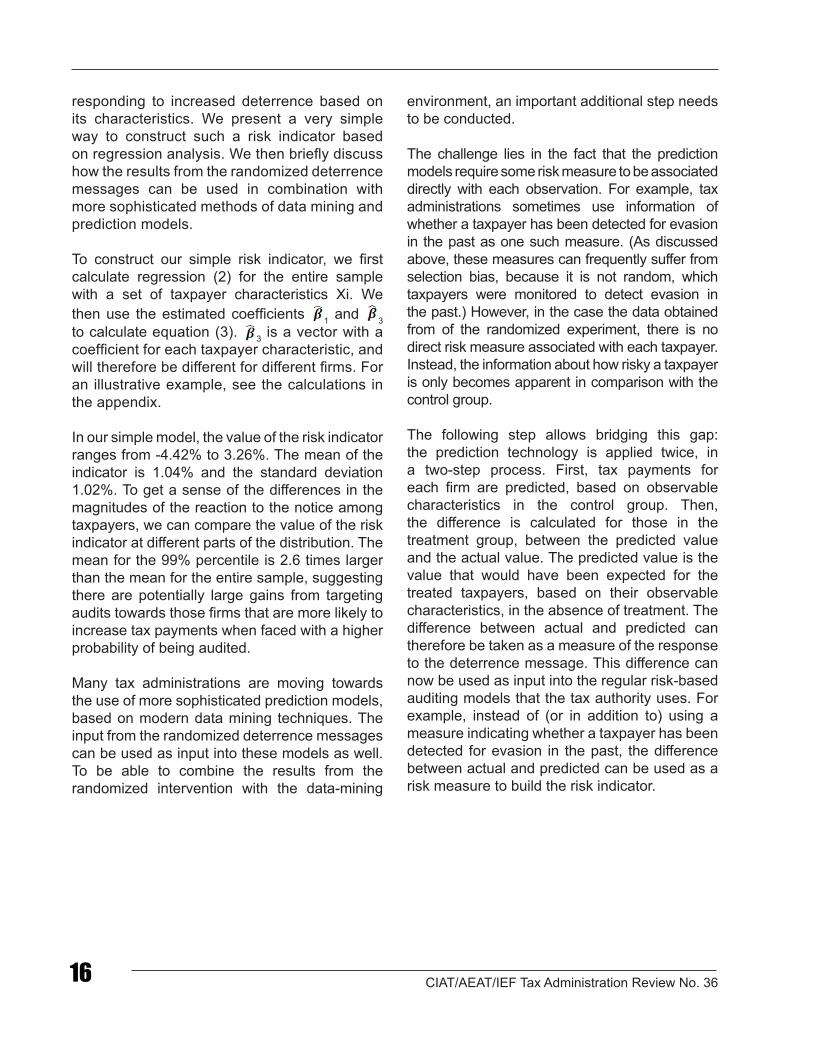
Finally, Figure 4 shows the estimated reaction to the notice by firms with different shares of sales to final consumers as a fraction of total sales. We have grouped firms into 4
categories: 1) upstream: those that only sell to other firms; 2) firms that have some final sales but overall sell less than 50% of total sales to final consumers; 3) firms whose share of final sales are above 50% but below 100%; and 4) retailers: firms that sell only to final consumers. As Figure 4 shows, the estimated effect is stronger the larger the share of sales to final consumers. The difference in impact between retail firms and upstream firms is indeed substantial. While the response among retailers is a 2.45% increase in the probability of paying more taxes, the response is only 0.47% among upstream firms.
Graph 4Impact by Share of Final Sales
Notes: Each bar represents a separate regression for each category of shares of sales to final consumers. The numbers on top of the bars indicate the coefficient on being in the treatment group. The height of the bar represents the effect of receiving the notice as a percentage point increase in the probability of paying higher taxes than last year. *** = significant at the 1% level, **= significant at the 5% level, * = significant at the 10% level.
Similar to Pomeranz (2013), these results show that the effect of the notice is stronger on firms that have a larger proportion of sales to the final consumer. This is also in line with the self-enforcement hypothesis of the Value Added Tax. In the final stage of the production chain, the self-enforcing mechanism, which operates through the paper trail built into the VAT structure, breaks down: while it is in the firms’ interest to ask suppliers for receipts in order to be able to deduct input costs from their VAT bill, final consumers have no incentive to do so (Keen, 2007).
2.3.2 Constructing a risk indicator
The analysis by subgroup shown above allows evaluating the extent of response for different groups of taxpayers. However, each taxpayer of course has many characteristics, and they are often correlated with one another. For example, retail firms also tend to be smaller firms. Tax authorities may therefore want to construct risk indictors that take into account many different characteristics of taxpayers, and predict for each taxpayer the likelihood of
CIAT/AEAT/IEF Tax Administration Review No. 3616
responding to increased deterrence based on its characteristics. We present a very simple way to construct such a risk indicator based on regression analysis. We then briefly discuss how the results from the randomized deterrence messages can be used in combination with more sophisticated methods of data mining and prediction models.
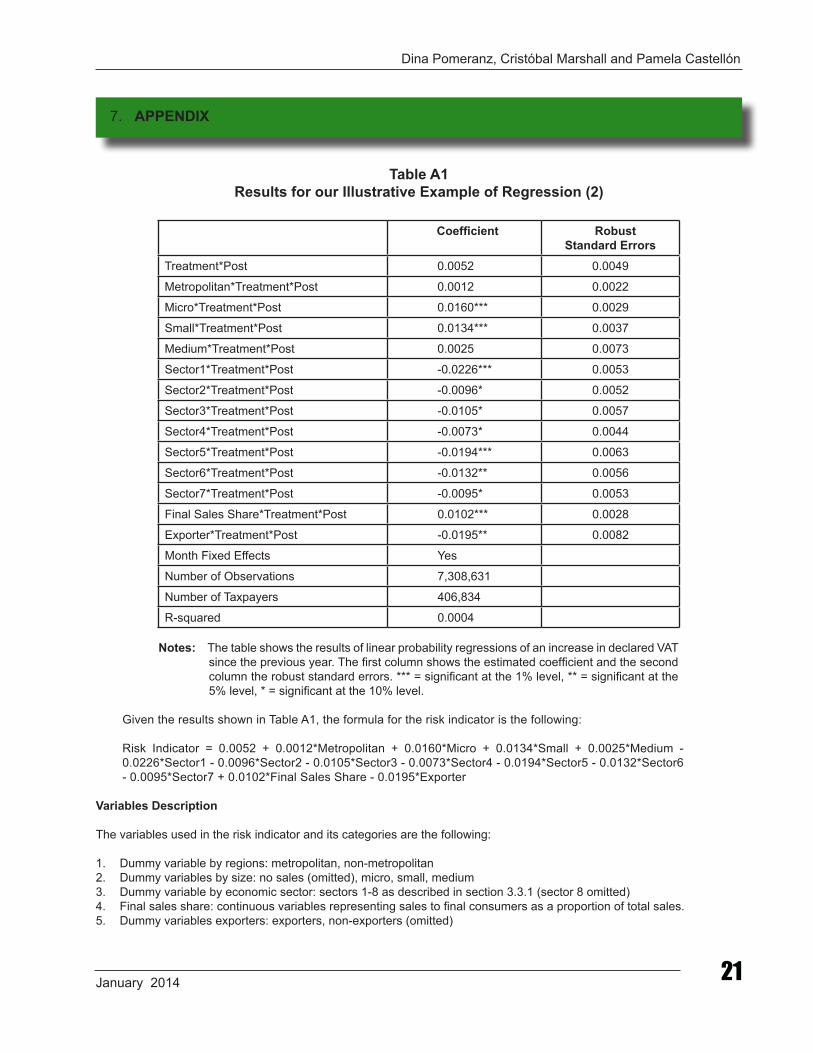
To construct our simple risk indicator, we first calculate regression (2) for the entire sample with a set of taxpayer characteristics Xi. We then use the estimated coefficients 1 and 3 to calculate equation (3). 3 is a vector with a coefficient for each taxpayer characteristic, and will therefore be different for different firms. For an illustrative example, see the calculations in the appendix.
In our simple model, the value of the risk indicator ranges from -4.42% to 3.26%. The mean of the indicator is 1.04% and the standard deviation 1.02%. To get a sense of the differences in the magnitudes of the reaction to the notice among taxpayers, we can compare the value of the risk indicator at different parts of the distribution. The mean for the 99% percentile is 2.6 times larger than the mean for the entire sample, suggesting there are potentially large gains from targeting audits towards those firms that are more likely to increase tax payments when faced with a higher probability of being audited.
Many tax administrations are moving towards the use of more sophisticated prediction models, based on modern data mining techniques. The input from the randomized deterrence messages can be used as input into these models as well. To be able to combine the results from the randomized intervention with the data-mining
environment, an important additional step needs to be conducted.
The challenge lies in the fact that the prediction models require some risk measure to be associated directly with each observation. For example, tax administrations sometimes use information of whether a taxpayer has been detected for evasion in the past as one such measure. (As discussed above, these measures can frequently suffer from selection bias, because it is not random, which taxpayers were monitored to detect evasion in the past.) However, in the case the data obtained from of the randomized experiment, there is no direct risk measure associated with each taxpayer. Instead, the information about how risky a taxpayer is only becomes apparent in comparison with the control group.
The following step allows bridging this gap: the prediction technology is applied twice, in a two-step process. First, tax payments for each firm are predicted, based on observable characteristics in the control group. Then, the difference is calculated for those in the treatment group, between the predicted value and the actual value. The predicted value is the value that would have been expected for the treated taxpayers, based on their observable characteristics, in the absence of treatment. The difference between actual and predicted can therefore be taken as a measure of the response to the deterrence message. This difference can now be used as input into the regular risk-based auditing models that the tax authority uses. For example, instead of (or in addition to) using a measure indicating whether a taxpayer has been detected for evasion in the past, the difference between actual and predicted can be used as a risk measure to build the risk indicator.
Dina Pomeranz, Cristóbal Marshall and Pamela Castellón
January 2014 17
In the course of implementing this methodology in Chile, a number of key lessons were learned. These lessons might also be useful for other tax authorities that are considering implementing a similar strategy, or for other organizations that conduct audits and can therefore follow the proposed methodology. The authors are also available to answer questions and provide support for practical implementation of this approach.
• Selecting the right message: The wording used in the deterrence letters not only needs to transmit effectively the increase in the probability of being audited, but should also avoid confusion among taxpayers and minimize the cases when taxpayers come to tax offices or call to request additional information. This allows minimizing both the cost of this intervention for the tax authority and the compliance costs for the taxpayers. Pretesting different types of wording and piloting the intervention can therefore be very useful to address these kinds of issues.
• Ensuring the right taxpayers receive the letter: To deal with this issue, the implementation of the methodology in Chile only included taxpayers with valid postal addresses. In addition, all the letters were sent via certified mail, which allowed for tracking those taxpayers who actually received the letter.
• Trade-off between simplicity and prediction: When estimating a reaction to the notice with regression analysis, it is important to determine what variables representing taxpayers’ characteristics will be included in the regression analysis, and ultimately in the risk indicator. Since it is not clear ex-ante what kind of characteristics might have an effect
on the outcome variable, one approach is to include in the regression as many potential explanatory variables as possible, and then rely on the statistical selection criteria to determine the right model.13 An alternative approach is to rely on a more simplified model that would include variables that are easy to interpret and analyze. In other words, there is a trade-off between increasing the predictive power of the model and relying on a more stable model in terms of time-consistency and resistance to noise in the data. More sophisticated data mining methods, as described above, are specifically designed to deal with such challenges, and to generate predictions based on large datasets.
• Replications: Some of the aforementioned lessons suggest that this methodology is better suited for certain contexts. For example, implementation would be more challenging in an environment where the tax authority lacks credibility, or where corruption limits the scope of audits to generate a real threat to taxpayers. On the other hand, implementation is easier where the tax authority has a strong reputation and better mechanisms are in place to credibly enforce audits.
• Sample size vs. long-term credibility: Being able to find statistically significant results requires a large number of treated firms. However, if taxpayers learn that a large number of notices were sent or that notices are sent repeatedly, they might assume that the tax authority has no intention or capacity to proceed with the auditing, or that the audits will not be very thorough. This could eventually attenuate or even eliminate any possible reaction from taxpayers (Ebrill et al 2001). In order to avoid such unintended
3. IMPLEMENTATION LESSONS LEARNED
13. For a discussion on application of statistical selection criteria see Sala-I-Martin et al. (2004).

CIAT/AEAT/IEF Tax Administration Review No. 3618
consequences, a tax authority that wishes to apply this methodology systematically and repeatedly should consider having the mailing followed by a number of actual detailed audits among taxpayers in the treatment group in order to produce a salient and credible increase in the likelihood of audit for these taxpayers. The tax authority might also consider sending a smaller number of letters regularly, rather than a very large number at the same time. The information acquired from these notices can then be aggregated over time in order to achieve the sufficient
sample size that provides the statistical power required for the risk indicator.
A combination of the mass-mailing strategy with a more long-term strategy can be to do a one-time mailing with a very large sample size in the first year, which gives baseline information for the risk indicator, and will work due to the one-time surprise. After that, the tax authority can use smaller mailings with a higher real increase in the audit probability to maintain credibility and at the same time assess possible changes in the responses over time.
A simple back of the envelope calculation can show that constructing a risk indicator and using it for the purpose of optimizing auditing can be highly cost-effective. There are two types of benefits to the construction of a risk indicator: (i) a direct benefit of the increased revenue from the response to the notice, and (ii) subsequent benefits from using an optimized audit strategy based on the information provided by the risk indicator.
Similarly, there are also two types of costs: (i) a direct cost of distributing the deterrence notices and possible additional costs of enforcement measures associated with the deterrence notice, and (ii) a potential loss of credibility if messages that are not supported by real increases of the audit probability are sent out by the tax authority repeatedly (see discussion above on how to minimize this risk).
In terms of the direct returns associated with producing the indicator, we can compare the benefits of increasing tax revenues among the taxpayers that randomly received the deterrence notice to the actual cost of sending out the notice. When comparing total payments between treatment and control groups we found that the additional revenues for the first 6 months after
mailing the letters were in the order of 10 million USD, and after 18 months in the order of 16 million USD. On the other hand, the total costs of implementation, including the cost of sending out the letters, were in the order of 100,000 USD plus the costs related to implementing additional audits and administration. This is orders of magnitudes below the benefits obtained by the increase in tax revenues.
The subsequent benefits associated with the improved audit strategy are the result of targeting more heavily those firms with a higher estimated probability of paying higher taxes in response. As shown in the case of Chile, the large dispersion in the distribution of the risk indicator and how those differences are driven by specific firm characteristics provides scope to improve the targeting of auditing and reap benefits in terms of higher tax revenues. In addition, the tax authority was able to use the information obtained in the study for other purposes, such as gaining information about the duration of deterrence effects, improving the mailing system, and making budgetary calculations. Finally, many lessons learned and skills built during the implementation process have been employed fruitfully in subsequent internal studies and analyses.
4. COST-BENEFIT ANALYSIS
Dina Pomeranz, Cristóbal Marshall and Pamela Castellón
January 2014 19
This paper presents a new methodology to generate information that can be used to optimize the audit strategy of tax administrators. Based on a randomized evaluation design, this method allows estimating what types of taxpayers are more likely to react to an increase in the perceived probability of being audited. That information can then be used to construct a risk indicator. Tax authorities can use this risk indicator to optimize their audit strategies, which is often regarded as one of the main priorities for tax administration (Ebrill et al., 2001; Bird and Gendron, 2007).
This approach has two main advantages. First, it creates valuable information for tax administrators that is otherwise costly to obtain and usually only available for a small and non-representative set of taxpayers. This is especially relevant as the amount of information the tax authority has about different types of transactions in the economy has been found to be a key element that explains the difference in the performance of tax systems between developed and developing
countries (Gordon and Li, 2009). Second, unlike most risk indicators that make predictions based on past information and thereby are likely to suffer from self-selection and omitted-variable bias, our randomized design creates a reliable estimator of taxpayers’ true responses to the audit threat.
The lessons from the application of our proposed methodology among VAT taxpayers in Chile show the importance of carefully designing and implementing the proposed analysis. Working with the appropriate sample size, ensuring the internal validity of the experiment, using the right wording to effectively change taxpayers’ perceived probability of being audited, and truth-telling to maintain the credibility and deterrence power of the tax authority are all key elements to the success of the intervention. A similar approach can be used by tax authorities in many different contexts and for different taxes. Furthermore, it can easily be tailored to other types of organizations, whose operations require the implementation of audits or other monitoring processes.
5. CONCLUSIONS
Adimark (2006). Imagen del Servicio de Impuestos Internos. Retrieved from http://www.sii.cl/aprenda_sobre_impuestos/estudios/imagen.htm
Bird, R. & Gendrom, P. P. (2007). The VAT in Developing and Transitional Countries. New York: Cambridge University Press.
Duflo, E., Glennerster, R. & Kremer, M. (2007). Using Randomization in Development Economics Research: A Toolkit. Handbook of Development Economics, 4, 3895-3962.
Ebrill, L., Keen, M., Bodin, J. P. & Summers, V. (2001). The Modern VAT. International Monetary Fund, 1 (1), 1-23.
Keen, M. (2007). VAT Attacks!, International Tax and Public Finance, 14 (4), 365-381.
Keen, M. & Lockwood, B. (2010). The Value Added Tax: Its Causes and Consequences. Journal of Development Economics, 92 (2), 138-151.
6. BIBLIOGRAPHY
CIAT/AEAT/IEF Tax Administration Review No. 3620
Kleven, H. J., Kreiner, C. T. & Saez, E. (2009). Why Can Modern Governments Tax so Much? An Agency Model of Firms as Fiscal Intermediaries. NBER Working Paper, 15218.
Kopczuk, W. & Slemrod, J. (2006). Putting Firms into Optimal Tax Theory. American Economic Review: Papers and Proceedings, 96 (2), 130-134.
Pomeranz, D. (2013). No Taxation without Information: Deterrence and Self-Enforcement in the Value Added Tax. NBER Working Paper 19199.
Sala-I-Martin, X., Doppelhofer, G. & Miller, R. I. (2004). Determinants of Long-Term Growth: A Bayesian Averaging of Classical Estimates (BACE) Approach. The American Economic Review, 96 (4), 813-835.
Servicio de Impuestos Internos (2012). Ingresos Tributarios Anuales 1993 a 2012. Retrieved from http://www.sii.cl/estadisticas/
Vellutini, Ch. (2011). Risk-Based Audits: Approaches and Country Experience. The World Bank, Working Paper.
Dina Pomeranz, Cristóbal Marshall and Pamela Castellón
January 2014 21
Table A1Results for our Illustrative Example of Regression (2)
Coefficient Robust Standard Errors
Treatment*Post 0.0052 0.0049
Metropolitan*Treatment*Post 0.0012 0.0022
Micro*Treatment*Post 0.0160*** 0.0029
Small*Treatment*Post 0.0134*** 0.0037
Medium*Treatment*Post 0.0025 0.0073
Sector1*Treatment*Post -0.0226*** 0.0053
Sector2*Treatment*Post -0.0096* 0.0052
Sector3*Treatment*Post -0.0105* 0.0057
Sector4*Treatment*Post -0.0073* 0.0044
Sector5*Treatment*Post -0.0194*** 0.0063
Sector6*Treatment*Post -0.0132** 0.0056
Sector7*Treatment*Post -0.0095* 0.0053
Final Sales Share*Treatment*Post 0.0102*** 0.0028
Exporter*Treatment*Post -0.0195** 0.0082
Month Fixed Effects Yes
Number of Observations 7,308,631
Number of Taxpayers 406,834
R-squared 0.0004
Notes: The table shows the results of linear probability regressions of an increase in declared VAT since the previous year. The first column shows the estimated coefficient and the second column the robust standard errors. *** = significant at the 1% level, ** = significant at the 5% level, * = significant at the 10% level.
Given the results shown in Table A1, the formula for the risk indicator is the following:
Risk Indicator = 0.0052 + 0.0012*Metropolitan + 0.0160*Micro + 0.0134*Small + 0.0025*Medium - 0.0226*Sector1 - 0.0096*Sector2 - 0.0105*Sector3 - 0.0073*Sector4 - 0.0194*Sector5 - 0.0132*Sector6 - 0.0095*Sector7 + 0.0102*Final Sales Share - 0.0195*Exporter
Variables Description
The variables used in the risk indicator and its categories are the following:
1. Dummy variable by regions: metropolitan, non-metropolitan2. Dummy variables by size: no sales (omitted), micro, small, medium3. Dummy variable by economic sector: sectors 1-8 as described in section 3.3.1 (sector 8 omitted)4. Final sales share: continuous variables representing sales to final consumers as a proportion of total sales.5. Dummy variables exporters: exporters, non-exporters (omitted)
7. APPENDIX

The Authors: Marvin Cardoza. Director of the Economic and Tax Studies Department. Master’s degree in Economics, certificate in macroeconomics and public policies from Pontifica Universidad Católica de Chile and degree in Information Systems engineering from Pontifica Universidad Católica de Nicaragua. Professor of Economics from Pontificia Universidad Católica Madre y Maestra. External consultant of the International Monetary Fund (IMF) and the Inter-American Development Bank (IDB). Nelissa Aybar. In charge of the Studies and Measurement Section of the Department of Economic Studies. Bachelor’s Degree in Economics from Pontificia Universidad Católica Madre y Maestra. Master’s degree in Applied Economics from Utah State University.
SYNOPSIS
This study describes and analyzes the results of the application of the Fiscal Invoices in the Dominican Republic as mechanism for controlling intermediate consumption. These results show the success in the application of the mechanism, while also highlighting substantial changes, following the use of the Fiscal Invoices as component of the Anti-Evasion Plan, such as the increase in collection, reduction of noncompliance, increase with respect to the goal, among other things. The foregoing shows the successful effort being displayed by the DGII for achieving the taxpayers’ due compliance with their tax obligations.
FISCAL INVOICES: DOMINICAN EXPERIENCEMarvin Cardoza and Nelissa Aybar
Marvin Cardoza and Nelissa Aybar
January 2014 23
Contents
1. Background2. Implementation of fiscal invoices 3. Characteristics of the fiscal invoices4. Classification of fiscal invoices5. Process for obtaining the fiscal invoices6. Sending of information on fiscal invoices7. Costs and benefits of fiscal invoices8. Information crosschecks and
inconsistencies9. The DGII’s experience10. Conclusions11. Bibliography12. Annexes
Intermediate consumption refers to all nonlasting goods and services which producers acquire and use in the production process1. Such intermediate consumption represented in average 82.6% of the GDP in Latin America and the Caribbean2. Undoubtedly this part of the economy is considerable and its control constitutes a real challenge for the Tax Administration. Because of its nature, omission of these sales could be a generalized practice if there were no pertinent regulation for exercising control, especially by the informal sectors of the economy.
It is for this reason that Tax Administrations have implemented mechanisms for regulating intermediate sales between companies. Some countries like Chile (1976), Bolivia (1987), Mexico (1989), Argentina and Peru (1992), Brazil (1995), Panama (1996), Venezuela (1999), Ecuador (2002) and Colombia (2005) have applied them successfully. The Fiscal Invoice mechanism was implemented in the Dominican Republic in 2007, for regulating such consumption, while also taking advantage of the experience of other Tax Administrations which had already applied this mechanism.
This document describes the experience and results of the implementation of the Fiscal Invoices in the Dominican Republic, as mechanism for controlling sales between companies. The contents is divided into ten sections; the first one covering the background information and challenges of the project. Section two deals with the development of the legal considerations of the Fiscal Invoices; section three describes the implementation process, while section four deals with the characteristics of the receipt. In turn, section five describes the classification of the Fiscal Invoices and section six comprises the process for obtaining the receipts. Section seven indicates the information which must be sent by the taxpayers in relation to the Fiscal Invoices; section eight describes the costs and benefits of the project; section nine analyzes the evolution of the information crosschecks, and finally section ten provides an account of the DGII’s experience in the implementation of the project.
1. Definition taken from the glossary of the Dominican Republic´s Central Bank.2. Estimated average based on data from Intermediate Consumption and Gross Domestic Product from Nicaragua, Bolivia, Costa Rica, Ecuador,
Guatemala, Paraguay, Dominican Republic, Chile and Colombia for different years. Data obtained from the countries’ central banks and statistics offices.
CIAT/AEAT/IEF Tax Administration Review No. 3624
The use of Fiscal Invoices originated as an initiative of the Anti-Evasion Plan presented by the General Directorate of Internal Taxes (DGII) in late 2004. It was aimed at establishing an effective tax compliance control mechanism and thus reduce evasion which, in the case of the TTIGS3 represented 41.7% of potential collection that same year. The plan was initially implemented in January 2005 and, in general, covered two dimensions: 1. Control of local sales intended for
intermediate consumption: sales between companies or between taxpayers.To this end, the Fiscal Invoices or Invoicing Control system was established in 2007.
2. Control of local sales intended for final consumption:
• Control of sales made with credit or debit card. This initiative served as origin of Regulation 08-04, of October 2004, which provides for the obligation of companies administering cards to withhold the TTIGS paid by the consumers.
• Control of cash sale transactions, principally carried out by end consumers. The tax printers project thus corresponds to this sphere.
This type of regulation had been previously implemented in other countries of the region and therefore, was an advantage for the Dominican Republic, on being able to include the best practices of the international experience. Some of the countries that had implemented it were Chile (1976), Bolivia (1987), Mexico (1989), Argentina and Peru (1992), Brazil (1995), Panama (1996), Venezuela (1999), Ecuador (2002) and Colombia (2005). It should be noted that in many other Latin American countries the
control of Fiscal Invoices was applied jointly with the Value Added Tax or VAT, as purchase and sales control mechanism and also the companies’ expenditure and revenue control.
The Dominican Project involved the regulation of the invoices that generate tax credit and/or sustain costs and expenditures; that is, those invoices which the taxpayers could use for registering costs and expenditures that may be deductible from IT or as credit of the TTIGS. It also covered the invoices to end consumers (without tax credit value), the debit and credit notes and special Fiscal Invoices such as: the informal suppliers register, the single revenue registey, minor expenditures registery and operations register for companies abiding by special taxation systems.
Legal framework
The Dominican laws grant the Tax Administration the power to examine the economic activities mainly so that all taxpayers may comply with the tax obligations dealing with the issuance of legal documents, their registration, filing and payment of the pertinent taxes. Since Fiscal Invoices are documents that prove the transfer of goods, the delivery in use or the rendering of services, their implementation is based on the supervisory work of the Administration. It is worth mentioning that such regulation does not at any time affect the right to free enterprise provided in the Constitution of the Republic.
The use of the Fiscal Invoice Number in the Dominican Republic began in January 2007, according to Presidential Decree No. 254-06 as legal basis. However, it should be noted that there is a broader legal basis in the use of this tax control resource, as described below.
1. BACKGROUND
3. TTIGS is the VAT applied in the Dominican Republic.
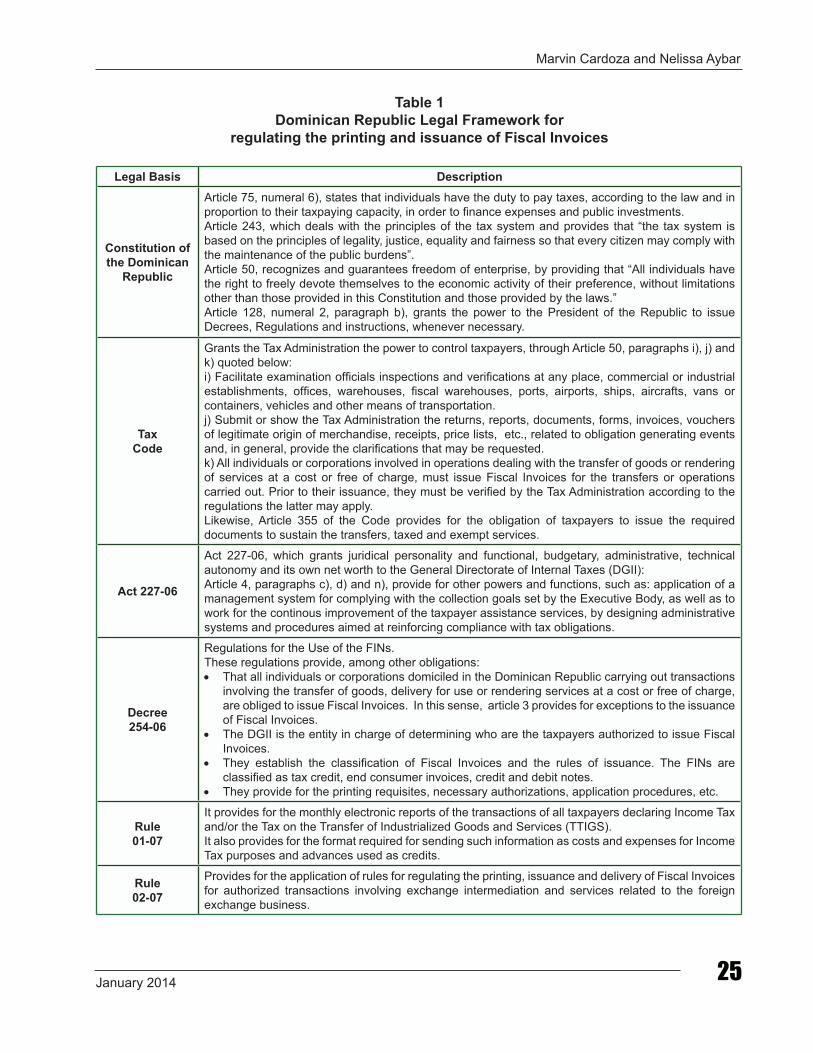
Marvin Cardoza and Nelissa Aybar
January 2014 25
Table 1Dominican Republic Legal Framework for
regulating the printing and issuance of Fiscal Invoices
Legal Basis Description
Constitution of the Dominican
Republic
Article 75, numeral 6), states that individuals have the duty to pay taxes, according to the law and in proportion to their taxpaying capacity, in order to finance expenses and public investments.Article 243, which deals with the principles of the tax system and provides that “the tax system is based on the principles of legality, justice, equality and fairness so that every citizen may comply with the maintenance of the public burdens”.Article 50, recognizes and guarantees freedom of enterprise, by providing that “All individuals have the right to freely devote themselves to the economic activity of their preference, without limitations other than those provided in this Constitution and those provided by the laws.”Article 128, numeral 2, paragraph b), grants the power to the President of the Republic to issue Decrees, Regulations and instructions, whenever necessary.
Tax Code
Grants the Tax Administration the power to control taxpayers, through Article 50, paragraphs i), j) and k) quoted below:i) Facilitate examination officials inspections and verifications at any place, commercial or industrial establishments, offices, warehouses, fiscal warehouses, ports, airports, ships, aircrafts, vans or containers, vehicles and other means of transportation.j) Submit or show the Tax Administration the returns, reports, documents, forms, invoices, vouchers of legitimate origin of merchandise, receipts, price lists, etc., related to obligation generating events and, in general, provide the clarifications that may be requested.k) All individuals or corporations involved in operations dealing with the transfer of goods or rendering of services at a cost or free of charge, must issue Fiscal Invoices for the transfers or operations carried out. Prior to their issuance, they must be verified by the Tax Administration according to the regulations the latter may apply.Likewise, Article 355 of the Code provides for the obligation of taxpayers to issue the required documents to sustain the transfers, taxed and exempt services.
Act 227-06
Act 227-06, which grants juridical personality and functional, budgetary, administrative, technical autonomy and its own net worth to the General Directorate of Internal Taxes (DGII):Article 4, paragraphs c), d) and n), provide for other powers and functions, such as: application of a management system for complying with the collection goals set by the Executive Body, as well as to work for the continous improvement of the taxpayer assistance services, by designing administrative systems and procedures aimed at reinforcing compliance with tax obligations.
Decree 254-06
Regulations for the Use of the FINs.These regulations provide, among other obligations:• That all individuals or corporations domiciled in the Dominican Republic carrying out transactions
involving the transfer of goods, delivery for use or rendering services at a cost or free of charge, are obliged to issue Fiscal Invoices. In this sense, article 3 provides for exceptions to the issuance of Fiscal Invoices.
• The DGII is the entity in charge of determining who are the taxpayers authorized to issue Fiscal Invoices.
• They establish the classification of Fiscal Invoices and the rules of issuance. The FINs are classified as tax credit, end consumer invoices, credit and debit notes.
• They provide for the printing requisites, necessary authorizations, application procedures, etc.
Rule 01-07
It provides for the monthly electronic reports of the transactions of all taxpayers declaring Income Tax and/or the Tax on the Transfer of Industrialized Goods and Services (TTIGS).It also provides for the format required for sending such information as costs and expenses for Income Tax purposes and advances used as credits.
Rule 02-07
Provides for the application of rules for regulating the printing, issuance and delivery of Fiscal Invoices for authorized transactions involving exchange intermediation and services related to the foreign exchange business.
CIAT/AEAT/IEF Tax Administration Review No. 3626
2. IMPLEMENTATION OF FISCAL INVOICES
4. Law which provides for the Regulations regarding the Printing, Issuance and Delivery of Fiscal Invoices.
In general, the process for implementing the FINs consists of five stages that began on July 15, 2006: • Phase I: Printing Shops Register (July 15,
2006)
The General Directorate of Internal Taxes created a register with the data of all printing shops or graphic establishments which, having complied with the provisions established in act 254-064, should be authorized to print valid Fiscal Invoices for tax purposes. In addition it was determined that said register should be available for consultation by all interested parties, electronically as well as physically, as well as in the different Local Administrations of the DGII.
• Phase II: Register of initial declaration of invoice inventories (August 1st, through December 15, 2006)
The register of initial declaration of inventories of invoices held by the taxpayers was set up.
• Phase III: Application for authorization to issue receipts, train the taxpayers and advertising (October 1st, 2006)
The first applications for authorization to issue Fiscal Invoices were received in
late 2006. In this regard, in the process of implementation of the Fiscal Invoices, the DGII takes care of providing the pertinent training so that they may operate as efficiently as possible. Computerized applications were developed in Internet so that all requests could be filed electronically. Also a wide direct dissemination program was carried out by means of guides, training workshops and an intensive advertising campaign to make known to the entire society the basic concepts of the new system.
• Phase IV: Issuance and use of receipts (January 1st, 2007)
In this stage, examination actions were carried out to evaluate in a significant number of businesses, compliance with the Fiscal Invoice regulations, and determining the corresponding sanctions applicable to the taxpayers who failed to comply with the provisions stated therein.
• Phase V: Sending of data (February 15, 2007)
Starting in February 2007, taxpayers began to provide the data. They could use the computerized infrastructure developed for creating the data bases and interphases in the Virtual Office’s information systems that allowed for sending them via Internet.
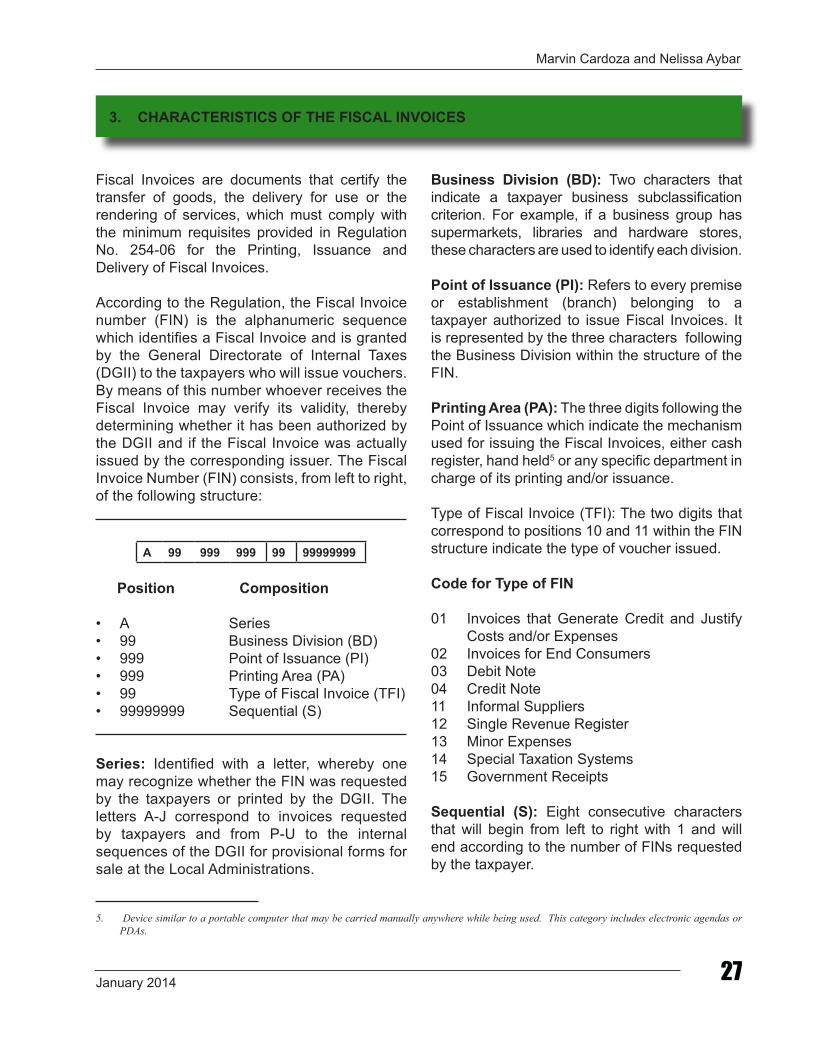
Marvin Cardoza and Nelissa Aybar
January 2014 27
Fiscal Invoices are documents that certify the transfer of goods, the delivery for use or the rendering of services, which must comply with the minimum requisites provided in Regulation No. 254-06 for the Printing, Issuance and Delivery of Fiscal Invoices.
According to the Regulation, the Fiscal Invoice number (FIN) is the alphanumeric sequence which identifies a Fiscal Invoice and is granted by the General Directorate of Internal Taxes (DGII) to the taxpayers who will issue vouchers. By means of this number whoever receives the Fiscal Invoice may verify its validity, thereby determining whether it has been authorized by the DGII and if the Fiscal Invoice was actually issued by the corresponding issuer. The Fiscal Invoice Number (FIN) consists, from left to right, of the following structure:
A 99 999 999 99 99999999
Position Composition
• A Series• 99 Business Division (BD)• 999 Point of Issuance (PI) • 999 Printing Area (PA) • 99 Type of Fiscal Invoice (TFI) • 99999999 Sequential (S)
Series: Identified with a letter, whereby one may recognize whether the FIN was requested by the taxpayers or printed by the DGII. The letters A-J correspond to invoices requested by taxpayers and from P-U to the internal sequences of the DGII for provisional forms for sale at the Local Administrations.
Business Division (BD): Two characters that indicate a taxpayer business subclassification criterion. For example, if a business group has supermarkets, libraries and hardware stores, these characters are used to identify each division.
Point of Issuance (PI): Refers to every premise or establishment (branch) belonging to a taxpayer authorized to issue Fiscal Invoices. It is represented by the three characters following the Business Division within the structure of the FIN.
Printing Area (PA): The three digits following the Point of Issuance which indicate the mechanism used for issuing the Fiscal Invoices, either cash register, hand held5 or any specific department in charge of its printing and/or issuance.
Type of Fiscal Invoice (TFI): The two digits that correspond to positions 10 and 11 within the FIN structure indicate the type of voucher issued.
Code for Type of FIN
01 Invoices that Generate Credit and Justify Costs and/or Expenses
02 Invoices for End Consumers03 Debit Note04 Credit Note11 Informal Suppliers12 Single Revenue Register13 Minor Expenses14 Special Taxation Systems15 Government Receipts
Sequential (S): Eight consecutive characters that will begin from left to right with 1 and will end according to the number of FINs requested by the taxpayer.
3. CHARACTERISTICS OF THE FISCAL INVOICES
5. Device similar to a portable computer that may be carried manually anywhere while being used. This category includes electronic agendas or PDAs.
CIAT/AEAT/IEF Tax Administration Review No. 3628
Fiscal Invoices are classified into two groups: of common and special use. Common use Fiscal Invoices are those to be permanently used in taxpayer economic transactions. They allow the purchaser to validate the deduction of Income Tax (IT) expenses and costs or tax credit of the Tax on the Transfer of Industrialized Goods and Services (TTIGS) and annul sales transactions.
• FINs that Generate Credit and Justify Costs and Expenses (Code 01):
These are receipts that record commercial goods purchase and sale transactions and/or the rendering of some service. They allow the purchaser to justify the IT expenses and costs or the TTIGS credits.
• Invoices to End Consumers (Code 02):
They justify the transfer of goods, the delivery for use or the rendering of services to end consumers. These receipts have no tax effects; that is, they cannot be used for credits in the TTIGS and/or to reduce IT expenses and costs.
• Debit Notes (Code 03):
Documents issued by those who sell goods and/or render services to recover costs and expenses, such as: interest for delinquency, freight or others, after issuing the Fiscal Invoice. These can only be issued to the same purchaser or user to modify previously issued receipts.
• Credit Notes (Code 04):
Documents issued by those who sell goods and/or render services for subsequent modifications in the selling conditions originally agreed; that is, to annul transactions,
4. CLASSIFICATION OF FISCAL INVOICES
make returns, grant discounts and bonuses, modify errors, among other similar cases.
Likewise, special Fiscal Invoices are documents that may be used as Fiscal Invoices in order to avoid alterations in the development of economic activities in those sectors, entrepreneurial or professional activities authorized by the DGII. Special Fiscal Invoices must be authorized by the DGII.
• Informal Suppliers Register (Code 11)
This type of receipt is used for registering TTIGS costs and expenses of suppliers not registered in the National Taxpayer File (NTF). This invoice will be issued as TTIGS credit or as Income Tax expenses of unregistered taxpayers acquiring goods or services. It is issued in the name of the supplier, indicating the Identity Card under which it will be reported.
• Single Revenue Register (Code 12)
Receipt used to register a summary of the transactions carried out during the day, mainly of those products exempt form the TTIGS, carried out by fuel stations, beauty parlors, grocery stores, etc. The use of this Fiscal Invoice does not exempt the taxpayer from issuing Fiscal Invoices at the request of a customer.
• Minor Expense Register (Code 13)
Registry of various expenses outside the company’s domicile to cover expenses incurred in the informal market by staff authorized by the taxpayer, such as parking, tire repair, food kiosks, occasional informal accommodation, among others.
Marvin Cardoza and Nelissa Aybar
January 2014 29
• Special Taxation Systems (Code 14)
Register of sale of goods or rendering of services to sectors abiding by special taxation systems, such as Free Zone operators, Free Zone companies, entities abiding by the Tourist Development Law, entities abiding by the Borderland Development Law, diplomatic corps
accredited to the country, entities of the Catholic Church and Non-Governmental Organizations (NGOs).
• Government Invoices (Code 15)
These are the ones used in the sale of goods and rendering of services to the State Institutions.
5. PROCESS FOR OBTAINING THE FISCAL INVOICES
There are several means for requesting the Fiscal Invoices. They may be requested through the Virtual Office by sending an electronic form with the taxpayer’s basic data (name or trade name of issuer according to the National Taxpayer File, commercial name, number of the National Taxpayer File), type of voucher to be printed or issued, number of Fiscal Invoices for which authorization is being requested. Fiscal Invoices may also be requested at the Taxpayer Assistance Center of the DGII’s Main Office or at the Taxpayer Control Area of the different Local Administrations, through authorization request
form FNCF-01. Lastly, the receipts may also be requested at the authorized printing shops through the use of the already mentioned form.
As provided in the Rules for Regulating the Printing, Issuance and Delivery of Fiscal Invoices, the DGII has a 10 working-day term to respond to the request. Nevertheless, when they are requested through the Virtual Office, the response is immediate. For the other request modalities, the response is given in 72 hours. In the case of new taxpayers requesting invoices, a visit is made to his establishment in order to verify his activity.
6. SENDING OF INFORMATION ON FISCAL INVOICES
Article 28 of the Regulations and General Rule No. 01-07 regarding the Remitttance of the Information, provide that taxpayers are obliged to attach to their annual Income Tax returns, a report with the Fiscal Invoice data, as well as to attach to their monthly TTIGS return the data relative to the Fiscal Invoices used as TTIGS advances or credits in each period.
The reports and dates for sending the information of all taxpayers declaring Income Tax and Tax on the Transfer of Goods and Services (TTIGS) should include the following:
Reports Sending datesPurchase of Goods and Services (606) The 15th of each month, at the latest
Sales of Goods and Services (Format 607) 60 days after closing date
Annulled Invoices (Format 608) Annually
Payments Abroad (Format 609) Annually
CIAT/AEAT/IEF Tax Administration Review No. 3630
Only National Large Taxpayers registered in the Large Taxpayers Office, the large taxpayers of the different Local Administrations, as well as those determined and previously notified by the DGII must send the Sale of Goods and Services Report (Format 607).
Taxpayers who are not obliged to declare or withhold the TTIGS must only submit the Purchase of Goods and Services (606) report. Corporations have up to 60 days following the closing date for sending this information. On the other hand, individuals must send it, at the latest, by February 28 of each year.
7. COSTS AND BENEFITS OF FISCAL INVOICES
Due to the magnitude of the project, it is essential to evaluate the impact of reducing tax noncompliance through the implementation of the Fiscal Invoices, whose application generates the following benefits: • Increase in collection. • Improvement of market operations, since it
reduces unfair competition which the evaders represent to those who comply.
• Increase of the system’s horizontal equity. • Generates positive externalities: greater
transparency and internal control for the taxpayer.
• Possibility of verifying final consumption through intermediate consumption; reduces double accounting, undervaluation of expenses and all the mechanisms used for reducing or evading the payment of taxes.
• Detection of informal suppliers. • Expansion of the taxpayer base.
On the other hand, the implementation involves the following costs: Increase of the Tax Administration’s budget to cover the administrative costs of the project’s
implementation (new areas, advertising and staff training).
Increase of compliance cost6. Taxpayers must send the data of purchases and sales made with Fiscal Invoices, which requires time for the preparation of the files. This directly impacts the cost of compliance and may also cause an impact on a greater level of evasion.
7.1 Costs of implementation of the mechanism
The importance of this project as part of the Anti-Evasion Plan made it necessary to invest in the creation of new areas in the institution. In 2010, the Fiscal Invoice Control Department7 was formally established for the purpose of supervising the issuance, printing and delivery of the FIN. On the other hand, several workshops, guides, lectures and training programs8 have been held for the taxpayers and tax agents. The cost of the project, which includes advertising and anual disbursements of the new areas created represented 0.04% of total TTIGS collected by the DGII in 2012. Intially, this amount was 0.06% for 2008 when the section was established for the same purpose. (See Chart 2)
6. For taxpayers, the tax compliance cost comprises all those costs in which they must incur to comply with the tax regulations, some of which are authorization and printing of payment receipts, filing of returns, updating and maintenance of accounting records. (Peñaranda Iglesias, 2008)
7. When initially established in 2006, the team in charge of the records and control of Fiscal Invoices was gathered in a Unit known as Fiscal Invoice Registration and Control Unit. Then, in 2008 it became a Section and finally in 2010 it was turned into the Fiscal Invoice Control Department.
8. For additional information see annex 1.
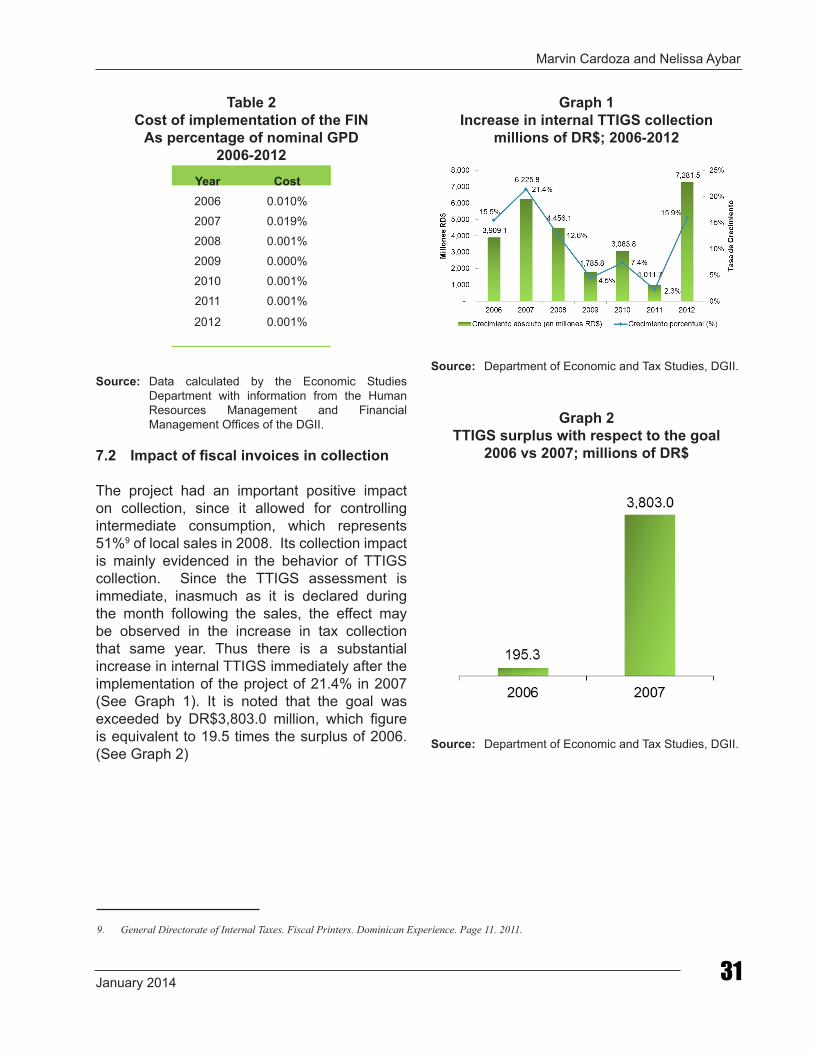
Marvin Cardoza and Nelissa Aybar
January 2014 31
Table 2Cost of implementation of the FIN
As percentage of nominal GPD2006-2012
Year Cost2006 0.010%
2007 0.019%
2008 0.001%
2009 0.000%
2010 0.001%
2011 0.001%
2012 0.001%
Source: Data calculated by the Economic Studies Department with information from the Human Resources Management and Financial Management Offices of the DGII.
7.2 Impact of fiscal invoices in collection
The project had an important positive impact on collection, since it allowed for controlling intermediate consumption, which represents 51%9 of local sales in 2008. Its collection impact is mainly evidenced in the behavior of TTIGS collection. Since the TTIGS assessment is immediate, inasmuch as it is declared during the month following the sales, the effect may be observed in the increase in tax collection that same year. Thus there is a substantial increase in internal TTIGS immediately after the implementation of the project of 21.4% in 2007 (See Graph 1). It is noted that the goal was exceeded by DR$3,803.0 million, which figure is equivalent to 19.5 times the surplus of 2006. (See Graph 2)
Graph 1Increase in internal TTIGS collection
millions of DR$; 2006-2012
Source: Department of Economic and Tax Studies, DGII.
Graph 2TTIGS surplus with respect to the goal
2006 vs 2007; millions of DR$
Source: Department of Economic and Tax Studies, DGII.
9. General Directorate of Internal Taxes. Fiscal Printers. Dominican Experience. Page 11. 2011.
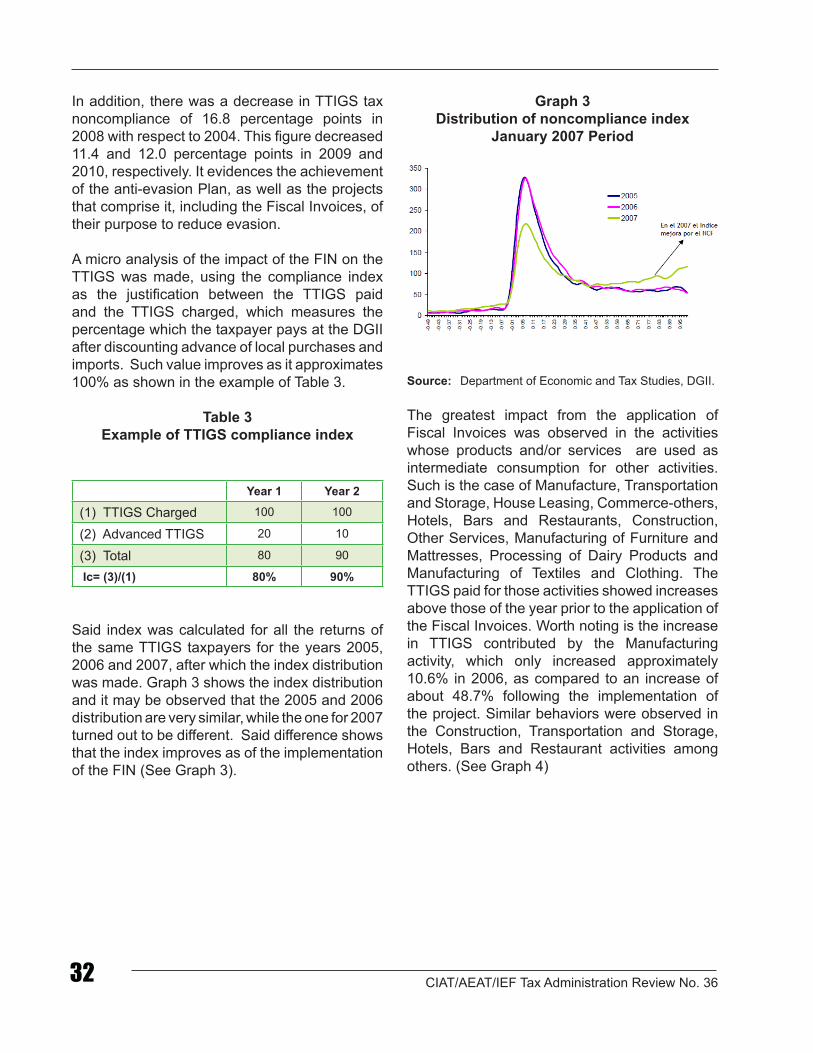
CIAT/AEAT/IEF Tax Administration Review No. 3632
In addition, there was a decrease in TTIGS tax noncompliance of 16.8 percentage points in 2008 with respect to 2004. This figure decreased 11.4 and 12.0 percentage points in 2009 and 2010, respectively. It evidences the achievement of the anti-evasion Plan, as well as the projects that comprise it, including the Fiscal Invoices, of their purpose to reduce evasion.
A micro analysis of the impact of the FIN on the TTIGS was made, using the compliance index as the justification between the TTIGS paid and the TTIGS charged, which measures the percentage which the taxpayer pays at the DGII after discounting advance of local purchases and imports. Such value improves as it approximates 100% as shown in the example of Table 3.
Table 3Example of TTIGS compliance index
Year 1 Year 2
(1) TTIGS Charged 100 100
(2) Advanced TTIGS 20 10
(3) Total 80 90
Ic= (3)/(1) 80% 90%
Said index was calculated for all the returns of the same TTIGS taxpayers for the years 2005, 2006 and 2007, after which the index distribution was made. Graph 3 shows the index distribution and it may be observed that the 2005 and 2006 distribution are very similar, while the one for 2007 turned out to be different. Said difference shows that the index improves as of the implementation of the FIN (See Graph 3).
Graph 3Distribution of noncompliance index
January 2007 Period
Source: Department of Economic and Tax Studies, DGII.
The greatest impact from the application of Fiscal Invoices was observed in the activities whose products and/or services are used as intermediate consumption for other activities. Such is the case of Manufacture, Transportation and Storage, House Leasing, Commerce-others, Hotels, Bars and Restaurants, Construction, Other Services, Manufacturing of Furniture and Mattresses, Processing of Dairy Products and Manufacturing of Textiles and Clothing. The TTIGS paid for those activities showed increases above those of the year prior to the application of the Fiscal Invoices. Worth noting is the increase in TTIGS contributed by the Manufacturing activity, which only increased approximately 10.6% in 2006, as compared to an increase of about 48.7% following the implementation of the project. Similar behaviors were observed in the Construction, Transportation and Storage, Hotels, Bars and Restaurant activities among others. (See Graph 4)
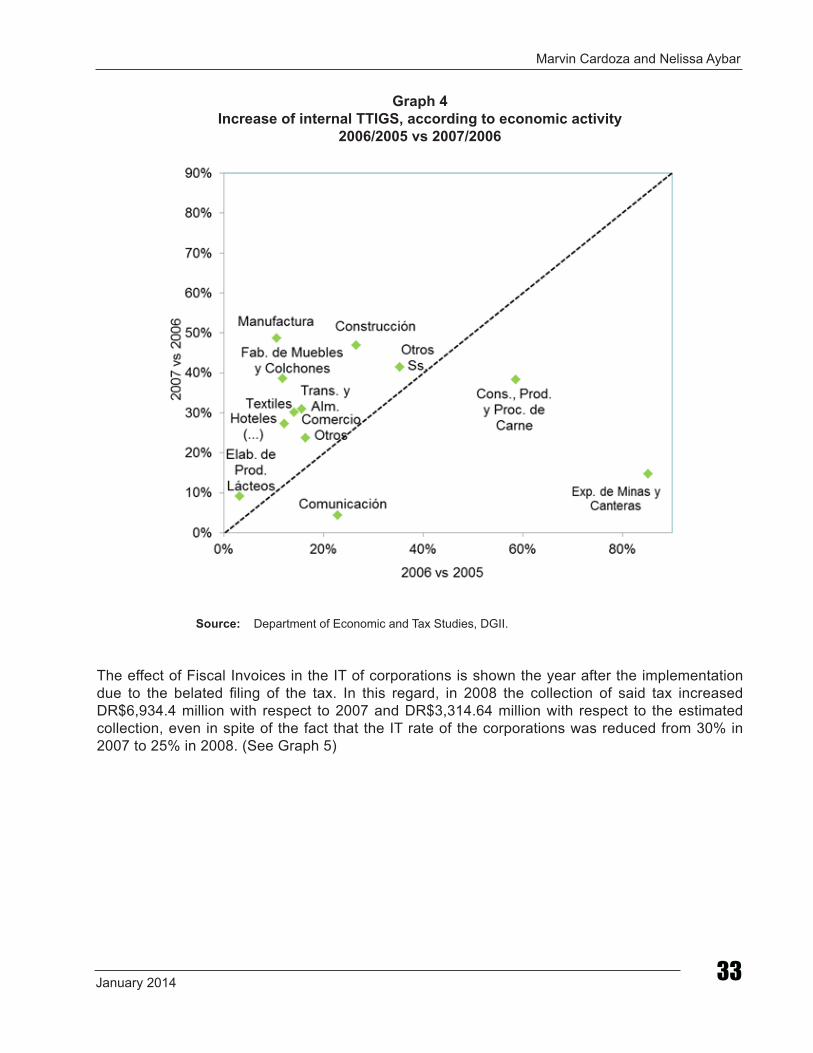
Marvin Cardoza and Nelissa Aybar
January 2014 33
Graph 4Increase of internal TTIGS, according to economic activity
2006/2005 vs 2007/2006
Source: Department of Economic and Tax Studies, DGII.
The effect of Fiscal Invoices in the IT of corporations is shown the year after the implementation due to the belated filing of the tax. In this regard, in 2008 the collection of said tax increased DR$6,934.4 million with respect to 2007 and DR$3,314.64 million with respect to the estimated collection, even in spite of the fact that the IT rate of the corporations was reduced from 30% in 2007 to 25% in 2008. (See Graph 5)
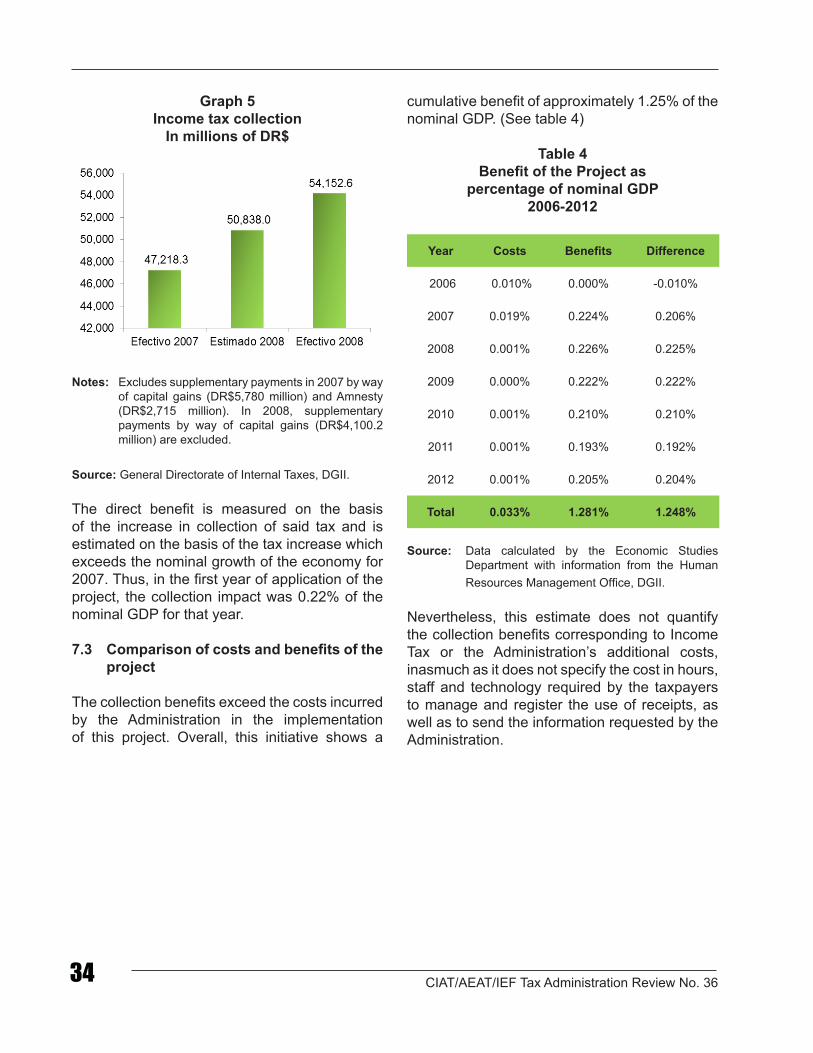
CIAT/AEAT/IEF Tax Administration Review No. 3634
Graph 5Income tax collection
In millions of DR$
Notes: Excludes supplementary payments in 2007 by way of capital gains (DR$5,780 million) and Amnesty (DR$2,715 million). In 2008, supplementary payments by way of capital gains (DR$4,100.2 million) are excluded.
Source: General Directorate of Internal Taxes, DGII.
The direct benefit is measured on the basis of the increase in collection of said tax and is estimated on the basis of the tax increase which exceeds the nominal growth of the economy for 2007. Thus, in the first year of application of the project, the collection impact was 0.22% of the nominal GDP for that year.
7.3 Comparison of costs and benefits of the project
The collection benefits exceed the costs incurred by the Administration in the implementation of this project. Overall, this initiative shows a
cumulative benefit of approximately 1.25% of the nominal GDP. (See table 4)
Table 4Benefit of the Project as
percentage of nominal GDP2006-2012
Year Costs Benefits Difference
2006 0.010% 0.000% -0.010%
2007 0.019% 0.224% 0.206%
2008 0.001% 0.226% 0.225%
2009 0.000% 0.222% 0.222%
2010 0.001% 0.210% 0.210%
2011 0.001% 0.193% 0.192%
2012 0.001% 0.205% 0.204%
Total 0.033% 1.281% 1.248%
Source: Data calculated by the Economic Studies
Department with information from the Human Resources Management Office, DGII.
Nevertheless, this estimate does not quantify the collection benefits corresponding to Income Tax or the Administration’s additional costs, inasmuch as it does not specify the cost in hours, staff and technology required by the taxpayers to manage and register the use of receipts, as well as to send the information requested by the Administration.
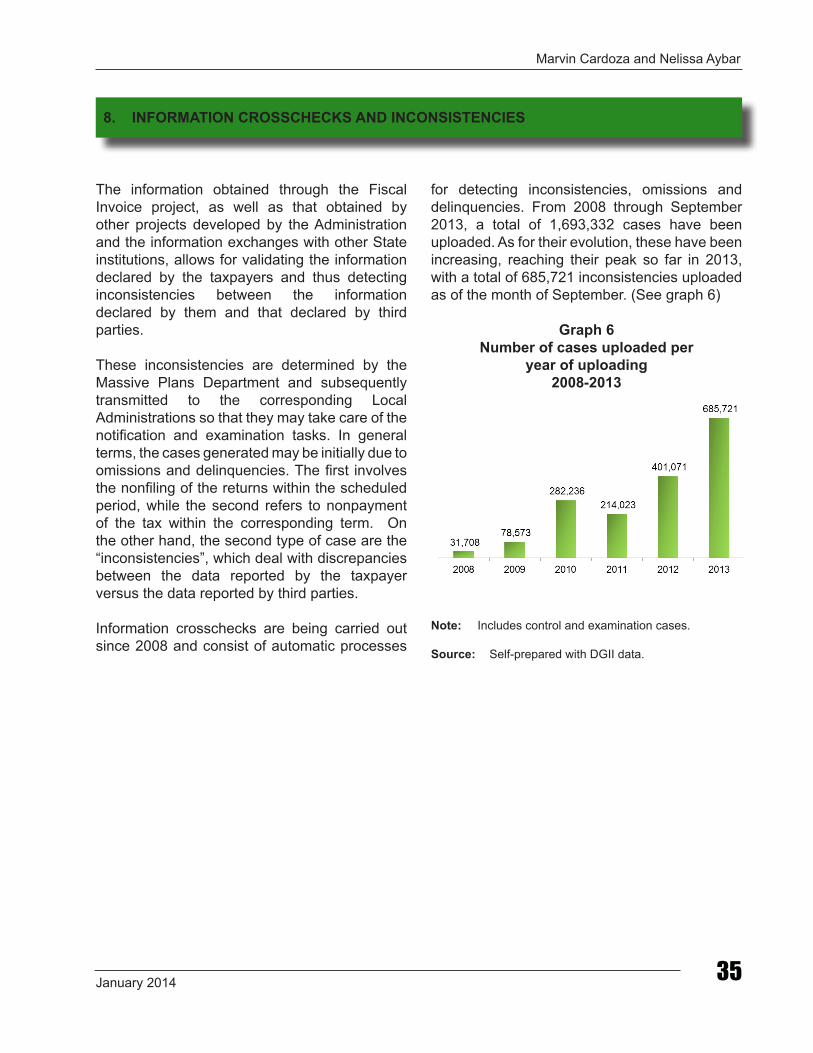
Marvin Cardoza and Nelissa Aybar
January 2014 35
The information obtained through the Fiscal Invoice project, as well as that obtained by other projects developed by the Administration and the information exchanges with other State institutions, allows for validating the information declared by the taxpayers and thus detecting inconsistencies between the information declared by them and that declared by third parties.
These inconsistencies are determined by the Massive Plans Department and subsequently transmitted to the corresponding Local Administrations so that they may take care of the notification and examination tasks. In general terms, the cases generated may be initially due to omissions and delinquencies. The first involves the nonfiling of the returns within the scheduled period, while the second refers to nonpayment of the tax within the corresponding term. On the other hand, the second type of case are the “inconsistencies”, which deal with discrepancies between the data reported by the taxpayer versus the data reported by third parties.
Information crosschecks are being carried out since 2008 and consist of automatic processes
for detecting inconsistencies, omissions and delinquencies. From 2008 through September 2013, a total of 1,693,332 cases have been uploaded. As for their evolution, these have been increasing, reaching their peak so far in 2013, with a total of 685,721 inconsistencies uploaded as of the month of September. (See graph 6)
Graph 6Number of cases uploaded per
year of uploading2008-2013
Note: Includes control and examination cases.
Source: Self-prepared with DGII data.
8. INFORMATION CROSSCHECKS AND INCONSISTENCIES
CIAT/AEAT/IEF Tax Administration Review No. 3636
9. THE DGII’S EXPERIENCE
The application of the Rules for Regulating the Printing, Issuance and Delivery of Fiscal Invoices has become an important element in the path toward transparency and reduction of evasion. Thanks to the level of the DGIII’s institutional and technological development and the institution’s high level of credibility among the taxpayers, it could be implemented without delays. It must be noted that the project was supported by all the corporate organizations, which adopted a common position of defense of the DGII’s actions, aware that the due application of tax laws guarantees them equity and an optimum environment for free competition.
The implementation of the Fiscal Invoice Control System radically changed the way the companies manage the receipts and disbursements records and accordingly, the way of presenting their economic results for tax purposes. From the standpoint of the Tax Administration, there was
a substantial change in the follow-up of the inconsistency of the returns, now with automated controls.
The amount of crosschecked information generated by the Fiscal Invoices forces entrepreneurs and businessmen to be transparent, thereby substantially reducing double accounting, undervaluation of expenditures and all the mechanisms used to evade the payment of taxes. This is achieved through Rule 01-07 issued by the DGII, which provides for the sending of monthly electronic reports of all the transactions of taxpayers declaring Income Tax and/or Tax on the Transfer of Industrialized Goods and Services (TTIGS). This measure determined the format for sending the information on costs and expenses for Income Tax purposes and advances used as credits, thus rendering transparent the taxpayer transactions and contributing to reduce tax evasion.
The Fiscal Invoice project which endeavors to control intermediate consumption is one of the most important aspects of the anti-evasion Plan, since it allows for the follow-up of at least 51% of local consumption or sales made in the Dominican territory. The massive and speedy implementation of said mechanism starting in 2007 guaranteed its significant results in the reduction of evasion, since it not only implied greater certainty on the part of the taxpayers when filing their returns, but also made available to the Tax Administration the valuable information resource.
In this sense, its application has a valuable effect not only on collection, but also on taxpayer behavior, since there is a perceived increase in risk on the part of the taxpayers and also because
of the amount of information generated from the Fiscal Invoices which conditions taxpayers to render their transactions transparent. Thus, said mechanism substantially reduces double accounting, undervaluation of expenditures and all the mechanisms used to avoid or evade the payment of taxes. Another important aspect of the project is that it counts on an appropriate legal and normative framework which has facilitated the introduction of the mechanism. There was also a strong support from the governmental authorities in facing resistance to a greater control of sales transactions. As was expected, the application of the Regulations had a positive impact on internal collections. This increase basically resulted from the taxes subject to “linking” via the FIN, which are
10. CONCLUSIONS
Marvin Cardoza and Nelissa Aybar
January 2014 37
the Income Tax (IT) and the Tax on the Transfer of Industrialized Goods and Services (TTIGS).
The other important factor has been the support of the business organizations to the institution’s struggle against tax evasion. The entrepreneurial sector adopted a common position of defense of the DGII’s actions, aware that the due application of tax laws guarantees them equity and an optimum environment for free competition.
Finally, the results show the success of the project, which is based on the increased collection of the internal TTIGS and IT, as well as the commitment of the taxpayers to comply with the tax obligations. The estimated cumulative benefits of the project amount to 1.25% of GDP from 2007 through 2012. In general, the achievements of the anti-evasion Plan have had a favorable impact on the manner of doing business in the Dominican Republic, as noted in the 2009 Doing Business report.
República Dominicana. Constitución Política de la República Dominicana, proclamada el 26 de enero. Publicada en la Gaceta Oficial No. 10561, del 26 de enero de 2010, art. 50.
República Dominicana. Constitución Política de la República Dominicana, proclamada el 26 de enero. Publicada en la Gaceta Oficial No. 10561, del 26 de enero de 2010, art. 128, numeral 2, literal b).
República Dominicana. Ley 11-92 que aprueba el Código Tributario de la República Dominicana. Publicada en la Gaceta Oficial No.9835, 16 de mayo de 1992, art. 50 literales i), j) y k).
República Dominicana. Ley 11-92 que aprueba el Código Tributario de la República Dominicana. Publicada en la Gaceta Oficial No. 9835, 16 de mayo de 1992, art. Artículo 355.
República Dominicana. Ley 227-06 Ley que otorga personalidad jurídica y autonomía funcional, presupuestaria, administrativa, técnica y patrimonio propio a la DGII. Publicada en la Gaceta Oficial No. 10369, 19 de junio de 2006, art.4, literales c), d) y n).
República Dominicana. Decreto 254-06 Reglamento para la Regulación de la Impresión, Emisión y entrega de comprobantes fiscales. Publicada en la Gaceta Oficial No. 10369, 19 de junio de 2006.
11. BIBLIOGRAPHY
Banco Mundial. (2009). Doing Business 2009. Washington, DC.
Peñaranda Iglesias, A. A. (2008). Política, Estructura e Instrumentos para la Asistencia al Contribuyente. Madrid. España. Instituto de Estudios Fiscales.
Dirección General de Impuestos Internos. (2011). Impresoras Fiscales: Experiencia Dominicana. Santo Domingo, República Dominicana.
Dirección General de Impuestos Internos. Guía del Contribuyente No. 20 Comprobantes Fiscales. Santo Domingo, República Dominicana.
Dirección General de Impuestos Internos. Guía del Contribuyente No. 21 Uso de los Comprobantes Fiscales. Santo Domingo, República Dominicana.
Conferencia sobre Las Tecnologías de la Información y de las Comunicaciones al Servicio de la Administración Tributaria. Conferencia del Director Juan Hernández Batista, durante el desarrollo de la Asamblea General del CIAT 2009. Gran Salón, Hotel Hilton, Santo Domingo, Distrito Nacional. República Dominicana.
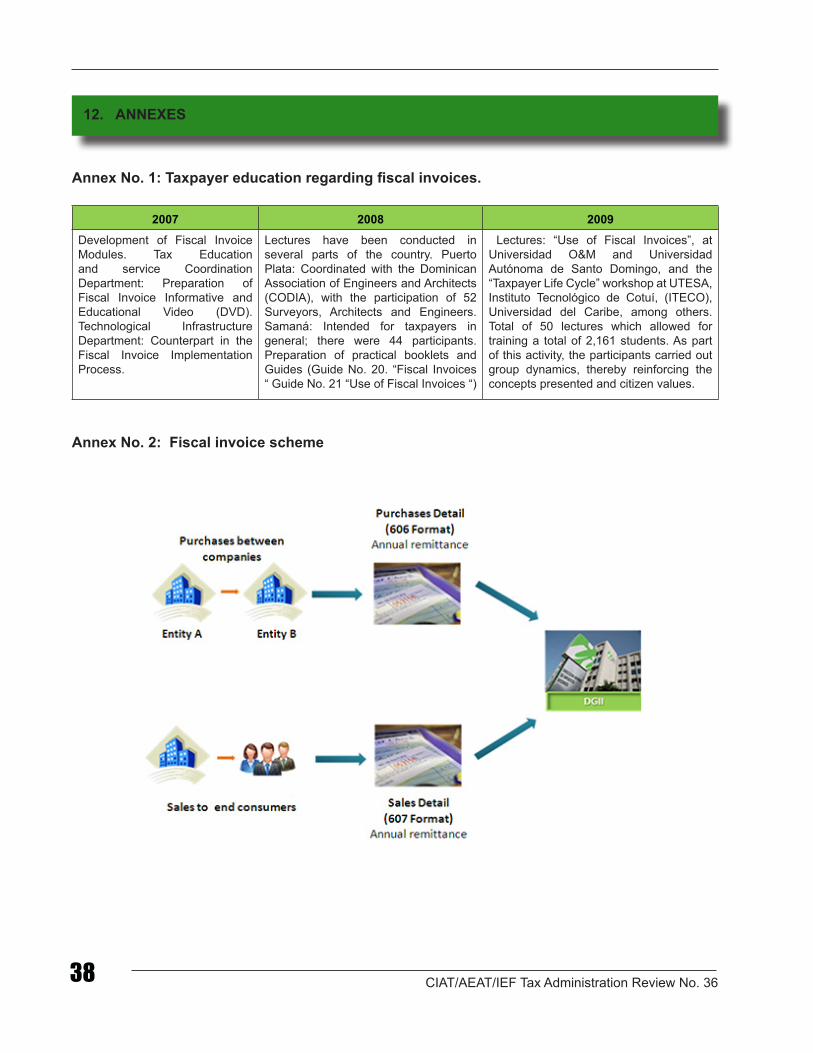
CIAT/AEAT/IEF Tax Administration Review No. 3638
Annex No. 1: Taxpayer education regarding fiscal invoices.
2007 2008 2009Development of Fiscal Invoice Modules. Tax Education and service Coordination Department: Preparation of Fiscal Invoice Informative and Educational Video (DVD). Technological Infrastructure Department: Counterpart in the Fiscal Invoice Implementation Process.
Lectures have been conducted in several parts of the country. Puerto Plata: Coordinated with the Dominican Association of Engineers and Architects (CODIA), with the participation of 52 Surveyors, Architects and Engineers. Samaná: Intended for taxpayers in general; there were 44 participants. Preparation of practical booklets and Guides (Guide No. 20. “Fiscal Invoices “ Guide No. 21 “Use of Fiscal Invoices “)
Lectures: “Use of Fiscal Invoices”, at Universidad O&M and Universidad Autónoma de Santo Domingo, and the “Taxpayer Life Cycle” workshop at UTESA, Instituto Tecnológico de Cotuí, (ITECO), Universidad del Caribe, among others. Total of 50 lectures which allowed for training a total of 2,161 students. As part of this activity, the participants carried out group dynamics, thereby reinforcing the concepts presented and citizen values.
Annex No. 2: Fiscal invoice scheme
12. ANNEXES
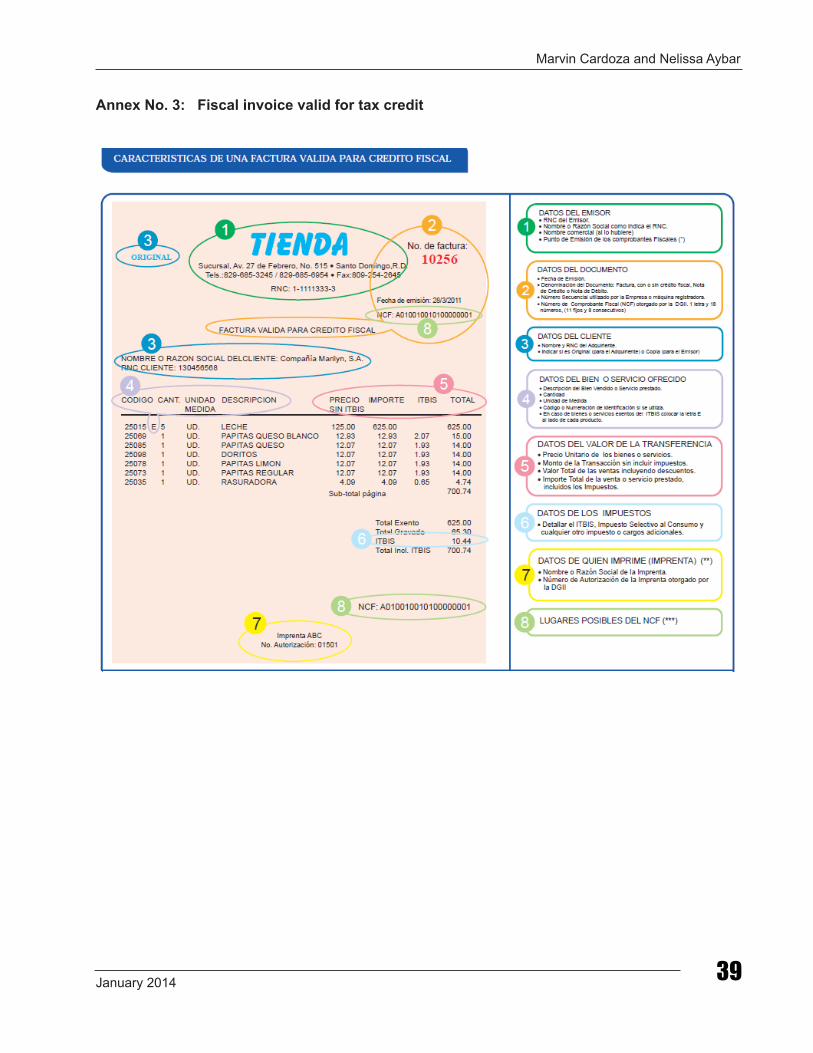
Marvin Cardoza and Nelissa Aybar
January 2014 39
Annex No. 3: Fiscal invoice valid for tax credit
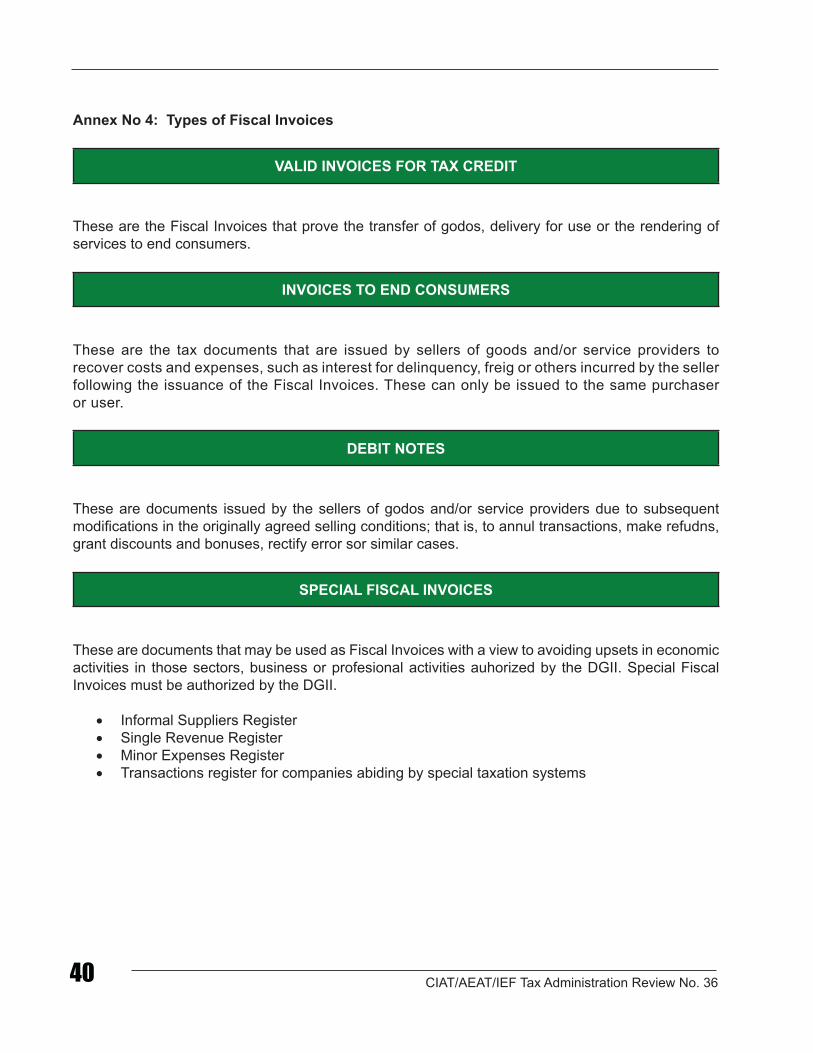
CIAT/AEAT/IEF Tax Administration Review No. 3640
Annex No 4: Types of Fiscal Invoices
VALID INVOICES FOR TAX CREDIT
These are the Fiscal Invoices that prove the transfer of godos, delivery for use or the rendering of services to end consumers.
INVOICES TO END CONSUMERS
These are the tax documents that are issued by sellers of goods and/or service providers to recover costs and expenses, such as interest for delinquency, freig or others incurred by the seller following the issuance of the Fiscal Invoices. These can only be issued to the same purchaser or user.
DEBIT NOTES
These are documents issued by the sellers of godos and/or service providers due to subsequent modifications in the originally agreed selling conditions; that is, to annul transactions, make refudns, grant discounts and bonuses, rectify error sor similar cases.
SPECIAL FISCAL INVOICES
These are documents that may be used as Fiscal Invoices with a view to avoiding upsets in economic activities in those sectors, business or profesional activities auhorized by the DGII. Special Fiscal Invoices must be authorized by the DGII.
• Informal Suppliers Register• Single Revenue Register• Minor Expenses Register• Transactions register for companies abiding by special taxation systems
The Author. National Public Accountant (John F. Kennedy University in Argentina)-Magister in Public Finances (National University of la Matanza - Public Finances Institutes of Argentina) Researcher of the Argentine Public Finance Institute and of the Centre for Tax Administration Studies, Faculty of Economics, University of Buenos Aires. He works at the Tax and Customs Training School, Federal Administration of public revenues.
SYNOPSIS
The purpose of this article is to develop aspects related with the Corporate Social responsibility (CSR) and their application to the tax administration field. For this, the concept of CSR is introduced, along with those of sustainable development and socially responsible investment, commenting on taxation and social responsibility aspects (tax compliance, tax incentive and non-fiscal or “extra-fiscal” taxation). It concludes with examples of application of this responsibility in tax administrations, mentioning the cases of Chile and Argentina, indicating guidelines and situations that administrations may consider in relation to this topic.
TAXES, SOCIAL RESPONSIBILITY AND TAX ADMINISTRATIONSEdgardo Héctor Ferré Olive
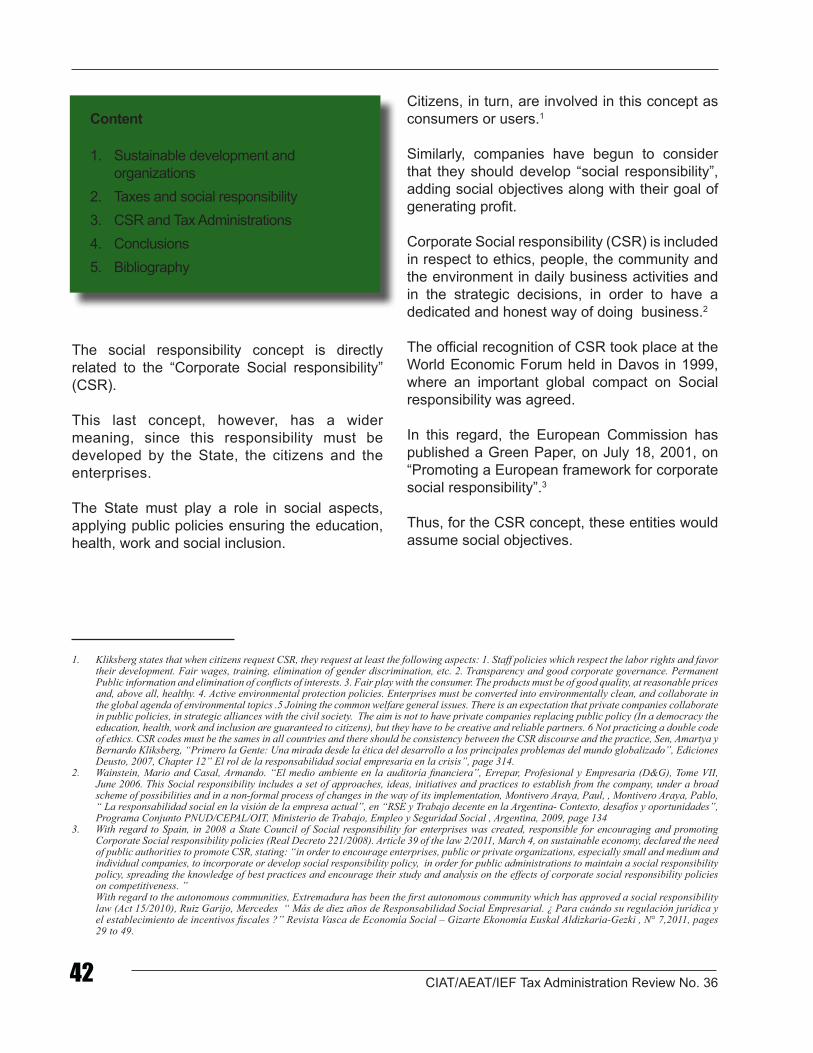
CIAT/AEAT/IEF Tax Administration Review No. 3642
Content
1. Sustainable development andorganizations
2. Taxes and social responsibility3. CSR and Tax Administrations4. Conclusions5. Bibliography
The social responsibility concept is directly related to the “Corporate Social responsibility” (CSR).
This last concept, however, has a wider meaning, since this responsibility must be developed by the State, the citizens and the enterprises.
The State must play a role in social aspects, applying public policies ensuring the education, health, work and social inclusion.
Citizens, in turn, are involved in this concept as consumers or users.1
Similarly, companies have begun to consider that they should develop “social responsibility”, adding social objectives along with their goal of generating profit.
Corporate Social responsibility (CSR) is included in respect to ethics, people, the community and the environment in daily business activities and in the strategic decisions, in order to have a dedicated and honest way of doing business.2
The official recognition of CSR took place at the World Economic Forum held in Davos in 1999, where an important global compact on Social responsibility was agreed.
In this regard, the European Commission has published a Green Paper, on July 18, 2001, on “Promoting a European framework for corporate social responsibility”.3
Thus, for the CSR concept, these entities would assume social objectives.
1. Kliksberg states that when citizens request CSR, they request at least the following aspects: 1. Staff policies which respect the labor rights and favor their development. Fair wages, training, elimination of gender discrimination, etc. 2. Transparency and good corporate governance. PermanentPublic information and elimination of conflicts of interests. 3. Fair play with the consumer. The products must be of good quality, at reasonable prices and, above all, healthy. 4. Active environmental protection policies. Enterprises must be converted into environmentally clean, and collaborate inthe global agenda of environmental topics .5 Joining the common welfare general issues. There is an expectation that private companies collaborate in public policies, in strategic alliances with the civil society. The aim is not to have private companies replacing public policy (In a democracy the education, health, work and inclusion are guaranteed to citizens), but they have to be creative and reliable partners. 6 Not practicing a double code of ethics. CSR codes must be the sames in all countries and there should be consistency between the CSR discourse and the practice, Sen, Amartya y Bernardo Kliksberg, “Primero la Gente: Una mirada desde la ética del desarrollo a los principales problemas del mundo globalizado”, Ediciones Deusto, 2007, Chapter 12” El rol de la responsabilidad social empresaria en la crisis”, page 314.
2. Wainstein, Mario and Casal, Armando. “El medio ambiente en la auditoría financiera”, Errepar, Profesional y Empresaria (D&G), Tome VII, June 2006. This Social responsibility includes a set of approaches, ideas, initiatives and practices to establish from the company, under a broadscheme of possibilities and in a non-formal process of changes in the way of its implementation, Montivero Araya, Paul, , Montivero Araya, Pablo, “ La responsabilidad social en la visión de la empresa actual”, en “RSE y Trabajo decente en la Argentina- Contexto, desafíos y oportunidades”,Programa Conjunto PNUD/CEPAL/OIT, Ministerio de Trabajo, Empleo y Seguridad Social , Argentina, 2009, page 134
3. With regard to Spain, in 2008 a State Council of Social responsibility for enterprises was created, responsible for encouraging and promoting Corporate Social responsibility policies (Real Decreto 221/2008). Article 39 of the law 2/2011, March 4, on sustainable economy, declared the need of public authorities to promote CSR, stating: “in order to encourage enterprises, public or private organizations, especially small and medium and individual companies, to incorporate or develop social responsibility policy, in order for public administrations to maintain a social responsibility policy, spreading the knowledge of best practices and encourage their study and analysis on the effects of corporate social responsibility policieson competitiveness. ” With regard to the autonomous communities, Extremadura has been the first autonomous community which has approved a social responsibilitylaw (Act 15/2010), Ruiz Garijo, Mercedes “ Más de diez años de Responsabilidad Social Empresarial. ¿ Para cuándo su regulación jurídica yel establecimiento de incentivos fiscales ?” Revista Vasca de Economía Social – Gizarte Ekonomía Euskal Aldizkaria-Gezki , N° 7,2011, pages29 to 49.
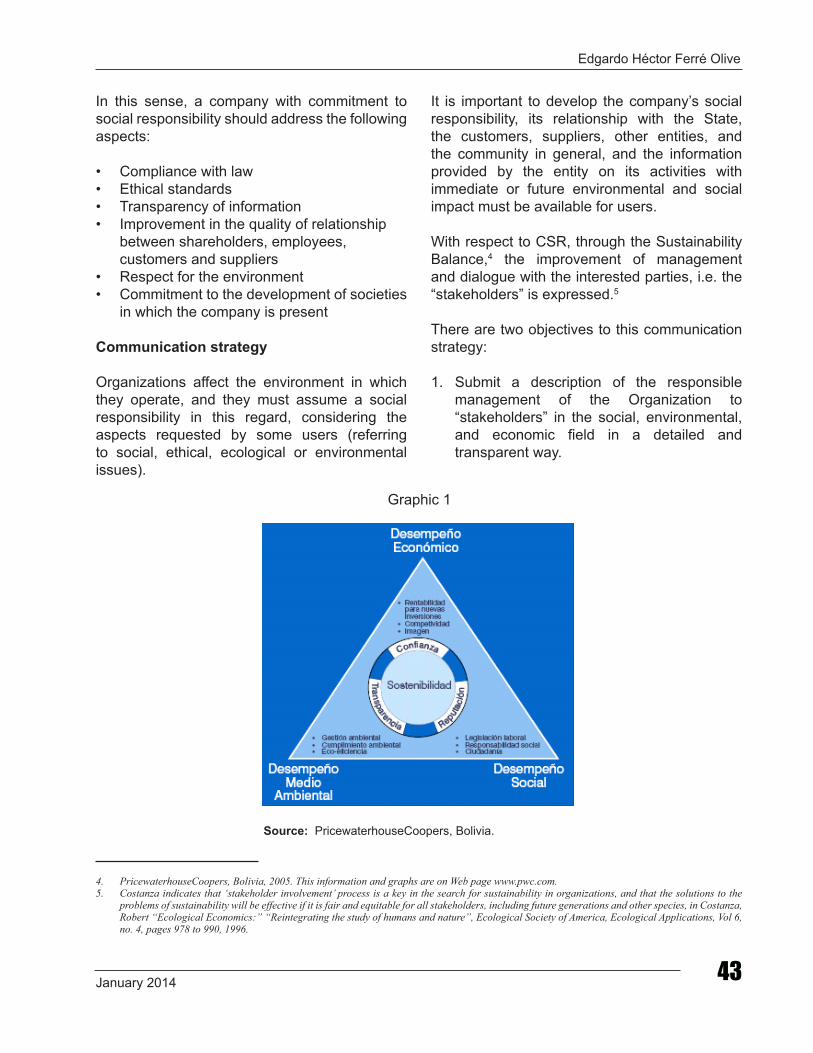
Edgardo Héctor Ferré Olive
January 2014 43
In this sense, a company with commitment to social responsibility should address the following aspects:
• Compliance with law• Ethical standards• Transparency of information• Improvement in the quality of relationship
between shareholders, employees, customers and suppliers
• Respect for the environment• Commitment to the development of societies
in which the company is present
Communication strategy
Organizations affect the environment in which they operate, and they must assume a social responsibility in this regard, considering the aspects requested by some users (referring to social, ethical, ecological or environmental issues).
It is important to develop the company’s social responsibility, its relationship with the State, the customers, suppliers, other entities, and the community in general, and the information provided by the entity on its activities with immediate or future environmental and social impact must be available for users.
With respect to CSR, through the Sustainability Balance,4 the improvement of management and dialogue with the interested parties, i.e. the “stakeholders” is expressed.5
There are two objectives to this communication strategy:
1. Submit a description of the responsible management of the Organization to “stakeholders” in the social, environmental, and economic field in a detailed and transparent way.
4. PricewaterhouseCoopers, Bolivia, 2005. This information and graphs are on Web page www.pwc.com.5. Costanza indicates that ‘stakeholder involvement’ process is a key in the search for sustainability in organizations, and that the solutions to the
problems of sustainability will be effective if it is fair and equitable for all stakeholders, including future generations and other species, in Costanza, Robert “Ecological Economics:” “Reintegrating the study of humans and nature”, Ecological Society of America, Ecological Applications, Vol 6, no. 4, pages 978 to 990, 1996.
Graphic 1
Source: PricewaterhouseCoopers, Bolivia.
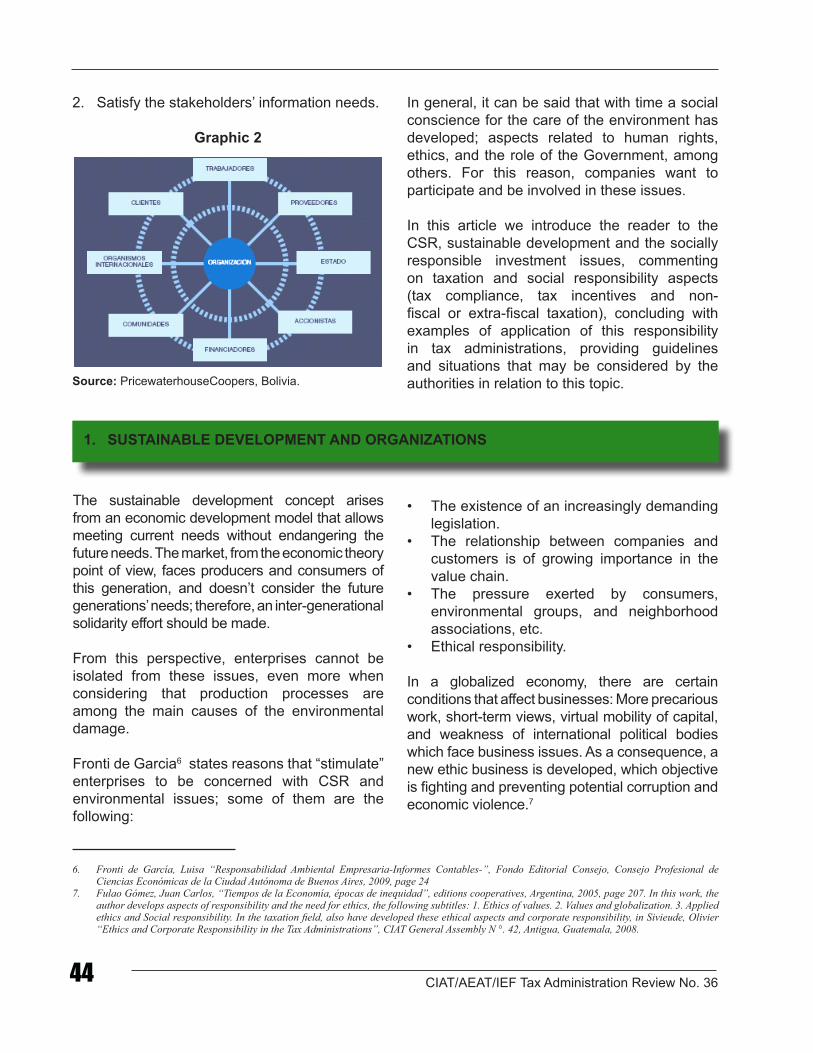
CIAT/AEAT/IEF Tax Administration Review No. 3644
2. Satisfy the stakeholders’ information needs.
Graphic 2
Source: PricewaterhouseCoopers, Bolivia.
In general, it can be said that with time a social conscience for the care of the environment has developed; aspects related to human rights, ethics, and the role of the Government, among others. For this reason, companies want to participate and be involved in these issues.
In this article we introduce the reader to the CSR, sustainable development and the socially responsible investment issues, commenting on taxation and social responsibility aspects (tax compliance, tax incentives and non-fiscal or extra-fiscal taxation), concluding with examples of application of this responsibility in tax administrations, providing guidelines and situations that may be considered by the authorities in relation to this topic.
1. SUSTAINABLE DEVELOPMENT AND ORGANIZATIONS
The sustainable development concept arises from an economic development model that allows meeting current needs without endangering the future needs. The market, from the economic theory point of view, faces producers and consumers of this generation, and doesn’t consider the future generations’ needs; therefore, an inter-generational solidarity effort should be made.
From this perspective, enterprises cannot be isolated from these issues, even more when considering that production processes are among the main causes of the environmental damage.
Fronti de Garcia6 states reasons that “stimulate” enterprises to be concerned with CSR and environmental issues; some of them are the following:
• The existence of an increasingly demanding legislation.
• The relationship between companies and customers is of growing importance in the value chain.
• The pressure exerted by consumers, environmental groups, and neighborhood associations, etc.
• Ethical responsibility.
In a globalized economy, there are certain conditions that affect businesses: More precarious work, short-term views, virtual mobility of capital, and weakness of international political bodies which face business issues. As a consequence, a new ethic business is developed, which objective is fighting and preventing potential corruption and economic violence.7
6. Fronti de García, Luisa “Responsabilidad Ambiental Empresaria-Informes Contables-”, Fondo Editorial Consejo, Consejo Profesional de Ciencias Económicas de la Ciudad Autónoma de Buenos Aires, 2009, page 24
7. Fulao Gómez, Juan Carlos, “Tiempos de la Economía, épocas de inequidad”, editions cooperatives, Argentina, 2005, page 207. In this work, the author develops aspects of responsibility and the need for ethics, the following subtitles: 1. Ethics of values. 2. Values and globalization. 3. Applied ethics and Social responsibility. In the taxation field, also have developed these ethical aspects and corporate responsibility, in Sivieude, Olivier “Ethics and Corporate Responsibility in the Tax Administrations”, CIAT General Assembly N °. 42, Antigua, Guatemala, 2008.
Edgardo Héctor Ferré Olive
January 2014 45
Ethics in organization
Ethical theories are examined and analyzed by business ethics and businesses are considered as a social practice. There are three areas which correspond to three business levels:8
1. Micro-ethics is responsible for rules of fair exchange between two individuals.
2. Macro-Ethics is the area where businesses operate.
3. Moral ethics, extending the first domain to the basic unit most prominent in current trade: the Corporation.
Corporate environmental responsibility is considered by environmental or green investment funds, investment groups that take into account if entities issuing titles or shares comply with environmental requirements in the production and marketing of their products. In these cases, we face the ethical investor.
Ethical investor
This is a type of investor who, when making an investment decision, examines not only the traditional performance and risk factors but other additional factors that must comply with ethical demands regarding the investment.
The corporate environmental responsibility, understood as the concern of the company’s management with the impact of their activities on the environment, is included within these requirements, affecting the organization’s internal and external aspects.9
8. Fulao Gómez, Juan Carlos, “Ámbitos de la ética de los negocios- Dominios de Responsabilidad Social”, SIRSO, Rio de Janeiro, 2012, page 3.9. García Fronti, Ines ‘ Responsabilidad social empresarial. “ Informes contables sobre su cumplimiento”, EDICON, Fondo Editorial del CPCECABA,
December 2006. The author develops the theory of the “stakeholders”, or multiple groups interested in the activities of the company, and the theory of the “stockholder” or shareholder, indicating that in a social reality both theories co-exist, pages 26-27.
10. Moreno Izquierdo, José “Responsabilidad Social Corporativa y Competitividad: una visión desde la empresa”, BBVA, 2004. A publication of interest from the business point of view, which has been published by the Harvard Business School, which develops commercial aspects to a “green trade strategy’, where different authors delve aspects such as” the road to a natural capitalism”, “competitive advantages in a warming planet”,” what every Executive should know Global warming”, etc., in “Harvard Business Review on Green Business Strategy”, Harvard Business School Press, U.S.A., 2007.
This type of investor will select its investment portfolio, excluding companies which do not comply with the environmental legislation or have received fines for damaging the environment.
By contrast, they will invest in companies that recycle products, are energy-saving and have a waste management policy. This investor will select its portfolio investment for a maximum performance with a minimum risk, but weighting environmental factors in his investment.
As a result, there is an increasing interest by investors to analyze the companies’ responsible corporate behavior, mainly, the socially responsible investment (Sri), which is promoted by institutional investors, using a portfolio selection criterion related to Social responsibility.
These conditions (or filters) are used with negative or mutually exclusive prospects (not investing in companies that do not incorporate certain criteria or which operate in activities considered socially, environmentally or morally harmful) or with positive prospects (by investing in companies with good practices in terms of Social Responsibility or evaluated by specialized indexes).10
Current examples are the ethical investment indexes, such as the U.S. Domini 400 Social Index, which includes an ethical impact study for 400 American companies, and which is internationally recognized and is part of the Standard & Poors 500 investment index.
CIAT/AEAT/IEF Tax Administration Review No. 3646
Regarding social responsibility, Nuñez has developed the main indicators used in CSR initiatives, including the Global Reporting Initiatives and the Guidelines for Multinational
Enterprises (OECD). She also highlighted the importance of measuring different indicators through the stock market Dow Jones Sustainability Index (DJSI) and the FTSE4Good.11
11. The author develops an interesting comparison between these indices, in aspects of corporate governance, environmental management, a human rights and labor standards, in Nuñez, Georgina “Corporate social responsibility in a Sustainable Development Framework”, ECLAC, United Nations Environment and development series, 72, November 2003, Chile.
12. The European Commission stated in a communication, that can be considered aggressive tax planning violates the principles of social responsibility of enterprises, in “Communication on a renewed strategy of the EU for 2011-2014 on the social responsibility of enterprises”, European Commission, COM (2011) 681 final, Brussels, on 25-10-2011.
13. Ruiz Garijo, op. Cit. in 3 page 33. 14. Rosembuj, Tulio “Minimización del impuesto y responsabilidad social corporativa”. Editorial el fisco, 2009, Barcelona, page 13. AVI-Yonha
indicates the society should not be allowed a strategic behavior that consists exclusively in the minimization of taxes, in Avi-Yonah, Reuven S. “Corporate Social Responsibility and Strategic Tax Behavior”, Symposium on Tax and Corporate Governance, Munich, December 2006, and co-organized by the International Network for Tax Resarch(INTR), the Max Planck Institute for Intellectual Property, Competition and Tax Law and the German IFA branch, page 28.
2. TAXES AND SOCIAL RESPONSIBILITY
Tax compliance
In term of taxation, some practices are considered socially responsible.
Socially responsible companies are those which duly meet their tax duties. They are companies that do not seek to minimize their taxes through aggressive tax planning or offshore regimes.12
The minimization of taxes hurts the State and represents an unfair behavior compared to the rest of the citizens that must pay higher taxes as a result of tax evasion and see how states decrease social spending in budgets.
The use of tax havens is a socially irresponsible practice, and has been one of the main causes of the current economic crisis, particularly in the financial field.13
Rosembuj14 indicates that the minimum tax is the one adjusted to the collective needs and sufficient for the financing of public goods needed by the community; i.e. it is the cross point between collective needs and private interests.
In this sense, the minimization of tax is any program, scheme or strategy, to avoid or evade the minimum tax compliance. It is a breakdown of social values due to excessive individual interest.
Regarding corporate social responsibility, the minimum tax must be duly paid (as well as not to exploit child labor nor damage the environment), as part of the correct behavior of a company.
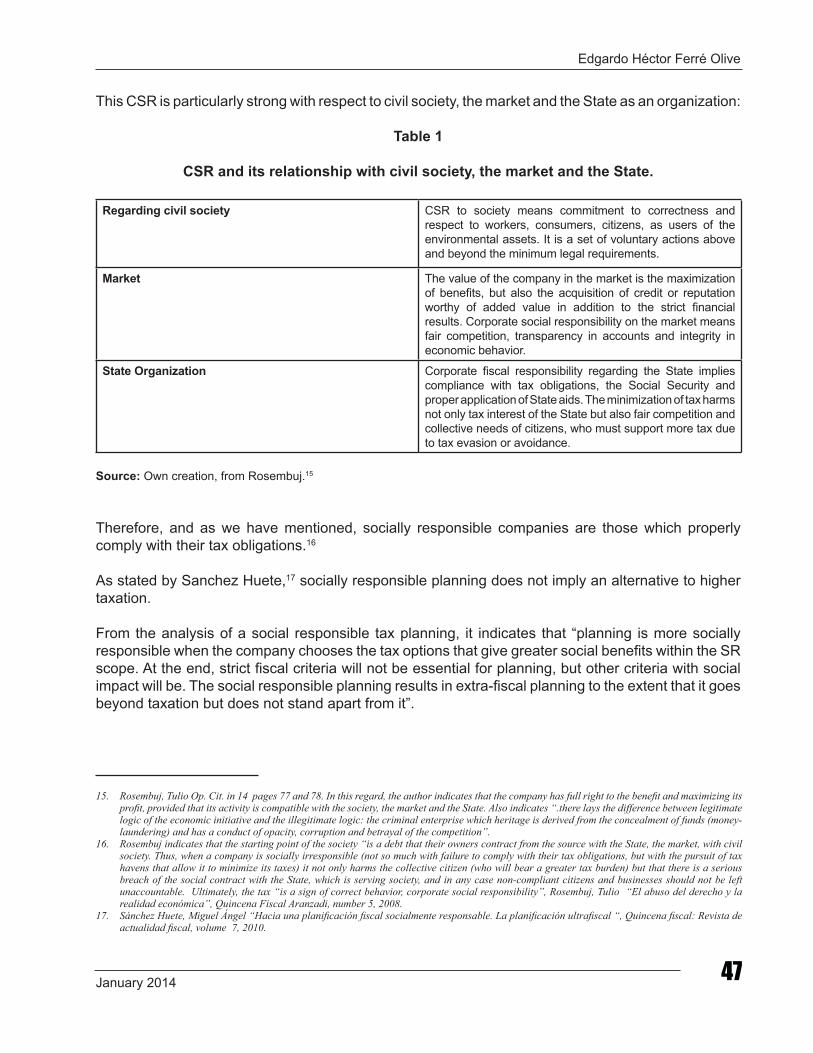
Edgardo Héctor Ferré Olive
January 2014 47
This CSR is particularly strong with respect to civil society, the market and the State as an organization:
Table 1
CSR and its relationship with civil society, the market and the State.
Regarding civil society CSR to society means commitment to correctness and respect to workers, consumers, citizens, as users of the environmental assets. It is a set of voluntary actions above and beyond the minimum legal requirements.
Market The value of the company in the market is the maximization of benefits, but also the acquisition of credit or reputation worthy of added value in addition to the strict financial results. Corporate social responsibility on the market means fair competition, transparency in accounts and integrity in economic behavior.
State Organization Corporate fiscal responsibility regarding the State implies compliance with tax obligations, the Social Security and proper application of State aids. The minimization of tax harms not only tax interest of the State but also fair competition and collective needs of citizens, who must support more tax due to tax evasion or avoidance.
Source: Own creation, from Rosembuj.15
Therefore, and as we have mentioned, socially responsible companies are those which properly comply with their tax obligations.16
As stated by Sanchez Huete,17 socially responsible planning does not imply an alternative to higher taxation.
From the analysis of a social responsible tax planning, it indicates that “planning is more socially responsible when the company chooses the tax options that give greater social benefits within the SR scope. At the end, strict fiscal criteria will not be essential for planning, but other criteria with social impact will be. The social responsible planning results in extra-fiscal planning to the extent that it goes beyond taxation but does not stand apart from it”.
15. Rosembuj, Tulio Op. Cit. in 14 pages 77 and 78. In this regard, the author indicates that the company has full right to the benefit and maximizing its profit, provided that its activity is compatible with the society, the market and the State. Also indicates “.there lays the difference between legitimate logic of the economic initiative and the illegitimate logic: the criminal enterprise which heritage is derived from the concealment of funds (money-laundering) and has a conduct of opacity, corruption and betrayal of the competition”.
16. Rosembuj indicates that the starting point of the society “is a debt that their owners contract from the source with the State, the market, with civil society. Thus, when a company is socially irresponsible (not so much with failure to comply with their tax obligations, but with the pursuit of tax havens that allow it to minimize its taxes) it not only harms the collective citizen (who will bear a greater tax burden) but that there is a serious breach of the social contract with the State, which is serving society, and in any case non-compliant citizens and businesses should not be left unaccountable. Ultimately, the tax “is a sign of correct behavior, corporate social responsibility”, Rosembuj, Tulio “El abuso del derecho y la realidad económica”, Quincena Fiscal Aranzadi, number 5, 2008.
17. Sánchez Huete, Miguel Ángel “Hacia una planificación fiscal socialmente responsable. La planificación ultrafiscal “, Quincena fiscal: Revista de actualidad fiscal, volume 7, 2010.
CIAT/AEAT/IEF Tax Administration Review No. 3648
Tax incentives
The companies that decide to be social responsible should be encouraged through tax benefits.
When a company is socially responsible, in principle it is obviously performing a public function.
This represents a saving of public spending. When these enterprises achieve general interest objectives, public authorities have a lesser task, requiring fewer public resources to meet the citizens’ demands in those areas.
If the socially responsible enterprises, therefore, contribute through their actions and policies to less public spending, obviously when it comes to paying their taxes they should contribute to a lesser extent than enterprises that do not show any social commitment.
This compensation can be done by establishing tax incentives.18
If the company is required to be socially responsible, there is a saving of public spending thanks to this performance and this justifies the application of such incentives by the State.
18. Avi-Yonha, Op. Cit. in 14 page 26, indicates that the Government has different options when it comes to promoting a specific policy: it can directly regulate, can directly subsidize certain activities, or may indirectly subsidize them through the tax system. Thus, in the field of CSR, it is considered that the tax is an ideal tool to encourage companies to assume certain social responsibilities that, in principle, seem to correspond to the State.
19. Ruiz Garijo believes that tax benefits are more effective instruments to promote CSR; since direct aid depend on annual budgets, with the uncertainty that this creates., and in turn these supports are rigid mechanisms while the incentive or tax benefit are flexible, in Op. Cit. in 3 page 39.
20. Ruiz Garijo, Op. Cit. in 3 page 39. The author also develops three precedents to analyze: 1) fiscal incentives in favor of CSR in the taxes of companies (IS) and the tax to the physical person income (income tax) applied in the common territory and the provincial territory of the Basque country, establishing deductions in environmental investments, improvement of working conditions, etc. (2) the tax regime of non-profit entities, to which Ruiz Garijo proposes to call them as RSO (social responsibility of organizations). In Spain, in non-profit entities fiscally stimulated social responsibility is given by the dominance of the SGIs in the development of their activities, and therefore, in the absence of profit. Reflected in socially responsible practices, like not giving back certain charges or not distribute heritage, in the event of dissolution, and lucrative entities (and that they not pursue aims of general interest), and 3) CSR in Extremadura, which establishes a deduction of 100% of payments for legal documents and 10% of the tax on unbuilt lots and damaged buildings taxes on production and transportation of energy, among other taxes. These benefits apply to enterprises declared “Empresa socialmente responsable de la Comunidad Autónoma de Extremadura”.
21. Friedman develops in the article critical aspects of enterprises’ social responsibility, opining that in his view entrepreneurs seek to always maximize their profits from their point of view, and that there are functions of the public power that businesses cannot develop, in Friedman, Milton “The Social Responsibility of Business is to Increase its Profits”, The New York Times Magazine, September 13,1970. Sanchez Huete indicates in this respect that social responsibility must not be an excuse or pretext to leave to the private sector the promotion of values and social rights, and that the promotion of entrepreneurship, in actions of general interest, should not be assumed as a mere cost, the cost of outsourcing one more public service, in Sánchez Huete, Miguel ángel “ La responsabilidad social y su fomento de través de normas tributarias”, in “ Ética y Responsabilidad ante la crisis”, María Ángeles Árraez Monllor y Pedro Francés Gómez (Eds. Lits.), Ediciones Sider S.C., España, Mayo de 2010, páginas 151 a 172, página 161.
These incentives may be direct or indirect, depending on whether certain subsidies and subventions are granted or if tax benefits are created.19
These tax incentives should be applied after carefully considering each tax system principles, and taking into account that the CSR:
• Is not a reward for good behavior• does not exempt the company from
compliance with its legal obligations,• is voluntary and somehow superior to the
company’s legal obligations.20
Therefore, we cannot confirm that a company is socially responsible only if they respect, for example, their workers’ labor rights.
The beneficiary of tax incentives is a company or entity (Association, Foundation, cooperative) which carries out a business activity and that satisfies a public need.
This function corresponds in theory to public authorities; and there are criticisms of the private sector replacing the public service.21
Here the general interest and private interests are joined, both being complementary to social welfare interests.
Edgardo Héctor Ferré Olive
January 2014 49
The application of these tax incentives should be done cautiously so they are not just for marketing but they do raise awareness of the company’s responsibility regarding social welfare.22
Ruíz Garijo also mentions that the CSR should be regulated at national and international levels, and he develops a list of good practices that would be within the CSR framework and for this purpose, a public entity should be competent to certify the CSR.23
Non-fiscal or extra-fiscal taxation
Strategies for social responsibility can be developed within the non-fiscal (extra-fiscal) taxation concept, following social interests linking this responsibility to what non-fiscal (extra-fiscal) taxation implies.
Through the extra fiscal character of taxes, economic and social policy principles are complemented, producing financing through collection, and prevent public expenditures; in particular, public environmental expenditures.24
22. García Calvente, Yolanda “El derecho financiero y tributario ante la Responsabilidad Social de la Empresa”, in “La Responsabilidad Social Empresarial: un nuevo reto para el Derecho”, Ediciones Marcial Pons, España, 2009, page 37.
23. Ruiz Garijo, Op. Cit. in 3 page 49.24. García Calvente, Op. Cit. in 22 page 38. Sanchez Huete, op. Cit. in 21 , p. 166, develop the concept of “non-fiscal (extra-fiscal) taxation”, stating
that in addition to the primary function of taxes to meet public expenditure, an extra-fiscal function is added, which highlights its instrumentality by waiving the collection goal .
We should here consider two cases related to CSR and the taxation scope in Latin America: Those from Chile and Argentina tax administrations.
Chile
The tax administration of Chile, service of internal taxes (SII) has established a Corporate Social responsibility Program (RSET), which specific objective is to encourage companies to promote and support training of their micro and small suppliers to the electronic invoicing system that is available on the SMEs internal revenue service website.
The objective is to generalize and legitimate this practice as the key operation mechanism in this sector, considering its multiple benefits in terms of efficiency and management.
This program is a partnership between the tax administration, which invites corporations to go beyond tax compliance, engaging them to induce smaller companies – which usually are their suppliers of goods and services – to adopt technologies and business practices that favor their development, their correct taxation, strengthen their competitiveness and their business management skills.
Argentina
With the AFIP General Resolution N ° 3424/2012 (B.O. (31/12/2012), the tax administration of Argentina (AFIP) has started a registry of socially responsible taxpayers (RSE register).
This mechanism allows a better public view of corporate commitments to the community, which demonstrates responsible behavior in social, economic and environmental aspects.
3. CSR AND TAX ADMINISTRATIONS
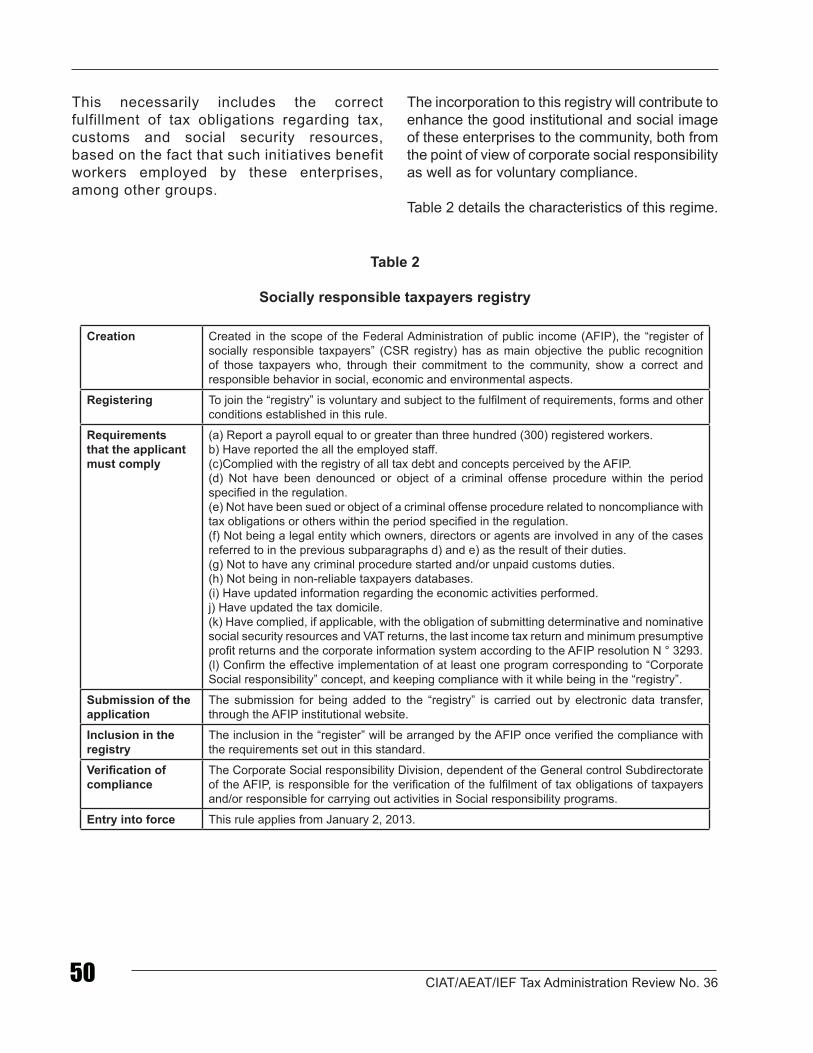
CIAT/AEAT/IEF Tax Administration Review No. 3650
This necessarily includes the correct fulfillment of tax obligations regarding tax, customs and social security resources, based on the fact that such initiatives benefit workers employed by these enterprises, among other groups.
The incorporation to this registry will contribute to enhance the good institutional and social image of these enterprises to the community, both from the point of view of corporate social responsibility as well as for voluntary compliance.
Table 2 details the characteristics of this regime.
Table 2
Socially responsible taxpayers registry
Creation Created in the scope of the Federal Administration of public income (AFIP), the “register of socially responsible taxpayers” (CSR registry) has as main objective the public recognition of those taxpayers who, through their commitment to the community, show a correct and responsible behavior in social, economic and environmental aspects.
Registering To join the “registry” is voluntary and subject to the fulfilment of requirements, forms and other conditions established in this rule.
Requirements that the applicant must comply
(a) Report a payroll equal to or greater than three hundred (300) registered workers.b) Have reported the all the employed staff.(c)Complied with the registry of all tax debt and concepts perceived by the AFIP.(d) Not have been denounced or object of a criminal offense procedure within the period specified in the regulation.(e) Not have been sued or object of a criminal offense procedure related to noncompliance with tax obligations or others within the period specified in the regulation.(f) Not being a legal entity which owners, directors or agents are involved in any of the cases referred to in the previous subparagraphs d) and e) as the result of their duties.(g) Not to have any criminal procedure started and/or unpaid customs duties.(h) Not being in non-reliable taxpayers databases.(i) Have updated information regarding the economic activities performed.j) Have updated the tax domicile.(k) Have complied, if applicable, with the obligation of submitting determinative and nominative social security resources and VAT returns, the last income tax return and minimum presumptive profit returns and the corporate information system according to the AFIP resolution N ° 3293.(l) Confirm the effective implementation of at least one program corresponding to “Corporate Social responsibility” concept, and keeping compliance with it while being in the “registry”.
Submission of the application
The submission for being added to the “registry” is carried out by electronic data transfer, through the AFIP institutional website.
Inclusion in the registry
The inclusion in the “register” will be arranged by the AFIP once verified the compliance with the requirements set out in this standard.
Verification of compliance
The Corporate Social responsibility Division, dependent of the General control Subdirectorate of the AFIP, is responsible for the verification of the fulfilment of tax obligations of taxpayers and/or responsible for carrying out activities in Social responsibility programs.
Entry into force This rule applies from January 2, 2013.
Edgardo Héctor Ferré Olive
January 2014 51
• CSR does not only mean to comply with the legal obligations of a company.
• The CSR purpose is not for the company to replace the public service, but to be its creative and reliable partner.
• The ethical investor should not only assess the fulfillment of corporate environmental responsibility, but also aspects related to compliance regarding tax, customs duties and social security resources.
• When paying taxes, companies will have an important and positive impact on the rest of the Society; tax compliance is a sign of correct behavior and an element of CSR.
4. CONCLUSIONS
• he strategic behavior of a company should not only be to minimize taxes.
• Tax incentives for companies that are considered socially responsible should be evaluated.
• he social responsibility framework should be regulated by designing a public CSR registering model.
• The tax administrations role regarding CSR should be evaluated.
5. BIBLIOGRAPHY
Avi-Yonah , Reuven S. (2006) “Corporate Social Responsibility and Strategic Tax Behavior”, Symposium on Tax and Corporate Governance, Munich, and co-organized by the International Network for Tax Resarch(INTR), the Max Planck Institute for Intellectual Property, Competition and Tax Law and the German IFA branch.
Costanza, Robert (1996) “Ecological Economics: Reintegrating the study of humans and nature”, Ecological Society of América, Ecological Applications, Vol 6, N° 4.
Friedman, Milton (1970) “The Social Responsibility of Business is to Increase its Profits”, The New York Times Magazine.
Fronti de García, Luisa (2009) “Responsabilidad Ambiental Empresaria-Informes Contables-”, EDICON, Fondo Editorial del Consejo Profesional de Ciencias Económicas de la Ciudad Autónoma de Buenos Aires.
Harvard Business School Press (2007) “Harvard Business Review on Green Business Strategy”, U.S.A..
García Calvente, Yolanda (2009) “El derecho financiero y tributario ante la Responsabilidad Social de la Empresa”, en “La Responsabilidad Social Empresarial: un nuevo reto para el Derecho”, Ediciones Marcial Pons, España.
García Fronti, Inés (2006) “Responsabilidad social empresaria. Informes contables sobre su cumplimiento”, EDICON, Fondo Editorial del Consejo Profesional de Ciencias Económicas de la Ciudad Autónoma de Buenos Aires. García Luque, Elisa (2006) “La actividad financiera del estado social globalizado (la prevención de gastos públicos y el tributo de tercera generación), REDF,N° 131.
CIAT/AEAT/IEF Tax Administration Review No. 3652
Gómez Fulao, Juan Carlos (2005), “Tiempos de la Economía, épocas de inequidad”, Ediciones Cooperativas, Argentina.
Gómez Fulao, Juan Carlos (2012) “Ámbitos de la ética de los negocios- Dominios de Responsabilidad Social-”, SIRSO, Río de Janeiro.
Montivero Araya, Pablo (2009) “La responsabilidad social en la visión de la empresa actual”, en “RSE y Trabajo decente en la Argentina- Contexto, desafíos y oportunidades”, Programa Conjunto PNUD/CEPAL/OIT, Ministerio de Trabajo, Empleo y Seguridad Social , Argentina.
Moreno Izquierdo, José (2004) “Responsabilidad Social Corporativa y Competitividad: una visión desde la empresa”, BBVA, España.
Núñez, Georgina (2003) “La responsabilidad social corporativa en un marco de desarrollo sostenible”, CEPAL, Naciones Unidas, Serie Medio Ambiente y Desarrollo, 72, Chile.
Patón García, Gemma (2012) “El efecto uniformador de la Globalización en las líneas impositivas medioambientales”, en Fiscalidad Medioambiental: Iniciativas y Orientaciones Actuales, IEF, España, Documento N° 4/2012.
Rosembuj, Tulio (2008) “ El abuso del derecho y la realidad económica”, Quincena Fiscal Aranzadi, número 5.
Rosemuj, Tulio (2009) “Minimización del impuesto y responsabilidad social corporativa”. Editorial el fisco, Barcelona.
Ruiz Garijo, Mercedes (2011) “Más de diez años de Responsabilidad Social Empresarial. ¿Para cuándo su regulación jurídica y el establecimiento de incentivos fiscales?” Revista Vasca de Economía Social – Gizarte Ekonomía Euskal Aldizkaria-Gezki , N° 7.
Sánchez Huete, Miguel Ángel (2010) “Hacia una planificación fiscal socialmente responsable. La planificación ultrafiscal“, Quincena fiscal: Revista de actualidad fiscal, número 7.
Sánchez Huete, Miguel Ángel (2010) “La responsabilidad social y su fomento de través de normas tributarias”, en “ Ética y Responsabilidad ante la crisis”, María Ángeles Árraez Monllor y Pedro Francés Gómez (Eds. Lits.), Ediciones Sider S.C., España.
Sen, Amartya y Bernardo Kliksberg (2007) “Primero la Gente: Una mirada desde la ética del desarrollo a los principales problemas del mundo globalizado”, Ediciones Deusto, Capítulo 12 “ El rol de la responsabilidad social empresaria en la crisis”.
Sivieude, Olivier (2008) “La Ética y la Responsabilidad Corporativa en las Adminis-traciones Tributarias”, Asamblea General del CIAT, N°. 42, Antigua, Guatemala.
Wainstein, Mario y Casal, Armando (2006) “El medio ambiente en la auditoría financiera”, Errepar, Profesional y Empresaria (D&G), Tomo VII.
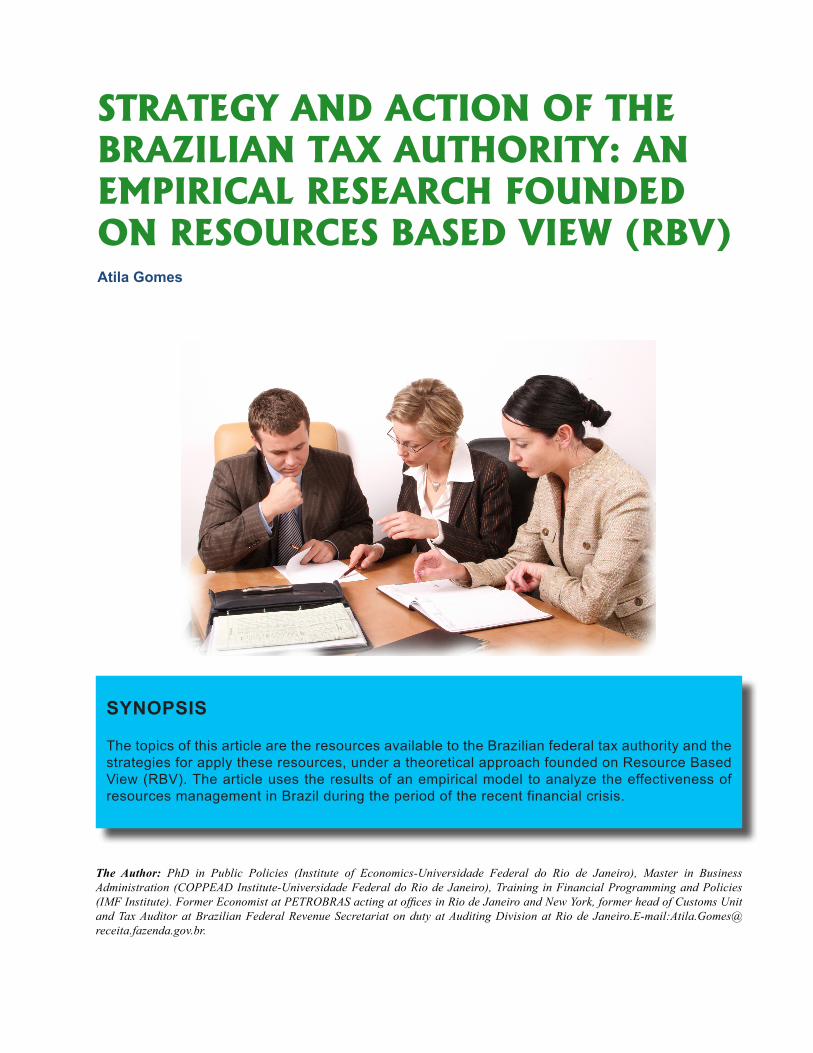
The Author: PhD in Public Policies (Institute of Economics-Universidade Federal do Rio de Janeiro), Master in Business Administration (COPPEAD Institute-Universidade Federal do Rio de Janeiro), Training in Financial Programming and Policies (IMF Institute). Former Economist at PETROBRAS acting at offices in Rio de Janeiro and New York, former head of Customs Unit and Tax Auditor at Brazilian Federal Revenue Secretariat on duty at Auditing Division at Rio de Janeiro.E-mail:[email protected].
SYNOPSIS
The topics of this article are the resources available to the Brazilian federal tax authority and the strategies for apply these resources, under a theoretical approach founded on Resource Based View (RBV). The article uses the results of an empirical model to analyze the effectiveness of resources management in Brazil during the period of the recent financial crisis.
STRATEGY AND ACTION OF THE BRAZILIAN TAX AUTHORITY: AN EMPIRICAL RESEARCH FOUNDED ON RESOURCES BASED VIEW (RBV)Atila Gomes
CIAT/AEAT/IEF Tax Administration Review No. 3654
Content
1. The central role of taxation in the stateaction
2. Taxation: A complex tool with manyfunctions
3. Taxation approaches
4. Strategies and resources
5. The Model and the results
6. Conclusion
7. Bibliografía
8. Appendix
The performance of tax authorities in achieving high levels of tax compliance has recently been subject of an increasing number of researches based on various approaches to taxation. This becomes more relevant in face of the impact of the financial crisis on tax policies, characterized by shrinking tax bases and also by reducing taxpayers’ capacity of payment to meet their obligations. This scenario creates opportunity for a detailed analysis of how the available resources have been used by tax authorities in order to achieve their goals.
This article analyzes the resources available to the Brazilian Federal Tax Authority and the strategies for applying these resources, under a theoretical approach founded on Resource Based View (RBV). The article uses the results of an empirical model to analyze the effectiveness of the resources management
in the Brazilian case. It is noteworthy that the conclusions herein presented came out from a research conducted at “Instituto de Economia da Universidade Federal do Rio de Janeiro”, using a quantitative methodology, and such conclusions are corroborated by results obtained in another research conducted at “Escola Brasileira de Administração Pública e Empresas da Fundação Getúlio Vargas”, which used a different methodology. It is remarkable that both researches, covering the strategy used by Brazilian tax authorities during the recent financial crisis, were conducted independently, at research centers that follow antagonist approaches, one heterodox and the other orthodox, and the results in both researches lead to the same conclusions. This means that the conclusions herein presented are definitely robust.
The article is based on a theoretical foundation seldom used in the taxation field so far; initially it reviews the traditional foundations of taxation and next it presents a new approach. Six sections compose the article. The first section deals with the central role of taxation in state intervention, in particular regarding the economic crisis created by the financial market. The second section deals with the characteristics that turn the contemporary taxation into a complex instrument managed by the state. The third section provides the dominant approaches to taxation, which support strategies adopted by the tax authorities. The fourth section specifies the foundations of an approach of tax administration using the theory of Resource Based View. The fifth section encompasses the formulation of an empirical model to identify the effectiveness of resources and their applications by the Brazilian Tax Authority at the federal level and the last section presents the article’s conclusions.
Atila Gomes
January 2014 55
The International crisis, started at the financial markets in 2008, has been the main recent determinant for a more active role of state in economic matters. Even if the market is more efficient than the state in allocating resource, the crisis has shown that the market fails to find the equilibrium by itself, except at an enormous social cost. In fact, the fast actions of the states intervening in the monetary and fiscal policies were definitely the measures that avoided a catastrophic economic damage to society, which could have been much more dramatic than the one we have seen so far. Despite of the crisis has spread worldwide, is important to mention that initially, the states acted individually, independently of any multilateral coordination, and the states did it well. In a second period, such actions were subject of some multilateral coordination involving countries, regional and multilateral organizations.
Two important points emerged from the states actions. First, there was not a uniform policy to fight the economic crisis1. The roll of measures adopted so far includes from the takeover of private saving companies up to increase tax, passing by supply-side policies. These varieties of proposals could mean a diversity of understandings of crisis diagnostics, which confronts proposals for fiscal restriction in order to keep the public budget in equilibrium against proposals for increasing public expenditures to boost the aggregate demand. Second, in order to solve the market problems, the states need to raise additional resources in the short or long term, depending on the options of policies adopted. No matter the expenditures has been
increased or budget cuts that have been made, among all the measures used by the states, the taxation has become one of the most important or, probably, the most important tool in public policies to fight the social-economic crisis. This is explained by the multiple functions of the tax in policy and economics.
This is not a new situation, just an old wine in a new bottle, since Adam Smith inquired, at XVIII century, how much tax should be raised by the state and how much the state should intervene in the economics. At the root of the modern tax state, formed in the middle age as described in Joseph Schumpeter´s seminal article “The Crisis of the Tax State”2, the real fiscal crisis is defined as a persistent social change that leads to an inevitable insolvency of the state and so it is necessary to establish a new system to finance the state. Nowadays, the risk of states insolvency, present in the recent downgrade of some sovereign risks, has lead to changes in the tax systems in many countries, increasing the marginal rate of tax incident on wealthy individuals, as did France, but increasing tax incident also on low income people, as Portugal did. In both countries such changes are applied to taxes due for fiscal year 2013. Such changes came up along with social reactions, once they redefine the tax burden among taxpayers.
No matters their structures, four characteristics are essential in a tax system: i) to provide the revenue needed for financing the social expenditures, ii) to be considered fair, iii) to represent the whole society and, finally, iv) to be easy to manage3. So far, states have succeeded financing their
1 . THE CENTRAL ROLE OF TAXATION IN THE STATE ACTION
1. For a survey on taxation during the Financial Crises see HEMMELGARN, T., NICODÉME, G (2010); The 2008 Financial Crisis and Taxation Policy; European Commission; Working Paper no 20/2010; Taxation Paper.
2. SCHUMPETER (1918), re-print in Revista Espanola de Control Externo; ano 2000; vol 2; nº 5.3. LLEDO, V.D., SCHNEIDER, A, MOORE, M. (2004); Governance, Tax and Tax Reform in Latin America; IDS Working Paper 221, march, 2004;
Institute of Development Studies, Sussex, England.
CIAT/AEAT/IEF Tax Administration Review No. 3656
activities by introducing tax innovations, mainly using Information Technology (IT). Taxes have assumed new functions in the society and, also, the states have demanded more resources to
provide more services to society and this has not impaired the economic development, since the economic stagnation we are facing now results mostly from a financial market collapse.
4. COBHAM, A. (2005), Taxation Policy and Development; OCGG Economic Analysis no 2; Oxford Council of Good Governance.5. The item 15 of Monterey Consensus (2003), defined tax revenue as source for financing the development in http://www.un.org/esa/ffd/monterrey/
MonterreyConsensus.pdf 6. ITD (2011), 4TH ITD Global Conference on “Tax and Inequality”; Issue paper; New Deli-India.
2. TAXATION: A COMPLEX TOOL WITH MANY FUNCTIONS
The taxation has multiple functions and plays a central role in the social life. Such functions are not always easy to conciliate, what can lead to a potential conflict on how to use taxes for achieving socials goals. On the other hand, these multiple functions create opportunities for tax authorities act in different ways using the available resources. According to Cobhan4, the functions of taxation are defined as the 4R: revenue, redistribution, representation and re-pricing.
The first, and most basic, function of taxation is to provide Revenue. In the short term it is a basic source of revenue to cover budget expenditures, while in the mid and long term it provides financing for public investments, mainly in developing countries5. We also emphasize the maintenance of a sustainable public debt and interest rate level. The public debt can be defined as the present value of future tax flow, so the monetary policy, while it is affected by the public indebtedness, is tied to taxes.
The second function is Redistribution, since taxation can reduce inequalities. We have witnessed an increase in social inequalities, as a consequence of the financial crisis. Social inequalities shall be the greatest challenges facing the taxation in coming years, as recognized at the 4th International Tax Dialogue Conference, a global conference about Tax and Inequality, held in India at the end of 20116. Progressive tax systems should be adopted to promote less concentrated post-tax income distribution.
The third function is Representation, in a sense that goes beyond the slogan “No taxation without representation” from the Magna Carta in the XIIIrd century or inform the US Declaration of Independence. It regards citizens’ participation in society decisions about who pays and how much to pay for financing public expenditures or, in other words, keeping alive the social contract instead of creating social conflict as we have seen recently in Greece. The fourth function is re-pricing, which affects prices, not in order to raise revenue but to influence the behavior of citizens and corporations in economic decisions. The undesired decisions could be subject to heavier taxation, in order to dissuade the citizens or corporations from adopting them, such as imposing taxes on carbon emissions to reduce pollution.
In face of these multiple functions that are expected to be accomplished by taxes, it is understandable that new proposals for an extended concept of taxation appear, well defined by McKERCHAR: “Taxation is not a discipline in its own right, but a social phenomenon that can be studied through various disciplinary lenses. Commonly, taxation attracts researchers from the disciplines of law, accounting, economics, political science, psychology and philosophy. This disciplinary backgrounds are each understandably narrow and, in spite of researchers being no doubt experts in their respective fields, it can be challenging to apply their skills and knowledge to the complexities
Atila Gomes
January 2014 57
of research problems that emanate from the study of taxation”7. This concept is relevant because it explains clearly how complex the taxation matters in the technical and political fields are. Thus, the concept leads us to important questions: first, in the political field we should focus on “What do taxpayers think about tax?” and “How do people behave regarding taxes?”; secondly, in the technical field we should obtain answers about
“What are the scientific viewpoints?” and “What do sciences propose about tax?”. The practical relevance of these questions is that, no matter the disciplinary background adopted, the answers to these questions have been the main references for best practices in strategic management for tax administration. As argued by Richard Bird, the tax policy has been influenced by the tax research agenda8.
7. Mc KERCHAR, M. (2008) ; Philosophical Paradigms, Inquiries Strategies and Knowledge Claims: applying principles of research design and conduct to taxation; e-Journal of Tax Research; vol 6, n 1.
8. BIRD, R.M. (2009) ; Tax System Change and the Impact of Tax Research (November 4, 2009). Rotman School of Management Working Paper No. 1500018.
9. Di JOHN,J. (2006) ; The Political Economy of Taxation and Tax Reform in Development Coutries; Research Paper 2006-74; United Nations University; World Institute for Development Economics Research.
10. Op.Cit. LLEDO, V.D., SCHNEIDER, A, MOORE, M. (2004).11. STEWART, M. (2006) ; New Research on Tax Law and Political Institutions; Legal Studies Research Paper No.219; University of Melbourne;
Austrália.12. BRAITHWAITE, V. (2002); Taxing Democracy, The Australian National University, Ashgate Publ.Co, UK.13. SLEMROD, J., Mc FARRY, E. (2004) ; Toward an Agenda for Behavioral Public Finance; USC Law, Economics Research Paper nº 04-25; Univ. of
Southern California.14. LEROY,Marc (2009) ; Tax Sociology-Sociopolitical Issues for a Dialogue with Economists, Socio-logos-Revue Publiée par l´association Française
de Sociologie, n4, dec.
3. TAXATION APPROACHES
The Taxation can be considered a phenomenon; therefore it has many approaches, from the historical proposals up to proposals sustained by quantitative methods. The main approaches herein are those considered references for contemporary literature, nevertheless the fact that the first reference for taxation in western societies came from ancient times more than four thousand years ago. As it is described in the Genesis Book, Ancient Egypt was threatened by an economic crisis, symbolized by pharaoh´s famous dream of seven fat cows followed by seven skinny cows. The problem was solved through collecting 20% of the land production during the growth years, the times of fat cows, and spending these resources during the
recession years, the times of skinny cows. This intervention of state in economy through counter-cycle policy is still useful nowadays.
The three main contemporary approaches of taxation will be herein classified as: economic, administrative and institutional. These could be defined as traditional approaches accepted, once considered as references the works of DiJhon9; Moore, LIiedo, Schneider 10 Stweart11 and Braithwaite12. The importance of such approaches is the orientation aiming straight to tax revenue. These are not exhaustive classifications, once can be found others views about taxation under behavioral economics13, politics or tax sociology14.
CIAT/AEAT/IEF Tax Administration Review No. 3658
Economic approach
The economic approach came up from the development of the liberal economic theory. Traditionally, it is concerned mainly with the tax system structure, tax incidence and its effects on the prices, income, demand and investments. The microeconomics treats the impact of tax on the price and its effects on the market. The tax creates inefficiency in the market, since it raises the price, but does not stimulate production that normally should rise in the presence of increasing prices. The increase in prices, as result of tax incidence, leads to reduction in production15. To smooth taxes impact on prices, the optimal taxation theory was developed16.
In macroeconomics, the main concern is that taxes reduce the disposable income affecting directly the aggregate demand and also affect investments. Still In the field of macroeconomics, tax incidence also affects the income distribution. Comparing the pre-tax income distribution with the post-tax distribution we can identify the impact of the tax system. If the tax system is progressive, it improves the post-tax income distribution and reduces inequalities.
For a long time the economic approach has been concerned about markets rules and until the 70’s there were no relevant mentions about the influence of taxpayer behavior or tax collection procedures on tax revenue. The problem of tax collection, in the economic approach, gained
15. HINES JR, J. H. (1998); Three Sides of Harberger Triangle; NBR Working Paper 6852; National Bureau of Economics Research; Cambridge – MA.16. DIAMOND, P., MIRRELEES, J, (1971a); Optimal Taxation and Public Production I: Production Efficiency; American Economic Review; Vol
61, n 1, mar., see also DIAMOND, P., MIRRELEES, J, (1971b); Optimal Taxation and Public Production II: Production Efficiency; American Economic Review; Vol 61, n 3, jun.
17. ALLIGHAN,M.G, SANDMO,A. (1972); Income Tax Evasion: A theoretical Analysis; Journal of Public Economics; p. 323-338; North-Holland Publishing Co.
18. For a critical view see RODRICK, D. (2004); Getting the Institutions Right ; Working Paper; Univ. of Harvard Cambridge, MA.19. SHOME, P. (1999); Taxation in Latin America: Structural Trends and Impact of Administration; Working Paper, WP/99/19, Fiscal Affairs
Department; IMF.20. STEWART, M. (2002) ; Global Trajectories of Tax Reform: Mapping Tax Reform in Developing and Transition Countries. University of
Melbourne, Public Law Research Paper No. 29. Melbourne- AU
importance, starting with the seminal work of Allighan and Sandmo17, which developed a model of expected utility indicating that tax revenue increases when the risk perception of the taxpayer increases as well. Such model introduces into the theory the importance of tax administration efficiency in obtaining the tax revenue.
Administrative approach
In the administrative approach, the tax administration became the central part of the tax revenue issue, as diagnosed by the multilateral organizations. Once the market has been working in accordance with free market rules18 and also the tax incidence has been designed to avoid “deadweight losses” caused by taxes, the amount of tax revenue collected would depend on the tax administration capacity in reducing the tax gap and reach the potential revenue19. In order to reach such potential revenue there has been many prescriptions aimed at increasing the tax administration capacity. Most of the proposals come from multilateral organizations and have been changing during the times. During 80’s, from the perspective of developing countries, mainly in Latin America, the priority was to fight inflation, which eroded the tax revenue. Only later, in the 90’s, tax administration reforms became an important theme in the agenda of the developing countries20, by this time the main concern was to assure independence of tax authorities through establishing the Autonomous Revenue Agencies (ARA).
Atila Gomes
January 2014 59
Starting in the 80’s, in a context of the “oil prices shock” that caused an economic stagflation, the administrative approach proposals were designed to treat the tax revenue as a production process, aiming at increasing productivity21. For instance, one of the proposals starts by measuring the tax gap and next recommends a predefined set of measures, going from improving the taxpayer services to a complete re-organization of the tax administration structure and processes22. The recommended organizational structure was the functional structure, in which a function is executed in one sector for the entire organization, avoiding the occurrence of task duplicity in different sectors. There was a concern to keep taxpayers honest, so special attention was dedicated to law enforcement.
The intensity of law enforcement created hard feelings in the relationship between society and the state, in the cases of USA and Australia. Both countries experienced situations that demanded mediating actions in the political field in order to preserve the society-state relationship. The American congress determined a change in the actions of the American Tax Authority, in order to turn the IRS into a “friendly” organization23. In Australia, a political solution settled the case of pension schemes, in which Australian tax authority had accused thousands taxpayers of misleading procedures.
This events established new paradigms for the tax administration, once represent the replacement of the imposition model of command-control by a responsive-regulation model. Such change can be compared to the transition in the penalties during XVIII century,
when severe physical punishment was replaced by the imprisonment, as shown by Foucault24.
In the USA, the idea of treating the taxpayer as a client was a turning point in the “big stick”25 policies, as was done in Australia when responsive regulation policies were introduced. Despite this turning point, important differences can be pointed out in the policies adopted by these countries. The USA policies have intended to improve and increase the services for taxpayers, what typifies an “exchange tax” from the point of view of sociological representation of tax, meaning tax in exchange of services. Meanwhile, the Australian policies have aimed mainly to establish a reliable relationship with taxpayer and, so, creating a “contribution tax”, under the view of sociological representation of taxation, that means a tax politically legitimated by citizenship.
Institutional approach
An institutional approach came up to solve a crisis in the relationship between the tax authority and taxpayers. The establishment of appropriate institutions is a central element of the recent institutional approach in many fields of public policies, also in taxation institutions do really matter. Institutions are formal and informal rules that have the function of facilitating the occurrence of transactions between agents26, even in the case that the agents are tax authorities and taxpayers. Since the transactions occur in the social environment shall be validated by the society, shall reduce the economic transaction costs, and shall use the most efficient legal instrument to settle the disputes.
21. BIRD, R.M. (2004) ; Administrative Dimension of Tax Reform; Asia-Pacific Tax Bulletin22. SILVANI, C., BAER, K. (1997) ; Designing Tax Administration Strategy Reform: Experience and Guide Lines; IMF Working Paper 97/30; Fiscal
Affair Department, IMF; Washington-DC.23. “The principal charge that Congress gave the IRS was to reorganize and become more “customer”-friendly. The restructuring ranged from the
symbolic, such as a changed mission statement that does not mention the collection of taxes, to an expensive overhaul of the entire organizational structure.” in LEDERMAN, L.;(2003);Tax Compliance and The Reformed IRS; Kansas Law Review, v. 51.
24. FOUCAULT, M.; (1975). Surveiller et punir: Naissance de la prison, Paris: Gallimard.25. LEVINER, S. (2009); A New Era of Tax Enforcement: from “Big Stick” to responsive regulation; Working Paper nº 06-007 ; John M. Olin
Center for Law, Economics; University of Michigan Law School.26. NORTH, D.(1991); Institutions; in The Journal of Economic Perspectives, Vol. 5, No. 1. Winter, 1991.
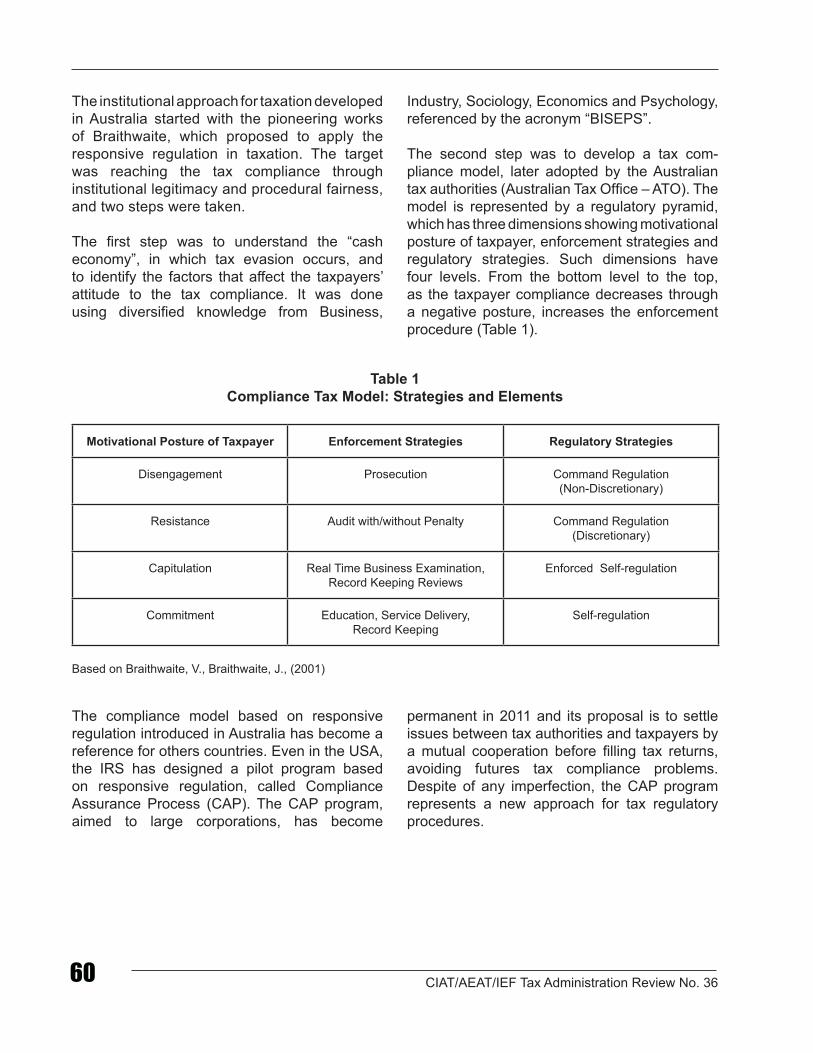
CIAT/AEAT/IEF Tax Administration Review No. 3660
The institutional approach for taxation developed in Australia started with the pioneering works of Braithwaite, which proposed to apply the responsive regulation in taxation. The target was reaching the tax compliance through institutional legitimacy and procedural fairness, and two steps were taken.
The first step was to understand the “cash economy”, in which tax evasion occurs, and to identify the factors that affect the taxpayers’ attitude to the tax compliance. It was done using diversified knowledge from Business,
Industry, Sociology, Economics and Psychology, referenced by the acronym “BISEPS”.
The second step was to develop a tax com-pliance model, later adopted by the Australian tax authorities (Australian Tax Office – ATO). The model is represented by a regulatory pyramid, which has three dimensions showing motivational posture of taxpayer, enforcement strategies and regulatory strategies. Such dimensions have four levels. From the bottom level to the top, as the taxpayer compliance decreases through a negative posture, increases the enforcement procedure (Table 1).
Table 1Compliance Tax Model: Strategies and Elements
Motivational Posture of Taxpayer Enforcement Strategies Regulatory Strategies
Disengagement Prosecution Command Regulation(Non-Discretionary)
Resistance Audit with/without Penalty Command Regulation (Discretionary)
Capitulation Real Time Business Examination,Record Keeping Reviews
Enforced Self-regulation
Commitment Education, Service Delivery,Record Keeping
Self-regulation
Based on Braithwaite, V., Braithwaite, J., (2001)
The compliance model based on responsive regulation introduced in Australia has become a reference for others countries. Even in the USA, the IRS has designed a pilot program based on responsive regulation, called Compliance Assurance Process (CAP). The CAP program, aimed to large corporations, has become
permanent in 2011 and its proposal is to settle issues between tax authorities and taxpayers by a mutual cooperation before filling tax returns, avoiding futures tax compliance problems. Despite of any imperfection, the CAP program represents a new approach for tax regulatory procedures.
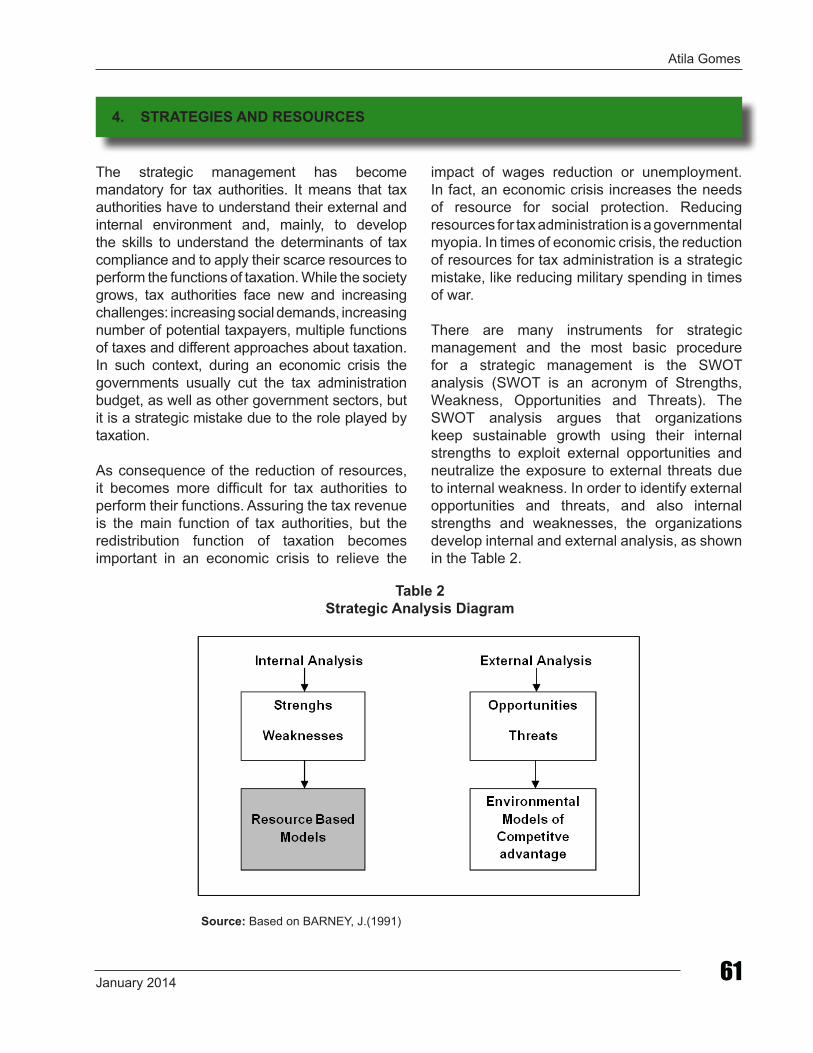
Atila Gomes
January 2014 61
The strategic management has become mandatory for tax authorities. It means that tax authorities have to understand their external and internal environment and, mainly, to develop the skills to understand the determinants of tax compliance and to apply their scarce resources to perform the functions of taxation. While the society grows, tax authorities face new and increasing challenges: increasing social demands, increasing number of potential taxpayers, multiple functions of taxes and different approaches about taxation. In such context, during an economic crisis the governments usually cut the tax administration budget, as well as other government sectors, but it is a strategic mistake due to the role played by taxation.
As consequence of the reduction of resources, it becomes more difficult for tax authorities to perform their functions. Assuring the tax revenue is the main function of tax authorities, but the redistribution function of taxation becomes important in an economic crisis to relieve the
impact of wages reduction or unemployment. In fact, an economic crisis increases the needs of resource for social protection. Reducing resources for tax administration is a governmental myopia. In times of economic crisis, the reduction of resources for tax administration is a strategic mistake, like reducing military spending in times of war.
There are many instruments for strategic management and the most basic procedure for a strategic management is the SWOT analysis (SWOT is an acronym of Strengths, Weakness, Opportunities and Threats). The SWOT analysis argues that organizations keep sustainable growth using their internal strengths to exploit external opportunities and neutralize the exposure to external threats due to internal weakness. In order to identify external opportunities and threats, and also internal strengths and weaknesses, the organizations develop internal and external analysis, as shown in the Table 2.
4. STRATEGIES AND RESOURCES
Source: Based on BARNEY, J.(1991)
Table 2Strategic Analysis Diagram
CIAT/AEAT/IEF Tax Administration Review No. 3662
Great part of literature in strategic management is dedicated to the external analysis, and the most successful model of competitive advantage is the Porter´s Model27. A minority stream considers the relevance of internal analysis and emphasizes the Resource Based Models. The trend of thought based on resources has become known as Resource Based View (RBV). The RBV argues that an organization is a unique set of resources, and resources mean those inputs, tangible or intangible, that assure the performance of organizations, so they are strategic resources. The strategic resources have some properties: they are valuable, rare, difficult to copy and imperfectly substitutable, since such properties are not available on the market28. The inputs available in the market are just production factors, as is a computer nowadays. In the past a computer was a strategic resource; now it is cheaper and available for any organization, but the way the organization uses the computer, or its software, can be an intangible strategic resource. Most of the strategic resources are developed inside the organization, through innovation, research and development. Organizations tend to protect their strategic resources, since they sustain their performance in the short and long run.
In both set of models for strategic analysis we have seen an evolution due to the fact that the environment has been changing so fast and deeply, as in the recent financial crisis. In such environment sustaining the organizations performance means to create conditions to deal with uncertainty, which is more than manage risks. Managing risks means operating with
some variables in a range of possible known deviations, but in the uncertainty environment even the relevant variable can be unknown. In such case, from the point of view of the resources, it is important the ability to recombine the resources available to perform the functions required in the new environment.
The decision to be made by the tax administration shall be “how does raise the tax revenues using the available resources?”. Since the resources available are scarce, the tax administration must allocate them in the most efficient way. The problem is that resources applied to different tax bases, such as income tax or sales tax, have different results, so the amount of tax revenue is a weighted result in accordance with the efficiency in each tax base.
The methods in which the resources are applied have also different results. The Graphic 1 shows cumulative methods to collect tax, from withhold tax up to enforcement. It also shows, in the curve R, the relation of such methods to the risk to realize the revenue. The curve C shows the relation of the methods to the accrued cost incurred. In normal conditions, the curve R indicates that tax compliance increases as the tax authorities are requested to more enforcing tax collection. In curve C, the more the tax authorities intervene, the more expensive the revenue collection becomes. In such conditions we can conclude that there is a trade-off between costs and result of enforcement, represented by curve P, and, so, there is an optimal point in curve P, in which the resources should be applied.
27. PORTER, M.E. (1980) Competitive Strategy, Free Press, New York.28. BARNEY, J. (1991) ; Firm Resource and Sustained Competitive Advantage, Journal of Management, vol.17,no 1.
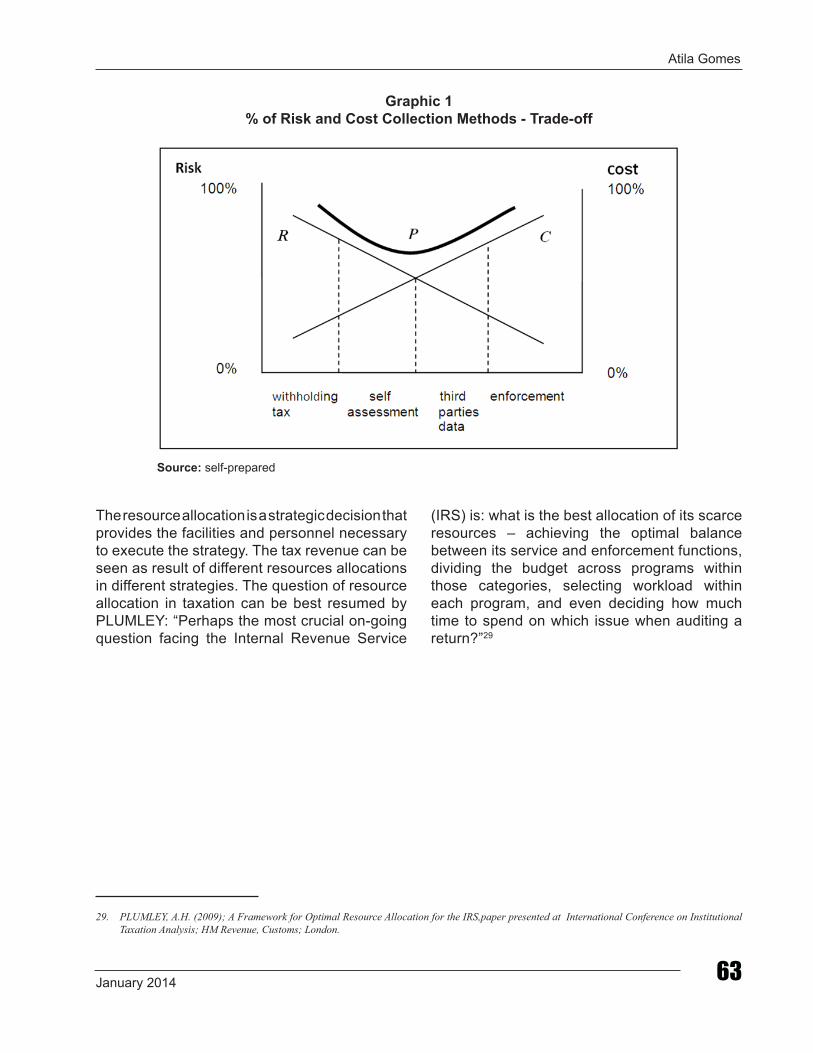
Atila Gomes
January 2014 63
Graphic 1% of Risk and Cost Collection Methods - Trade-off
Source: self-prepared
The resource allocation is a strategic decision that provides the facilities and personnel necessary to execute the strategy. The tax revenue can be seen as result of different resources allocations in different strategies. The question of resource allocation in taxation can be best resumed by PLUMLEY: “Perhaps the most crucial on-going question facing the Internal Revenue Service
(IRS) is: what is the best allocation of its scarce resources – achieving the optimal balance between its service and enforcement functions, dividing the budget across programs within those categories, selecting workload within each program, and even deciding how much time to spend on which issue when auditing a return?”29
29. PLUMLEY, A.H. (2009); A Framework for Optimal Resource Allocation for the IRS,paper presented at International Conference on Institutional Taxation Analysis; HM Revenue, Customs; London.
CIAT/AEAT/IEF Tax Administration Review No. 3664
The researches on resources allocation have explored new approaches enjoying developments in theoretical field and also using new tools for research, mainly in quantitative methods30. Two questions have been the focus of the researches. Some studies focus on efficiency, which treats the relation among resources and products. Another trend emphasizes the final impact of the resource allocation on the desired result, it means the subject is the effectiveness; this approach is a trend in public policies evaluations. A difference between the approaches is that some governmental actions can, even in an efficient form, supply products that do not attend to public needs and, so, do not produce the desired result. It is a misleading conception in public administration that is overcome by the concern with effectiveness, as defined by Australian tax authorities “efficiency is about doing things right while effectiveness is about doing the right things”31.
This work emphasizes the theoretical background, recovering the origins of strategic analysis, and uses the Resource Based View as foundation to develop an empirical model that aims to the final results. The purpose here was to identify the use of resources by the Brazilian tax authority and the effectiveness of such resources through an empirical model to verify the impact of resources and their allocation over the amount of tax revenue collected.
The Brazilian tax authority, Receita Federal do Brasil, is herein after referenced as RFB. The RFB is in charge of collecting federal taxes,
social security contributions and customs duties. The RFB is also in charge for services and tax enforcement to the Brazilian population, which is around 190 million inhabitants, living in 23 states. The RFB jurisdiction is divided in 10 fiscal regions, each corresponding to a regional headquarter; such regions have very different characteristics. The total units are around 500. The model considered only the tax units, so international trade taxes and the main social security taxes were excluded.
The RFB is in charge of services and enforcement; these two functions represent different strategies that result in different sets of products. When tax authorities allocate resources, they are also making a choice by a strategy. Therefore, when the tax authorities allocate resources, such as assigning tax auditors to perform auditing, this represents an option to increase tax compliance through an enforcement strategy. An alternative use could be to assign tax auditors for conducting taxpayer education programs, which mean allocating resource in a service strategy.
The year analyzed was 2009, so during the height of the financial crisis. However, Brazil has not been severely affected by this financial crisis; the crisis caused impacts that requested adequate actions by tax authorities. The empirical model treats individually each of 10 fiscal regions in Brazilian territory. Considering the differences among such regions, the performance of tax authorities is affected by selecting the adequate strategy, services or enforcement, for each region. If the tax authority fails in the resource
5. THE MODEL AND THE RESULTS
30. For new methods see: GAO (2005); IRS Can Improve Its Productivity Measures by Using Alternative Methods; Report to the Chairman and Ranking Minority Member, Committee on Finance, U.S. Senate ; United State Government Accountability Office; Washington –DC; DALY, GRAVELLE (2006); Methods for Measuring IRS’s Productivity; in The IRS Research Bulletin, p. 161-176, IRS, 2006, Washington –DC; and LOPÉZ,J.A.M (2012); Frontier Analysis as Tool for the Management of Efficiency in Process of Audit and Control in Peru; in Tax Administration Review, no.33, June, 2012;CIAT/AEAT/IEF; Panama, Republic of Panama.
31. ATO (2008) ; Measuring Compliance Effectiveness – our methodology; Australian Government; Canberra-AU, in http://www.ato.gov.au/corporate/PrintFriendly.aspx?doc=/content/00157833.htm .
Atila Gomes
January 2014 65
allocation in the adequate strategy for each region, the tax revenue shall be considered as result of voluntary tax compliance only, and the actions of tax authorities are useless, without any influence in tax revenue.
The model proposes that the tax revenue is a result of resources applied and a set of products aligned to strategy. However, the economic conditions can affect the tax revenue, so the model also considered the impact of the Gross Domestic Product (GDP), mainly in voluntary tax compliance.
The relations among the tax revenue and the resources and the products are stated mathematically by coefficients that multiply resources and products. If there are no relations among the tax revenue and the resources or products, the coefficients must be equal zero. Such coefficients were calculated and tested through an econometric model, as presented herein at the appendix.
The empirical results indicated that the traditional variables, the GDP or GDP per capita, used by economic theory to explain and forecast tax revenue, were not sufficient to explain adequately the tax revenue. It means that the tax revenue is not only the result of taxpayers’ voluntary tax compliance under influence of economic conditions. So, others variables are necessary to a trustable explanation of the determinants of tax revenue.
The additional variables herein considered were those that represent the tax administration management, once the tax authorities make decisions of resource allocation and products selections in order to reach the tax revenue. Thus, in sequence, variables that represent, first, the provision of Internet Services and, next, a variable representing the allocation of Personnel in Enforcement were included. Considered
individually, the “Personnel in Enforcement” provided a more trustable result than the “Internet Services”. Such variables did not present any problem of econometric estimation, when individually considered.
An interesting question is that in Brazilian case, if an auditing results in a fine, the taxpayers can apply for installment payment using internet service or appeal for review by an administrative court. So, there is a relationship between the actions of Personnel in Enforcement and Internet Service demand, but such relationship was believed being residual and no relevant. This belief had theoretical foundation due to the fact that “Personnel in Enforcement” and “Internet Service” represent different strategies, performing different functions and are located in different sectors at tax organizations. The provision of Internet Services is part of a strategy of a “friendly” organization that should increase the voluntary tax compliance and, consequently, reduce the impact of enforcement actions on tax collection. However, the influence of Personnel in Enforcement, in the Brazilian case, is more important than it was supposed32.
The figures indicate that the action of Personnel in Enforcement, besides increasing directly tax revenue, cause indirect impact on Internet Services demand. Therefore, a more complex econometric procedure was required to measure the joint influence of “Personnel in Enforcement” and “Internet Services”, as detailed at the appendix. This is a frequent problem faced by researchers and managers when evaluating resources applied to multiple products or when evaluating products that use multiple resources.
The results indicate that Brazilian tax authorities have accomplished at use of resources and products in a way that they influence tax revenue collection. The resources represented by the two selected variables, “Personnel in Enforcement”
32. The notable exception is the work of Paulo Nogueira Batista Jr, Brazilian representative in IMF, that foreseen the strategic relevance of tax auditing for the macroeconomic policy in Brazilian case. See BATISTA JR; P.N. (2001); Fiscalização Tributária no Brasil: Uma Perspectiva Macroeconômica; in A Economia como ela é; Ed. Boitempo, São Paulo –SP
CIAT/AEAT/IEF Tax Administration Review No. 3666
and “Internet Services”, must be considered as strategic resources, not only by their intrinsic characteristics, but mainly because they are fundamental to perform the main function of the tax organization. An important point detected from the model results is the fact that “Personnel in Enforcement” presented a minor coefficient (1.086) than the “Internet Services” (1.339), which could mean that resources applied on Internet Service would provide a better result and the strategy of “friendly” organization would be more effective, but it is not necessarily true. Two observations shall be pointed out.
First, the risk measure for each resource reach the result indicates that “Personnel in Enforcement” presents less risk (22%) when compared to “Internet Services” (37%). Therefore, despite the fact that “Personnel in Enforcement” presents a minor coefficient of impact on tax collection, the effectiveness is greater than the impact of “Internet Services”. A possible explanation for this fact is that the Personnel in Enforcement is able to detect fraud, abusive tax planning or any misleading procedures that intentionally were created to seem regular. Such schemes are found in Medium and Large Taxpayers and cause large impact on tax revenue. In the case of Internet Services, they are able to identify only a pre-defined programming. In some cases, the security routines can be broken and the Internet Services are, indeed, used as mean to perform fraud, as we will mention ahead.
Second, despite the fact that the amount of tax auditors at the Brazilian Federal Tax Administration is around twelve thousand,
only twenty percent are directly allocated to enforcement. Therefore, the Personnel in Enforcement related to the Brazilian population is very small, 0.133 tax auditor for ten thousand inhabitants, when compared to 0.419 in USA and 2.735 in Australia33.
These figures indicate that in case that scarce resource must be allocated, as is usual during economic crisis period, the option shall be allocating resources to Personnel in Enforcement, since it represents a minor risk of failure. So, the best option is increasing the more effective resources to reach the expected result.
The quantitative results herein obtained are also corroborated by the qualitative results obtained by Gentil34, which conducted a research concerning to strategies of the Brazilian tax authority during the financial crisis. Gentil concluded that the performance of Brazilian tax authority was due, mainly, to the following measures adopted during the crisis: i) increasing enforcement on Large Taxpayers and specially on the financial sector, and ii) restructuring the unit in charge of auditing the financial sector and the unit in charge of international affairs by increasing personnel on duty. Also, a highlight reference was made to a special operation labeled “gold of foolish” against taxpayers that tried to settle the tax through an internet service (PERDCOMP- electronic request for reimbursement and compensation) using illegal credits, that it was detected through auditing procedures. All this measures are consistent with quantity results obtained in the model herein presented.
33. OCDE (2011); Tax Administration in OECD and Selected Non-OECD Countries: Comparative Information Series (2010); Forum on Tax Administration, Center For Tax Police and Administration.
34. GENTIL, D.M.; (2011), A Crise Financeira Global e a Gestão da Receita Federal: Um Estudo de Caso; Dissertação de Mestrado; EBAP, FGV; Rio de Janeiro – RJ.
Atila Gomes
January 2014 67
The actions of tax authorities during a crisis period become more important, since, indeed, they do the tax policy. The taxation is a vital support for the state existence and has several functions. Especially in times of recession, it is a tool to combat the economic crisis; it preserves the social protection and stimulates the demand. Such lessons have been taught since the times of the ancient Egypt.
Nowadays, taxation is treated in the economic literature as a share of GDP or GDP per capita. The wide diffusion of economic literature has contributed to create the belief that taxation is a natural consequence of economic conditions, in this sense the actions of the tax authorities are not considered as a determinant of tax revenue.
The importance of tax administration has seldom been recognized. This omission in the literature is confronted by the results herein obtained through the empirical model, which stated the importance of the action of tax authorities, specifically in the allocation of resources for the collection of public revenue.
Governments must avoid the strategic mistake of cutting funds of the tax authority budget, as
it usually occurs during periods of crisis, when governments cut expenditures in many others governmental activities. However, scarce resources must be applied in the best way and this is the most crucial decision challenging tax authorities.
Considering that there are multiple strategies, tax authorities must know the effectiveness of resources available to better apply them. The development of empirical models helps the resources allocation. In the Brazilian case the effectiveness of the use of personnel in tax enforcement and also the provision of services via the Internet were identified as determinants of tax revenues.
Traditionally, Personnel in Enforcement have been the main resource used by tax authorities to reach the necessary tax revenue. The Internet Service is a new feature, like a trend in all services organizations, and it was boosted by the strategy for a “friendly” organization introduced in tax administration. The important difference between such instruments is that the variances in results indicate that the action of Human Being is more effective than the results obtained through technological resources.
6. CONCLUSION
CIAT/AEAT/IEF Tax Administration Review No. 3668
7. BIBLIOGRAPHY
AL-NOWAIHI, S., DHAMI, A. (2010); Rebuttal of Hashimzade, Myles and Tran-Nam (2009). New Approaches to the Economics of Tax Evasion; Working Paper No. 10/01; University of Leicester, UK.
BARBONE, L.; DAS-GUPTA, A.; DE WULF, L.; HANSSON, A. (1999); Reforming Tax Systems: The World Bank Record in the 1990s (November 1999). World Bank Policy Research Working Paper No. 2237. In: http://ssrn.com/abstract=629168
BARRAND, P.; ROSS, S.; HARRISON, G. (2004); Integrating a Unified Revenue Administration for Tax and Social Contribution Collections:Experiences of Central and Eastern European Countries; IMF Fiscal Affairs Department; Working Paper 04/237, Washington-DC.
BRAITHWAITE, V. (2007); Responsive Regulation and Taxation: an introduction; Law and Policy, Vol. 29, nº 1; In: http://ssrn.com/abstract=955575
BRAITHWAITE, V., BRAITHWAITE, J.(2001); An Evolving Compliance Model for tax enforcement. In N. Shover and J.P. Wright (eds), Crimes of Privilege: Readings in White Collar Crime. Oxford University Press, New York. 405-419.
CARMELI, A., TISHLER, A. (2004); The Relationships Between Intangible Organizational Elements and Organizational Performance; Strategic Management Journal, Vol 25, n 13,p. 1257-1278; John Wiley, Sons, Ltd.
CRANDALL, M., KIDD, W. (2006); Revenue Authorities: Issues and Problems in Evaluating Their Success; Working Paper; WP/06/240; IMF; oct; Washington, DC. In: http://www.imf.org/external/pubs/ft/wp/2006/wp06240.pdf
DIAMOND, P. (2008); Behavioral Economics; Working Paper 08-03; MIT; Department of Economics; Cambridge –MA – USA. In: http://ssrn.com/abstract=1108588
FILOSO, V. (2010); Regression Anatomy, Revealed; MPRA Paper No. 23245; In: http://mpra.ub.uni-muenchen.de/23245/
GAO (2007); Business System Modernization: Internal Revenue Service’s Fiscal Year 2007 Expenditure Plan; Report to Congressional Committees; United State Government Accountability Office; GAO-07-247; In: www.gao.gov/cgi-bin/getrpt? GAO-07-247
HASHIMZADE, N.; MYLES, G.D., TRAN-NAN,B. (2010) ;New Approaches to the Economics of Tax Evasion; http://www.esrc.ac.uk/hmrc/ images/Day1-Session6-Myles-New-Approaches-to-the-Economics-of-tax-evasion-FULL-PAPER_tcm19-18212.pdf.
HASSELDINE, J. (2007); Study into: “Best Practice” in Tax Administration; Consultancy Report for the National Audit Office; 15 out 2007; NAO; UK.
LOCKETT, A. (2005); Edith Penrose´s Legacy to Resource Based-View; Managerial and Economic Decision; vol 26, p. 83-98.
MANN, A (2004); Are Semi-Autonomous Revenue Authorities the Answer to Tax Administration Problems in Developing Countries? A practical Guide; USAID.
MANSFIELD, C.I. (1987); Tax Administration in Developing Countries: an economic perspective; IMF Working Paper 87/42; Fiscal Affair Department, IMF; Washington-DC.
MINISTÉRIO DA FAZENDA, (2010); Relatórios de Gestão; Receita Federal do Brasil; MF; Brasília – DF.
Atila Gomes
January 2014 69
MURPHY, K. (2004); Moving Towards a More Effective Model of Regulatory Enforcement in The Australian Taxation Office; Center for Tax System Integrity; The Australian National University.
NEWBERTH, S. L. (2007); Empirical Research on Resource Based View of The Firm: an assessment and suggestion for future research; Strategic Management Journal; vol 28, p. 121-146.
OCDE (2008); Monitoring Taxpayers´s Compliance: A practical Guide Based on Revenue Body Experience, Center forTax Policy and Administration.
SANDMO, A. (2004); The Theory of Tax Evasion: a retrospective view; Discussion Paper 31-04; Norwegian School of Business and Administration.
SHAW, J.; SLEMROD, J., WHITING, J. (2008); Administration, Compliance; in Mirrelees Review, Institute of Financial Studies, Publishing Oxford University Press.
SLEMROD, J., Mc FARRY, E. (2004); Toward an Agenda for Behavioral Public Finance; USC Law, Economics Research Paper nº 04-25; Univ. of Southern Califórnia. In: http://ssrn.com/abstract=590201
SMITH, A. [1904] ; An Inquiry into the Nature and Causes of the Wealth of Nations by Adam Smith, edited with an Introduction, Notes, Marginal Summary and an Enlarged Index by Edwin Cannan (London: Methuen, 1904). 2 vols. original 1776. In: http://oll.libertyfund.org/title/171
STEINMO, S., TOLBERT, C. J. (1993) ; DO INSTITUTIONS REALLY MATTER? Taxation in Industrialized Democracies; Comparative Political Studies, Vol. 31 No. 2, April 1998 165-187; Sage Publications, Inc.
TANZI, V. e PELLECHIO, A. (1995); The Reform of Tax Administration; IMF Working Paper 95/22; Fiscal Affair Department, IMF; Washington-DC.
WB, (2008); The Political Economy of Taxation in Developing Countries: challenges to practitioners; World Bank, DFID; march, 2008, IFC; Washington –DC, USA.
VENTRY, D.J. (2008); Cooperative Regulation; Connecticut Law Review, Vol. 41, nº 2, December, Connecticut University.
CIAT/AEAT/IEF Tax Administration Review No. 3670
The Model Specification
The model propose that the tax revenue (T) is result of resources, represented by the vector (R), and a set of products aligned to strategy, represented by the vector (P). The economic conditions can affect the results of tax revenue, so it is used a control variable represented by GDP. Therefore, the tax revenue is expressed by the function:
T = f ( R, P, GDP) [ 1 ]
The technique used is multiple regressions, which has been common in analysis based on RBV, comprising 64% of studies according to survey conducted by Nothnagel35.
The proposed estimator is applied to data for each tax region. The tax regions are indexed by the index s and the resources and products are indexed by i. The tax revenue was submitted to a logarithmic transformation to improve linearity. The basic estimator, in which represents the error unspecified, is shown below in [ 2 ]. Another auxiliary regression was used and will be shown ahead.
Log Ts = α + ( ∑ β i Ris ) + ( ∑ i Pis ) + GDPs + [ 2 ]
The coefficients must be subjected to the test for the following hypothesis: does exist a relation between revenues and resources, represented
by the coefficient βi and also exist a relation between the revenues and products, represented by i. Therefore, the strategic decision made by tax authorities about selecting products and allocating resources affects tax collection. This hypothesis is represented here in the falsifiable form in which the zero coefficients indicate the absence of influence of the resources and products on tax collection actions, so H0: βi =
i = 0. Thus the rejection of H0 and acceptance of the alternative hypothesis H1: βi ≠ i ≠ 0, satisfies the proposition that the resources and their allocation in products contribute to the achievement of the collection.
The Variables and the Sample
In a first round, a list of items that could influence the tax collection was selected. Such variables were classified in subsets, in accordance with the nature of the resource, if Labor or Capital. In its turn, products were classified in accordance with the strategy in which they are related, like tax enforcement or service. Some variable are listed in Table 3. The sample was selected using a cross-section methodology and encompassed the 10 fiscal regions. The data for the year 2009, was collected in sources legally available. The GDP percapita was calculated for each region using official data available at the Brazilian Institute of Geography and Statistic (IBGE).
8. APPENDIX
35. NOTHNAGEL, K (2008); Empirical Research within Resource Based Theory; p. 26; Gabler Ed.
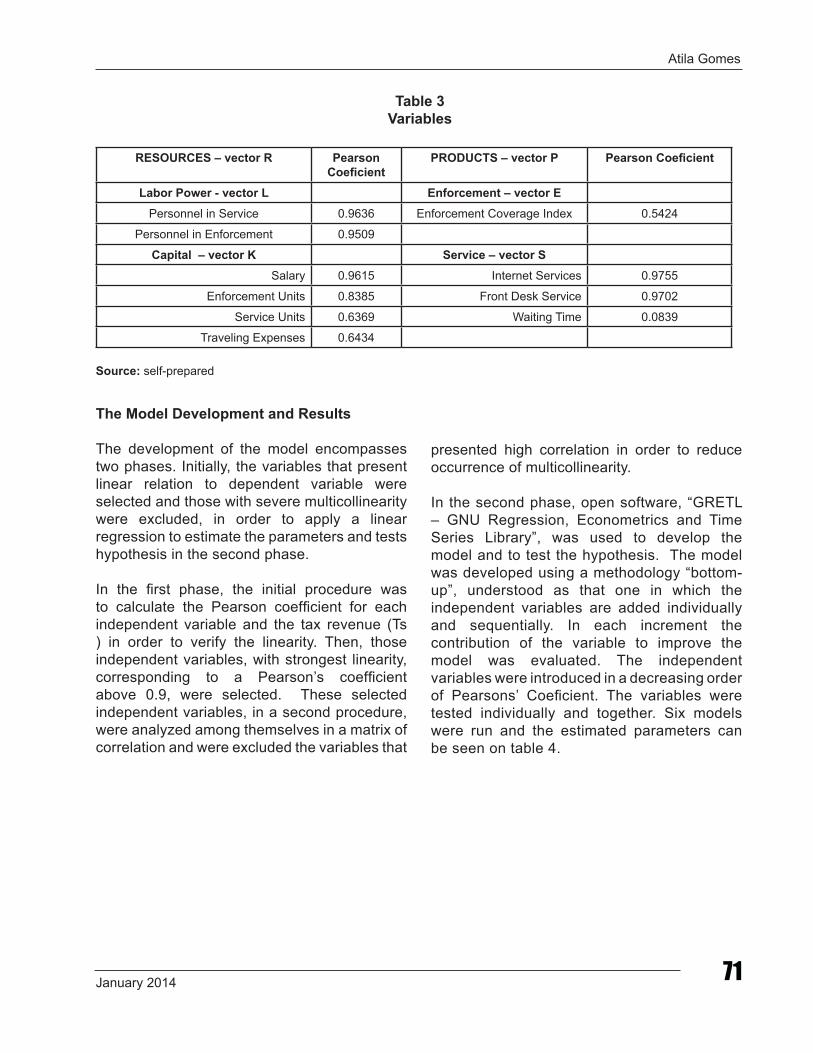
Atila Gomes
January 2014 71
Table 3Variables
RESOURCES – vector R Pearson Coeficient
PRODUCTS – vector P Pearson Coeficient
Labor Power - vector L Enforcement – vector EPersonnel in Service 0.9636 Enforcement Coverage Index 0.5424
Personnel in Enforcement 0.9509
Capital – vector K Service – vector SSalary 0.9615 Internet Services 0.9755
Enforcement Units 0.8385 Front Desk Service 0.9702
Service Units 0.6369 Waiting Time 0.0839
Traveling Expenses 0.6434
Source: self-prepared
The Model Development and Results
The development of the model encompasses two phases. Initially, the variables that present linear relation to dependent variable were selected and those with severe multicollinearity were excluded, in order to apply a linear regression to estimate the parameters and tests hypothesis in the second phase.
In the first phase, the initial procedure was to calculate the Pearson coefficient for each independent variable and the tax revenue (Ts ) in order to verify the linearity. Then, those independent variables, with strongest linearity, corresponding to a Pearson’s coefficient above 0.9, were selected. These selected independent variables, in a second procedure, were analyzed among themselves in a matrix of correlation and were excluded the variables that
presented high correlation in order to reduce occurrence of multicollinearity.
In the second phase, open software, “GRETL – GNU Regression, Econometrics and Time Series Library”, was used to develop the model and to test the hypothesis. The model was developed using a methodology “bottom-up”, understood as that one in which the independent variables are added individually and sequentially. In each increment the contribution of the variable to improve the model was evaluated. The independent variables were introduced in a decreasing order of Pearsons’ Coeficient. The variables were tested individually and together. Six models were run and the estimated parameters can be seen on table 4.
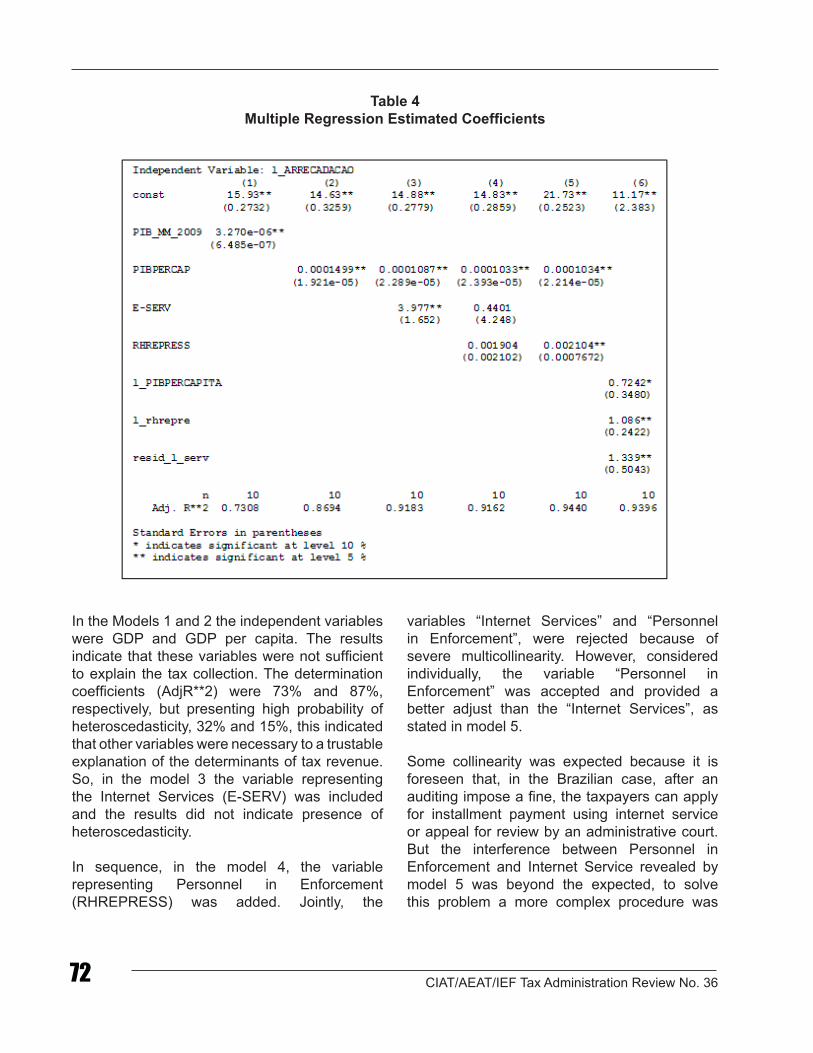
CIAT/AEAT/IEF Tax Administration Review No. 3672
Table 4Multiple Regression Estimated Coefficients
In the Models 1 and 2 the independent variables were GDP and GDP per capita. The results indicate that these variables were not sufficient to explain the tax collection. The determination coefficients (AdjR**2) were 73% and 87%, respectively, but presenting high probability of heteroscedasticity, 32% and 15%, this indicated that other variables were necessary to a trustable explanation of the determinants of tax revenue. So, in the model 3 the variable representing the Internet Services (E-SERV) was included and the results did not indicate presence of heteroscedasticity.
In sequence, in the model 4, the variable representing Personnel in Enforcement (RHREPRESS) was added. Jointly, the
variables “Internet Services” and “Personnel in Enforcement”, were rejected because of severe multicollinearity. However, considered individually, the variable “Personnel in Enforcement” was accepted and provided a better adjust than the “Internet Services”, as stated in model 5.
Some collinearity was expected because it is foreseen that, in the Brazilian case, after an auditing impose a fine, the taxpayers can apply for installment payment using internet service or appeal for review by an administrative court. But the interference between Personnel in Enforcement and Internet Service revealed by model 5 was beyond the expected, to solve this problem a more complex procedure was
Atila Gomes
January 2014 73
required to measure such impact. A partitioned regression, based on the Frish-Waugh-Lovell theorem36, was used to solve the severe multicollinearity between Internet Service and Personnel in Enforcement. So, three procedures were developed:
I) The variables were submitted to a logarithmic transformation and, after that, a simple linear regression, using the variables that present severe multicolli-nearity, was developed. Therefore “Internet Services” was defined in relation to “Personnel in Enforcement”, allowing to estimate “Internet Services”, labeled l_serv*, using the function [3]:
l_serv* = A + βi (l_rhrepre) [ 3 ]
II) The residues from the estimated “Internet Services” in relation to the observed “Internet Services”, were calculated. The residue represents the part not related to enforcement actions, so:
resid_l_serv = l_serv – l_serv* [ 4 ]
III) The main regression was developed using the residues of “Internet Services” and “Personnel in Enforcement”. Thus, the impact of enforcement actions was integrally considered and, also, just the
part of internet services not generated by enforcement action. So, the final regression model is:
l_ARRECADACAO = ƒ ( l_PIBpercapita,l_ rhrepre, resid_l_serv ) [ 5 ]
The robust results, obtained with the final regression, are stated in the model 6, which shows that the H0 hypothesis was rejected, so the regression coefficients couldn´t be equal zero. Therefore, the alternative hypothesis was accepted. The F-statistic, used for simultaneous testing of regression coefficients, indicated that the probability of coefficients equal zero was 0.014%, therefore the H0 hypothesis was rejected in a significance level less than 1%.
When evaluated individually, the coefficients of the variables obtained in the model 6 were statistically validated because the tests of t-statistics indicate that the coefficients were accepted in confidence intervals 90-99%. The results indicated that Brazilian tax authorities have accomplished a use of resources and products in a way that they influence tax revenue collection. The resources represented by the two selected variables, “Personnel in Enforcement” and “Internet Services”, must be considered as strategic resources, not only by their intrinsic characteristics, but mainly because they are fundamental to perform the main function of the tax organization.
36. FILOSO, V. (2010); Regression Anatomy, Revealed; MPRA Paper No. 23245.
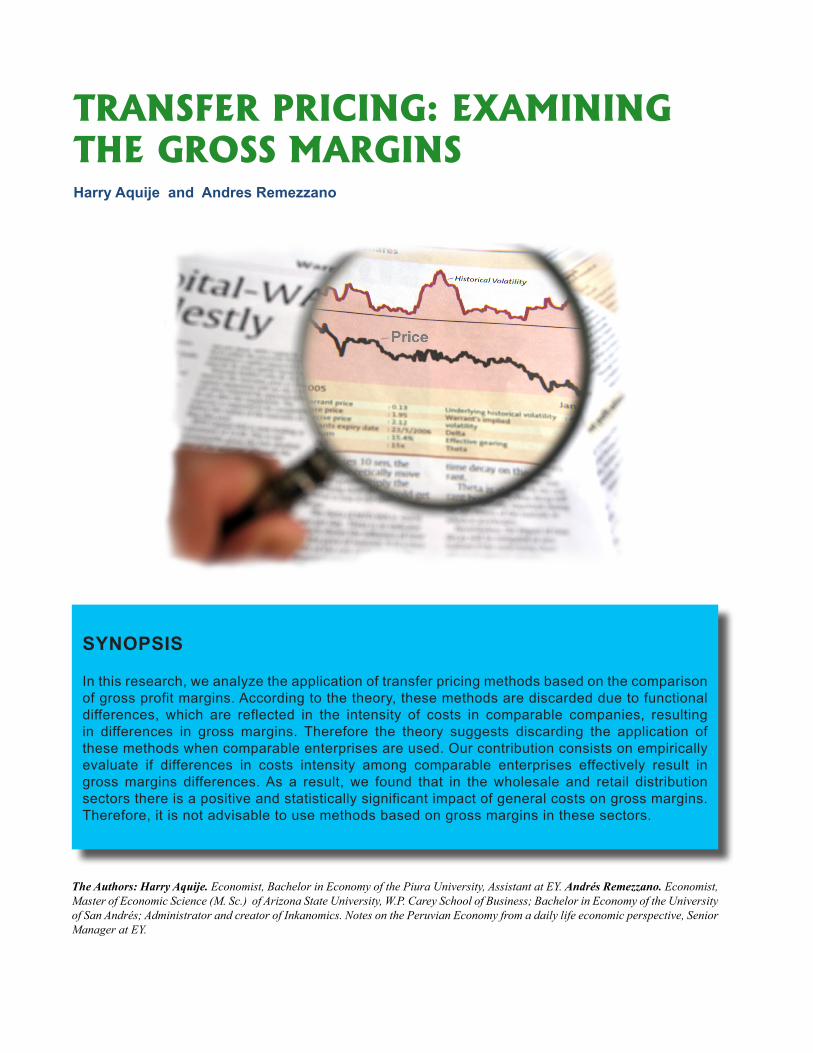
The Authors: Harry Aquije. Economist, Bachelor in Economy of the Piura University, Assistant at EY. Andrés Remezzano. Economist, Master of Economic Science (M. Sc.) of Arizona State University, W.P. Carey School of Business; Bachelor in Economy of the University of San Andrés; Administrator and creator of Inkanomics. Notes on the Peruvian Economy from a daily life economic perspective, Senior Manager at EY.
SYNOPSIS In this research, we analyze the application of transfer pricing methods based on the comparison of gross profit margins. According to the theory, these methods are discarded due to functional differences, which are reflected in the intensity of costs in comparable companies, resulting in differences in gross margins. Therefore the theory suggests discarding the application of these methods when comparable enterprises are used. Our contribution consists on empirically evaluate if differences in costs intensity among comparable enterprises effectively result in gross margins differences. As a result, we found that in the wholesale and retail distribution sectors there is a positive and statistically significant impact of general costs on gross margins. Therefore, it is not advisable to use methods based on gross margins in these sectors.
TRANSFER PRICING: EXAMINING THE GROSS MARGINSHarry Aquije and Andres Remezzano
Harry Aquije and Andres Remezzano
January 2014 75
Content
1. Motivation2. Literature review3. Methodology4. Database5. Results6. Conclusions7. Bibliography
Transfer pricing (hereinafter TP) refer to the prices agreed between companies of a same economic group for the import and export of goods and services, as well as for loans and royalties. Taking into account that our country is characterized as a raw materials exporter country, this field turns to be an important control mechanism to verify the profits of the companies and the taxes to be paid by them.
From an economic concept stating that the role of prices to efficiently allocate resources, similarly the role of TP is to efficiently allocate resources within the company or economic group, where the conflicting interests existing in operations between independent third-parties are not present.
To use the market value for TP is the best alternative when there is a competitive market that provides a reference of the corresponding price or may be used as a perfect substitute for internal trade (Holmstrom and Tirole, 1991). In practice, it must be verified that transactions between related companies comply with the free competition principle (the arm’s length principle)1, which allows tax authorities to redefine the prices agreed upon in a transaction between related parties to the value or price that
would have been fixed between independent parties, in the same or similar conditions.
Accordingly, the Organization for Economic Cooperation and Development (hereinafter OECD) published for the first time in 1995, guidelines for TP. The TP methods were established in this document to assess whether operations between related companies have been held as if they were independent companies. The following methods were developed: Comparable Uncontrolled Price Method, the Resale Price Method; the Cost Plus Method, the Profit Split Method and the Transactional Net Margin Method.
In this paper we focus on further analyzing methods based on the gross profit, i.e. the Resale Price Method and the Cost Plus Method. These methods provide that if gross margins obtained in comparable transactions are similar to gross margins obtained between related companies we face a situation in which prices have been fair and without any advantages.
In a possible application of these methods, the analysis consists in comparing the gross margin of the enterprise under study and contrasting it with gross margins obtained by independent companies. In these cases the OECD guidelines suggest that functional differences reflected in general costs differences finally impact gross margins and therefore the comparison becomes not adequate or requires adjustments.
Our proposal is to make an empirical observation to prove the above statement. I.e. we will perform an empirical analysis to prove that when expenses intensity are higher, the gross margin is also higher and the use of comparable companies in the application of gross margins without considering this effect could lead to wrong results.
1. Principle according to which prices agreed upon in a transaction between related companies should correspond to the prices which would have been agreed upon in a transaction between non-related parties, in condition equal or similar to those of an open market.
CIAT/AEAT/IEF Tax Administration Review No. 3676
For this project, we have taken financial information of companies from different economic sectors, including wholesale distribution, retail distribution, business services, manufacturing and mining. In addition, we have financial information for the companies from the year 1990 to 2011 and therefore we make an estimate using the fixed effects methodology by company.
The results show that in the wholesale distribution and retail distribution sectors, companies with greater expenses have a higher gross margin 2,
so it is not recommended to use the methods at a gross margin level. Similarly, business services and manufacturing sectors show a positive correlation between these variables, while the mining sector shows a negative correlation.
This work is divided in seven sections. Section 1 describes the motivation to develop this topic. Section 2 develops a literature review. Section 3 explains the methodology. Section 4 shows the used database. Results are explained in section 5 and finally, section 6 presents the conclusions.
2. Results show that the operating expense ratio is an explanatory variable of gross margin in these industries.3. United Nations,”P ractical Manual on Transfer Pricing for Developing Countries”, United Nations New York (2013): Chapter1, paragraph 1.1.3.4. OECD Guidelines on transfer pricing for multinational enterprises and tax administrations (2010).5. OCDE: chapter II, paragraph 2.27 y 2.28, United Nations, ”Practical Manual on Transfer Pricing for Developing Countries”, United Nations New
York (2013): Chapter 6, paragraph 6.2.9.6.
Evidence shows that intra-group trade has permanently been increasing. Currently more than 30 per cent of the world trade takes place between related companies, so TP is becoming more important than ever3.
Similarly, TP are also important for taxpayers and tax administrations, because they determine to a large extent the income and expenses, and therefore the taxable profits of related companies in different tax jurisdiction4.
In this regard, it is worth mentioning that both the OECD guidelines and the United Nations TP Manual point out that special care is required to apply the TP methods at a gross margins level, due to differences in costs intensity between comparable companies. In some cases, it may be convenient to work at the operating margin level since the operating expenses variable is incorporated to the analysis5.
When the Cost plus and Resale Price methods are applied externally there are two reasons that can lead us to discard these methods. Namely, they are the accounting differences and the differences in expenses intensity.
In the case of not using the Cost Plus and Resale Price because of differences in expenses intensity, this is done because the differences in expenses intensity are supposed to affect the business gross margin.
In theory, and according to the OECD, companies with higher general expenses should be economically compensated with a higher gross margin. For example, higher costs in marketing and sales result in higher gross margins. Similarly, the recruitment of top managers and directors should result in a higher gross margin and greater efficiency in the business management.
1. MOTIVATION
Harry Aquije and Andres Remezzano
January 2014 77
The above description is economically reasonable and intuitive, but we have found no empirical evidence that sustains it.
Our work seeks to empirically validate if indeed enterprises with higher general and business
costs effectively have higher gross margins. If this is the case, there would be empirical evidence to discard the use of methods based on gross margins in their external version, or it would require a special treatment based on what we will find.
6. Previous empirical studies found that most companies apply variable of the market value and cost based methods to determine their transfer pricing. According to Ernst & Young (2011), from 39 to 44 percent of the surveyed companies adopt an approach based on the market value, while 30 to 36 per cent use an approach based on costs.
There is a broad theoretical and empirical framework in multinational companies TP literature. Hirshleifer (1956) presented the TP problem in the economy, stating that in competitive markets, the market value is the best reference to evaluate the internal transfer of products. If the market is not perfectly competitive or if the market for the product transfer does not exist, the correct TP would be the marginal cost. This way, firms choose between three approaches to assess their internal transactions: the negotiated price, the market value and the price based on costs6 (Eccles, 1985; Cravens, 1997).
In terms of economic research related to our current topic, the work done by Silva (1999) has been taken as reference. In this work, the
author assumes a positive relationship between intensity of expenses and the gross margin, and he proposes to perform an adjustment by functions using the ratio of operating expenses as an adjustment variable. Such an approach would be in line with some aspects of our work. Similarly, the work by Li and Ferreira (2007) was considered, in which the authors analyze the TP implications for the company from the point of view of the organization management literature.
Finally, the OECD Transfer Pricing Guidelines for multinational enterprises and tax administrations have been considered. It is worth mentioning that similar research to the one presented here has not been found, so this is a valuable contribution for implementing TP methods at a gross margin level.
2. LITERATURE REVIEW
The regulation specifies two TP methods based on indicators at gross profit level: the Resale Price Method and the Cost Plus Method. In each case, compliance with the arm length principle is evaluated based on a single variable model, either sales or sales cost.
For the implementation of TP methods at the gross margins level, the following model could be used:
gi = α + Ei (1)
for i = 1, ..., N comparables
Where g represents the margin of gross profit (gross margin on sales), α represents the mean or average of the gross profit margin, E represents the error associated with the comparable i-t, in addition i = 1 to N of comparable companies.
3. METHODOLOGY
CIAT/AEAT/IEF Tax Administration Review No. 3678
7. In order to unify the analysis a gross margin ratio on sales has been created, without considering the applied method (resale price or Cost Plus). The conclusions should not be substantially affected by this simplification.
8. See Remezzano (2013).
The error term has an expected value of zero and a constant variance.
By not incorporating the gross profit margin effects, this model produces results which are inconsistent with the regulation.
To solve this problem, we propose to include variable operating expense ratio in the model. According to the theoretical premise, the operating expenses ratio positively influences the obtained gross margin.
Then, we have the following model:
yi,t = αi + β1xi,t + β2ln(ωi,t) + Ei,t (2)
for i = 1, ..., N comparables
for t = 1, ..., T comparables
Where, y is the gross margin (gross profit between sales), x represents the ratio of operating expenses (Sales, General and administrative costs between net sales) and ω is the total assets of it comparable companies .7
In order to unify the analysis a gross margin ratio on sales has been created, without considering the applied method (resale price or Cost Plus). The conclusions should not be substantially affected by this simplification.
In the proposed model the explained variable is the gross margin, while the explanatory variable is the operating expenses ratio. In addition, a control variable is included which is the natural logarithm of total assets, this variable controls because it represents the size of the company. The estimate is performed using a panel data through the fixed effects methodology, which allowing controlling over time the unobservable variables.
In the present study we analyze companies in five economic sectors that we consider relevant in the global economic activity. It is an advantage to have available the financial information of companies in some databases, since the first OECD guidelines on TP did not have this information which allow performing tests at the empirical level.
A database that includes financial information for more than 65,000 companies in 110 countries was used, with historical information from 1979.
There are two TP methods at the gross margins levels according to the OECD and Peruvian law: the Resale price method and the Cost Plus method. Since the first is compatible with distribution operations, both retail and wholesale distribution companies were included in the
4. DATABASE
database. On the other hand, since the second is compatible with manufacturing operations, it was included in the textile manufacturing companies database.
As a result of our country position as raw materials exporter, we also considered companies in the mining sector, since most of the tax collection in our country is from mining activities, and therefore the result is important for the tax authority8. Finally, because of their importance in the world economy, business services companies were included. The selection of these economic sectors will allow us to observe operational differences between industries.
The companies were found through the Industrial Classification code (code SIC)9. This way, the five industries shown below were found:
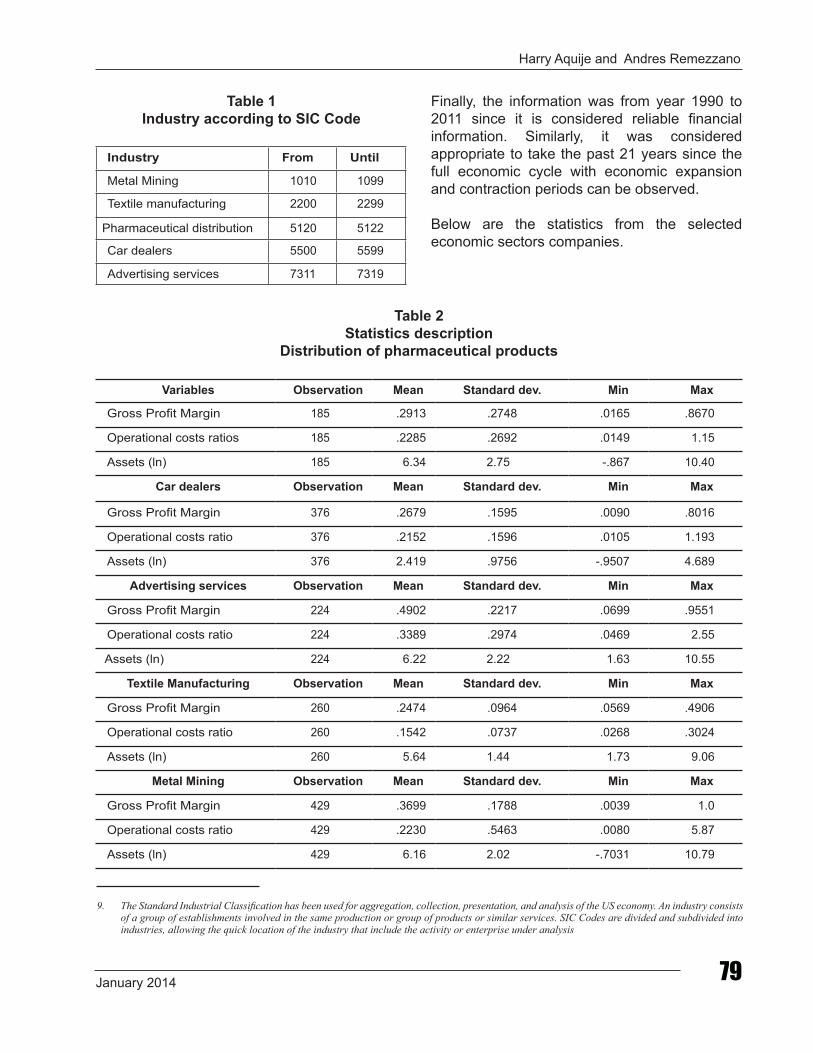
Harry Aquije and Andres Remezzano
January 2014 79
9. The Standard Industrial Classification has been used for aggregation, collection, presentation, and analysis of the US economy. An industry consists of a group of establishments involved in the same production or group of products or similar services. SIC Codes are divided and subdivided into industries, allowing the quick location of the industry that include the activity or enterprise under analysis
Table 1Industry according to SIC Code
Industry From Until
Metal Mining 1010 1099
Textile manufacturing 2200 2299
Pharmaceutical distribution 5120 5122
Car dealers 5500 5599
Advertising services 7311 7319
Finally, the information was from year 1990 to 2011 since it is considered reliable financial information. Similarly, it was considered appropriate to take the past 21 years since the full economic cycle with economic expansion and contraction periods can be observed.
Below are the statistics from the selected economic sectors companies.
Table 2Statistics description
Distribution of pharmaceutical products
Variables Observation Mean Standard dev. Min Max
Gross Profit Margin 185 .2913 .2748 .0165 .8670
Operational costs ratios 185 .2285 .2692 .0149 1.15
Assets (ln) 185 6.34 2.75 -.867 10.40
Car dealers Observation Mean Standard dev. Min Max
Gross Profit Margin 376 .2679 .1595 .0090 .8016
Operational costs ratio 376 .2152 .1596 .0105 1.193
Assets (ln) 376 2.419 .9756 -.9507 4.689
Advertising services Observation Mean Standard dev. Min Max
Gross Profit Margin 224 .4902 .2217 .0699 .9551
Operational costs ratio 224 .3389 .2974 .0469 2.55
Assets (ln) 224 6.22 2.22 1.63 10.55
Textile Manufacturing Observation Mean Standard dev. Min Max
Gross Profit Margin 260 .2474 .0964 .0569 .4906
Operational costs ratio 260 .1542 .0737 .0268 .3024
Assets (ln) 260 5.64 1.44 1.73 9.06
Metal Mining Observation Mean Standard dev. Min Max
Gross Profit Margin 429 .3699 .1788 .0039 1.0
Operational costs ratio 429 .2230 .5463 .0080 5.87
Assets (ln) 429 6.16 2.02 -.7031 10.79
CIAT/AEAT/IEF Tax Administration Review No. 3680
4.1. Distribution of pharmaceutical products
This sector is responsible for the wholesale distribution of pharmaceutical products, which handles prescribed drugs and over the counter drugs.
4.2. Car dealers and gas stations services
The retail distribution is formed by companies that sale products for personal or family consumption, as well as the provision of services related to these sales.
We will analyze the car dealers and gas station service. This group includes the retail distribution of new and used vehicles as well as boats, SUVs and motorcycles. It also includes the sale of spare parts and services from gas stations.
4.3. Advertising services
The business services are companies providing advertising, credit report, data processing, computer programming, mail, reproduction services, among others.
In this work we analyze the advertising services section, which is divided into four groups. In the first group are advertising agencies, which produce printed documents, graphic arts and design for newspapers, magazines, radio and television. The second group is of external advertising agencies, including companies which design billboards, posters, among others. The third group is formed by representatives of advertising on radio and television. Finally, in the
fourth group are companies that provide different advertising services, which consist in distribution of flyers, advertising on transportation systems and aerial advertising.
4.4. Manufacture of textiles
The manufacturing section includes companies engaged in the mechanical or chemical transformation of materials or substances into new products. These are described as plants or factories.
The manufacture of textile includes the operation of preparing the fiber and manufacturing yarn, ropes and cables. Similarly, they include activities of dying and completion of fibers, as also the coating and waterproofing. Finally, the manufacture of apparel and other finished thread products is also included.
4.5. Metal Mining
This group includes companies engaged in the mining, mine development and exploration of metal. These minerals are extracted to be used as such or to form alloy, produce chemicals, among others. They include the processes of crushing, grounding, washing, drying, or mineral leaching. It also includes the separation by gravity or by floating.
Finally, in the Group of companies obtained through the SIC codes search; those that had insufficient financial information or were not active during the last five years of analysis were eliminated. Those showing a negative gross margin were also eliminated.
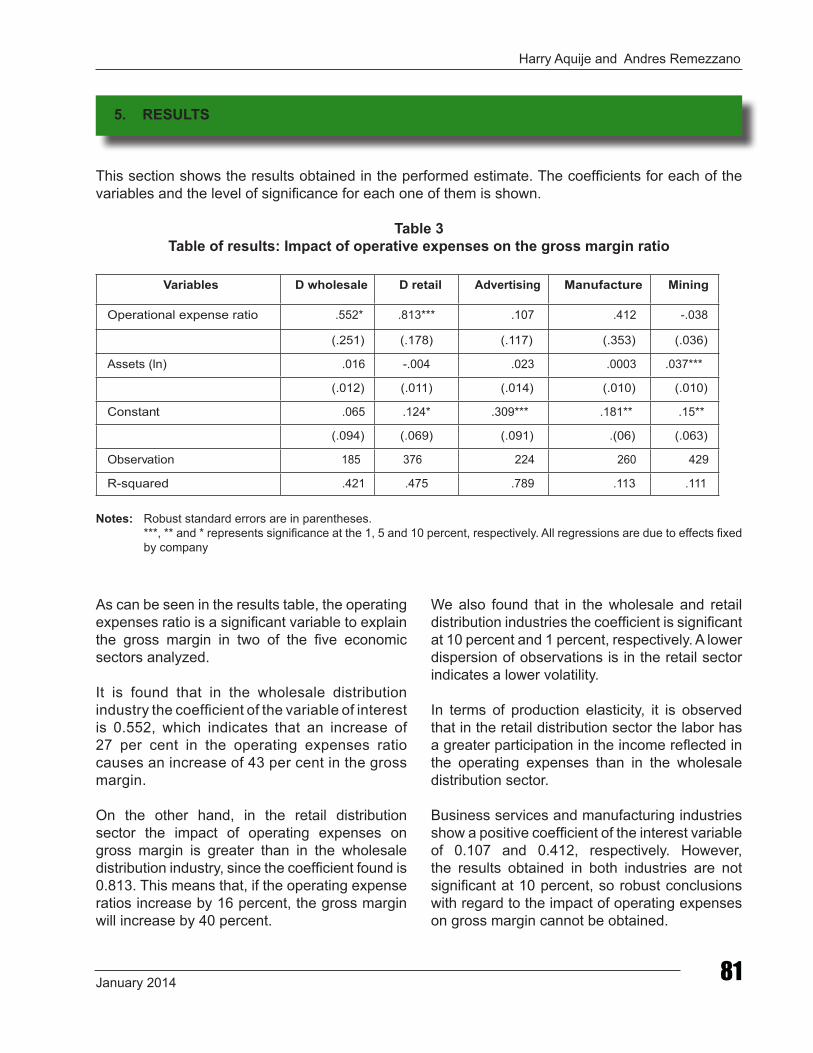
Harry Aquije and Andres Remezzano
January 2014 81
This section shows the results obtained in the performed estimate. The coefficients for each of the variables and the level of significance for each one of them is shown.
Table 3Table of results: Impact of operative expenses on the gross margin ratio
Variables D wholesale D retail Advertising Manufacture Mining
Operational expense ratio .552* .813*** .107 .412 -.038
(.251) (.178) (.117) (.353) (.036)
Assets (ln) .016 -.004 .023 .0003 .037***
(.012) (.011) (.014) (.010) (.010)
Constant .065 .124* .309*** .181** .15**
(.094) (.069) (.091) .(06) (.063)
Observation 185 376 224 260 429
R-squared .421 .475 .789 .113 .111
Notes: Robust standard errors are in parentheses. ***, ** and * represents significance at the 1, 5 and 10 percent, respectively. All regressions are due to effects fixed
by company
5. RESULTS
As can be seen in the results table, the operating expenses ratio is a significant variable to explain the gross margin in two of the five economic sectors analyzed.
It is found that in the wholesale distribution industry the coefficient of the variable of interest is 0.552, which indicates that an increase of 27 per cent in the operating expenses ratio causes an increase of 43 per cent in the gross margin.
On the other hand, in the retail distribution sector the impact of operating expenses on gross margin is greater than in the wholesale distribution industry, since the coefficient found is 0.813. This means that, if the operating expense ratios increase by 16 percent, the gross margin will increase by 40 percent.
We also found that in the wholesale and retail distribution industries the coefficient is significant at 10 percent and 1 percent, respectively. A lower dispersion of observations is in the retail sector indicates a lower volatility.
In terms of production elasticity, it is observed that in the retail distribution sector the labor has a greater participation in the income reflected in the operating expenses than in the wholesale distribution sector.
Business services and manufacturing industries show a positive coefficient of the interest variable of 0.107 and 0.412, respectively. However, the results obtained in both industries are not significant at 10 percent, so robust conclusions with regard to the impact of operating expenses on gross margin cannot be obtained.
CIAT/AEAT/IEF Tax Administration Review No. 3682
Finally, in the mining industry, the coefficient of the variable of interest is negative - 0.38 and is not significant at 10 percent. This result indicates that operating expenses do not explain the gross margin in the mining industry. In addition, there is a negative relationship between both variables. To interpret this result, we should consider that mining activities require high amounts of capital for their implementation and have a medium-term investment horizon. On the other hand, the price at which minerals are sold is very sensitive to global economic activity, in particular to the demand from China that has driven prices upward. However, China’s growth has slowed
down in recent years, affecting considerably the prices. The level of assets is a significant variable to explain the gross margin in this sector.
Due to the results obtained, it can be concluded that in the manufacturing, mining and services industries there is no evidence at empirical level to discard the use of methods based on gross margins due to differences in expenses intensity. While for the wholesale and retail distribution sectors, methods that externally compare gross margins should be rejected, since the operating expenses are an explanatory variable of gross margin in these industries.
6. CONCLUSIONS
The conclusion of this work is that in the wholesale distribution and retail distribution sectors, the operating expenses ratio is an explanatory variable of the gross margin. Therefore there is empirical evidence to discard out the use of methods based on gross margins at external level in these sectors. A possibility in these cases would be using this method at the level of the operating margin, as the OECD suggests.
In the same way, we find that companies with higher general and commercial costs are economically balanced with higher gross margins, in the manufacturing, services and wholesale and retail distribution sectors. It is worth mentioning, that in the manufacturing and services sectors we find a positive relationship
between these variables, but not a significant relationship. In the same way, in the mining sector we find a negative relationship, but not an explanatory relationship of the level of operating expenses on gross margins.
Finally, it is observed that the theoretical assumption that indicates that higher level of operating expenses corresponds to a higher gross margin is not fulfilled in the mining sector. Obviously, assets are an important variable in this sector. A preliminary explanation could be that since these are commodities, international prices affect the gross margin, while operating costs respond to non-current factors of the company. This result, as well as the trends found for each industry, could be subject of further studies.
Harry Aquije and Andres Remezzano
January 2014 83
7. BIBLIOGRAPHY
Loeffler, Clemens, y Thomas Pfeiffer. 2011. “Market versus cost-based transfer pricing, intra- company coordination and competitive behavior on the intermediate market,” Journal of Business Economics, forthcoming.
Myers, Joan, y Mary Collins. 2011. “An historical review of transfer pricing theories: Addre- sing goal congruence within the organization,” 18 American Society of Business and Beha- vioral Sciences 1-13.
“OECD Transfer Pricing Guidelines for Multinational Enterprises and Tax Administrations,” OECD Publishing 2010.
Przysuski, Martin, y Srini Lalapet. 2005.“A Comprehensive Look at the Berry Ratio in Trans- fer Pricing,” 8 Tax Notes International 759-767
Remezzano, Andr´es. 2013. “Historia y contexto sobre Precios de Transferencia,” Revista Análisis Tributario 22-24.
Silva, Ednaldo. 1999. “Transfer Pricing Under Gross Profit Methods: Adjustment for Fun- ctions Performed,” Journal of Global Transfer Pricing 33-39.
United Nations, “Practical Manual on Transfer Pricing for Developing Countries,”United Nations New York 2013.
Amerkhail, Valerie. 2006. “Functional Analysis and Choosing the Best Method,” 12 Economic Consulting Services, LLC 1-29.
Bierman, Harold. 1959. “Pricing Intracompany Transfers,” 34 Accounting Review 429-432.
Berry, Charles. 1999. “Berry Ratios: Their Use and Misuse,” Journal of Global Transfer Pricing.
Cook, Paul. 1955. “Decentralization and the Transfer-Price Problem,” 28 Journal of Business87-94.
Ernst and Young 2011. “2010 global transfer pricing survey”.
Heflebower, Richard. 1960. “Observations on Decentralization in Large Enterprises,” 9 Journal of Industrial Economics 7-22.
Hirshleifer, Jack. 1956. “On the economics of Transfer Pricing,” 29 Journal of Business 172- 184.
Holmstrom, Bengt, y Jean Tirole. 1991. “Transfer Pricing and Organizational Form,” 7 Jour- nal of Law, Economics & Organization 201-228.
Li, Dan y Manuel Ferreira. 2007. “Internal and External Factors on Firms Trasfer Pricing Decisions: Insights from Organization Studies,” 6 GlobAdvantage 1-34.

All the material contained in this publication was prepared and set up at the Publications Center of the CIAT Executive Secretariat, P. O. Box 0834-02129, Panama Republic of Panama. Concluded in January 2014.