
Churn Forecasting Model for South African Pre-Paid...
21
RAIS RESEARCH ASSOCIATION for INTERDISCIPLINARY STUDIES FEBRUARY 2018 51 Churn Forecasting Model for South African Pre-Paid Service Providers Olusola Gbenga Olufemi Department of Computer Science, Tshwane University of Technology, South Africa [email protected] Trudie Strydom Department of Computer Science, Tshwane University of Technology, South Africa [email protected] ABSTRACT: Telecommunication companies globally confront with rising problems of customer agitations. Inadequacy of telecoms’ rendered services, delivered products and many other causes, result to the difficult moments telecoms face. ese problems have further degenerated to customers leaving from one network provider to the other, in quest for improved satisfaction. Churn is the term used to describe this customers’ resultant movement, due to agitation caused by inadequate operations. e Republic of South Africa (RSA) telecoms presently face this social problem called churn. To understand what causes customer churn, deep studies on varied literature on customer churn revealed the reasons behind this movement, i.e. churn factors. A developed customer experience questionnaire from these studied factors identified the main churn causing factors in RSA telecoms. is questionnaire eased the obtaining of data-records from respondents in South Africa, used in creating varied datasets. Using the varied datasets, a Bayesian networks’ model developed detected and evaluated churn likelihood in these different telecoms. is model proved to have more predicting potentials and relevance in our present days. ree factors revealed to impact more on customer churn in South Africa, by way of the DOI: 10.5281/zenodo.1196495
Transcript of Churn Forecasting Model for South African Pre-Paid...

R A I S RESEARCH ASSOCIATION for INTERDISCIPLINARY STUDIESFEBRUARY 2018
51
Churn Forecasting Model for South African Pre-Paid Service Providers
Olusola Gbenga Olufemi Department of Computer Science,
Tshwane University of Technology, South [email protected]
Trudie Strydom Department of Computer Science,
Tshwane University of Technology, South [email protected]
ABSTRACT: Telecommunication companies globally confront with rising problems of customer agitations. Inadequacy of telecoms’ rendered services, delivered products and many other causes, result to the difficult moments telecoms face. These problems have further degenerated to customers leaving from one network provider to the other, in quest for improved satisfaction. Churn is the term used to describe this customers’ resultant movement, due to agitation caused by inadequate operations. The Republic of South Africa (RSA) telecoms presently face this social problem called churn. To understand what causes customer churn, deep studies on varied literature on customer churn revealed the reasons behind this movement, i.e. churn factors. A developed customer experience questionnaire from these studied factors identified the main churn causing factors in RSA telecoms. This questionnaire eased the obtaining of data-records from respondents in South Africa, used in creating varied datasets. Using the varied datasets, a Bayesian networks’ model developed detected and evaluated churn likelihood in these different telecoms. This model proved to have more predicting potentials and relevance in our present days. Three factors revealed to impact more on customer churn in South Africa, by way of the
DOI: 10.5281/zenodo.1196495

Proceedings of the RAIS Conference I FEBRUARY 19-20, 2018
52
predictions carried out by the derived model. These factors are: Friends & Family Deals on Networks (FFD), Customer Care Service (CCS), and Offers & Promotions (OP).KEYWORDS: Churn, Data Mining, Decision Support System, Customer Relationship Management, Bayesian Networks, DAG, Pre-paid Service, R BNlearn.
1. Realizing Influential Churn Factors and Suitable Churn Model
In tackling churn problems, numerous attempts have been made to achieve some appropriate insights toward the churn concepts. In general, it is discovered that research in this field has been made with one of the following aims (Daly 2011, 2-5):
· Finding the influential factors on customer churn· Building models for customer churn prediction; these two aims specifically give
directions in resolving churn problems according to Daly (2011).
1.2. IntroductionThe telecoms’ market is one of the fastest rising service provider sectors (GSMA 2016, 15). As stated by Nadim (2012), a fierce competition is being witnessed at present amongst major providers of telecom products and services in South Africa. This rivalry is with known pre-paid providers: Vodacom, MTN, Cell C, Telkom Mobile and Virgin Mobil (Nadim 2012, 1-5). This has caused churning of valuable customers among the network providers. Churn - or customer leaving a provider - is a major problem that many in the various industries would be delighted to solve (Shaun 2014, 1-8). However, it is extremely tough for telecom managers to keep retention magnitudes up (Amulya 2013, 7-9). The cost of adding a new subscriber is higher than retention cost of existing customers (Constantinou 2014, 6-7). It is therefore understandable why telecommunication companies find it paramount to keep old customers, along with acquiring new ones. Pre-paid customers are the major focus here as they make up greater percentage of customers’ population in telecoms. These are also more prone to churn since there are no contracts binding them to specific service providers. Pre-paid option is steadily taking a larger share of gross advertisement in South Africa (Deloitte 2011, 7). As studied, monetary investment and growth of any telecom can be influenced negatively by high pre-paid customer churn (Molapo 2011, 4). There is, therefore, a necessity for understanding why telecoms’ customers churn, and need for robust churn predicting mechanisms, to reduce churn with pre-paid customers in RSA. Importantly, being able to predict customers who intend to churn is a major key to telecoms’ profitability (Constantinou 2014, 5).

53
Olufemi & STRYDOm: Churn forecasting model for South African Pre-Paid Service Providers
1.3. Literature ReviewBayesian theorem helps to reason about likelihood of hypothesis, given specific evidence (Conrady 2015, 5). When we have the evidence, our belief is restructured in the probability of the hypothesis taking place (Conrady 2015, 7). Numerous variables may be available as evidence, with these variables influencing our belief (Conrady 2015, 8). According to Conrady (2015), Bayesian networks (BN) use the opportunity of independency amongst specific variables around the problem realm, in building graphical structures called Directed Acyclic Graphs (DAGs), thereby reducing the number of dependencies needed when inference for a certain reasoning is to be achieved. A directed line from the “causing” node to that which is being “affected’’, is what direct causal dependencies signify, and this is clearly demonstrated by Bayesian networks structures (Conrady 2015, 10).A collection of conditional probability tables (CPTs) is another crucial feature of the Bayesian networks (Conrady 2015, 11). What we have as the prior probabilities before any inference is derived or query is invoked are the initial probabilities (Conrady 2015, 8). According to Conrady (2015), the invocation of these values gives rise to conditional probabilities. These new values produce the posterior probabilities for every variable, when we have each of those variables’ parents in the query (Conrady 2015, 9). Representing dependencies and independencies among certain variables within a given domain is performed reliably through constructing a Bayesian networks’ model (Conrady 2015, 16). It is also easy to understand the interactions among variables and dependencies, since they are modeled in graphical form through Bayesian networks (Cofino 2002, 4).Datta et al. (2001) created a model to predict churn for a mobile service subdivision by using decision tree and genetic algorithm. Unlike genetic algorithm, Bayesian networks use decision theory for risk examinations, and select in respective circumstance actions that boost the anticipated values in a less ambiguous way (Daly 2011, 16). Pendharkar (2009) designed two models with a Genetic Algorithm based Neural Network. Just like Bayesian networks, the structure of a Neural Network is a weighted directed acyclic graph. The creation of these two network types begins with a collection of primary edge weights and lingers until realizing the ideal weights. In contrast to Neural Network, a Bayesian networks’ model is robust in that it can accommodate minor amendments in the model, and these amendments do not upset the operations of the entire system (Daly 2011, 19). Different from Neural Network model parameters appearing regularly to those using them as a “black box”, every parameter in Bayesian networks’ model has clear semantic descriptions (Daly 2011, 25). Hence,

Proceedings of the RAIS Conference I FEBRUARY 19-20, 2018
54
a justified reason for Bayesian networks’ use in this research. Wei and Chui (2002) developed a new model for customer churn prediction in a telecommunication service industry, using classification analysis technique. Significantly, the Bayesian networks’ technique appropriated in this research can be used for resolving discriminative tasks (i.e. classification), and regression difficulties (i.e. configuration difficulties and forecasting) (Wamukeke 2014, 4). Generalized Additive Neural Networks (GANN) was suggested as a technique which can be used to build model, to predict customer churn in the RSA telecom industries (De Waal 2008, 3). However, GANN’s models have pitfalls still associated with Neural network.
1.4. MethodologyThe European Society for Opinion and Market Research (ESOMAR) rules were applied and their objectives upheld while meeting with the various telecom customers for customer-experience-data. These rules were applied to the questionnaire developed through literature studies. The questionnaire was used in gathering customer-experience-data, and other information relating to customer relationship management. The principal objective of Esomar’s rules is to protect the data and information released to the researchers by any organization, participant or respondent (e.g. pre-paid users), importantly during the survey (ESOMAR 2014, 2). The questionnaire (SurveyMonkey online and paper types) made, were completed by pre-paid customers of MTN, Vodacom, Cell C, Telkom Mobile and Virgin Mobile, since these are major pre-paid providers in South Africa (UNICEF 2012, 48). Making use of the questionnaire, a 313-sample size data was derived from respondents, which ensured a confidence level of 95%, using a confidence interval of 6 (Moore 2013, 15). The resulting outcomes from the questionnaire were very relevant for the derivation of the data used in building and evaluating the Bayesian networks’ models in this study. These outcomes were specifically used to obtain the models’ nodes, structures, and to derive conditional probabilities. However, the conditional probabilities will not be fully discussed in this study. Data derived from this questionnaire was helpful in querying the applicable models, as this also served as test data.From literature reviews, a total of thirteen factors were identified to be related to pre-paid customer churn in South Africa. A variable “Believe will leave network (BWN),” was added as a variable to complement this list. This was included in the questionnaire to test the derived models. The BWN is referred to as the target variable in the developed network structures; with this serving in the networks’ queries (Yap 2008, 22). These factors are as outlined, with abbreviations accorded to them as shown in Table 1.1.

55
Olufemi & STRYDOm: Churn forecasting model for South African Pre-Paid Service Providers
Table 1.1: Variables included as influential churn factors
Variables Abbreviation1 Voice Signal Strong VSS2 Data Strong Strength DSS3 Calls Not Dropping CND4 Low Cost for Calls LCC5 Low Cost for Data LCD6 Accurate Charge AC7 Pre-paid Plan PP8 Friends & Family Deals on Network FFD9 Customer Care Service CCS10 Duration Stayed with Network ND11 Roaming Service RS12 Offers & Promotion OP13 Age Group AG14 Believe will leave Network BWN
The specific factors that cause pre-paid customer churn for similar case studies may vary (Yap 2008, 25). A generated Bayesian networks’ model derived from this data, represents a probabilistic model for predicting future churn for pre-paid customers. The BN parameters utilized were obtained by means of learning from data. To create records for the BN parameter learning, the collected questionnaire data were extracted and processed. The following pre-processing, processing, and extraction steps were performed on the raw data for each customer record and period (Przytula 2012, 3):
1. The variables e.g. Voice Signal Strong (VSS), Call Not being Dropped (CND), Believe will Leave Network (BWN), and so on were determined.
2. The states-values of all the variables were conceived. This means that specific states-values were associated with each variable. For example, the value of “Strongly Agree” or its associated numeric value of 5 is a typical value.
3. All the period-customer records for which one or more independent or dependent variables’ states-values could not be featured were dropped from the dataset.
On completing these steps, record sets were obtained with one record (for customers who had not previously churned), and record (for customers who had previously churned) for each respondent, having the states-values for the different variables associated with these respondents. These records were then eventually transferred into Excel spreadsheets.

Proceedings of the RAIS Conference I FEBRUARY 19-20, 2018
56
Foremost of the objectives of the Bayesian method is to model the posterior conditional probability distribution of outcomes (often causal) variable(s), after observing new evidence. Bayesian networks may be constructed either manually or automatically with the knowledge of the underlying area of study, from a large dataset using several applicable development tools (Horny 2014, 14). The Bayesian networks’ construction was kicked-off with learning from data, such as that found in pre-paid customer records. Consider the table in Figure 3.1 as sample data-records, shown on a spreadsheet. Each row of the table corresponds to an individual, and what is known about his pre-paid experience or satisfaction. One can use such dataset to learn the network parameters given its structure or learn both the structure and its parameters (Daly 2011, 32). More importantly, learning either the structure or parameters becomes less stressful when the dataset is complete (Daly 2011, 36). This completeness implies that all nodes and their states-values are present in each data-record. Hence, complete data-record sets are important for accurately deriving directed acyclic graph, which a Bayesian networks’ model denotes. Figure 1.1 shows the randomised 313 data-records. The randomisation possible through R support in conducting records’ sorting. This allowed each record smooth chance for the learning procedures. The randomisation did not change the data-records’ content, but had placed each record in a different position in the 313 data-records.
Figure 1.1: A view of the pre-paid customer records (A segment)

57
Olufemi & STRYDOm: Churn forecasting model for South African Pre-Paid Service Providers
Figure 1.2 shows the randomised dataset’s data-values recorded in numeric values. The BN model development can only be carried out with numeric data-values with BNLearn package. Hence, data-values Strongly Agree, Agree, Neutral, Disagree and Strongly Disagree were modified to 5.0, 4.0, 3.0, 2.0 and 1.0 respectively.
Figure 1.2: A view of randomized & coded data-records (A segment)
1.4.1. Generating Directed Acyclic Graphs with Varied Learning DatasetsAs suggested by Lucas (2004), putting up a directed acyclic graph (DAG) that represents a Bayesian networks (BN) model should primarily begin from visualizing and recognizing applicable nodes (random variables), and the operational dependencies existing amongst these nodes. To start this development, a likert scale was firstly used with the option: Strongly Agree, Agree, Neutral, Disagree, and Strongly Disagree, to measure respondents’ attitudes to each particular question or statement in the survey questionnaire (SSC 2001, 2).

Proceedings of the RAIS Conference I FEBRUARY 19-20, 2018
58
To make the usage of the data-values for the Bayesian networks’ construction more relevant, Likert scale was used. Number 5 coded the Strongly Agree response, 1 coded the Strongly Disagree response. This means that the data-value’s weight was made to decrease as one moves from 5 to 1. By using this method, the decision adopted a semi-continuous range of values for the variables, recorded as numbers (1-5) rather than alphanumeric values (Disagree, etc.). This choice resulted in conditional densities derived, rather than conditional probabilities, as would have been the case otherwise. For the Age-Group and Duration on Network variables, the coding scheme used was from 1 - 4, since there are four values in each of these variables. Hence, the Age-Group variables were represented: 18-30 as 1, 31-43 as 2, 44-56 as 3, and 57-69 represented 4. Similarly, the Duration on Network variables were denoted: Less than 6 months as 1, Between six months and one year as 2, Between one year and two years as 3, and More than two years as 4.
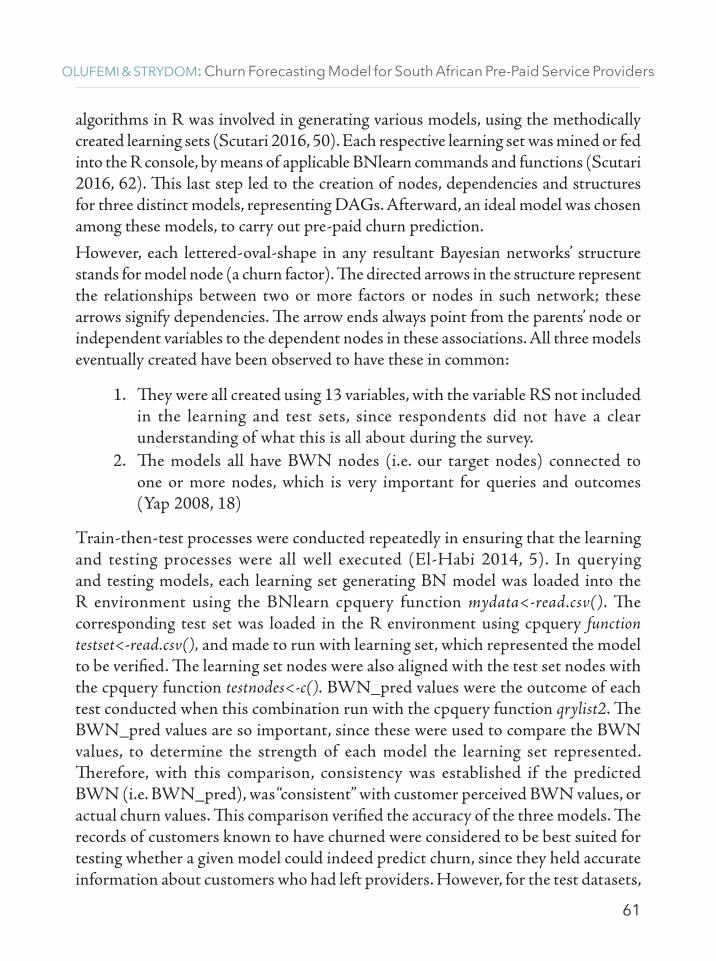
A decision on collected data fragment to be used for building these models was enforced, since not the whole dataset from the survey was to be involved in putting up these diverse models (Daly 2011, 38). A preliminary dataset of 313 data-records derived from the questionnaire was made to have each record numbered. A specific numbering scheme was used to ensure that records obtained from previous churn customers could be identified. The numbers were not used in the models’ creation and queries but helped to understand some trends in performance. A new randomized 558 data-records was created from the 313 data-record through post-fixing the records with R. This new data creation also included records on the right-hand-side (RHS) of the 313 data-records, for the pre-paid customers who had left the network previously (Figure 1.3), been moved to the bottom of the same 313 data-records. The users’ responses in this moved data-records (i.e. 245 data-records of leavers – Figure 1.3) were reversed to normal, except for the column users’ responses under Age-Group and Network Duration. This derivation scheme of the new 558 data-records is as pictured in Figure 1.4.
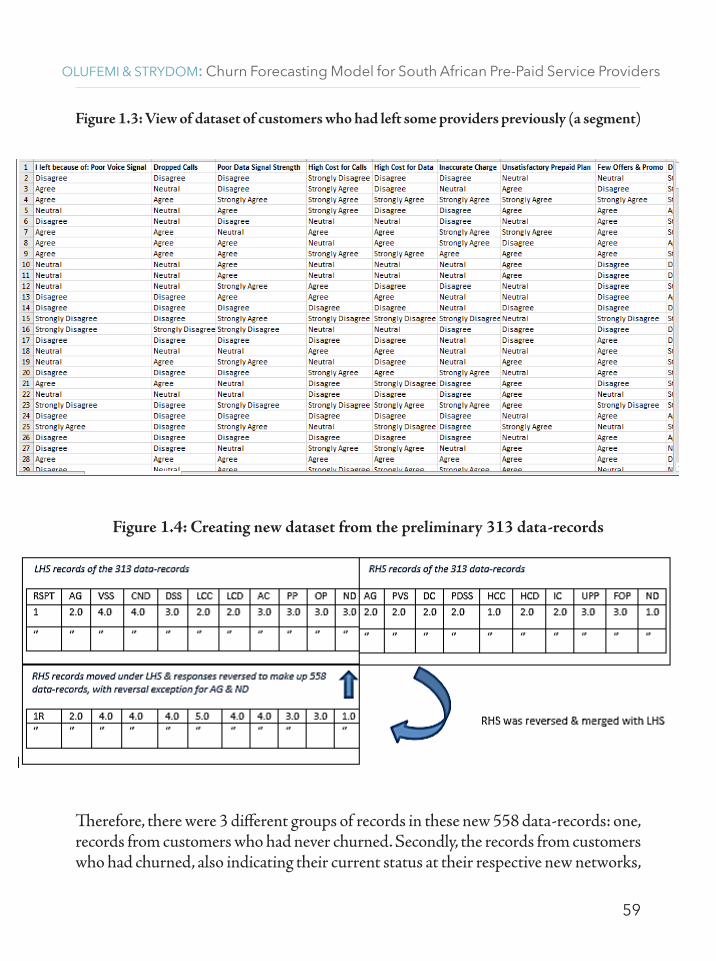
Figure 1.3 shows a subset of the records of churned prepaid customers of the various networks, as revealed through the questionnaire for the derivation of customer-experience-data. The reasons they left providers are also clearly stated there-in. This subset was obtained from the last questions on the developed questionnaire, captured as the right-hand side of each row (record) of the spreadsheet, originally in columns V to AF.
59
Olufemi & STRYDOm: Churn forecasting model for South African Pre-Paid Service Providers
Figure 1.3: View of dataset of customers who had left some providers previously (a segment)
Figure 1.4: Creating new dataset from the preliminary 313 data-records
Therefore, there were 3 different groups of records in these new 558 data-records: one, records from customers who had never churned. Secondly, the records from customers who had churned, also indicating their current status at their respective new networks,

Proceedings of the RAIS Conference I FEBRUARY 19-20, 2018
60
as well as their belief that they would leave. Thirdly a group of records for customers who had churned previously, and their rating of the aspects that caused them to churn from those previous providers. Eventually, three different learning sets and three test sets were constructed using this new dataset – 558 data-records, to determine aspects that may influence the performance of a derived churn prediction model. It should be remembered the Roaming Service variable was not included in the learning or test datasets created, since survey respondents did not understand its meaning. However, the preliminary 313 data-records, the new 558 data-records, the learning sets, and test sets derived from the 558 data-records, are not all fully shown in this study due to limited space. More importantly, absolute care was taken to avoid learning and test sets’ data overlap, to ensure high model accuracy (Rajaraman, 2014, 351).
Table 1.2: Summary of the varied learning and test datasets created
Datasets Approach for datasets’ creation Total Records formed
Learning set 1 (LS1)Top 85 records LHS + Top 85 records RHS of 558-record dataset.
170
Learning set 2 (LS2)Records in rows 2 – 383 in the 558-record dataset formed this.
381
Learning set 3 (LS3)Records in rows 243 – 314 was combined with records in rows 2 – 86 in the 558-record dataset.
157
Test set 1 (TS1)Next 85 records LHS + Top 85 records RHS of 558-record dataset.
170
Test set 2 (TS2) 86 data-records, from rows 385 – 470. 86
Test set 3 (TS3)Rows 87 – 163 records, combined with row 385 – 470 records in the 55-record dataset.
163
Each dataset obtained was saved in MS Excel .csv format, enabling data use in the R environment (Hojsgaard 2016, 8) during models’ generation, running of diverse queries and model testing. More importantly, BNlearn Mixed Max-Min Hill-Climbing (mmhc)
61
Olufemi & STRYDOm: Churn forecasting model for South African Pre-Paid Service Providers
algorithms in R was involved in generating various models, using the methodically created learning sets (Scutari 2016, 50). Each respective learning set was mined or fed into the R console, by means of applicable BNlearn commands and functions (Scutari 2016, 62). This last step led to the creation of nodes, dependencies and structures for three distinct models, representing DAGs. Afterward, an ideal model was chosen among these models, to carry out pre-paid churn prediction.
However, each lettered-oval-shape in any resultant Bayesian networks’ structure stands for model node (a churn factor). The directed arrows in the structure represent the relationships between two or more factors or nodes in such network; these arrows signify dependencies. The arrow ends always point from the parents’ node or independent variables to the dependent nodes in these associations. All three models eventually created have been observed to have these in common:
1. They were all created using 13 variables, with the variable RS not included in the learning and test sets, since respondents did not have a clear understanding of what this is all about during the survey.
2. The models all have BWN nodes (i.e. our target nodes) connected to one or more nodes, which is very important for queries and outcomes (Yap 2008, 18)
Train-then-test processes were conducted repeatedly in ensuring that the learning and testing processes were all well executed (El-Habi 2014, 5). In querying and testing models, each learning set generating BN model was loaded into the R environment using the BNlearn cpquery function mydata<-read.csv(). The corresponding test set was loaded in the R environment using cpquery function testset<-read.csv(), and made to run with learning set, which represented the model to be verified. The learning set nodes were also aligned with the test set nodes with the cpquery function testnodes<-c(). BWN_pred values were the outcome of each test conducted when this combination run with the cpquery function qrylist2. The BWN_pred values are so important, since these were used to compare the BWN values, to determine the strength of each model the learning set represented. Therefore, with this comparison, consistency was established if the predicted BWN (i.e. BWN_pred), was “consistent” with customer perceived BWN values, or actual churn values. This comparison verified the accuracy of the three models. The records of customers known to have churned were considered to be best suited for testing whether a given model could indeed predict churn, since they held accurate information about customers who had left providers. However, for the test datasets,

Proceedings of the RAIS Conference I FEBRUARY 19-20, 2018
62
the customer’s own belief of whether he may churn, as captured in the node BWN, was also used as an indication of probable churn.The performance of each model derived was expressed in percentage as follows with this formula:
Total Number of Records with Consistent Values in Test Dataset TS Total Number of Records in Test Dataset TS
This formula tells us that a model’s performance is calculated as percentage, in ratio of the total number of records with consistent values in a test dataset, to the total number of records in the same test dataset. Summary of evaluation of the derived models’ performance is presented in the next section. This highlights the comparison observed on outcomes derived for each test on the three models.
2. The Outcome of the realized Churn Predicting Model
2.2. QuestionnaireTelecom markets in RSA have experienced churn in past few years, with subscribers switching communication service providers (CSP) in that period, as indicated by this study survey on pre-paid customers. The numbers of respondents still believed to be loyal to their CSPs are at the same time large. This study data were analyzed by statistical means, using tables and graphs (ACAPS 2012, 4). From the statistics gathered, it was observed that many network providers have been badly affected by this phenomenon called churn, as illustrated in Figure 2.4 showing the percentage of customers who left providers due to some unfavorable factors. Our sample data revealed that 78.27% of the respondents’ population in South Africa churned from their previous providers due to diverse reasons (factors). These statistics can help the badly and less affected providers intensify constructive efforts, which will, in turn, reduce churn with them. Figure 2.1, Figure 2.2 and Figure 2.3 show customer count by gender, age-groups and customer-network. Figure 2.2 shows that most of the respondents who fell into the age-group 18-30 (52.74%), were the most active users of the pre-paid network option. Figure 2.6 shows that many of the respondents were 78% satisfied with their current network providers (Strongly Disagree and Disagree), indicating that they did not believe that they will leave their current network providers.
* 100%

63
Olufemi & STRYDOm: Churn forecasting model for South African Pre-Paid Service Providers
Figure 2.2: Active pre-paid customers by Age-Group
Figure 2.3: Pre-paid networks customers’ population represented in this study
Figure 2.1: Customer Count by Gender

Proceedings of the RAIS Conference I FEBRUARY 19-20, 2018
64
Figure 2.4: Churned customers
Figure 2.5: Duration Customers had endured before Churning
Figure 2.6: Impending churn
65
Olufemi & STRYDOm: Churn forecasting model for South African Pre-Paid Service Providers
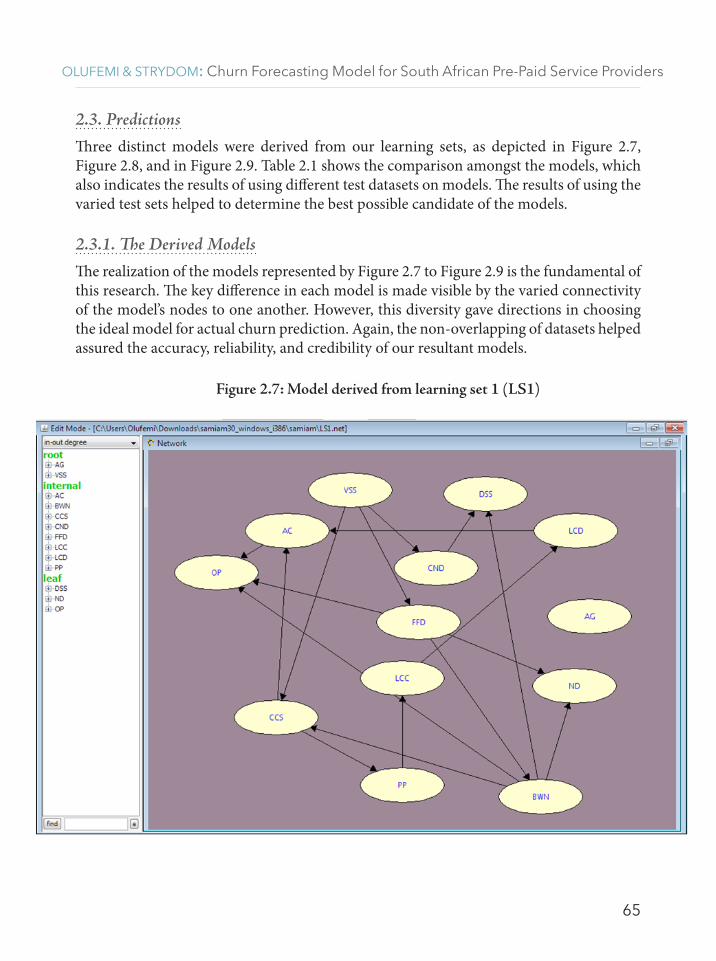
2.3. PredictionsThree distinct models were derived from our learning sets, as depicted in Figure 2.7, Figure 2.8, and in Figure 2.9. Table 2.1 shows the comparison amongst the models, which also indicates the results of using different test datasets on models. The results of using the varied test sets helped to determine the best possible candidate of the models.
2.3.1. The Derived ModelsThe realization of the models represented by Figure 2.7 to Figure 2.9 is the fundamental of this research. The key difference in each model is made visible by the varied connectivity of the model’s nodes to one another. However, this diversity gave directions in choosing the ideal model for actual churn prediction. Again, the non-overlapping of datasets helped assured the accuracy, reliability, and credibility of our resultant models.
Figure 2.7: Model derived from learning set 1 (LS1)

Proceedings of the RAIS Conference I FEBRUARY 19-20, 2018
66
Figure 2.8: Model derived from learning set 2 (LS2)
Figure 2.9: Model derived from learning set 3 (LS3)

67
Olufemi & STRYDOm: Churn forecasting model for South African Pre-Paid Service Providers
2.3.2. Comparison of the Learning Sets & Models GeneratedA challenging task in predictive modelling is finding the proper datasets for building conforming predictive models (Scutari 2016, 74). The use of only high-quality datasets was ensured during the data analysis, learning, and evaluation procedures (Gartner 2011, 9). The approach adopted in this study was using one preliminary dataset, but with different variations of the use of the dataset, for the generation of varied models. When comparing the different models, the target variable BWN was an important determinant in the choice of ideal model, since this is a key indicator of whether the customer will leave a pre-paid network. Table 2.1 gives highlights on comparisons of learning sets and models derived from these datasets.
Table 2.1: Models’ Assessment Table
Model No. of Data-records involved in learning
No. of Nodes’ Participation in learning
No. of Nodes’ Connections to one another
Appropriate Node Connections to the target variable node BWN
Figure 2.7Learning Set 1 (LS1) 170 13 17 1 (FFD)
Figure 2.8Learning Set 2 (LS 2) 381 13 21 3 (FFD, OP, CSS)
Figure 2.9Learning Set 3 (LS 3) 157 13 17 1 (FFD)
The node BWN in the model shown in Figure 2.8, is a direct descendant or child of FFD, OP and CSS nodes. More importantly, the BWN node in Figure 2.8 has more direct connections of other nodes to it than in Figure 2.7 and Figure 2.9. Consequently, this implies that these nodes connected to BWN in Figure 2.8, representing churn factors are the most pressing - affecting the pre-paid customers. It should also be noted that Figure 2.8 has the highest number of connections of nodes to one another in its network - 21. Hence on these grounds, Figure 2.8 may well serve as the ideal model, most suitable for churn prediction in this study.

Proceedings of the RAIS Conference I FEBRUARY 19-20, 2018
68
2.3.3. Models’ Performance Evaluation
Table 2.2: Summary of Performance Evaluation for LS1, LS2 & LS3 Models
Model Query and Test Performed using BNlearn on (LS +TS)
Number of Records in Learning Set(LS)
Number of records in Test Set
Number of Nodes in Test Set apart from BWN
Customer BWN = Predicted BWN
Accuracy 0f Model Assessment in (%)
LS1 + TS1 170 170 12 130 Ok, 41 Inconst.
68.5
LS2 + TS2 381 86 12 73 Ok, 13 Inconst.
84.88
LS2 + TS1 381 170 12 97 Ok, 73 Inconst.
57.06
LS3 + TS3 157 163 12 78 Ok, 85 Inconst.
47.85
LS2+TS2R 381 86 3 74 Ok, 22 Inconst.
74.42
LS2+TS3 381 163 12 Ok 127, 36 Inconst.
77.91
NB: Inconst. in table means Inconsistence
From Table 2.2, we can also deduce that the best model turned out to be Figure 2.8, derived from LS2, which was tested correspondingly with TS1, TS2, TS2R and TS3. With test set TS2, it established the highest performance evaluation – 84.88%. This performance value qualifies it as an ideal model, since it originated from the ideal learning set LS2. Following the Bayesian paradigm, using also a reduced test set containing only the direct parents of the target node BWN (FFD, CSS, OP) on LS2, a good performance was still obtained in terms of predicting churn (74.42%). The model generated from LS2 was also tested further, using a test dataset TS3 that contained mixed high and low values of BWN. This test similarly yielded satisfactory result, although in this scenario there was data overlap between learning and test datasets. This data overlap therefore does not make TS3 absolutely fit for testing on LS2.
Conclusions
To be more relevant and profitable in this highly competitive telecom market, network providers need to predict intending churning customers more precisely and promptly. They need to also take proactive actions to retain valuable customers. In

69
Olufemi & STRYDOm: Churn forecasting model for South African Pre-Paid Service Providers
this research, we have offered a different technique for building predictive models for pre-paid customers’ churn prediction. Many prediction models and churn detection techniques have been presented to date. However, more robust models are required to predict churn by pre-paid telecoms, considering the extreme social effects of churn. In this study, a Bayesian networks model is introduced to predict churn in telecoms. This model is easy to implement, and all the parameters are routinely calculated. Results indicate that in comparison to other related models in relevant comparable literature, the Bayesian networks’ models are effective ways to solving problem as pre-paid customer churn in South African telecoms, where the aim is to detect and curb churn as much as possible (Constantinou 2014, 5). The most fascinating attribute of Bayesian networks is the part it plays in validating causation (Darwiche 2010, 7). BNlearn package in R software was utilized in this work, in putting up the required Bayesian networks models, since it was found reliable for data manipulation and graphical model development (Venables 2016, 75).
In summary, dataset LS2 produced the best model – ideal model (Figure 2.8), with performance above 80%. This model’s reliability was made possible, principally following the principles guiding the creation of the varied learning sets and the corresponding test sets. Friends & Family Deals on network, Customer Care Service, and Offers & Promotions (i.e. FFD, CCS and OP) may be considered the most crucial churn promoting factors in SA telecoms. Hence, FFD, CSS and OP may be accorded more prominence by the telecoms in RSA in formulating strategies that may enhance customer satisfactions. If meeting with customers’ satisfaction is telecoms’ goal, they will similarly maximize profit in return as they predict better the reactions of their customers to the much-needed services they provide daily. Consequently, it is believed that the model’s improvement in the future lies more with the availability of more refined and increased quantity of customer-experience-data. In conclusion, conducting further studies on building more enriched predictive models, using more polished and plentiful churn datasets collected directly from telecoms is in conception.
References
ACAPS. 2012. Qualitative and Quantitative Research Techniques for Humanitarian Needs Assessment. Geneva: ACAPS.
Amulya, M. 2013. Customer Retention Strategies in Telecom Service Providers in India. International journal of Engineering & Management Science I.J.E.M.S, 4:1.

Proceedings of the RAIS Conference I FEBRUARY 19-20, 2018
70
Cofino, Antonio.S., Rafael Cano, Carmen Sordo, Jose. M. Gutierrez. 2002. Bayesian Networks for Probabilistic Weather Prediction. European Conference on Artificial Intelligence. IOS Press:1-5.
Conrady, S., L. Jouffe. 2013. Bayesian network and BayesLab – A Practical Introduction for Researchers. Accessed December 12, 2015. http://www.bayesia.com/book.
Constantinou, Michael. 2014. Pre-paid Churn Prediction. Revenue Science.
Daly, Ronan. 2011. “Learning Bayesian networks: approaches and Issues.” The Knowledge Engineering Review 22(2):1-59.
Darwiche, Adnan. 2010. What are Bayesian networks and why are their applications growing across all fields? Communications of the ACM, 53:90.
De Waal, David.a., Jan. V. De Toit. 2008. Gaining Insight into Customer Churn Prediction using Generalized Additive Neural Network. SATNAC 4.
Deloitte. 2011. The changing face of prepaid. UK: Deloitte Development LCC.
Dicarlo, David. 2012. Random Number Generation: Types and Techniques. Honors, Virginia, Liberty University.
El-Habi. Abdalla 2014. “Evaluation of Data Mining Classification Models.” IUG Journal of Natural and Engineering Studies 22(1):1-16.
Esomar. 2014. Global Market research 2014. Esomar World research.
Gartner. 2011. Measuring Business Value of Data. Gartner, Inc.
Gsma, I. 2016. The Mobile Economy 2015 Report. London: GSM Association.
Hojsgaard, Soren. 2016. Graphs in the gRbase package. CRAN.
Horny, Michal. 2014. Bayesian network. Boston: Boston University School of Public health.
Molapo, Motshedisi .E., Geoffrey Mukwada. 2011. “The Impact of Customer Retention Strategies in the South African Cellular Industry: The Case of the Eastern Free State.“ International Journal of Business, Humanities and Technology 1(2), September: 52-60.
Moore, David. 2013. The Basic Practice of Statistics. Accessed 09/11/2014. https://pdfs.semanticscholar.org/84df/48f2e9808ea7a978fb8a8a426c392d8a02b7.pdf
Nadim, Mohammed., Bonolo, M., Hlelo, G., Matthew, W. 2012. SA Mobile Telecoms – Price war? Illovo, South Africa: First Avenue Investment Management.
Przytula, Krzysztof W., Et al. 2012. System and Method for Predicting Political Instability Using Bayesian Networks. Raytheon Company, Waltham, MA (U S) (Raytheon Company, W., Ma (U S) 13/159, 759).
Rajaraman, Anand. 2014. Mining of Massive Data. Stanford: Standford University.
Scutari, Marco. 2016. Package ‘Bnlearn’. Cran.
Shaun, Crawford., Handy, G. 2014. Reimagining Customer Relationships. EY Global.

71
Olufemi & STRYDOm: Churn forecasting model for South African Pre-Paid Service Providers
Unicef. 2012. South African Mobile Generation. Digital Citizenship Safety (pp. 48). South Africa: UNICEF.
Venables, W.n. (2016). An Introduction to R. Unpublished manuscript.
Wamukeke, E.Nasambu. 2014. “Predicting Sales in E-commerce Using Bayesian Network Model.” IJCSI 11(6):1-9.
Yap, Ghim-Eng. 2008. “Explaining inferences in Bayesian networks.” Applied Intelligence 28(3):1-26.


![Customers Churn Prediction using Artificial Neural ... · devising of churn policy [16] is depicted in Fig. 2. Fig. 2. The Six Steps for Customer Churn Prediction. Churn prediction](https://static.fdocuments.in/doc/165x107/5e71a26fb4acff71e10cc1fe/customers-churn-prediction-using-artificial-neural-devising-of-churn-policy.jpg)