CHUKWUMA, UCHENNA VALENTINE … Uchenna...extracts of Euphorbia hirta to rats in group 3 to 6 and...
110
1 Digitally Signed by: Content manager’s Name DN : CN = Weabmaster’s name O= University of Nigeria, Nsukka OU = Innovation Centre Nwamarah Uche Faculty of Biological scicnces Department of Biochemistry EFFECTS OF ETHANOL EXTRACTS OF EUPHORBIA HIRTA HERB ON SOME OXIDATIVE AND BIOCHEMICAL PARAMETERS IN ALLOXAN-INDUCED DIABETIC RATS CHUKWUMA, UCHENNA VALENTINE (PG/M.Sc/08/48973)
Transcript of CHUKWUMA, UCHENNA VALENTINE … Uchenna...extracts of Euphorbia hirta to rats in group 3 to 6 and...
1
Digitally Signed by: Content manager’s Name
DN : CN = Weabmaster’s name
O= University of Nigeria, Nsukka
OU = Innovation Centre
Nwamarah Uche
Faculty of Biological scicnces
Department of Biochemistry
EFFECTS OF ETHANOL EXTRACTS OF EUPHORBIA HIRTA
HERB ON SOME OXIDATIVE AND BIOCHEMICAL
PARAMETERS IN ALLOXAN-INDUCED DIABETIC RATS
CHUKWUMA, UCHENNA VALENTINE
(PG/M.Sc/08/48973)
2
TITLE
EFFECTS OF ETHANOL EXTRACTS OF EUPHORBIA HIRTA HERB
ON SOME OXIDATIVE AND BIOCHEMICAL PARAMETERS IN
ALLOXAN-INDUCED DIABETIC RATS
A DISSERTATION SUBMITTED IN PARTIAL FULFILMENT OF THE
REQUIREMENTS FOR AWARD OF THE DEGREE OF MASTER OF
SCIENCE (M.Sc) IN MEDICAL BIOCHEMISTRY, UNIVERSITY OF
NIGERIA,
NSUKKA
BY
CHUKWUMA, UCHENNA VALENTINE
(PG/M.Sc/08/48973)
DEPARTMENT OF BIOCHEMISTRY
UNIVERSITY OF NIGERIA
NSUKKA
SUPERVISOR: DR. V. N. OGUGUA
APRIL, 2013
3
CERTIFICATION
CHUKWUMA, Uchenna Valentine, a postgraduate student with Registration Number
PG/M.Sc/08/48973 in the Department of Biochemistry has satisfactorily completed the
requirements for the research work for the degree of Master of Science (M.Sc) in Medical
Biochemistry. The work embodied in this report is original and has not been submitted in
part or full for any other diploma or degree of this or any other university.
DR V.N. OGUGUA PROF L.U.S. EZEANYIKA
(Supervisor) (Head of Department)
EXTERNAL EXAMINER

4
DEDICATION
My sincere dedication goes specially to God Almighty.
5
ACKNOWLEDGEMENTS
I am very grateful to God for the gift of life and good health throughout the course of this
work. I am also grateful to my parents who provided the funds for the work. Great thanks go to my
supervisor Dr. V.N. Ogugua for his guidance at every stage of the work. Finally, I wish to thank Dr.
Parker Elijah Joshua, (Medical/Pharmacological Biochemistry Unit, University of Nigeria, Nsukka), Dr.
Olive Obienu (Consultant Gastroenterologist, U.N.T.H, Ituku/Ozalla), Dr. Francis Ukekwe (Consultant
Histopathologist, U.N.T.H, Ituku/Ozalla), and Dr. M.C. Ugonabor (Consultant Chemical Pathologist,
U.N.T.H, Ituku/Ozalla) for their wonderful contributions to the success of the work.
6
ABSTRACT
Diabetes mellitus produces a lot of highly reactive oxygen species which have been attributed
to the aetiology and pathophysiology of the disease. In view of the adverse effects associated
with synthetic drugs and natural medicine being considered to be safer, cheaper and more
effective, traditional antidiabetic plants can be explored. The results of the experiment showed
that there were significant increases (P<0.05) in the concentrations of total cholesterol, low
density lipoprotein (LDL) and triacylglycerol (TAG) in group 2 rats (diabetic untreated)
compared with normal control rats (group 1). Administration of 300 mg/kg b.w. of ethanol
extracts of Euphorbia hirta to rats in group 3 to 6 and 0.01mg/kg b.w of voglibose to rats in
group 7 showed significant reduction (p<0.05) in total cholesterol, LDL and TAG
concentrations. On the other hand, there was significant decrease (p<0.05) in high density
density (HDL) concentrations in the group 2 (diabetic untreated) compared with group 1
(normal rats). However, administration of 300 mg/kg b.w of ethanol extracts of E. hirta to rats
in group 3 to 6 and 0.01 mg/kg b.w to rats in group 7 showed significant increase (p<0.05) in
HDL concentration. There was no significant increase (p>0.05) in sodium and bicarbonate ion
concentrations but significant increase (p<0.05) in potassium and chloride ion concentrations
in diabetic untreated rats (group 2) compared with rats in normal control group. There was
significant increase (p<0.05) in serum urea and creatinine concentrations in diabetics untreated
rats (group 2) compared with normal rats (group 1). Administration of 300 mg/kg b.w. of
ethanol extract of E. hirta to groups 3 to 6 and 0.01 mg/kg b.w. of voglibose to group 7
resulted in significant decrease (p<0.05) in serum urea and creatinine concentrations. There
was significant decrease (p<0.05) in serum catalase and superoxide dismutase activities and
vitamin C concentration with significant increase (p<0.05) in serum malondialdehyde
concentration in group 2 (diabetics untreated rats) compared with normal rats (group 1).
However, addition of 300 mg/kg b.w. of ethanol extract of E. hirta to Groups 3 to 6 and 0.01
mg/kg b.w. of voglibose to group 7 resulted in significant increase (p<0.05) in serum catalase
and superoxide dismutase activities and vitamin C concentration, with significant decrease
(p<0.05) in MDA concentration compared with the diabetic untreated rats (group 2). There was
significant increase (p<0.05) in blood glucose concentration in rats of group 2 to 7 before
administration of ethanol extracts of E. hirta and voglibose compared with normal rats (group
1). When 300 mg/kg b.w. of ethanol extract of E. hirta was administered to groups 3 to 6 and
0.01 mg/kg b.w. of voglibose to group 7, there was significant decrease (p<0.05) in blood
glucose concentration compared with diabetic untreated (group 2). The administration of 300
mg/kg b.w. of ethanol extract of E. hirta and 0.01 mg/kg b.w. of voglibose showed significant
increase (p<0.05) in the body weights of the rats in groups 4 to 7 compared with that of normal
control. No significant increase (p>0.05) in the body weights of rats in group 2 and 3 compared
with normal rats (group 1). When 300 mg/kg b.w. of ethanol extract of E. hirta and 0.01
mg/kg b.w. of voglibose were administered to rats in groups 3 to 7, there was significant
increase (p<0.05) in the body weights of the rats compared with diabetic untreated rats (group
2).
7
TABLE OF CONTENTS
PAGE
Title Page .. .. .. .. .. .. .. .. .. .. i
Certification .. .. .. .. .. .. .. .. .. .. ii
Dedication .. .. .. .. .. .. .. .. .. .. iii
Acknowledgements .. .. .. .. .. .. .. .. .. iv
Abstract .. .. .. .. .. .. .. .. .. .. v
Table of Contents .. .. .. .. .. .. .. .. .. vi
List of Figures .. .. .. .. .. .. .. .. .. .. xi
List of Tables .. .. .. .. .. .. .. .. .. .. xii
List of Plates .. .. .. .. .. .. .. .. .. xiii
List of Abbreviations .. .. .. .. .. .. .. .. .. xiv
CHAPTER ONE: INTRODUCTION
1.1 History of diabetes mellitus ... ... ... ... ... ... ... 1
1.2 Types of diabetes mellitus ... ... ... ... ... ... ... 3
1.2.1 Type 1 diabetes mellitus (insulin dependent diabetes mellitus) ... ... 3
1.2.1.1 Immune mediated type 1 diabetes mellitus ... ... ... ... ... 3
1.2.1.2 Idiopathic type 1 diabetes mellitus ... ... ... ... ... ... 3
1.2.2 Type 2 dibetes mellitus (Non-insulin dependent diabetes mellitus) ... ... 3
1.2.3 Gestational diabetes mellitus ... ... ... ... ... ... ... 3
1.2.4 Miscellanous types of diabetes mellitus ... ... ... ... ... 3
1.2.4.1 Pre-diabetes (Impaired glucose tolerance) ... ... ... ... ... 3
1.2.4.2 Genetic type ... ... ... ... ... ... ... ... ... 4
1.2.4.3 Secondary diabetes ... … … ... ... ... ... ... 4
1.3 Clinical features of diabetes mellitus ... ... ... ... ... 4
1.4 Diagnosis of diabetes mellitus … ... ... ... ... ... 4
1.5 Complications of diabetes mellitus … ... ... ... ... ... 5
1.5.1 Acute complications diabetes mellitus ... ... ... ... ... 5
1.5.2 Chronic complications of diabetes mellitus ... ... ... ... ... 5
8
1.5.2.1 Diabetes Macroangiopathy ... … ... ... ... ... ... 5
1.5.2.2 Diabetic microangiopathy … ... ... ... ... ... ... 6
1.5.2.3 Infections … … … … ... ... ... ... ... 6
1.6 Euphorbia hirta herb … … … ... ... ... ... ... 6
1.6.1 Medicinal application of Euphorbia hirta ... ... ... ... ... 7
1.7 Alpha glucosidase inhibitors … ... ... ... ... ... 7
1.7.1 Voglibose in the management of type 2 diabetes … … … … 7
1.8 Oxidative stress in diabetes … … … … … … … 7
1.8.1 Catalase … … … ... ... ... ... ... ... 8
1.8.2 Glutathione perosidase and glutathione reductase … ... ... ... 8
1.8.3 Lipid peroxidation … … … … … … … … 8
1.8.4 Superoxide dismutase … … … … … … … 9
1.8.5 Vitamins … … … … ... ... ... ... ... 9
1.9 Justification of the research … … … … … … … 10
1.10 Aim and objectives of the study ... ... ... ... ... … 10
1.10.1 Aim of the study … … … … … … … … 10
1.10.2 Specific objectives of the study … ... ... ... ... ... 10
CHAPTER TWO: MATERIALS AND METHODS
2.1 Materials … … … … … … … … … 11
2.1.1 Plant materials (Euphorbia hirta herbs) … … … … … 11
2.1.2 Animals … … … … … … … … … 11
2.1.3 Chemicals/Reagents/Samples … … … … … … 11
2.1.4 Instruments/Equipment … … … … … … … 11
2.2 Methods … … … … … … … … … 12
2.2.1 Experimental design … … … … … … … … 12
2.2.2 Composition of diet fed experimental rats … … … … … 12
2.2.3 Preparation of normal saline … … … … … … … 13
2.2.4 Extraction of Euphorbia hirta herbs … … … … … … 13
2.2.5 Induction of diabetes … … … … … … … … 13

9
2.2.6 Acute toxicity studies (LD50) … … … … … … … 13
2.2.7 Phytochemical analysis … … … … … … … 14
2.2.7.1 Test for carbohydrate (Molisch’s test) … … … … … 14
2.2.7.2 Test for alkaloids (General tests) … … … … … … 15
2.2.7.3 Test for glycosides (Fehling’s test) … … … … … 16
2.2.7.4 Test for saponins (Kokate, 2001) … … … … … 16
2.2.7.5 Test for tannins (Ferric chloride method) … … … … … 17
2.2.7.6 Test for flavonoids (Ammonium test method) … … … … 17
2.2.7.7 Test for resins (Precipitation test) … … … … … 17
2.2.7.8 Test for proteins (Millon’s test) … … … … … … 17
2.2.7.9 Test for oils … … … … … … … … 17
2.2.7.10 Test for steroids and terpenoids … … … … … … 18
2.2.8 Proximate analysis … … … … … … … 18
2.2.8.1 Crude protein … … … … … … … … 18
2.2.8.2 Crude fat … … … … … … … … … 20
2.2.8.3 Moisture … … … … … … … … 20
2.2.8.4 Ash/mineral matter … … … … … … … 21
2.2.8.5 Crude fibre … … … … … … … … 21
2.2.8.6 Carbohydrate or nitrogen free extract (NFE) … … … … 22
2.2.9 Determination of total cholesterol concentration … … … … 23
2.2.10 Low density lipoprotein-cholesterol concentration … … … 24
2.2.11 High density lipoproteins (HDL)–cholesterol concentration … … 25
2.2.12 Determination of triacylglycerol concentration … … … … 26
2.2.13 Assay of superoxide dismutase activity … … … … 27
10
2.2.14 Assay of catalase activity … … … … … … … 29
2.2.15 Determination of malondialdehyde concentration … … … 30
2.2.16 Determination of ascorbic acid concentration … … … … 31
2.2.17 Determination of sodium ion concentration … … … … 32
2.2.18 Determination of potassium ion concentration … … … … 33
2.2.19 Determination of chloride ion concentration … … … … 33
2.2.20 Determination of bicarbonate ion concentration … … … 34
2.2.21 Determination of serum urea concentration … … … … 34
2.2.22 Determination of serum creatinine concentration … … … … 36
2.2.23 Determination of fasting and random glucose concentration … … 37
2.2.24 Body weight … … … … … … … … 38
2.2.25 Histopathological examination … … … … … … 38
2.3 Statistical analysis … … … … … … … … 40
CHAPTER THREE: RESULTS
3.1 Phytochemical analysis … … … … … … … 41
3.2 Percentage proximate composition … … … … … … 42
3.3 Acute toxicity studies … … … … … … … 43
3.4 Effects of ethanol extracts of Euphorbia hirta on serum total cholesterol
concentration of normal and diabetic rats … … … … … 44
3.5 Effects of ethanol extracts of Euphorbia hirta on serum high density
lipoprotein concentration of normal and diabetic rats … … … 46
3.6 Effects of ethanol extracts of Euphorbia hirta on serum low density
11
lipoprotein concentration of normal and diabetic rats … … … 48
3.7 Effects of ethanol extracts of Euphorbia hirta on serum triacylglycerol
concentration of normal and diabetic rats … … … … … 50
3.8 Effects of ethanol extracts of Euphorbia hirta on serum sodium ion
concentration of normal and diabetic rats … … … … … 52
3.9 Effects of ethanol extracts of Euphorbia hirta on serum potassium ion
concentration of normal and diabetic rats … … … … … 54
3.10 Effects of ethanol extracts of Euphorbia hirta on serum chloride ion
concentration of normal and diabetic rats … … … … … 56
3.11 Effects of ethanol extracts of Euphorbia hirta on serum bicarbonate ion
concentration of normal and diabetic rats … … … … … 58
3.12 Effects of ethanol extracts of Euphorbia hirta on serum urea
concentration of normal and diabetic rats … … … … … 60
3.13 Effects of ethanol extracts of Euphorbia hirta on serum creatinine
concentration of normal and diabetic rats … … … … … 62
3.14 Effects of ethanol extracts of Euphorbia hirta on serum catalase
activity of normal and diabetic rats … … … … … … 64
3.15 Effects of ethanol extracts of Euphorbia hirta on serum superoxide
dismutase activity of normal and diabetic rats … … … … 66
3.16 Effects of ethanol extracts of Euphorbia hirta on malondialdehyde
concentration of normal and diabetic rats … … … … … 68
3.17 Effects of ethanol extracts of Euphorbia hirta on vitamin C
concentration of normal and diabetic rats … … … … … 70
12
3.18 Effects of ethanol extracts of Euphorbia hirta on body glucose concentration
of normal and diabetic rats before and after the experiment … … … 72
3.19 Effects of ethanol extracts of Euphorbia hirta on body weights of normal
and diabetic rats before and after the experiment … … … … 74
3.20 Histopathological examination … … … … … … 76
CHAPTER FOUR: DISCUSSION
4.1 Discussion … … … … … … … … … 84
4.2 Conclusion … … … … … … … … … 89
4.3 Recommendations … … … … … … … 89
REFERENCES … … … … … … … … … 90
APPENDICES … … … … … … … … … 97
13
LIST OF FIGURES
PAGE
Fig. 1 Euphorbia hirta plant … … … … … … … … 6
Fig. 2 Effects of ethanol extracts of Euphorbia hirta on serum total cholesterol
concentration of normal and diabetic rats … … … … … 45
Fig. 3 Effects of ethanol extracts of Euphorbia hirta on serum high density
lipoprotein concentration of normal and diabetic rats … … … 47
Fig. 4 Effects of ethanol extracts of Euphorbia hirta on serum low density
lipoprotein concentration of normal and diabetic rats … … … 49
Fig. 5 Effects of ethanol extracts of Euphorbia hirta on serum triacylglycerol
concentration of normal and diabetic rats … … … … … 51
Fig. 6 Effects of ethanol extracts of Euphorbia hirta on serum sodium ion
concentration of normal and diabetic rats … … … … … 53
Fig. 7 Effects of ethanol extracts of Euphorbia hirta on serum potassium ion
concentration of normal and diabetic rats … … … … … 55
Fig. 8 Effects of ethanol extracts of Euphorbia hirta on serum chloride ion
concentration of normal and diabetic rats … … … … … 57
Fig. 9 Effects of ethanol extracts of Euphorbia hirta on serum bicarbonate ion
concentration of normal and diabetic rats … … … … … 59
14
Fig. 10 Effects of ethanol extracts of Euphorbia hirta on serum urea
concentration of normal and diabetic rats … … … … … 61
Fig. 11 Effects of ethanol extracts of Euphorbia hirta on serum creatinine
concentration of normal and diabetic rats … … … … … 63
Fig. 12 Effects of ethanol extracts of Euphorbia hirta on serum catalase
activity of normal and diabetic rats … … … … … … 65
Fig. 13 Effects of ethanol extracts of Euphorbia hirta on serum superoxide
dismutase activity of normal and diabetic rats … … … … 67
Fig. 14 Effects of ethanol extracts of Euphorbia hirta on serum malondialdehyde
concentration of normal and diabetic rats … … … … … 69
Fig. 15 Effects of ethanol extracts of Euphorbia hirta on vitamin C
concentration of normal and diabetic rats … … … … … 71
Fig. 16 Effects of ethanol extracts of Euphorbia hirta on body glucose concentration
of normal and diabetic rats before and after the experiment … … … 73
Fig. 17 Effects of ethanol extracts of Euphorbia hirta on body weights of normal
and diabetic rats before and after the experiment … … … … 75
LIST OF TABLES
Table 1: World health organisation diabetes criteria … … … … 5
Group 1 = Normal Control Group 2 = Diabetic Untreated
Group 3 = 300mg/kg b.w. of flower Euphorbia hirta Group 4 = 300mg/kg b.w. of leaf Euphorbia hirta
Group 5 = 300mg/kg b.w. of stem Euphorbia hirta Group 6 = 300mg/kg b.w. of flower+leaf+stem extract
Group 7 = Standard drug (0.01mg/kg b.w. of Voglibose)
Group 1 = Normal Control Group 2 = Diabetic Untreated
Group 3 = 300mg/kg b.w. of flower Euphorbia hirta Group 4 = 300mg/kg b.w. of leaf Euphorbia hirta
Group 5 = 300mg/kg b.w. of stem Euphorbia hirta Group 6 = 300mg/kg b.w. of flower+leaf+stem extract
Group 1 = Normal Control Group 2 = Diabetic Untreated
Group 3 = 300mg/kg b.w. of flower Euphorbia hirta Group 4 = 300mg/kg b.w. of leaf Euphorbia hirta
15
Table 2: Procedure for malondialdehyde concentration determination … … 31
Table 3: Qualitative phytochemical analysis of ethanol extracts of Euphorbia hirta 41
Table 4: Percentage proximate composition of ethanol extracts of Euphorbia hirta 42
16
LIST OF PLATES
Page
Plate 1: Photomicrograph of pancreas of normal control rats (group 1)
showing an unremarkable islet of langerhans surrounded by
normal acini of exocrine pancreas tissue (EP) … … … … 77
Plate 2: Photomicrograph of pancreas of group 2 rats (diabetic untreated)
showing moderate to severe lymphocytic infiltration of islet of langerhans … 77
Plate 3: Photomicrograph of pancreas of group 3 diabetic rats treated
with 300 mg/kg b.w. of the flower extract showing mild to moderate
lymphocytic infiltration of islet of langerhans … … … … 78
Plate 4: Photomicrograph of pancreas of group 4 diabetic rats treated
with 300 mg/kg b.w. of the leaf extract showing mild lymphocytic
infiltration of islet of langerhans … … … … … … 80
Plate 5: Photomicrograph of pancreas of group 5 diabetic rats treated
with 300 mg/kg b.w. of the stem extract showing mild lymphocytic
infiltration (LI) of islet of langerhans … … … … … … 81
Plate 6: Photomicrograph of pancreas of group 6 diabetic rats treated
with 300 mg/kg b.w. of the flower, leaf and stem extract showing scanty
lymphocytic infiltration (LI) of islet of langerhans … … … … 82
Plate 7: Photomicrograph of pancreas of group 7 rats (0.01 mg/kg b.w. of
standard drug, voglibrose showing scanty lymphocytic infiltration

17
of an enlarged islet of langerhans … … … … … 83
18
LIST OF ABBREVIATIONS
CAT Catalase
CHOL Cholesterol
Cl– Chloride Ion
HDL High density lipoprotein
K+ Potassium ion
LDL Low density Lipoprotein
MDA Malondialdehyde
Na+ Sodium ion
NFE Nitrogen free extract
SOD Superoxide dismutase
TAG Triacylglycerol
VLDL Very low density lipoprotein
19
CHAPTER ONE
INTRODUCTION
Euphorbia hirta herb is traditionally used to treat asthma, respiratory tract infections
and cough (Ogbulie et al., 2007) but has been recently reported to have antidiabetic effect
which may be related to its antioxidant capacity and its alpha glucosidase inhibitory properties
(Widharna et al., 2010). Some established alpha glucosidase inhibitors within the intestinal
brush border, attenuates post-prandial blood glucose peaks (Balfour and Tavish, 1993).
Diabetes mellitus produces a lot of highly reactive oxygen species which have been attributed
to the aetiology and pathophysiology of the disease. Antioxidant enzymes such as catalase,
glutathione peroxidase and superoxide dismutase help to neutralize harmful free radicals
(Nelson and Cox, 2005). In view of the adverse effects associated with synthetic drugs and
natural medicine being considered to be safer, cheaper and more effective, traditional
antidiabetic plants can be explored (Kamboj, 2000).
1.1 HISTORY OF DIABETES MELLITUS
The term diabetes was coined by Aretaeus of Cappodocia susbruta (6th
Century B.C)
identified diabetes and classified it as med humelia and identified it with obesity sendentary
life; hence, advising exercise to cure (Dwired et al., 2007). Medieral Persia Aricenna (980-
1037) provided a detailed account on diabetes in the canon of medicine, describing the
abnormal appetite and the collapse of sexual function. He also recognised a primary and
secondary diabetes, and described diabetes gangrene. He treated diabetes using a mixture of
lupine trigonella (Fenugreek) and zedoary seed which produced a reduction in excretion of
sugar. He described diabetes insupidus very precisely for the first time but Johann Peter Frank
(1745-1821) differenciated between diabetes mellitus and diabetes insupidus (Nabipour, 2003).
Diabetes was first recorded in English in the form diabete, in a medical text written
around 1425. In 1675, Thomas Willis added two words mellitus from the Latin origin meaning
“honey”, a reference to the sweet taste of the urine. Matthew Dabson confirmed that the sweet
taste was because of an excess of a kind of sugar in the urine and of people with diabetes
(Dobson, 1776). Aretaeus did attempt to treat it but could not give a good prognosis; He
commented on life (with diabetes) is short and disgusting (Medvei, 1993).
The discovery of a role for the pancreas in diabetes was described by Joseph Von
Mering and Oskar Minkowski, who in 1889 found that dogs whose pancreas was removed,
developed all the signs and symptoms of diabetes and died shortly after wards (Von Mering
20
and Minkowski, 1890). In 1910, Sir Edwin Albert sharpey-Schafer suggested that people with
diabetes were deficient in a single chemical that is normally produced by the pancreas. He
proposed calling this substance insulin, from the Latin insula meaning island, but the endocrine
role of insulin was not clarified until 1921 when Sir Fredrick Grant Banting and Charles
Herbert Best repeated the work of Von Mering and Minkowski and demonstrated they could
reverse induced diabetes in dogs by giving them extracts from the pancreatic islets of
Langerhans of healthy dogs (Bating et al., 1991).
In 1869, Paul Langerhans, a medical student of Berlin, was studying the structure of the
pancreas under microscope when he identified some previously unnoticed tissue climps
scattered throughout the bulk of the pancreas and were known as islets of Langerhans. In 1901,
another major step was taken by Eugene Opie when he clearly established the link between the
islet of Langerhans and diabetes. The distinction between what is now known as type 1
diabetes and type 2 diabetes was first clearly made by Sir Harold Perciral (Harry) Hims Worth
and in January, 1936 (Himsworth, 1936).
Bating and Best purified the hormone insulin from Biovin pancreas at the University of
Toronto (Bating et al., 1991) and in plants such as Safflower. The first synthetic insulin was
produced simultaneously in the labs of Panaroitis Katsovannis at the University of Pittsburgh
and Helmut, Zahn at RWTH, Aachen University in the early 1960. The first genetically
engineered synthetic human insulin was produced in a Laboratory in 1977 by Herbert Boyer
using E. coli, and in 1980, a U.S. biotech company Genentech, founded by Boyer and Eli Lily
developed human insulin under the brand name Humulin. The insulin was isolated from
genetically altered bacterial which produced large quantities of insulin.
Other land mark discoveries include:
• Identification of the first of the sulfonylureas in 1942 by Marcel Janbon and co-workers
(Janbon et al., 1942) and it induced hypoglycaemia in animals (Patlak, 2002).
• Determination of the amino acid sequence of insulin by Sir Fredick Sanger
• The radioimmuno assay for insulin as discovered by Rosaly Jallow and Solomon
Berson, gaining Jallow a Nobel Prize in Physiology or Medicine in 1977.
• Dr. Gerald Reaven identified the constellation of symptoms now called metabolic
syndrome in 1988.
1.2 Types of Diabetes Mellitus
21
There are four main types of diabetes mellitus: Type 1 diabetes, Type 2 diabetes,
gestational diabetes and miscellanous types of diabetes.
1.2.1 Type 1 diabetes mellitus (insulin dependent diabetes mellitus)
Type 1 diabetes is characterised by loss of the insulin-producing beta cells of the islets
of the langerhans in the pancreas leading to insulin deficiency apparently mediated by white
cell production of active oxygen species (Oberley, 1988). This type of diabetes can be further
classified as:
1.2.1.1 Immune-mediated type 1 diabetes mellitus
This type of diabetes mellitus accounts for majority of type 1 diabetes where the beta
cell loss is a T-cell mediated autoimmune attack (Rother, 2007).
1.2.1.2 Idiopathic type 1 diabetes mellitus
In this type of diabetes mellitus, no aetiology has been clearly implicated.
1.2.2 Type 2 diabetes mellitus (Non-insulin dependent diabetes mellitus)
This type of diabetes mellitus result from insulin resistance, a condition in which cells
fail to use insulin properly, sometimes combined with an absolute insulin deficiency. There is a
strong inheritable genetic connection in type 2 daibetes.
1.2.3 Gestational diabetes mellitus
This type of diabetes mellitus occurs when pregnant women, who have never had
diabetes before have high blood glucose level during pregnancy. Even though it may be
transient, untreatable gestational diabetes can damage the health of the foetus or mother. Risks
to the baby includes: Macrosomia (high birth weight), congenital cardiac anomalies, central
nervous system anomalies and skeletal muscle malformation. Infact, the rate of diabetes in
expectant mothers has more than doubled in the past 6 years (Lawrence et al., 2008).
1.2.4 Miscellaneous types of diabetes mellitus
1.2.4.1 Pre-diabetes (Impaired glucose tolerance)
This is a condition that occurs when a person’s blood glucose levels are higher than
normal, but not high enough for a diagnosis of type 2 diabetes. Many people destined to
develop type 2 diabetes spend many years in a state of pre-diabetes and have risks of
22
cardiovascular complications (ADA, 2002) which have been termed “America’s largest health
care epidemics (Jellinger, 2009).
1.2.4.2 Genetic Type
Genetic mutations (autosomal and mitochondrial) can lead to defects in beta cell
function. Abnormal insulin action may also have been genetically determined in some cases
(Tominaga, 1999).
1.2.4.3 Secondary diabetes
Any disease that causes extensive damage to the pancreas may lead to diabetes. Such
examples include chronic pancreatitis, cystic fibrosis, acromegaly, haemochromatosis,
Cushing’s syndrome (Iwasaki et al., 2008), thyrotoxicosis, aging (Jack et al., 2004), high fat
diet (Lovejoy, 2002) and less active life (Hu, 2003). Obesity has been found to contribute to
approximately 55% of cases of type 2 diabetes (CDC, 2004) and decreasing consumption of
saturated fats and transfatty acids, while replacing them with unsaturated fats, may decrease
risks (Riserus et al., 2009).
1.3 Clinical features of diabetes mellitus
The classical symptoms of diabetes mellitus include: Polyuria (frequency urination),
polydipsia (increased thirst), polyphagia (frequent hunger), fatigue and weight loss (Cooke,
2008). Other important features include: collapse of sexual function (Nabipour, 2003), blurring
of vision and skin rashes collectively known as diabetes dermadromes and develop in 30 to
70% of diabetic patients (Izaki, 2000).
1.4 Diagnosis of Diabetes Mellitus
Diabetes is characterized by recurrent or persistent hyperglycemia and is diagnosed by
demonstrating any one of the following: (WHO, 1999).
• Fasting plasma glucose level ≥ 7.0mmol/L (126 mg/dL)
• Plasma glucose ≥ 11.1mmol/L (200 mg/dL) 2 hours after a 75g oral glucose load as in a
glucose tolerance test.
• Symptoms of hyperglycemia and casual plasma glucose ≥ 11.1mmol/L (200 mg/dL).
• Glycerated haemoglobin (HbAIC ≥ 6.5%).
Also, 2006 WHO diabetes criteria
Table 1: World Health Organisation diabetes criteria
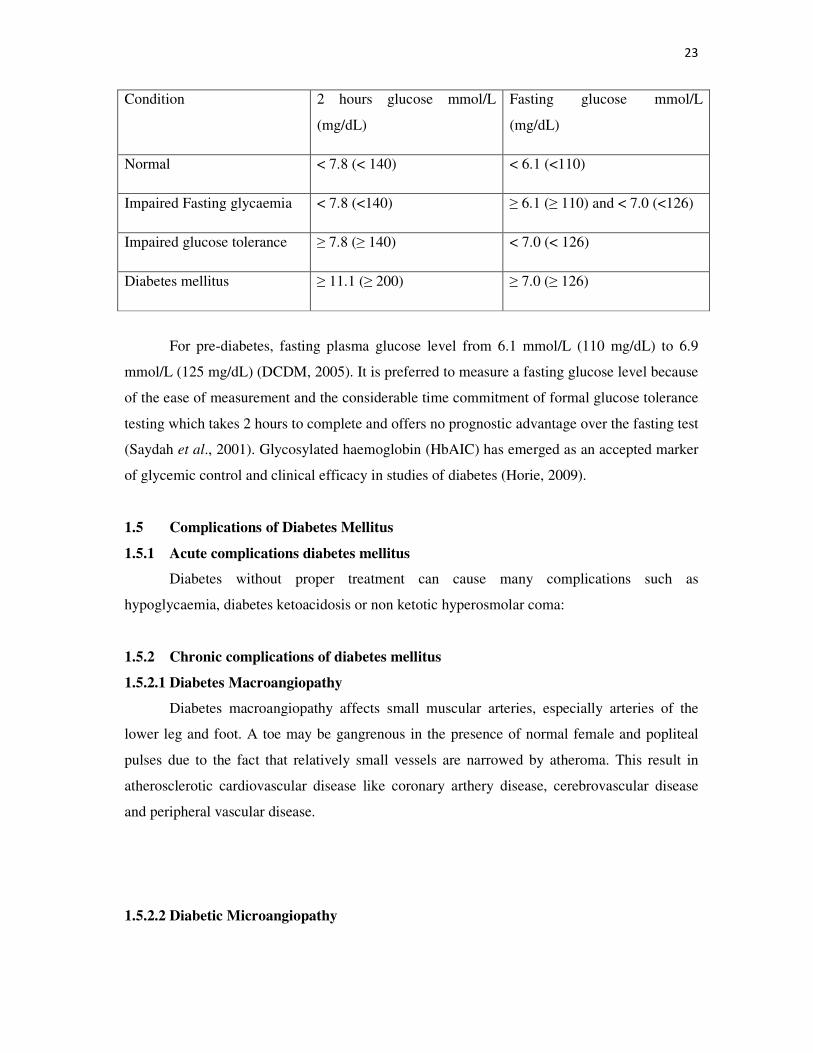
23
Condition 2 hours glucose mmol/L
(mg/dL)
Fasting glucose mmol/L
(mg/dL)
Normal < 7.8 (< 140) < 6.1 (<110)
Impaired Fasting glycaemia < 7.8 (<140) ≥ 6.1 (≥ 110) and < 7.0 (<126)
Impaired glucose tolerance ≥ 7.8 (≥ 140) < 7.0 (< 126)
Diabetes mellitus ≥ 11.1 (≥ 200) ≥ 7.0 (≥ 126)
For pre-diabetes, fasting plasma glucose level from 6.1 mmol/L (110 mg/dL) to 6.9
mmol/L (125 mg/dL) (DCDM, 2005). It is preferred to measure a fasting glucose level because
of the ease of measurement and the considerable time commitment of formal glucose tolerance
testing which takes 2 hours to complete and offers no prognostic advantage over the fasting test
(Saydah et al., 2001). Glycosylated haemoglobin (HbAIC) has emerged as an accepted marker
of glycemic control and clinical efficacy in studies of diabetes (Horie, 2009).
1.5 Complications of Diabetes Mellitus
1.5.1 Acute complications diabetes mellitus
Diabetes without proper treatment can cause many complications such as
hypoglycaemia, diabetes ketoacidosis or non ketotic hyperosmolar coma:
1.5.2 Chronic complications of diabetes mellitus
1.5.2.1 Diabetes Macroangiopathy
Diabetes macroangiopathy affects small muscular arteries, especially arteries of the
lower leg and foot. A toe may be gangrenous in the presence of normal female and popliteal
pulses due to the fact that relatively small vessels are narrowed by atheroma. This result in
atherosclerotic cardiovascular disease like coronary arthery disease, cerebrovascular disease
and peripheral vascular disease.
1.5.2.2 Diabetic Microangiopathy
24
Diabetes microangiopathy affects large arteries and affects diabetes of all types,
appears to be related to the duration of the diseas and is properly aggravated by poor diabetic
control. It is responsible for diabetic retinopathy, neuropathy and nephropathy (MacSween and
Whaley, 1992), coronary heart disease and hypertension (Adler et al., 2000).
1.5.2.3 Infections
There is an increased susceptibility of bacterial and fungal infections. Boils, carbuncles
and urinary tract infections sometimes complicated by pylonephritis and renal papillary
necrosis are of frequent occurrence and may precipitate diabetic coma.
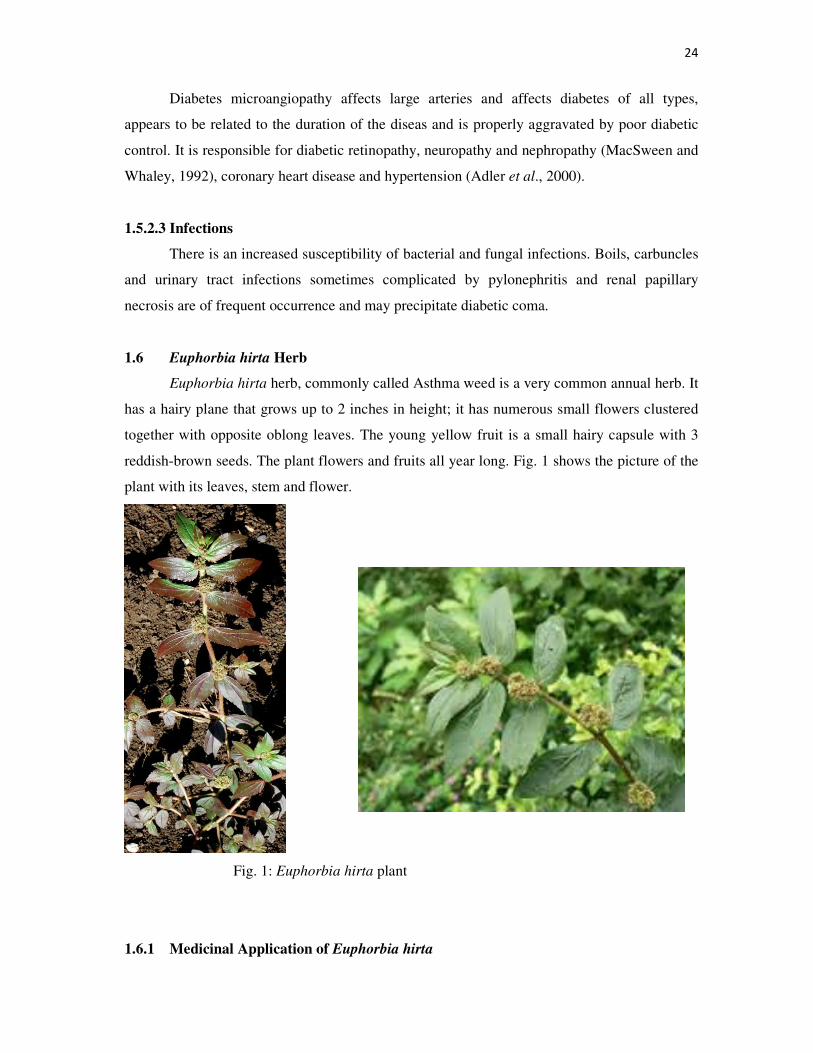
1.6 Euphorbia hirta Herb
Euphorbia hirta herb, commonly called Asthma weed is a very common annual herb. It
has a hairy plane that grows up to 2 inches in height; it has numerous small flowers clustered
together with opposite oblong leaves. The young yellow fruit is a small hairy capsule with 3
reddish-brown seeds. The plant flowers and fruits all year long. Fig. 1 shows the picture of the
plant with its leaves, stem and flower.
Fig. 1: Euphorbia hirta plant
1.6.1 Medicinal Application of Euphorbia hirta
25
Euphorbia hirta herb is traditionally used to treat asthma, bronchitis, worm infestation,
conjunctivitis and dysentery (Ogbulie et al., 2007) but has been recently reported to have
antidiabetic effect which may be related to its antioxidant capacity and its alpha glucosidase
inhibitory properties (Widharna et al., 2010).
1.7 Alpha Glucosidase Inhibitors
Alpha glucosidase inhibitors act by delaying the absorption of complex carbohydrates
and disaccharides to absorbable monosaccharide from the small intestine. They lower post
prandial blood glucose and insulin levels by reversibly inhibiting glucosidases in intestinal
brush (Balfour and Tavish, 1993). This process leads to a reduction of glucose absorption and
subsequent reduction in postprandial hyperglycemia (Van de Larr, 2005).
1.7.1 Voglibose in the Management of Type 2 Diabetes
Voglibose is an alpha glucosidase inhibitor and is an ideal agent for the management of
type 2 diabetes due to its direct hypoglycaemic effect through decreased absorption and
hypolipidemic effect via improved insulin sensitity (Shinozaki, 1996).
Voglibose reduces cartid in time media thickness with decrease in HbAiC hence
reducing the incidence of chronic vascular complications in diabetic patients (Yibchok-anun,
2009). A study conducted by Satoh and co-workers on 30 type 2 diabetic patients suggested
that voglibose reduces oxidative stress generated and soluble intercellular adhesion molecule in
obese type 2 diabetic patients (Satoh, 2006).
1.8 Oxidative Stress in Diabetes
Increasing evidence in both experimental and clinical studies suggest that increased
oxidative stress is a widely accepted participant in the development and progression of diabetes
and its complications (Baynes, 1991). Diabetes is usually accompanied by increased
production of free radicals (Chang et al., 1993), or impaired antioxidant defenses (Mc Lennan
et al., 1991).
Common antioxidants includes the vitamin A, C and E and the enzymes superoxide,
dismutase, catalase, glutathione peroxidase and glutathione reductase (Maritin et al., 2003).
Other antioxidants include α-lipoic acid, mixed carotenoids, coenzyme Q10 (Brownlee, 2001).
Several bioflavonoids, antioxidants minerals (copper, zinc, manganese and selenium) and the
cofactors (folic acid, vitamin B1, B2, B6, B12). They work in synergy with each other and
against different types of radicals. Vitamin E suppresses the propagation of lipid peroxidation
26
(Hensley et al., 2000). Vitamin C, with vitamin E inhibits hydroperoxide formation. Metal
complexing agents, such as penicillamine bind transitional metals involve in some reactions in
lipid peroxidation and inhibit Fenton and Haber-weiss-type reactions (Laight et al., 2000);
vitamins A and E scavenge free radicals (Chow, 1991).
The involvement of oxidative stress in the pathology of diabetes from its associated
cardiovascular dysfunctions, nephropathy, retinopathy (leading to blindness) and embryopathy
or congenital malfunctions, suggests that potential management of diabetes could benefit from
use of dietary biofactors in medicinal and food plants (Okezie et al., 2007). The effects
of antioxidants on oxidative stress are measured through some observable biomarkers which
include:
1.8.1 Catalase
Catalase located in peroxisomes, decomposes hydrogen peroxide to water and oxygen
(Winterbourn, 1993). Catalase activity is consistently found to be elevated in the heart (Sanders
et al., 2001), Aorta (Kocak et al., 2000), as well as brain (Aragno et al., 1999) of diabetic rats.
1.8.2 Glutathione Peroxidase and Glutathione Reductase
Glutathione peroxidase and reductase are two enzymes that are found in the cytoplasm,
mitochindria and nucleus. Glutathione peroxidase metabolizes hydrogen peroxide to water by
using reduced glutathione as a hydrogen donor (Sies, 1993). Glutathione disulphide is recycled
back to glutathione reductase, using the co-factor NADPH generated by glucose-6-phosphate
dehydrogenase (Santini et al., 1997). Glutathione peroxidase activity is seen to be elevated in
liver (Rauscher et al., 2000), kidney (Rauscher et al., 2000), aorta (Kocak et al., 2000), blood
(Mohan and Das, 1998) and red blood cells (Sailaja and Suresh, 2000) whereas decreased
activity was seen in heart (Kaul et al., 1996) and retina (Obrosova et al., 2000).
1.8.3 Lipid peroxidation
Hydroperoxides have toxic effects on cells both directly and through degradation to
highly toxic hydroxyl radicals. They may also react with transitional metals like iron or copper
to form stable aldehydes such as malondialdehydes that will damage cell membranes. Peroxyl
radicals can remove hydrogen from lipids, producing hydroperoxides that further propagate the
free-radical pathway (Halliwell and Guttetidge, 1990).
Induction of diabetes in rats with streptozotocin (STZ) or alloxan uniformily result in
an increase in thiobarbituric acid reactive substances (TBARS) an indirect evidence of
intensified free-radical production. Increase in TBARS associated with diabetes is presented by
27
treatment with nicotinamide (Melo et al., 2000), aspirin (Caballero et al., 2000), sodium
nitroprusside (Mohan and Das, 1998), captoprin, enalapril (Kedziora-Kornatowska et al.,
2000), if this treatment is given before or immediately after the diabetogen (Mekinova et al.,
1995).
1.8.4 Superoxide Dismutase
Isoforms of SOD are variously located within the cells. CuZn-SOD is formed in both
the cytoplasm and the nucleus. Mn-SOD is confined in the mitochodria but can be released into
extracellular space (Reiter et al., 2000). SOD converts superoxide anion radical produced in
the body to hydrogen peroxide, thereby reducing the likelihood of superoxide anion interacting
with nitric oxide to form reactive peroxynitrite. Alternations of SOD activity in diabetic
animals are normalised by captopril (Kedziora-Kornatowska et al., 1998), lipoic acid
(Obrosova et al., 2000), all of which were administered prior to or concomitant with the
diabetogen. Treatment with vitamin C, vitamin E and β-carotene for eight weeks elevates
hepatic SOD activity in diabetic rats, which is normal without treatment (Mekinova et al.,
1995).
In the heart, which is an important target in diabetes and prone to diabetic
cardiomyopathy leading to chronic heart failure, SOD and glutathione peroxidase expression as
well as activities are decreased (Maritim et al., 2003), whereas catalase is increased in
experimental models of diabetes (Hayden and Tyagi, 2003).
1.8.5 Vitamins
Vitamins A, C and E are diet-derived and detoxify free radicals directly. They also
interact in recycling processes to generate reduced form of the vitamins. Α-tocopherol is
reconstituted when ascorbic acid recycles the tocopherol radical; dihydroascorbic acid which is
generated is recycled to glutathione. Vitamin E, a component of the total peroxyl radical-
trapping antioxidant system, reacts directly with peroxyl and superoxide radicals and singlet
oxygen and protect membranes from lipid peroxidation (Weber et al., 1997).
Treatment with vitamin C and E was shown to decrease urinary albumin excretion,
glomerular basement membrane thickness and kidney weight in STZ-induced diabetic rats
(Kedziora-Kornatowska et al., 2003).
1.9 Justification of the Research
Good herbal remedy for the treatment of diabetes mellitus is a welcomed development.
Most of the severe complications of diabetes are due to the hyperglycaemic effects and the
28
effects of free radicals produced as a result of the pathogenesis of diabetes mellitus. Hence, a
good herbal drug with antioxidant and alpha glucosidase inhibition actions could prevent
complications of diabetes.
1.10 AIM AND OBJECTIVES OF THE STUDY
1.10.1 Aim of the Study
This research is carried out to assess the effects of ethanol extracts of the leaves,
flowers and stems of Euphorbia hirta on the blood glucose levels, body weight, oxidative and
biochemical parameters in alloxan-induced diabetic rats.
1.10.2 Specific Objectives of the Study
This research work is therefore set out to achieve the following objectives:
1. To determine the effect of 300 mg/kg b.w. of the flower, leaf and stem ethanol extracts
of E. hirta on serum electrolyte concentrations, lipid and renal profiles in comparison
with 0.01 mg/kg b.w. of the standard drug, voglibose.
2. To determine the effect of 300 mg/kg of the flower, leaf and stem ethanol extracts of E.
hirta on the variation of the blood glucose and body weight rats compared with 0.01
mg/kg b.w of the standard drug, voglibose.
3. To determine the effect of the 300 mg/kg b.w. of the ethanol extracts on some oxidative
parameters of the rats compared with the 0.01 mg/kg b.w. of standard drug, voglibose.
29
CHAPTER TWO
MATERIALS AND METHODS
2.2 Materials
2.2.1 Plant materials (Euphorbia hirta Herbs)
Large quantities of the flowers, leaves and stems of Euphorbia hirta herb were
collected from the University of Nigeria, Nsukka environ and were identified by Mr. Ozioko of
the herbarium Botany Dept., U.N.N. The different parts of the Euphorbia hirta herb were air-
dried separately at room temperature, then into powdery form using electrical grinding
machine.
2.2.2 Animals
Adult male Wistar albino rats of between 10 and 16 weeks with weights of 160–200g were
obtained from the Animal House of the Faculty of Biological Sciences, University of Nigeria, Nsukka.
The animals were acclimatised for about 7 days under standard environmental conditions, with a 12
hour light/dark cycle maintained on a regular feed (vital feed) and water ad libitum.
2.2.3 Chemicals/reagents/samples
All chemicals used in this study were of the analytical grade and products of May and
Baker, England; BDH, England and Merck, Darmstadt, Germany. Reagents used for all the
assays were commercial kits and products of Randox, USA; QCA, Spain; Teco (TC), USA;
Biosystem Reagents and Instruments, Spain.
All other chemicals were obtained from the usual suppliers.
2.2.4 Instruments/Equipment
Rotary evaporation (Model Modulyo 4K, Edward, England), Water Bath (Gallenkamp,
England), Chemical Balance (Gallenkamp, England), Conical Flasks (Pyrex, England), Hotbox
(Gallenkamp, England), Centrifuge (3,500 rpm, PIC, England), Digital Photo Calorimeter (EI 312 Model,
Japan), Adjustable Micropipette (Perfect, U.S.A.), Refrigerator (Kelvinator, Germany), pH Meter (Pye,
Unicam 293, England), , multi-well microtiter plate reader (Tecan, Austria).
30
2.2 Methods
2.2.1 Experimental design
Forty (40) albino Wistar rats were acclimatized at the same conditions of temperature
and pressure, and the same animal feeds were used for all the rats. The rats were divided into
seven (7) groups as shown below:
Group 1 Normal Rats (Control)
Group 2 Diabetic Rats (Not treated)
Group 3 Diabetic Rats + 300 mg/kg b.w. of ethanol flower extract.
Group 4 Diabetic Rats + 300 mg/kg b.w. of ethanol leaf extract.
Group 5 Diabetic Rats + 300 mg/kg b.w. of ethanol stem extract.
Group 6 Diabetic Rats + 300 mg/kg b.w. of ethanol (flower + leaf + stem) extract.
Group 7 Diabetic Rats + 0.01 mg/kg b.w. of voglibose.
2.2.2 Composition of diet fed experimental rats
The proximate composition of the normal rat diet given to the animals in the control group
was as follows:
Crude protein - 14.5g %
Crude fat - 4.8g %
Crude fibre - 7.2g %
Crude ash - 8.0g %
Phosphorus - 0.62g %
Lysine - 0.6g %
Methionine - 0.29g %
Methionine + Cystine - 0.52g %
Calcium - 0.8g %
Vitamin E - 15mg/100g
Vitamin C - 50mg/100g
31
Manganese - 30mg/100g
Zinc - 30mg/100g
Sodium - 0.15g %
2.2.3 Preparation of normal saline
This was prepared by dissolving 0.89g of sodium chloride (NaCl) in 50ml of water and the
volume made up to 100ml of distilled water.
2.2.5 Extraction of Euphorbia hirta Herbs
Large quantities of the flowers, leaves and stems of Euphorbia hirta herb were
collected from the University of Nigeria, Nsukka environ and were identified by Mr. Ozioko of
the herbarium Botany Dept., U.N.N. The different parts of the Euphorbia hirta herb were air-
dried separately at room temperature, then into powdery form using electrical grinding
machine. The ground samples extracted with 95% ethanol solution, using cold maceration
techniques. The samples were filtered using Whatman filter paper. The filtrates concentrated to
solid matter using rotary evaporators, which then become the stock sample of the flowers
leaves, and stem ethanol extracts which were used for the analysis. These extracts were stored
in the refrigerator compartment.
2.2.5 Induction of Diabetes
Diabetes was induced in the rats by intraperitoneal injection of Alloxan in a dose of about
160mg/kg body weight in Normal Saline (Chougale et al., 2007) or 65mg/kg body weight of
intravenous injection of alloxan in Normal Saline (Gruppuso et al., 1990). The blood glucose
concentrations and body weights of the rats were measured on days 0, 5, 10, 15, 20, 25, 30 while the
rats were treated with the extracts and the standard drug (Voglibose) from day 15 and sacrificed on
the day 30. Their sera were used for oxidative and biochemical analyses.
2.2.6 Acute Toxicity Studies (LD50)
32
Acute toxicity studies (LD50) was measured using method of Lorke (1989). The animals were
divided into two groups, A and B, with each group subdivided into four groups made up of three
animals each.
Experimental Protocol for Acute Toxicity Studies
Phase I:
Group 1 : Mice were administered with 10mg/kg of body weight of the ethanol flowers,
leaves and stem extracts of Euphorbia hirta herb.
Group 2 : Mice were administered with 100mg/kg of body weight of the
ethanol flower, leaf and stem extracts of Euphorbia hirta herb..
Group 3 : Mice were administered with 1000 mg/kg of body weight of the ethanol
flower, leaf and stem extracts of Euphorbia hirta herb.
Group 4 : Mice were administered with 1000 mg/kg of body weight of distilled water.
Phase II
Group 1 : Mice were administered with 1900 mg/kg of body weight of the ethanol
flower, leaf and stem extracts of Euphorbia hirta herb.
Group 2 : Mice were administered with 2600 mg/kg of body weight of the ethanol
flower, leaf and stem extracts of Euphorbia hirta herb.
Group 3 : Mice were administered with 5000 mg/kg of body weight of the ethanol
flower, leaf and stem extracts of Euphorbia hirta herb.
Group 4 : Mice were administered with 5000 mg/kg of body weight of distilled water.
The mice were monitored closely for 24 hours for signs of toxicity and lethality
2.2.7 Phytochemical analysis
Preliminary Phytochemical analysis was carried out based on the procedures outlined by
Harborne (1973), and modified by Trease and Evans (1996). The following phytochemical tests were
carried out:
33
2.2.7.1 Test for carbohydrate (Molisch’s test)
To 2ml of the flowers, leaves and stems of Euphorbia hirta extract filtrate, 2 drops of alcoholic
solution of α-napthol were added, the mixture was thoroughly shaken and 1ml of concentrated
tetraoxosulphate (vi) acid was added slowly along the sides of the test tubes and allowed to stand. A
violet ring indicates the presence of carbohydrates.
2.2.7.2 Test for alkaloids (General tests)
A known weight, 50 mg of solvent free flowers, leaves and stems of Euphorbia hirta extract
was stored with 0.5ml of dilute hydrochloric acid and filtered. The filtrate was tested carefully with
various alkaloidal reagents as follows:
(a) Mayer’s test (potassium mercuric iodide solution): To 0.5ml of the flowers, leaves and
stems of Euphorbia hirta filtrate, a drop of Meyer’s reagent was added by the side of the
test tubes. A white or cream precipitate indicates the test as positive.
Meyer’s reagents:- Mercuric chloride (1.358g) was dissolved in 60 ml of water and
potassium iodide (5.0g) is dissolved in 10ml of water. The two solutions were mixed and made
up to 100ml with water.
(b) Dragendorff’s test (bismuth potassium iodide solution): To a few of the filtrate, 1ml of
Dragendorff’s reagent was added. A prominent yellow precipitate indicates the test as
positive.
Dragendorff’s reagents:-
Stock solution:- Bismuth carbonate (5.2g) and sodium iodide (4g) were boiled for 5
minutes with 50ml glacial acetic acid. After 12 hours, the precipitate, sodium acetate crystals
are filtered off using a sintered glass funnel. Clear, red-brown filtrate, 40ml is mixed with 160
ml of ethyl acetate and 1ml of water and stored in amber-coloured bottles.
Working solution:- A volume, 10ml, of the stock solution was mixed with 20 ml of acetic
acid and made up to 100ml with water.
34
(c) Wagner’s test (iodine in potassium iodide solution): To 0.5ml of the filtrate, 2 drops of
Wagner’s reagent were added by the side of the test tubes. A reddish-brown precipitate
indicates the test as positive.
Wagner’s reagent:- Iodine (1.27 g) and potassium iodide (2 g) was dissolved in 5 ml of
water and made up to 100ml with dissolved water
(d) Hagner’s test (A saturated solution of picric acid in cold water): To 0.5 ml of the filtrate, 1
ml of Hager’s reagent (saturated aqueous solution of picric acid) was added. A prominent
yellow and characterised crystalline precipitate indicates the test as positive.
The remaining filtrate was placed in 100 ml separating funnel and made alkaline with dilute
ammonia solution. The aqueous alkaline solution was separated and extracted with two 5 ml portions
of dilute sulphuric acid. The sample was tested with a few drops of Mayer’s, Wagner’s and
Dragendorff’s reagent.
2.2.7.3 Test for glycosides (Fehling’s test)
A quantity, 50mg, of the concentrated flowers, leaves and stems of Euphorbia hirta herb
extract was hydrolysed with concentrated hydrochloric acid for 2 hours on a water bath, filtered and
the hydrolysate was subjected to the following tests:
A. Borntrager’s Test (Evans and Trease, 1989):
To 2ml of filtered hydrolysate, 3ml of chloroform was added and shaken, chloroform
layer was separated and 10% ammonia solution was added to it. Pink colour indicates the
presence of glycosides.
B. Legal’s Test: A known weight, 50 mg, of the extract was dissolved in pyridine, sodium
nitroprusside solution was added and made alkaline using 10% sodium hydroxide. Presence of
glycosides is indicated by pink colour.
2.2.7.4 Test for saponins (Kokate, 2001)
35
A known weight, 50mg, of the concentrated flowers, leaves and stems of Euphorbia hirta
extract was diluted with distilled water and made up to 20 ml. The suspension is shaken in a
graduated cylinder for 15 minutes. A 2 cm layer of foam indicates the presence of saponins.
2.2.7.5 Test for tannins (Ferric chloride method)
Concentrated flowers, leaves and stems of Euphorbia hirta herb extract (1 g) was boiled with
50 ml of water, filtered and used for the ferric chloride test proper. To 3 ml of the filtrate, a few drops
of ferric chloride were added. Presence of cream gelatinous precipitate and a light green coloration
which changes shortly to black indicate a positive test.
2.2.7.6 Test for flavonoids (Ammonium test method)
Ethylacetate (10 ml) was added to 0.2g of the concentrated flowers, leaves and stems of
Euphorbia hirta extract sample and heated on a water bath for 3 minutes. The mixture was cooled,
filtered and the filtrate used for the ammonium test proper:
A volume, 4 ml, of the filtrate was shaken with 1 ml of dilute ammonia solution. The layers
were allowed to separate. A yellow solution with sodium hydroxide which turns colourless with dilute
hydrochloric acid confirms the presence of flavonoids.
2.2.7.7 Test for resins (Precipitation test)
The concentrated flowers, leaves and stems of Euphorbia hirta (0.2 g) was extracted with 15ml
of 95% ethanol. The alcoholic extract was then poured into 20 ml of distilled water in a beaker.
Precipitate formed at the bottom of the test tube indicates positive test.
2.2.7.8 Test for proteins (Millon’s test)
To 2ml of the filtrate, 2 drops of Millon’s reagent were added. A white precipitate
indicates the presence of proteins.
Millon’s Reagent: Mercury (1g) is dissolved in 9ml of fuming nitric acid. When the
reaction was completed, equal volume of distilled water was added.
36
2.2.7.9 Test for oils
The concentrated flowers, leaves and stems of Euphorbia hirta (0.1 g) material was pressed
between a filter paper and the paper was observed for translucency.
2.2.7.10 Test for steroids and terpenoids
Ethanol (9 ml) was added to 1g of the flowers, leaves and stems of Euphorbia hirta sample and
refluxed for a few minutes and filtered. The filtrate was concentrated down to 2.5 ml on a boiling
water bath and 5ml of hot water was added to it and mixed thoroughly. The mixture was allowed to
stand for 1 hour after which the waxy matter filtered off. The filtrate was shaken with 2.5 ml of
chloroform in a separating funnel. The lower layer was drawn out. To 0.5 ml of the chloroform extract
in a test tube was carefully added 1 ml of concentrated sulphuric acid to form a lower layer.
Another 0.5 ml of the chloroform extract was evaporated to dryness on a water bath and
heated with 3 ml of concentrated sulphuric acid for 10 minutes on a water bath. A reddish brown
interface indicates positive result for steroids while a grey coloration indicates a positive test for
terpenoids.
2.2.8 Proximate analysis
Percentage concentrations of protein, carbohydrate, crude fibre, moisture and ash in the
flowers, leaves and stems of Euphorbia hirta extracts were determined using the AOAC method
(1990).
2.2.8.1 Crude protein
Principle
The crude protein content was determined using the micro Kjeldahl method. The method is
generally used to determine nitrogen (N) in substances which contain N as ammonium salts, nitrates
or organic N compounds. Since it measures the total amount of N in a compound only a rough
indication of the total protein content can be obtained and was termed crude protein. The quantity of
N measured was then multiplied by 6.25 to obtain the protein content of the compound. The
multiplication factor can vary with some materials (AOAC, 1990).

37
The N of protein and other compounds were converted into ammonium sulphate by acid
digestion with boiling H2SO4.The acid digest was cooked, diluted with water and made strongly basic
with NaOH. Ammonium was released and distilled into a 4% boric acid solution. The amount of
ammonium borate formed was determined with standard H2SO4 or HCl.
The indicator used, bromocresol green, gave a pink colour end point at a hydrogen ion
concentration corresponding to a solution of NH4Cl. Boric acid is so weak that it has no appreciable
influence on the pH concentration. The reactions are represented as:
NH3 + HB03 NH4 + BO3-
H+ + B02 HB02 (AOAC, 1990)
The method involved three major steps:
(a) Digestion of the sample
(b) Distillation of the ammonia into a trapping solution.
(c) Quantification of the ammonia by titration.
(a) Digestion: A small quantity of samples of the flowers, leaves and stems of Euphorbia hirta
herb extracts (0.1 g) was weighed in a Kjeldhal flask containing 2.0g sodium sulphate/copper
sulphate as catalyst. Concentrated H2SO4 (20 ml) was introduced into the flask and the
contents gently heated. The heating was increased until the contents of the flask were
completely digested giving a clear solution.
(b) Distillation: The content of the flask was washed with 220 ml distilled water into a distillation
flask and cooled under ice blocks. To the flask, 100 ml of 4% boric acid first added; later, 3
drops of screened methyl red were also added.
(c) Back titration: After cooling, 40% NaOH (50 ml) was added and the distillate was titrated
against 0.5 N Na2SO4 solution.
The percentage nitrogen was calculated using the relationship
% Nitrogen = 100××××
SampleofWeight
MWNDfNT
Where
38
T = Titre volume
N = Normality of acid
Df = Dilution factor
MWN = Molecular weight of nitrogen
% Protein = % Nitrogen × 6.25
Where 6.25=conversion factor of nitrogen to protein
2.2.8.2 Crude fat
Principle
The sample was continuously extracted with ether. After extraction, the ether extract was
evaporated to dryness and the residue designated the ether extract. This is referred to as the fat
portion of the sample. Even though, the ether extract also contains organic acids, oils, pigments,
alcohols and fat-soluble vitamins and it is referred to as crude fat. Many of the complex lipids, such as
phospholipids are not completely extracted in this procedure (Ensimger and Olentine, 1978).
Method
A washed, dried and cooled quick-fit flask was weighed. Flowers, leaves and stems of
Euphorbia hirta extracts were weighed into the extraction thimble and placed in the quick-fit soxhlet
apparatus. The solvent flask containing 250 ml of diethyl ether was connected to a condenser. The set-
up was heated for 16hrs for complete extraction. The extract was evaporated at 70oC to remove any
remaining solvent present. The apparatus was reweighed and percentage fat calculated as follows:
% Crude Fat = 100×SampleofWeight
OilofWeight
2.2.8.3 Moisture
39
Method
Two grammes (2g) of freshly collected samples of flowers, leaves and stems of Euphorbia hirta
were weighed and dried in the oven at 110oC to a constant weight. The dishes and samples were
cooled and reweighed and percentage moisture content calculated using. The relationship is as
follows:
% Moisture = 1001
32 ×−
W
WW
Where
W1 = Weight of sample
W2 = Initial weight of sample and dish
W3 = Final weight of dry sample
2.2.8.4 Ash/Mineral matter
Principle
Ash is defined as the mineral matter of a feed or material since it includes for the most part
the inorganic or mineral components of the feed or material (Ensiminger and Olentine, 1978; Cullison,
1982). The sample was heated at 600oC to burn off all organic materials. The inorganic material which
did not volatilize at this temperature was designated ash.
Method
Into previously weighed porcelain dishes were put 2g samples of flowers, leaves and stems of
Euphorbia hirta extracts and reweighed. The crucible and samples were placed in a muffle furnace at
600oC for 3 hrs. The ashes and crucible were cooled in a desiccator and reweighed. The percentage
ash content was calculated using:
% Ash = 12
13
WW
WW
−
−
Where
W1 = Weight of crucible
40
W2 = Weight of crucible and sample
W3 = Weight of crucible and ash
2.2.8.5 Crude fibre
Principle
This fraction was designed to include those materials in food which were of low digestibility
namely cellulose, certain hemicelluloses and some of the lignin, if present. Some of the lignin,
however, may be included in the nitrogen free extract. A moisture – free, ether extract is digested first
with weak acid solution (1.25% H2SO4) and then with a weak base solution (1.25% NaOH). The organic
residue left after digestion is collected. The loss of weight on ignition was called crude fibre.
Method
Samples of the flowers, leaves and stems of Euphorbia hirta extracts (2 g) each was weighed
into 500 ml beakers containing pre-heated dilute H2S04 about (40 ml). The content was boiled for 30
mins and filtered. The residue was washed three times with hot water, then 150 ml of pre-heated KOH
and drops of antifoam agent (loctanol) were added to the sample in the beaker and heated to boiling.
The mixture was boiled slowly for more 30 mins, filtered and washed three times with hot water.
Acetone was then used in washing it three times in cold extraction unit and the content dried at 130oC
for an hour.
After ashing the content at 500oC, the ash was weighed and the percentage fibre calculated as
follows:
% Crude fibre = 100×SampleofWeight
FibreofWeight
2.2.8.6 Carbohydrate or Nitrogen Free Extract (NFE)
Principle
41
Proximate analysis of carbohydrate is also known as Nitrogen Free Extract (NFE)
determination. It includes mostly sugars and starches and also some of the more soluble
hemicelluloses and some of the more soluble lignin (Cullison, 1982). Since this fraction was designed
to include the more soluble carbohydrates, it is sometimes referred to as the carbohydrate portion of
the material being analysed.
Method
NFE was calculated by subtracting the sum of the other fractions from 100 as follows:
100 – (% moisture + % crude protein + % crude fat + crude fibre + % ash) = % NFE.
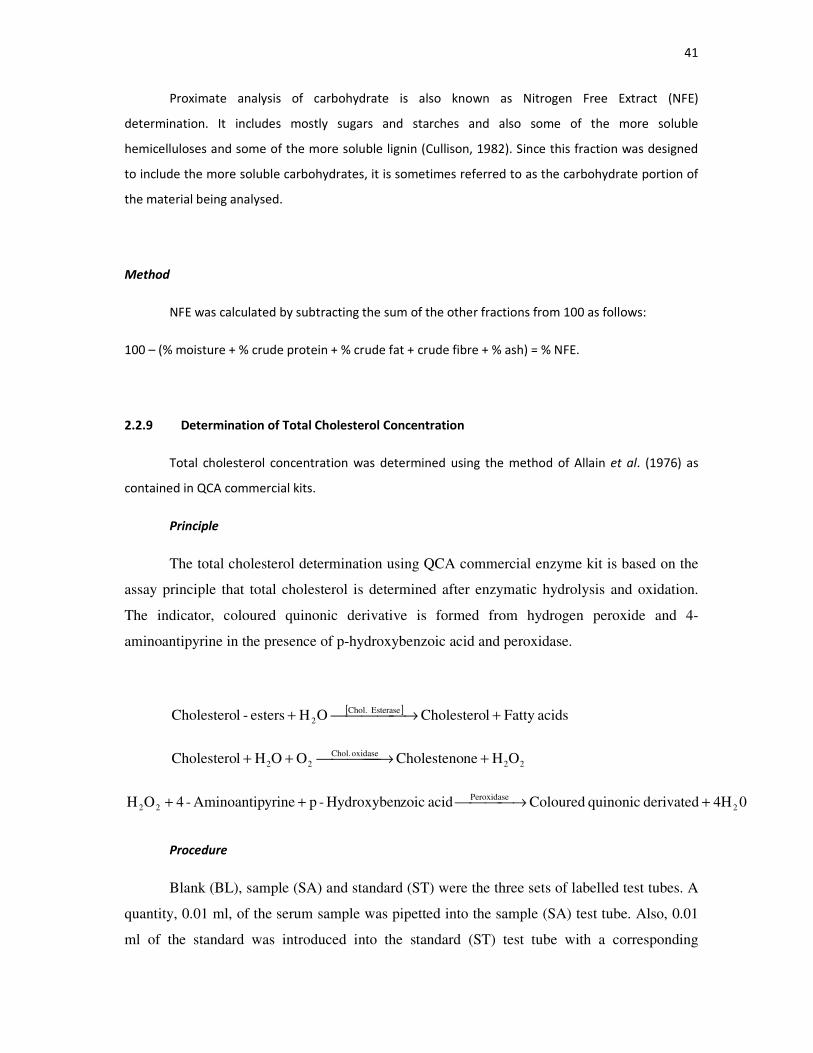
2.2.9 Determination of Total Cholesterol Concentration
Total cholesterol concentration was determined using the method of Allain et al. (1976) as
contained in QCA commercial kits.
Principle
The total cholesterol determination using QCA commercial enzyme kit is based on the
assay principle that total cholesterol is determined after enzymatic hydrolysis and oxidation.
The indicator, coloured quinonic derivative is formed from hydrogen peroxide and 4-
aminoantipyrine in the presence of p-hydroxybenzoic acid and peroxidase.
[ ]
acidsFatty lCholestero OH esters-lCholesteroEsterase Chol.
2 + →+
22
oxidase Chol.
22 OH neCholesteno O OH lCholestero + →++
04H derivated quinonic Coloured acid zoicHydroxyben-p yrineAminoantip-4 OH 2
Peroxidase
22 + →++
Procedure
Blank (BL), sample (SA) and standard (ST) were the three sets of labelled test tubes. A
quantity, 0.01 ml, of the serum sample was pipetted into the sample (SA) test tube. Also, 0.01
ml of the standard was introduced into the standard (ST) test tube with a corresponding
42
addition of 1 ml of working reagent into each of the test tubes. The solutions in the different
sets of test tubes were well mixed and allowed to stand for 5 minutes at 37oC (or 10 minutes at
room temperature). The absorbance was read at the wavelength of Hg 546 nm.
Calculations
The total cholesterol concentration in the sample was calculated using the following general
formula:
lcholestero totalof mg/dl 200 x O.D.ST
O.D.SA=
Where SA is Sample
ST is Standard
OD is Optical density
200 is a constant
SI Units = (mg/100 ml) × 0.0259 = mmol/L
2.2.10 Low Density Lipoprotein-Cholesterol Concentration
Low density lipoprotein – cholesterol concentration was determined using the method
of Assman et al. (1984) using QCA commercial kit.
Principle
Low density lipoprotein–cholesterol (LDL–cholesterol) can be determined as the
difference between total cholesterol and cholesterol content of the supernatant after
precipitation of the LDL fraction by polyvinyl sulphate (PVS) in the presence of
polyethyleneglycol monomethyl ether.
LDL-cholesterol = Total cholesterol – cholesterol in the supernatant
Reagents
Content Initial Concentration of Solutions
1. Precipitation Reagent:-
43
Polyvinyl sulphate 0.7 g/L
EDTA Na2 5.0 mM
Polyethyleneglycol monomethyl ether 170 g/L
Stabilizers
Procedure
(1) Precipitation reaction
The precipitation solution (3 drops or 0.1 ml) was carefully measured into test tubes labeled
accordingly. The serum sample (0.2 ml) was added to the labeled test tubes. The contents were
thoroughly mixed and left to stand for 15 minutes at room temperature (20–25oC). Then, the mixture
was centrifuged at 2,000 × g for 15 minutes and the cholesterol concentration in the supernatant was
determined.
(2) Cholesterol determination
The concentration of the serum total cholesterol was determined according to the QCA
CHOD–PAP method.
Calculations
The LDL–cholesterol concentration in the sample was calculated using the following general
formula:
LDL–cholesterol (mg/dl) = Total cholesterol (mg/dl) – 1.5 × supernatant cholesterol (mg/dl).
2.2.11 High Density Lipoproteins (HDL)–Cholesterol Concentration
High density lipoprotein–cholesterol concentration was determined using the method of
Albers (1978) as contained in QCA commercial kit.
Principle

44
Low density lipoprotein (LDL) and very low density lipoprotein (VLDL) are lipoproteins
precipitated from the serum by the action of a polysaccharide in the presence of divalent cations.
Then, high density lipoprotein–cholesterol (HDL–Cholesterol) present in the supernatant, is
determined.
acidFatty lCholestero OH esters-lCholesteroesterase chol.
2 + →+
22
oxidase chol.
22 OH neCholesteno OH O2
1 lCholestero + →++
04H neQuinoneimi DCFS yrineAminoantip-4 OH2 2
eperoxidase
22 + →++
Procedure
The procedure took two steps:
(A) Precipitation step
The serum sample (0.3 ml) was pipetted into labeled centrifuge tubes. Also, a drop of the
precipitant solution or reagent (10g/L of dextran sulphate, 1M of magnesium acetate and stabilizers)
was added to each of the centrifuge tubes.
(B) Colorimetric step
Then contents in the various tubes were thoroughly mixed and allowed to stand for 15
minutes at room temperature (20–25oC); then centrifuged at 2,000 × g for 15 minutes (or 10,000 × g
for 2 minutes). The concentration of cholesterol in the supernatant was determined.
Calculations
The HDL cholesterol concentration in the sample was calculated using the following general
formula:
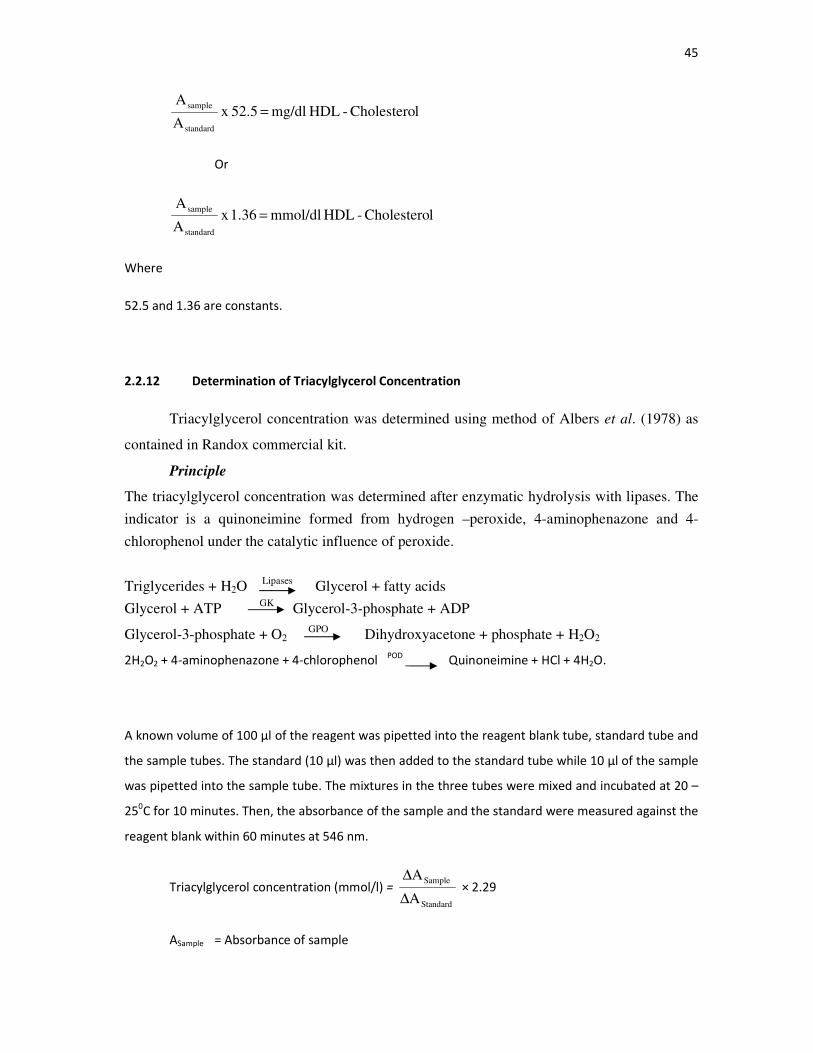
45
lCholestero - HDL mg/dl 52.5 x A
A
standard
sample=
Or
lCholestero - HDL mmol/dl 1.36 x A
A
standard
sample=
Where
52.5 and 1.36 are constants.
2.2.12 Determination of Triacylglycerol Concentration
Triacylglycerol concentration was determined using method of Albers et al. (1978) as
contained in Randox commercial kit.
Principle
The triacylglycerol concentration was determined after enzymatic hydrolysis with lipases. The
indicator is a quinoneimine formed from hydrogen –peroxide, 4-aminophenazone and 4-
chlorophenol under the catalytic influence of peroxide.
Triglycerides + H2O Lipases
Glycerol + fatty acids
Glycerol + ATP GK
Glycerol-3-phosphate + ADP
Glycerol-3-phosphate + O2 GPO
Dihydroxyacetone + phosphate + H2O2
2H2O2 + 4-aminophenazone + 4-chlorophenol POD
Quinoneimine + HCl + 4H2O.
A known volume of 100 µl of the reagent was pipetted into the reagent blank tube, standard tube and
the sample tubes. The standard (10 µl) was then added to the standard tube while 10 µl of the sample
was pipetted into the sample tube. The mixtures in the three tubes were mixed and incubated at 20 –
250C for 10 minutes. Then, the absorbance of the sample and the standard were measured against the
reagent blank within 60 minutes at 546 nm.
Triacylglycerol concentration (mmol/l) =
Standard
Sample
A
A
∆
∆ × 2.29
ASample = Absorbance of sample

46
AStandard= Absorbance of standard
2.2.13 Assay of Superoxide Dismutase Activity
Superoxide dismutase (SOD) activity was assayed using the method as described by
Fridorich (1989) as contained in Randox commercial kit.
Principle
The role of superoxide dismutase (SOD) is to accelerate the dismutation of the toxic
superoxide radical (O2·), produced during oxidative energy processes, to hydrogen peroxide and
molecular oxygen. This method employs xanthine and xanthine oxidase (XOD) to generate superoxide
radicals which react with 2–(4–iodophenyl)–3–(4–nitrophenyltetrazolium chloride (I.N.T.) to form a
red formazan dye. The superoxide dismutase activity is then measured by the degree of inhibition of
this reaction. One unit of SOD is that which causes a 50% inhibition of the rate of reduction of INT
under the conditions of the assay.
Xanthine Uric acid + O2·
I.N.T. Formazan dye
OR
O2· + O2
·+ 2H
+ O2 + H2O2
Reagent Composition
Contents Initial Concentration of Solutions
R1a Mixed Substrate
XOD
O2·
SOD
47
Xanthine
I.N.T.
0.05 mmol/l
0.025 mmol/l
R1b Buffer
CAPS
EDTA
40 mmol/l; pH 10.2
0.94 mmol/l
R2 Xanthine Oxidase 80 U/l
CAL Standard
Procedure
Wavelength 505 nm
Cuvette 1 cm path length
Temperature 37oC
Measurement Against air
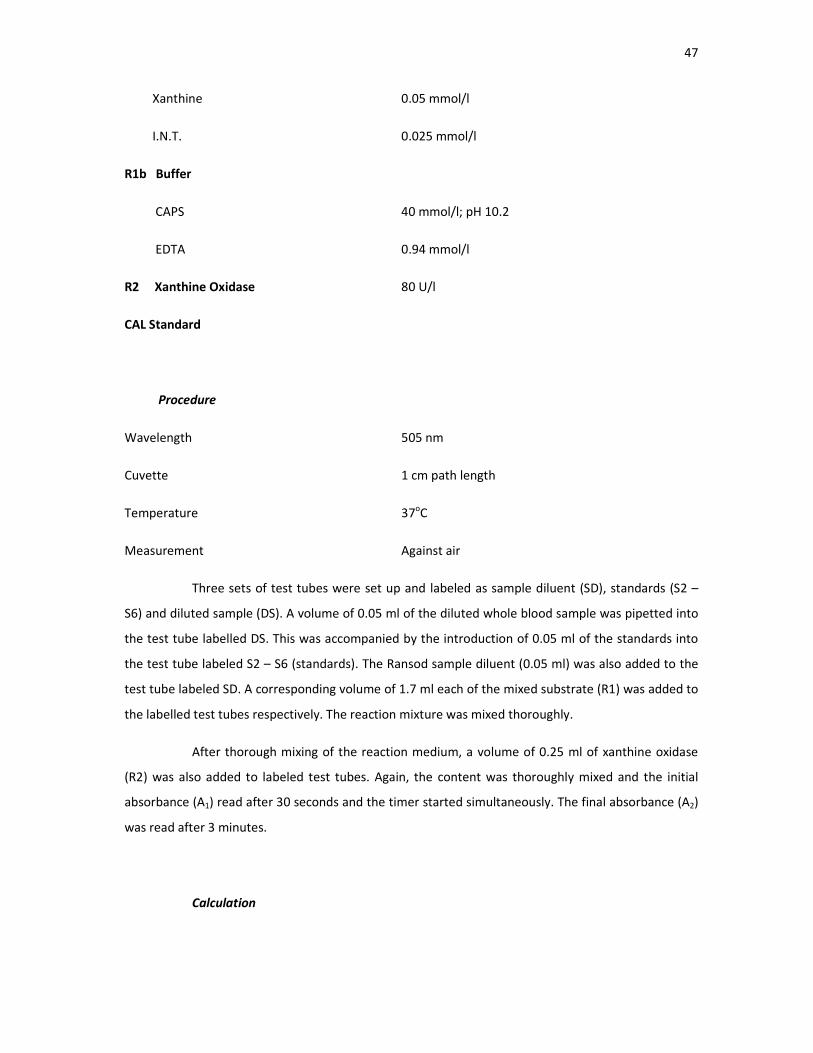
Three sets of test tubes were set up and labeled as sample diluent (SD), standards (S2 –
S6) and diluted sample (DS). A volume of 0.05 ml of the diluted whole blood sample was pipetted into
the test tube labelled DS. This was accompanied by the introduction of 0.05 ml of the standards into
the test tube labeled S2 – S6 (standards). The Ransod sample diluent (0.05 ml) was also added to the
test tube labeled SD. A corresponding volume of 1.7 ml each of the mixed substrate (R1) was added to
the labelled test tubes respectively. The reaction mixture was mixed thoroughly.
After thorough mixing of the reaction medium, a volume of 0.25 ml of xanthine oxidase
(R2) was also added to labeled test tubes. Again, the content was thoroughly mixed and the initial
absorbance (A1) read after 30 seconds and the timer started simultaneously. The final absorbance (A2)
was read after 3 minutes.
Calculation

48
3
12 AA − = ΔA/min of standard or sample
Sample diluent rate (S1 rate) = Rate of uninhibited reaction = 100%.
All standard rate and diluted sample rates were converted into percentages of the sample
diluent rate, and subtracted from 100% to give a percentage inhibition.
100 – )(
)100(
min/1
min/
dS
Std
A
A
∆
×∆ = % Inhibition
100 – )(
)100(
min/1
min/
dS
sample
A
A
∆
×∆ = % Inhibition
Percentage inhibition plot for each standard was plotted against Log10 (Standard
concentration in SOD units/ml). The percentage inhibition of sample was used to obtain units of SOD
from the standard curve.
SOD units/ml of whole blood = SOD units/ml from standard curve × dilution factor.
Converting to SOD units/g Haemoglobin
mlnHaemoglobig
mlUnitsSOD
/
/ = SOD units/g Haemoglobin.
2.2.14 Assay of Catalase Activity
Catalase activity was assayed using the method of Aebi (1983).
Principle
49
The ultraviolet absorption of hydrogen peroxide can be easily measured at 240 nm. On the
decomposition of hydrogen peroxide with catalase, the absorption decreases with time and from this
decrease catalase activity can be measured.
Reagents
Phosphate buffer, pH 7.0
3.522 g KH2PO4 and 7.268 g Na2HPO4.2H20 in 1000 ml of water
Hydrogen peroxide solution
0.085 ml of 30% hydrogen peroxide in 25 ml phosphate buffer.
Procedure
Red blood cell lysate was prepared by adding 1.2 ml of distilled water to 0.2 ml of RBC. Then
500 fold dilution of RBC lysate by phosphate buffer was made before the determination of catalase
activity. Immediately following the addition of 1 ml phosphate buffer (blank) or hydrogen peroxide
solution into 2 ml RBC diluted lysate, the change of absorbance of RBC against blank at 240 nm was
recorded every 15 seconds for 1 minute on a UV spectrophotometer. The activity of catalase was
calculated using the following equation:
Catalase catalytic concentration (U/L) = 00693.0
)/23.0 21 ALogA×
Where A1 = A240 at t = 0
A2 = A240 at t = 15 seconds
0.23 and 0.00693 = Constants
2.2.15 Determination of Malondialdehyde Concentration
Lipid peroxides assay was done by determining the concentration of malondialdehyde
(MDA) formed using the method of Varshney and Kale (1990).
50
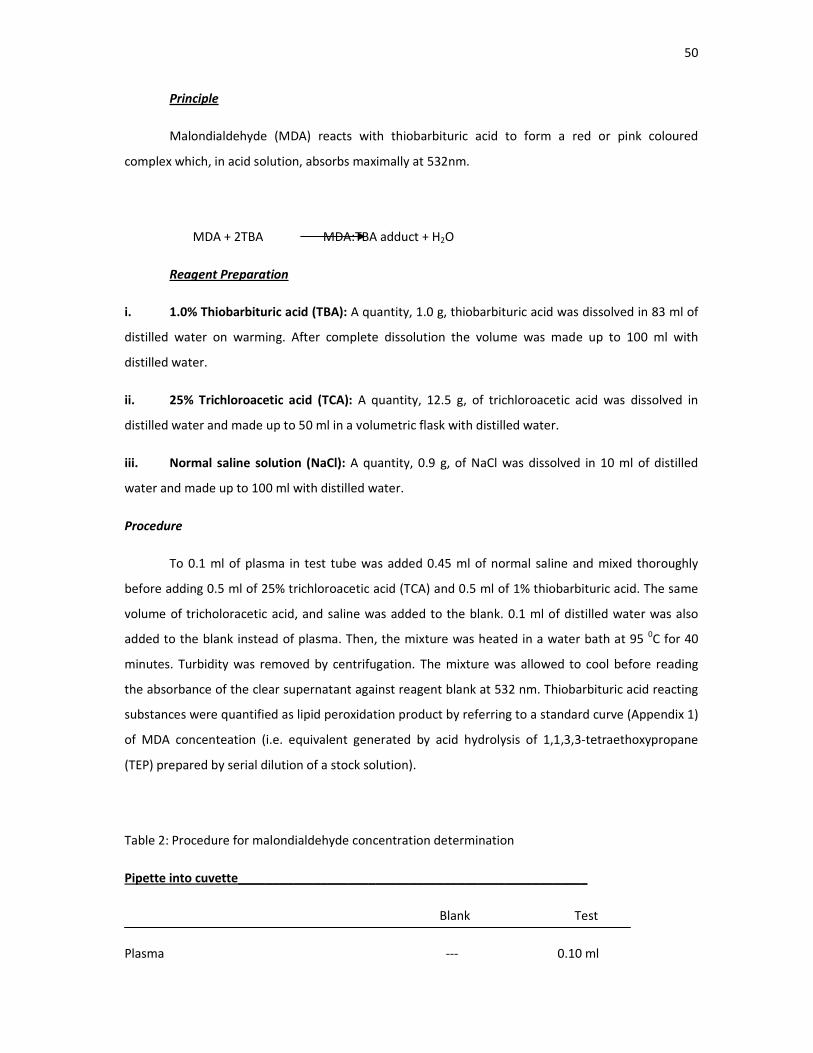
Principle
Malondialdehyde (MDA) reacts with thiobarbituric acid to form a red or pink coloured
complex which, in acid solution, absorbs maximally at 532nm.
MDA + 2TBA MDA:TBA adduct + H2O
Reagent Preparation
i. 1.0% Thiobarbituric acid (TBA): A quantity, 1.0 g, thiobarbituric acid was dissolved in 83 ml of
distilled water on warming. After complete dissolution the volume was made up to 100 ml with
distilled water.
ii. 25% Trichloroacetic acid (TCA): A quantity, 12.5 g, of trichloroacetic acid was dissolved in
distilled water and made up to 50 ml in a volumetric flask with distilled water.
iii. Normal saline solution (NaCl): A quantity, 0.9 g, of NaCl was dissolved in 10 ml of distilled
water and made up to 100 ml with distilled water.
Procedure
To 0.1 ml of plasma in test tube was added 0.45 ml of normal saline and mixed thoroughly
before adding 0.5 ml of 25% trichloroacetic acid (TCA) and 0.5 ml of 1% thiobarbituric acid. The same
volume of tricholoracetic acid, and saline was added to the blank. 0.1 ml of distilled water was also
added to the blank instead of plasma. Then, the mixture was heated in a water bath at 95 0C for 40
minutes. Turbidity was removed by centrifugation. The mixture was allowed to cool before reading
the absorbance of the clear supernatant against reagent blank at 532 nm. Thiobarbituric acid reacting
substances were quantified as lipid peroxidation product by referring to a standard curve (Appendix 1)
of MDA concenteation (i.e. equivalent generated by acid hydrolysis of 1,1,3,3-tetraethoxypropane
(TEP) prepared by serial dilution of a stock solution).
Table 2: Procedure for malondialdehyde concentration determination
Pipette into cuvette___________________________________________________
Blank Test
Plasma --- 0.10 ml
51
Distilled water 0.10 ml ---
Normal saline 0.45 ml 0.45 ml
25% TCA 0.50 ml 0.50 ml
1% TBA 0.50 ml 0.50 ml___
2.2.16 Determination of Ascorbic Acid Concentration
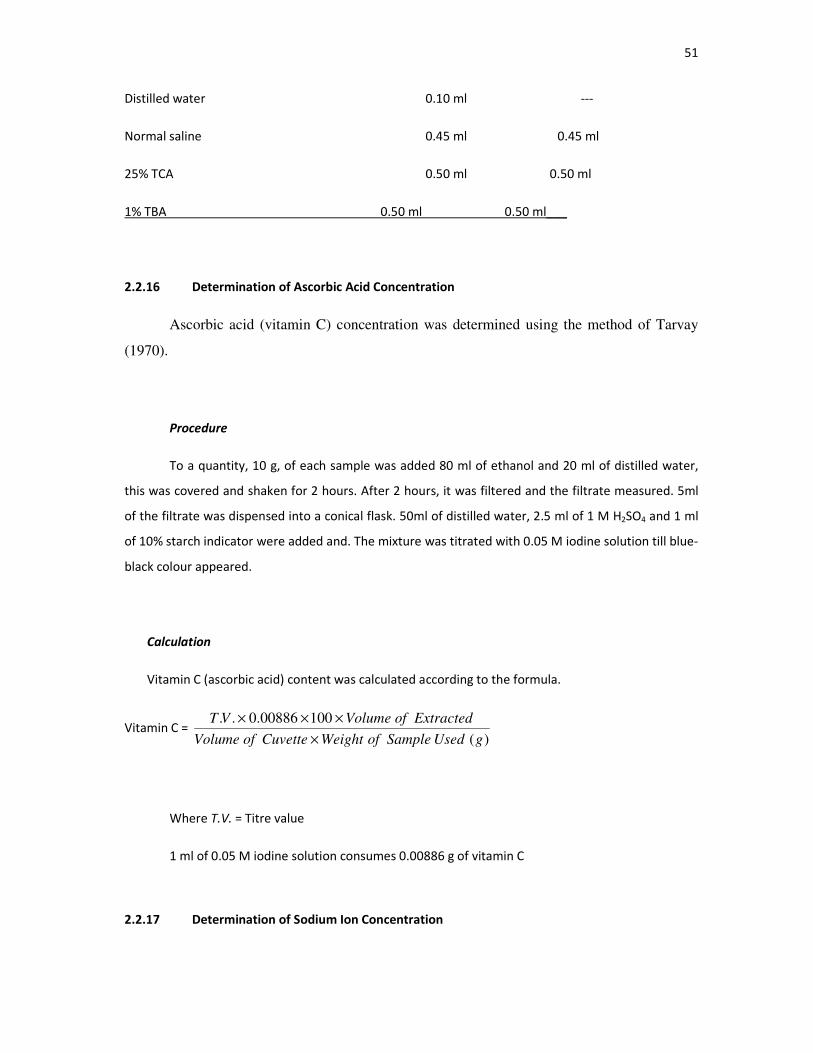
Ascorbic acid (vitamin C) concentration was determined using the method of Tarvay
(1970).
Procedure
To a quantity, 10 g, of each sample was added 80 ml of ethanol and 20 ml of distilled water,
this was covered and shaken for 2 hours. After 2 hours, it was filtered and the filtrate measured. 5ml
of the filtrate was dispensed into a conical flask. 50ml of distilled water, 2.5 ml of 1 M H2SO4 and 1 ml
of 10% starch indicator were added and. The mixture was titrated with 0.05 M iodine solution till blue-
black colour appeared.
Calculation
Vitamin C (ascorbic acid) content was calculated according to the formula.
Vitamin C = )(
10000886.0..
gUsedSampleofWeightCuvetteofVolume
ExtractedofVolumeVT
×
×××
Where T.V. = Titre value
1 ml of 0.05 M iodine solution consumes 0.00886 g of vitamin C
2.2.17 Determination of Sodium Ion Concentration
52
Sodium ion concentration was determined using the method of Tietz (1983) as
contained in Teco diagnostic kit. In this present method, sodium is precipitated as the triple
salt, sodium magnesium uranyl acetate, with the excess uranium then being reacted with
ferrocyanate, producing a chromophore whose absorbances varies inversely as the
concentration of sodium in the test specimen.
Different test tubes were labelled as standard (S), control (C), test (T) and blank (B). The
filtrate reagent (1.0 ml) was pipetted to all test tubes. The sample (50 μl) was added to all test tubes
and distilled water was then added to the blank. All the test tubes were shaken vigorously and mixed
continuously for 3 minutes. All the test tubes were centrifuged at high speed of 1,500 G for 10
minutes.
A volume of 1.0 ml of acid reagent was pipetted to all test tubes at the colour development
stage. The supernatant (50 μl) was added to the respective tubes and mixed thoroughly. The colour
reagent (50 μl) was also added to all the test tubes and mixed thoroughly. The spectrophotometer was
zeroed with distilled water; after which, the absorbance readings were taken at a wavelength of 550
nm.
2.2.18 Determination of Potassium Ion Concentration
Potassium ion concentration was determined using the method of Tietz (1983) as contained in
Teco diagnostic kit. The amount of potassium is determined by using sodium tetraphenylborone in a
specifically prepared mixture to produce a colloidal suspension. The turbidity of which is proportional
to potassium concentration in the range of 2 – 7 mEq/L.
The test tubes were well labelled as standard, control, test, etc. Also, a blank was provided. A
volume of 1.0ml of potassium reagent was pipetted into all tubes. Also, 0.01ml (10μl) of samples was
added to the respective test tubes and mixed thoroughly. The test tube mixtures were allowed to stay
under room temperature for 3 minutes. After 3 minutes, the absorbance of the solutions in the
different test tubes was read at a wavelength of 500nm with the reagent blank
2.2.19 Determination of Chloride Ion Concentration
Chloride ion concentration was determined using the method of Tietz (1983) as
contained in Teco diagnostic kit.
Principle:
Hg(SCN)2 + 2Cl– HgCl2 + 2SCN
–
53
3SCN– + Fe
3+ 4 Fe(SCN)3 Red Complex
Chloride ions form a soluble, non-ionized compound, with mercuric ions and will displace
thiocyanate ions from non-ionized mercuric thiocyanate. The released thiocyanate ions react with
ferric ions to form a colour complex that absorbs light at 480 nm. The intensity of the colour produced
is directly proportional to the chloride concentration.
Reagents:
1. Chloride Reagent (Active Ingredients):
Mercuric Nitrate 0.058 mM
Mercuric Thiocyanate 1.75 Mm
Mercuric Chloride 0.74 mM
Ferric Nitrate 22.3mM
Non-reactive ingredients and stabilizers in dilute acid and methanol.
2. Chloride Calibrator:
Sodium Chloride 100mEq/L
Procedure:
The different test tubes were labeled “blank”, “calibrator”, “patient”, etc. A quantity of 1.5ml
of chloride reagent was pipetted to each test tube. Also, a known volume, 0.01ml of calibrator or
sample was pipetted to the respective test tube and mixed thoroughly which was followed by
incubated for at least 5 minutes. The spectrophotometer was set at 480 nm and zero with reagent
blank. The absorbance readings were read at 480 nm and recorded all readings of all test tubes.
Calculation:
Conc. of Chloride (mEq/L) = Calibrator ofion ConcentratCalibrator of Absorbance
Unknownof Absorbance×
54
2.2.20 Determination of Bicarbonate Ion Concentration
Bicarbonate ion concentration was determined using the method of Tietz (1983) as
contained in Teco diagnostic kit.
2.2.21 Determination of Serum Urea Concentration
Serum urea concentration was determined using the method of Tietz (1994) as
contained in Randox diagnostic kit.
Principle:
This method is based on the principle that urea in the serum is hydrolysed to ammonia in the
presence of urease. The ammonia is then measured photometrically by Berthelot’s reaction.
Urea + H2O 2NH3 + CO2
NH3 + Hupochlorite + Phenol Indophenol (Blue Compound)
Reagents Composition
Reagents
Contents Concentration of Solutions
1. EDTA
Sodium nitroprusside
Urease
116 mmol/L
6 mmol/L
1 g/L
2. Phenol (Diluted) 120 mmol/L
3. Sodium hydrochlorite (diluted)
Sodium hydroxide
27 mmol/L
0.14 N
CAL Standard Specific instruction
Urease
55
Procedure
Three sets of test tubes labelled Blank (B), Standard (ST) and Sample (SA) were set up. A
volume of 10 μl each of the serum sample was pipetted into the test tubes labelled SA, ST and B
respectively. Reagent 1 (10 μl) which is made up of EDTA, sodium nitroprusside and urease was
pipetted into all the three sets of test tubes labelled B, ST and SA respectively. The contents of the
three test tubes were thoroughly mixed and incubated at 37oC for 10 min. After which, 2.50 ml each of
Reagents 2 (diluted phenol) and 3 (diluted sodium hypochloride and sodium hydroxide) were added to
the three sets of test tubes. The contents were also thoroughly mixed and incubated at 37oC for 15
min. The absorbance of the sample (Asample) and standard (Astandard) against the blank was read at a
wavelength of 546 nm against the blank.
Urea Conc. = ×Standard
sample
A
A Standard Conc
Where:
A sample = Absorbance of the Sample
A standard = Absorbance of the Standard
2.2.22 Determination of Serum Creatinine Concentration
Serum creatinine concentration was determined using the method of Tietz (1994) as
contained in Randox diagnostic kit. The modified Jaffe method (Blass et al., 1974) for the in vitro
determination of creatinine in serum using the Quimica Clinica Applicada (QCA) creatinine test kit was
employed in the determination of creatinine concentration.
Principle
Creatinine in alkaline solution reacts with picrate to form a coloured complex.
Sample
56
Serum
Reagents
Reagent A = Alkaline solution containing NaOH and Na2CO3
Reagent B = Picric acid solution
Reagent C= Standard, an aqueous solution equivalent to 2mg/dl of creatinine.
Methodology
A working reagent composed of equal volumes of Reagent A and B (Alkaline solution and
picric acid solution) was prepared. For each determination, 0.5ml of Reagent A mixed with 0.5 ml of
Reagent B gave 1ml of working reagent for each serum sample, 0.1ml of sample was added to 1.0ml
of working reagent in a clean test tube. It was mixed properly and transferred to a cuvette, a stop
watch was started and absorbance was read at the 20th
and 80th
seconds against a working reagent
blank at 546 nm. Two standards were prepared and run by adding 0.1ml of the standard (Reagent C)
to 1 ml of working reagent in a test tube. It was mixed properly and transferred to a cuvette, a stop
watch was started and absorbance read at the 20th
and 80th
seconds against a working reagent blank
at 546nm for the samples. The mean of the standards was used as the standard.
The following formula was used to calculate the serum creatinine concentration of each
sample.
Serum Creatinine Conc. (mg/dl) = 1
2
Standard of Sec)20th -(80th Absorbance of Change
Sample of Sec)20th -(80th Absorbance of Change×
Where 2 =standard aqueous solution of creatinine
2.2.23 Determination of Fasting and Random Glucose Concentration
Fasting and random blood sugar using Accu-chek Active glucometer by Roche
Diagnostic according to the method of Marks and Dawson (1965).
Principle
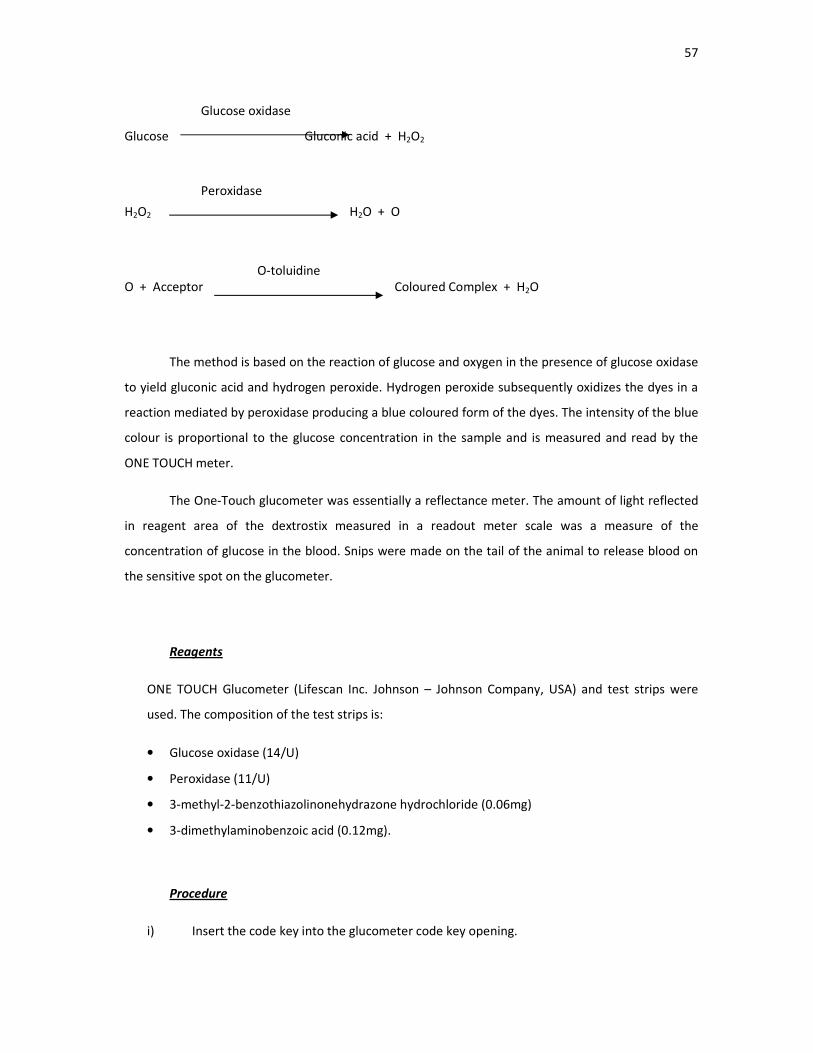
57
Glucose Gluconic acid + H2O2
H2O2 H2O + O
O + Acceptor Coloured Complex + H2O
The method is based on the reaction of glucose and oxygen in the presence of glucose oxidase
to yield gluconic acid and hydrogen peroxide. Hydrogen peroxide subsequently oxidizes the dyes in a
reaction mediated by peroxidase producing a blue coloured form of the dyes. The intensity of the blue
colour is proportional to the glucose concentration in the sample and is measured and read by the
ONE TOUCH meter.
The One-Touch glucometer was essentially a reflectance meter. The amount of light reflected
in reagent area of the dextrostix measured in a readout meter scale was a measure of the
concentration of glucose in the blood. Snips were made on the tail of the animal to release blood on
the sensitive spot on the glucometer.
Reagents
ONE TOUCH Glucometer (Lifescan Inc. Johnson – Johnson Company, USA) and test strips were
used. The composition of the test strips is:
• Glucose oxidase (14/U)
• Peroxidase (11/U)
• 3-methyl-2-benzothiazolinonehydrazone hydrochloride (0.06mg)
• 3-dimethylaminobenzoic acid (0.12mg).
Procedure
i) Insert the code key into the glucometer code key opening.
Glucose oxidase
Peroxidase
O-toluidine
58
ii) Insert a test strip to make sure that the code on the glucometer matches the code on the
test strip.
iii) Insert a fresh new strip with the orange pad facing up until it goes no further into the
glucometer opening for test strips.
iv) Wait until the image of a flashing blood appears on the glucometer screen; that signifies
that the glucometer is ready. Then put a drop of blood collected with a capillary tube on
the centre of the square of the orange pad.
v) An hour glass symbol appears on the glucometer screen followed after 5 seconds by the
test result.
vi) Copy the test result as the blood glucose level in g/dl.
2.2.24 Body Weight
According to duration of study, both control and the test animals were weighed before
and after the experiment. Therefore, the difference in body weight was recorded and compared.
2.2.25 Histopathological Examination The histological examination of the tissues of the pancreas of Wistar male albino rats
was done using the method of Drury et al. (1967) as described below:
A. Fixation and Washing
Formalin (10%) was used as the fixative and for the purpose of preservation. A thin section of
the tissue (about 1 to 2 cm in diameter) was trimmed with a sharp razor blade. The small pieces of the
tissue were placed in the 10% formalin, the container was shaken gently several times to make sure
that the fluid had reached all surfaces and that pieces were not sticking to the bottom. This was then
incubated at 250C for 24 hours, to allow proper fixing. The fixed tissue pieces were washed with
running water for 24 hours to free them from excess fixatives.
B. Dehydration
Water was removed from the tissue before embedding the tissue in paraffin. The dehydration
was achieved by immersing the thin sections of the tissue in automatic tissue processor containing 12
jars.The first three (3) jars contained 70, 90 and 95% absolute alcohol respectively. This was done to
59
remove the water content in the tissues. The absolute alcohol reduced the shrinking that occurred in
the tissue. The time for each step was 30 minutes. A second change of absolute alcohol was included
to ensure complete removal of water. This was achieved in the second three (3) jars of the automatic
tissue processor.
C. Clearing
Solutions of xylene were used for clearing the tissue sections. This step was achieved in the
third three (3) jars of the automatic tissue processor. Because the alcohol (ethanol) used for
dehydration would not dissolve or mix with molten paraffin, the tissue was immersed in xylene
solution which was miscible with both alcohol and paraffin before infiltration could take place.
Clearing was done to remove opacity from dehydrated tissue. A period of 15 minutes was
allowed to elapse before the tissue was removed from the solution for infiltration with paraffin.
D. Infiltration with Paraffin
Paraffin wax at 50 to 52°C was used to infiltrate the tissue. The tissue was transferred directly
from the clearer to a bath containing melted paraffin. After 30 - 60 minutes incubation in the first
bath, the tissue was then removed to a fresh dish of paraffin contained in the fourth three jars of the
automatic tissue processor for a similar length of time.
E. Embedding (Blocking) with Paraffin
As soon as the tissue was thoroughly infiltrated with paraffin, it (paraffin) was allowed to
solidify around and within the tissue.
F. Paraffin Sectioning
The embedded blocks were trimmed into squares and fixed in the microtome knives for
sectioning after which the sections were floated on a water bath.
60
G. Mounting
Glass slides were thoroughly cleaned and a thin smear of albumen fixative was made on the
slides. The albumenized slide was used to collect the required section from the rest of the ribbon in
the water. The section on the glass slide was kept moist before staining.
H. Staining with Haematoxylin
The slides were passed through a series of jars containing alcohols of decreasing strength and
various staining solutions.
I. Microscopic Observation of Slide
The slides prepared were mounted on photomicroscope, one after the other and viewed at
different magnification power of the microscope. Photograph of each of the slides was taken.
2.3 Statistical Analysis
The results were expressed as mean±SD and test of statistical significance was carried out
using one–way analysis of variance (ANOVA). The means was separated using Duncan multiple Test.
The statistical packaged used was the statistical package for social sciences (SPSS), version 17.
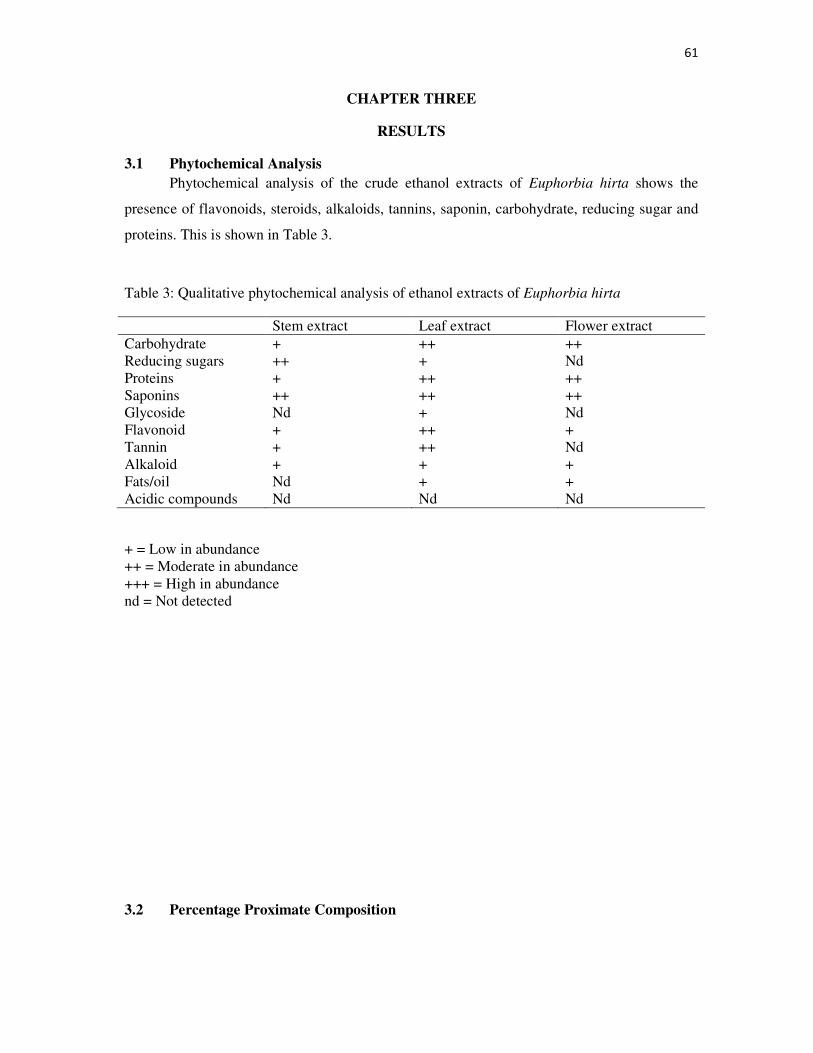
61
CHAPTER THREE
RESULTS
3.1 Phytochemical Analysis
Phytochemical analysis of the crude ethanol extracts of Euphorbia hirta shows the
presence of flavonoids, steroids, alkaloids, tannins, saponin, carbohydrate, reducing sugar and
proteins. This is shown in Table 3.
Table 3: Qualitative phytochemical analysis of ethanol extracts of Euphorbia hirta
Stem extract Leaf extract Flower extract
Carbohydrate + ++ ++
Reducing sugars ++ + Nd
Proteins + ++ ++
Saponins ++ ++ ++
Glycoside Nd + Nd
Flavonoid + ++ +
Tannin + ++ Nd
Alkaloid + + +
Fats/oil Nd + +
Acidic compounds Nd Nd Nd
+ = Low in abundance
++ = Moderate in abundance
+++ = High in abundance
nd = Not detected
3.2 Percentage Proximate Composition
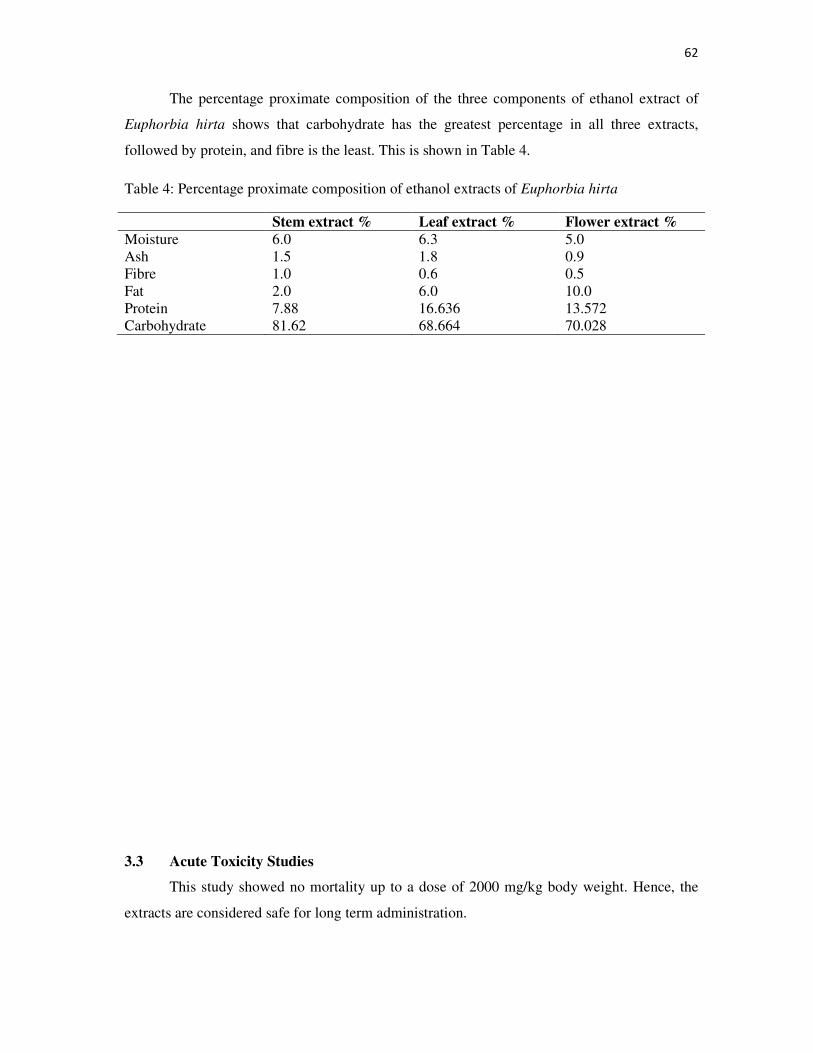
62
The percentage proximate composition of the three components of ethanol extract of
Euphorbia hirta shows that carbohydrate has the greatest percentage in all three extracts,
followed by protein, and fibre is the least. This is shown in Table 4.
Table 4: Percentage proximate composition of ethanol extracts of Euphorbia hirta
Stem extract % Leaf extract % Flower extract %
Moisture 6.0 6.3 5.0
Ash 1.5 1.8 0.9
Fibre 1.0 0.6 0.5
Fat 2.0 6.0 10.0
Protein 7.88 16.636 13.572
Carbohydrate 81.62 68.664 70.028
3.3 Acute Toxicity Studies
This study showed no mortality up to a dose of 2000 mg/kg body weight. Hence, the
extracts are considered safe for long term administration.
63
3.4 Effects of Ethanol Extracts of Euphorbia hirta on Serum Total Cholesterol
Concentration of Normal and Diabetic Rats
In Fig. 2, significant (P<0.05) increase was observed in the total cholesterol
concentration of rats in the diabetic untreated group (group 2) compared with normal control
(group 1). However, non-significant decrease (P>0.05) was observed in the total cholesterol
concentration of diabetic rats (group 7) treated with the standard drug (voglibose) compared
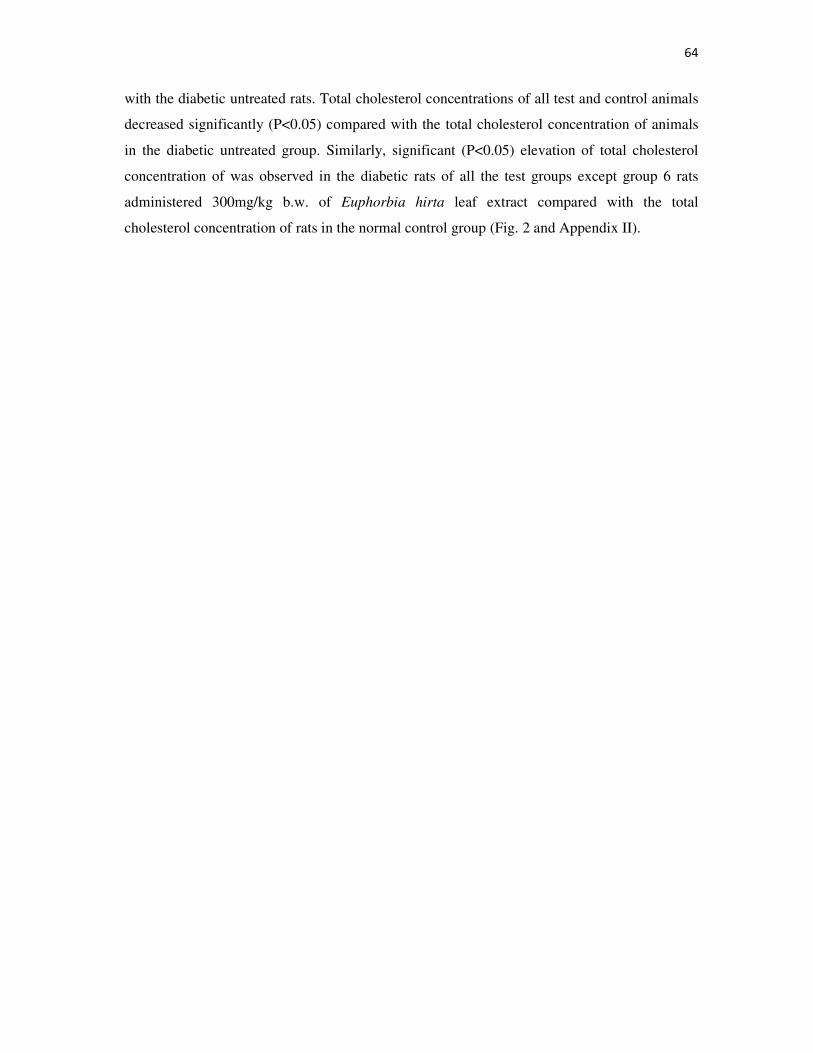
64
with the diabetic untreated rats. Total cholesterol concentrations of all test and control animals
decreased significantly (P<0.05) compared with the total cholesterol concentration of animals
in the diabetic untreated group. Similarly, significant (P<0.05) elevation of total cholesterol
concentration of was observed in the diabetic rats of all the test groups except group 6 rats
administered 300mg/kg b.w. of Euphorbia hirta leaf extract compared with the total
cholesterol concentration of rats in the normal control group (Fig. 2 and Appendix II).
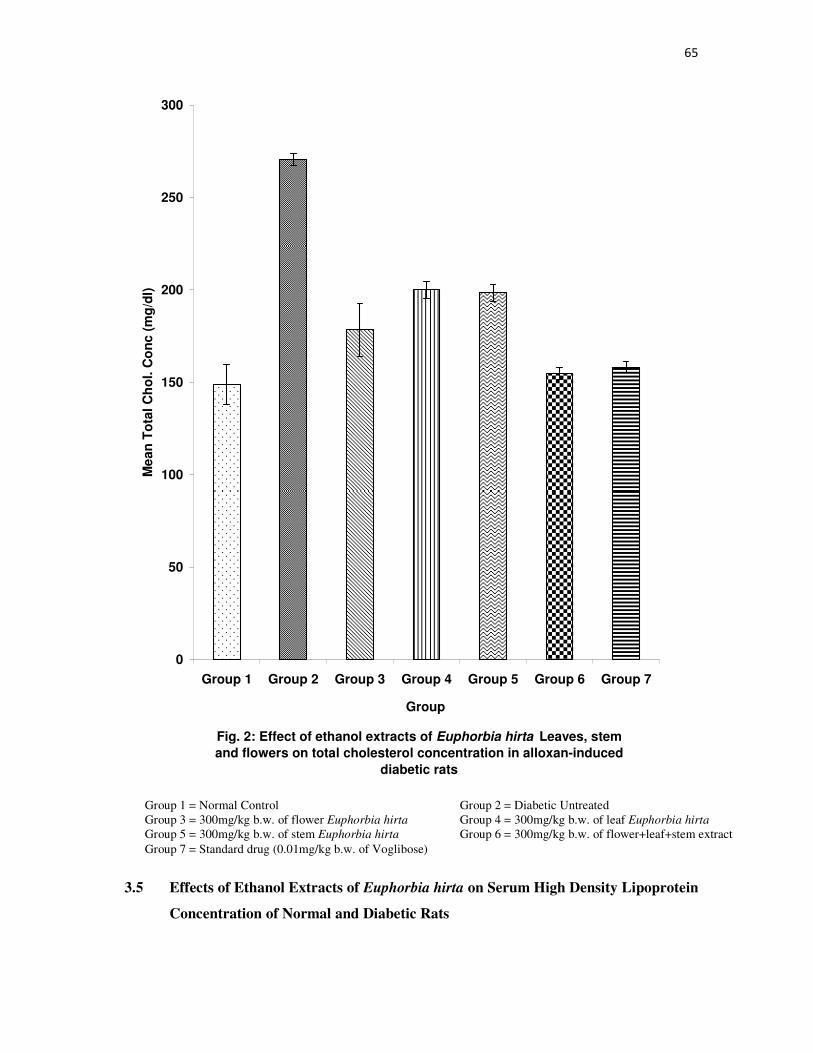
65
Fig. 2: Effect of ethanol extracts of Euphorbia hirta Leaves, stem
and flowers on total cholesterol concentration in alloxan-induced
diabetic rats
0
50
100
150
200
250
300
Group 1 Group 2 Group 3 Group 4 Group 5 Group 6 Group 7
Group
Me
an
To
tal
Ch
ol.
Co
nc
(m
g/d
l)
3.5 Effects of Ethanol Extracts of Euphorbia hirta on Serum High Density Lipoprotein
Concentration of Normal and Diabetic Rats
Group 1 = Normal Control Group 2 = Diabetic Untreated
Group 3 = 300mg/kg b.w. of flower Euphorbia hirta Group 4 = 300mg/kg b.w. of leaf Euphorbia hirta
Group 5 = 300mg/kg b.w. of stem Euphorbia hirta Group 6 = 300mg/kg b.w. of flower+leaf+stem extract
Group 7 = Standard drug (0.01mg/kg b.w. of Voglibose)
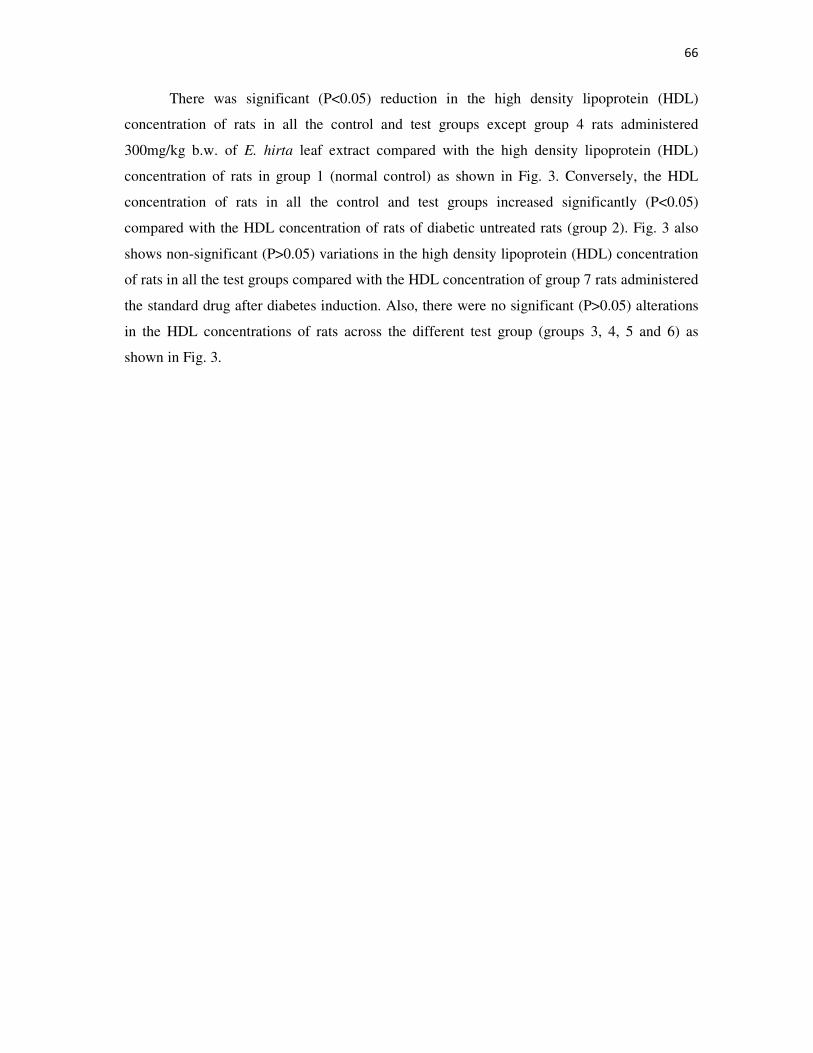
66
There was significant (P<0.05) reduction in the high density lipoprotein (HDL)
concentration of rats in all the control and test groups except group 4 rats administered
300mg/kg b.w. of E. hirta leaf extract compared with the high density lipoprotein (HDL)
concentration of rats in group 1 (normal control) as shown in Fig. 3. Conversely, the HDL
concentration of rats in all the control and test groups increased significantly (P<0.05)
compared with the HDL concentration of rats of diabetic untreated rats (group 2). Fig. 3 also
shows non-significant (P>0.05) variations in the high density lipoprotein (HDL) concentration
of rats in all the test groups compared with the HDL concentration of group 7 rats administered
the standard drug after diabetes induction. Also, there were no significant (P>0.05) alterations
in the HDL concentrations of rats across the different test group (groups 3, 4, 5 and 6) as
shown in Fig. 3.
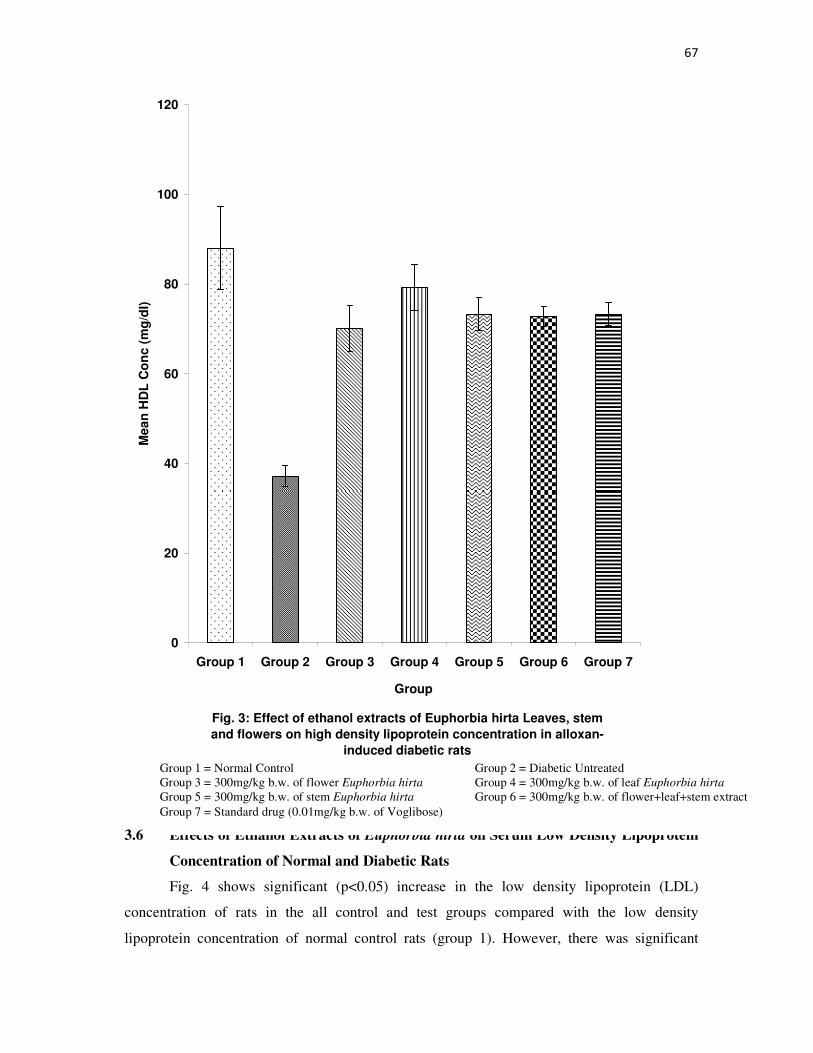
67
Fig. 3: Effect of ethanol extracts of Euphorbia hirta Leaves, stem
and flowers on high density lipoprotein concentration in alloxan-
induced diabetic rats
0
20
40
60
80
100
120
Group 1 Group 2 Group 3 Group 4 Group 5 Group 6 Group 7
Group
Me
an
HD
L C
on
c (
mg
/dl)
3.6 Effects of Ethanol Extracts of Euphorbia hirta on Serum Low Density Lipoprotein
Concentration of Normal and Diabetic Rats
Fig. 4 shows significant (p<0.05) increase in the low density lipoprotein (LDL)
concentration of rats in the all control and test groups compared with the low density
lipoprotein concentration of normal control rats (group 1). However, there was significant
Group 1 = Normal Control Group 2 = Diabetic Untreated
Group 3 = 300mg/kg b.w. of flower Euphorbia hirta Group 4 = 300mg/kg b.w. of leaf Euphorbia hirta
Group 5 = 300mg/kg b.w. of stem Euphorbia hirta Group 6 = 300mg/kg b.w. of flower+leaf+stem extract
Group 7 = Standard drug (0.01mg/kg b.w. of Voglibose)
68
(p<0.05) decrease in the LDL concentration of rats in all the control and test groups compared
with the LDL concentration of rats in the diabetic untreated group (group 2). It was also shown
in Fig. 4 that non-significant (p>0.05) variations were observed in the LDL concentration of
diabetic rats in all the test groups administered varying doses of the extract compared with
standard control (group 1, voglibose). There was significant (p<0.05) decrease in the LDL
concentration of rats (group 6) administered 300 mg/kg b.w. of flower, leaf and stem extracts
after the induction of diabetes compared with the LDL concentration of rats of group 5
administered 300 mg/kg b.w. of E. hirta stem extract after the induction of diabetes.
69
Fig. 4: Effect of ethanol extracts of Euphorbia hirta leaves, stem and
flowers on low density lipoprotein concentration in alloxan-induced
diabetic rats
0
20
40
60
80
100
120
140
160
180
Group 1 Group 2 Group 3 Group 4 Group 5 Group 6 Group 7
Group
Me
an
LD
L C
on
c (
mg
/dl)
3.7 Effects of Ethanol Extracts of Euphorbia hirta on Serum Triacylglycerol
Concentration of Normal and Diabetic Rats
Group 1 = Normal Control Group 2 = Diabetic Untreated
Group 3 = 300mg/kg b.w. of flower Euphorbia hirta Group 4 = 300mg/kg b.w. of leaf Euphorbia hirta
Group 5 = 300mg/kg b.w. of stem Euphorbia hirta Group 6 = 300mg/kg b.w. of flower+leaf+stem extract
Group 7 = Standard drug (0.01mg/kg b.w. of Voglibose)
70
Triacylglycerol (TAG) concentration increased significantly (p<0.05) in the diabetic
untreated rats (group 2) compared with the TAG concentration of the normal control rats
(group 1) as shown in Fig. 5. Fig. 5 also shows that the TAG concentration of rats in all the test
groups and group 7 rats (standard drug) decreased significantly (p<0.05) compared with the
TAG concentration of the diabetic untreated rats. Non-significant (p>0.05) change was
observed in the TAG concentration of rats in all the test groups compared with the TAG
concentration of group 1 rats (normal control). Similarly, non-significant (p>0.05) difference
was observed in the TAG concentration of rats across the different test groups as shown in Fig.
5.
71
Fig. 5: Effect of ethanol extracts of Euphorbia hirta leaves, stem and
flowers on triacylglycerol concentration in alloxan-induced diabetic
rats
0
50
100
150
200
250
Group 1 Group 2 Group 3 Group 4 Group 5 Group 6 Group 7
Group
Me
an
TA
G C
on
c (
mg
/dl)
3.8 Effects of Ethanol Extracts of Euphorbia hirta on Serum Sodium Ion
Concentration of Normal and Diabetic Rats
Group 1 = Normal Control Group 2 = Diabetic Untreated
Group 3 = 300mg/kg b.w. of flower Euphorbia hirta Group 4 = 300mg/kg b.w. of leaf Euphorbia hirta
Group 5 = 300mg/kg b.w. of stem Euphorbia hirta Group 6 = 300mg/kg b.w. of flower+leaf+stem extract
Group 7 = Standard drug (0.01mg/kg b.w. of Voglibose)
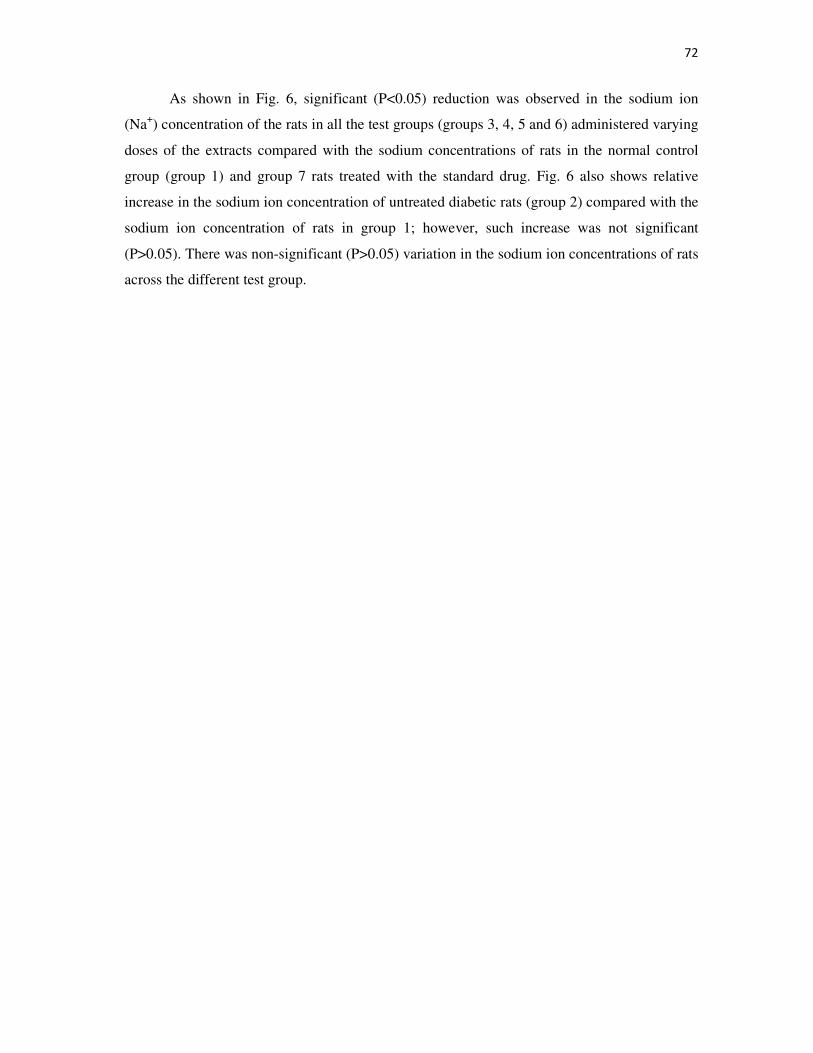
72
As shown in Fig. 6, significant (P<0.05) reduction was observed in the sodium ion
(Na+) concentration of the rats in all the test groups (groups 3, 4, 5 and 6) administered varying
doses of the extracts compared with the sodium concentrations of rats in the normal control
group (group 1) and group 7 rats treated with the standard drug. Fig. 6 also shows relative
increase in the sodium ion concentration of untreated diabetic rats (group 2) compared with the
sodium ion concentration of rats in group 1; however, such increase was not significant
(P>0.05). There was non-significant (P>0.05) variation in the sodium ion concentrations of rats
across the different test group.
73
Fig. 6: Effect of ethanol extracts of Euphorbia hirta leaves, stem and
flowers on sodium ion concentration in alloxan-induced diabetic
rats
0
20
40
60
80
100
120
140
160
Group 1 Group 2 Group 3 Group 4 Group 5 Group 6 Group 7
Group
Me
an
Na
+ C
on
c (
mE
q/L
)
3.9 Effects of Ethanol Extracts of Euphorbia hirta on Serum Potassium Ion
Concentration of Normal and Diabetic Rats
Group 1 = Normal Control Group 2 = Diabetic Untreated
Group 3 = 300mg/kg b.w. of flower Euphorbia hirta Group 4 = 300mg/kg b.w. of leaf Euphorbia hirta
Group 5 = 300mg/kg b.w. of stem Euphorbia hirta Group 6 = 300mg/kg b.w. of flower+leaf+stem extract
Group 7 = Standard drug (0.01mg/kg b.w. of Voglibose)
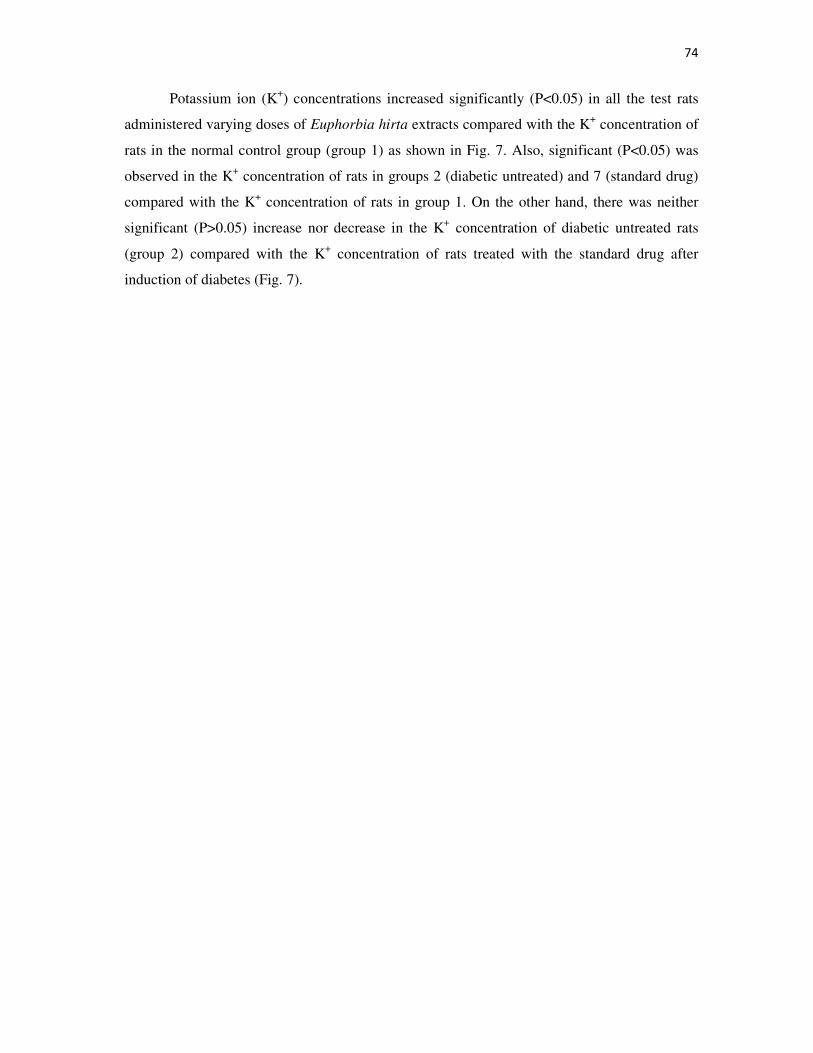
74
Potassium ion (K+) concentrations increased significantly (P<0.05) in all the test rats
administered varying doses of Euphorbia hirta extracts compared with the K+ concentration of
rats in the normal control group (group 1) as shown in Fig. 7. Also, significant (P<0.05) was
observed in the K+ concentration of rats in groups 2 (diabetic untreated) and 7 (standard drug)
compared with the K+ concentration of rats in group 1. On the other hand, there was neither
significant (P>0.05) increase nor decrease in the K+ concentration of diabetic untreated rats
(group 2) compared with the K+ concentration of rats treated with the standard drug after
induction of diabetes (Fig. 7).
75
Fig. 7: Effect of ethanol extracts of Euphorbia hirta leaves, stem and
flowers on potassium ion concentration in alloxan-induced diabetic
rats
0
1
2
3
4
5
6
7
8
Group 1 Group 2 Group 3 Group 4 Group 5 Group 6 Group 7
Group
Me
an
K+ C
on
c (
mE
q/L
)
3.10 Effects of Ethanol Extracts of Euphorbia hirta on Serum Chloride Ion
Concentration of Normal and Diabetic Rats
Group 1 = Normal Control Group 2 = Diabetic Untreated
Group 3 = 300mg/kg b.w. of flower Euphorbia hirta Group 4 = 300mg/kg b.w. of leaf Euphorbia hirta
Group 5 = 300mg/kg b.w. of stem Euphorbia hirta Group 6 = 300mg/kg b.w. of flower+leaf+stem extract
Group 7 = Standard drug (0.01mg/kg b.w. of Voglibose)

76
Fig. 8 shows significant (P<0.05) elevation in the chloride ion (Cl–) concentration of
group 2 rats (diabetic untreated) compared with the chloride ion (Cl–) concentration of group 1
rats (normal control). The chloride ion (Cl–) concentration of all the test group rats except
group 6 (300mg/kg b.w. of flower+leaf+stem extracts) decreased significantly (P<0.05)
compared with the chloride ion (Cl–) concentration of rats in all the control groups as observed
in Fig. 8.
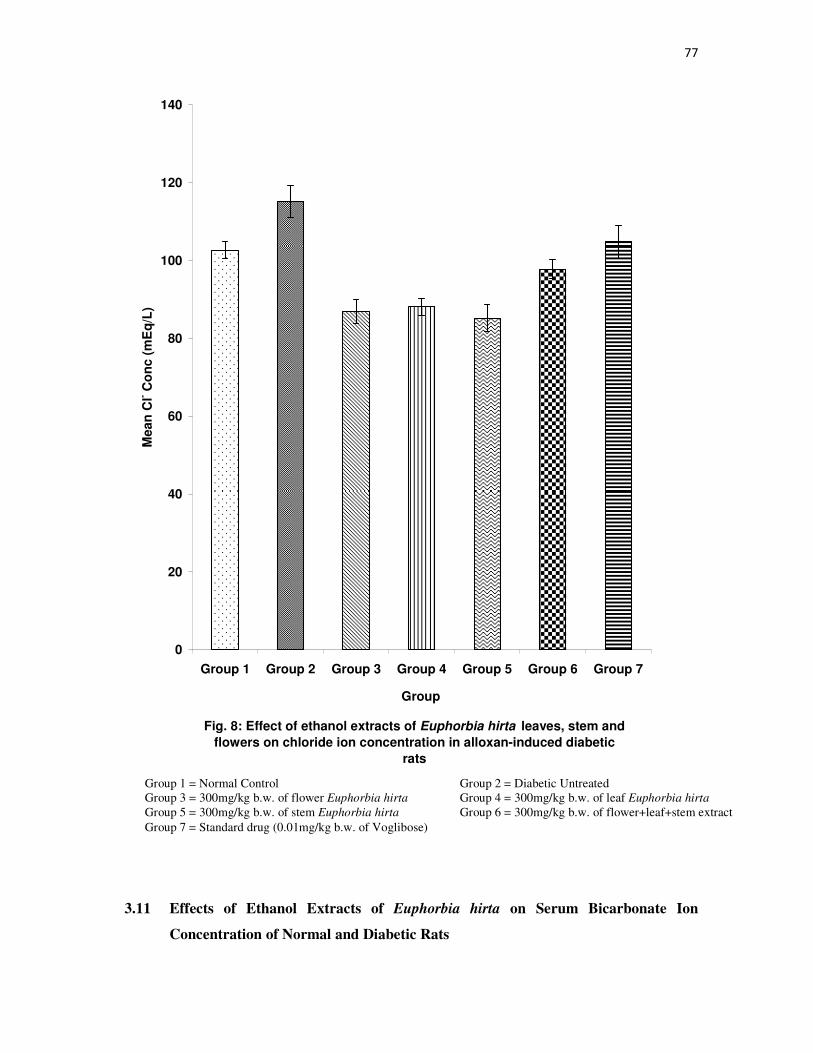
77
Fig. 8: Effect of ethanol extracts of Euphorbia hirta leaves, stem and
flowers on chloride ion concentration in alloxan-induced diabetic
rats
0
20
40
60
80
100
120
140
Group 1 Group 2 Group 3 Group 4 Group 5 Group 6 Group 7
Group
Mean
Cl- C
on
c (
mE
q/L
)
3.11 Effects of Ethanol Extracts of Euphorbia hirta on Serum Bicarbonate Ion
Concentration of Normal and Diabetic Rats
Group 1 = Normal Control Group 2 = Diabetic Untreated
Group 3 = 300mg/kg b.w. of flower Euphorbia hirta Group 4 = 300mg/kg b.w. of leaf Euphorbia hirta
Group 5 = 300mg/kg b.w. of stem Euphorbia hirta Group 6 = 300mg/kg b.w. of flower+leaf+stem extract
Group 7 = Standard drug (0.01mg/kg b.w. of Voglibose)

78
It was observed in Fig. 9 that there was non-significant difference (P>0.05) in
bicarbonate ion concentration of the rats in the test groups administered varying doses of the
different extracts compared with the bicarbonate ion concentrations of the rats in all the control
group. Similarly, there were non-significant (P>0.05) changes in the bicarbonate ion
concentration of diabetic untreated rats (group 2) and group 7 rats treated with the standard
drug after the induction of diabetes compared with normal control rats (group 1). Fig. 9 shows
significantly (P<0.05) elevation in bicarbonate ion concentration of groups 3 and 6 rats
administered 300mg/kg b.w. of flower extract of Euphorbia hirta and 300mg/kg b.w. of flower
+ leaf + stem extract of Euphorbia hirta respectively compared with bicarbonate ion
concentration of group 4 rats administered 300mg/kg b.w. of leaf extract of Euphorbia hirta.
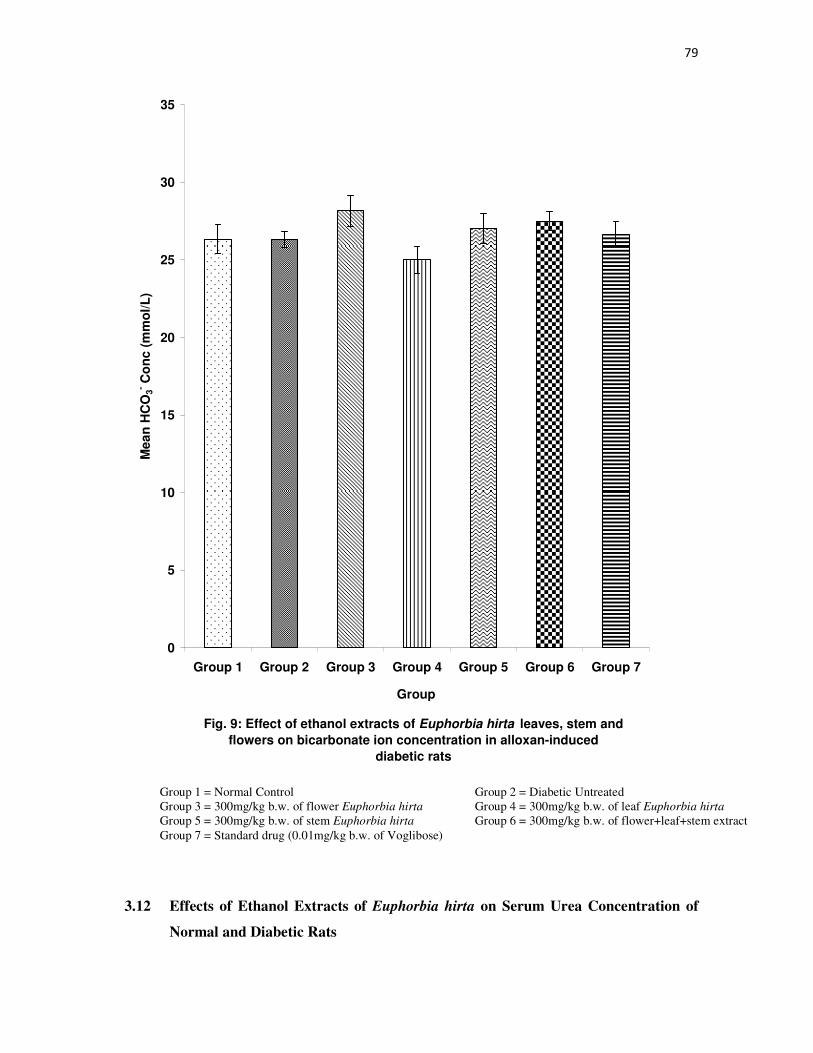
79
Fig. 9: Effect of ethanol extracts of Euphorbia hirta leaves, stem and
flowers on bicarbonate ion concentration in alloxan-induced
diabetic rats
0
5
10
15
20
25
30
35
Group 1 Group 2 Group 3 Group 4 Group 5 Group 6 Group 7
Group
Me
an
HC
O3- C
on
c (
mm
ol/
L)
3.12 Effects of Ethanol Extracts of Euphorbia hirta on Serum Urea Concentration of
Normal and Diabetic Rats
Group 1 = Normal Control Group 2 = Diabetic Untreated
Group 3 = 300mg/kg b.w. of flower Euphorbia hirta Group 4 = 300mg/kg b.w. of leaf Euphorbia hirta
Group 5 = 300mg/kg b.w. of stem Euphorbia hirta Group 6 = 300mg/kg b.w. of flower+leaf+stem extract
Group 7 = Standard drug (0.01mg/kg b.w. of Voglibose)
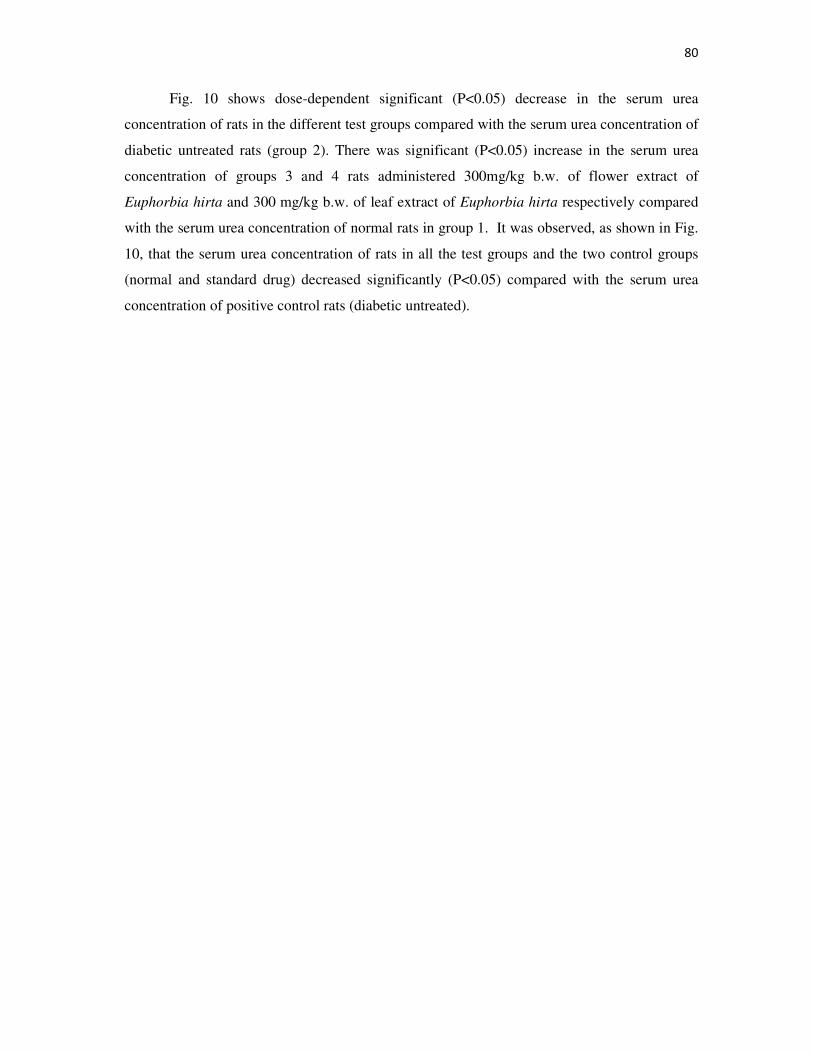
80
Fig. 10 shows dose-dependent significant (P<0.05) decrease in the serum urea
concentration of rats in the different test groups compared with the serum urea concentration of
diabetic untreated rats (group 2). There was significant (P<0.05) increase in the serum urea
concentration of groups 3 and 4 rats administered 300mg/kg b.w. of flower extract of
Euphorbia hirta and 300 mg/kg b.w. of leaf extract of Euphorbia hirta respectively compared
with the serum urea concentration of normal rats in group 1. It was observed, as shown in Fig.
10, that the serum urea concentration of rats in all the test groups and the two control groups
(normal and standard drug) decreased significantly (P<0.05) compared with the serum urea
concentration of positive control rats (diabetic untreated).
81
Fig. 10: Effect of ethanol extracts of Euphorbia hirta leaves, stem
and flowers on urea concentration in alloxan-induced diabetic rats
0
10
20
30
40
50
60
70
80
90
Group 1 Group 2 Group 3 Group 4 Group 5 Group 6 Group 7
Group
Me
an
Ure
a C
on
c (
mg
/dl)
3.13 Effects of Ethanol Extracts of Euphorbia hirta on Serum Creatinine Concentration
of Normal and Diabetic Rats
There was a dose-dependent significant (P<0.05) decrease in the serum creatinine
concentration of test rats in groups 3, 4 and 5 administered varying doses of the extract
Group 1 = Normal Control Group 2 = Diabetic Untreated
Group 3 = 300mg/kg b.w. of flower Euphorbia hirta Group 4 = 300mg/kg b.w. of leaf Euphorbia hirta
Group 5 = 300mg/kg b.w. of stem Euphorbia hirta Group 6 = 300mg/kg b.w. of flower+leaf+stem extract
Group 7 = Standard drug (0.01mg/kg b.w. of Voglibose)
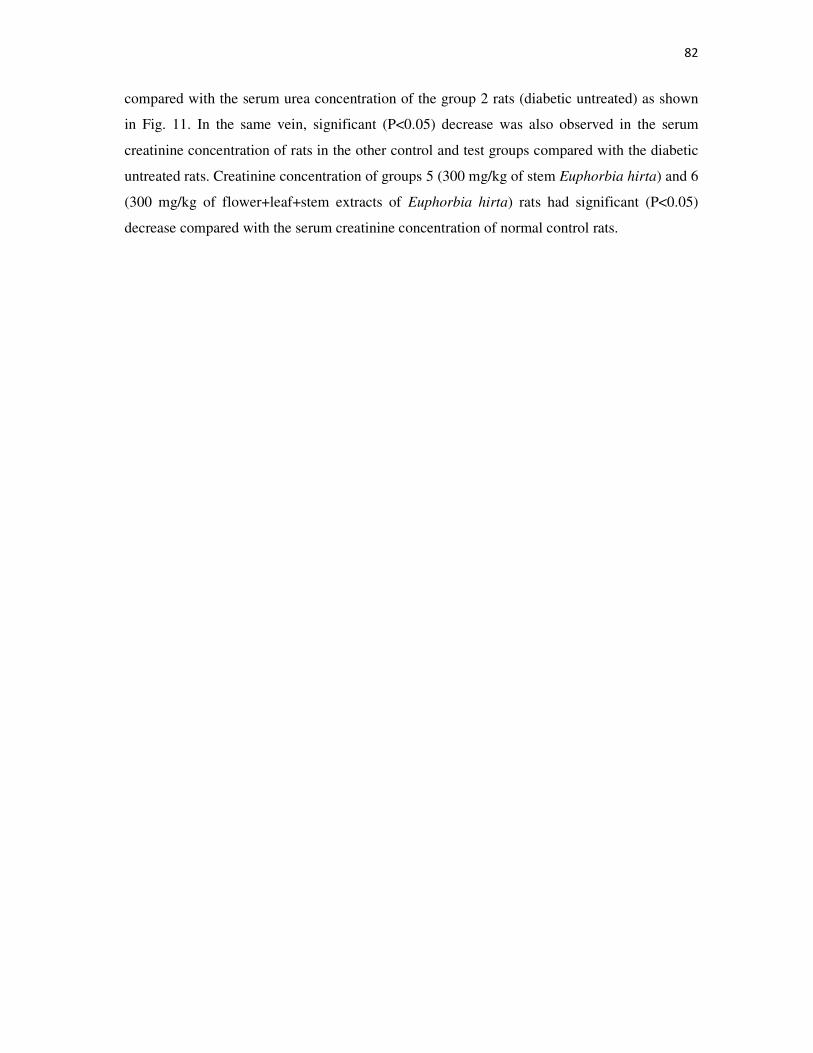
82
compared with the serum urea concentration of the group 2 rats (diabetic untreated) as shown
in Fig. 11. In the same vein, significant (P<0.05) decrease was also observed in the serum
creatinine concentration of rats in the other control and test groups compared with the diabetic
untreated rats. Creatinine concentration of groups 5 (300 mg/kg of stem Euphorbia hirta) and 6
(300 mg/kg of flower+leaf+stem extracts of Euphorbia hirta) rats had significant (P<0.05)
decrease compared with the serum creatinine concentration of normal control rats.
83
Fig. 11: Effect of ethanol extracts of Euphorbia hirta leaves, stem
and flowers on creatinine concentration in alloxan-induced diabetic
rats
0
0.5
1
1.5
2
2.5
3
Group 1 Group 2 Group 3 Group 4 Group 5 Group 6 Group 7
Group
Me
an
Cre
ati
nin
e C
on
c (
mg
/dl)
3.14 Effects of Ethanol Extracts of Euphorbia hirta on Serum Catalase Activity of
Normal and Diabetic Rats
Group 1 = Normal Control Group 2 = Diabetic Untreated
Group 3 = 300mg/kg b.w. of flower Euphorbia hirta Group 4 = 300mg/kg b.w. of leaf Euphorbia hirta
Group 5 = 300mg/kg b.w. of stem Euphorbia hirta Group 6 = 300mg/kg b.w. of flower+leaf+stem extract
Group 7 = Standard drug (0.01mg/kg b.w. of Voglibose)
84
Fig. 12 shows dose-dependent significant (P<0.05) increase in the serum catalase
activities of test rats in all the test groups and group 7 diabetic rats treated with the standard
drug compared with the serum urea concentration of the group 2 rats (diabetic untreated).
There was significant (P<0.05) decrease in the serum catalase activities of diabetic untreated
rats (group 2) compared with the serum catalase activities of normal control rats (group 1) as
shown in Fig. 12. Conversely, significant (P<0.05) increase was observed in the serum catalase
activities of the diabetic rats treated with the standard drug compared with the serum catalase
activities of normal control rats (group 1) and diabetic untreated rats. However, there was no
significant (P>0.05) difference in the serum catalase activities of rats in all the test groups
compared with the serum catalase activities of normal control group as shown in Fig. 12.
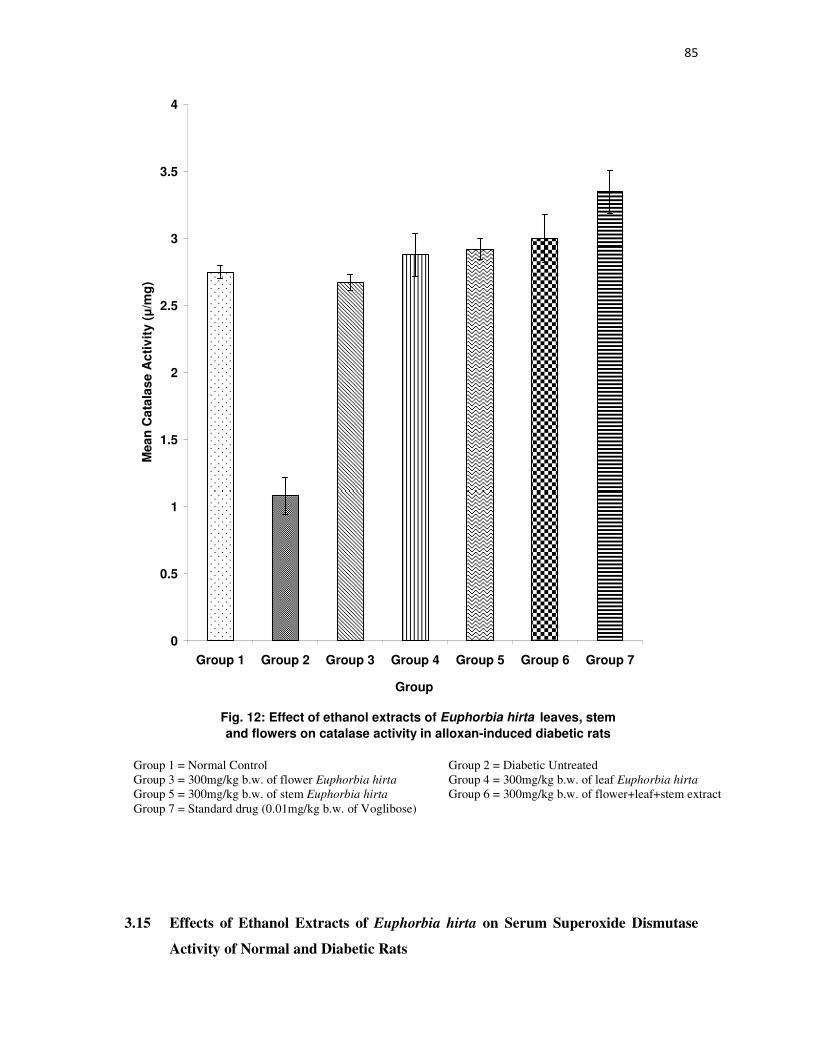
85
Fig. 12: Effect of ethanol extracts of Euphorbia hirta leaves, stem
and flowers on catalase activity in alloxan-induced diabetic rats
0
0.5
1
1.5
2
2.5
3
3.5
4
Group 1 Group 2 Group 3 Group 4 Group 5 Group 6 Group 7
Group
Mea
n C
ata
las
e A
cti
vit
y (µ
/mg
)
3.15 Effects of Ethanol Extracts of Euphorbia hirta on Serum Superoxide Dismutase
Activity of Normal and Diabetic Rats
Group 1 = Normal Control Group 2 = Diabetic Untreated
Group 3 = 300mg/kg b.w. of flower Euphorbia hirta Group 4 = 300mg/kg b.w. of leaf Euphorbia hirta
Group 5 = 300mg/kg b.w. of stem Euphorbia hirta Group 6 = 300mg/kg b.w. of flower+leaf+stem extract
Group 7 = Standard drug (0.01mg/kg b.w. of Voglibose)
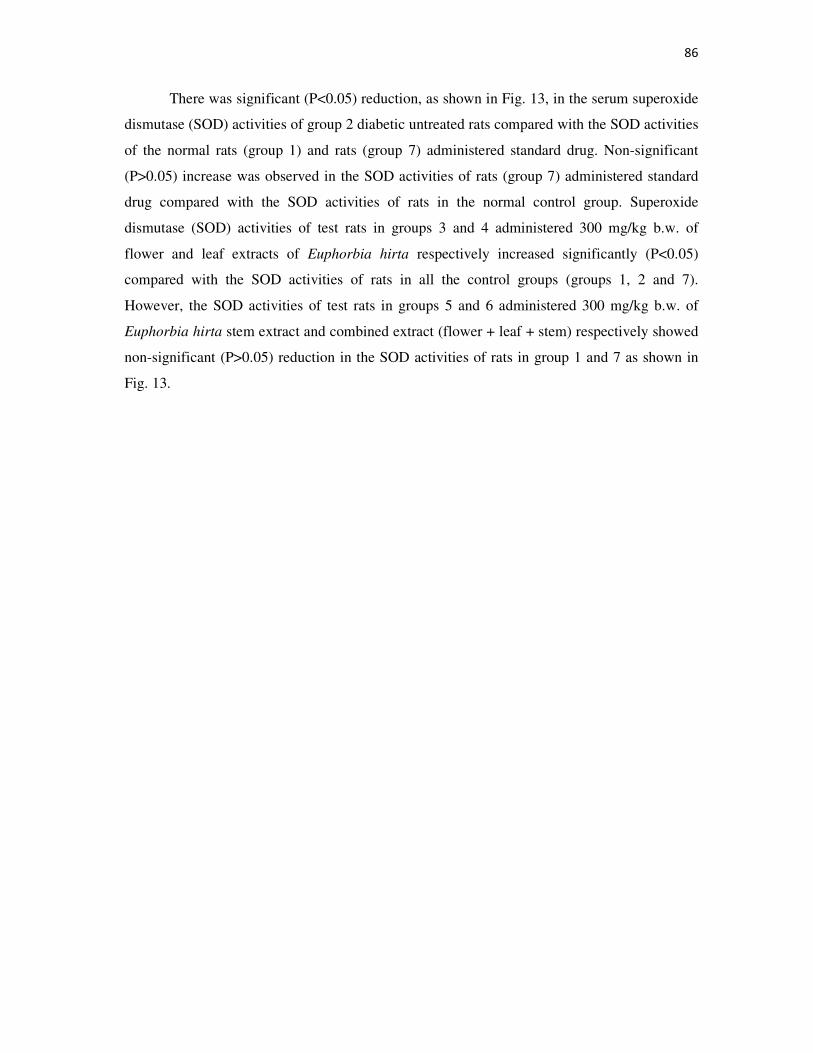
86
There was significant (P<0.05) reduction, as shown in Fig. 13, in the serum superoxide
dismutase (SOD) activities of group 2 diabetic untreated rats compared with the SOD activities
of the normal rats (group 1) and rats (group 7) administered standard drug. Non-significant
(P>0.05) increase was observed in the SOD activities of rats (group 7) administered standard
drug compared with the SOD activities of rats in the normal control group. Superoxide
dismutase (SOD) activities of test rats in groups 3 and 4 administered 300 mg/kg b.w. of
flower and leaf extracts of Euphorbia hirta respectively increased significantly (P<0.05)
compared with the SOD activities of rats in all the control groups (groups 1, 2 and 7).
However, the SOD activities of test rats in groups 5 and 6 administered 300 mg/kg b.w. of
Euphorbia hirta stem extract and combined extract (flower + leaf + stem) respectively showed
non-significant (P>0.05) reduction in the SOD activities of rats in group 1 and 7 as shown in
Fig. 13.
87
Fig. 13: Effect of ethanol extracts of Euphorbia hirta leaves, stem
and flowers on superoxide dismutase activity in alloxan-induced
diabetic rats
0
1
2
3
4
5
6
Group 1 Group 2 Group 3 Group 4 Group 5 Group 6 Group 7
Group
Me
an
SO
D A
cti
vit
y (µ
/mg
)
3.16 Effects of Ethanol Extracts of Euphorbia hirta on Serum Malondialdehyde
Concentration of Normal and Diabetic Rats
Observation carried out in Fig. 14 showed increased concentration of malondialdehyde
(MDA) in diabetic untreated rats (group 2) compared with the MDA concentration of rats in
Group 1 = Normal Control Group 2 = Diabetic Untreated
Group 3 = 300mg/kg b.w. of flower Euphorbia hirta Group 4 = 300mg/kg b.w. of leaf Euphorbia hirta
Group 5 = 300mg/kg b.w. of stem Euphorbia hirta Group 6 = 300mg/kg b.w. of flower+leaf+stem extract
Group 7 = Standard drug (0.01mg/kg b.w. of Voglibose)
88
groups 1 (normal control) 7 (standard drug). There was no significant (P>0.05) decrease in the
MDA concentration of rats in all the test groups except group 3 rats administered 300 mg/kg
b.w. of the flower extract compared with the MDA concentration of the normal control rats. On
the other hand, the MDA concentration of rats in all the test groups decreased significantly
(P<0.05) compared with the MDA concentration of diabetic untreated rats found in group 2.
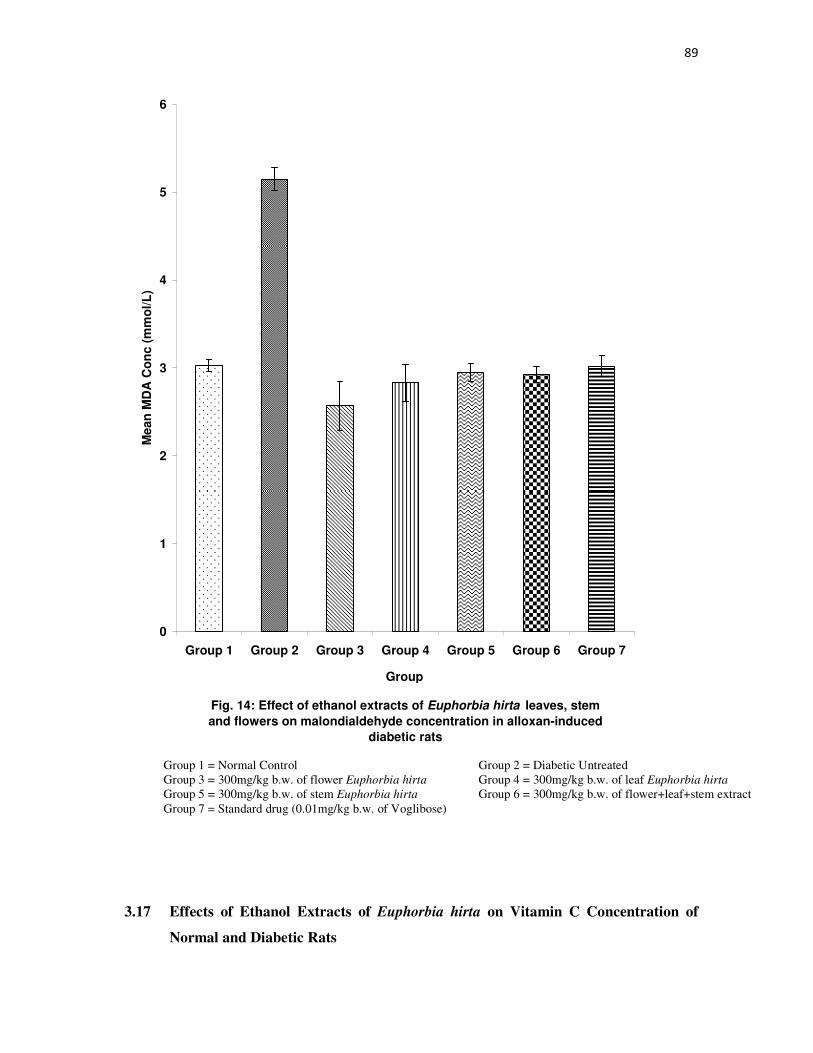
89
Fig. 14: Effect of ethanol extracts of Euphorbia hirta leaves, stem
and flowers on malondialdehyde concentration in alloxan-induced
diabetic rats
0
1
2
3
4
5
6
Group 1 Group 2 Group 3 Group 4 Group 5 Group 6 Group 7
Group
Me
an
MD
A C
on
c (
mm
ol/
L)
3.17 Effects of Ethanol Extracts of Euphorbia hirta on Vitamin C Concentration of
Normal and Diabetic Rats
Group 1 = Normal Control Group 2 = Diabetic Untreated
Group 3 = 300mg/kg b.w. of flower Euphorbia hirta Group 4 = 300mg/kg b.w. of leaf Euphorbia hirta
Group 5 = 300mg/kg b.w. of stem Euphorbia hirta Group 6 = 300mg/kg b.w. of flower+leaf+stem extract
Group 7 = Standard drug (0.01mg/kg b.w. of Voglibose)
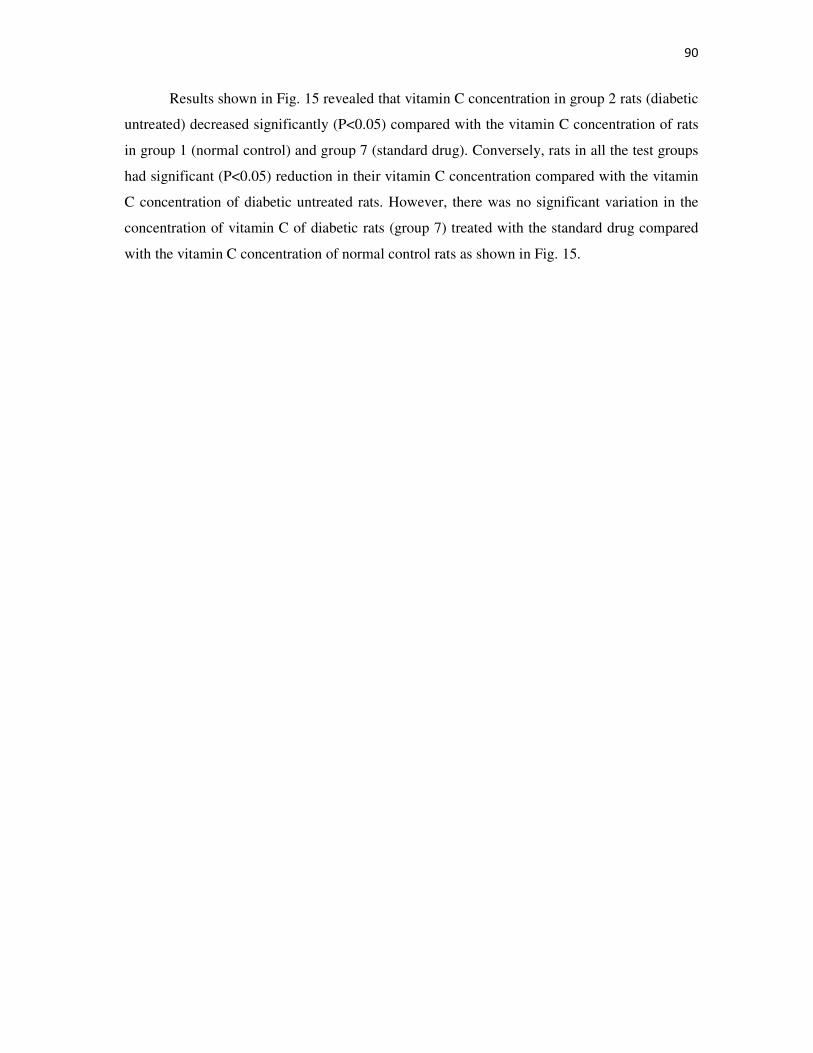
90
Results shown in Fig. 15 revealed that vitamin C concentration in group 2 rats (diabetic
untreated) decreased significantly (P<0.05) compared with the vitamin C concentration of rats
in group 1 (normal control) and group 7 (standard drug). Conversely, rats in all the test groups
had significant (P<0.05) reduction in their vitamin C concentration compared with the vitamin
C concentration of diabetic untreated rats. However, there was no significant variation in the
concentration of vitamin C of diabetic rats (group 7) treated with the standard drug compared
with the vitamin C concentration of normal control rats as shown in Fig. 15.
91
Fig. 15: Effect of ethanol extracts of Euphorbia hirta leaves, stem
and flowers on vitamin C concentration in alloxan-induced diabetic
rats
0
0.2
0.4
0.6
0.8
1
1.2
1.4
1.6
1.8
Group 1 Group 2 Group 3 Group 4 Group 5 Group 6 Group 7
Group
Mea
n V
it C
Co
nc
(m
g/d
l)
3.18 Effects of Ethanol Extracts of Euphorbia hirta on Body Glucose Concentration of
Normal and Diabetic Rats Before and After the Experiment
Group 1 = Normal Control Group 2 = Diabetic Untreated
Group 3 = 300mg/kg b.w. of flower Euphorbia hirta Group 4 = 300mg/kg b.w. of leaf Euphorbia hirta
Group 5 = 300mg/kg b.w. of stem Euphorbia hirta Group 6 = 300mg/kg b.w. of flower+leaf+stem extract
Group 7 = Standard drug (0.01mg/kg b.w. of Voglibose)
92
Fig. 16 shows significant (P<0.05) rise in the blood glucose concentration of rats in all
the test groups and other control groups compared with the blood glucose concentration of
normal control rats (group 1) before the experiment. However, there was neither significant
(P>0.05) increased nor decrease in the blood glucose concentration of rats in all the groups
compared with the blood glucose concentration of diabetic untreated rats (group 2) before the
experiment.
Significant (P<0.05) decrease was observed in the blood glucose concentration of rats
in all the groups compared with the blood glucose concentration of rats in the diabetic
untreated rats after the experiment as shown in Fig. 15. There was non-significant (P>0.05)
variation in the blood glucose concentration of rats in all the test groups and group 7 rats
(standard drug) compared with the blood glucose concentration of normal control rats.
Similarly, non-significant (P>0.05) change was observed in the blood glucose concentration of
across the test groups after the experiment as shown in Fig. 15.
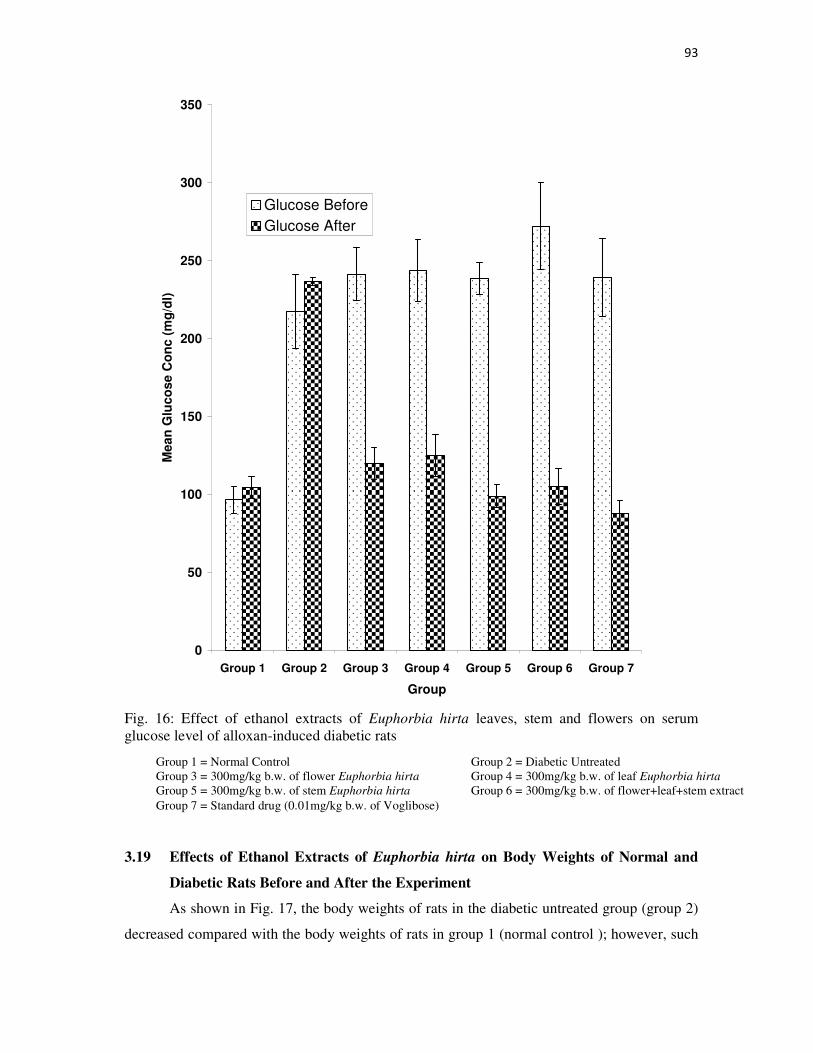
93
0
50
100
150
200
250
300
350
Group 1 Group 2 Group 3 Group 4 Group 5 Group 6 Group 7
Group
Me
an
Glu
co
se
Co
nc
(m
g/d
l)
Glucose Before
Glucose After
Fig. 16: Effect of ethanol extracts of Euphorbia hirta leaves, stem and flowers on serum
glucose level of alloxan-induced diabetic rats
3.19 Effects of Ethanol Extracts of Euphorbia hirta on Body Weights of Normal and
Diabetic Rats Before and After the Experiment
As shown in Fig. 17, the body weights of rats in the diabetic untreated group (group 2)
decreased compared with the body weights of rats in group 1 (normal control ); however, such
Group 1 = Normal Control Group 2 = Diabetic Untreated
Group 3 = 300mg/kg b.w. of flower Euphorbia hirta Group 4 = 300mg/kg b.w. of leaf Euphorbia hirta
Group 5 = 300mg/kg b.w. of stem Euphorbia hirta Group 6 = 300mg/kg b.w. of flower+leaf+stem extract
Group 7 = Standard drug (0.01mg/kg b.w. of Voglibose)
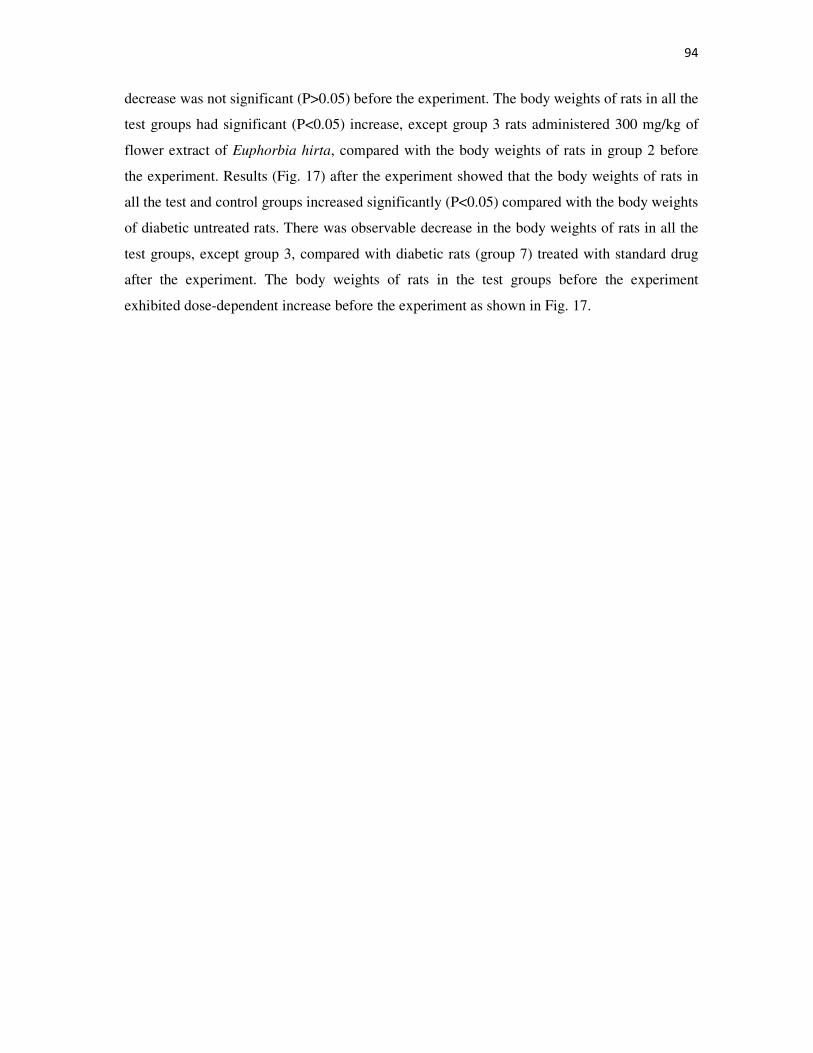
94
decrease was not significant (P>0.05) before the experiment. The body weights of rats in all the
test groups had significant (P<0.05) increase, except group 3 rats administered 300 mg/kg of
flower extract of Euphorbia hirta, compared with the body weights of rats in group 2 before
the experiment. Results (Fig. 17) after the experiment showed that the body weights of rats in
all the test and control groups increased significantly (P<0.05) compared with the body weights
of diabetic untreated rats. There was observable decrease in the body weights of rats in all the
test groups, except group 3, compared with diabetic rats (group 7) treated with standard drug
after the experiment. The body weights of rats in the test groups before the experiment
exhibited dose-dependent increase before the experiment as shown in Fig. 17.
95
0
50
100
150
200
250
300
Group 1 Group 2 Group 3 Group 4 Group 5 Group 6 Group 7
Group
Me
an
Bo
dy
We
igh
t (g
)
Weight Before
Weight After
Fig. 17: Effect of ethanol extracts of Euphorbia hirta leaves, stem and flowers on body weight
of alloxan-induced diabetic rats
3.20 Histopathological Examination
Group 1 = Normal Control Group 2 = Diabetic Untreated
Group 3 = 300mg/kg b.w. of flower Euphorbia hirta Group 4 = 300mg/kg b.w. of leaf Euphorbia hirta
Group 5 = 300mg/kg b.w. of stem Euphorbia hirta Group 6 = 300mg/kg b.w. of flower+leaf+stem extract
Group 7 = Standard drug (0.01mg/kg b.w. of Voglibose)
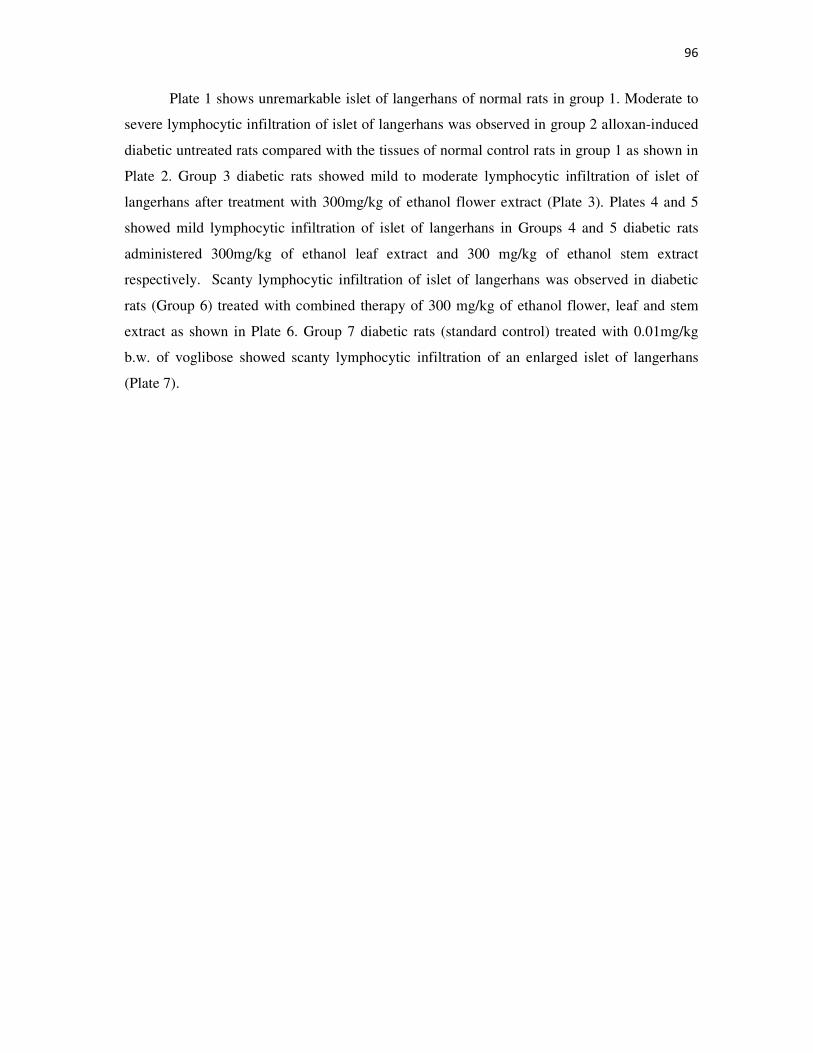
96
Plate 1 shows unremarkable islet of langerhans of normal rats in group 1. Moderate to
severe lymphocytic infiltration of islet of langerhans was observed in group 2 alloxan-induced
diabetic untreated rats compared with the tissues of normal control rats in group 1 as shown in
Plate 2. Group 3 diabetic rats showed mild to moderate lymphocytic infiltration of islet of
langerhans after treatment with 300mg/kg of ethanol flower extract (Plate 3). Plates 4 and 5
showed mild lymphocytic infiltration of islet of langerhans in Groups 4 and 5 diabetic rats
administered 300mg/kg of ethanol leaf extract and 300 mg/kg of ethanol stem extract
respectively. Scanty lymphocytic infiltration of islet of langerhans was observed in diabetic
rats (Group 6) treated with combined therapy of 300 mg/kg of ethanol flower, leaf and stem
extract as shown in Plate 6. Group 7 diabetic rats (standard control) treated with 0.01mg/kg
b.w. of voglibose showed scanty lymphocytic infiltration of an enlarged islet of langerhans
(Plate 7).
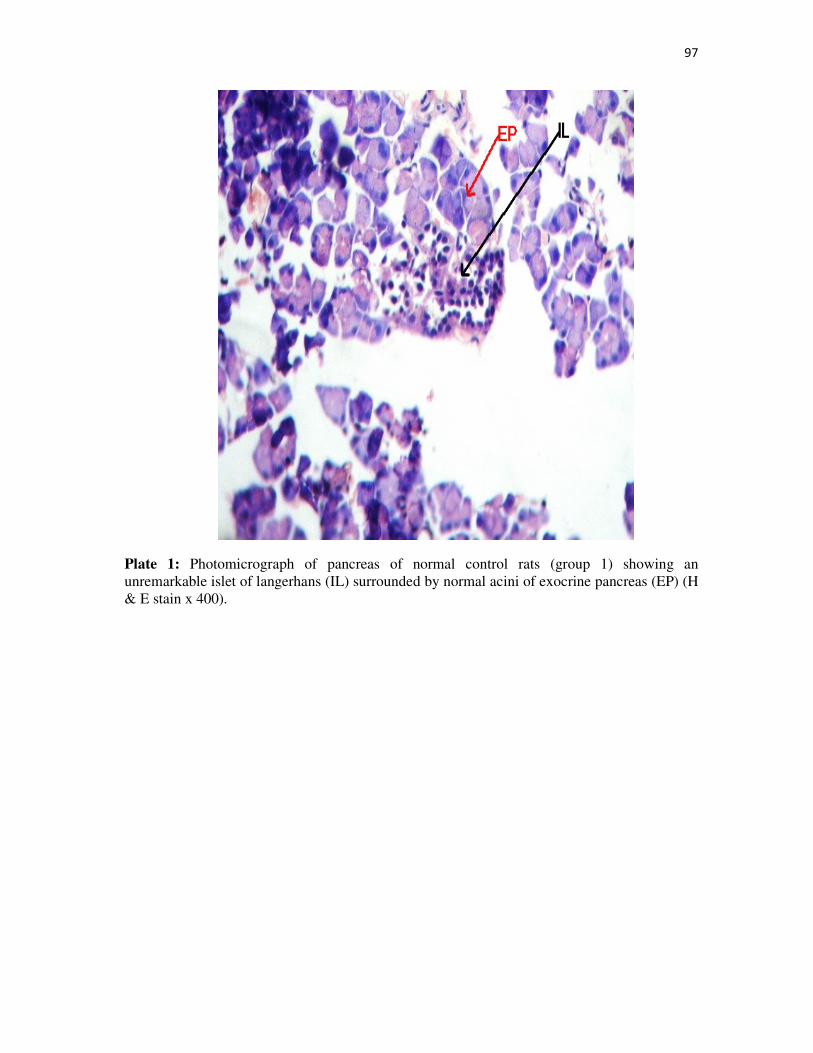
97
Plate 1: Photomicrograph of pancreas of normal control rats (group 1) showing an
unremarkable islet of langerhans (IL) surrounded by normal acini of exocrine pancreas (EP) (H
& E stain x 400).
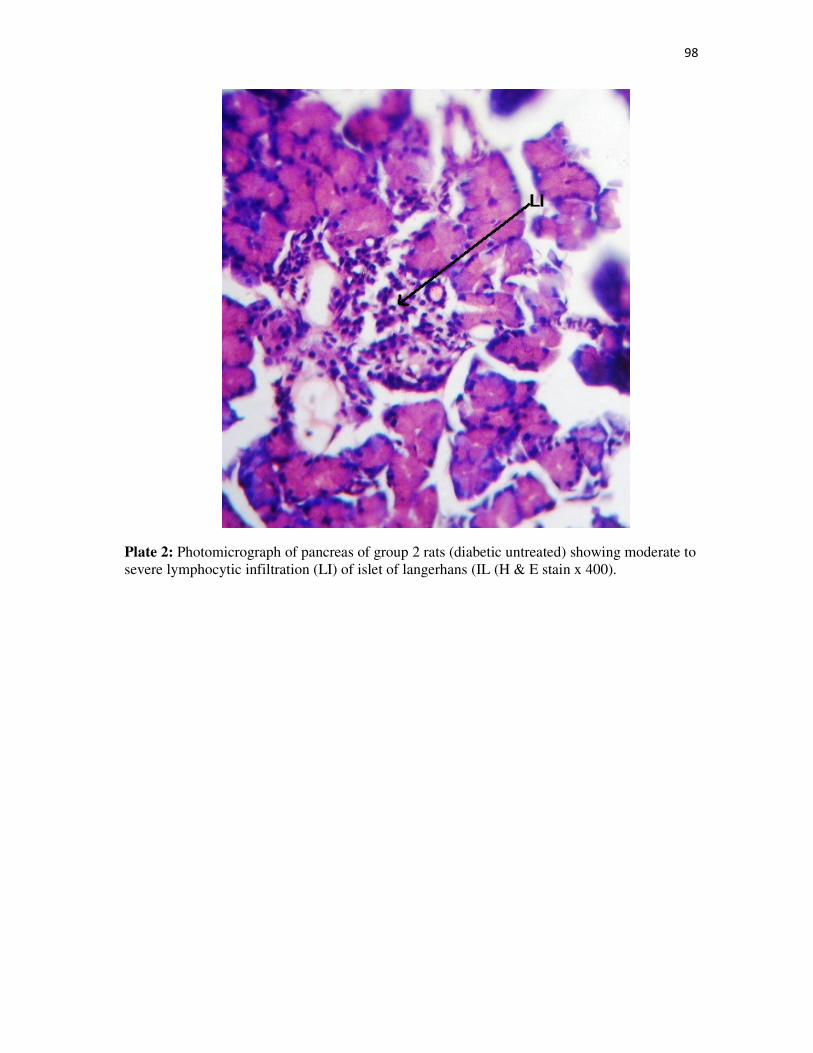
98
Plate 2: Photomicrograph of pancreas of group 2 rats (diabetic untreated) showing moderate to
severe lymphocytic infiltration (LI) of islet of langerhans (IL (H & E stain x 400).
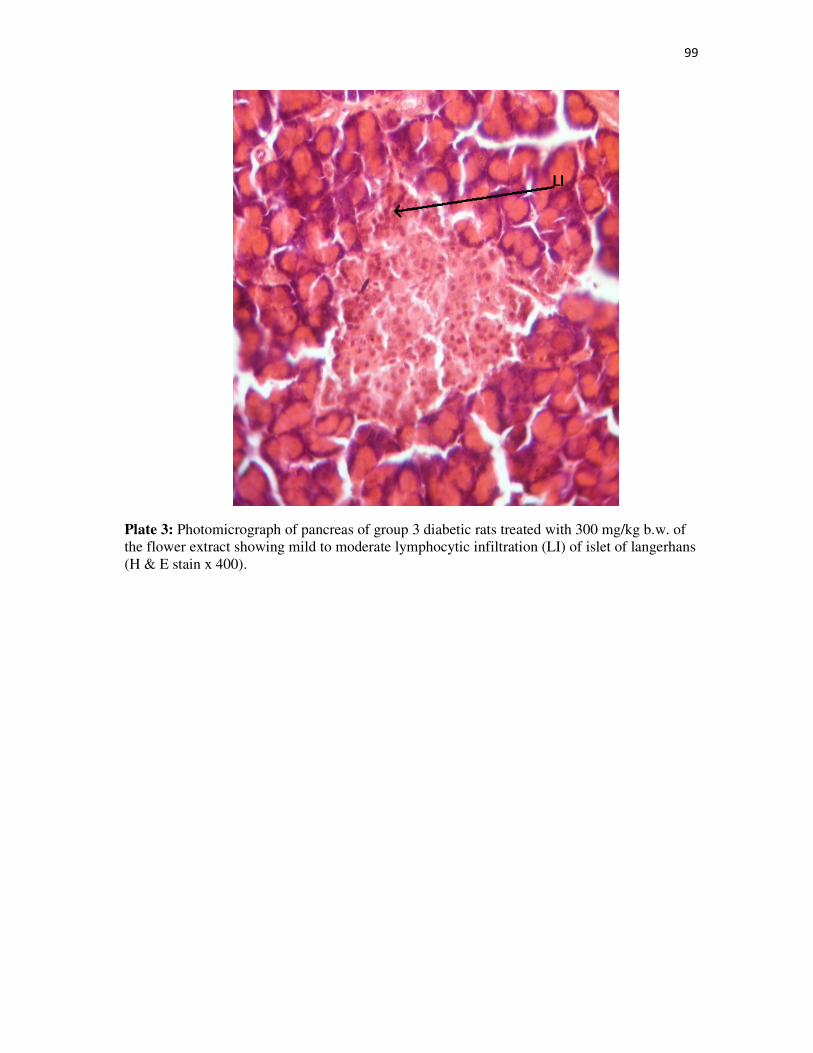
99
Plate 3: Photomicrograph of pancreas of group 3 diabetic rats treated with 300 mg/kg b.w. of
the flower extract showing mild to moderate lymphocytic infiltration (LI) of islet of langerhans
(H & E stain x 400).
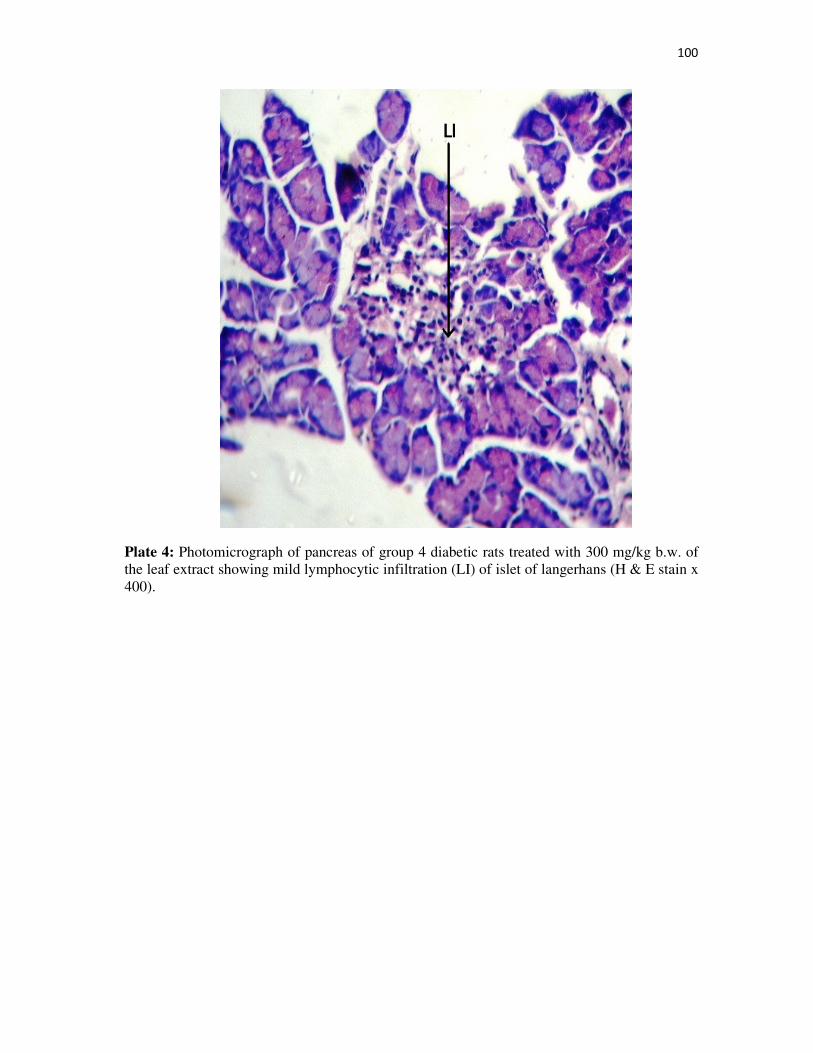
100
Plate 4: Photomicrograph of pancreas of group 4 diabetic rats treated with 300 mg/kg b.w. of
the leaf extract showing mild lymphocytic infiltration (LI) of islet of langerhans (H & E stain x
400).
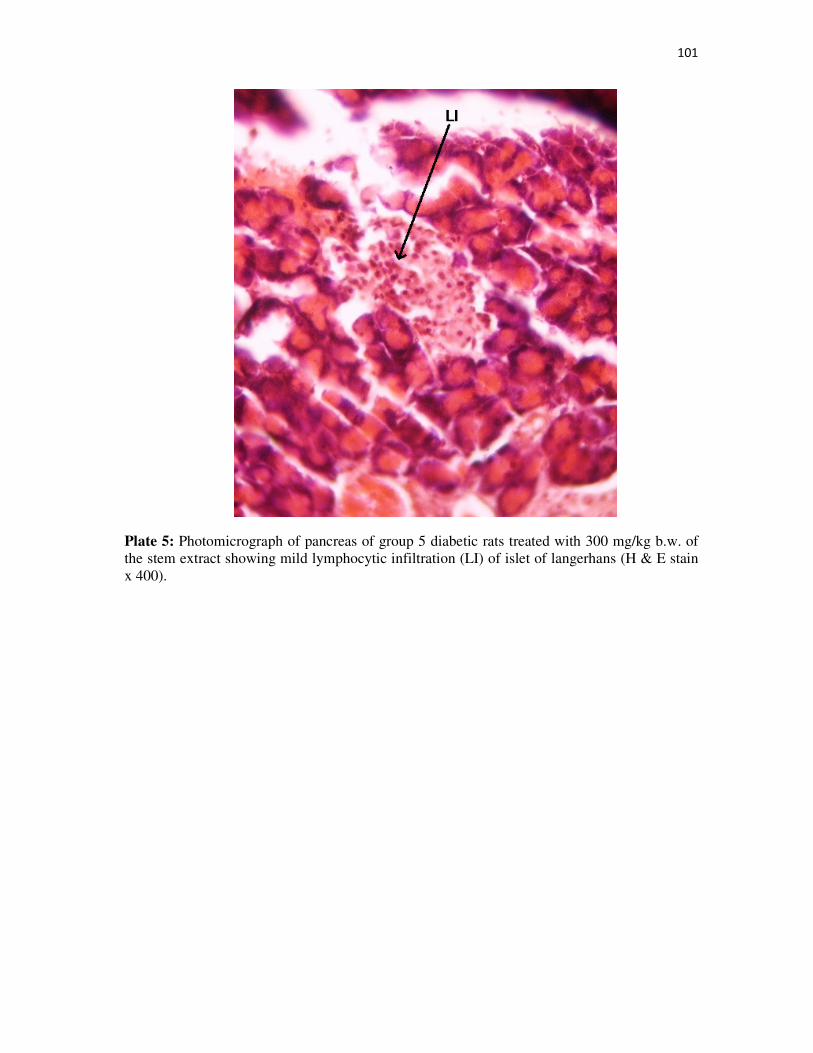
101
Plate 5: Photomicrograph of pancreas of group 5 diabetic rats treated with 300 mg/kg b.w. of
the stem extract showing mild lymphocytic infiltration (LI) of islet of langerhans (H & E stain
x 400).

102
Plate 6: Photomicrograph of pancreas of group 6 diabetic rats treated with 300 mg/kg b.w. of
flower, leaf and stem extracts showing scanty lymphocytic infiltration (LI) of islet of
langerhans (H & E stain x 400).
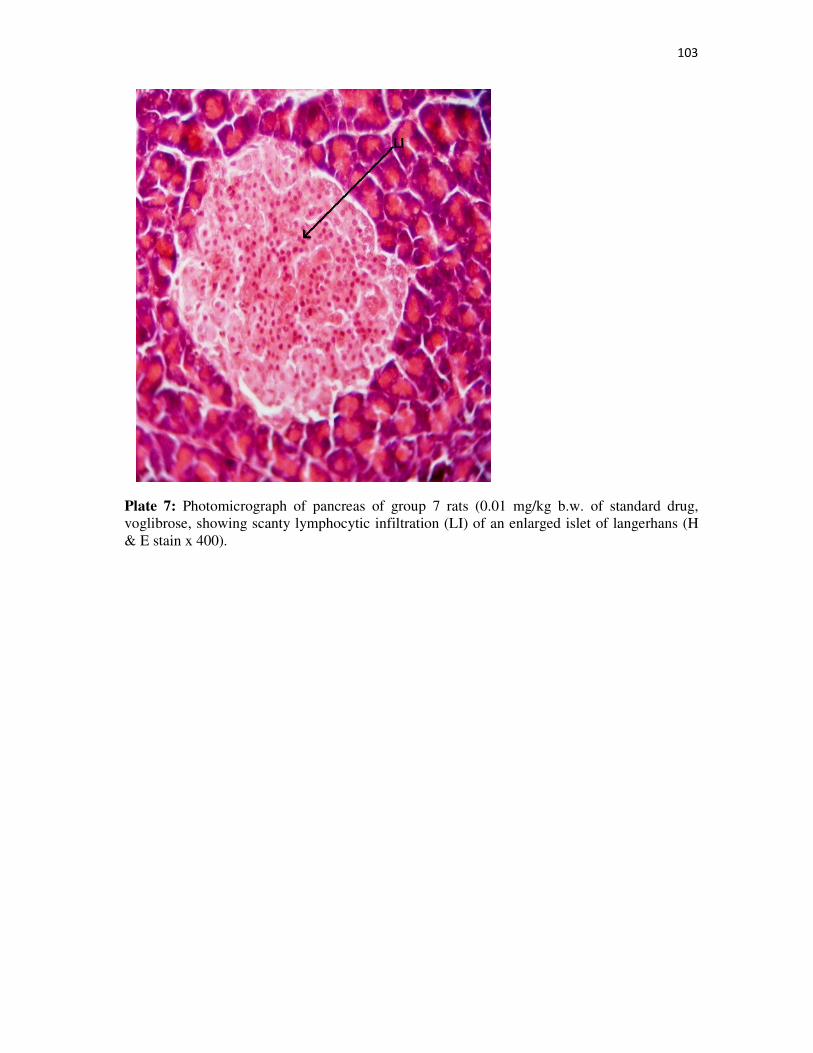
103
Plate 7: Photomicrograph of pancreas of group 7 rats (0.01 mg/kg b.w. of standard drug,
voglibrose, showing scanty lymphocytic infiltration (LI) of an enlarged islet of langerhans (H
& E stain x 400).
104
CHAPTER FOUR
DISCUSSION
The results of the experiment showed that there was significant increase (p<0.05) in the total
cholesterol concentration in group 2 rats (diabetic untreated) compared with normal control rats
(group 1). This increase in total cholesterol concentration can be attributed to diabetes-induced
hypercholesterolaemia (Mayne, 1991). Administration of 300 mg/kg b.w. of ethanol extracts of E. hirta
to rats in Groups 3 to 6, and 0.01 mg/kg b.w. of voglibose in rats in group 7 showed significant
reduction (p<0.05) in the total cholesterol concentration compared with rats in group 2 (diabetic
untreated). The decrease in total cholesterol is more pronounced in group which is a combination of
the three extracts. The significant decrease may be due to increased breakdown of the cholesterol in
the liver, and decreased absorption of cholesterol via the chylomicrons due to inhibition of α-
glucosidase enzymes. Conversely, there was significant decrease (p<0.05) in high density lipoprotein
(HDL)-cholesterol concentration in the Group 2 (Diabetic untreated) compared with Group 1 (normal
rats). This decrease may be due to the inhibition of HDL-C production in diabetes. However,
administration of ethanol extracts of E. hirta in Groups 3 to 6 and voglibose in Group 7 showed
significant increase in HDL-C concentration. This significant increase may be due to increase
cholesterol transport pathway (Nelson and Cox, 2008).
There was also significant increase (p<0.05) in low density lipoprotein (LDL-C)-cholesterol
concentration in Group 2 (diabetic untreated) compared with Group 1 (normal control rats). This can
be attributed to increase in concentration LDL-C resulting from diabetes induction. However, there
was corresponding significant decrease (p<0.05) in LDL-C with the administration of 300 mg/kg b.w. of
ethanol extracts of E. hirta to rats in Groups 3 to 6 and 0.01 mg/kg b.w. of voglibose to rats in Group 7
compared with diabetic untreated rats (Group 2). This decrease is more in Group 6 rats which were
administered a mixture of the three ethanol extracts. This significant decrease in LDL-C may be due to
the increase in the reverse cholesterol transport pathway, and decreased cholesterol concentration
from the intestine in the chylomicrons due to α-glucosidase inhibition. Similarly, there was significant
increase (p<0.05) in triacylglycerol concentration in Group 2 (Diabetic untreated) compared with the
normal untreated rats (Group 1). This may be due to diabetes-induced hypertriglyceridaemia.
However, administration of 300 mg/kg b.w. of ethanol extracts of E. hirta to rats in Groups 3
to 6 and 0.01 mg/kg b.w. of voglibose to rats in Group 7 caused significant reduction (p<0.05) in the
triacylglycerol concentration. This decrease in LDL-C concentration is more in Group 6 which is a
105
combination of the three ethanol extracts. This significant decrease in LDL-C may be attributed to the
reduced absorption of the triacylglycerol rich chylomicrons from the intestinal brush borders due to
inhibition of the α-glucosidase in the brush borders. Voglibose has also been postulated to decrease
triacylglycerol (Satoh et al., 2006).
It can be noticed that there was non-significant change (p>0.05) in the sodium ion
concentration in diabetic untreated rats (Group 2) compared with rats in normal control group. This
may be due to the fact that diabetes may not have a direct effect on serum sodium ion concentration.
However, administration of 300 mg/kg b.w. of ethanol extracts of E. hirta to rats in Groups 3 to 6 and
0.01 mg/kg b.w. of voglibose to rats Group 7 resulted in significant reduction (p<0.05) in serum
sodium ion concentration. The relative hyponatraemia may be due to the diuretic property of E. hirta
ethanol extracts which is related to the angiotensin converting enzyme inhibition (Edwards et al.,
1995).
Furthermore, there was significant increase (p<0.05) in serum potassium ion concentration in
diabetic untreated rats (Group 2) compared with the potassium ion concentration of normal rats
(Group 1). This may be due to diabetes induced hyperkalaemia due to poorly controlled diabetes with
possibilities of diabetic ketoacidosis resulting (Mayne, 1991). However, there were no significant
change (p<0.05) in serum potassium concentration on administration of 300 mg/kg b.w. of ethanol
extracts of E. hirta to rats in Group 3 to 6 and 0.01 mg/kg b.w. of voglibose to rats in Group 7. The loss
of significance in potassium ion concentration shows that neither ethanol extracts of E. hirta nor
voglibose has effect on the serum potassium ion concentration. Moreover, there was a significant
increase (p<0.05) in serum chloride ion concentration in diabetic untreated animals compared with
the animals in the normal control group. This may be attributed to diabetes-induced hyperchloraemic
acidosis where sodium is reabsorbed with chloride ion in the tubules, in exchange with hydrogen ion
or potassium ion (Mayne, 1991). When ethanol extracts of E. hirta were added to Groups 3 to 6, there
was significant reduction in serum chloride ion concentration compared with rats in diabetic
untreated group. This may be attributed to the diuretic effect of E. hirta extract where sodium and
chloride ions are exchanged for potassium and hydrogen ions respectively. However, the
administration of 0.01 mg/kg b.w. of voglibose to rats in Group 7 showed non-significant change
(p>0.05) in the serum chloride ion concentration compared with the chloride ion concentration of
Group 2 rats (diabetic untreated).
Furthermore, there was no significant change (p>0.05) in the serum HCO3– concentration in
diabetic untreated rats (Group 2) compared with HCO3– concentration of normal rats (Group 1). Also,
there was no significant change (p>0.05) in HCO3– concentration when 300 mg/kg b.w. of the ethanol
106
extracts were administered to rats in Groups 3 to 6 and 0.01 mg/kg b.w. of voglibose to rats in Group
7 compared with HCO3– concentration of diabetic untreated rats (Group 2). Conversely, there was
significant increase (p<0.05) in the serum urea concentration in diabetic untreated rats (Group 2)
compared with urea concentration of normal untreated rats (Group 1). This may be attributed to the
acute phase of diabetic nephropathy with reduction in the glomerular filtration rate (Mayne, 1991).
However, there were significant decrease (p<0.05) in the serum urea concentration when ethanol
extracts of E. hirta were added to Groups 3 to 6 and voglibose to Group 7 compared with diabetic
untreated rats (Group 2) which is an indication of the resolution of the acute phase of diabetic-
induced nephropathy.
Moreover, there was significant increase (p<0.05) in the serum creatinine concentration in
diabetic untreated rats (Group 2) compared with Group 1 (normal control rats). This may be due to
diabetes-induced nephropathy with reduced GFR. However, administration of ethanol extracts of E.
hirta to Groups 3 to 6 and voglibose to Group 7 caused significant reduction in the serum creatinine
concentration. This is a clear indication of the resolution of the acute phase of diabetes induced
nephropathy.
There was significant decrease (p<0.05) in the serum catalase activity in Group 2 (diabetic
untreated rats) compared with Group 1 normal control rats. This may be attributed to the increasing
production of free radicals due to the diabetic state (Oberley, 1988). However, there were significant
increases (p<0.05) in the serum catalase activity when ethanol extracts of E. hirta were added to
Groups 3 to 6 and voglibose to Group 7 compared with diabetic untreated rats. This can be caused by
the scavenging action of the ethanol extracts of E. hirta. Voglibose caused highest increase in serum
catalase activity as it has been known for its ability to reduce oxidative stress (Satoh et al., 2006).
Significant decrease (p<0.05) was observed in the serum superoxide dismutase activity of
group 2 diabetic untreated compared with normal control rats (Group 1). This may be attributed to
the increased production of free radicals due to the diabetic state. On administration of 300 mg/kg
b.w. of ethanol extracts of E. hirta to rats in Groups 3, 4, 5 and 6, and 0.01 mg/kg b.w. of voglibose to
Group 7, there was significant increase (p<0.05) in the serum superoxide dismutase (SOD) activity
compared with diabetic untreated rats (Group 2). This can be caused by the antioxidant scavenging
action of the ethanol extracts of E. hirta.
Nevertheless, there was significant increase (p<0.05) in the malondialdehyde (MDA)
concentration in diabetic untreated rats (Group 2) compared with the MDA concentration of Group 1
animals (normal rats). This may be due to increased lipid peroxidation (Gallou et al., 1993) which was
107
induced by diabetes resulting in increased reactive oxygen species (Baynes, 1991). When 300 mg/kg
b.w. of ethanol extracts of E. hirta was administered to rats in Groups 3, 4, 5 and 6, and 0.01 mg/kg
b.w. of voglibose to Group 7, there was significant decrease (p<0.05) in MDA concentration compared
with diabetic untreated rats (Group 2). This could be attributed to the antioxidant scavenging activities
of ethanol extracts of E. hirta resulting in reduced lipid peroxidation.
Finally, there was significant reduction in vitamin C concentration in Group 2 (diabetic
untreated) compared with the normal control animals. This is due to diabetes-induced free radical
production. However, when 300 mg/kg. b.w. of ethanol extracts of E. hirta were administered to rats
in Groups 3, 4, 5 and 6, and 0.01 mg/kg b.w. voglibose to Group 7 rats, there were significant increases
(p<0.05) in vitamin C concentration compared with the normal control rats (Group 2). This may be
caused by the antioxidant scavenging action of ethanol extracts of E. hirta.
It can be observed that there was significant increase (p<0.05) in blood glucose concentration
in rats of Groups 2 to 7 before the administration of 300 mg/kg b.w. of ethanol extract of E. hirta and
0.01 mg/kg b.w. of voglibose compared with Group 1 (normal rats). This increase in blood glucose
could be attributed to the induction of diabetes with alloxan in the respective groups.
However, when 300 mg/kg b.w. of ethanol extracts of E. hirta were administered to rats in
Groups 3, 4, 5 and 6, and 0.01 mg/kg b.w. of voglibose to rats in Group 7, there were significant
decreases (p<0.05) in the blood glucose concentration after the administration of the extracts to the
rats compared with Group 2 rats (diabetic untreated). This has shown that ethanol extracts of E. hirta
and voglibose exhibit hypoglycaemic activities (Kim et al., 2004).
It can be observed that before the administration of 300 mg/kg b.w. of ethanol extracts of E.
hirta and 0.01 mg/kg b.w. of voglibose, there was significant increase (p<0.05) in the body weights of
rats in Groups 4, 5, 6 and 7 with non-significant increase (p>0.05) in the body weights of rats in Group
3 compared with the body weights of normal control rats. There was no significant change (p<0.05) in
the body weights of diabetic untreated rats (Group 2) compared with the body weights of rats in
Group 1 (normal control). However, after the administration of 300 mg/kg b.w. of ethanol extracts of
E. hirta to rats in Groups 3, 4, 5 and 6, and 0.01 mg/kg b.w. voglibose to Group 7, there was significant
increase (p<0.05) in body weights of all rats in Groups 1, 3, 4, 5, 6 and 7 compared with diabetic
untreated rats (Group 2). The increase in Group 1 can be attributed to normal growth to normal feed
high in carbohydrate and fats while increase in Group 3 to 7 was probably due to increases
glycogenesis and lipogenesis with diabetes treatment.
108
The induction of diabetes by alloxan in the diabetes rats (as shown in Rats 2 of Plate 2) caused
destruction of the islet of Langerhans which histologically resulted in moderate to severe infilteration
of the islet of Langerhans by lymphocytes (shown by the multiple black spots in the islets on Plate 2
when compared with Plate 1).
However, addition of different ethanol extracts of Euphorbia hirta resulted in resolution of the
damage on the islets of Langerhans which is shown histologically by reduction in lyphocytic
infilteration (black spots) of the islets of Langerhans. This results in mild to moderate lymphocytic
infiltration when flower extract was added (plate 3), mild lymphocytic infiltration when leaf and stem
extracts were added (Plates 4 & 5) and scanty lymphocytic infiltration when equal mixture of flower,
leaf and stem extracts and voglibose (standard drug) were added (Plates 6 & 7).
These resolutions tend to restore the insulin secretory capacity of the islets of Langerhans, reverses
the diabetic condition with reversal of biochemical parameters in rats of Groups 3 to 7 towards
normal ranges when compared with diabetic untreated rats in Group 2.
4.2 CONCLUSION
From the results of the tests, we can deduce that the 300 mg/kg. b.w. of ethanol extracts of
Euphorbia hirta has lipid lowering activity by reducing serum total cholesterol, triacylglycerol and low
density lipoprotein-cholesterol while increasing high density lipoprotein-cholesterol concentrations by
increasing the reverse cholesterol transport pathway. Dose of 300 mg/kg b.w. of ethanol extracts of E.
hirta also improves renal function by reducing serum urea and creatinine concentrations; hence,
reducing incidences of acute diabetic nephropathy. Ethanol extracts (300 mg/kg b.w.) of E. hirta
exhibit antioxidant scavenging action by increasing catalase and superoxide dismutase activities, and
vitamin C concentration; thereby reducing malondialdehyde concentration, hence reducing lipid
peroxidation. Finally, 300 mg/kg b.w. of ethanol extracts of E. hirta has hypoglycaemic action which
are identical to the hypoglycaemic action of voglibose via α-glucosidase inhibition. The decrease in
serum Na+ and Cl
– concentrations has shown that ethanol extracts of E. hirta exhibits diuretic
peoperties which is suspected to be due to the inhibition of the angiotensin converting enzyme.
4.3 RECOMMENDATIONS
Further experiments have to be done to fractionate and elucidate the different compounds of
the ethanol extracts of the flower, leaf and stem of Euphorbia hirta so as to identify the actual

109
component(s) of the herb with the diuretic, hypoglycaemia, lipid lowering, antioxidative activities with
reduced urea and creatinine profile. Comparison with other antidiabetic drugs like glibenclamide,
metformin and soluble insulin should be undertaken to access the extent of hypoglycaemic actions of
ethanol extracts of E. hirta and the extent of reduction of diabetic complications.

110