
CHUFSD Official Budget Statement
31
CROTON-HARMON UNION FREE SCHOOL DISTRICT OFFICIAL BUDGET STATEMENT FOR THE 2019-2020 SCHOOL YEAR Additional copies available from: Board of Education Croton-Harmon UFSD Iris Cross-Bugliosi, President 10 Gerstein Street Andrea Furey, Vice-President Croton-on-Hudson, NY 10520 Sarah Carrier (914) 271-4713 Joshua M. Diamond Neal D. Haber Brian Loges Elizabeth Lynam PLEASE DO NOT REMOVE THIS COPY. You may review the report by going to the district website or you may request a copy by contacting Denise Harrington-Cohen, Assistant Superintendent for Business at 914-271-4713, extension 4211 or [email protected] For further information on school report card please go to: data.nysed.gov
Transcript of CHUFSD Official Budget Statement

CROTON-HARMON UNION FREE SCHOOL DISTRICT
OFFICIAL BUDGET STATEMENT
FOR THE 2019-2020
SCHOOL YEAR
Additional copies available from: Board of Education
Croton-Harmon UFSD Iris Cross-Bugliosi, President 10 Gerstein Street Andrea Furey, Vice-President Croton-on-Hudson, NY 10520 Sarah Carrier (914) 271-4713 Joshua M. Diamond
Neal D. Haber Brian Loges Elizabeth Lynam
PLEASE DO NOT REMOVE THIS COPY.
You may review the report by going to the district website or you may request a copy by contacting Denise Harrington-Cohen, Assistant Superintendent for Business at 914-271-4713, extension 4211 or [email protected]
For further information on school report card please go to: data.nysed.gov

4/26/2019 New York State Education Department State Aid Management System (SAMS)
https://eservices.nysed.gov/sams/printForm.do?method=printForm&fsId=830&segmentKey=1556309622185 1/3
Property Tax Report Card 2018-2019 - Page 1
660202 - CROTON-HARMON UFSD Official - as of 04/26/2019 04:14PM
****Please use Chrome or Firefox browsers when entering the Business Portal to complete the PTRC. InternetExplorer is NOT recommended.*****
Note: Some data elements of the Property Tax Report Card have been revised or renamed to more closelyfollow the Property Tax Cap calculations districts complete on the Office of the State Comptroller website.Please see the Help text above for definitions. Additional guidance on the Property Tax Levy Limit is availableon the Office of Educational Management Services website:http://www.p12.nysed.gov/mgtserv/propertytax/taxcap/.
Please also submit an electronic version (PDF or Word) of your school district's 2019-20 Budget Notice to:[email protected]. This will enable us to help correct any formula or data entry discrepancy quickly.
Notice: The Enacted Budget allows school districts to establish a reserve fund for NYS Teachers' RetirementSystem Contributions, effective immediately. This reserve, if applicable, should be reported in the Schedule ofReserves under 'Other Reserve' and with a description that says: "To fund employer retirement contributionsto the New York State Teachers' Retirement System (TRS.)"
Form Due - April 29, 2019
Form Preparer Name: DENISE HARRINGTON-COHENPreparer's Telephone Number: 914-271-4713
Shaded Fields Will CalculateBudgeted2018-19
(A)
Proposed Budget2019-20
(B)
PercentChange
(C)
Total Budgeted Amount, not including Separate Propositions 47,172,204 48,513,218 2.84 %A. Proposed Tax Levy to Support the Total Budgeted Amount1 39,080,561 40,159,191B. Tax Levy to Support Library Debt, if Applicable 0 0C. Tax Levy for Non-Excludable Propositions, if Applicable2 0 0D. Total Tax Cap Reserve Amount Used to Reduce CurrentYear Levy, if
Applicable0 0
E. Total Proposed School Year Tax Levy (A+B+C-D) 39,080,561 40,159,191 2.76 %F. Permissible Exclusions to the School Tax Levy Limit 2,128,197 2,404,000G. School Tax Levy Limit, Excluding Levy for PermissableExclusions3
37,045,344 40,159,191
H. Total Proposed Tax Levy for School Purposes, ExcludingPermissible
Exclusions and Levy for Library Debt, Plus Prior Year TaxCap Reserve (E-B-F+D)
36,952,364 37,755,191
I. Difference: (G-H);(negative value requires 60.0% voterapproval)2
92,980 2,404,000
Public School Enrollment 1,576 1,581 0.32 %Consumer Price Index 2.44 %
1 Include any prior year reserve for excess tax levy, including interest.
2 Tax levy associated with educational or transportation services propositions are not eligible for exclusion under theSchool Tax Levy Limit and may affect voter approval requirements.
4/26/2019 New York State Education Department State Aid Management System (SAMS)
https://eservices.nysed.gov/sams/printForm.do?method=printForm&fsId=830&segmentKey=1556309622185 2/3
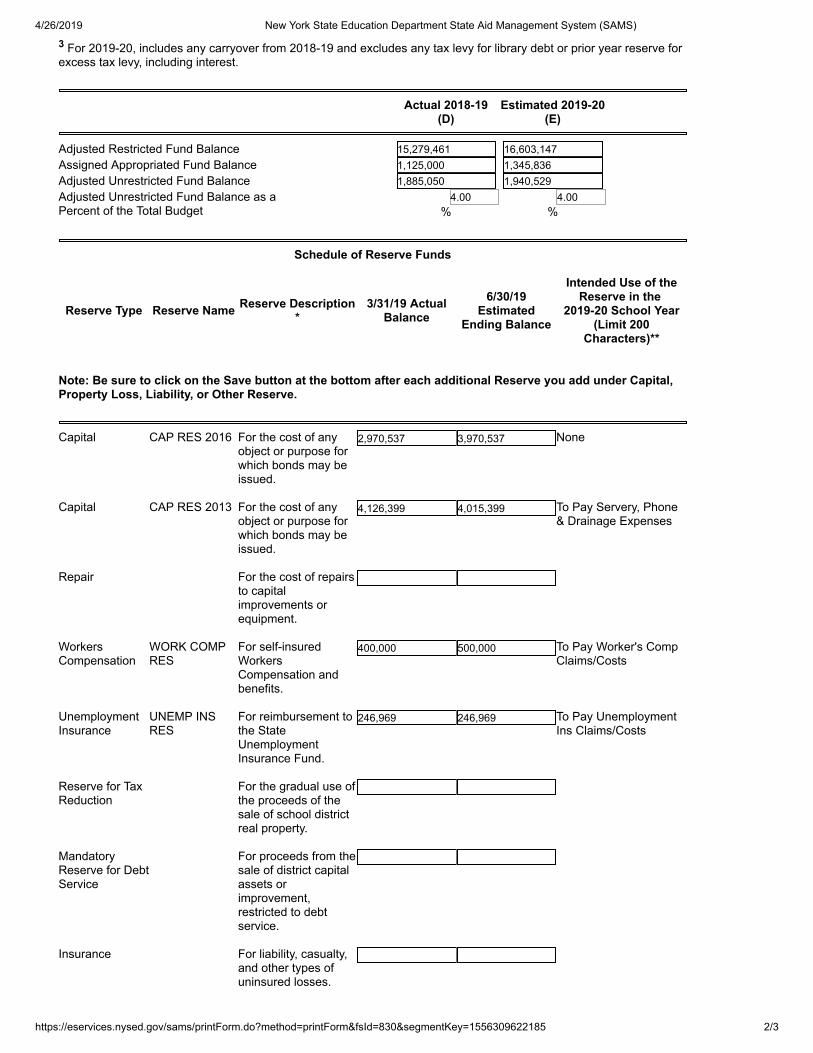
3 For 2019-20, includes any carryover from 2018-19 and excludes any tax levy for library debt or prior year reserve forexcess tax levy, including interest.
Actual 2018-19 (D)
Estimated 2019-20 (E)
Adjusted Restricted Fund Balance 15,279,461 16,603,147Assigned Appropriated Fund Balance 1,125,000 1,345,836Adjusted Unrestricted Fund Balance 1,885,050 1,940,529Adjusted Unrestricted Fund Balance as a
Percent of the Total Budget 4.00
% 4.00
%
Schedule of Reserve Funds
Reserve Type Reserve Name Reserve Description*
3/31/19 ActualBalance
6/30/19Estimated
Ending Balance
Intended Use of theReserve in the
2019-20 School Year (Limit 200
Characters)** Note: Be sure to click on the Save button at the bottom after each additional Reserve you add under Capital,Property Loss, Liability, or Other Reserve.
Capital CAP RES 2016 For the cost of anyobject or purpose forwhich bonds may beissued.
2,970,537 3,970,537 None
Capital CAP RES 2013 For the cost of any
object or purpose forwhich bonds may beissued.
4,126,399 4,015,399 To Pay Servery, Phone& Drainage Expenses
Repair For the cost of repairs
to capitalimprovements orequipment.
WorkersCompensation
WORK COMPRES
For self-insuredWorkersCompensation andbenefits.
400,000 500,000 To Pay Worker's CompClaims/Costs
UnemploymentInsurance
UNEMP INSRES
For reimbursement tothe StateUnemploymentInsurance Fund.
246,969 246,969 To Pay UnemploymentIns Claims/Costs
Reserve for TaxReduction
For the gradual use ofthe proceeds of thesale of school districtreal property.
MandatoryReserve for DebtService
For proceeds from thesale of district capitalassets orimprovement,restricted to debtservice.
Insurance For liability, casualty,
and other types ofuninsured losses.

4/26/2019 New York State Education Department State Aid Management System (SAMS)
https://eservices.nysed.gov/sams/printForm.do?method=printForm&fsId=830&segmentKey=1556309622185 3/3
Property Loss + (add)
To cover propertyloss.
Liability + (add)
RES FORLIABILITY
To cover incurredliability claims.
198,061 198,061 To Pay Potential LegalSettlements
Tax Certiorari RES FOR TAX
CERTSFor tax certiorarisettlements.
4,978,071 5,378,071 To Pay Potential TaxSettlements
Reserve forInsuranceRecoveries
For unexpendedproceeds of insurancerecoveries at fiscalyear end.
EmployeeBenefit AccruedLiability
EMP ACRBNFTLIAB
For accrued'employee benefits'due to employeesupon termination ofservice.
433,473 483,473 To Pay Accrued Leavefor Retirees
RetirementContribution
ERS RESERVE For employerretirementcontributions to theState and LocalEmployees'Retirement System.
1,245,453 1,345,453 To Pay Pension Contribto Emp Retirement Sys
Reserve forUncollectedTaxes
For unpaid taxes duecertain city schooldistricts notreimbursed by theircity/county until thefollowing fiscal year.
Single OtherReserve
TRS RESERVE For Teachers RetContributions
0 250,000 To Pay Pension Contribto Teach Ret Sys
* NYSED Reserve Guidance:http://www.p12.nysed.gov/mgtserv/accounting/docs/reserve_funds.pdf OSC Reserve Guidance:http://osc.state.ny.us/localgov/pubs/listacctg.htm#reservefunds **Provide a brief, but specific, statement of the planned use and appropriation for the reserve in SY 2019-20.Mention any capital expenditures that will need to be voted upon in the upcoming Budget Vote.
Save Reset Save & Ready


Page 1
'State Category (3-Part Budget) Report'
Croton-Harmon UFSD
Fiscal Year: 2020
3:42:03 pm
April 20, 2019
2018-2019
Adopted Proposed
Budget Budget
2019-2020
DescriptionState Function
Administration
1010 Board Of Education 27,800.00 32,800.00
1040 District Clerk 36,500.00 105,900.00
1060 District Meeting - -
1240 Chief School Administrator 374,128.00 369,544.00
1310 Business Administration 483,926.00 457,769.00
1320 Auditing 67,500.00 67,500.00
1325 Treasurer 90,411.00 91,513.00
1380 Fiscal Agent Fee 10,000.00 15,000.00
1420 Legal 177,000.00 167,000.00
1430 Personnel 207,829.00 182,661.00
1460 Records Management Officer 20,100.00 13,100.00
1480 Public Information and Services 234,324.00 239,828.00
1670 Central Printing & Mailing 32,500.00 32,500.00
1680 Central Data Processing - -
1710 Admin-Salaries/Contractual - -
1910 Unallocated Insurance 210,000.00 210,000.00
1920 School Association Dues 17,000.00 17,000.00
1950 Assessments on School Property - -
1981 BOCES Administrative Costs 269,456.00 280,000.00
1983 BOCES Capital Expenses 17,594.00 17,594.00
1989 Unclassified - -
2010 Curriculum Devel and Suprvsn 683,672.00 591,921.00
2020 Supervision-Regular School 1,259,070.00 1,258,489.00
2040 Supervision-Special School - -
2070 Inservice Training-Instruction - -
2250 Prg For Sdnts w/Disabil-Med Elgble 181,649.00 184,697.00
5510 District Transportation Services 118,838.00 118,309.00
9000 Employee Benefits 923,904.00 942,874.00
5,443,201.00 5,395,999.00Total Administration
Capital
1620 Operation of Plant 289,644.00 297,118.00
1621 Maintenance of Plant 3,616,782.00 3,679,583.00
1930 Judgments and Claims - -
1950 Assessments on School Property 60,000.00 60,000.00
1964 Refund on Real Property Taxes 5,000.00 5,000.00
5510 District Transportation Services - -
9000 Employee Benefits 843,760.00 600,508.00
9711 Serial Bonds-School Construction 3,044,382.00 3,039,141.00
9713 Serial Bonds-BOCES Construction - -
9731 Bond Antic Notes-School Construction 538,856.00 845,690.00
9733 Bond Antic Notes-BOCES Construction - -
9760 Tax Anticipation Notes - -
9785 Install Purch Debt-State Aided Hardware - -
9789 Other Debt (specify) 297,877.00 327,665.00
9950 Transfer to Capital Fund - -
8,696,301.00 8,854,705.00Total Capital
Program
1420 Legal 40,000.00 40,000.00
2020 Supervision-Regular School - -
2110 Teaching-Regular School 13,354,574.00 14,158,711.00
2250 Prg For Sdnts w/Disabil-Med Elgble 5,118,770.00 5,285,729.00
2280 Occupational Education(Grades 9-12) 286,811.00 285,000.00
2330 Teaching-Special Schools 57,500.00 57,500.00
2610 School Library & AV 474,757.00 511,966.00
2620 Educational Television 25,050.00 25,050.00
2630 Computer Assisted Instruction 1,122,267.00 1,152,371.00
2805 Attendance-Regular School - -
2810 Guidance-Regular School 696,809.00 708,791.00
2815 Health Srvcs-Regular School 361,926.00 369,616.00
2820 Psychological Srvcs-Reg Schl 340,036.00 383,167.00
2825 Social Work Srvcs-Regular School 79,000.00 76,500.00
2850 Co-Curricular Activ-Reg Schl 246,630.00 273,040.00
WinCap Ver. 19.04.12.2159

Page 2
'State Category (3-Part Budget) Report'
Croton-Harmon UFSD
Fiscal Year: 2020
3:42:03 pm
April 20, 2019
2018-2019
Adopted Proposed
Budget Budget
2019-2020
DescriptionState Function
2855 Interscholastic Athletics-Reg Schl 884,876.00 907,768.00
5510 District Transport Srvcs-Med Elgble 2,335,679.00 2,367,091.00
5530 Garage Building 112,500.00 112,500.00
5540 Contract Transportation-Med Elgble - -
7140 Recreation - -
7310 Youth Program - -
8070 Census - -
9000 Employee Benefits 7,385,517.00 7,437,714.00
9901 Transfer to School Food Service Fund 30,000.00 30,000.00
9901 Transfer to Special Aid Fund 80,000.00 80,000.00
33,032,702.00 34,262,514.00Total Program
47,172,204.00 48,513,218.00Report Totals
Budget Component Summary
2019-2020 2018-2019%
of Budget
%
of BudgetProposed Budget Adopted Budget
Administration 5,395,999.00 5,443,201.00 11.12 11.53
Capital 8,854,705.00 8,696,301.00 18.25 18.44
Program 34,262,514.00 33,032,702.00 70.63 70.03
48,513,218.00 47,172,204.00 100.00 100.00
WinCap Ver. 19.04.12.2159

4/24/2019 2018 | CROTON-HARMON UFSD - Enrollment Data | NYSED Data Site
https://data.nysed.gov/enrollment.php?year=2018&instid=800000035699 1/2
These enrollment data are collected as part of NYSED's Student Information Repository System (SIRS). These counts are as of "BEDS Day" which is
typically the �rst Wednesday in October. Available are enrollment counts for public and charter school students by various demographics for the
2017 - 18 school year. For nonpublic school enrollment data please see the Non-Public School Enrollment and Staff information on our Information
and Reporting Services webpage.
CROTON-HARMON UFSD ENROLLMENT (2017 - 18)
ENROLLMENT BY GENDER
815 51%
793 49%
ENROLLMENT BY ETHNICITY
1 0%
42 3%
262 16%
103 6%
1,159 72%
41 3%
K-12 Enrollment: 1,608
MALE
FEMALE
American Indian or Alaska Native Hispanic or Latino White Multiracial0
100
200
300
400
500
600
700
800
900
1K
1.1K
1.2K
AMERICAN INDIAN OR ALASKA NATIVE
BLACK OR AFRICAN AMERICAN
HISPANIC OR LATINO
ASIAN OR NATIVE HAWAIIAN/OTHER PACIFIC ISLANDER
WHITE
MULTIRACIAL

4/24/2019 2018 | CROTON-HARMON UFSD - Enrollment Data | NYSED Data Site
https://data.nysed.gov/enrollment.php?year=2018&instid=800000035699 2/2
109 7% 106 7% 113 7% 119 7%
144 9% 130 8% 132 8% 100 6%
142 9% 129 8% 135 8% 109 7%
139 9% 1 0%
ENROLLMENT BY GRADE
— — — — — — — —
49 3% 200 12% 140 9%
OTHER GROUPS
© COPYRIGHT NEW YORK STATE EDUCATION DEPARTMENT, ALL RIGHTS RESERVED.
THIS DOCUMENT WAS CREATED ON: APRIL 24, 2019, 3:18 PM EST
ENGLISH LANGUAGE LEARNERS STUDENTS WITH DISABILITIES ECONOMICALLY DISADVANTAGED
MIGRANT HOMELESS FOSTER CARE PARENT IN ARMED FORCES
K (Full) 1st Grade 2nd Grade 3rd Grade 4th Grade 5th Grade 6th Grade 7th Grade 8th Grade 9th Grade 10th Grade 11th Grade 12th Grade UG0
50
100
150
K (FULL DAY) 1ST GRADE 2ND GRADE 3RD GRADE
4TH GRADE 5TH GRADE 6TH GRADE 7TH GRADE
8TH GRADE 9TH GRADE 10TH GRADE 11TH GRADE
12TH GRADE UNGRADED SECONDARY

4/24/2019 2018 | CROTON-HARMON UFSD - Report Card | NYSED Data Site
https://data.nysed.gov/essa.php?instid=800000035699&year=2018&createreport=1&OverallStatus=1&EMindicators=1&EMcomposite=1&EMgrowth=… 1/19
CROTON-HARMON UFSD - NEW YORK STATE REPORT CARD [2017 - 18]
The New York State Report Card is an important part of the Board of Regents’ effort to raise learning standards
for all students. It provides information to the public on school/district staff, students, and measures of school
and district performance as required by the Every Student Succeeds Act (ESSA). Knowledge gained from the
report card on a school’s or district’s strengths and weaknesses can be used to improve instruction and services
to students.
GOOD STANDING
2018-19 ACCOUNTABILITY STATUS BASED ON 2017-18 DATA
SubgroupComposite
PerformanceGrowth
CompositePerformance &
Growth Combined
English LanguagePro�ciency (ELP)
ProgressChronic
Absenteeism
All Students 4 2 3 2 4 4
American Indian or AlaskaNative
— — — — — —
Asian or NativeHawaiian/Other Paci�cIslander
4 2 4 — 4 4
Black or African American 3 3 3 — 2 4
Hispanic or Latino 3 2 3 2 4 4
Multiracial 4 2 3 — 4 3
White 4 2 3 — 4 4
English LanguageLearners
2 2 2 2 1 4
Students with Disabilities 4 3 4 — 2 4
EconomicallyDisadvantaged
2 2 3 2 2 4
EM INDICATOR LEVELS

4/24/2019 2018 | CROTON-HARMON UFSD - Report Card | NYSED Data Site
https://data.nysed.gov/essa.php?instid=800000035699&year=2018&createreport=1&OverallStatus=1&EMindicators=1&EMcomposite=1&EMgrowth=… 2/19
Subgroup Level
All Students 4
American Indian or Alaska Native —
Asian or Native Hawaiian/Other Paci�c Islander 4
Black or African American 3
Hispanic or Latino 3
Multiracial 4
White 4
English Language Learners 2
Students with Disabilities 4
Economically Disadvantaged 2
EM COMPOSITE PERFORMANCE

4/24/2019 2018 | CROTON-HARMON UFSD - Report Card | NYSED Data Site
https://data.nysed.gov/essa.php?instid=800000035699&year=2018&createreport=1&OverallStatus=1&EMindicators=1&EMcomposite=1&EMgrowth=… 3/19
Subgroup Subject Cohort Index Level
All Students
ELA 650 174.3 4
Math 652 180.4 4
Science 262 229.2 4
Combined 1,564 186.1 4
American Indian or Alaska Native
ELA 1 — —
Math 1 — —
Science — — —
Combined 2 — —
Asian or Native Hawaiian/Other Paci�c Islander
ELA 50 194 4
Math 50 214 4
Science 39 235.9 4
Combined 139 212.9 4
Black or African American
ELA 38 144.7 3
Math 35 114.3 3
Science 20 197.5 3
Combined 93 144.6 3
Hispanic or Latino
ELA 127 127.6 2
Math 124 124.2 2
Science 46 200 2
Combined 297 137.4 2
Multiracial
ELA 48 189.6 4
Math 47 184 4
Science 7 250 4
Combined 102 191.2 4
White
ELA 428 185.2 4
Math 433 194.9 4
Science 178 235.7 4
Combined 1,039 197.9 4
EM CORE SUBJECT PERFORMANCE

4/24/2019 2018 | CROTON-HARMON UFSD - Report Card | NYSED Data Site
https://data.nysed.gov/essa.php?instid=800000035699&year=2018&createreport=1&OverallStatus=1&EMindicators=1&EMcomposite=1&EMgrowth=… 4/19
Subgroup Subject Cohort Index Level
English Language Learners
ELA 56 40.2 1
Math 58 45.7 1
Science 13 65.4 1
Combined 127 45.3 1
Students with Disabilities
ELA 83 94 4
Math 80 74.4 4
Science 31 193.5 4
Combined 194 101.8 4
Economically Disadvantaged
ELA 57 88.6 2
Math 53 89.6 2
Science 41 163.4 2
Combined 151 109.3 2
4/24/2019 2018 | CROTON-HARMON UFSD - Report Card | NYSED Data Site
https://data.nysed.gov/essa.php?instid=800000035699&year=2018&createreport=1&OverallStatus=1&EMindicators=1&EMcomposite=1&EMgrowth=… 5/19
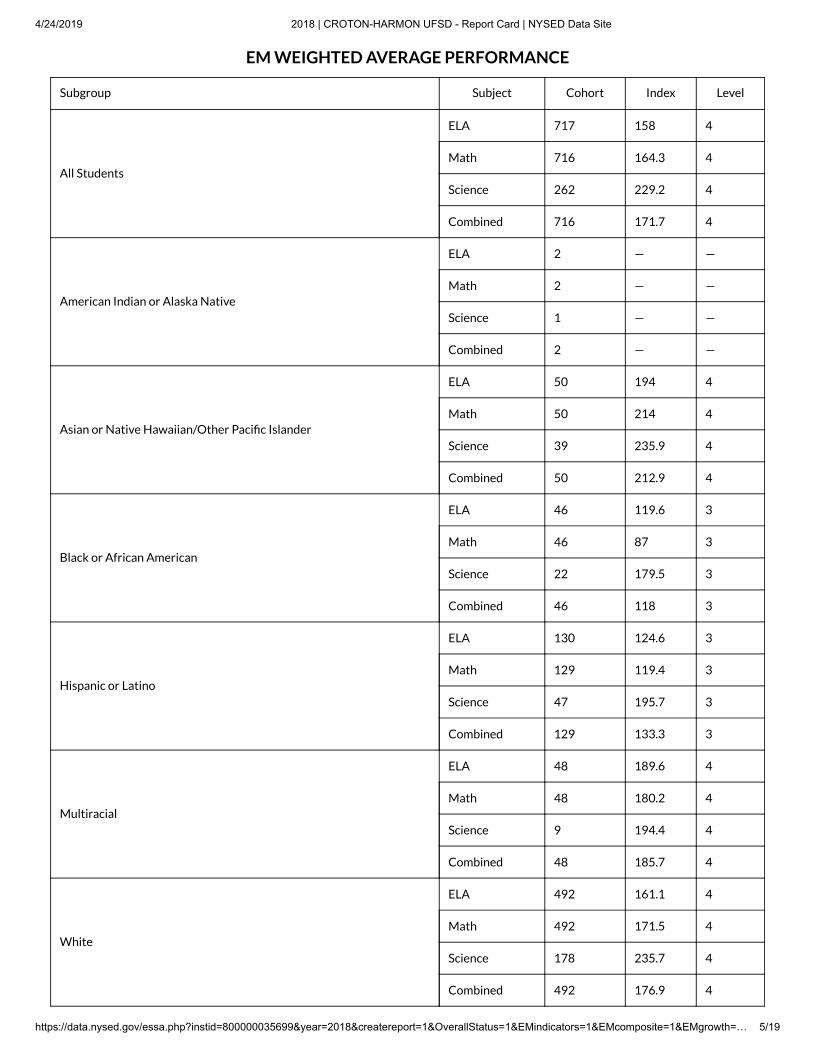
Subgroup Subject Cohort Index Level
All Students
ELA 717 158 4
Math 716 164.3 4
Science 262 229.2 4
Combined 716 171.7 4
American Indian or Alaska Native
ELA 2 — —
Math 2 — —
Science 1 — —
Combined 2 — —
Asian or Native Hawaiian/Other Paci�c Islander
ELA 50 194 4
Math 50 214 4
Science 39 235.9 4
Combined 50 212.9 4
Black or African American
ELA 46 119.6 3
Math 46 87 3
Science 22 179.5 3
Combined 46 118 3
Hispanic or Latino
ELA 130 124.6 3
Math 129 119.4 3
Science 47 195.7 3
Combined 129 133.3 3
Multiracial
ELA 48 189.6 4
Math 48 180.2 4
Science 9 194.4 4
Combined 48 185.7 4
White
ELA 492 161.1 4
Math 492 171.5 4
Science 178 235.7 4
Combined 492 176.9 4
EM WEIGHTED AVERAGE PERFORMANCE
4/24/2019 2018 | CROTON-HARMON UFSD - Report Card | NYSED Data Site
https://data.nysed.gov/essa.php?instid=800000035699&year=2018&createreport=1&OverallStatus=1&EMindicators=1&EMcomposite=1&EMgrowth=… 6/19
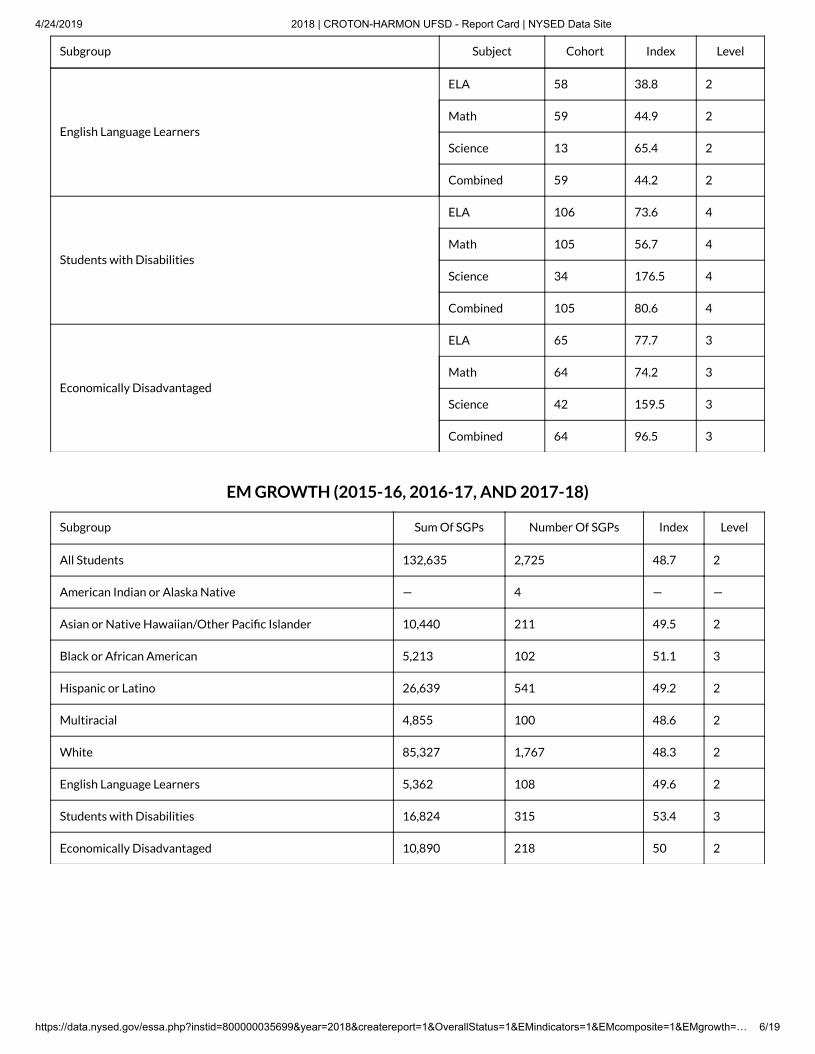
Subgroup Subject Cohort Index Level
English Language Learners
ELA 58 38.8 2
Math 59 44.9 2
Science 13 65.4 2
Combined 59 44.2 2
Students with Disabilities
ELA 106 73.6 4
Math 105 56.7 4
Science 34 176.5 4
Combined 105 80.6 4
Economically Disadvantaged
ELA 65 77.7 3
Math 64 74.2 3
Science 42 159.5 3
Combined 64 96.5 3
Subgroup Sum Of SGPs Number Of SGPs Index Level
All Students 132,635 2,725 48.7 2
American Indian or Alaska Native — 4 — —
Asian or Native Hawaiian/Other Paci�c Islander 10,440 211 49.5 2
Black or African American 5,213 102 51.1 3
Hispanic or Latino 26,639 541 49.2 2
Multiracial 4,855 100 48.6 2
White 85,327 1,767 48.3 2
English Language Learners 5,362 108 49.6 2
Students with Disabilities 16,824 315 53.4 3
Economically Disadvantaged 10,890 218 50 2
EM GROWTH (2015-16, 2016-17, AND 2017-18)

4/24/2019 2018 | CROTON-HARMON UFSD - Report Card | NYSED Data Site
https://data.nysed.gov/essa.php?instid=800000035699&year=2018&createreport=1&OverallStatus=1&EMindicators=1&EMcomposite=1&EMgrowth=… 7/19
Subgroup Level
All Students 3
Asian or Native Hawaiian/Other Paci�c Islander 4
Black or African American 3
Hispanic or Latino 3
Multiracial 3
White 3
English Language Learners 2
Students with Disabilities 4
Economically Disadvantaged 3
Subgroup Number Of ELLs Benchmark Progress Rate Success Ratio Level
All Students 33 45% 40% 0.9 2
American Indian or Alaska Native 0 — — — —
Asian or Native Hawaiian/Other Paci�c Islander 4 — — — —
Black or African American 0 — — — —
Hispanic or Latino 50 44% 39% 0.9 2
Multiracial 0 — — — —
White 4 — — — —
English Language Learners 33 45% 40% 0.9 2
Students with Disabilities 11 — — — —
Economically Disadvantaged 41 45% 37% 0.8 2
EM COMPOSITE PERFORMANCE AND GROWTH COMBINED
EM ELP

4/24/2019 2018 | CROTON-HARMON UFSD - Report Card | NYSED Data Site
https://data.nysed.gov/essa.php?instid=800000035699&year=2018&createreport=1&OverallStatus=1&EMindicators=1&EMcomposite=1&EMgrowth=… 8/19
Subgroup Subject Baseline Cohort IndexDistrict
MIPStateMIP
Long-TermGoal
ExceedLong-TermGoal
EndGoal
LevelAverage
OfLevels
All StudentsELA 135.9 717 158 138.5% 100.7% 117.3 158.7 200 4 4
Math 145.2 716 164.3 147.4% 103.3% 119.4 159.7 200 4 4
American Indianor Alaska Native
ELA — 2 — — — — — — — —
Math — 2 — — — — — — — —
Asian or NativeHawaiian/OtherPaci�c Islander
ELA 163.5 50 194 165% 155.1% 162.6 181.3 200 4 4
Math 199 50 214 199% 173% 177.5 188.8 200 4 4
Black or AfricanAmerican
ELA 119.4 46 119.6 122.6% 93.9% 111.6 155.8 200 3 2
Math 83.3 46 87 88% 83.1% 102.6 151.3 200 2 2
Hispanic orLatino
ELA 104.6 130 124.6 108.4% 90.8% 109 154.5 200 4 4
Math 113.9 129 119.4 117.3% 87% 105.8 152.9 200 4 4
MultiracialELA 164.1 48 189.6 165.5% 97.6% 114.6 157.3 200 4 4
Math 160.3 48 180.2 161.9% 99.3% 116.1 158.1 200 4 4
WhiteELA 141.8 492 161.1 144.1% 98% 115 157.5 200 4 4
Math 150.2 492 171.5 152.2% 106.3% 121.9 161 200 4 4
English LanguageLearners
ELA 32.7 58 38.8 39.4% 60.8% 84 142 200 1 1
Math 47.3 59 44.9 53.4% 77.9% 98.2 149.1 200 1 1
Students withDisabilities
ELA 63 106 73.6 68.5% 54.4% 78.6 139.3 200 3 2
Math 54.5 105 56.7 60.3% 54.4% 78.6 139.3 200 2 2
EconomicallyDisadvantaged
ELA 65 65 77.7 70.4% 90.7% 108.9 154.5 200 2 2
Math 45 64 74.2 51.2% 89.4% 107.8 153.9 200 2 2
EM PROGRESS

4/24/2019 2018 | CROTON-HARMON UFSD - Report Card | NYSED Data Site
https://data.nysed.gov/essa.php?instid=800000035699&year=2018&createreport=1&OverallStatus=1&EMindicators=1&EMcomposite=1&EMgrowth=… 9/19
Subgroup BaselineExpected
AttendanceDays
StudentsChronically
Absent
ChronicAbsenteeism
Rate
DistrictMIP
StateMIP
Long-TermGoal
ExceedLong-TermGoal
EndGoal
Level
All Students 5.6 1,000 49 4.9% 5.6% 15% 13.3% 9.2% 5% 4
AmericanIndian or AlaskaNative
— 2 — — — — — — — —
Asian or NativeHawaiian/OtherPaci�c Islander
0 74 0 0% 0% 8.3% 7.7% 6.4% 5% 4
Black or AfricanAmerican
13.3 54 7 13% 13% 20.8% 18.2% 11.6% 5% 4
Hispanic orLatino
6.2 186 12 6.5% 6.2% 20.4% 17.8% 11.4% 5% 4
Multiracial 6.1 32 4 12.5% 6.1% 17% 15% 10% 5% 3
White 5.6 683 30 4.4% 5.6% 10.7% 9.7% 7.4% 5% 4
EnglishLanguageLearners
5 44 3 6.8% 5% 18.1% 15.9% 10.5% 5% 4
Students withDisabilities
9.8 136 16 11.8% 9.6% 22.2% 19.3% 12.2% 5% 4
EconomicallyDisadvantaged
14.3 87 10 11.5% 13.9% 20.5% 17.9% 11.5% 5% 4
EM CHRONIC ABSENTEEISM

4/24/2019 2018 | CROTON-HARMON UFSD - Report Card | NYSED Data Site
https://data.nysed.gov/essa.php?instid=800000035699&year=2018&createreport=1&OverallStatus=1&EMindicators=1&EMcomposite=1&EMgrowth… 10/19
Subgroup Tested 95% Enrollment Participation Rate
All Students ✘ 1,556 83.3%
American Indian or Alaska Native — 1 —
Asian or Native Hawaiian/Other Paci�c Islander ✔ 52 100%
Black or African American — 21 —
Hispanic or Latino ✘ 294 89.1%
Multiracial — 28 —
White ✘ 1,059 80%
English Language Learners — 30 —
Students with Disabilities ✘ 214 73.4%
Economically Disadvantaged ✘ 121 86%
Subgroup Tested 95% Enrollment Participation Rate
All Students ✘ 1,554 84.2%
American Indian or Alaska Native — 1 —
Asian or Native Hawaiian/Other Paci�c Islander ✔ 52 100%
Black or African American — 21 —
Hispanic or Latino ✘ 290 89.7%
Multiracial — 28 —
White ✘ 1,061 81.2%
English Language Learners — 30 —
Students with Disabilities ✘ 213 69.5%
Economically Disadvantaged ✘ 120 79.2%
Grade Number Taking NYSESLAT
Grade 7 1
EM ELA PARTICIPATION RATE
EM MATHEMATICS PARTICIPATION RATE
RECENTLY ARRIVED ELLS TAKING NYSESLAT IN LIEU OF NYSTP ELA
4/24/2019 2018 | CROTON-HARMON UFSD - Report Card | NYSED Data Site
https://data.nysed.gov/essa.php?instid=800000035699&year=2018&createreport=1&OverallStatus=1&EMindicators=1&EMcomposite=1&EMgrowth… 11/19
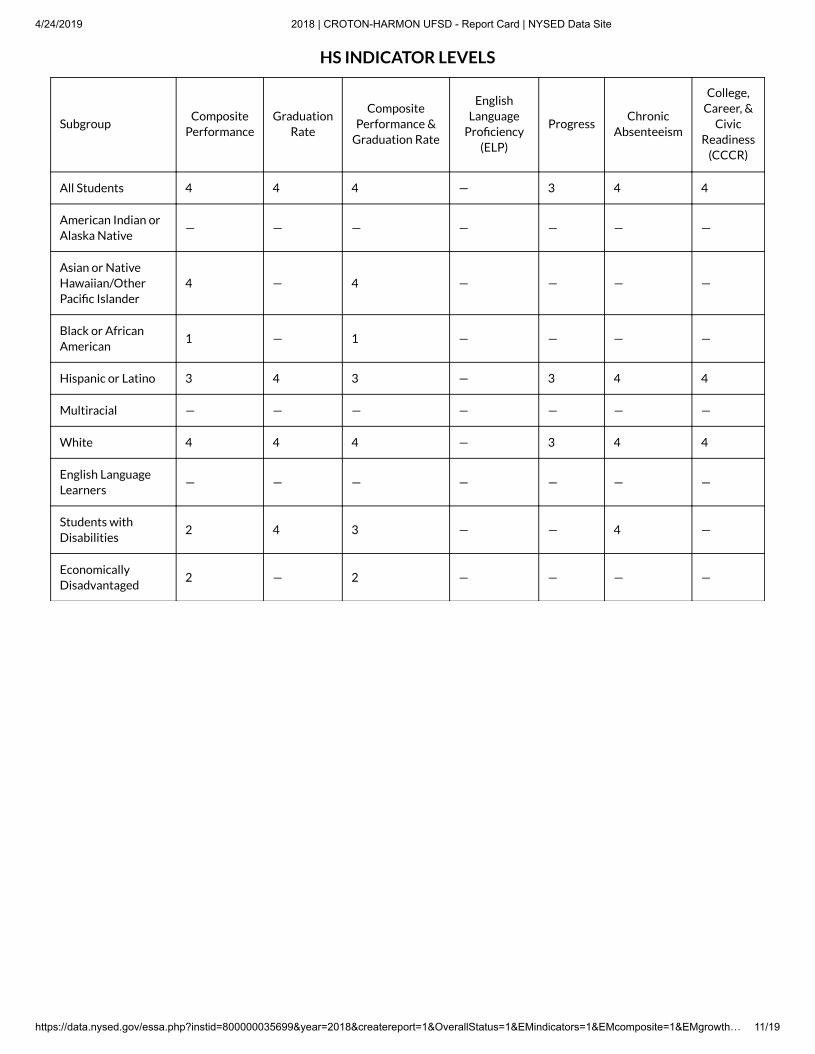
SubgroupComposite
PerformanceGraduation
Rate
CompositePerformance &
Graduation Rate
EnglishLanguage
Pro�ciency(ELP)
ProgressChronic
Absenteeism
College,Career, &
CivicReadiness
(CCCR)
All Students 4 4 4 — 3 4 4
American Indian orAlaska Native
— — — — — — —
Asian or NativeHawaiian/OtherPaci�c Islander
4 — 4 — — — —
Black or AfricanAmerican
1 — 1 — — — —
Hispanic or Latino 3 4 3 — 3 4 4
Multiracial — — — — — — —
White 4 4 4 — 3 4 4
English LanguageLearners
— — — — — — —
Students withDisabilities
2 4 3 — — 4 —
EconomicallyDisadvantaged
2 — 2 — — — —
HS INDICATOR LEVELS

4/24/2019 2018 | CROTON-HARMON UFSD - Report Card | NYSED Data Site
https://data.nysed.gov/essa.php?instid=800000035699&year=2018&createreport=1&OverallStatus=1&EMindicators=1&EMcomposite=1&EMgrowth… 12/19
Subgroup Subject Cohort Index Combined Index Level
All Students
ELA 137 229.9 212.1 4
Math 137 176.3 212.1 4
Science 137 229.2 212.1 4
Social Studies 137 231.8 212.1 4
Asian or Native Hawaiian/Other Paci�c Islander
ELA 8 243.8 239.6 4
Math 8 231.3 239.6 4
Science 8 243.8 239.6 4
Social Studies 8 243.8 239.6 4
Black or African American
ELA 11 150 137.9 1
Math 11 95.5 137.9 1
Science 11 163.6 137.9 1
Social Studies 11 177.3 137.9 1
Hispanic or Latino
ELA 37 185.1 180.6 3
Math 37 150 180.6 3
Science 37 200 180.6 3
Social Studies 37 220.3 180.6 3
Multiracial
ELA 2 — — —
Math 2 — — —
Science 2 — — —
Social Studies 2 — — —
White
ELA 114 236 217.6 4
Math 114 182.9 217.6 4
Science 114 232.9 217.6 4
Social Studies 114 236 217.6 4
English Language Learners
ELA 2 — — —
Math 2 — — —
Science 2 — — —
Social Studies 2 — — —
HS COMPOSITE PERFORMANCE

4/24/2019 2018 | CROTON-HARMON UFSD - Report Card | NYSED Data Site
https://data.nysed.gov/essa.php?instid=800000035699&year=2018&createreport=1&OverallStatus=1&EMindicators=1&EMcomposite=1&EMgrowth… 13/19
Subgroup Subject Cohort Index Combined Index Level
Students with Disabilities
ELA 23 128.3 113.6 2
Math 23 60.9 113.6 2
Science 23 145.7 113.6 2
Social Studies 23 163 113.6 2
Economically Disadvantaged
ELA 23 160.9 162.4 2
Math 23 137 162.4 2
Science 23 187 162.4 2
Social Studies 23 193.5 162.4 2
4/24/2019 2018 | CROTON-HARMON UFSD - Report Card | NYSED Data Site
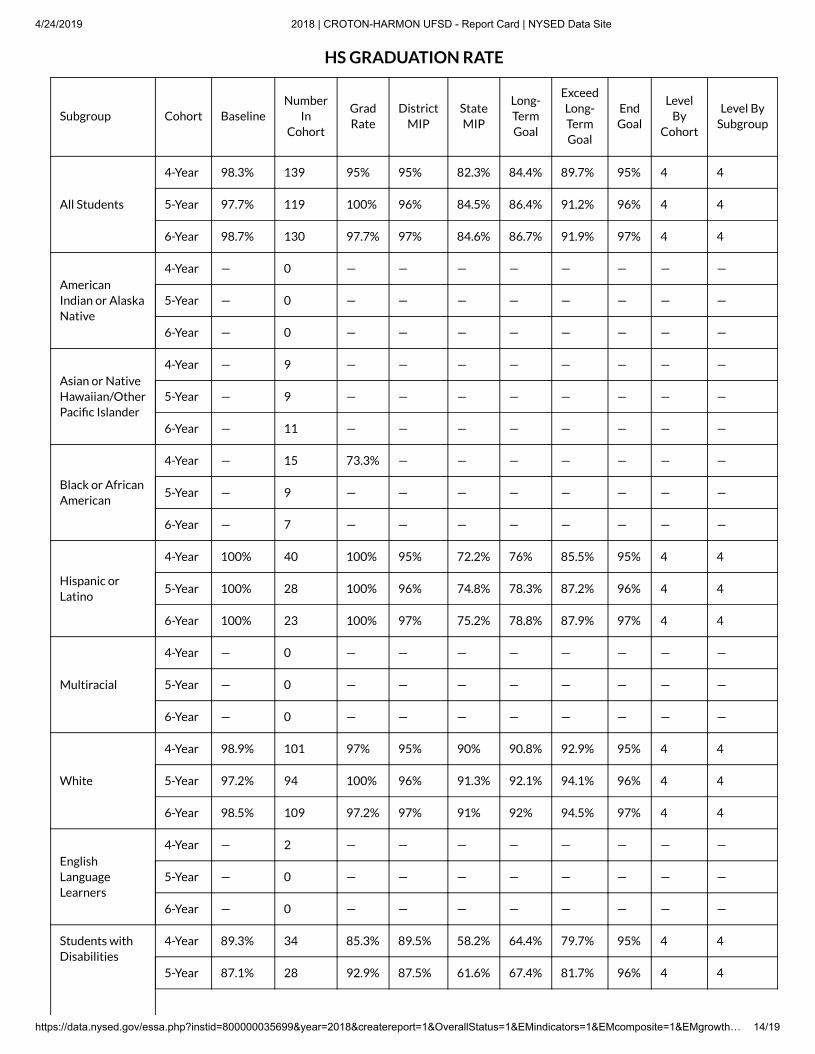
https://data.nysed.gov/essa.php?instid=800000035699&year=2018&createreport=1&OverallStatus=1&EMindicators=1&EMcomposite=1&EMgrowth… 14/19
Subgroup Cohort BaselineNumber
InCohort
GradRate
DistrictMIP
StateMIP
Long-TermGoal
ExceedLong-TermGoal
EndGoal
LevelBy
Cohort
Level BySubgroup
All Students
4-Year 98.3% 139 95% 95% 82.3% 84.4% 89.7% 95% 4 4
5-Year 97.7% 119 100% 96% 84.5% 86.4% 91.2% 96% 4 4
6-Year 98.7% 130 97.7% 97% 84.6% 86.7% 91.9% 97% 4 4
AmericanIndian or AlaskaNative
4-Year — 0 — — — — — — — —
5-Year — 0 — — — — — — — —
6-Year — 0 — — — — — — — —
Asian or NativeHawaiian/OtherPaci�c Islander
4-Year — 9 — — — — — — — —
5-Year — 9 — — — — — — — —
6-Year — 11 — — — — — — — —
Black or AfricanAmerican
4-Year — 15 73.3% — — — — — — —
5-Year — 9 — — — — — — — —
6-Year — 7 — — — — — — — —
Hispanic orLatino
4-Year 100% 40 100% 95% 72.2% 76% 85.5% 95% 4 4
5-Year 100% 28 100% 96% 74.8% 78.3% 87.2% 96% 4 4
6-Year 100% 23 100% 97% 75.2% 78.8% 87.9% 97% 4 4
Multiracial
4-Year — 0 — — — — — — — —
5-Year — 0 — — — — — — — —
6-Year — 0 — — — — — — — —
White
4-Year 98.9% 101 97% 95% 90% 90.8% 92.9% 95% 4 4
5-Year 97.2% 94 100% 96% 91.3% 92.1% 94.1% 96% 4 4
6-Year 98.5% 109 97.2% 97% 91% 92% 94.5% 97% 4 4
EnglishLanguageLearners
4-Year — 2 — — — — — — — —
5-Year — 0 — — — — — — — —
6-Year — 0 — — — — — — — —
Students withDisabilities
4-Year 89.3% 34 85.3% 89.5% 58.2% 64.4% 79.7% 95% 4 4
5-Year 87.1% 28 92.9% 87.5% 61.6% 67.4% 81.7% 96% 4 4
HS GRADUATION RATE

4/24/2019 2018 | CROTON-HARMON UFSD - Report Card | NYSED Data Site
https://data.nysed.gov/essa.php?instid=800000035699&year=2018&createreport=1&OverallStatus=1&EMindicators=1&EMcomposite=1&EMgrowth… 15/19
Subgroup Cohort BaselineNumber
InCohort
GradRate
DistrictMIP
StateMIP
Long-TermGoal
ExceedLong-TermGoal
EndGoal
LevelBy
Cohort
Level BySubgroup
6-Year 77.6% 31 87.1% 78.4% 59.9% 66.1% 81.6% 97% 4 4
EconomicallyDisadvantaged
4-Year — 18 77.8% — — — — — — —
5-Year — 11 — — — — — — — —
6-Year — 5 — — — — — — — —
Subgroup Level
All Students 4
Asian or Native Hawaiian/Other Paci�c Islander 4
Black or African American 1
Hispanic or Latino 3
White 4
Students with Disabilities 3
Economically Disadvantaged 2
Subgroup Number Of ELLs Benchmark Progress Rate Success Ratio Level
All Students 7 — — — —
American Indian or Alaska Native 0 — — — —
Asian or Native Hawaiian/Other Paci�c Islander 1 — — — —
Black or African American 0 — — — —
Hispanic or Latino 6 — — — —
Multiracial 0 — — — —
White 0 — — — —
English Language Learners 7 — — — —
Students with Disabilities 1 — — — —
Economically Disadvantaged 7 — — — —
HS COMPOSITE PERFORMANCE & GRADUATION RATE COMBINED
HS ELP

4/24/2019 2018 | CROTON-HARMON UFSD - Report Card | NYSED Data Site
https://data.nysed.gov/essa.php?instid=800000035699&year=2018&createreport=1&OverallStatus=1&EMindicators=1&EMcomposite=1&EMgrowth… 16/19
Subgroup Subject Baseline Cohort IndexDistrict
MIPStateMIP
Long-TermGoal
ExceedLong-TermGoal
EndGoal
LevelAverage
OfLevels
All StudentsELA 212.4 137 229.9 212.5% 189.4% 193.6 204.3 215 4 3
Math 183.5 137 176.3 184.2% 149.1% 157.6 178.8 200 3 3
Asian or NativeHawaiian/OtherPaci�c Islander
ELA — 8 — — — — — — — —
Math — 8 — — — — — — — —
Black or AfricanAmerican
ELA — 11 — — — — — — — —
Math — 11 — — — — — — — —
Hispanic orLatino
ELA 164.1 37 185.1 166.1% 163.4% 172 193.5 215 4 3
Math 156.4 37 150 158.1% 120.7% 133.9 167 200 3 3
MultiracialELA — 2 — — — — — — — —
Math — 2 — — — — — — — —
WhiteELA 223.5 114 236 215% 207.8% 209 212 215 4 3
Math 192.9 114 182.9 193.2% 166.4% 172 186 200 3 3
English LanguageLearners
ELA — 2 — — — — — — — —
Math — 2 — — — — — — — —
Students withDisabilities
ELA — 23 — — — — — — — —
Math — 23 — — — — — — — —
EconomicallyDisadvantaged
ELA — 23 — — — — — — — —
Math — 23 — — — — — — — —
HS PROGRESS

4/24/2019 2018 | CROTON-HARMON UFSD - Report Card | NYSED Data Site
https://data.nysed.gov/essa.php?instid=800000035699&year=2018&createreport=1&OverallStatus=1&EMindicators=1&EMcomposite=1&EMgrowth… 17/19
Subgroup BaselineExpected
AttendanceDays
StudentsChronically
Absent
ChronicAbsenteeism
Rate
DistrictMIP
StateMIP
Long-TermGoal
ExceedLong-TermGoal
EndGoal
Level
All Students 3.8 517 9 1.7% 3.8% 23.4% 20.4% 12.7% 5% 4
Asian or NativeHawaiian/OtherPaci�c Islander
— 46 — — — — — — — —
Black or AfricanAmerican
— 42 — — — — — — — —
Hispanic orLatino
6.7 72 2 2.8% 6.6% 32.8% 28.2% 16.6% 5% 4
Multiracial — 11 — — — — — — — —
White 3.2 394 7 1.8% 3.2% 16.1% 14.3% 9.7% 5% 4
EnglishLanguageLearners
— 12 — — — — — — — —
Students withDisabilities
5.6 53 1 1.9% 5.6% 34% 29.2% 17.1% 5% 4
EconomicallyDisadvantaged
— 53 — — — — — — — —
Subgroup Baseline IndexDistrict
MIPStateMIP
Long-TermGoal
Exceed Long-Term Goal
EndGoal
Level
All Students 127 153.9 128.9 128.2 136 155.5 175 4
Asian or Native Hawaiian/OtherPaci�c Islander
— — — — — — — —
Black or African American — — — — — — — —
Hispanic or Latino 122.5 133.3 124.6 101.4 113.6 144.3 175 4
Multiracial — — — — — — — —
White 130.7 156.8 132.5 148.6 153 164 175 4
English Language Learners — — — — — — — —
Students with Disabilities — — — — — — — —
Economically Disadvantaged — — — — — — — —
HS CHRONIC ABSENTEEISM
CCCR LEVELS

4/24/2019 2018 | CROTON-HARMON UFSD - Report Card | NYSED Data Site
https://data.nysed.gov/essa.php?instid=800000035699&year=2018&createreport=1&OverallStatus=1&EMindicators=1&EMcomposite=1&EMgrowth… 18/19
SubgroupCohortCount
AnnualBiliteracy
2.0Weight
1.5Weight
1.0Weight
0.5Weight
All Students 142 0 69 31 34 0
Asian or Native Hawaiian/Other Paci�cIslander
8 0 — — — —
Black or African American 13 0 — — — —
Hispanic or Latino 39 0 6 16 16 0
Multiracial 2 0 — — — —
White 118 0 60 26 26 0
English Language Learners 2 0 — — — —
Students with Disabilities 27 0 — — — —
Economically Disadvantaged 23 0 — — — —
Subgroup Tested 95% 12th Grade Enrollment Participation Rate
All Students ✔ 140 99.3%
American Indian or Alaska Native — 0 —
Asian or Native Hawaiian/Other Paci�c Islander — 3 —
Black or African American — 5 —
Hispanic or Latino — 15 —
Multiracial — 2 —
White ✔ 115 100%
English Language Learners — 1 —
Students with Disabilities — 13 —
Economically Disadvantaged — 14 —
CCCR COUNTS
HS ELA PARTICIPATION RATE

4/24/2019 2018 | CROTON-HARMON UFSD - Report Card | NYSED Data Site
https://data.nysed.gov/essa.php?instid=800000035699&year=2018&createreport=1&OverallStatus=1&EMindicators=1&EMcomposite=1&EMgrowth… 19/19
© COPYRIGHT NEW YORK STATE EDUCATION DEPARTMENT, ALL RIGHTS RESERVED.
THIS DOCUMENT WAS CREATED ON: APRIL 24, 2019, 3:19 PM EST
Subgroup Tested 95% 12th Grade Enrollment Participation Rate
All Students ✔ 140 97.9%
American Indian or Alaska Native — 0 —
Asian or Native Hawaiian/Other Paci�c Islander — 3 —
Black or African American — 5 —
Hispanic or Latino — 15 —
Multiracial — 2 —
White ✔ 115 98.3%
English Language Learners — 1 —
Students with Disabilities — 13 —
Economically Disadvantaged — 14 —
HS MATHEMATICS PARTICIPATION RATE

Croton-Harmon UFSD
Required Report on Administrative Salaries & Benefits Budgeted for 2019/20
Salary Benefits OtherSupt's Contribution
$240,000.00$5,000.00$8,239.80 $8,239.80
$3,630.80 $3,630.80$21,600.00 $19,564.80 $4,891.20$1,360.00
$246.00 $114.96
$5,400.00
$240,000.00 $65,156.36 $0.00 $16,761.80
Salary Benefits OtherAss't Supt's Contribution
$175,000.00$8,239.80 $8,239.80
$2,537.50 $2,537.50$15,750.00 $19,964.80 $4,891.20$1,360.00
$246.00 $114.96
$2,700.00
$175,000.00 $50,913.06 $0.00 $15,668.50
Salary Benefits Other
Ass't Supt's Contribution
$175,000.00$8,239.80 $8,239.80
$2,537.50 $2,537.50$15,750.00 $19,964.80 $4,891.20$1,360.00
$246.00 $114.96
$2,700.00
$175,000.00 $50,913.06 $0.00 $15,668.50
In Lieu of Mileage
Totals
Mandatory MedicareMandatory Retirement SystemMedical CoverageDental/Optical CoverageLife Insurance Policy Disability Insurance
Totals
Assistant Superintendent for BusinessContractual SalaryMandatory Social Security
Medical CoverageDental/Optical CoverageLife Insurance Policy Disability InsuranceIn Lieu of Mileage
Assistant Superintendent Contractual SalaryMandatory Social Security Mandatory MedicareMandatory Retirement System
In Lieu of Mileage
Totals
*Current contract expires on 6/30/22
Mandatory MedicareMandatory Retirement SystemMedical Coverage Dental/Optical CoverageLife Insurance Policy Disability Insurance
Superintendent of Schools*Contractual SalaryTax Sheltered AnnuityMandatory Social Security

Croton-Harmon UFSD
175,000$ 165,000$ 183,806$ 154,042$ 170,644$ 147,175$ 145,000$ Director of Facilities II
High School PrincipalMiddle School PrincipalElementary School PrincipalHigh School Assistant PrincipalDirector of Pupil Personnel ServicesDirector of Technology
Administrators (over $135,000)


![READING AND SCORING APPLICATIONS IN ZOOMGRANTS€¦ · Print/Preview Next Submitted Applicatio Print Budget Other Application Budget Sources Summary Official Decision C] Notified](https://static.fdocuments.in/doc/165x107/5f0e40bc7e708231d43e5873/reading-and-scoring-applications-in-zoomgrants-printpreview-next-submitted-applicatio.jpg)


