Chrysalis Investments Limited (the Company) Interim ...
42
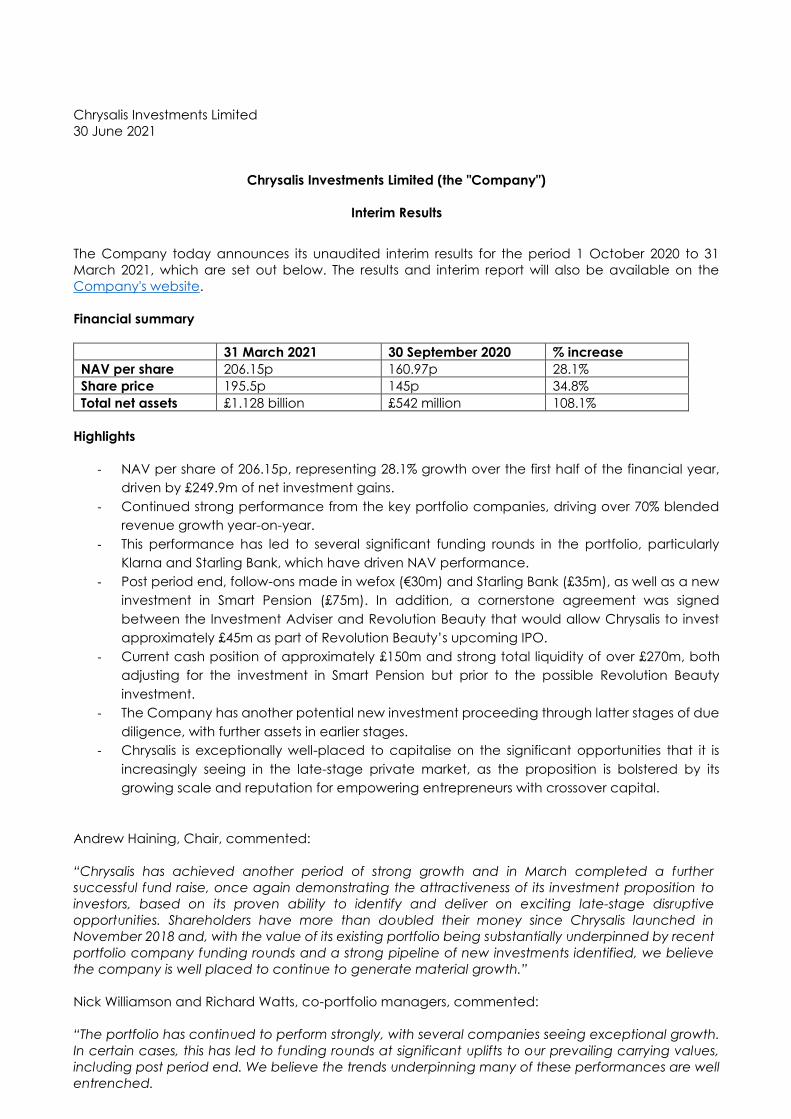
Chrysalis Investments Limited 30 June 2021 Chrysalis Investments Limited (the "Company") Interim Results The Company today announces its unaudited interim results for the period 1 October 2020 to 31 March 2021, which are set out below. The results and interim report will also be available on the Company's website. Financial summary 31 March 2021 30 September 2020 % increase NAV per share 206.15p 160.97p 28.1% Share price 195.5p 145p 34.8% Total net assets £1.128 billion £542 million 108.1% Highlights - NAV per share of 206.15p, representing 28.1% growth over the first half of the financial year, driven by £249.9m of net investment gains. - Continued strong performance from the key portfolio companies, driving over 70% blended revenue growth year-on-year. - This performance has led to several significant funding rounds in the portfolio, particularly Klarna and Starling Bank, which have driven NAV performance. - Post period end, follow-ons made in wefox (€30m) and Starling Bank (£35m), as well as a new investment in Smart Pension (£75m). In addition, a cornerstone agreement was signed between the Investment Adviser and Revolution Beauty that would allow Chrysalis to invest approximately £45m as part of Revolution Beauty’s upcoming IPO. - Current cash position of approximately £150m and strong total liquidity of over £270m, both adjusting for the investment in Smart Pension but prior to the possible Revolution Beauty investment. - The Company has another potential new investment proceeding through latter stages of due diligence, with further assets in earlier stages. - Chrysalis is exceptionally well-placed to capitalise on the significant opportunities that it is increasingly seeing in the late-stage private market, as the proposition is bolstered by its growing scale and reputation for empowering entrepreneurs with crossover capital. Andrew Haining, Chair, commented: “Chrysalis has achieved another period of strong growth and in March completed a further successful fund raise, once again demonstrating the attractiveness of its investment proposition to investors, based on its proven ability to identify and deliver on exciting late-stage disruptive opportunities. Shareholders have more than doubled their money since Chrysalis launched in November 2018 and, with the value of its existing portfolio being substantially underpinned by recent portfolio company funding rounds and a strong pipeline of new investments identified, we believe the company is well placed to continue to generate material growth.” Nick Williamson and Richard Watts, co-portfolio managers, commented: “The portfolio has continued to perform strongly, with several companies seeing exceptional growth. In certain cases, this has led to funding rounds at significant uplifts to our prevailing carrying values, including post period end. We believe the trends underpinning many of these performances are well entrenched.
Transcript of Chrysalis Investments Limited (the Company) Interim ...
Chrysalis Investments Limited
30 June 2021
Chrysalis Investments Limited (the "Company")
Interim Results
The Company today announces its unaudited interim results for the period 1 October 2020 to 31
March 2021, which are set out below. The results and interim report will also be available on the
Company's website.
Financial summary
31 March 2021 30 September 2020 % increase
NAV per share 206.15p 160.97p 28.1%
Share price 195.5p 145p 34.8%
Total net assets £1.128 billion £542 million 108.1%
Highlights
- NAV per share of 206.15p, representing 28.1% growth over the first half of the financial year,
driven by £249.9m of net investment gains.
- Continued strong performance from the key portfolio companies, driving over 70% blended
revenue growth year-on-year.
- This performance has led to several significant funding rounds in the portfolio, particularly
Klarna and Starling Bank, which have driven NAV performance.
- Post period end, follow-ons made in wefox (€30m) and Starling Bank (£35m), as well as a new
investment in Smart Pension (£75m). In addition, a cornerstone agreement was signed
between the Investment Adviser and Revolution Beauty that would allow Chrysalis to invest
approximately £45m as part of Revolution Beauty’s upcoming IPO.
- Current cash position of approximately £150m and strong total liquidity of over £270m, both
adjusting for the investment in Smart Pension but prior to the possible Revolution Beauty
investment.
- The Company has another potential new investment proceeding through latter stages of due
diligence, with further assets in earlier stages.
- Chrysalis is exceptionally well-placed to capitalise on the significant opportunities that it is
increasingly seeing in the late-stage private market, as the proposition is bolstered by its
growing scale and reputation for empowering entrepreneurs with crossover capital.
Andrew Haining, Chair, commented:
“Chrysalis has achieved another period of strong growth and in March completed a further
successful fund raise, once again demonstrating the attractiveness of its investment proposition to
investors, based on its proven ability to identify and deliver on exciting late-stage disruptive
opportunities. Shareholders have more than doubled their money since Chrysalis launched in
November 2018 and, with the value of its existing portfolio being substantially underpinned by recent
portfolio company funding rounds and a strong pipeline of new investments identified, we believe
the company is well placed to continue to generate material growth.”
Nick Williamson and Richard Watts, co-portfolio managers, commented:
“The portfolio has continued to perform strongly, with several companies seeing exceptional growth.
In certain cases, this has led to funding rounds at significant uplifts to our prevailing carrying values,
including post period end. We believe the trends underpinning many of these performances are well
entrenched.

More widely, we believe Chrysalis is only scratching the surface of the opportunity available in the
late-stage private market. Our original hypothesis of a “blurring of the lines” between private and
public markets appears to be playing out and our crossover proposition, backed by significant scale,
is resonating strongly with entrepreneurs. This has allowed us to access some fabulous companies.
Our early-mover advantage is substantial, but we are continually looking for ways to develop the
Chrysalis offering. Our origination network is generating a significant cadence of leads, and the
current pipeline of new investments is very exciting, with a further potential investment in the final
stages of DD and others in earlier stages. With substantial cash and liquidity available, we are well on
track to continue our drive to diversify the portfolio, selectively targeting exceptional investment
opportunities”.
-ENDS-
For further information, please contact:
Jupiter Asset Management:
Magnus Spence
+44 (0) 20 3817 1325
Liberum:
Chris Clarke / Darren Vickers / Owen
Matthews
+44 (0) 20 3100 2000
Numis Securities Limited
Nathan Brown/ Matt Goss
+44 (0) 20 7260 1000
Maitland Administration (Guernsey) Limited:
Elaine Smeja / Aimee Gontier
+44 (0) 1481 749364
Media Enquiries:
Montfort Communications
Charlotte McMullen / Toto Reissland-
Burghart / Miles McKechnie
+44 (0) 20 3770 7920
LEI: 213800F9SQ753JQHSW24
A copy of this announcement will be available on the Company's website at
http://chrysalisinvestments.co.uk. Neither the content of the Company's website, nor the content on
any website accessible from hyperlinks on its website for any other website, is incorporated into, or
forms part of, this announcement nor, unless previously published by means of a recognised
information service, should any such content be relied upon in reaching a decision as to whether or
not to acquire, continue to hold, or dispose of, securities in the Company.
This announcement may include "forward-looking statements". All statements other than statements
of historical facts included in this announcement, including, without limitation, those regarding the
Company's financial position, business strategy, plans and objectives of management for future
operations (including development plans and objectives relating to the Company's products and
services) are forward-looking statements.
Forward-looking statements are subject to risks and uncertainties and accordingly the Company's
actual future financial results and operational performance may differ materially from the results and
performance expressed in, or implied by, the statements. These factors include but are not limited to
those described in the formal Prospectus. These forward-looking statements speak only as at the date
of this announcement. The Company expressly disclaims any obligation or undertaking to update or
revise any forward-looking statements contained herein to reflect actual results or any change in the
assumptions, conditions or circumstances on which any such statements are based unless required to
do so by the Financial Services and Markets Act 2000, the Listing Rules or Prospectus Rules of the
Financial Conduct Authority or other applicable laws, regulations or rules.
Chairman’s Statement
I am pleased to present the interim accounts for the six months ended 31st March 2021 together with
a portfolio update from our Investment Adviser.
Your company has enjoyed another period of strong growth. The Net Asset Value per share increased
by 28.1% in the period under review while the share price increased 34.8% over the same period.
Since inception of the Company in November 2018, the Net Asset Value per share has increased 109%
and shareholders have seen a 96% increase in the value of their shares. This compares with a -1% fall
in the FTSE All-Share index.
The Company continues to implement its strategy of investing in late stage, pre-IPO growth
companies. The investment in You & Mr Jones was completed during the period, and small follow-on
investments were made in Graphcore, a position which we initiated shortly after Chrysalis was
established, and Featurespace. The investment portfolio now comprises twelve positions in
companies which range in valuation from over £20 billion to less than £100 million and operate across
a range of economic sectors and geographies. The holdings typically share common characteristics:
tech-enablement; founder-led disruptors; huge addressable markets.
As growth companies choose to stay private for longer, the demand for capital to finance their
growth increases. Accordingly, the Company raised a further £300 million in March 2021, following on
from the £95 million raised in October 2020. This capital is allowing the Investment Adviser to invest in
new investment opportunities, as well as to make follow-on investments in existing portfolio positions.
As a result of this fresh capital, as well as the gains made from strong investment returns, the Company
now has a market capitalisation of approximately £1.1 billion and, as of 23 March 2021 has been a
constituent of the FTSE-250 index. Our scale is important. It attracts some of the best, and largest,
investment opportunities in our target market and allows us to take meaningful positions in some of
the largest tech-enabled private companies in the world.
Klarna, which accounts for 21.5% of our portfolio at year end, is an excellent example of how private
capital markets are providing liquidity at much higher valuations and on a much “deeper” basis than
had previously been thought possible, Post year end Klarna announced a further funding round at
$45.6 billion. On an adjusted basis for this transaction, the holding would represent 21.4% of the
portfolio.
In November, we changed the name of the Company from Merian Chrysalis Investment Company
Limited to Chrysalis Investments Limited and refreshed the Company’s brand and supporting
communications materials. This change reflects the sale of Merian to Jupiter as well as the growing
reputation and recognition that Chrysalis has in the market.
In order to maintain a pre-eminent position in financing growth companies, the UK needs a modern
and efficient mechanism for companies to list as publicly owned entities. In this regard, we welcome
the proposals put forward by Lord Hill in his Listing Review Report which was published in March 2021.
I am also pleased to report that the Investment Adviser made important contributions to the Review.
In particular, we support the thrust to maintain the UK as an attractive place to list for companies
based both in the UK and overseas. We also agree with the proposals to permit dual class share
structures, to simplify the prospectus regime and to reduce the minimum free float requirements.
These measures, if adopted, will continue to place the UK at the top of the list of venues for listings,
particularly among the growing number of founder-managed, tech companies, as evidenced by
Wise’s decision to seek a listing in London.
Environmental, social and governance considerations, or ESG, as it is known within the corporate
world, has been a growing investment consideration for a number of years.
The Board and the Investment Adviser have established and are currently implementing an ESG policy
which ensures that we are aligning ourselves with best practice in this important area. I am pleased
to note that Jupiter, the Investment Adviser, has also aligned its strategy, purpose and principles with
the UN Global Compact (“UNGC”) such that all investment decision-making and engagement is
guided by the principles of the UNGC. The means investee companies are expected to abide by the
Compact’s Ten Principles, committing to meeting fundamental responsibilities in the areas of human
rights, labour, environment, and anti-corruption. These commitments apply to the investment
management of Chrysalis and are welcomed by the Board.
Jupiter has also committed to achieving net zero emissions by 2050 across its full range of investments
and operations, including the holdings within Chrysalis, reflecting the urgent need to limit global
warming to less than 1.5 degrees Celsius in line with the Paris Agreement.
The investment team, led by Richard Watts and Nick Williamson, is working hard to source and due
diligence the next wave of investments in tech-enabled, growth companies. This will increase the
number of portfolio holdings and lead to a broadening of economic sectors and geographies in
which we are invested. At the same time, the team continues to work to maximise the returns on the
Company’s existing investments and to support management teams on their growth journeys.
In terms of resourcing, the Investment Adviser has been looking to grow its available resources to
match the growing size of Chrysalis. To that end, Nick Williamson recently stepped back from
managing his successful smaller companies listed fund to dedicate himself fully to Chrysalis, which the
Board believes will be to the benefit of shareholders. In addition, the Investment Adviser is currently
looking to add additional employees to ensure sufficient staffing for the next phases of growth.
Finally, I should also like to record my thanks to our shareholders for their continued support.
Andrew Haining
Chairman
29 June 2021
Portfolio Statement
As at 31 March 2021
Date of
acquisition
Cost
(£’000)
Value
(£’000)
% of net
assets Company
Location
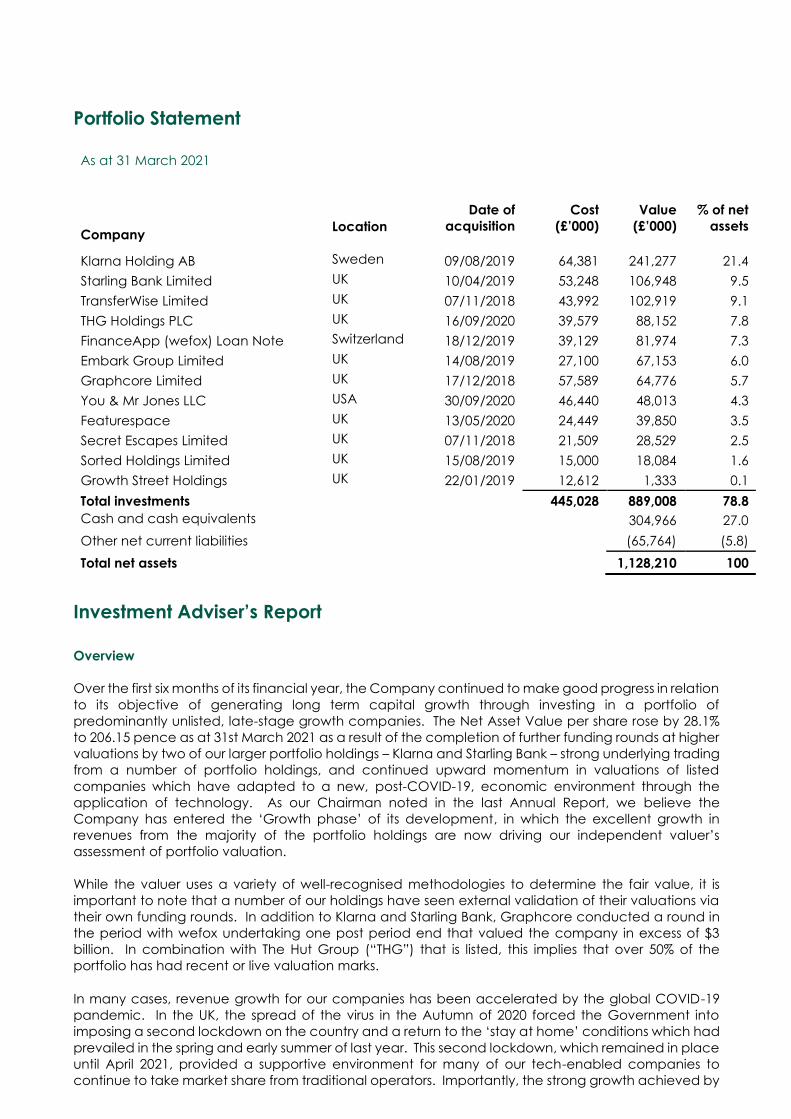
Klarna Holding AB Sweden 09/08/2019 64,381 241,277 21.4
Starling Bank Limited UK 10/04/2019 53,248 106,948 9.5
TransferWise Limited UK 07/11/2018 43,992 102,919 9.1
THG Holdings PLC UK 16/09/2020 39,579 88,152 7.8
FinanceApp (wefox) Loan Note Switzerland 18/12/2019 39,129 81,974 7.3
Embark Group Limited UK 14/08/2019 27,100 67,153 6.0
Graphcore Limited UK 17/12/2018 57,589 64,776 5.7
You & Mr Jones LLC USA 30/09/2020 46,440 48,013 4.3
Featurespace UK 13/05/2020 24,449 39,850 3.5
Secret Escapes Limited UK 07/11/2018 21,509 28,529 2.5
Sorted Holdings Limited UK 15/08/2019 15,000 18,084 1.6
Growth Street Holdings UK 22/01/2019 12,612 1,333 0.1
Total investments 445,028 889,008 78.8
Cash and cash equivalents
304,966 27.0
Other net current liabilities (65,764) (5.8)
Total net assets 1,128,210 100
Investment Adviser’s Report
Overview
Over the first six months of its financial year, the Company continued to make good progress in relation
to its objective of generating long term capital growth through investing in a portfolio of
predominantly unlisted, late-stage growth companies. The Net Asset Value per share rose by 28.1%
to 206.15 pence as at 31st March 2021 as a result of the completion of further funding rounds at higher
valuations by two of our larger portfolio holdings – Klarna and Starling Bank – strong underlying trading
from a number of portfolio holdings, and continued upward momentum in valuations of listed
companies which have adapted to a new, post-COVID-19, economic environment through the
application of technology. As our Chairman noted in the last Annual Report, we believe the
Company has entered the ‘Growth phase’ of its development, in which the excellent growth in
revenues from the majority of the portfolio holdings are now driving our independent valuer’s
assessment of portfolio valuation.
While the valuer uses a variety of well-recognised methodologies to determine the fair value, it is
important to note that a number of our holdings have seen external validation of their valuations via
their own funding rounds. In addition to Klarna and Starling Bank, Graphcore conducted a round in
the period with wefox undertaking one post period end that valued the company in excess of $3
billion. In combination with The Hut Group (“THG”) that is listed, this implies that over 50% of the
portfolio has had recent or live valuation marks.
In many cases, revenue growth for our companies has been accelerated by the global COVID-19
pandemic. In the UK, the spread of the virus in the Autumn of 2020 forced the Government into
imposing a second lockdown on the country and a return to the ‘stay at home’ conditions which had
prevailed in the spring and early summer of last year. This second lockdown, which remained in place
until April 2021, provided a supportive environment for many of our tech-enabled companies to
continue to take market share from traditional operators. Importantly, the strong growth achieved by
these companies is unlikely to be a one-off event; instead, we observe the ongoing digital revolution
is bringing about structural changes in society which is likely to alter the economic landscape forever.
Against this backdrop, we see enormous potential growth for tech-enabled companies in the years
ahead.
We also continue to observe the trend for companies to stay private for longer. This means that a
larger proportion of this growth will be achieved by private companies which are in no hurry to IPO.
By investing in late-stage, pre-IPO companies, as well as listed companies, we believe that Chrysalis is
uniquely well-placed to capture this growth opportunity for shareholders.
Activity in the period under review
Over the six months, we raised a further £300 million in March 2021, following a £95 million raise that
was closed at the end of September 2020, but completed in October 2020, bringing total capital
raised since launch to £770 million. This capital is required to provide follow-on financing, increasingly
at scale, to our existing portfolio of holdings so that they can continue to capture the growth potential
in their chosen markets. In addition, it will allow us to initiate new positions in exciting, tech-enabled
companies, thereby continuing to diversify the portfolio, both by number of stocks, and across a wider
range of economic sectors. We also established a Revolving Credit Facility for £32 million in March
2021 to provide working capital to the Company and some short-term, flexible financing. As of March
2021, £15 million of the facility had been drawn down.
In October, we completed our investment in You & Mr Jones, a US business headquartered in New
York, thereby adding one of the leading companies in digital marketing, or ‘Brandtech’, to the
portfolio.
This deal was the first by Chrysalis outside Europe and reflects our extensive interest in, and
understanding of, this opportunity, partly due to our substantial shareholding via our open-ended fund
range in listed peer, S4 Capital. You & Mr Jones employs 3,000 people across 40 countries and has
made seven acquisitions and 20 strategic investments to build out its product offering. Clients include
Unilever, Adidas, Microsoft, Danone, Reebok, Paypal and Google.
In March 2021, we added a further $10 million to our position in Graphcore as part of a larger funding
round which took place in December 2020. This investment, together with our initial investment in
December 2018, brings our total capital investment in the company to approximately $75 million over
four fund-raising rounds. This ability and willingness to add to our initial investments is increasingly seen
as attractive by many private companies, affording them the opportunity to continue to grow at
supernormal rates via our provision of adequate financing in the late-stage, pre-IPO phase.
Markets and market developments
Equity markets performed well over the six months to 31st March 2021, continuing the recovery from
the short-lived sell off in early 2020. The FTSE 100 rose 14.4%, buoyed by an effective vaccination
programme and the prospect of a re-opening of the UK economy. The tech-heavy NASDAQ index
also performed well, gaining 18.6% over the same period. We believe that markets will continue to
look beyond COVID-19 and assess the impact of an economic recovery which has been fuelled by
unprecedented levels of Government borrowing.
The private equity markets also continued to strengthen from the COVID-19 induced lows and we
have seen a rising number of deals from advisers. During the period, we assessed 74 deals, some of
which were introduced to us, and some of which we initiated ourselves through direct contact with
the management teams and founders.
Portfolio
As at 31st March 2021, the Company had net assets of approximately £1.13 billion, with circa £889
million invested in a portfolio of investments and circa £305 million held in cash. The portfolio comprises
12 holdings – eleven of which are in private companies and one listed company, THG plc.
Our aim is to invest in companies which display a number of characteristics which we call the
“Chrysalis blueprint”. Typically, each company should have a huge addressab le market with
structural tailwinds, be highly innovative and disruptive in nature and should have developed best-in-
class technology enabling it to compete on price, service and convenience. Usually, they will be
founder-led businesses. Companies should also have demonstrated proof of concept, have a clear
roadmap to profitability, and the ability to achieve and sustain exceptional rates of growth.
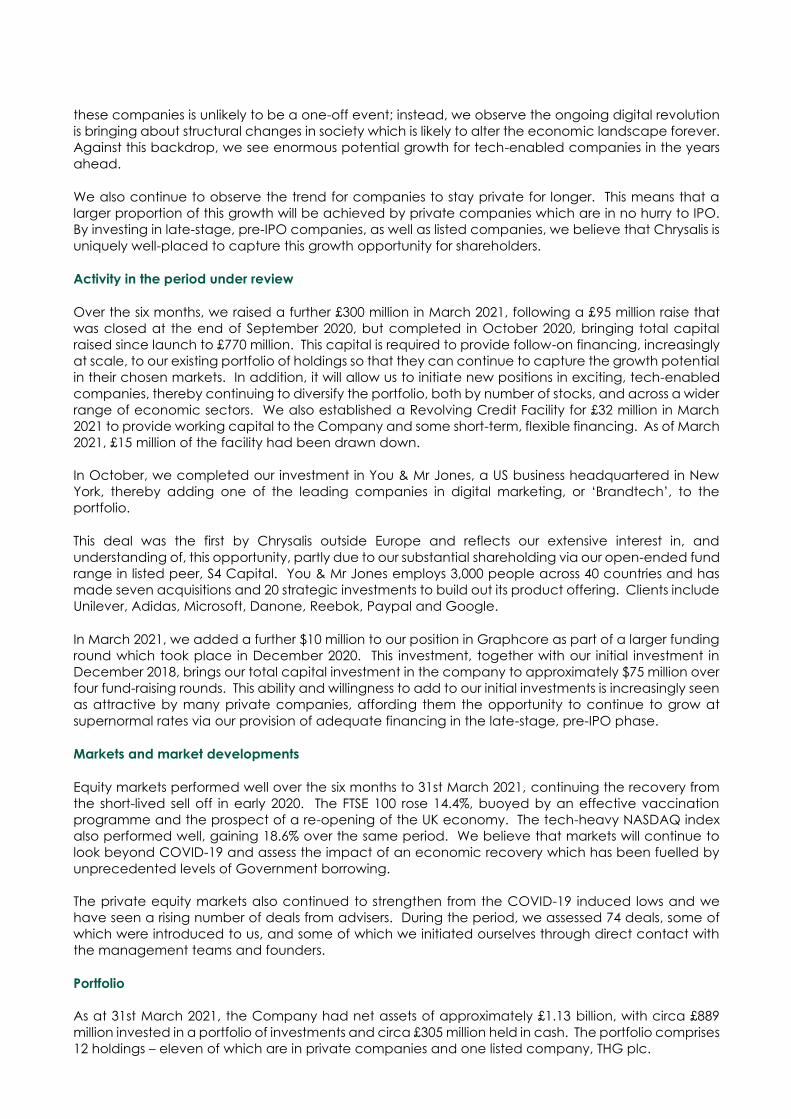
The portfolio is comprised of late-stage, growth companies. By way of example, the portfolio includes
7 positions, representing approximately 83% of the investment portfolio value, which have market
capitalisations of greater than $1billion and are therefore termed ‘unicorns’. Starling was the latest
company to join this group, having successfully completed a major funding round at a £1.3billion post
new-money valuation in March 2021, following a year of exceptional growth over 2020 and a move
into profitability.
Split of investment portfolio by market cap ($ million)
This investment focus on late-stage growth companies is an important feature of our proposition. It
provides a level of comfort that the business models and strategies employed by the investee
companies are sound; it provides assurance that the management teams are proven; and it gives
confidence that the businesses are financially robust. Currently, approximately 47% of the investee
companies are operating profitability. This is marginally down on the figure as of September 2020,
broadly reflecting two counteracting elements. The first is the significant valuation uplift of Klarna,
which is currently loss-making as it scales new markets, which reduced the ratio; the second is the shift
into profitability by Starling Bank, which had a positive impact on the ratio.
Split of portfolio by EBITDA profitability
Source: Chrysalis Investments
Nearly all areas of society are seeing an impact from technology, and this is reflected in the wide
range of sectors the Company has invested in, including areas that are only just beginning to see
technological change, such as insurance. While the portfolio has a significant weighting to financials,
in reality, the companies represented in this sector – such as Klarna, TransferWise (trading as Wise) and
Embark – are all targeting different sub-sectors in a wide market; we do not view them as a
homogenous grouping.
Split of portfolio by sector
We want to continue to diversify into a wider range of sectors, albeit while retaining the focus on tech-
enabled companies.
The portfolio is also becoming more international, as we begin to take advantage of our origination
network’s ability to source strong deal flow from other markets. Our expansion internationally is likely
to continue, but at a measured pace, recognising that the UK still offers many attractive companies.
While the domicile of our investee companies’ headquarters points to a majority of the portfolio being
UK based, on a revenue basis, the portfolio is much more international in nature.
Split of portfolio by HQ location Split of portfolio by revenue origination
Portfolio holdings
Company commentary
Klarna Holding AB
Online shopping is not always frictionless for consumers. Examples range from having to fill in multiple
personal detail fields, particularly when using a new website, and also around returns. Having paid
immediately, consumers can often wait several weeks for returned goods to be checked and the
cost credited back to their account, leaving them out of pocket. This friction results in abandoned
baskets and slower purchase velocity, which lowers retailers’ revenues.
Founded in Stockholm in 2005, Klarna is a leading global payments provider that is revolutionising the
online payment experience by removing friction from customers’ website journeys and allowing them
to control how they pay for goods. To that end, Klarna offers direct payment, payment after delivery
options and instalment plans in a smooth one-click purchase experience that allows users across
Europe and North America to phase their spending. Its technology also allows returned goods to be
credited back to customers’ accounts as soon as it is accepted by the logistics company.
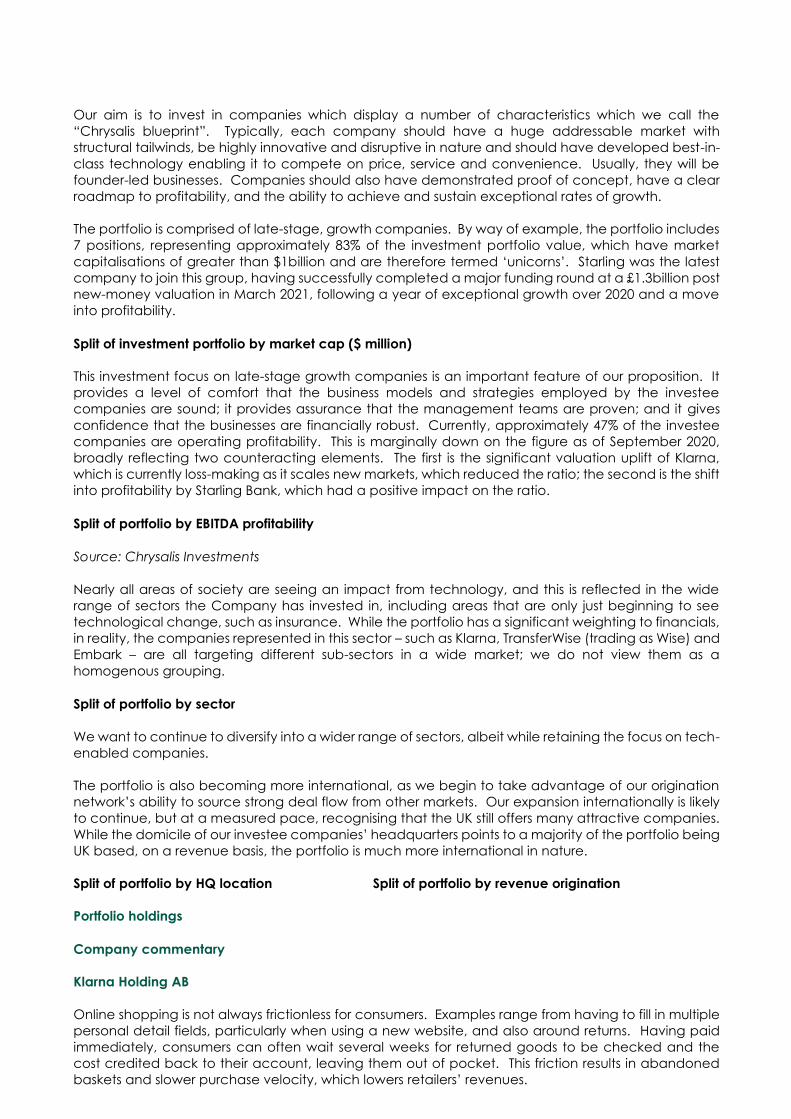
Over recent years, Klarna has typically generated a 30%+ rate of sales growth per annum, but this
accelerated over 2020 to reach $1.2 billion, partly due to the effect of COVID-19 accelerating the
online shift, but also due to the increasing importance of the US market, where Klarna’s more recent
entry is delivering exceptional growth. The progression of gross merchandise volume, a key driver of
revenue, is shown below.
Klarna – Gross Merchandise Volume growth (in SEK rolling 12 million year-on-year)
Achieving market leadership in the US and UK is a key part of our investment thesis and we were
particularly encouraged by growth in the US, which saw customers using the Klarna app more than
double year-on-year to 17 million in April 2021, driving record GMV.
The attractiveness of this growth profile to investors was demonstrated by Klarna’s successful $1 billion
funding round in March 2021 at a valuation of $30 billion pre new money and subsequent $0.6bn
funding round in June 2021 which valued the business at $45.6bn post new money. This most recent
valuation is not reflected in the net asset value of the portfolio as at 31st March 2021.
This compares very favourably with the post new money valuation of $10.65 billion achieved over the
summer of 2020, in which Chrysalis participated to its maximum allowable level.
Given the runway for growth and our confidence in Klarna’s unit economics, we continue to be very
excited about the potential of this position. Post period end, Klarna announced another substantial
funding round, led by Softbank, at a post new-money valuation of $45.6 billion.
Date of Initial Investment: 5th August 2019
Total Investment: £64.4m
Carrying Value: £241.3m
Last Reported Financials: 1Q 2021 trading update
Starling Bank Limited
Banking has traditionally been dominated by the branch model, with technology added on an ad
hoc basis. Branches add cost, particularly as consumers’ demands shift more towards online access,
which is an issue for banks facing ever growing regulatory and shareholder pressure. In addition, the
application of technology a piecemeal fashion typically results in lower functionality, a poor customer
experience, and an inability to scale the bank’s architecture.
Founded by banking expert Anne Boden in 2014, Starling has built a cloud-native, mobile first, scalable
platform that delivers a wide range of financial services to customers. Core products include bank
accounts for both retail and SME customers, which allow users to bank via a mobile app, offering
digital sign-up; instant notification of transactions; insights into spending habits; and 24/7 support.
Starling has also been successful in providing its technology to other financial services businesses and
users via its "Banking-as-a-Service" offering, which allows customers to access its state-of-the-art
payments systems and infrastructure.
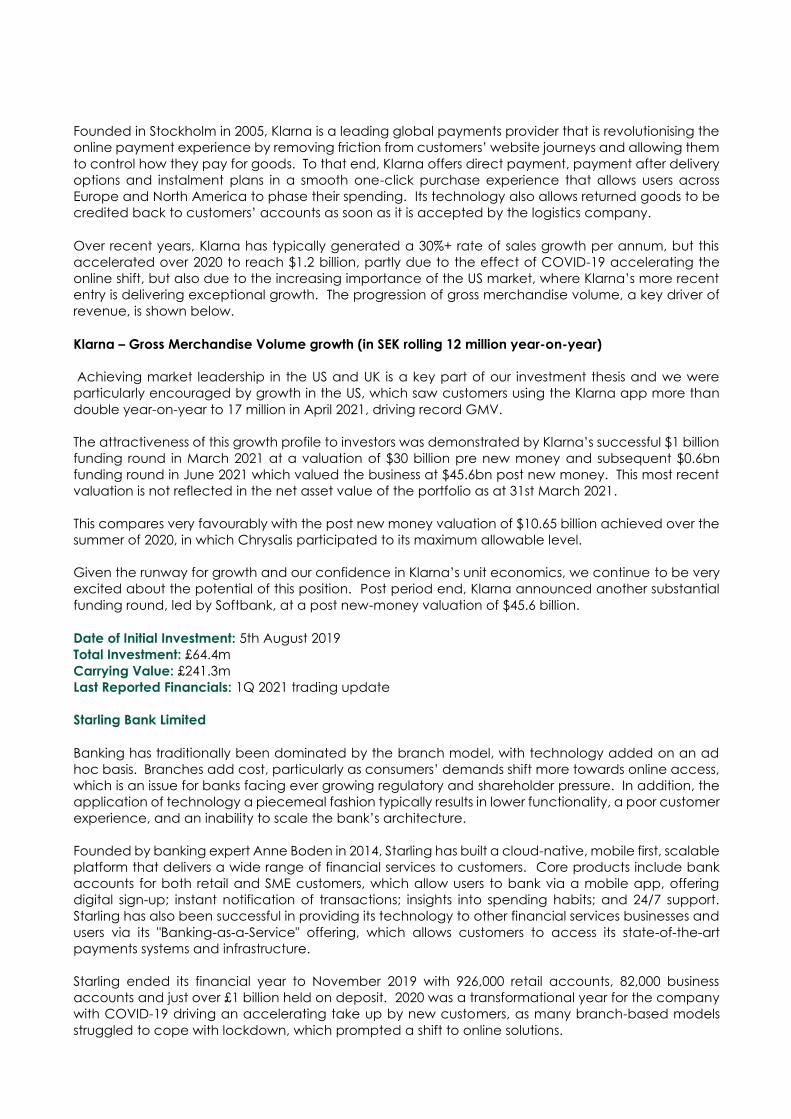
Starling ended its financial year to November 2019 with 926,000 retail accounts, 82,000 business
accounts and just over £1 billion held on deposit. 2020 was a transformational year for the company
with COVID-19 driving an accelerating take up by new customers, as many branch-based models
struggled to cope with lockdown, which prompted a shift to online solutions.
Starling – Customer deposit growth £m
Starling saw rapid growth over 2020 and, by March 2021, the bank had opened more than 2 million
accounts – of which 300,000 were business accounts – and had seen deposits balloon to £5.4 billion,
reflecting over 250% Compound Annual Growth (“CAGR”) since November 2019.
In addition, Starling generated approximately 400% revenue growth in the year to January 2021, as it
began to lend to Small to Medium-sized Enterprises (“SMEs”), generating an annualised revenue run
rate of c£145 million. Given operating costs remained broadly flat over the year – testimony to its
platform efficiency – the bank turned profitable over 4Q 2020 and as of January 2021, was generating
annualised operating profit of £18 million.
This performance culminated in a substantial funding round in March 2021, led by Fidelity, alongside
the Qatar Investment Authority, RPMI Railpen and Goldman Sachs, which raised approximately £322
million in total and valued the bank at £1.3 billion post new-money.
Given the momentum in the business and the current on-going re-opening of the UK economy
following lockdown, we are optimistic of further growth in the year ahead.
Date of Initial Investment: 12th February 2019
Total Investment: £53.2m
Carrying Value: £106.9m
Last Reported Financials: Limited financial information released in January 2021
TransferWise Limited (trading as Wise)
Every year, more than $10 trillion is transferred internationally. However, traditional bank networks are
local, making international money transfers slow, expensive and inconvenient. The cost of transfers to
both individuals and businesses continues to be far too high across the industry and transactions are
typically advertised with zero or low fees despite hidden charges in the exchange rate mark-up. As of
March 2020, the World Bank estimated the global average total cost of remittance to be 6.8% of the
transfer value.
Wise is a global technology company that was founded with the aim of reducing the fees associated
with sending money across borders. With a simple money transfer platform and borderless accounts,
Wise makes it quick and easy for individuals who travel, live and work internationally to manage their
money. Businesses can also use Wise to pay suppliers or employees overseas, request payments from
customers, and transfer funds between their own accounts in different countries.
Wise’s pricing is always transparent, with the full cost of the transaction shown upfront. On average it
costs 0.69% of the transfer value to move money across borders and for some established currency
routes like GBP-EUR, the fee is less than 0.4%.
In the quarter to March 2021, Wise had 10 million customers, moving over £5 billion per month.
Currently 38% of all transactions happen instantly (up from 34% in the prior quarter) with about 75%
happening within an hour. Wise releases limited financial information, so the most recent results
remain those for the year ended March 2020 when £67 billion in customer payments were processed
by Wise – an uplift of c86% from the previous year – and it was the fourth consecutive year that the
company has been profitable whilst continuing to scale rapidly. Revenues during the year increased
approximately 70% to £302.6 million and EBITDA increased from approximately £18 million to
approximately £42 million with the implied EBITDA margin increasing by about 3.7 percentage points
to 14.0%. Over 100,000 new business customers were acquired in the financial year and total customer
numbers increased from five million to seven million.
Despite Wise’s strong valuation returns for us over recent years, we continue to be optimistic regarding
the outlook for this position. With a small share in a massive market and a compelling offering, the
outlook for ongoing growth looks favourable.
Date of Initial Investment: 7th November 2018
Total Investment: £44.0m
Carrying Value: £ 102.9m
Last Reported Financials: Annual report to March 2021
THG plc
E-commerce has been a feature of modern life for many years now, albeit it is still capturing a growing
proportion of customers’ wallets versus the offline equivalent. However, the complexities of
integrating a full e-commerce proposition can be daunting, even for multinationals. Considerations
include warehouse management; parcel sortation optimisation; global logistics capability; website
creation, translation and near-customer hosting; returns capability; and data capture.
THG is an e-commerce business that operates a highly scalable, end-to-end proprietary technology
platform (Ingenuity) powering the sale of both its own brands and third-party brands. Accessing
Ingenuity provides a cost-effective solution for companies to begin distributing their products online.
The firm has invested significantly in its infrastructure, technology platform and brands and is one of
the world's largest online beauty and well-being businesses.
The key event last year was THG’s IPO in September 2020. Since that time, its shares have performed
well, rising from 500p at flotation, to close the period at 623.5p, having touched 800p in January.
Operationally, the company has performed very strongly, executing on a number of pieces of M&A,
including Perricone (for an apparently highly attractive multiple of one times sales); and Dermstore (a
$350 million acquisition of the US number one pure-play online retailer of specialty beauty and
skincare brands). We believe these acquisitions will drive substantial value generation for shareholders
over the coming years.
The recent financial performance of the business has been impressive, with the quarter to March 2021
seeing 58% growth, compared with 42% over 2020 as a whole, with Ingenuity seeing exceptional
growth of 188% over 1Q 2021.
On the ESG front, THG also launched THG Eco, which forms the backbone of THG’s sustainability plans;
the company recently achieved Carbon Neutral status. Date of Initial Investment: 17th December 2018
Total Investment: £39.6m
Carrying Value: £88.2m
Last Reported Financials: 1Q 2021 trading update
FinanceAPP AG (“wefox”)
The vast majority of insurance policies across Europe are still sold via brokers. These brokers typically
operate from a high-street store and do not enjoy the benefits of scale or technology. Customers are
also often dissatisfied with their current insurance experience as customer service is poor and
insurance products are not tailored to fit their particular needs.
wefox is looking to solve these problems by aggregating insurance brokers onto a digital platform and
then enabling them to distribute fully digital and customised insurance products to their customers,
resulting in market leading prices and service.
The company performed extremely well over the period. wefox hit €10 million of Gross Revenue in
September 2020, the first €20 million revenue month in December 2020 and the first €30 million revenue
month in January 2021. This extraordinary rate of growth has been driven by the company’s ability to
launch new digital insurance products and enter new territories throughout Europe such as
Switzerland, Austria and Poland.
What sets wefox apart from many of its peers is its ability to combine high rates of growth with very
profitable unit economics. The company has publicly stated that is expects to achieve revenues of
€300 million in 2021 and be profitable at an operating level. This was a core part of our investment
thesis, and we believe that this dynamic will eventually make wefox a very strong candidate to IPO.

Date of Initial Investment: 5th December 2019
Total Investment: £39.1m
Carrying Value: £82.0m
Last Reported Financials: Not available
Embark Group Limited
In recent years, the Wrap Platform Market has continued to invest in technology while the traditional
Self-Invested Personal Pension (“SIPP”) and Small Self Administrated Schemes (“SSAS”) players have
relied on product knowledge. Embark was formed to combine the technology strengths of the Wrap
Platforms with the extensive pensions expertise of the typical SIPP and SSAS providers in order to deliver
specialist and tech-enabled solutions to both retail and corporate customers.
Embark is a full-scale retirement solutions provider, with platform, investment wrap, e-SIPP, SIPP, SSAS,
fund research and employee benefits consulting capabilities. The Group trades under the subsidiary
brands Embark, Vested, Rowanmoor, EBS, The Adviser Centre, DISCUS and Hornbuckle.
It also operates a wide portfolio of white-label technology solutions for businesses such as RBS Coutts,
Standard Life, Nutmeg, BestInvest, Charles Stanley, Moneyfarm and Wealthsimple.
Embark is one of the fastest growing digital retirement and savings businesses in the UK market. The
Group is experiencing strong demand for its digital services and the capital it has previously raised will
enable it to take full advantage of its disruptive position in the UK savings sector, through continued
technological innovation and selective expansion opportunities. Since our initial investment, Embark
has completed two material transactions which significantly enhanced its market position. The
company acquired the advised and partnership client books of Alliance Trust Savings (“ATS”) in
October 2019 and then completed its acquisition of Zurich’s Investment and Retail Platform through
April 2020.
A significant milestone was achieved during the current financial period with the migration of over £7
billion of advised assets onto the Embark platform from the client books of ATS. The migration of assets
is a complex process that carries inherent risk, but the company successfully delivered on its migration
plans set out at the time of acquisition.
Successfully migrating these assets eliminates significant operational and regulatory risk from the
business and will lead to material cost savings and enhanced profitability over the course of 2021.
Date of Initial Investment: 3rd July 2019
Total Investment: £27.1m
Carrying Value: £67.2m
Last Reported Financials: Report & accounts to December 2019
Graphcore Limited
The application of machine learning (“ML”) and artificial intelligence (“AI”) continues to gain traction
across society, from seemingly mundane tasks like directing call centre chat bots, to understanding
voice commands and autonomous driving. Work we commissioned in late 2019 predicted the ML/AI
chip market would grow to nearly $9 billion by 2023, from approximately $2.6 billion in 2019, illustrating
the market’s substantial growth potential.
ML/AI programmes have traditionally been run on graphics processing units (“GPUs”) being the best
architecture available to accelerate the huge workloads these models require. However, GPUs
require algorithms to be optimised to suit their modus operandi to gain maximum efficiency. This
means data scientists can be restricted in their model choice: the model is chosen to fit the hardware,
rather than the problem it is trying to address.
Graphcore is a leading machine intelligence semiconductor business, which has developed the
Intelligence Processing Unit (“IPU”). The IPU is completely different from today’s Central Processing
Unit (“CPU”) and GPU processors. It is a highly flexible, easy to use, parallel processor that has been
designed from the ground up to deliver state of the art performance on today’s machine intelligence
models for both training and inference. The IPU has been designed to allow new and emerging
machine intelligence workloads to be realised. As well as designing one of the world’s most
sophisticated silicon processor, Graphcore has also built the world’s very first graph tool chain
specifically designed for machine intelligence – the Poplar software stack.
Graphcore achieved a significant milestone last year when it introduced its second-generation IPU
platform (“MK2”) in July 2020. This has greater processing power, more memory, and built-in scalability
for handling extremely large MI workloads. The initial performance benchmarks that Graphcore
publicly released were impressive and demonstrated state of the art performance and accuracy
across several complex AI models such as BERT and ResNeXt. The company remains focused on
building out its commercial opportunities based on this new technology.
To that end, Graphcore secured an additional $222 million of primary capital in December 2020 as
part of a Series E funding round. This funding round was completed at a pre-money valuation of $2.5
billion and saw participation from new and existing investors. The business is now extremely well
capitalised, with cash of $440 million, which will support its continuing, major R&D investment and
global expansion.
Customer engagement is growing rapidly across a range of corporations, organisations and research
institutions, with users of Graphcore systems including Microsoft, Oxford Nanopore, Citadel and
Qwant. The past twelve months have been transformational for Graphcore as the business has
transitioned from development to prepare for volume production. Demand for IPU products is
increasing among new and existing customers, and we look forward with optimism.
Date of Initial Investment: 17th December 2018
Total Investment: £57.6m
Carrying Value: £64.8m
Last Reported Financials: Report and accounts to December 2019
You & Mr Jones LLC
Along with other industries, the world of marketing is adjusting to the impact of technology on its
consumers. In particular, the rise of the mobile phone has meant digital marketing now accounts for
nearly half of the $640 billion total annual media spend.
While marketeers have perfected the television marketing playbook, the digital marketing toolkit is still
relatively immature. Consumers create their own content and discuss brands online, requiring
companies to have a much more responsive marketing product. In addition to this speed, they need
to create, curate, and disseminate product across multiple platforms and deal with the resulting huge
quantities of data. All of this causes efficiency problems.
You & Mr Jones is at the forefront of digital marketing or “Brandtech”. Its offering is based around the
OMG technology platform, which allows marketers to plan, create and distribute digital campaigns
seamlessly. This operating system offers a significant productivity boost to clients and has enabled
some to make material cost savings. The company is headquartered in New York (US), employs
approximately 3,000 people across 40 countries and has made seven acquisitions and 20 strategic
investments to date to build out its product offering. Clients include Unilever, Adidas, Microsoft,
Danone, Diageo, Reebok, Reckitt Benckiser, PayPal and Google.
You & Mr Jones is a recent addition to our portfolio; our investment was made at the end of September
2020. The last public data released by the company was for 3Q 2020, when net revenue organic
growth for the nine months to September 2020 was 27% year-on-year.
You & Mr Jones has a close comparator in the listed market – S4 Capital – which is exposed to the
same growth drivers. As of 1Q 2021, S4 Capital reported organic gross profit (net revenue) growth of
33% year-on-year, which compares favourably to 19.4% growth reported over 2020.
With a compelling offering in a market ripe for disruption, we are very excited about the prospects for
You & Mr Jones.
Date of Initial Investment: 6th October 2020
Total Investment: £46.4m
Carrying Value: £48.0m
Last Reported Financials: Not available
Featurespace Limited
Fraud is an occupational hazard for banks and other financial institutions. In areas such as card fraud,
models are deployed that look for suspicious activity and block it before illegal transactions can
occur. Fraudulent behaviour can change very quickly, particularly in an online world, and rules-based
models are non-adaptive. This means that the rulebook goes out of date rapidly, resulting in rising
fraud unless more rules are written. If the rules are too tight, then the financial institution receives too
many false positives, resulting in lost revenue through lower lending or transaction volumes. Typically,
this also increases the number of in-bound calls to customer service agents in the form of complaints,
requiring higher levels of staffing. If too many rules are written, the rulebook becomes unwieldy and
time consuming to manage.
Featurespace has invented Adaptive Behavioural Analytics and created the ARIC Risk Hub, which
utilises real-time machine learning software to risk-score events in more than 180 countries to prevent
fraud and financial crime. By analysing anomalies in individuals’ transactions, ARIC Risk Hub can
automatically identify emerging fraud attacks and suspicious activity in real-time, without requiring
constant retraining. Over 30 major global financial institutions use ARIC Risk Hub to protect their
businesses and customers, including four of the five largest banks in the UK.
Featurespace responded extremely well to lock-down and its risk models adapted automatically to
the pandemic related shift in spending patterns – most notably a move from “card present”
transactions to “card not present” – as publicly endorsed by their largest customer. One of the
company’s revenue streams is transaction based, and this did see a temporary drop off over the initial
parts of lockdown. However, this has recovered meaningfully since, and the new business pipeline
looks exceptionally robust. The company has also enjoyed significant industry recognition, winning
The Queen’s Award for Enterprise and seeing NatWest recognized at The Card and Payments Awards
for “Best Security and Anti-Fraud Development” following its enterprise-wide deployment of
Featurespace’s solutions.
This, combined with on-going innovations such as the February 2021 launch of Automated Deep
Behavioral Networks that uses deep learning to provide enhanced defence against card fraud, gives
us confidence of further progress in the year ahead.
Date of Initial Investment: 13th May 2019
Total Investment: £24.4m
Carrying Value: £39.8m
Last Reported Financials: Annual report & accounts to December 2019
Secret Escapes Limited
Every year hotels struggle to manage their capacity and are often left with unoccupied rooms that
impact yield. They are often unwilling to market these rooms at discounted prices in case this affects
their brand and ability to price in the future.
Secret Escapes Limited (“Secret Escapes”) is a members-only online travel company. Its digital
marketplace uses innovative technology to connect travellers with discounts on luxury hotels and
travel experiences. It helps hotels minimise unsold inventory by allowing them to discreetly market to
its members who are seeking luxury travel at affordable prices. The firm operates in many countries
around the world and is the market-leading membership-based travel company in Germany, UK,
Czech Republic, Poland, Slovakia and the Nordics.
The rolling lockdowns of the last 15 months have created a tough backdrop for an online travel
business, and we supported the company with additional capital over 2020 to allow it to continue to
invest in the offering and bolster its balance sheet in time of stress.

Early signs from the wider travel market appear to indicate a substantial backlog of demand for
holiday travel, and, while recent trading has been correlated with local lockdown laws, we are
optimistic that the company will recover strongly as the travel market reopens.
Date of Initial Investment: 7th November 2018
Total Investment: £21.5m
Carrying Value: £28.5m
Last Reported Financials: Annual report and accounts to December 2019
Sorted Holdings Limited
Integration with a logistics carrier and its services is one of the most complex and difficult connections
for an e-commerce site to develop, especially on a global basis. Providing an easy-to-use API
connection requires specialist knowledge to build and continual maintenance. This can be time
consuming and expensive. Retail is also becoming increasingly global and building APIs to carriers
worldwide and managing different commercial terms and pricing models is an increasingly complex
problem.
Sorted is a Manchester-based, global Software as a Service (SaaS) company that has developed a
delivery management platform that allows retailers (both digital and physical) to effectively manage
their delivery and returns proposition. This enables retailers to increase conversion rates, reduce
abandoned baskets, and maintain customer loyalty.
Throughout 2020, retailers increasingly relied on their digital capabilities and this has led to increased
focus and investment on their online propositions. Sorted has benefitted from this trend and the
company has won a number of enterprise clients that will go live over the course of 2021. Shipment
volumes continue to grow rapidly and, in January 2021 alone, Sorted saw a 243% increase in volume
through its SaaS platform in comparison to the same period in 2020.
Date of Initial Investment: 15th August 2019
Total Investment: £15.0m
Carrying Value: £18.1m
Last Reported Financials: Exempt from publishing accounts
Growth Street Holding Limited
Growth Street was set up to provide innovative and flexible revolving credit lines to SMEs. As previously
reported, two large loans defaulted early in the 2020 financial year. In combination with changes to
the peer-to-peer funding market and accentuated by the pandemic, a decision was taken in 2020
to wind down the company. The Investment Adviser worked with other shareholders to support the
business through this difficult time and, in later 2020, a decision was taken to accelerate returns to
investors that funded the Growth Street platform, such that they received full recoveries. While this
decision modestly increased the risk of a lower wind-down value for Chrysalis Investments, the
Investment Adviser believed ensuring no losses for retail customers was the responsible course of
action.
In April 2021, Growth Street concluded its solvent wind down and commenced its liquidation process.
Given it was relatively early stage at the time of investment, compared with other portfolio
companies, Growth Street was a small position in the portfolio. It is currently held at a nominal amount,
reflecting a reasonable estimation of its wind-down value.
Date of Initial Investment: 24th January 2019
Total Investment: £12.6m
Carrying Value: £1.3m
Last Reported Financials: Small companies’ exemption
Environmental, Social & Governance (‘ESG’)
The board has established an ESG policy for the Company in respect of its investments which focuses
on four key areas:
• Corporate governance – which considers the quality of the management team, succession,
shareholder alignment and incentivisation.
• Human Capital – given the competitive and evolving nature of tech-enabled companies,
consideration is given to how businesses attract, remunerate and retain talented individuals.
The focus extends to training, diversity and inclusion.
• Cyber and data security – assessing policies on data security and the use of customer
information.
• Business ethics – assessing sales practices, regulatory affairs and supply chains.
This policy is applied when considering new positions as part of due diligence work and the Investment
Adviser also engages on an ongoing basis with management teams of the portfolio holdings to ensure
that it understands each respective company’s own ESG policies, goals and reporting.
The Chrysalis approach is to be an active and engaged shareholder, challenging and supporting
management teams in developing their business, while remaining considerate of the opportunities
and risks that ESG factors might prevail upon them. While the Company’s fundamental ability to set
the ESG agenda is only based upon its percentage ownership of an investee company – which can
vary significantly across the portfolio – the Investment Adviser typically finds that by adopting this
approach it can influence the agenda for each of the Board of Directors.
Pipeline and Outlook
As at 31st March 2021, the Company has approximately £305 million of cash to invest. As part of the
equity raise in early 2021, we detailed a pipeline of new investment opportunities representing in
excess of £1 billion and the potential to make follow on investments of up to £250 million. As a team,
we are focused on investing this capital as well as supporting growth of the existing portfolio and
harvesting returns from earlier investments.
We continue to work hard to generate proprietary deal flow, as we believe this is the best way to
access the best deals on the most attractive terms. Our larger scale and growing reputation enable
us to engage with founders of outstanding businesses in the UK and, increasingly, in Europe and the
US.
Over the first part of the calendar year, concerns about a rise in the yield of the 10 year US Treasury
prompted some volatility in the valuations of technology stocks, particularly where valuations are
elevated and unsupported by positive cash flows. As the world begins to emerge from the enforced
lockdowns of the last fifteen months, it is likely that economic activity will bounce back in the short
term, perhaps keeping yields higher for a period of time, which may lead to further uncertainty and
volatility in tech valuations.
Our approach to investing is to find companies whose growth rates are so compelling, whose
addressable markets are so vast, and whose technological edges are so profound, that we believe
they will continue to appreciate in value regardless of higher discount rates. We continue to see a
strong pipeline of companies that meet these criteria and as of mid-June are currently in later-stage
due diligence on two new potential investments, and have line-of-sight on a follow-on opportunity,
having recently participated in wefox’s funding round, where we committed €30 million to the
process.
When we launched Chrysalis it was based on a hypothesis of a “blurring of the lines” between private
and public investing. The last few years have convinced us this was a correct supposition. Late-stage
investing in Europe has grown rapidly since our IPO and our proposition of crossover has resonated
very strongly with entrepreneurs. As Chrysalis has managed to grow into a meaningfully sized vehicle,
this scale is enhancing our proposition’s credentials and we are seeing roughly twice as many deals
via our origination channel as this time last year.
This market growth, combined with our early-mover advantage, differentiated proposition and now
scale means we believe that Chrysalis has only begun to scratch the surface of its potential. We look
forward to the rest of the year with optimism.
Investment Objective and Policy
Investment objective
The investment objective of the Company is to generate long term capital growth through investing
in a portfolio consisting primarily of equity or equity-related investments in unquoted and listed
companies.
Investment policy
Investments will be primarily in equity and equity-related instruments (which shall include, without
limitation, preference shares, convertible debt instruments, equity-related and equity-linked notes
and warrants) issued by portfolio companies. The Company will also be permitted to invest in
partnerships, limited liability partnerships and other legal forms of entity where the investment has
equity like return characteristics.
For the purposes of this investment policy, unquoted companies shall include companies with a
technical listing on a stock exchange but where there is no liquid trading market in the relevant
securities on that market (for example, companies with listings on The International Stock Exchange
and the Cayman Stock Exchange). Further, the Company shall be permitted to invest in unquoted
subsidiaries of companies whose parent or group entities have listed equity or debt securities.
The Company may invest in publicly traded companies (including participating in the IPO of an
existing unquoted company investment), subject to the investment restrictions below. In particular,
unquoted portfolio companies may seek IPOs from time to time following an investment by the
Company, in which case the Company may continue to hold its investment without restriction.
The Company is not expected to take majority shareholder positions in portfolio companies but shall
not be restricted from doing so. Further, there may be circumstances where the ownership of a
portfolio company exceeds 50% of voting and/or economic interests in that portfolio company
notwithstanding an initial investment in a minority position. While the Company does not intend to
focus its investments on a particular sector, there is no limit on the Company’s ability to make
investments in portfolio companies within the same sector if it chooses to do so.
The Company will seek to ensure that it has suitable investor protection rights through its investment in
portfolio companies where appropriate.
The Company may acquire investments directly or by way of holdings in special purpose vehicles,
intermediate holding vehicles or other fund or similar structures.
Investment restrictions
The Company will invest and manage its assets with the objective of spreading risk, as far as
reasonably practicable.
No single investment (including related investments in group entities) will represent more than 20% of
Gross Assets, calculated as at the time of that investment. The market value of individual investments
may exceed 20% of gross assets following investment.
The Company’s aggregate equity investments in publicly traded companies that it has not previously
held an investment in prior to that investment’s IPO will represent no more than 20% of the Gross Assets,
calculated as at the time of investment.
Subject in all cases to the Company’s cash management policy, the Company’s aggregate
investment in notes, bonds, debentures and other debt instruments (which shall exclude for the
avoidance of doubt convertible debt, equity-related and equity-linked notes, warrants or equivalent
instruments) will represent no more than 20% of the Gross Assets, calculated as at the time of
investment.
The Company will not be required to dispose of any investment or rebalance its portfolio as a result of
a change in the respective value of any of its investments.
Board Members
The Board comprises five independent non-executive Directors who meet at least quarterly, in
addition to ad hoc meetings convened in accordance with the needs of the business, to consider
the Company’s affairs in a prescribed and structured manner. All Directors are considered
independent of the Investment Adviser for the purposes of the AIC Code and Listing Rule 15.2.12A.
The Board is responsible for the Company’s long term sustainability success and the generation of
value for shareholders. In doing so, the Board oversees the business affairs of the Company in
accordance with the Articles of Incorporation, the investment policy and with due regard to the wider
interests of stakeholders as a whole. Additionally, the Board has overall responsibility for the
Company's activities including its investment activities and reviewing the performance of the
Company's portfolio. The Board is confident that the combination of its members is appropriate and
is such that no one individual or small group of individuals dominates the Board’s decision making.
The Directors, in the furtherance of their duties, may take independent professional advice at the
Company’s expense, which is in accordance with provision 19 of the AIC Code. The Directors also
have access to the advice and services of the Company Secretary through its appointed
representatives who are responsible to the Board for ensuring that the Board’s procedures are
followed, and that applicable rules and regulations are complied with.
To enable the Board to function effectively and allow the Directors to discharge their responsibilities,
full and timely access is given to all relevant information.
Comprehensive board papers are circulated to the Board in advance of meetings by the Company
Secretary, allowing time for full review and comment by the attending parties. In the event that
Directors are unable to attend a particular meeting, they are invited to express their views on the
matters being discussed to the Chairman in advance of the meeting for these to be raised
accordingly on their behalf. Full and thorough minutes of all meetings are kept by the Company
Secretary.
The Directors are requested to confirm their continuing professional development is up to date and
any necessary training is identified during the annual performance reviews carried out and recorded
by the Remuneration and Nomination Committee.
The current Board has served since the Company’s inception in October 2018 and has been carefully
selected against a set of objective criteria. The Board considers that the combination of its members
brings a wealth of skills, experience and knowledge to the Company, as illustrated in their biographies
below. As part of the on-going review of Board composition, skills analysis and succession planning,
an independent consultant has been engaged and is currently working to source a sixth non-
executive director:
Director Biographies
Andrew Haining (Chairman) (independent)
Andrew has had a 30-year career in banking and private equity with Bank of America, CDC (now
Bridgepoint) and Botts & Company. During his career, Andrew has been responsible for over 20
private equity investments with transactional values in excess of $1bn.
Andrew holds several Guernsey and UK board positions.
Stephen Coe (senior independent)
Stephen serves as Chairman of the Audit Committee. He is currently a Director and Chairman of the
Audit Committee of Weiss Korean Opportunities Fund Limited, and a Non-Executive Director of River
and Mercantile UK Micro Cap Investment Company Limited. Stephen has been involved with offshore
investment funds and managers since 1990, with significant exposure to property, debt, emerging
markets and private equity investments. Stephen qualified as a Chartered Accountant with Price
Waterhouse Bristol in 1990 and remained in audit practice, specialising in financial services, until 1997.
From 1997 to 2003 Stephen was a director of the Bachmann Group of fiduciary companies and
Managing Director of Bachmann Fund Administration Limited, a specialist third party fund
administration company. From 2003 to 2006 Stephen was a director with Investec in Guernsey and
Managing Director of Investec Trust (Guernsey) Limited and Investec Administration Services Limited.
Stephen became self-employed in August 2006, providing services to financial services clients.
Simon Holden (independent)
Simon Holden (British, Guernsey Resident) is a Chartered Director (CDir) and Fellow of the Institute of
Directors and adds extensive private equity investing and corporate operations experience to the
Company’s board. Previously an investment director at Terra Firma Capital Partners, Candover
Investments prior to that, Simon has been an active independent director to listed investment trusts,
private equity funds and trading company boards since 2015. In addition, Simon acts as the pro-bono
Business Adviser to the States of Guernsey's Trading Assets that operate all of the Bailiwick’s critical
airports, harbours and maritime fuel supply infrastructure.
Simon graduated from the University of Cambridge with an MEng and MA (Cantab) in Manufacturing
Engineering. He is a member of the Association of Investment Companies (‘AIC’), Institute of Directors
(‘IoD’), Guernsey Investment Funds Association (‘GIFA’) and several other financial services and
intellectual property interest groups.
Anne Ewing (independent)
Anne has over 35 years of financial services experience in banking, asset and fund management,
corporate treasury, life insurance and the fiduciary sector. Anne has an MSc in Corporate
Governance and is a Chartered Fellow of the Securities Institute and a Fellow of ICSA. Anne has held
senior roles in Citibank, Rothschilds, Old Mutual International and KPMG and latterly has been
instrumental in the start-ups of a Guernsey fund manager and two fiduciary licensees.
Anne has several non-executive Directorships and chairman roles in investment companies and a
banking and trust company group in the Channel Islands and in London.
Tim Cruttenden (independent)
Tim is Chief Executive Officer of VenCap International plc, a UK-based asset management firm
focused on investing in venture capital funds. He joined VenCap in 1994 and is responsible for leading
the strategy and development of the firm. Prior to joining VenCap, Tim was an economist and
statistician at the Association of British Insurers in London. He received his Bachelor of Science degree
(with honours) in Combined Science (Economics and Statistics) from Coventry University and is an
Associate of the CFA Society of the UK. Tim is a non-executive director of Polar Capital Technology
Trust.
Interim Management Report For the 6 month period ended 31 March 2021
Risks and Uncertainties
There are several potential risks and uncertainties which could have a material impact on the
Company's performance and could cause actual results to differ materially from expected and
historical results.
The AIFM has overall responsibility for risk management and control within the context of achieving
the Company’s objectives. The Board agrees the strategy for the Company, approves the
Company’s risk appetite and the AIFM monitors the risk profile of the Company. The AIFM also
maintains a risk management process to identify, monitor and control risk concentration.
The Board’s responsibility for conducting a robust assessment of the principal and emerging risks is
embedded in the Company’s risk map, which helps position the Company to ensure compliance with
the Association of Investment Companies Code of Corporate Governance (the “AIC Code”).
The main risks that the Company faces arising from its financial instruments are:
(i) market risk, including:Price risk, being the risk that the value of investments will fluctuate because
of
changes in market prices;
– interest rate risk, being the risk, that the future cash flows of a financial instrument will fluctuate
because of changes in interest rates; and
– foreign currency risk, being the risk that the value of financial assets and liabilities will fluctuate
because of movements in currency rates.
(ii) credit risk, being the risk that a counterparty to a financial instrument will fail to discharge an
obligation or commitment that it has entered with the Company.
(iii) liquidity risk, being the risk that the Company will not be able to meet its liabilities when they fall
due. This may arise should the Company not be able to liquidate its investments.
(iv) company failure, being the risk that companies invested in may fail and result in loss of capital
invested.
To manage such risks the Company shall comply with the investment restrictions and diversification
limits provided for in the Prospectus.
The Company will invest and manage its assets with the objective of spreading risk. Further to the
investment restrictions discussed, the Company also seeks to manage risk by:
• not incurring debt over 20% of its NAV, calculated at time of drawdown. The Company will target
repayment of such debt within twelve months of drawdown; and
• entering from time to time into hedging or other derivative arrangements for the purposes of
efficient portfolio management, managing where appropriate, any exposure through its
investments to currencies other than Sterling.
Emerging risks
Whilst vaccination programmes are being rolled out and, at the interim period end, the outlook for
the economy is improving, COVID-19 remains an on-going risk and remains a source of uncertainty.
In considering this risk, the Board’s thought process has been as follows:
The Directors have carried out a robust assessment of the Company’s processes for monitoring
operating costs, share price discount, the Investment Adviser’s compliance with the investment
objective and policy, asset allocation, the portfolio risk profile, counterparty exposure, liquidity risk
and financial controls. At 31 March 2021, the Company had cash and cash equivalents of
£304,966,000 and current liabilities of £66,588,000. Therefore, the Company is able to settle its debts
and continue its business with no interruptions.
Among the aims of the Company, as set out at IPO, are to invest in companies that have both the
ability to deliver growth rates substantially higher than the average UK plc and that can protect the
duration of those rates via competitive advantage, e.g., via scale or technology. This led the
Investment Adviser towards a group of businesses it labelled “tech-enabled disrupters”.
Given the shutdown of many “traditional” areas of the economy, businesses and consumers have
had to rely much more heavily on technology and online channels. These were sectors already
growing faster than the wider economy but have now been given added impetus. Not only can this
lead to higher growth rates in the short term, but it can also drive new user adoption at significantly
lower cost than previously experienced.
The Directors monitor the performance of the portfolio investments on a quarterly basis and receive
monthly data in some instances which enables them to track the development of the Investment
Adviser’s investment theses.
The Board have considered the operations of the services providers as they relate to the Company.
With this in mind, the Board believe the Company is well-positioned at this particular time from a
thematic perspective and the strategy of the Company therefore remains unchanged.
The Board will of course continue to assess the position as more information about the impact of the
virus becomes available.
Going Concern
In assessing the going concern basis of accounting, the Directors have assessed the guidance issued
by the Financial Reporting Council and considered recent market volatility and the potential impact
of COVID-19 virus on the Company’s investments. After making enquiries and bearing in mind the
nature of the Company’s business and assets, the Directors consider that the Company has adequate
resources to continue in operational existence for at least twelve months from the date of approval
of the Unaudited Condensed Interim Financial Statements. For this reason, they continue to adopt
the going concern basis in preparing the Unaudited Condensed Interim Financial Statements.
At period end, the Company has a current cash position of £304,966,000 and current liabilities
amounting to £66,588,000. Therefore, the Company has sufficient liquidity to meet its obligations. For
this reason, the Directors continue to adopt the going concern basis in preparing the Interim Report
and Unaudited Condensed Interim Financial Statements.
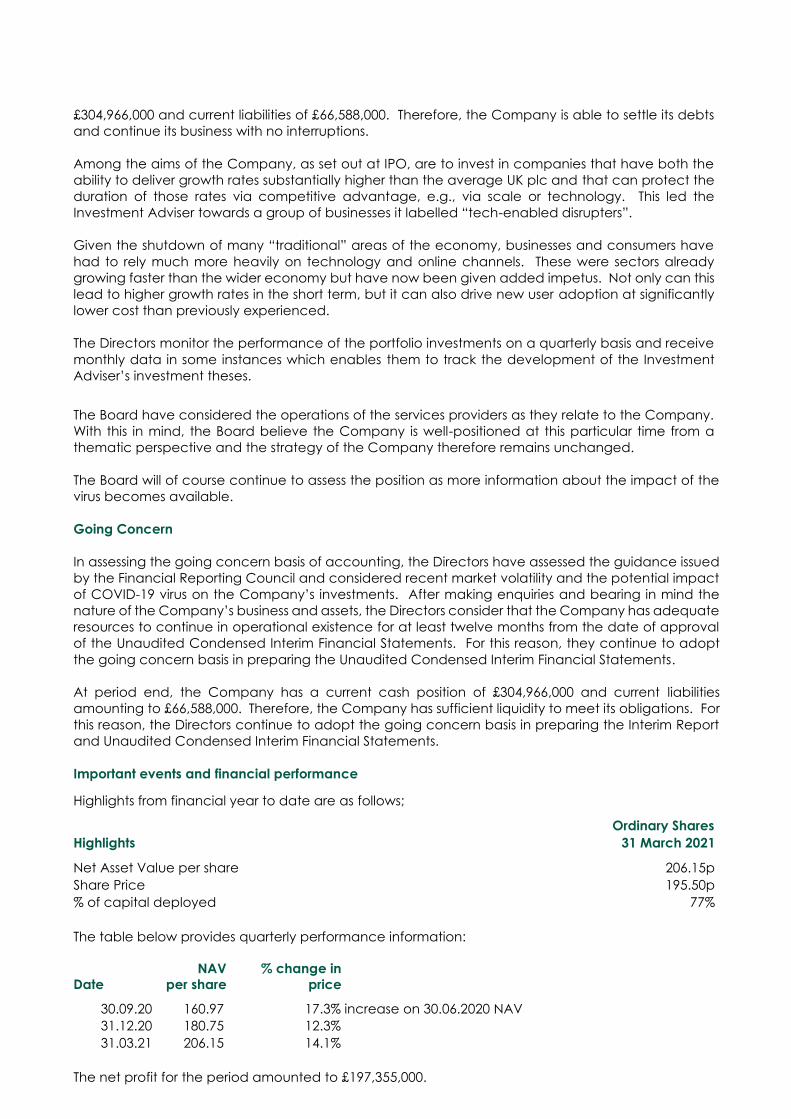
Important events and financial performance
Highlights from financial year to date are as follows;
Ordinary Shares
Highlights 31 March 2021
Net Asset Value per share 206.15p
Share Price 195.50p
% of capital deployed 77%
The table below provides quarterly performance information:
NAV % change in
Date per share price
30.09.20 160.97 17.3% increase on 30.06.2020 NAV
31.12.20 180.75 12.3%
31.03.21 206.15 14.1%
The net profit for the period amounted to £197,355,000.

Further details of the Company’s performance for the period are included in the Investment Adviser’s
Report on pages 4 to 18, which includes a review of investment activity and adherence to investment
restrictions.
Discount
As at 31 March 2021, the share price was trading at a premium to the last published NAV per share
at that point.
Related party transactions
Details of related party transactions are given in note 13 to the Unaudited Condensed Interim Financial Statements.
Statement of Directors’ Responsibilities The Directors confirm that to the best of their knowledge:
• the condensed set of financial statements has been prepared in accordance with IAS 34 Interim
Financial Reporting;
• the interim management report (which includes the Chairman’s Statement, Interim Management
Report and the Investment Adviser’s Report) includes a fair review of the information required by:
(a) DTR 4.2.7R of the Disclosure Guidance and Transparency Rules, being an indication of
important events that have occurred during the first six months of the financial year and their
impact on the condensed set of financial statements, and a description of the principal or
emerging risks and uncertainties for the remaining six months of the financial year; and
(b) DTR 4.2.8R of the Disclosure Guidance and Transparency Rules, being related party
transactions that have taken place in the first six months of the financial year and that have
materially affected the financial position or the performance of the entity during that period
and any changes in the related party transactions described in the last annual report that
could do so.
The Directors are responsible for the maintenance and integrity of the corporate and financial
information included on the Company’s website, and for the preparation and dissemination of
financial statements. Legislation in Guernsey governing the preparation and dissemination of
financial statements may differ from legislation in other jurisdictions.
Stephen Coe
Director
29 June 2021
Independent Review Report
Conclusion We have been engaged by Chrysalis Investments Limited (the “Company”) to review the condensed
set of financial statements in the half-yearly financial report for the six months ended 31 March 2021
of the Company which comprises the unaudited condensed statement of comprehensive income,
the unaudited condensed statement of financial position, the unaudited condensed statement of
changes in equity, the unaudited condensed statement of cash flows and the related explanatory
notes.
Based on our review, nothing has come to our attention that causes us to believe that the condensed
set of financial statements in the half-yearly financial report for the six months ended 31 March 2021 is
not prepared, in all material respects, in accordance with IAS 34 Interim Financial Reporting as
adopted by the EU and the Disclosure Guidance and Transparency Rules (“the DTR”) of the UK’s
Financial Conduct Authority (“the UK FCA”).
Scope of review
We conducted our review in accordance with International Standard on Review Engagements (UK
and Ireland) 2410 Review of Interim Financial Information Performed by the Independent Auditor of
the Entity issued by the Auditing Practices Board for use in the UK. A review of interim financial
information consists of making enquiries, primarily of persons responsible for financial and accounting
matters, and applying analytical and other review procedures. We read the other information
contained in the half-yearly financial report and consider whether it contains any apparent
misstatements or material inconsistencies with the information in the condensed set of financial
statements.
A review is substantially less in scope than an audit conducted in accordance with International
Standards on Auditing (UK) and consequently does not enable us to obtain assurance that we would
become aware of all significant matters that might be identified in an audit. Accordingly, we do not
express an audit opinion.
Directors’ responsibilities
The half-yearly financial report is the responsibility of, and has been approved by, the Directors. The
Directors are responsible for preparing the half-yearly financial report in accordance with the DTR of
the UK FCA.
As disclosed in note 2, the annual financial statements of the Company are prepared in accordance
with International Financial Reporting Standards as adopted by the EU. The Directors are responsible
for preparing the condensed set of financial statements included in the half-yearly financial report in
accordance with IAS 34 as adopted by the EU.
Our responsibility is to express to the Company a conclusion on the condensed set of financial
statements in the half-yearly financial report based on our review.
The purpose of our review work and to whom we owe our responsibilities
This report is made solely to the Company in accordance with the terms of our engagement letter to
assist the Company in meeting the requirements of the DTR of the UK FCA. Our review has been
undertaken so that we might state to the Company those matters we are required to state to it in this
report and for no other purpose. To the fullest extent permitted by law, we do not accept or assume
responsibility to anyone other than the Company for our review work, for this report, or for the
conclusions we have reached.
Barry Ryan
for and on behalf of KPMG Channel Islands Limited
Chartered Accountants, Guernsey
29 June 2021
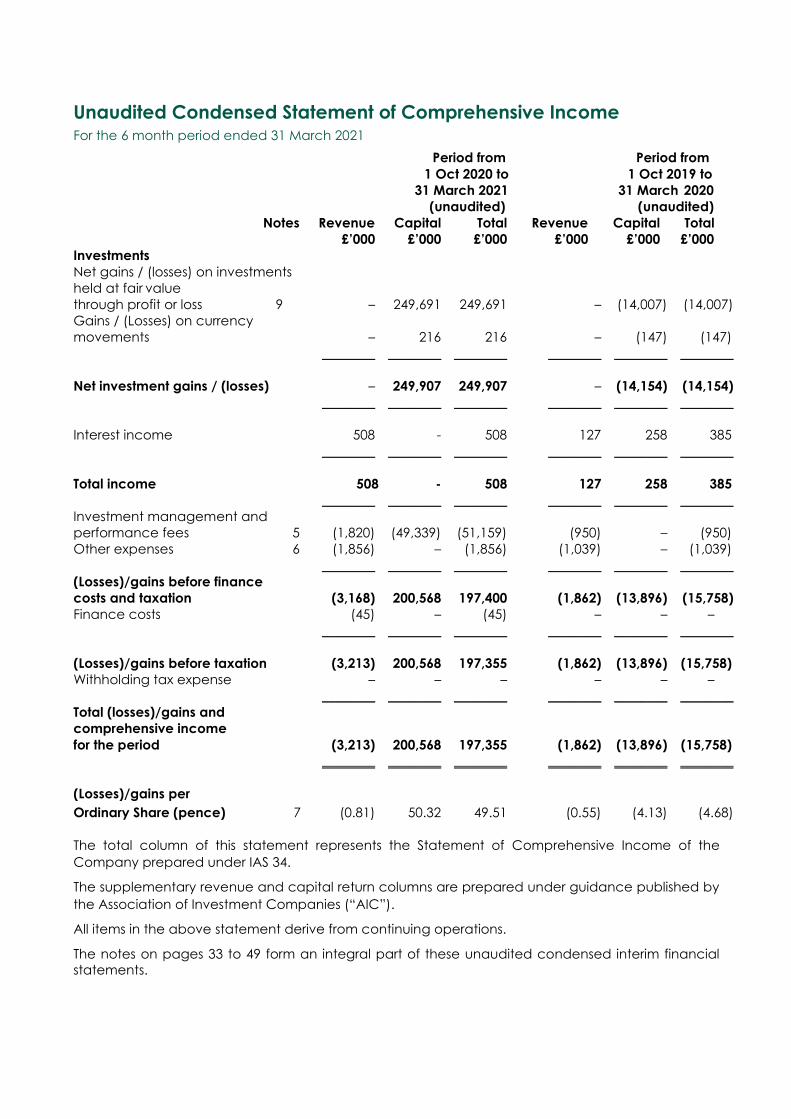
Unaudited Condensed Statement of Comprehensive Income For the 6 month period ended 31 March 2021
Period from Period from
1 Oct 2020 to 1 Oct 2019 to
31 March 2021 31 March 2020
(unaudited) (unaudited)
Notes Revenue Capital Total Revenue Capital Total
£’000 £’000 £’000 £’000 £’000 £’000
Investments
Net gains / (losses) on investments
held at fair value
through profit or loss 9 – 249,691 249,691 – (14,007) (14,007)
Gains / (Losses) on currency
movements – 216 216 – (147) (147)
________ ________ ________ ________ ________ ________
Net investment gains / (losses) – 249,907 249,907 – (14,154) (14,154)
________ ________ ________ ________ ________ ________
Interest income 508 - 508 127 258 385
________ ________ ________ ________ ________ ________
Total income 508 - 508 127 258 385
________ ________ ________ ________ ________ ________
Investment management and
performance fees 5 (1,820) (49,339) (51,159) (950) – (950)
Other expenses 6 (1,856) – (1,856) (1,039) – (1,039)
________ ________ ________ ________ ________ ________
(Losses)/gains before finance
costs and taxation (3,168) 200,568 197,400 (1,862) (13,896) (15,758)
Finance costs (45) – (45) – – –
________ ________ ________ ________ ________ ________
(Losses)/gains before taxation (3,213) 200,568 197,355 (1,862) (13,896) (15,758)
Withholding tax expense – – – – – –
________ ________ ________ ________ ________ ________
Total (losses)/gains and
comprehensive income
for the period (3,213) 200,568 197,355 (1,862) (13,896) (15,758)
________ ________ ________ ________ ________ ________
(Losses)/gains per
Ordinary Share (pence) 7 (0.81) 50.32 49.51 (0.55) (4.13) (4.68)
The total column of this statement represents the Statement of Comprehensive Income of the
Company prepared under IAS 34.
The supplementary revenue and capital return columns are prepared under guidance published by
the Association of Investment Companies (“AIC”).
All items in the above statement derive from continuing operations.
The notes on pages 33 to 49 form an integral part of these unaudited condensed interim financial
statements.
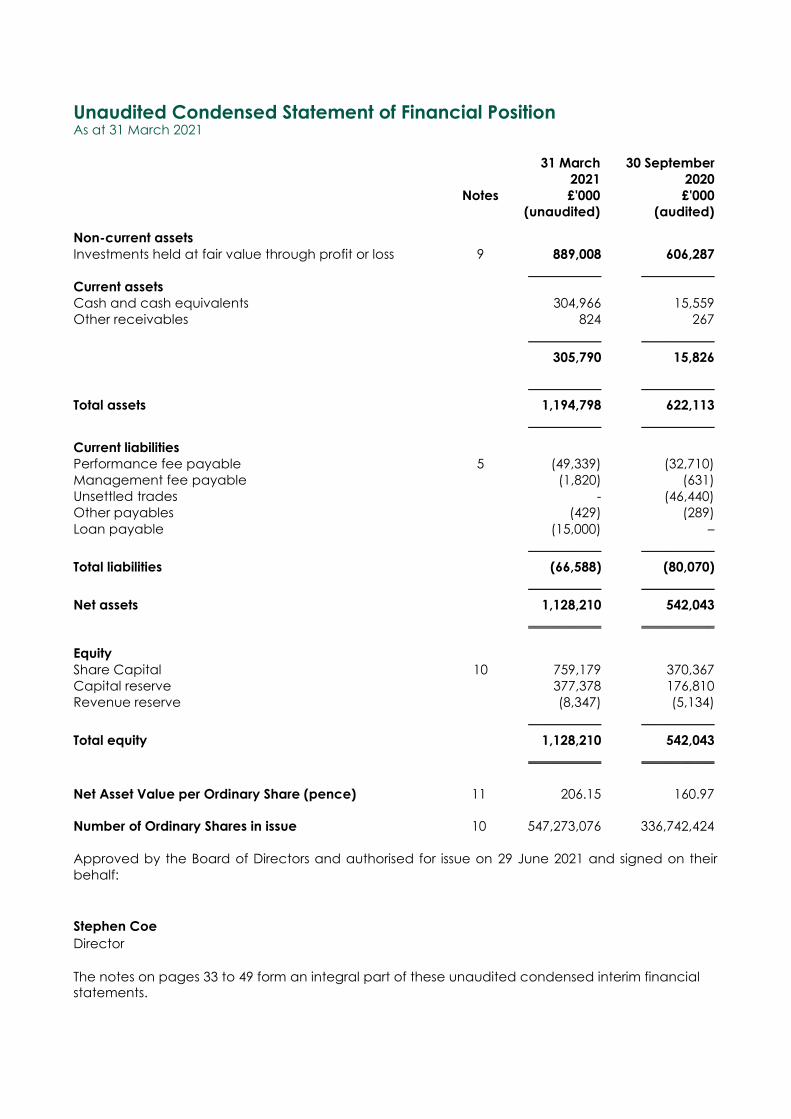
Unaudited Condensed Statement of Financial Position As at 31 March 2021
31 March 30 September
2021 2020
Notes £'000 £'000
(unaudited) (audited)
Non-current assets
Investments held at fair value through profit or loss 9 889,008 606,287
___________ ___________
Current assets
Cash and cash equivalents 304,966 15,559
Other receivables 824 267
___________ ___________
305,790 15,826
___________ ___________
Total assets 1,194,798 622,113
___________ ___________
Current liabilities
Performance fee payable 5 (49,339) (32,710)
Management fee payable (1,820) (631)
Unsettled trades - (46,440)
Other payables (429) (289)
Loan payable (15,000) –
___________ ___________
Total liabilities (66,588) (80,070)
___________ ___________
Net assets 1,128,210 542,043
___________ ___________
Equity
Share Capital 10 759,179 370,367
Capital reserve 377,378 176,810
Revenue reserve (8,347) (5,134)
___________ ___________
Total equity 1,128,210 542,043
___________ ___________
Net Asset Value per Ordinary Share (pence) 11 206.15 160.97
Number of Ordinary Shares in issue 10 547,273,076 336,742,424
Approved by the Board of Directors and authorised for issue on 29 June 2021 and signed on their
behalf:
Stephen Coe
Director
The notes on pages 33 to 49 form an integral part of these unaudited condensed interim financial statements.
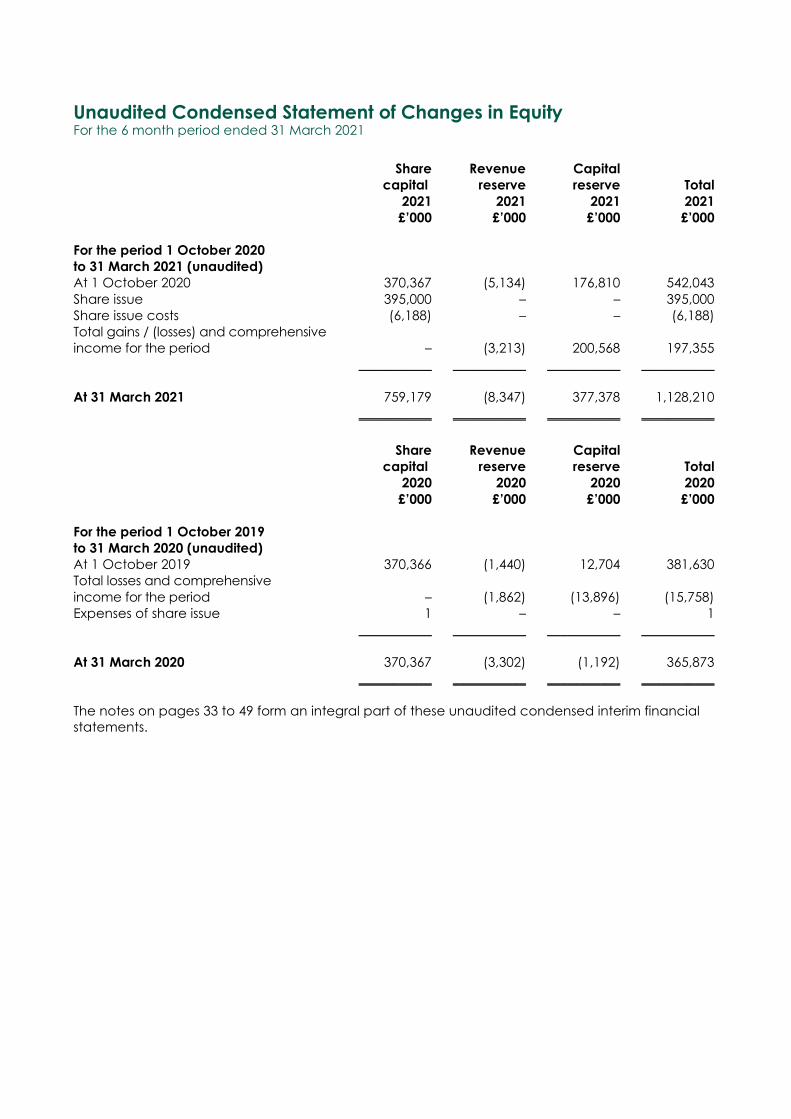
Unaudited Condensed Statement of Changes in Equity
For the 6 month period ended 31 March 2021
Share Revenue Capital
capital reserve reserve Total
2021 2021 2021 2021
£’000 £’000 £’000 £’000
For the period 1 October 2020
to 31 March 2021 (unaudited)
At 1 October 2020 370,367 (5,134) 176,810 542,043
Share issue 395,000 – – 395,000
Share issue costs (6,188) – – (6,188)
Total gains / (losses) and comprehensive
income for the period – (3,213) 200,568 197,355
___________ ___________ ___________ ___________
At 31 March 2021 759,179 (8,347) 377,378 1,128,210
___________ ___________ ___________ ___________
Share Revenue Capital
capital reserve reserve Total
2020 2020 2020 2020
£’000 £’000 £’000 £’000
For the period 1 October 2019
to 31 March 2020 (unaudited)
At 1 October 2019 370,366 (1,440) 12,704 381,630
Total losses and comprehensive
income for the period – (1,862) (13,896) (15,758)
Expenses of share issue 1 – – 1
___________ ___________ ___________ ___________
At 31 March 2020 370,367 (3,302) (1,192) 365,873
___________ ___________ ___________ ___________
The notes on pages 33 to 49 form an integral part of these unaudited condensed interim financial
statements.

Unaudited Condensed Statement of Cash Flows For the 6 month period ended 31 March 2021
Period from Period from
1 Oct 2020 to 1 Oct 2019 to
31 March 31 March
2021 2020
Notes £'000 £'000
(unaudited) (unaudited)
Cash flows from operating activities
Interest paid (45) –
Other expense payments 12 (82,054) (1,980)
Interest income 508 385
Purchases of investments 9 (45,058) (130,129)
Sale of investments 9 12,028 –
___________ ___________
Net cash outflow from operating activities (114,621) (131,724)
___________ ___________
Cash flows from financing activities
Issue of Ordinary Shares 10 395,000 –
Expenses of Ordinary Share issuance 10 (6,188) –
Acquisition of loan payable 15,000 –
___________ ___________
Net cash inflow from financing activities 403,812 –
___________ ___________
Net increase / (decrease) in cash and cash equivalents 289,191 (131,724)
Cash and cash equivalents at beginning of period 15,559 212,665
Effect of foreign exchange 216 (147)
___________ ___________
Cash and cash equivalents at end of period 304,966 80,794
___________ ___________
Cash and cash equivalents comprise of the following:
Cash at bank 304,966 20,802
Cash equivalents - UK treasury bills – 59,992
___________ ___________
304,966 80,794
___________ ___________
The notes on pages 33 to 49 form an integral part of these unaudited condensed interim financial statements.
Selected Explanatory Notes to the Unaudited Condensed Interim Financial Statements For the 6 month period ended 31 March 2021
1. Reporting Entity
Chrysalis Investments Limited (the “Company”) is a closed-ended investment company,
registered in Guernsey on 3 September 2018, with registered number 65432. The Company’s
registered office is 3rd Floor, 1 Le Truchot, St Peter Port, Guernsey GY1 1WD.
The Company is a Registered Closed-ended Collective Investment Scheme regulated by the
Guernsey Financial Services Commission (“GFSC”), with reference number 2404263, pursuant to
the Protection of Investors (Bailiwick of Guernsey) Law 1987, as amended and the Registered
Closed-ended Investment Scheme Rules 2015.
The Company’s 547,273,076 shares in issue under ticker CHRY, SEDOL BGJYPP4 and ISIN
GG00BGJYPP46 have a premium listing and are admitted to trading on the London Stock
Exchange’s Main Market for listed securities. The Unaudited Condensed Interim Financial
Statements of the Company are presented for the 6 month period ended 31 March 2021. The
Company invests in a diversified portfolio consisting primarily of equity and equity-related
securities issued by unquoted companies. The Company became a FTSE 250 company on 23
March 2021.
The Company and its Alternative Investment Fund Manager received investment advice from
Jupiter Investment Management Limited (“JIML”) during the 6 month period ended 31 March
2021. The administration of the Company is delegated to Maitland Administration (Guernsey)
Limited (“MAGL”) (the “administrator”).
2. Significant accounting policies
(a) Basis of accounting
The Unaudited Condensed Interim Financial Statements have been prepared on a going
concern basis in accordance with IAS 34 Interim Financial Reporting as adopted by the EU, and
applicable Guernsey law. These Unaudited Condensed Interim Financial Statements do not
comprise statutory Financial Statements within the meaning of the Companies (Guernsey) Law,
2008, they do not include all of the information required for full annual financial statements and
should be read in conjunction with the financial statements of the Company as at 30 September
2020, which were prepared in accordance with International Financial Reporting Standards as
adopted by the EU. The accounting policies adopted in these Unaudited Condensed Interim
Financial Statements are consistent with those of the previous financial period and the
corresponding interim reporting period, except for the adoption of new and amended
standards as set out below.
Where presentational guidance set out in the Statement of Recommended Practice (“SORP”)
for investment companies issued by the Association of Investment Companies (“AIC”) updated
in February 2019 is consistent with the requirements of IFRS, the directors have sought to prepare
the Unaudited Condensed Interim Financial Statements on a basis compliant with the
recommendations of the SORP.
(b) Going concern
The Directors have adopted the going concern basis in preparing the Unaudited Condensed
Interim Financial Statements.
In assessing the going concern basis of accounting, the Directors have assessed the guidance
issued by the Financial Reporting Council and considered recent market volatility and the
potential impact of COVID-19 virus on the Company’s investments. After making enquiries and
bearing in mind the nature of the Company’s business and assets, the Directors consider that
the Company has adequate resources to continue in operational existence for at least twelve
months from the date of approval of the Unaudited Condensed Interim Financial Statements.
For this reason, they continue to adopt the going concern basis in preparing the Unaudited
Condensed Interim Financial Statements.
At period end, the Company has a current cash position of £304,966,000 and current liabilities
amounting to £66,588,000. Therefore, the Company has sufficient liquidity to meet its obligations.
For this reason, the Directors continue to adopt the going concern basis in preparing the Interim
Report and Unaudited Condensed Interim Financial Statements.
(c) Segmental reporting
The chief operating decision maker is the Board of Directors. The Directors are of the opinion
that the Company is engaged in a single segment of business with the primary objective of
investing in securities to generate capital growth for shareholders. Consequently, no business
segmental analysis is provided.
The key measure of performance used by the Board is the Net Asset Value of the Company
(which is calculated under IFRS as adopted by the European Union). Therefore, no reconciliation
is required between the measure of profit or loss used by the Board and that contained in these
Unaudited Condensed Interim Financial Statements.
(d) Taxation
The Company has been granted exemption from liability to income tax in Guernsey under the
Income Tax (Exempt Bodies) (Guernsey) Ordinance, 1989 amended by the Director of Income
Tax in Guernsey for the current period. Exemption is applied and granted annually and subject
to the payment of a fee, currently £1,200.
3. Use of estimates and critical judgements
The preparation of Unaudited Condensed Interim Financial Statements in accordance with IFRS
requires management to make estimates and assumptions that affect the reported amounts of
assets and liabilities and the disclosure of contingent assets and liabilities at the date of the
Unaudited Condensed Interim Financial Statements and the reported amounts of income and
expenses during the period. Actual results could differ from those estimates and assumptions.
The estimates and underlying assumptions are reviewed on an ongoing basis. There were no
significant accounting estimates or significant judgements in the current period, except for the
use of estimates in the valuation of the unquoted investments detailed in note 13.
4. New and revised standards
The following accounting standards and their amendments were in issue at the period end but
will not be in effect until after this financial period end. The Directors have considered their
impact and have concluded that they will not have a significant impact on the Unaudited
Condensed Interim Financial Statements.
• Amendments to IFRS 9, IAS 1 and IAS 37 - effective 1 January 2022
• Amendments to IAS 1, IAS 8 and IAS 12 - effective 1 January 2023
5. Investment management fees
1 October 2020 to 1 October 2019 to
31 March 31 March
2021 2020
£'000 £'000
Investment management fee 1,820 950
Investment Adviser's performance fee – charged to capital 49,339 –
___________ ___________
Total investment management fees 51,159 950
___________ ___________
Under the terms of the portfolio management agreement, Jupiter Investment Management
Limited (“JIML”) is entitled to a management fee and a performance fee together with
reimbursement of reasonable expenses incurred in the performance of its duties. JIML is a
subsidiary of Jupiter.
Management fee
The monthly management fee is equal to 1/12 of 0.5% of the Net Asset Value (the “management
fee”). The management fee is calculated and paid monthly in arrears.
If at any time the Company invests in or through any other investment fund or special purpose
vehicle and a management fee or advisory fee is charged to such investment fund or special
purpose vehicle by JIML or any of its Associates and is not waived, the value of such investment
will be excluded from the calculation of NAV for the purposes of determining the management
fee.
As at 31 March 2021, an amount of £1,820,000 (30 September 2020: £631,000) was outstanding
and due to JIML in respect of management fees.
Performance fee
JIML will be entitled to receive a performance fee, the sum of which is equal to 20% of the amount
by which the Adjusted Net Asset Value at the end of a Calculation Period exceeds the higher of: (i)
the Performance Hurdle; and (ii) the High Water Mark (“the performance fee”). The calculation
period for the current period will be the period commencing on 1 October 2020 and ending on 30
September 2021 (the “Calculation Period”).
Adjusted Net Asset Value at the end of a Calculation Period shall be the audited NAV in Sterling at
the end of the relevant Calculation Period:
(i) plus an amount equal to any accrued or paid performance fee in respect of that Calculation
Period or any prior Calculation Period;
(ii) plus an amount equal to all dividend or other income distributions paid to shareholders that
have been declared and paid on or prior to the end of the relevant Calculation Period;
(iii) minus the amount of any distribution declared in respect of the Calculation Period but which
has not already reduced the audited NAV;
(iv) minus the Net Capital Change where the Net Capital Change is positive or, correspondingly,
plus the Net Capital Change where such net Capital Change is negative (which for this
purpose includes the Net Capital Change in the relevant Calculation Period and each
preceding Calculation Period; and
(v) minus any increase in the NAV during the Calculation Period attributable to investments
attributable to C shares prior to the conversion of those C shares.
“Performance Hurdle” means, in relation to the Calculation Period, (“A” multiplied by “B”) + C
where:
“A” is 8% (expressed for the purposes of this calculation as 1.08) (calculated as an annual rate and
adjusted to the extent the Calculation Period is greater or shorter than one year).
“B” is:
(i) in respect of the first Calculation Period, the Net Issue Proceeds; or
(ii) in respect of each subsequent Calculation Period, the sum of this calculation as at the end of
the immediately preceding Calculation Period: plus (where sum is positive) or minus (where such
sum is negative) the Net Capital Change attributable to shares issues and repurchases in all
preceding Calculation Period (the amount in this paragraph (b) being the “Aggregate NCC”), in
each case, plus (where such sum is positive) or minus (where such sum is negative) the sum of:
(x) in respect of each share issue undertaken in the relevant Calculation Period being assessed, an
amount equal to the Net Capital Change attributable to that share issue multiplied by the sum of
the number of days between admission to trading of the relevant shares and the end of the relevant
Calculation Period divided by 365 (such amount being the “issue adjustment”), minus
(y) in respect of each repurchase or redemption of shares undertaken in the relevant Calculation
Period being assessed, an amount equal to Net Capital Charge attributable to that share purchase
or redemption multiplied by the number of days between the relevant disbursement of monies to
fund such repurchase or redemption and the end of the relevant Calculation Period divided by 365
(such amount being the “reduction adjustment”),
“C” is the sum of:
the issue adjustment for the Calculation Period;
the reduction adjustment for the Calculation Period; and
the Aggregate NCC multiplied by -1.
“Net Capital Change” equals I minus R where:
“I” is the aggregate of the net proceeds of any share issue over the relevant year (other
than the first issue of ordinary shares);
“R” is the aggregate of amounts disbursed by the Company in respect of the share
redemptions or repurchases over the relevant period.
“High Water Mark” means the Adjusted Net Asset Value as at the end of the Calculation Period
in respect of which a performance fee was last earned or if no performance fee has yet been
earned, an amount equal to the Net Issue Proceeds (as such term is defined in the prospectus);
and
“Calculation period" means each twelve-month period ending on 30 September, except that
the first Calculation Period shall be the period commencing on Admission and ending on
30 September 2019.
Under the terms of the portfolio management agreement, any accrued and unpaid
performance fees will crystallise and become payable to JIML upon certain termination events.
The accrued performance fee shall only be payable by the Company to the extent that the
Payment Amount is greater than the sum of the performance fee (which shall both be
calculated as at the end of each Calculation Period) and, to the extent that the Payment
Amount is less than the sum of the performance fee for that Calculation Period, an amount
equal to the difference shall be carried forward and included in the performance fee
calculated as at the end of the next Calculation Period (and such amount shall be paid
before any performance fee accrued at a later date).
“Payment amount” is the sum of:
(i) aggregate net realised profits on investments since the start of the relevant Calculation
Period; plus
(ii) an amount equal to each IPO investment unrealised gain where the initial public offering of
the relevant investment takes place during the relevant Calculation Period; plus or minus
(as applicable)
(iii) an amount equal to the listed investment value change attributable to that calculation
period; plus
(iv) the aggregate amount of all dividends or other income received from investments of the
Company in that Calculation Period (other than investments made pursuant to the cash
management policy of the Company as stated in the Investment Policy).
No performance fee is payable out of the assets attributable to any C Shares in issue from time
to time.
As at 31 March 2021, the Company had exceeded the High Water Mark and Performance
Hurdle and an accrual of £49,338,637 (2020: £nil) for performance fees has been reflected within
these Unaudited Condensed Interim Financial Statements.
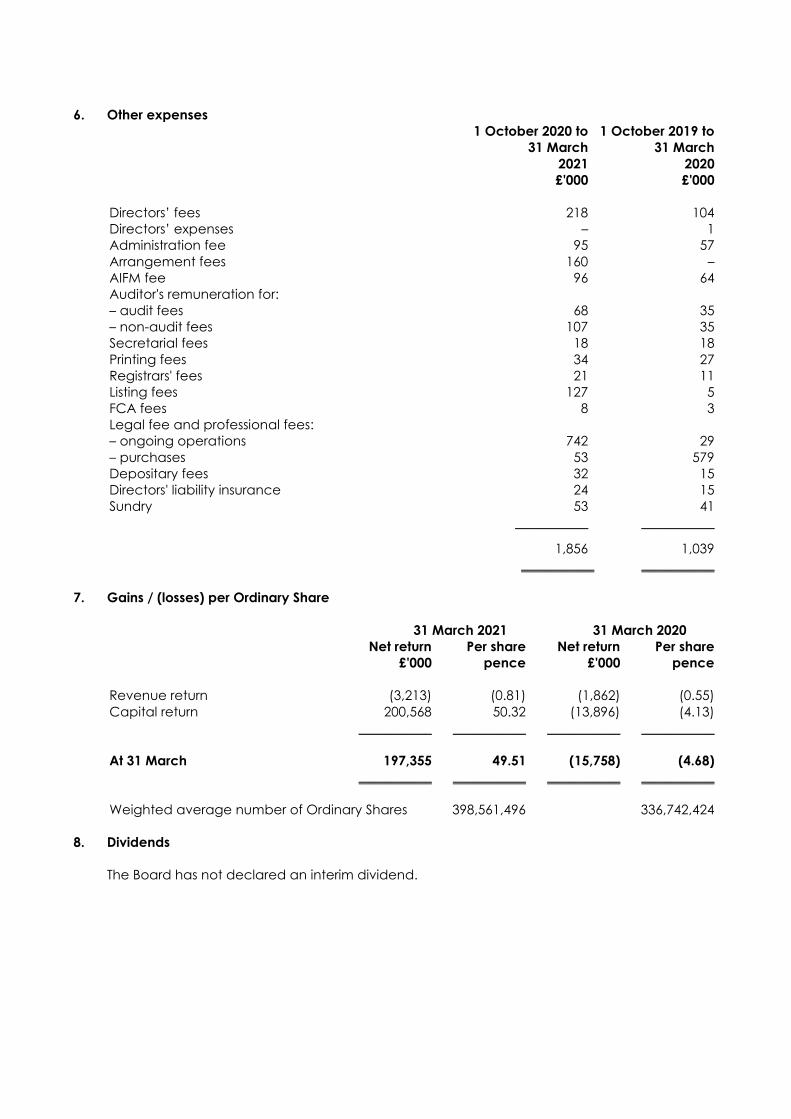
6. Other expenses
1 October 2020 to 1 October 2019 to
31 March 31 March
2021 2020
£'000 £'000
Directors’ fees 218 104
Directors’ expenses – 1
Administration fee 95 57
Arrangement fees 160 –
AIFM fee 96 64
Auditor's remuneration for:
– audit fees 68 35
– non-audit fees 107 35
Secretarial fees 18 18
Printing fees 34 27
Registrars' fees 21 11
Listing fees 127 5
FCA fees 8 3
Legal fee and professional fees:
– ongoing operations 742 29
– purchases 53 579
Depositary fees 32 15
Directors' liability insurance 24 15
Sundry 53 41
___________ ___________
1,856 1,039
___________ ___________
7. Gains / (losses) per Ordinary Share
31 March 2021 31 March 2020
Net return Per share Net return Per share
£'000 pence £'000 pence
Revenue return (3,213) (0.81) (1,862) (0.55)
Capital return 200,568 50.32 (13,896) (4.13)
___________ ___________ ___________ ___________
At 31 March 197,355 49.51 (15,758) (4.68)
___________ ___________ ___________ ___________
Weighted average number of Ordinary Shares 398,561,496 336,742,424
8. Dividends
The Board has not declared an interim dividend.
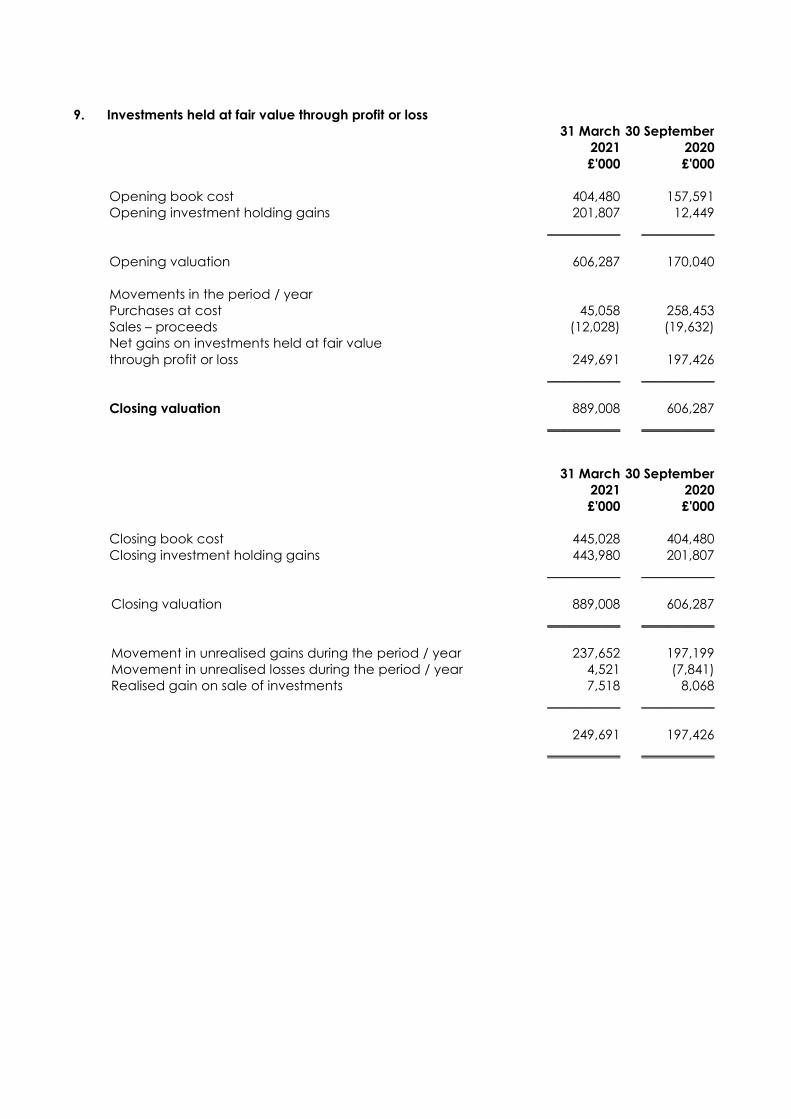
9. Investments held at fair value through profit or loss
31 March 30 September
2021 2020
£'000 £'000
Opening book cost 404,480 157,591
Opening investment holding gains 201,807 12,449
___________ ___________
Opening valuation 606,287 170,040
Movements in the period / year
Purchases at cost 45,058 258,453
Sales – proceeds (12,028) (19,632)
Net gains on investments held at fair value
through profit or loss 249,691 197,426
___________ ___________
Closing valuation 889,008 606,287
___________ ___________
31 March 30 September
2021 2020
£'000 £'000
Closing book cost 445,028 404,480
Closing investment holding gains 443,980 201,807
___________ ___________
Closing valuation 889,008 606,287
___________ ___________
Movement in unrealised gains during the period / year 237,652 197,199
Movement in unrealised losses during the period / year 4,521 (7,841)
Realised gain on sale of investments 7,518 8,068
___________ ___________
249,691 197,426
___________ ___________
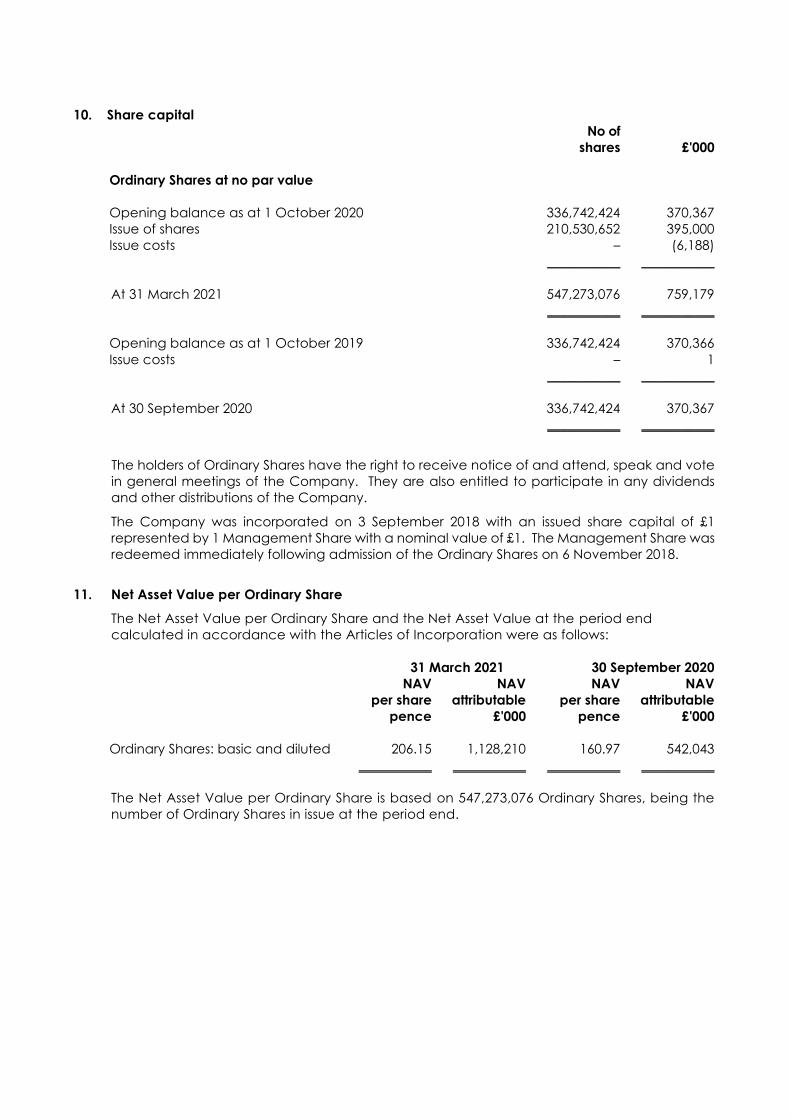
10. Share capital
No of
shares £'000
Ordinary Shares at no par value
Opening balance as at 1 October 2020 336,742,424 370,367
Issue of shares 210,530,652 395,000
Issue costs – (6,188)
___________ ___________
At 31 March 2021 547,273,076 759,179
___________ ___________
Opening balance as at 1 October 2019 336,742,424 370,366
Issue costs – 1
___________ ___________
At 30 September 2020 336,742,424 370,367
___________ ___________
The holders of Ordinary Shares have the right to receive notice of and attend, speak and vote
in general meetings of the Company. They are also entitled to participate in any dividends
and other distributions of the Company.
The Company was incorporated on 3 September 2018 with an issued share capital of £1
represented by 1 Management Share with a nominal value of £1. The Management Share was
redeemed immediately following admission of the Ordinary Shares on 6 November 2018.
11. Net Asset Value per Ordinary Share
The Net Asset Value per Ordinary Share and the Net Asset Value at the period end
calculated in accordance with the Articles of Incorporation were as follows:
31 March 2021 30 September 2020
NAV NAV NAV NAV
per share attributable per share attributable
pence £'000 pence £'000
Ordinary Shares: basic and diluted 206.15 1,128,210 160.97 542,043
___________ ___________ ___________ ___________
The Net Asset Value per Ordinary Share is based on 547,273,076 Ordinary Shares, being the
number of Ordinary Shares in issue at the period end.
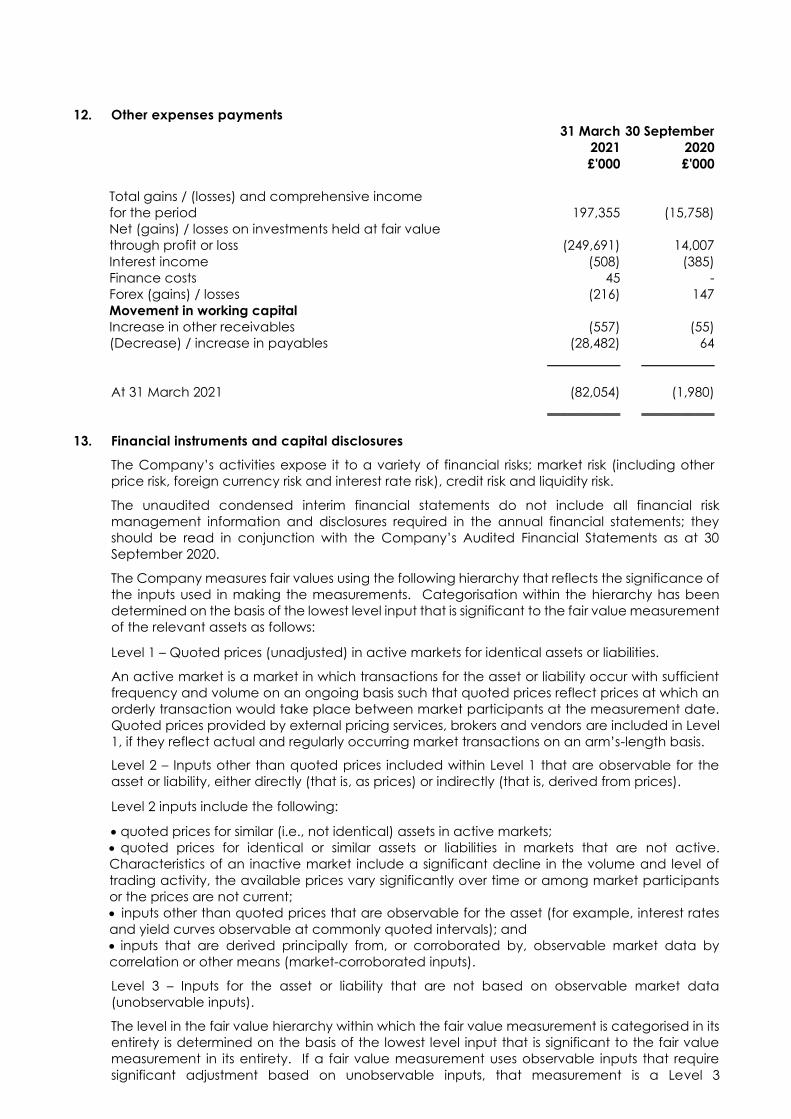
12. Other expenses payments
31 March 30 September
2021 2020
£'000 £'000
Total gains / (losses) and comprehensive income
for the period 197,355 (15,758)
Net (gains) / losses on investments held at fair value
through profit or loss (249,691) 14,007
Interest income (508) (385)
Finance costs 45 -
Forex (gains) / losses (216) 147
Movement in working capital
Increase in other receivables (557) (55)
(Decrease) / increase in payables (28,482) 64
___________ ___________
At 31 March 2021 (82,054) (1,980)
___________ ___________
13. Financial instruments and capital disclosures
The Company’s activities expose it to a variety of financial risks; market risk (including other
price risk, foreign currency risk and interest rate risk), credit risk and liquidity risk.
The unaudited condensed interim financial statements do not include all financial risk
management information and disclosures required in the annual financial statements; they
should be read in conjunction with the Company’s Audited Financial Statements as at 30
September 2020.
The Company measures fair values using the following hierarchy that reflects the significance of
the inputs used in making the measurements. Categorisation within the hierarchy has been
determined on the basis of the lowest level input that is significant to the fair value measurement
of the relevant assets as follows:
Level 1 – Quoted prices (unadjusted) in active markets for identical assets or liabilities.
An active market is a market in which transactions for the asset or liability occur with sufficient
frequency and volume on an ongoing basis such that quoted prices reflect prices at which an
orderly transaction would take place between market participants at the measurement date.
Quoted prices provided by external pricing services, brokers and vendors are included in Level
1, if they reflect actual and regularly occurring market transactions on an arm’s-length basis.
Level 2 – Inputs other than quoted prices included within Level 1 that are observable for the
asset or liability, either directly (that is, as prices) or indirectly (that is, derived from prices).
Level 2 inputs include the following:
• quoted prices for similar (i.e., not identical) assets in active markets;
• quoted prices for identical or similar assets or liabilities in markets that are not active.
Characteristics of an inactive market include a significant decline in the volume and level of
trading activity, the available prices vary significantly over time or among market participants
or the prices are not current;
• inputs other than quoted prices that are observable for the asset (for example, interest rates
and yield curves observable at commonly quoted intervals); and
• inputs that are derived principally from, or corroborated by, observable market data by
correlation or other means (market-corroborated inputs).
Level 3 – Inputs for the asset or liability that are not based on observable market data
(unobservable inputs).
The level in the fair value hierarchy within which the fair value measurement is categorised in its
entirety is determined on the basis of the lowest level input that is significant to the fair value
measurement in its entirety. If a fair value measurement uses observable inputs that require
significant adjustment based on unobservable inputs, that measurement is a Level 3

measurement. Assessing the significance of a particular input to the fair value measurement in
its entirety requires judgement, considering factors specific to the asset or liability.
At 31 March 2021 Level 1 Level 2 Level 3 Total
£’000 £’000 £’000 £’000
Quoted equity 88,152 – – 88,152
Unquoted equity / Convertible debt – – 800,856 800,856
___________ ___________ ___________ ___________
88,152 – 800,856 889,008
___________ ___________ ___________ ___________
At 30 September 2020 Level 1 Level 2 Level 3 Total
£’000 £’000 £’000 £’000
Quoted equity 94,213 – – 94,213
Unquoted equity / Convertible debt – – 512,074 512,074
___________ ___________ ___________ ___________
94,213 – 512,074 606,287
___________ ___________ ___________ ___________
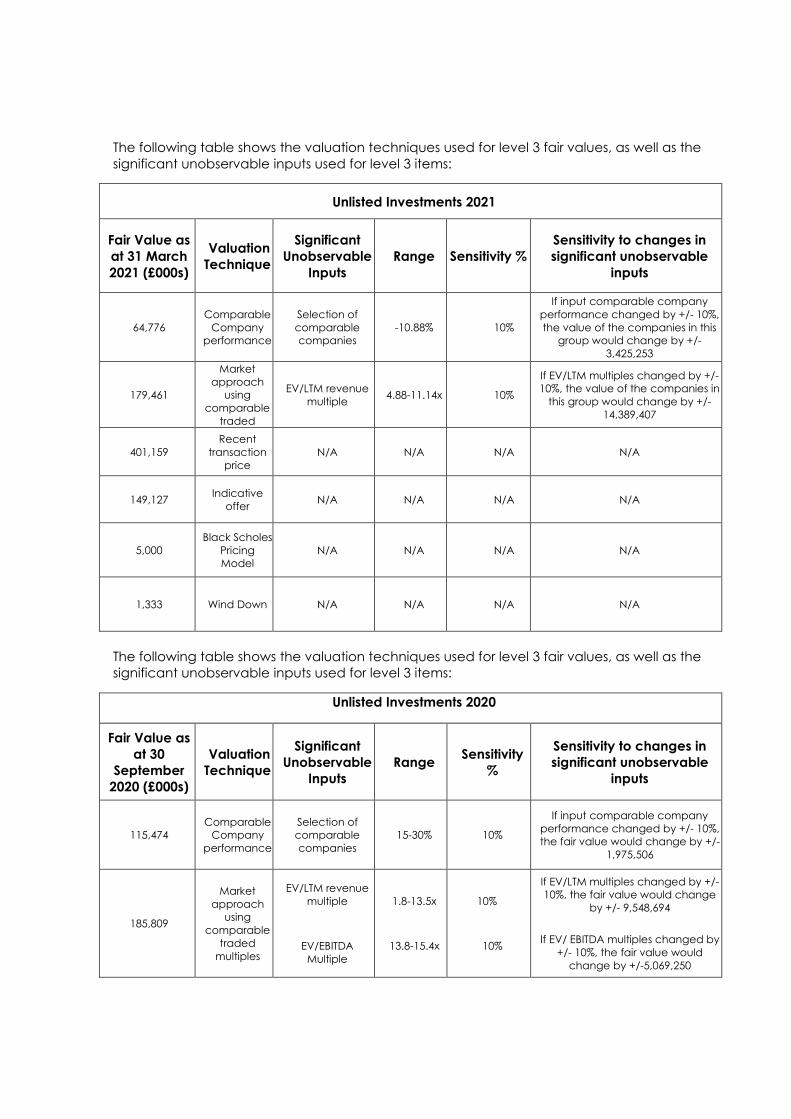
The following table shows the valuation techniques used for level 3 fair values, as well as the
significant unobservable inputs used for level 3 items:
Unlisted Investments 2021
Fair Value as
at 31 March
2021 (£000s)
Valuation
Technique
Significant
Unobservable
Inputs
Range Sensitivity %
Sensitivity to changes in
significant unobservable
inputs
64,776
Comparable
Company
performance
Selection of
comparable
companies
-10.88% 10%
If input comparable company
performance changed by +/- 10%,
the value of the companies in this
group would change by +/-
3,425,253
179,461
Market
approach
using
comparable
traded
multiples
EV/LTM revenue
multiple 4.88-11.14x 10%
If EV/LTM multiples changed by +/-
10%, the value of the companies in
this group would change by +/-
14,389,407
401,159
Recent
transaction
price
N/A N/A N/A N/A
149,127 Indicative
offer N/A N/A N/A N/A
5,000
Black Scholes
Pricing
Model
N/A N/A N/A N/A
1,333 Wind Down N/A N/A N/A N/A
The following table shows the valuation techniques used for level 3 fair values, as well as the
significant unobservable inputs used for level 3 items:
Unlisted Investments 2020
Fair Value as
at 30
September
2020 (£000s)
Valuation
Technique
Significant
Unobservable
Inputs
Range Sensitivity
%
Sensitivity to changes in
significant unobservable
inputs
115,474
Comparable
Company
performance
Selection of
comparable
companies
15-30% 10%
If input comparable company
performance changed by +/- 10%,
the fair value would change by +/-
1,975,506
185,809
Market
approach
using
comparable
traded
multiples
EV/LTM revenue
multiple
EV/EBITDA
Multiple
1.8-13.5x
13.8-15.4x
10%
10%
If EV/LTM multiples changed by +/-
10%, the fair value would change
by +/- 9,548,694
If EV/ EBITDA multiples changed by
+/- 10%, the fair value would
change by +/-5,069,250
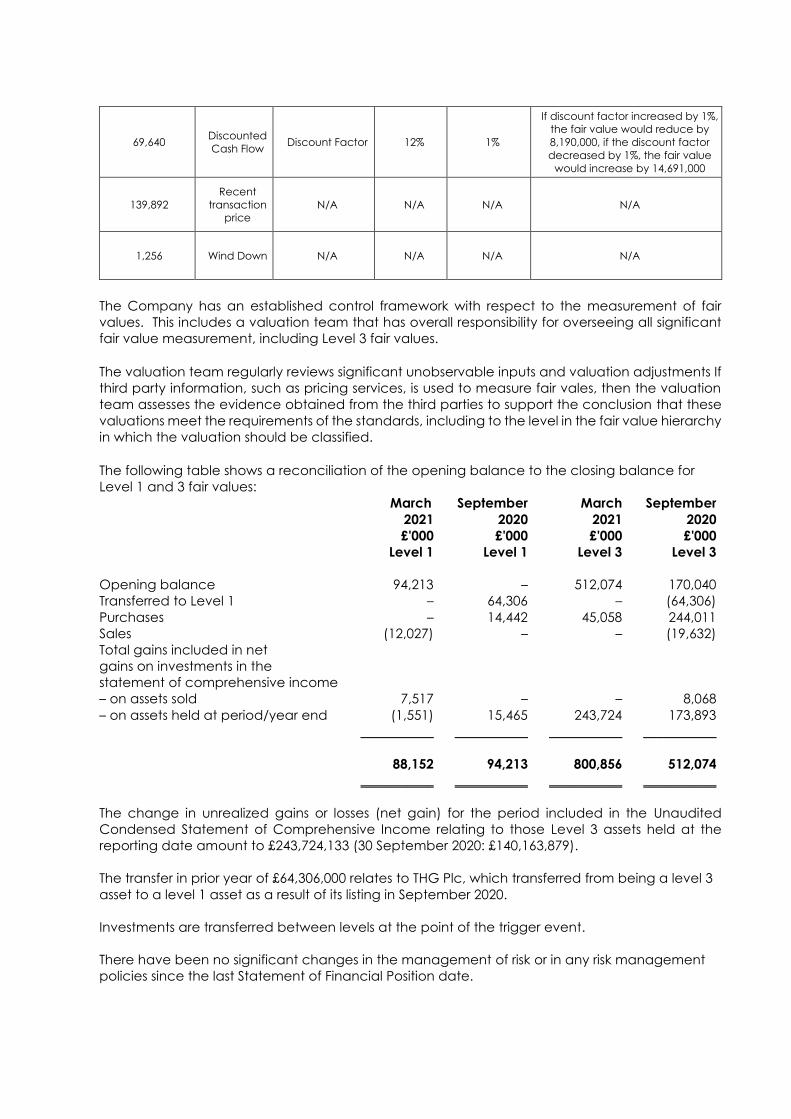
69,640 Discounted
Cash Flow Discount Factor 12% 1%
If discount factor increased by 1%,
the fair value would reduce by
8,190,000, if the discount factor
decreased by 1%, the fair value
would increase by 14,691,000
139,892
Recent
transaction
price
N/A N/A N/A N/A
1,256 Wind Down N/A N/A N/A N/A
The Company has an established control framework with respect to the measurement of fair
values. This includes a valuation team that has overall responsibility for overseeing all significant
fair value measurement, including Level 3 fair values.
The valuation team regularly reviews significant unobservable inputs and valuation adjustments If
third party information, such as pricing services, is used to measure fair vales, then the valuation
team assesses the evidence obtained from the third parties to support the conclusion that these
valuations meet the requirements of the standards, including to the level in the fair value hierarchy
in which the valuation should be classified.
The following table shows a reconciliation of the opening balance to the closing balance for
Level 1 and 3 fair values:
March September March September
2021 2020 2021 2020
£'000 £'000 £'000 £'000
Level 1 Level 1 Level 3 Level 3
Opening balance 94,213 – 512,074 170,040
Transferred to Level 1 – 64,306 – (64,306)
Purchases – 14,442 45,058 244,011
Sales (12,027) – – (19,632)
Total gains included in net
gains on investments in the
statement of comprehensive income
– on assets sold 7,517 – – 8,068
– on assets held at period/year end (1,551) 15,465 243,724 173,893
___________ ___________ ___________ ___________
88,152 94,213 800,856 512,074
___________ ___________ ___________ ___________
The change in unrealized gains or losses (net gain) for the period included in the Unaudited
Condensed Statement of Comprehensive Income relating to those Level 3 assets held at the
reporting date amount to £243,724,133 (30 September 2020: £140,163,879).
The transfer in prior year of £64,306,000 relates to THG Plc, which transferred from being a level 3
asset to a level 1 asset as a result of its listing in September 2020.
Investments are transferred between levels at the point of the trigger event.
There have been no significant changes in the management of risk or in any risk management
policies since the last Statement of Financial Position date.

14. Related parties
JIML continues to be the Investment Adviser to the Company. The relationship is governed by an
agreement dated 11 October 2018.
1 October 2020 1 October 2019 1 October 2019
31 March 30 September 31 March
2021 2020 2020
£’000 £’000 £’000
Management fee charged by JIML:
Total management fee charged 1,820 2,084 950
Management fee outstanding (1,820) 631 950
Performance fee charged by JIML:
Total performance fee charged 49,339 32,608 –
Performance fee outstanding (49,339) 32,710 103
Directors’ fees
Total Directors’ fees charged 218 208 104
Directors’ fees outstanding – – –
As at 31 March 2021 the following Directors have holdings in the Company:
Number of % Ordinary Shares
Director Ordinary Shares issue as at 31 March 2021
Andrew Haining 54,000 0.0099
Stephen Coe 50,909 0.0093
Simon Holden 72,500 0.0132
Anne Ewing 32,500 0.0059
Tim Cruttenden 14,968 0.0027
As at 30 September 2020 the following Directors have holdings in the Company:
Number of % Ordinary Shares
Director Ordinary Shares issue as at 30 September 2020
Andrew Haining 45,000 0.0134
Stephen Coe 45,909 0.0136
Simon Holden 67,500 0.0200
Anne Ewing 7,500 0.0022
Tim Cruttenden 9,090 0.0027
The following JIML’s sub-funds hold an investment in the Company. The Board is notified at the
quarterly board meetings about any transaction in relation to the sub-funds by JIML's risk and
compliance report. JIML is a subsidiary of Jupiter.
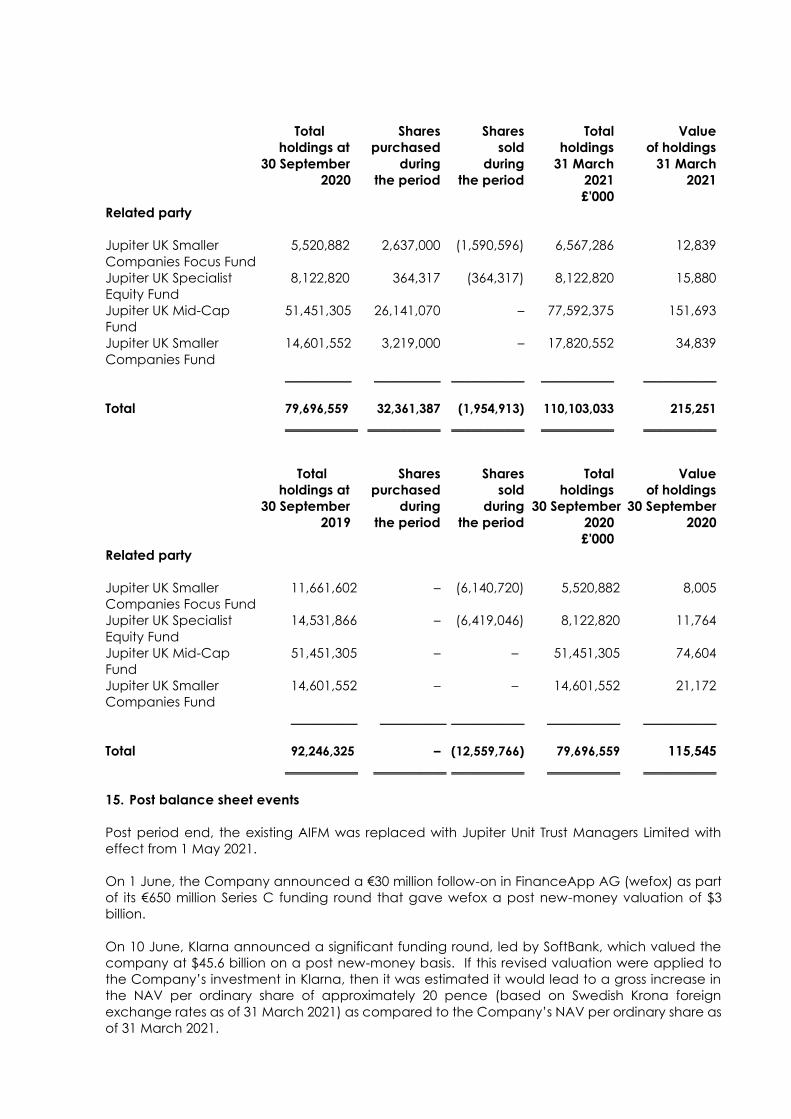
Total Shares Shares Total Value
holdings at purchased sold holdings of holdings
30 September during during 31 March 31 March
2020 the period the period 2021 2021
£'000
Related party
Jupiter UK Smaller 5,520,882 2,637,000 (1,590,596) 6,567,286 12,839
Companies Focus Fund
Jupiter UK Specialist 8,122,820 364,317 (364,317) 8,122,820 15,880
Equity Fund
Jupiter UK Mid-Cap 51,451,305 26,141,070 – 77,592,375 151,693
Fund
Jupiter UK Smaller 14,601,552 3,219,000 – 17,820,552 34,839
Companies Fund
__________ __________ ___________ ___________ ___________
Total 79,696,559 32,361,387 (1,954,913) 110,103,033 215,251
___________ ___________ ___________ ___________ ___________
Total Shares Shares Total Value
holdings at purchased sold holdings of holdings
30 September during during 30 September 30 September
2019 the period the period 2020 2020
£'000
Related party
Jupiter UK Smaller 11,661,602 – (6,140,720) 5,520,882 8,005
Companies Focus Fund
Jupiter UK Specialist 14,531,866 – (6,419,046) 8,122,820 11,764
Equity Fund
Jupiter UK Mid-Cap 51,451,305 – – 51,451,305 74,604
Fund
Jupiter UK Smaller 14,601,552 – – 14,601,552 21,172
Companies Fund
__________ __________ ___________ ___________ ___________
Total 92,246,325 – (12,559,766) 79,696,559 115,545
___________ ___________ ___________ ___________ ___________
15. Post balance sheet events
Post period end, the existing AIFM was replaced with Jupiter Unit Trust Managers Limited with
effect from 1 May 2021.
On 1 June, the Company announced a €30 million follow-on in FinanceApp AG (wefox) as part
of its €650 million Series C funding round that gave wefox a post new-money valuation of $3
billion.
On 10 June, Klarna announced a significant funding round, led by SoftBank, which valued the
company at $45.6 billion on a post new-money basis. If this revised valuation were applied to
the Company’s investment in Klarna, then it was estimated it would lead to a gross increase in
the NAV per ordinary share of approximately 20 pence (based on Swedish Krona foreign
exchange rates as of 31 March 2021) as compared to the Company’s NAV per ordinary share as
of 31 March 2021.
On 24 June, the Company announced a further follow-on investment into Starling Bank of
approximately £35 million, connected to Starling’s series D funding round.
On 28 June, the Company announced a £75 million investment in Smart Pension Limited. The
investment forms part of a £165 million Series D funding round and includes £110 million of newly
issued primary capital and £55 million of secondary equity acquired from existing shareholders of
Smart Pension Limited.
On 29 June, the Company’s Investment Adviser signed a cornerstone investment agreement with
Revolution Beauty Group plc which allows the Company to invest approximately £45m as part of
Revolution Beauty’s IPO if the IPO proceeds.
There has not been any other matter or circumstance occurring subsequent to the end of the
financial period that has significantly affected, or may significantly affect, the operations of the
Company, the results of those operations, or the state of affairs of the Company in future financial
period.
Corporate Information
Directors
Andrew Haining, Chairman
Anne Ewing
Simon Holden
Stephen Coe (Senior Independent Director)
Tim Cruttenden
Registered office
3rd Floor
1 Le Truchot
St Peter Port
Guernsey, GY1 1WD
Alternative Investment Fund Manager
Maitland Institutional Services Ltd
Springfield Lodge
Colchester Road
Chelmsford
Essex, CM2 5PW
Notice served March 2021, inactive until
end of notice period.
Jupiter Unit Trust Managers Limited
The Zig Zag Building
70 Victoria Street
London, SE1E 6SQW
Appointed 1 May 2021
Investment Adviser
Merian Global Investors (UK) Limited
The Zig Zag Building
70 Victoria Street
London, SW1E 6SQ

Jupiter Investment Management Limited
The Zig Zag Building
70 Victoria Street
London, SW1E 6SQ
Appointed 15 February 2021
Financial Adviser and Corporate Broker
Liberum Capital Limited
Ropemaker Place Level 12
25 Ropemaker Street
London, EC2Y 9LY
Numis Securities Limited
The London Stock Exchanges Building
10 Paternoster Square
London, EC4M 7LT
Appointed 17 February 2021
Administrator and Company Secretary
Maitland Administration (Guernsey) Limited
3rd Floor
1 Le Truchot
St Peter Port
Guernsey, GY1 1WD
Registrar
Computershare Investor Services
(Guernsey) Limited
1st Floor, Tudor House
Le Bordage
St Peter Port
Depositary
Citibank Europe plc, UK Branch
Citigroup Centre
Canada Square
Canary Wharf
London, E14 5LB
English Legal Adviser to the Company
Travers Smith LLP
10 Snow Hill
London, EC1A 2AL
Guernsey Legal Adviser to the Company
Ogier (Guernsey) LLP
Redwood House
St Julian's Avenue
St Peter Port, GY1 1AW

Independent Auditor
KPMG Channel Islands Limited
Glategny Court
Glategny Esplanade
St Peter Port
Guernsey, GY11WR
Definitions
BENCHMARK PERFORMANCE With reference to investment valuation, application of the performance of a benchmark or
pool of comparable companies to an unlisted company to determine a valuation.
NAV PER SHARE Net Asset Value expressed as an amount per share.
NAV PER SHARE GROWTH With reference to fund performance, NAV at end of stated year / NAV at beginning of stated
year as a percentage.
IRR Internal Rate of Return – with reference to investment performance, calculated using excel
XIRR formula.
TRADING MULTIPLE With reference to investment valuation, enterprise value / annual revenue of company.
DRAWDOWN With reference to index performance, the maximum percentage loss in value over a given
time period.
DISCOUNT / PREMIUM
The amount by which the market price per share of an investment company is lower or higher
than its net asset value per share. The discount or premium is normally expressed as a
percentage of the net asset value per share.
NET ASSET VALUE (NAV)
The Net Asset Value (NAV) is the amount by which total assets exceed total liabilities, i.e., the
difference between what the Company owns and what it owes.