Chronobiology of the renin-angiotensin-aldosterone system ... · blood flow and glomerular...
16
Chronobiology International, Early Online: 1–16, (2013) ! Informa Healthcare USA, Inc. ISSN: 0742-0528 print / 1525-6073 online DOI: 10.3109/07420528.2013.807275 Chronobiology of the renin-angiotensin-aldosterone system in dogs: relation to blood pressure and renal physiologyy Jonathan P. Mochel 1,2 , Martin Fink 2 , Mathieu Peyrou 3 , Cyril Desevaux 4 , Mark Deurinck 5 , Je ´ro ˆ me M. Giraudel 6 , and Meindert Danhof 1 1 Department of Pharmacology, Leiden-Academic Centre for Drug Research, Leiden, The Netherlands, 2 Department of Modeling and Simulation, Novartis Campus St. Johann, Basel, Switzerland, 3 Department of Therapeutics Research, Novartis Centre de Recherche Sante Animale SA, Saint-Aubin, Switzerland, 4 Department of Pre-Clinical Safety, Novartis Centre de Recherche Sante Animale SA, Saint-Aubin, Switzerland, 5 Department of Pre-clinical Safety, Novartis Institutes of Biomedical Research, Basel, Switzerland, and 6 Yarrandoo Research and Development Centre, Novartis Animal Health Australasia Pty. Limited, Kemps Creek, Australia The renin-angiotensin-aldosterone system (RAAS) plays a pivotal role in the regulation of blood pressure and volume homeostasis. Its contribution to the development of cardiovascular diseases has long been recognized. Extensive literature has shown that peptides of the RAAS oscillate with a circadian periodicity in humans, under strong influence of posture, sleep, and age. Although observations of time-variant changes in the renin cascade are available in dogs, no detailed chronobiological investigation has been conducted so far. The present studies were designed to explore the circadian variations of plasma renin activity (RA) and urinary aldosterone-to-creatinine ratio (U A:C ) in relation to blood pressure (BP), sodium (U Na ,U Na,fe ), and potassium (U K ,U K,fe ) renal handling. Data derived from intensive blood and urine sampling, as well as continuous BP monitoring, were collected throughout a 24-h time period, and analyzed by means of nonlinear mixed-effects models. Differences between the geometric means of day and night observations were compared by parametric statistics. Our results show that variables of the renin cascade, BP, and urinary electrolytes oscillate with significant day-night differences in dogs. An approximately 2-fold (1.6–3.2-fold) change between the average day and night measurements was found for RA (p50.001), U A:C (p ¼ 0.01), U K,fe (p ¼ 0.01), and U Na (p ¼ 0.007). Circadian variations in BP, albeit small (less than 10 mm Hg), were statistically significant (p50.01) and supported by the model-based analysis. For all variables but U Na and U Na,fe , the levels were higher at night than during the day. The data also indicate that blood pressure oscillates in parallel to the RAAS, such that, as opposed to healthy humans, BP does not drop at night in dogs. The postprandial decrease in RA is assumed to be related to body fluid volume expansion secondary to water and sodium intake, whereas the reduction of U A:C reflects aldosterone-stimulated secretion by the renin-angiotensin II pathway. U Na and U Na,fe peaked in the afternoon, about 7–8 h after food intake, which is consistent with the ‘‘impulse-response pattern’’ of sodium excretion described in previous publications. Finally, U K and U K,fe mirrored aldosterone-mediated potassium secretion in the kidney tubules. To describe the circadian variations of the various variables, two different mathematical representations were applied. A cosine model with a fixed 24-h period was found to fit the periodic variations of RA, U A:C ,U K ,U K,fe , and BP well, whereas changes in U Na and U Na,fe were best characterized by a surge model. The use of nonlinear mixed effects allowed estimation of population characteristics that can influence the periodicity of the RAAS. Specifically, sodium intake was found to interact with the tonic and the phasic secretion of renin, suggesting that varying feeding time could also impact the chronobiology of the renin cascade. (Author correspondence: [email protected]) Keywords: Chronotherapy, Circadian periodicity, Covariate, Nonlinear mixed-effects modeling INTRODUCTION Within the mammalian kidney, the juxtaglomerular apparatus (JGA) consists of tubular and vascular struc- tures whose role is critical in the regulation of renal blood flow and glomerular filtration rate (Thurau, 1966). As part of the JGA, the macula densa (MD) is an area of specialized cells that respond to changes in sodium chloride concentration in the tubular fluid by mediating yPart of the results of these studies were presented in abstract form at the European Association for Veterinary Pharmacology and Toxicology (EAVPT), July 8–12, 2012, Noordwijkerhout, The Netherlands. Correspondence: Jonathan Mochel, MSc, DVM, ECVPT Resident, Novartis Campus St. Johann, WSJ-27.6.022, 4002 Basel, Switzerland. Tel.: +41 61 696 9077; Fax: +41 61 324 5874; E-mail: [email protected] Submitted January 28, 2013, Returned for revision May 16, 2013, Accepted May 17, 2013 1 Chronobiol Int Downloaded from informahealthcare.com by Novartis Pharma on 08/09/13 For personal use only.
Transcript of Chronobiology of the renin-angiotensin-aldosterone system ... · blood flow and glomerular...

Chronobiology International, Early Online: 1–16, (2013)! Informa Healthcare USA, Inc.ISSN: 0742-0528 print / 1525-6073 onlineDOI: 10.3109/07420528.2013.807275
Chronobiology of the renin-angiotensin-aldosterone system in dogs:relation to blood pressure and renal physiologyy
Jonathan P. Mochel1,2, Martin Fink2, Mathieu Peyrou3, Cyril Desevaux4, Mark Deurinck5,Jerome M. Giraudel6, and Meindert Danhof1
1Department of Pharmacology, Leiden-Academic Centre for Drug Research, Leiden, The Netherlands, 2Department ofModeling and Simulation, Novartis Campus St. Johann, Basel, Switzerland, 3Department of Therapeutics Research,Novartis Centre de Recherche Sante Animale SA, Saint-Aubin, Switzerland, 4Department of Pre-Clinical Safety, NovartisCentre de Recherche Sante Animale SA, Saint-Aubin, Switzerland, 5Department of Pre-clinical Safety, Novartis Institutesof Biomedical Research, Basel, Switzerland, and 6Yarrandoo Research and Development Centre, Novartis Animal HealthAustralasia Pty. Limited, Kemps Creek, Australia
The renin-angiotensin-aldosterone system (RAAS) plays a pivotal role in the regulation of blood pressure and volumehomeostasis. Its contribution to the development of cardiovascular diseases has long been recognized. Extensiveliterature has shown that peptides of the RAAS oscillate with a circadian periodicity in humans, under strong influenceof posture, sleep, and age. Although observations of time-variant changes in the renin cascade are available in dogs,no detailed chronobiological investigation has been conducted so far. The present studies were designed to explorethe circadian variations of plasma renin activity (RA) and urinary aldosterone-to-creatinine ratio (UA:C) in relationto blood pressure (BP), sodium (UNa, UNa,fe), and potassium (UK, UK,fe) renal handling. Data derived from intensiveblood and urine sampling, as well as continuous BP monitoring, were collected throughout a 24-h time period,and analyzed by means of nonlinear mixed-effects models. Differences between the geometric means of day andnight observations were compared by parametric statistics. Our results show that variables of the renin cascade, BP,and urinary electrolytes oscillate with significant day-night differences in dogs. An approximately 2-fold (1.6–3.2-fold)change between the average day and night measurements was found for RA (p50.001), UA:C (p¼ 0.01), UK,fe
(p¼ 0.01), and UNa (p¼ 0.007). Circadian variations in BP, albeit small (less than 10 mm Hg), were statisticallysignificant (p50.01) and supported by the model-based analysis. For all variables but UNa and UNa,fe, the levels werehigher at night than during the day. The data also indicate that blood pressure oscillates in parallel to the RAAS, suchthat, as opposed to healthy humans, BP does not drop at night in dogs. The postprandial decrease in RA is assumed tobe related to body fluid volume expansion secondary to water and sodium intake, whereas the reduction of UA:C
reflects aldosterone-stimulated secretion by the renin-angiotensin II pathway. UNa and UNa,fe peaked in the afternoon,about 7–8 h after food intake, which is consistent with the ‘‘impulse-response pattern’’ of sodium excretion describedin previous publications. Finally, UK and UK,fe mirrored aldosterone-mediated potassium secretion in the kidneytubules. To describe the circadian variations of the various variables, two different mathematical representations wereapplied. A cosine model with a fixed 24-h period was found to fit the periodic variations of RA, UA:C, UK, UK,fe, and BPwell, whereas changes in UNa and UNa,fe were best characterized by a surge model. The use of nonlinear mixed effectsallowed estimation of population characteristics that can influence the periodicity of the RAAS. Specifically, sodiumintake was found to interact with the tonic and the phasic secretion of renin, suggesting that varying feeding timecould also impact the chronobiology of the renin cascade. (Author correspondence: [email protected])
Keywords: Chronotherapy, Circadian periodicity, Covariate, Nonlinear mixed-effects modeling
INTRODUCTION
Within the mammalian kidney, the juxtaglomerular
apparatus (JGA) consists of tubular and vascular struc-
tures whose role is critical in the regulation of renal
blood flow and glomerular filtration rate (Thurau, 1966).
As part of the JGA, the macula densa (MD) is an area
of specialized cells that respond to changes in sodium
chloride concentration in the tubular fluid by mediating
yPart of the results of these studies were presented in abstract form at the European Association for Veterinary Pharmacology andToxicology (EAVPT), July 8–12, 2012, Noordwijkerhout, The Netherlands.Correspondence: Jonathan Mochel, MSc, DVM, ECVPT Resident, Novartis Campus St. Johann, WSJ-27.6.022, 4002 Basel,Switzerland. Tel.: +41 61 696 9077; Fax: +41 61 324 5874; E-mail: [email protected]
Submitted January 28, 2013, Returned for revision May 16, 2013, Accepted May 17, 2013
1
Chr
onob
iol I
nt D
ownl
oade
d fr
om in
form
ahea
lthca
re.c
om b
y N
ovar
tis P
harm
a on
08/
09/1
3Fo
r pe
rson
al u
se o
nly.

renin release from the granular cells of the JGA. Renin
release triggers a cascade of biochemical events, with
the subsequent formation of angiotensin I, angiotensin
II, and aldosterone. The so-called renin-angiotensin-
aldosterone system (RAAS) plays a pivotal role in the
control of blood pressure (BP) and volume homeostasis
by regulating sodium and potassium exchanges in the
kidney tubules. Its contribution to the development
of hypertension and chronic heart failure has long
been recognized (Kunita et al., 1976; Nicholls et al., 1993;
Pedersen et al., 1995; Roche et al., 2002). Further, it has
been shown that inhibition of the renin-angiotensin
pathway is an effective approach to treat these disorders
(Allikmets, 2007; Turnbull, 2003).
It has been established that RAAS peptides oscillate
with a circadian periodicity in rodents and humans
(Cugini et al., 1981, 1984, 1985, 1986, 1987; Kawasaki
et al., 1990). Several physiological influences have been
shown to influence day-night variations of the renin-
angiotensin cascade, including alterations in posture
(Muller et al., 1958), sleep cycles (Brandenberger et al.,
1985, 1994), and age (Cugini et al., 1985).
Parallel to day-night changes in RAAS peptides, data
from telemetry monitoring in humans have consistently
demonstrated that BP has a reproducible circadian
rhythm, with highest levels measured in the morning,
and lowest values around midnight (Smolenski & Haus,
1994; Staessen et al., 1992).
Although observations of time-variant changes in
RAAS peptides in dogs have been published (Corea
et al., 1996; Gordon & Lavie, 1985; Reinhardt et al., 1996),
no detailed characterization of the chronobiology of
these variables is currently available in the literature.
In addition, the question of whether BP oscillates over
the 24-h span in dogs is still a matter of debate
(Miyazaki et al., 2002; Piccione et al., 2005, Soloviev
et al., 2006).
Benefits of acquiring knowledge on the chronobiol-
ogy of the RAAS and BP in dogs are twofold. First,
it provides a scientific rationale to support further
research on administration time-dependent efficacy
of treatment in the management of RAAS-related
diseases, such as chronic canine valvular heart disease.
This condition is characterized by the thickening
and shortening of the atrioventricular valves, and affects
about 75% of dogs over the age of 16 (Guglielmini, 2003).
Second, human and canine heart failure share common
pathophysiological features. Specifically, activation of
the renin cascade is one of the key neurohumoral
responses to the reduced cardiac output observed in
both species (Sayer et al., 2009; Watkins et al., 1976).
Therefore, knowledge on the circadian periodicity of
renin, in relation to BP and renal physiology in dogs,
also constitutes valuable information to the understand-
ing of RAAS biology in humans.
This investigation offers a comprehensive description
of the chronobiology of the renin cascade in dogs, in
relation to BP and renal sodium-potassium handling,
using a nonlinear mixed-effects modeling approach
(also referred to as population modeling).
MATERIALS AND METHODS
Sample collection for measurement of plasma and
urinary variables and telemetry recordings were per-
formed in two separate studies and distinct groups
of animals, in order to preclude manipulation-related
disturbances (e.g., venipuncture) on blood pressure
(Baumgart, 1991).
AnimalsThe studies were performed in compliance with a
registered Swiss permit covering animal experiments
for cardiovascular research in dogs as approved by
the Cantonal Animal Welfare Committee and the
Veterinary Services. The study protocols were designed
to use the fewest number of animals possible while
being consistent with the scientific needs of the
study, and conformed to international ethical standards
(Portaluppi et al., 2010).
In the first experiment (Study a; Figure 1), blood
and urinary samples for measurement of RA, urinary
aldosterone, and renal sodium-potassium exchanges
were taken from 18 adult (9 males and 9 females)
healthy, non-neutered beagle dogs weighing between
12.0 and 18.0 kg (Marshall Europe, Green Hill,
Montichiari, Italy).
In the second experiment (Study b; Figure 1), systolic
(SBP) and diastolic (DBP) arterial blood pressures
were continuously recorded from 6 adult healthy,
non-neutered telemetered male beagle dogs weighing
from 10.4 to 15.2 kg (Marshall Europe, Green Hill).
Suitability for inclusion was evaluated by a physical
examination and confirmed by measuring selected
hematological (red and white blood cells counts, hemo-
globin [Hb], hematocrit [Hct]) and clinical chemistry
(albumin, total protein, alanine aminotransferase,
aspartate aminotransferase, blood urea nitrogen, cre-
atinine) parameters in blood. Telemetry signal quality
and BP waveform analysis were used as additional
criterion for telemetry dogs.
Housing ConditionsPrior to the experiments, the dogs were acclimatized
to the experimental facility for a week. Animals were
housed in pens (about 2 m2/animal) containing granu-
late bedding material and an additional elevated plat-
form for resting. On the sampling days, dogs were
housed in metabolism cages. Over many sessions, the
dogs were trained to rest in metabolism cages for up to
12 h. Dogs from the telemetry study were group housed
and pair housed on days of BP recording. The study
rooms had natural daylight and additional artificial light
of similar intensity (400 lux) from 07:00 to 19:00 h. Room
temperature and relative humidity were within the
target ranges of 17–23 �C and 35–75%, respectively.
2 J. P. Mochel et al.
Chronobiology International
Chr
onob
iol I
nt D
ownl
oade
d fr
om in
form
ahea
lthca
re.c
om b
y N
ovar
tis P
harm
a on
08/
09/1
3Fo
r pe
rson
al u
se o
nly.

Drinking water quality was compliant with the Swiss
Federal Regulation on Foodstuff, and was offered ad
libitum. One week before and throughout the studies,
water and food intake were recorded on a daily basis.
The dogs were offered a normal-sodium diet (Biomill
Adult Medium, 0.5% sodium; Biomill, Herzogenbuchsee,
Switzerland) once daily at 07:00 h. Depending on the
size of the ration, the individual daily sodium intake
ranged from 34 to 80 mEq. The amount of food given per
dog was kept constant throughout the experiments.
Experimental ProcedureStudy a: Periodicity of the RAAS and UrinaryElectrolytes in DogsBlood specimens were collected every 2 h (starting from
07:00 h) into 1.2 - or 2.7-mL S-Monovette tubes
(Sarstedt, Newton, NC, USA). Due to the known sensi-
tivity of the renin-angiotensin cascade to posture and
external stimuli (Muller et al., 1958), specific precau-
tions were taken: dogs were kept and maintained in
the same position (up and standing) during blood
collection, sampling was performed in a sound-
protected room, and low-intensity lighting was used
for night sampling.
Blood samples were cooled on ice immediately
after withdrawal and centrifuged under refrigeration
(2� 1 �C, 15 min) within 30 min of sampling. Plasma was
then transferred into cooled propylene aliquots, snap-
frozen, and stored at �80 �C before determination
of RA. Urine samples were collected from the metabol-
ism cage every 4 h (starting from 07:00 h) into cooled
Erlenmeyer flasks and transferred into two distinct
plain tubes, for determination of urinary (i) aldosterone
(UAL) (stored at �80 �C), (ii) sodium (UNa) (stored at
4 �C), and (iii) potassium (UK) (stored at 4 �C) concen-
trations. Urinary aldosterone-to-creatinine ratios (UA:C)
were derived by measuring plasma and urinary creatin-
ine, as proposed by Gardner et al. (2007). The glomeru-
lar filtration rate (GFR), as well as sodium and
potassium fractional excretions (UNa,fe and UK,fe,
respectively), was determined using the renal clearance
of creatinine1 as described by Lefebvre et al. (2008).
Study b: Periodicity of Blood Pressure in DogsThe telemetry system consisted of an implantable
transmitter (chronic use TL11M2-D70-PCT implant;
Data Sciences International [DSI], St. Paul, MN, USA),
cage receivers (RMC-1 general purpose receiver for
metal cages; DSI), ambient pressure monitor (APR-1
ambient pressure reference; DSI), data exchange matrix
(Dataquest ART data exchange matrix; DSI), and an
electronic data acquisition system (DQ ART 2.1
Dataquest acquisition and analysis system; DSI).
The transmitter contained a pressure sensor for BP
measurement, an electric potential sensor for electro-
cardiogram (ECG) recording, and a thermometer for
measuring core body temperature. The pressure sensor
was connected to a fluid-filled urethane catheter
inserted in the arteria femoralis with the tip placed in
the arteria inguinalis. ECG leads were implanted intra-
muscularly in an Einthoven lead II configuration. The
transmitted signal was captured by the cage receivers
and transformed by the data exchange matrix. After
surgery, the dogs were allowed to recover for 1 month.
The procedures were in compliance with the recom-
mendations of the BVAAWF/FRAME/RSPCA/UFAW
Joint Working Group on Refinement regarding telemetry
(Morton et al., 2003). Beginning around 07:00 h and
ending about 24 h later, the electrocardiogram and
arterial BP and core body temperature were recorded
continuously. Data from every third quarter of an hour
were analyzed and averaged to derive an hourly value.
Intensive blood and urine samplingover 24-hour periods
Period of acclimation Regular diet(07.00am)
Regular diet(07.00am)
Period of acclimation
Continuous telemetry recordingover a 24-hour time window
Study a. Periodicity of the RAAS and urinaryelectrolytes in dogs (n: 18 dogs)
Study b. Periodicity of blood pressure in dogs(n: 6 dogs)
FIGURE 1. Study outline. All animals were healthy adult, non-neutered beagle dogs fed a normal-sodium diet at 07:00 h. (a) Periodicity
of the RAAS and urinary electrolytes in dogs (Study a). Blood and urinary samples for measurement of RA, urinary aldosterone, and
renal sodium-potassium exchanges were taken from 18 beagle dogs (9 males and 9 females) weighing between 12.0 and 18.0 kg. Samples
were collected every 2 and 4 h for plasma and urinary specimens, respectively. (b) Periodicity of blood pressure in dogs (Study b).
Systolic and diastolic arterial BPs were continuously recorded from 6 telemetered male beagle dogs weighing from 10.4 to 15.2 kg.
1Because of limited tubular secretion and reabsorption (Guignard & Drukker, 1999; O’Connell et al., 1962), creatinine clearance canbe used to provide estimates of the glomerular filtration rate (GFR) in dogs.
RAAS and Blood Pressure Chronobiology in Dogs 3
! Informa Healthcare USA, Inc.
Chr
onob
iol I
nt D
ownl
oade
d fr
om in
form
ahea
lthca
re.c
om b
y N
ovar
tis P
harm
a on
08/
09/1
3Fo
r pe
rson
al u
se o
nly.

Analytical MethodsRenin activity was determined by measuring the rate
of angiotensin I (AI) formation after incubation of
endogenous renin and angiotensinogen in plasma
(2 h, 37 �C, pH 7.2). AI concentrations were measured
after liquid-solid extraction using a validated enzyme
immunoassay (EIA) (S-1188 Angiotensin I-EIA kit; host:
rabbit high-sensitivity European Conformity (CE)-
marked; Bachem, Bubendorf, Switzerland). Analyses
were performed in duplicates; values with a coefficient
of variance (CV%) below 25% were retained for statis-
tical evaluation. UAL concentrations were determined
with a liquid chromatography–tandem mass spectrom-
etry method using an isotope dilution technique. Urine
samples were not subjected to acid hydrolysis before
extraction, that is, only nonconjugated aldosterone
concentrations were measured. Calibration standards
ranging from 0.05 to 10.0 ng/mL were used for quanti-
fication. Sodium and potassium concentrations were
quantified using an ion-selective electrode measure-
ment method (Olympus AU 400; Beckmann Coulter
International, Nyon, Switzerland). A colorimetric Jaffe
reaction was used for quantification of plasma and
urinary creatinine concentrations.
Data AnalysisQuantification of Day-Night DifferencesComparison of area under the curves (AUCs). For rich
data (i.e., RA, SBP, and DBP), the individual area
under the curve of day (AUCs[07:00–19:00]) vs. night
(AUCs[19:00–07:00]) observations were derived using the
linear trapezoidal rule, and compared by paired t tests
using R version 2.15 (The R Foundation for Statistical
Computing, Vienna, Austria). The homogeneity of vari-
ances between day and night AUCs was assessed
using the Bartlett’s test. p values were adjusted for
multiple comparisons using the Sidak procedure, and
were reported for a¼ 0.05. Distributions were inspected
for normality and skewness.
Comparison of day vs. night urinary spot samples. For
sparse data (i.e., UA:C, UNa, UNa,fe, UK, and UK,fe), day
(11:00 and 15:00 h) vs. night (23:00 and 03:00 h) meas-
urements derived from urinary spot samples were
compared by paired t tests. The Bartlett’s test was
used for evaluating homoscedasticity between day and
night levels. p values were adjusted for multiple com-
parisons using the Sidak correction, and were reported
for a¼ 0.05.
Chronobiological AnalysisChi-square statistics for testing the zero-amplitude
hypothesis.. For rhythm detection, a p value was
derived from the difference in objective function value
(OFV) between the fit of a straight line approximation
of the mean (1 model parameter) and that of a cosine
function (3 model parameters). In nonlinear mixed-
effects modeling, the OFV is approximated to minus
2 times the logarithm of the likelihood of the data given
the model, with a lower value indicating a better model
(Sheiner & Ludden, 1992). It is used to draw statistical
inference about the goodness-of-fit of the mathematical
models. A negative OFV would indicate that the likeli-
hood is greater than 1.
The difference in OFV between two models follows
an asymptotic chi-square distribution, with degrees
of freedom equal to the difference in the number of
parameters between contending models. A periodic
rhythm was considered as statistically significant for a
drop in OFV45.9 (for a risk level a¼ 0.05).
Nonlinear mixed-effects (population) modeling. Nyc-
themeral variations in RA, BP, and urinary variables
were characterized by means of a nonlinear mixed-
effects modeling approach, using NONMEM version 7.2
(Icon Development Solutions, Ellicott City, MD, USA).
Individual model parameters were obtained post hoc as
empirical Bayes estimates.
Nonlinear mixed-effects models were written using
the following format (Equation 1):
yij ¼ f �i, tij� �
þ g �i, tij,�� �
� "ij, j ¼ 1, . . . ni
�i ¼ � � exp�i, i ¼ 1, . . . , Nð1Þ
where yij is the observed variable (e.g., RA, UA:C)
measured on the ith individual at time tij, �i is the
vector of individual parameters, f(�i, tij) is the value
of that observed variable at time tij for an individual
with parameters �i, and "ij is an independent random
variable. The function g(�i, tij,�) is the standard devi-
ation of the error of a given measurement at time tij. In
population modeling f(�i, tij) is referred to as structural
model (error-free), whereas g(�i, tij,�) is the residual
error model (combining unexplained variability and
measurement noise). � represents the typical value
(population average) of a model parameter. The sources
of variation between the individual parameters �i can be
explained by population characteristics (i.e., covariates)
that can be included additionally or proportionally to m.
The independent random variables �i represent the
unexplained difference between the value of the indi-
vidual parameters �i and their average �. Random
variables yij, "ij, �i, and �i were assumed to be log-
normally distributed.
The first-order conditional estimation method with
interaction was used for all analyses. Covariate search
was performed using the stepwise covariate model
building tool of Perl-speaks-NONMEM (Mats Karlsson,
Niclas Jonsson, and Andrew Hooker, 2008) with forward
inclusion based on p¼ 0.05 and afterwards backward
exclusion based on p¼ 0.01. Analyzed covariates were
sex, dietary sodium, and body weight.
Standard goodness-of-fit diagnostics, including
population and individual predictions vs. observations,
and the distributions of weighted residuals over time,
were performed to assess the adequacy of selected
4 J. P. Mochel et al.
Chronobiology International
Chr
onob
iol I
nt D
ownl
oade
d fr
om in
form
ahea
lthca
re.c
om b
y N
ovar
tis P
harm
a on
08/
09/1
3Fo
r pe
rson
al u
se o
nly.
models. Graphical assessment was performed using the
R-based software Xpose version 4.1 (Jonsson & Karlsson,
1999) in R version 2.15.
Model selection was based on statistical significance
between competing models using the objective function
value obtained from NONMEM, graphical evaluation,
and validity of parameter estimates. Residual error
estimates from the population models were used as
supportive information for evaluation of lack of fit.
The normality and independence of residuals were
evaluated using the Shapiro-Wilk and Durbin-Watson
tests, respectively.
Correlations Between signalsPhase relationships between observed variables were
investigated using a circular version of the Pearson’s
product moment correlation in R version 2.15
(Agostinelli & Lund, 2011; R package ‘‘circular’’:
Circular Statistics).
Differences between the average phases of blood
pressure, plasma, and urinary variables were character-
ized by introducing a phase shift in the population
models. Chi-square statistics were used to decide on
the statistical significance of the drop in OFV when
including this additional model parameter.
p values were adjusted for multiple comparisons
using the Sidak procedure, and were reported for
a¼ 0.05.
RESULTS
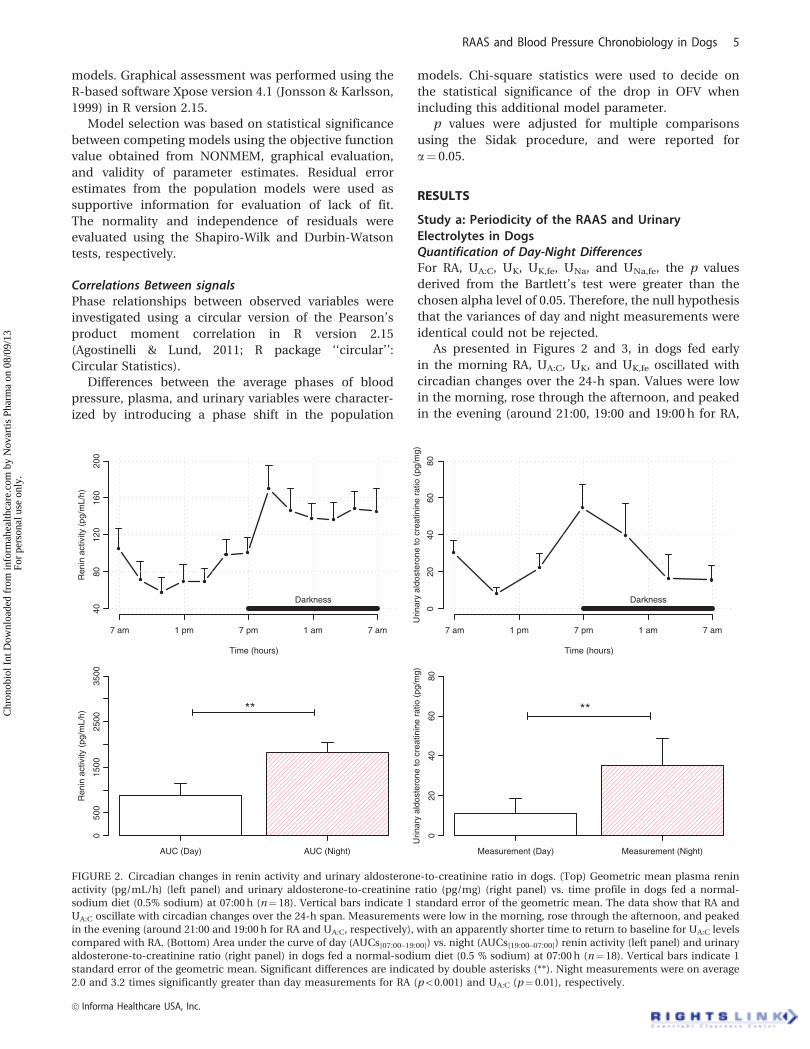
Study a: Periodicity of the RAAS and UrinaryElectrolytes in DogsQuantification of Day-Night DifferencesFor RA, UA:C, UK, UK,fe, UNa, and UNa,fe, the p values
derived from the Bartlett’s test were greater than the
chosen alpha level of 0.05. Therefore, the null hypothesis
that the variances of day and night measurements were
identical could not be rejected.
As presented in Figures 2 and 3, in dogs fed early
in the morning RA, UA:C, UK, and UK,fe oscillated with
circadian changes over the 24-h span. Values were low
in the morning, rose through the afternoon, and peaked
in the evening (around 21:00, 19:00 and 19:00 h for RA,
Time (hours)
Ren
in a
ctiv
ity (
pg/m
L/h)
7 am 1 pm 7 pm 1 am 7 am
4080
120
160
200
Darkness
Time (hours)
Urin
ary
aldo
ster
one
to c
reat
inin
e ra
tio (
pg/m
g)
7 am 1 pm 7 pm 1 am 7 am
020
4060
80
Darkness
AUC (Day) AUC (Night)
Ren
in a
ctiv
ity (
pg/m
L/h)
050
015
0025
0035
00
**
Measurement (Day) Measurement (Night)
Urin
ary
aldo
ster
one
to c
reat
inin
e ra
tio (
pg/m
g)
020
4060
80
**
FIGURE 2. Circadian changes in renin activity and urinary aldosterone-to-creatinine ratio in dogs. (Top) Geometric mean plasma renin
activity (pg/mL/h) (left panel) and urinary aldosterone-to-creatinine ratio (pg/mg) (right panel) vs. time profile in dogs fed a normal-
sodium diet (0.5% sodium) at 07:00 h (n¼ 18). Vertical bars indicate 1 standard error of the geometric mean. The data show that RA and
UA:C oscillate with circadian changes over the 24-h span. Measurements were low in the morning, rose through the afternoon, and peaked
in the evening (around 21:00 and 19:00 h for RA and UA:C, respectively), with an apparently shorter time to return to baseline for UA:C levels
compared with RA. (Bottom) Area under the curve of day (AUCs[07:00–19:00]) vs. night (AUCs[19:00–07:00]) renin activity (left panel) and urinary
aldosterone-to-creatinine ratio (right panel) in dogs fed a normal-sodium diet (0.5 % sodium) at 07:00 h (n¼ 18). Vertical bars indicate 1
standard error of the geometric mean. Significant differences are indicated by double asterisks (**). Night measurements were on average
2.0 and 3.2 times significantly greater than day measurements for RA (p50.001) and UA:C (p¼ 0.01), respectively.
RAAS and Blood Pressure Chronobiology in Dogs 5
! Informa Healthcare USA, Inc.
Chr
onob
iol I
nt D
ownl
oade
d fr
om in
form
ahea
lthca
re.c
om b
y N
ovar
tis P
harm
a on
08/
09/1
3Fo
r pe
rson
al u
se o
nly.

UA:C, and UK,fe, respectively), with an apparently shorter
time to return to baseline for UA:C, UK, and UK,fe levels
compared with RA. Night measurements were on aver-
age 2.0 and 3.2 times significantly greater than day
measurements for RA (p50.001) and UA:C (p¼ 0.01),
respectively (Figure 2).
UK and UK,fe oscillated in parallel, showing simi-
lar dynamics to UA:C and a peak around 19:00 h
(Figure 3). Day UK and UK,fe values were on average
1.2 (p40.05) and 1.6 (p¼ 0.01) times smaller than night
measurements. In contrast, UNa and UNa,fe levels were
high from morning to the middle of the afternoon
(peak around 15:00 h), and decreased from the latter half
of the afternoon to the early morning (Figure 3). UNa and
UNa,fe values were respectively 1.9 (p¼ 0.007) and 1.3
(p¼ 0.05) times higher during daytime.
Chi-Square Statistics for Testing the Zero-AmplitudeHypothesisThe cosinor fit of the data was statistically significant
(p� 0.001) for RA, UA:C, UK, UK,fe, UNa, and UNa,fe,
supporting the hypothesis of time-varying dynamics
with a 24-h period (Table 1). In contrast, no circadian
●
●
●
●
●●
●
Time (hours)
7 am 1 pm 7 pm 1 am 7 am
0.0
0.2
0.4
0.6
0.8
040
8012
016
0
●
●
●
●
●●
●
●
●
Sodium fractional excretion (%)Urinary sodium concentration (mmol/L)
Darkness
●
●
●
●
●
●
●
Time (hours)
7 am 1 pm 7 pm 1 am 7 am
010
2030
050
100
150
●
●
●
●
●●
●
●
●
Potassium fractional excretion (%)Urinary potassium concentration (mmol/L)
Darkness
Day Night
Sod
ium
frac
tiona
l exc
retio
n (%
)
0.0
0.1
0.2
0.3
0.4
0.5
Day Night
Urin
ary
sodi
um c
once
ntra
tion
(mm
ol/L
)
020
4060
8010
0
**
Day Night
Pot
assi
um fr
actio
nal e
xcre
tion
(%)
05
1015
20
**
Day NightUrin
ary
pota
ssiu
m c
once
ntra
tion
(mm
ol/L
)
020
4060
8010
0
FIGURE 3. Circadian changes in sodium and potassium renal elimination (urinary concentration and fractional excretion) in dogs. (Top)
Geometric mean sodium (left panel) and potassium (right panel) renal elimination vs. time profile in dogs fed a normal-sodium diet (0.5%
sodium) at 07:00 h (n¼ 18). Solid line: fractional excretion (%, left axis); dashed line: urinary concentration (mmol/L, right axis). Vertical
bars indicate 1 standard error of the geometric mean. UNa,fe and UNa levels were high from morning to the middle of the afternoon (peak
observed around 15:00 h), and decreased from the latter half of the afternoon to the early morning. In contrast, UK,fe and UK showed a
profile very similar to UA:C, with a peak around 19:00 h and a rather short time to return to baseline values compared with RA. (Bottom) Day
vs. night urinary electrolyte measurements in dogs fed a normal-sodium diet (0.5 % sodium) at 07:00 h (n¼ 18). From left to right: sodium
fractional excretion (%), sodium concentration (mmol/L), potassium fractional excretion (%), and potassium concentration (mmol/L).
Vertical bars indicate 1 standard error of the geometric mean. Significant differences are indicated by double asterisks (**).UNa,fe and UNa
values were respectively 1.3 (p¼ 0.05) and 1.9 (p¼ 0.007) times higher during daytime. Unlike sodium, day UK,fe and UK values were on
average 1.6 (p¼ 0.001) and 1.2 (p40.05) times smaller than night measurements.
TABLE 1. Comparison of objective function value (OFV) for statistical testing of the zero-amplitude hypothesis.
OFV RA UA:C UK,fe UNa,fe UNa UK GFR SBP DBP
OFV (straight line) �51 240 �196 27 40 �16 28 �353 �333
OFV (cosine model) �203 203 �263 �36 1 �36 27 �370 �343
Difference �152 �37 �67 �63 �39 �20 �1 �17 �10
p value 50.001 50.001 50.001 50.001 50.001 50.001 NS 50.001 0.001
For rhythm detection, a p value was derived from the difference in OFV between the fit of a straight line approximation of the mean and
that of a cosine function. A periodic rhythm was considered as statistically significant for a drop in OFV45.9 (for a risk level of a¼ 0.05).
Model estimates of the amplitudes can be found in Table 2.
6 J. P. Mochel et al.
Chronobiology International
Chr
onob
iol I
nt D
ownl
oade
d fr
om in
form
ahea
lthca
re.c
om b
y N
ovar
tis P
harm
a on
08/
09/1
3Fo
r pe
rson
al u
se o
nly.

changes were found for the endogenous creatinine
clearance (GFR).
Nonlinear Mixed-Effects ModelingA cosine model (Figure 4) was found to fit the periodic
nature of plasma renin activity, aldosterone, and potas-
sium urinary elimination well, as shown by the standard
goodness-of-fit diagnostics, and the individual predic-
tions in Figures 5 and 6.
The selected structural model was written as follows
(Equation 2):
f ðtijÞ ¼ Mi � 1þ Ai � cos tij � i
� �� 2�
�i
� �� �� �ð2Þ
where f(tij) is the predicted RA, UA:C, UK, or UK,fe value
at time tij, Mi is the mesor (daily average of rhythm) for
the ith individual, Ai is the amplitude of the cosine, i
is the acrophase (or time of peak), and � i is the fixed
24-h period of the cosine for that individual.
The residual error model combined an additive and
a proportional error term. Estimates of residual errors
(CV%) from the population models were 30%, 80%, 18%,
and 30% for RA, UA:C, UK, and UK,fe, respectively. The p
values derived from the Shapiro-Wilk and Durbin-
Watson tests were greater than the chosen alpha level
of 0.05. Hence, the null hypothesis that the residuals
were independent and came from a normally distrib-
uted population could not be rejected.
Changes in UNa and UNa,fe were best characterized by
means of a surge function (Nagaraja et al., 2003). The
structural model was written as follows (Equation 3):
gðtijÞ ¼ Bi � 1þ Ai � cos tij � i
� �� 2�
�i
� �� �þ 1
� �� wi
ð3Þ
where g(tij) is the predicted UNa or UNa,fe level, Bi
is the baseline for the ith individual, Ai is the ampli-
tude of the cosine, i is the acrophase, � i is the
fixed 24-h period of the cosine, and wi represents
the width of the surge function for that individual
(Figure 4).
A proportional error model was used to account for
the residual noise in the measurement of UNa and UNa,fe.
Estimates of residual errors (CV%) from the population
models were 20% and 30% for UNa and UNa,fe, respect-
ively. The p values derived from the Shapiro-Wilk and
Durbin-Watson tests were greater than the chosen alpha
level of 0.05. Therefore, the null hypothesis that the
residuals were independent and came from a normally
distributed population could not be rejected.
Time (hours)
Obs
erve
d va
riabl
e (u
nit)
7 am 1 pm 7 pm 1 am 7 am 1 pm 7 pm 1 am 7 am
8010
012
014
0
M: mesor
τ: period
τ: period
Ψ: acrophase
Ψ: acrophase
A: amplitude
A: amplitude
Time (hours)
Obs
erve
d va
riabl
e (u
nit)
7 am 1 pm 7 pm 1 am 7 am 1 pm 7 pm 1 am 7 am
8010
012
014
0
B: baseline w: width
FIGURE 4. Model parameters of a cosine and a surge function. (Top) The shape of a cosine model is determined by a set of parameters:
(M, A, , and �), where M is the mesor (daily average of rhythm), A is the amplitude of the cosine, is the acrophase (or time of peak), and �
is the period (herein fixed to a value of 24 h). (Bottom) The structure of a surge function is similar to that of a cosine, with the substitution of
the mesor by the baseline (initial value of rhythm, B), and the addition of another parameter: the width of the surge (w). A cosine model was
found to fit the periodic variations of RA, UA:C, UK, UK,fe, and BP well, whereeas circadian changes in UNa and UNa,fe were best characterized
by means of a surge function, reflecting an afternoon peak sodium excretion followed by a monotonous decay, rather than periodic
oscillations around the clock.
RAAS and Blood Pressure Chronobiology in Dogs 7
! Informa Healthcare USA, Inc.
Chr
onob
iol I
nt D
ownl
oade
d fr
om in
form
ahea
lthca
re.c
om b
y N
ovar
tis P
harm
a on
08/
09/1
3Fo
r pe
rson
al u
se o
nly.

Standard goodness-of-fit diagnostics and individual
predictions can be found in Figures 5 and 6.
Population parameter estimates, relative standard
errors (RSEs), and 90% confidence intervals (CIs) are
listed in Table 2. The precision of the final model
parameters was considered satisfactory (RSE530%).
Data from the various variables were fitted simultan-
eously, leveraging the richness of the plasma data (RA)
to derive the acrophase of the (more sparse) urinary
variables. The model estimated a 3-h delay between the
acrophase of RA and that of UA:C, UK, or UK,fe. The peak
UNa and UNa,fe was estimated to lie around 14:30 h.
Estimates from the model further indicate that UA:C
oscillated with a larger relative amplitude (ca. 58% of the
mesor) compared with RA, UK, and UK,fe (respectively
26%, 24%, and 21% of the mesor/baseline value).
CorrelationsStatistics confirmed the positive correlation between
the phase of UA:C and that of UK,fe (r¼ 0.3, p¼ 0.009).
The correlation between plasma renin activity and
the renal elimination of aldosterone was also supported
by the Pearson’s product moment correlation test
(r¼ 0.2, p¼ 0.03). Finally, a positive correlation was
found between the phase of UK,fe and that of UNa,fe
(r¼ 0.4, p50.001). Results are summarized in Table 3.
Influence of Population Characteristics on the Periodicityof RAAS-Related VariablesDietary sodium intake and sex were found to be
significant covariates to explain part of the between-
subject variability in RA, UA:C, and urinary electrolytes
(Table 4).
Results from the covariate analysis indicate that
sodium intake (which was proportional to the size of
the ration) had a significant effect on the mesor of UA:C
(p50.001), RA (p50.001), UK,fe (p50.001), the baseline
of UNa,fe (p50.001), and the amplitude of RA (p50.001)
and UNa,fe (p50.001). The effect of sodium intake on the
periodicity of RA is further illustrated in Figure 7, using
predictions from the population model. Specifically, the
mesor RA of a typical 13-kg healthy female dog fed
around 190 g of dry food per day (i.e., 34 mEq Na/24 h)
would be 140 pg/mL/h, with an amplitude of 27 pg/mL/
h. Increasing the portion size from 190 to 440 g (i.e., 80
mEq Na/24 h) per day would result in a decrease of both
3.5 4.0 4.5 5.0
12
34
56
7
Renin activity
Population prediction
Obs
erva
tion
(log)
1 2 3 4 5 6
12
34
56
7
Individual prediction
Obs
erva
tion
(log)
0 5 10 15 20
−2−1
01
2
Time (hours)
CW
RE
S
2.0 2.5 3.0 3.5 4.0 4.5
01
23
45
Urinary aldosterone:creatinine
Population predictionO
bser
vatio
n (lo
g)
0 1 2 3 4 5
01
23
45
Individual prediction
Obs
erva
tion
(log)
0 5 10 15 20
−2−1
01
Time (hours)
CW
RE
S
2.1 2.3 2.5 2.7
2.0
2.5
3.0
Potassium fractional excretion
Population prediction
Obs
erva
tion
(log)
2.0 2.2 2.4 2.6 2.8
2.0
2.5
3.0
Individual predictionO
bser
vatio
n (lo
g)
0 5 10 15 20
−3−2
−10
12
Time (hours)
CW
RE
S
−2.0 −1.5 −1.0 −0.5
−3.0
−2.0
−1.0
0.0
Sodium fractional excretion
Population prediction
Obs
erva
tion
(log)
−2.0 −1.5 −1.0 −0.5
−3.0
−2.0
−1.0
0.0
Individual prediction
Obs
erva
tion
(log)
0 5 10 15 20
−3−2
−10
12
Time (hours)C
WR
ES
4.4 4.6 4.8 5.0
4.0
4.5
5.0
Systolic & Diastolic BP
Population prediction
Obs
erva
tion
(log)
4.0 4.4 4.8 5.2
4.0
4.5
5.0
Individual prediction
Obs
erva
tion
(log)
0 5 10 15 20
−4−2
02
Time (hours)
CW
RE
S
FIGURE 5. Standard goodness-of-fit diagnostics. Scatter plot of population (top panel) and individual predictions (middle panel) vs.
observations (log scale), and conditional weighted residuals (bottom panel, CWRES) of population predictions. From left to right: RA, UA:C,
UK,fe, UNa,fe, and BP. Solid black line: identity line. Dashed green line: regression line. For CWRES, the x-axis represents time after food
ingestion (e.g., time 0 is 07:00 h). Because of the very good agreement between the fractional excretion and the urinary concentration of
electrolytes, only fractional excretions are represented herein. Note: Population predictions are estimates of the average (plasma, urinary)
concentration, enzyme activity, etc. An adequate model presents the following characteristics: (i) the line of identity is aligned with the
regression line (for both individual and population predictions), whereas (ii) the residues (differences between observations and
predictions) are centered on a mean value of 0, with (iii) an homogeneous dispersion around the mean.
8 J. P. Mochel et al.
Chronobiology International
Chr
onob
iol I
nt D
ownl
oade
d fr
om in
form
ahea
lthca
re.c
om b
y N
ovar
tis P
harm
a on
08/
09/1
3Fo
r pe
rson
al u
se o
nly.

the mesor (from 140 to 100 pg/mL/h) and the amplitude
(from 27 to 12.8 pg/mL/h) of RA oscillations.
Sex had a significant impact on the amplitude of RA
(p50.001), UK,fe (p50.01), and UNa,fe (p50.001). An
almost 5-fold difference in the amplitude of RA was
observed between male and female dogs (Figure 7).
Finally, body weight had limited influence on the
periodicity of the RAAS, with a statistically significant
effect on the amplitude of RA only (p¼ 0.01).
Study b: Periodicity of Blood Pressure in DogsDBP and SBP oscillated parallel to RA throughout
the observation span (Figure 8). Accordingly, DBP and
SBP were found to be highly correlated, as indicated by
the significance of the Pearson’s product moment
correlation test (r¼ 0.8, p50.001) (Table 3).
AUCs[07:00–19:00] were on average 6.5% and 7% smaller
than AUCs[19:00–07:00] for DBP (p¼ 0.007) and SBP
(p50.001), respectively. This corresponds to an average
nocturnal increase of 5 mm Hg for DBP and 9 mm Hg
for SBP. The p values derived from the Bartlett’s test
were greater than the chosen alpha level of 0.05,
indicating similar variances between day and night
AUCs for SBP and DBP.
Concurrently, the model fit of blood pressure data
led to the rejection of the hypothesis that SBP and DBP
measurements (p¼ 0.01) were constant over time
(Table 1). Similar to RA, a cosine model with a fixed
24-h period was found to describe the periodic nature of
DBP and SBP well, as shown by the quality of the
population and individual fits (Figures 5 and 6).
The selected structural model was the same as
indicated in Equation 2, but with f(tij) being the
predicted DBP or SBP value at time tij
Based on the drop in OFV between competing
models, the average phase of blood pressure measure-
ments was found to be statistically different from that
of plasma and urinary variables (p¼ 0.04, p¼ 0.002, and
p50.001 for RA, UA:C and UK,fe, and UNa,fe, respectively).
Noise in DBP and SBP measurements was modeled
using a proportional error term. Estimates of residual
errors (CV%) from the population models were 7%
and 10% for DBP and SBP, respectively. Based on the
results of the Shapiro-Wilk and Durbin-Watson tests,
the null hypothesis that the residuals were independent
and came from a normally distributed population could
not be rejected.
Body weight and dietary sodium were not found to
have an effect on BP model parameters. Population
parameter estimates, RSEs, and 90% CIs can be found
in Table 2. The precision of the final model parameters
appeared highly satisfactory (RSE520%).
0 5 10 15 20
12
34
56
Renin activity
Time (hours)
Obs
erva
tion,
Pre
dict
ion
(log)
0 5 10 15 20
23
45
67
Time (hours)
Obs
erva
tion,
Pre
dict
ion
(log)
0 5 10 15 20
23
45
67
Time (hours)
Obs
erva
tion,
Pre
dict
ion
(log)
0 5 10 15
01
23
45
6
Urinary aldosterone:creatinine
Time (hours)O
bser
vatio
n, P
redi
ctio
n (lo
g)
0 5 10 15
01
23
45
Time (hours)
Obs
erva
tion,
Pre
dict
ion
(log)
0 2 4 6 8 10 12
01
23
45
Time (hours)
Obs
erva
tion,
Pre
dict
ion
(log)
0 5 10 15
01
23
4
Potassium fractional excretion
Time (hours)
Obs
erva
tion,
Pre
dict
ion
(log)
0 5 10 15
01
23
4
Time (hours)O
bser
vatio
n, P
redi
ctio
n (lo
g)
0 5 10 15 20
01
23
4
Time (hours)
Obs
erva
tion,
Pre
dict
ion
(log)
4 6 8 10 12 14 16
−0.8
−0.4
0.0
0.4
Sodium fractional excretion
Time (hours)
Obs
erva
tion,
Pre
dict
ion
(log)
0 5 10 15 20
−0.
8−
0.4
0.0
0.4
Time (hours)
Obs
erva
tion,
Pre
dict
ion
(log)
0 2 4 6 8 10 12
−0.8
−0.4
0.0
0.4
Time (hours)O
bser
vatio
n, P
redi
ctio
n (lo
g)
0 5 10 15 20
4.0
4.2
4.4
4.6
4.8
5.0
Systolic blood pressure
Time (hours)
Obs
erva
tion,
Pre
dict
ion
(log)
0 5 10 15 20
4.0
4.2
4.4
4.6
4.8
5.0
Time (hours)
Obs
erva
tion,
Pre
dict
ion
(log)
0 5 10 15 20
4.6
4.8
5.0
5.2
5.4
Time (hours)
Obs
erva
tion,
Pre
dict
ion
(log)
FIGURE 6. Individual prediction time-course profiles based on individual parameter estimates (obtained as empirical Bayes estimates).
Scatter plot of observed (open circles, log scale) and predicted (continuous blue line) individual data vs. time after food (hour). Dashed line:
population predictions. Out of clarity only a subset of 3 individuals per variable are represented herein (ordered in columns). From left to
right: RA, UA:C, UK,fe, UNa,fe, and SBP.
RAAS and Blood Pressure Chronobiology in Dogs 9
! Informa Healthcare USA, Inc.
Chr
onob
iol I
nt D
ownl
oade
d fr
om in
form
ahea
lthca
re.c
om b
y N
ovar
tis P
harm
a on
08/
09/1
3Fo
r pe
rson
al u
se o
nly.
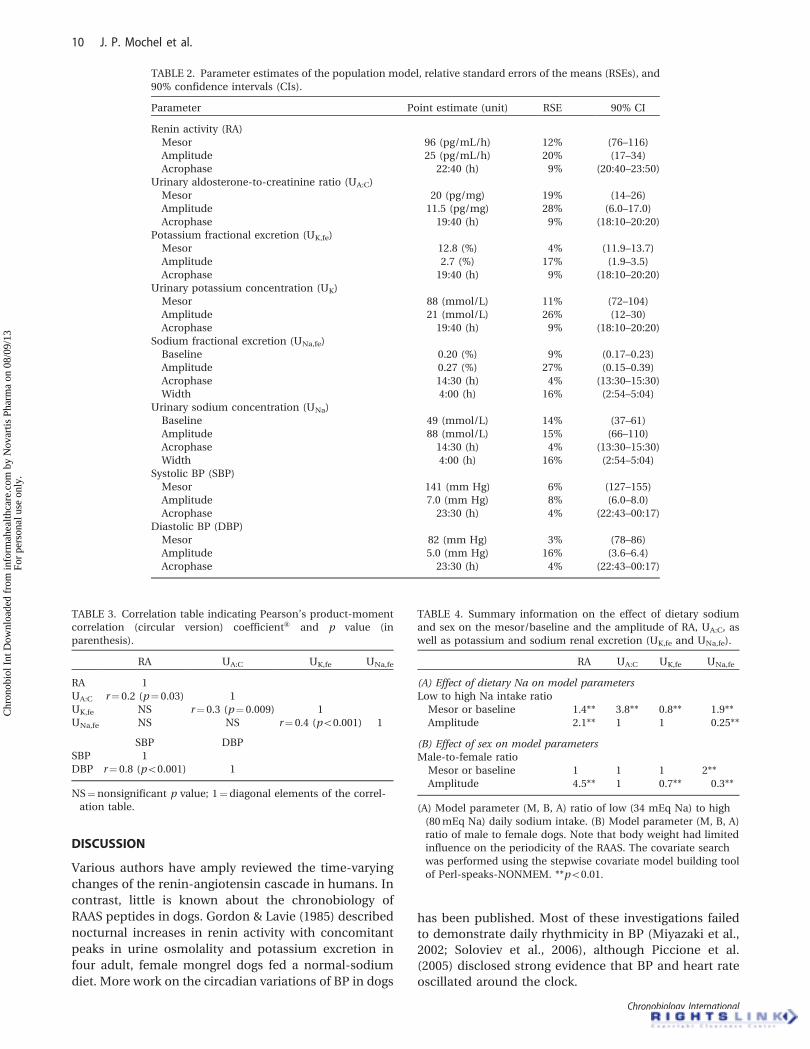
DISCUSSION
Various authors have amply reviewed the time-varying
changes of the renin-angiotensin cascade in humans. In
contrast, little is known about the chronobiology of
RAAS peptides in dogs. Gordon & Lavie (1985) described
nocturnal increases in renin activity with concomitant
peaks in urine osmolality and potassium excretion in
four adult, female mongrel dogs fed a normal-sodium
diet. More work on the circadian variations of BP in dogs
has been published. Most of these investigations failed
to demonstrate daily rhythmicity in BP (Miyazaki et al.,
2002; Soloviev et al., 2006), although Piccione et al.
(2005) disclosed strong evidence that BP and heart rate
oscillated around the clock.
TABLE 2. Parameter estimates of the population model, relative standard errors of the means (RSEs), and
90% confidence intervals (CIs).
Parameter Point estimate (unit) RSE 90% CI
Renin activity (RA)
Mesor 96 (pg/mL/h) 12% (76–116)
Amplitude 25 (pg/mL/h) 20% (17–34)
Acrophase 22:40 (h) 9% (20:40–23:50)
Urinary aldosterone-to-creatinine ratio (UA:C)
Mesor 20 (pg/mg) 19% (14–26)
Amplitude 11.5 (pg/mg) 28% (6.0–17.0)
Acrophase 19:40 (h) 9% (18:10–20:20)
Potassium fractional excretion (UK,fe)
Mesor 12.8 (%) 4% (11.9–13.7)
Amplitude 2.7 (%) 17% (1.9–3.5)
Acrophase 19:40 (h) 9% (18:10–20:20)
Urinary potassium concentration (UK)
Mesor 88 (mmol/L) 11% (72–104)
Amplitude 21 (mmol/L) 26% (12–30)
Acrophase 19:40 (h) 9% (18:10–20:20)
Sodium fractional excretion (UNa,fe)
Baseline 0.20 (%) 9% (0.17–0.23)
Amplitude 0.27 (%) 27% (0.15–0.39)
Acrophase 14:30 (h) 4% (13:30–15:30)
Width 4:00 (h) 16% (2:54–5:04)
Urinary sodium concentration (UNa)
Baseline 49 (mmol/L) 14% (37–61)
Amplitude 88 (mmol/L) 15% (66–110)
Acrophase 14:30 (h) 4% (13:30–15:30)
Width 4:00 (h) 16% (2:54–5:04)
Systolic BP (SBP)
Mesor 141 (mm Hg) 6% (127–155)
Amplitude 7.0 (mm Hg) 8% (6.0–8.0)
Acrophase 23:30 (h) 4% (22:43–00:17)
Diastolic BP (DBP)
Mesor 82 (mm Hg) 3% (78–86)
Amplitude 5.0 (mm Hg) 16% (3.6–6.4)
Acrophase 23:30 (h) 4% (22:43–00:17)
TABLE 3. Correlation table indicating Pearson’s product-moment
correlation (circular version) coefficient� and p value (in
parenthesis).
RA UA:C UK,fe UNa,fe
RA 1
UA:C r¼ 0.2 (p¼ 0.03) 1
UK,fe NS r¼ 0.3 (p¼ 0.009) 1
UNa,fe NS NS r¼ 0.4 (p50.001) 1
SBP DBP
SBP 1
DBP r¼ 0.8 (p50.001) 1
NS¼nonsignificant p value; 1¼diagonal elements of the correl-
ation table.
TABLE 4. Summary information on the effect of dietary sodium
and sex on the mesor/baseline and the amplitude of RA, UA:C, as
well as potassium and sodium renal excretion (UK,fe and UNa,fe).
RA UA:C UK,fe UNa,fe
(A) Effect of dietary Na on model parameters
Low to high Na intake ratio
Mesor or baseline 1.4** 3.8** 0.8** 1.9**
Amplitude 2.1** 1 1 0.25**
(B) Effect of sex on model parameters
Male-to-female ratio
Mesor or baseline 1 1 1 2**
Amplitude 4.5** 1 0.7** 0.3**
(A) Model parameter (M, B, A) ratio of low (34 mEq Na) to high
(80 mEq Na) daily sodium intake. (B) Model parameter (M, B, A)
ratio of male to female dogs. Note that body weight had limited
influence on the periodicity of the RAAS. The covariate search
was performed using the stepwise covariate model building tool
of Perl-speaks-NONMEM. **p50.01.
10 J. P. Mochel et al.
Chronobiology International
Chr
onob
iol I
nt D
ownl
oade
d fr
om in
form
ahea
lthca
re.c
om b
y N
ovar
tis P
harm
a on
08/
09/1
3Fo
r pe
rson
al u
se o
nly.

The present studies offer a comprehensive charac-
terization of the chronobiology of the renin cascade in
dogs in relation to BP and renal sodium-potassium
exchanges, using a nonlinear mixed-effects modeling
approach. The core value of population modeling lies in
its ability to separate the (between- and within-subject)
variability from the measurement error (noise), in order
to determine population characteristics (i.e., covariates)
that are able to explain the sources of variation between
individuals.
Telemetry recordings were performed in a distinct
cohort of animals to preclude manipulation-related
disturbances, such as venipuncture, on BP. Extensive
literature has demonstrated the influence of environ-
mental factors (e.g., noise, stress) on BP in humans
(Attarchi et al., 2012; Baumgart, 1991; Lindquist et al.,
1997; Rocha et al., 2002). The relation of stress to
elevated heart rate and BP in dogs is well known, as
most recently confirmed by Hoglund et al. (2012). In this
observational study, both SBP and DBP increased
when owners left dogs in the examination room while
recordings were made by the veterinarian alone.
The RAAS and Urinary Electrolytes Exhibit a ClearCircadian Periodicity in DogsOur data document a clear circadian rhythmicity of RA,
UA:C, UNa, UNa,fe, UK, and UK,fe in trained and relaxed
healthy dogs, under standardized conditions. Our
results are consistent with previous investigations
in dogs (Corea et al., 1996), horses (Clarke et al., 1978,
1988), and humans (Cugini et al., 1981, 1985), which
underlines the similarity of blood fluid homeostasis
between mammalian species. The endogenous clear-
ance of creatinine, used as estimate of the GFR, showed
no periodic rhythmicity, which is consistent with other
publications in dogs (e.g., Uechi et al., 1994).
In accordance with the usual feeding pattern in
domesticated dogs, the animals in these studies were
fed once daily at 07:00 h. The effect of feeding time
on the periodicity of the renin cascade remains unclear,
as illustrated by the conflicting results between Kunita
et al. (1976) and Ikonomov et al. (1981). Kunita et al.
have reported significant differences in the periodicity
of renin and aldosterone when meals were taken at
night instead of the usual times of the day in five
healthy volunteers. These results dispute data from
Ikonomov et al. showing that diurnal changes in food
intake do not affect the rhythmicity of renin and sodium
excretion. Investigations in horses (Clarke et al., 1978,
1988) and sheep (Blair-West & Brook, 1969) have led
to the conclusion that episodic feeding caused substan-
tial variations of the RAAS, as opposed to continuous
feeding. To the authors’ knowledge, no information is
currently available in dogs.
Time (hours)
Pre
dict
ed r
enin
act
ivity
(pg
/mL/
h)
7 am 1 pm 7 pm 1 am 7 am
4060
8010
012
014
0
Male dog
Time (hours)
Pre
dict
ed r
enin
act
ivity
(pg
/mL/
h)
7 am 1 pm 7 pm 1 am 7 am
4060
8010
012
014
0
Female dog
Time (hours)
Pre
dict
ed r
enin
act
ivity
(pg
/mL/
h)
7 am 1 pm 7 pm 1 am 7 am
6010
014
018
0 Dietary Na: 34mEq Na
Time (hours)
Pre
dict
ed r
enin
act
ivity
(pg
/mL/
h)
7 am 1 pm 7 pm 1 am 7 am
6010
014
018
0 Dietary Na: 53mEq Na
Time (hours)
Pre
dict
ed r
enin
act
ivity
(pg
/mL/
h)
7 am 1 pm 7 pm 1 am 7 am
6010
014
018
0 Dietary Na: 80mEq Na
FIGURE 7. Effect of sex and dietary sodium on the periodicity of renin activity in dogs. Predictions based on the covariate analysis.
(Top) Renin activity (pg/mL/h) predictions from the population model for a male (left panel) and a female (right panel) dog with similar
daily sodium intake (80 mEq Na), and similar body weight (13 kg). (Bottom) Renin activity (pg/mL/h) predictions from the population
model in a 13-kg female dog fed a normal-sodium diet of increasing size, with daily sodium intake ranging from 34 to 80 mEq Na. As
also shown in Table 4, results of the covariate analysis indicate that sex has a significant effect on the amplitude of RA, whereas sodium
intake also has an influence on the mesor of RA oscillations (i.e., the greater the amount of dietary sodium, the smaller the mesor and
the amplitude of RA).
RAAS and Blood Pressure Chronobiology in Dogs 11
! Informa Healthcare USA, Inc.
Chr
onob
iol I
nt D
ownl
oade
d fr
om in
form
ahea
lthca
re.c
om b
y N
ovar
tis P
harm
a on
08/
09/1
3Fo
r pe
rson
al u
se o
nly.

A cosine model with a fixed 24-h period was found to
fit the periodic variations of RA, UA:C, UK, and UK,fe well,
as suggested by the quality of the standard goodness-
of-fit diagnostics and the individual predictions.
In contrast, circadian changes in UNa and UNa,fe were
best characterized by means of a surge model, as
described by Nagaraja et al. (2003), reflecting an after-
noon peak sodium excretion followed by a monotonous
decay, rather than periodic oscillations around the
clock.
RA and UA:C measurements were low in the morning,
rose through the afternoon, and peaked in the evening.
The morning decrease in RA is assumed to be related
to body fluid volume expansion secondary to water and
sodium intake, referred to as ‘‘postprandial decrease
of RA’’ in previous publications (Kaczmarczyk et al.,
1980; Seeliger et al., 1999). The similitude of RA and UA:C
signals, supported by the Pearson’s product moment
correlation test, reflects aldosterone-stimulated secre-
tion by the renin-angiotensin II pathway.
In contrast, UNa and UNa,fe were high from morning
to the middle of the afternoon, and peaked around
15:00 h. This phenomenon has been termed ‘‘impulse-
response pattern’’ of sodium excretion (Boemke et al.,
1995), and is characterized by a peak urinary elimination
4–8 h after meal ingestion. During the evening and night,
UNa was maintained on very low levels. The decrease
in UNa,fe, together with constant GFR, suggests that
tubular, rather than glomerular, events were primarily
involved in the reduced elimination of sodium during
night hours. This assumption is supported by the
concomitant activation of known sodium-conserving
mediators (i.e., UA:C) acting on the kidney tubules.
Variations in UK and UK,fe mirror aldosterone-
mediated excretion of potassium in the distal tubules.
Tubular transport is indeed the main modality of
potassium exchange in the kidneys, whereas sodium
reabsorption also occurs in the proximal kidney tubules,
independently of aldosterone. This divergence is further
supported by the positive correlation between UA:C
and UK,fe, and the nonsignificant correlation between
UA:C and UNa,fe.
Dietary Sodium Influences the Tonic and thePhasic Secretion of ReninThe relation of elevated RA levels to increased renin
secretion has been established by Schricker et al. (1994).
Specialized cells of the MD act as a sensing device
monitoring changes in sodium chloride concentrations,
so that granular cells of the JGA can adjust their net
Time (hours)
Sys
tolic
blo
od p
ress
ure
(mm
Hg)
7 am 1 pm 7 pm 1 am 7 am
120
130
140
150
160
Darkness
Time (hours)
Dia
stol
ic b
lood
pre
ssur
e (m
mH
g)
7 am 1 pm 7 pm 1 am 7 am
7080
9010
0
Darkness
AUC (Day) AUC (Night)
Sys
tolic
blo
od p
ress
ure
(mm
Hg)
1200
1400
1600
1800
2000
**
AUC (Day) AUC (Night)
Dia
stol
ic b
lood
pre
ssur
e (m
mH
g)
600
700
800
900
1100
1300
**
FIGURE 8. 24-Hour time-course profiles of systolic and diastolic blood pressures in dogs. (Top) Geometric mean systolic (left panel) and
diastolic (mm Hg) (right panel) blood pressures in dogs fed a normal-sodium diet (0.5% sodium) at 07:00 h (n¼ 6). Vertical bars indicate 1
standard error of the geometric mean. SBP and DBP oscillated parallel to RA over the observation span. Blood pressure increased in the first
half of the night, before returning to baseline in the early morning. (Bottom) Area under the curve of day (AUCs[07:00–19:00]) vs. night
(AUCs[19:00–07:00]) systolic (left panel) and diastolic (right panel) blood pressures in dogs fed a normal-sodium diet (0.5% sodium) at 07:00 h
(n¼ 6). Vertical bars indicate 1 standard error of the geometric mean. Significant differences are indicated by double asterisks (**).
AUCs[07:00–19:00] were on average 7% and 6.5% smaller than AUCs[19:00–07:00] for SBP (p50.001) and DBP (p¼ 0.007), respectively.
12 J. P. Mochel et al.
Chronobiology International
Chr
onob
iol I
nt D
ownl
oade
d fr
om in
form
ahea
lthca
re.c
om b
y N
ovar
tis P
harm
a on
08/
09/1
3Fo
r pe
rson
al u
se o
nly.

secretion of renin to maintain an appropriate RA
level (Laragh & Sealey, 2011). Herein, results from the
covariate analysis show that dietary sodium interacts
with the renin cascade, not only by influencing the
tonic (i.e., mesor), but also the phasic (i.e., amplitude)
secretion of renin (i.e., the greater the amount of
sodium intake, the smaller the mesor and the ampli-
tude of RA). Note that sex was also found to
be a significant source of variability, with a 4.5-fold
-difference between the amplitude of male and female
dogs.
The urinary aldosterone-to-creatinine ratio has been
validated as a reproducible measure of 24-h urinary
aldosterone excretion in dogs (Gardner et al., 2007). UA:C
reflects aldosterone production over several to many
hours, eliminating minute-to-minute variation, as
seen with plasma aldosterone concentrations. From
the covariate analysis, sodium intake had a significant
effect on the mesor, but not on the amplitude of UA:C
oscillations, indicating that dietary sodium influences
the tonic, but possibly not the phasic, secretion of
aldosterone. This should, however, be interpreted with
caution given the relatively small changes in dietary
sodium investigated in our experiment.
Blood Pressure and Renin Activity Display SimilarFluctuations Around the ClockThe levels of DBP and SBP observed in this experiment
were in agreement with previous investigations in dogs
(Mishina & Watanabe, 2008; Miyazaki et al., 2002), and
reference values reported in humans (Baumgart, 1991).
Further, the high level of correlation between DBP and
SBP was in the same order of magnitude as reported by
Gavish et al. (2008) in ambulatory patients.
Circadian variations in DBP and SBP, albeit small
(5 and 9 mm Hg, respectively), were statistically signifi-
cant and supported by the model-based analysis.
Blood pressure increased during the first half of the
night, before returning to baseline in the early morning,
thereby showing similar fluctuations to RA around the
clock. Renin has been shown to play a pivotal role in BP
regulation. In a study by Passo et al. (1971), increases in
renin secretion were associated with a substantial rise
in BP in 16 dogs. The main contribution of the RAAS
to BP regulation is mediated by the sodium-retaining
effects of aldosterone, and the powerful vasoconstrictor
effect of angiotensin II. The role of RAAS activation
in the development of hypertension in dogs has been
elucidated in a renal failure model by Mishina &
Watanabe (2008). In their study, RA, angiotensin II,
and aldosterone were significantly elevated in associ-
ation with a noticeable increase in BP, indicating that
the RAAS was involved in the development of nephron
loss-associated hypertension.
The nocturnal increase in BP observed in our experi-
ment supports earlier findings from Piccione et al.
(2005) in 10 healthy beagle dogs. These results are in
contradiction with investigations in human healthy
volunteers, where lower BP levels have been reported
during periods of darkness allocated to sleeping
(Fernandez et al., 2009). In humans, Smyth et al.
(1969) have shown that sleep is characterized by signs
of parasympathetic predominance, with a noticeable
reduction of heart rate and BP. According to Trinder
et al. (2001), sleep displays a strong ultradian rhythm
characterized by the regular occurrence of two funda-
mental states, alternating with a ca. 100-min period: the
non-rapid (NREM) and the rapid (REM) eye movement
sleep. NREM is associated with low BP and bradycardia,
whereas REM is characterized by a substantial increase
in heart rate and BP. Later investigations from Murali
et al. (2003) have shown that sympathetic activity was
increased to levels above awaking values during REM
sleep.
Although dogs have a natural tendency to be crepus-
cular, they can easily become diurnal through human
interactions. In essence, domesticated dogs are mainly
active during the day, while sleeping at night. Similar
to humans, REM sleep has been described in dogs
(Hendricks & Morrison, 1981; Hendricks et al., 1989).
In theory, nocturnal increases of BP could be a sign
of REM predominance in this species. Differences in
posture (dogs were monitored whilst freely moving
allowing for different body positions, and not main-
tained recumbent as in human studies), may also
explain part of the observed difference in BP dynamics
(Muller et al., 1958). In addition, the activation of
sodium-conserving mechanisms (i.e., elevated UA:C)
may have been a prerequisite to increase the levels of
SBP and DBP at night.
It has been argued that increased sodium excretion is
preceded by an elevation of BP (Coleman & Guyton,
1969; Hall et al., 1980). This mechanism, referred to as
‘‘pressure natriuresis,’’ would represent a powerful
means of stabilizing BP via reduction of the extracellular
fluid volume (Hall, 1986). Herein, an elevation of
UNa and UNa,fe during daytime has been reported in
the absence of increasing BP. Likewise, a reduction of
sodium elimination was observed at night in spite of an
increase in BP. These observations are entirely consist-
ent with those of other studies in dogs (Andersen et al.,
2000; Bie & Sandgaard, 2000; Sandgaard et al., 2000),
indicating that the RAAS controls sodium homeostasis
even when opposing changes in BP occur. According to
Bie & Damkjaer (2010), in order for the pressure
natriuresis mechanism to be involved, BP must change
in response to varying sodium intake. This has not been
reported in intact animals (Kjolby et al., 2005, 2008),
as shown by the nonsignificant effect of dietary sodium
on BP in our experiment.
Body weight and sodium intake were not found to
have an effect on BP model parameters. However,
the effect of sex on the chronobiology of BP could not
be assessed in Study b, since only male dogs were
included in the experiment.
RAAS and Blood Pressure Chronobiology in Dogs 13
! Informa Healthcare USA, Inc.
Chr
onob
iol I
nt D
ownl
oade
d fr
om in
form
ahea
lthca
re.c
om b
y N
ovar
tis P
harm
a on
08/
09/1
3Fo
r pe
rson
al u
se o
nly.

Tuning in to the Body’s Rhythms to Adapt DrugDosing SchedulesDeeper understanding of circadian rhythms can have a
substantial impact on the therapeutic management of
RAAS-related diseases by determining the time of drug
administration that would optimize efficacy while
minimizing the occurrence of adverse effects. This
concept, referred to as chronotherapy, is currently
being used for the treatment of human rheumatoid
arthritis (Staessen et al., 1992), lung cancer (Mazzoccoli
et al., 2012), and cardiovascular diseases (Nicholls et al.,
1993). An increasing number of investigations on the use
of angiotensin-converting enzyme inhibitors (ACEIs) in
hypertension have shown a greater reduction of BP with
bedtime administration as compared with morning
dosing (Hermida & Ayala, 2009; Palatini et al., 1993).
Sole & Martino (2009) have demonstrated that heart and
vessel growth and remodeling were dynamic and
occurred more actively during the period normally
allocated to sleep. In mice, administrations of the
ACEI captopril at sleeping hours significantly improved
cardiovascular function and reduced adverse remodel-
ing, whereas no effects were reported when the drug was
given during active hours of the day (Martino et al.,
2011). In a study by Nozawa et al. (2006), temocapril
(another ACEI) prolonged the survival of spontaneously
hypertensive rats, with a maximum effect after dosing
during the resting period, and a minimum effect after
dosing at the active period. The authors concluded that
treatment with an ACEI at night may be a more effective
dosing regimen in patients with hypertension.
Another therapeutic approach in the management of
heart failure and hypertension is to continuously assess
not only the medical response, but also the development
of adverse effects. The optimal treatment time can vary
considerably between patients, as shown by the recent
work of Watanabe et al. (2013) in hypertensive patients
under losartan/hydrochlorothiazide (L/H) (angiotensin
II receptor blocker/thiazide diuretics) combination
therapy. In their study, L/H taken few hours before
bedtime in a 61-yr-old man induced circadian hyper-
amplitude tension (CHAT), a condition associated with
an increased cardiovascular disease risk. For yet another
patient, CHAT was exacerbated when L/H was given
during the day, but was alleviated when the same dose
of treatment was taken in the evening. In all instances,
optimization of therapy based on the most appropriate
time of drug administration should be investigated on
an individual basis (Cornelissen & Halberg, 2009).
SUMMARY AND PERSPECTIVES
This research offers the first chronobiological charac-
terization of the RAAS in relation to BP and renal
sodium-potassium handling in dogs. Our data demon-
strate that BP oscillates in parallel to the RAAS, which is
coherent with existing publications in dogs, but reflects
a clear (and not elucidated) difference from humans.
Cosine and surge models were able to describe and
predict the time-variant changes of the experimental
data with high accuracy, as shown by the quality of the
standard goodness-of-fit diagnostics.
The use of nonlinear mixed-effects allowed borrow-
ing information from the densely sampled plasma
values (RA) to improve knowledge on the time variations
of the urinary variables. The model-based approach
provided insights into the relation of dietary sodium,
sex, and body weight to renin and aldosterone secretion,
which would have been impossible using standard
statistical approaches. Specifically, sodium intake
appears to be an important determinant of RA chrono-
biology, and we are currently investigating the influence
of varying feeding time on the chronobiology of the
RAAS. This would support earlier findings from Itoh
et al. (1996) who showed that the effect of dietary
sodium on BP depends on the circadian timing of its
intake in humans.
Recent experiments in human patients have pointed
out the importance of administration time-dependent
effects of treatment in the management of RAAS-related
diseases. These results suggest that additional investi-
gations on the chronobiology of the RAAS and BP are
required in diseased dogs under ACEI to determine
whether it is possible to improve drug therapy of heart
failure or hypertension by selecting the appropriate time
of treatment.
ACKNOWLEDGMENTS
The investigations on RAAS periodicity were con-ducted at the Centre de Recherche Sante AnimaleSA (CRA) of Novartis Animal Health, located inSaint-Aubin, Switzerland. The telemetry study wasperformed at Novartis Institutes of BiomedicalResearch, Novartis Pharma AG, Basel, Switzerland.
DECLARATION OF INTEREST
With the exception of Pr. Meindert Danhof, theauthors of this paper are Novartis employees. Theexperiments were supported by Novartis AnimalHealth, Basel, Switzerland.
The authors report no conflicts of interest. Theauthors alone are responsible for the content andwriting of the paper.
REFERENCES
Allikmets K. (2007). Aliskiren—an orally active renin inhibitor.
review of pharmacology, pharmacodynamics, kinetics, and
clinical potential in the treatment of hypertension. Vasc
Health Risk Manag, 3, 809–15.
Andersen JL, Andersen LJ, Sandgaard NC, Bie P. (2000). Volume
expansion natriuresis during servo control of systemic blood
pressure in conscious dogs. Am J Physiol Regul Intergr Comp
Physiol, 278, R19–27.
14 J. P. Mochel et al.
Chronobiology International
Chr
onob
iol I
nt D
ownl
oade
d fr
om in
form
ahea
lthca
re.c
om b
y N
ovar
tis P
harm
a on
08/
09/1
3Fo
r pe
rson
al u
se o
nly.

Attarchi M, Dehghan F, Safakhah F, et al. (2012). Effect of exposure
to occupational noise and shift working on blood pressure
in rubber manufacturing company workers. Ind Health, 50,
205–13.
Baumgart P. (1991). Circadian rhythm of blood pressure: Internal
and external time triggers. Chronobiol Int, 8, 444–50.
Bie P, Damkjaer M. (2010). Renin secretion and total body sodium:
Pathways of integrative control. Clin Exp Pharmacol Physiol, 37,
e34–42.
Bie P, Sandgaard NC. (2000). Determinants of the natriuresis after
acute, slowsodium loading in conscious dogs. Am J Physiol
Regul Intergr Comp Physiol, 278, R1–10.
Blair-West JR, Brook AH. (1969). Circulatory changes and renin
secretion in sheep in response to feeding. J Physiol, 204, 15–30.
Brandenberger G, Follenius M, Goichot B, et al. (1994).
Twenty-four-hour profiles of plasma renin activity in relation
to the sleep-wake cycle. J Hypertens, 12, 277–83.
Brandenberger G, Follenius M, Muzet A, et al. (1985). Ultradian
oscillations in plasma renin activity: Their relationships to
meals and sleep stages. J Clin Endocrinol Metab, 61, 280–4.
Clarke LL, Ganjam VK, Fichtenbaum B, et al. (1988). Effect of
feeding on renin-angiotensin-aldosterone system of the horse.
Am J Physiol, 254, R524–30.
Clarke LL, Moore J, Garner H. (1978). Diurnal variations of plasma
aldosterone in horses: Dependence on feeding schedule
[abstract]. Physiologist 21, 21.
Coleman TG, Guyton AC. (1969). Hypertension caused by salt
loading in the dog. Onset transients of cardiac output and other
circulatory variables. Circ Res, 25, 153–60.
Corea M, Seeliger E, Boemke W, Reinhardt HW. (1996).
Diurnal pattern of sodium excretion in dogs with and without
chronically reduced renal perfusion pressure. Kidney Blood
Press Res, 19, 16–23.
Cornelissen G, Halberg F. (2009). Treatment with open eyes:
Markers-guided chronotheranostics. In Youan BC (ed.).
Chronopharmaceutics: science and technology for biological
rhythm-guided therapy and prevention of diseases. Hoboken,
NJ: Wiley, pp. 257–323.
Cugini P, Scavo D, Cornelissen G, et al. (1981). Circadian rhythms
of plasma renin, aldosterone and cortisol on habitual and low
dietary sodium intake. Horm Res, 15, 7–27.
Cugini P, Centanni M, Lucia P, et al. (1984). Parametric methods
applied to the standardization of gestational reference intervals
for blood renin activity, aldosterone and cortisol using the
transversal and longitudinal approach. Quad Sclavo Diagn, 20,
245–57.
Cugini P, Murano G, Lucia P, et al. (1985). Circadian rhythms
of plasma renin activity and aldosterone: Changes related to
age, sex, recumbency and sodium restriction. Chronobiologic
specification for reference values. Chronobiol Int, 2, 267–76.
Cugini P, Halberg F, Lucia P, et al. (1986). Role of the macula densa
and beta-adrenergic system in the control of the circadian
rhythm of renin and aldosterone. Recenti Prog Med, 77, 570–2.
Cugini P, Murano G, Lucia P, et al. (1987). Effects of a mild and
prolonged restriction in sodium or food intake on the circadian
rhythm of aldosterone and related variables. Chronobiol Int, 4,
245–50.
Fernandez JR, Hermida RC, Mojon A. (2009). Chronobiological
analysis techniques. Application to blood pressure. Philos Trans
A Math Phys Eng Sci, 28;367, 431–45.
Gardner SY, Atkins CE, Rausch WP, et al. (2007). Estimation of 24-h
aldosterone secretion in the dog using the urine aldosterone:
Creatinine ratio. J Vet Cardiol, 9, 1–7.
Gavish B, Ben-Dov IZ, Bursztyn M. (2008). Linear relationship
between systolic and diastolic blood pressure monitored over
24 h: Assessment and correlates. J Hypertens, 26, 199–209.
Gordon CR, Lavie P. (1985). Day-night variations in urine excre-
tions and hormones in dogs: Role of autonomic innervation.
Physiol Behav, 35, 175–81.
Guglielmini C. (2003). Cardiovascular diseases in the ageing dog:
Diagnostic and therapeutic problems. Vet Res Commun, 27,
555–60.
Guignard JP, Drukker A. (1999). Why do newborn infants have a
high plasma creatinine? Pediatrics, 103, e49.
Hall JE. (1986). Control of sodium excretion by angiotensin II:
Intrarenal mechanism and blood pressure regulation. Am J
Physiol, 250, R960–72.
Hall JE, Guyton AC, Smith Jr MJ, Coleman TG. (1980). Blood
pressure and renal function during chronic changes in sodium
intake: Role of angiotensin. Am J Physiol, 239, F271–80.
Hendricks JC, Morrison AR. (1981). Normal and abnormal sleep in
mammals. J Am Vet Med Assoc, 178, 121–6.
Hendricks JC, Lager A, O’Brien D, Morrison AR. (1989). Movement
disorders during sleep in cats and dogs. J Am Vet Med Assoc,
194, 686–9.
Hermida RC, Ayala DE. (2009). Chronotherapy with the angioten-
sin-converting enzyme inhibitor ramipril in essential hyperten-
sion: Improved blood pressure control with bedtime dosing.
Hypertension 54, 40–6.
Hoglund K, Hanas S, Carnabuci C, et al. (2012). Blood pressure,
heart rate, and urinary catecholamines in healthy dogs
subjected to different clinical settings. J Vet Intern Med, 26,
1300–8.
Ikonomov O, Stoynev AG, Shisheva A, Tarkolev N. (1981).
Circadian rhythms of plasma renin activity and the plasma
concentration of aldosterone and insulin in the rat: Effect
of renal denervation and food restriction. Agressologie 22,
247–53.
Itoh K, Kawasaki T, Cugini P. (1996). Effects of timing of salt
intake to 24-hour blood pressure and its circadian rhythm.
Ann N Y Acad Sci, 783, 324–5.
Kaczmarczyk G, Echt M, Mohnhaupt R, et al. (1980). Postprandial
volume regulation and renin-angiotensin system in conscious
dogs. Adv Physiol Sci, 11, 611–20.
Kawasaki T, Cugini P, Uezono K, et al. (1990). Circadian variations
of total renin, active renin, plasma renin activity and plasma
aldosterone in clinically healthy young subjects. Horm Metab
Res, 22, 636–639.
Kjolby MJ, Kompanowska-Jezierska E, Wamberg S, Bie P. (2005).
Effects of sodium intake on plasma potassium and renin
angiotensin aldosterone system in conscious dogs. Acta
Physiol Scand, 184, 225–34.
Kjolby M, Bie P. (2008). Chronic activation of plasma renin is log-
linearly related to dietary sodium and eliminates natriuresis in
response to a pulse change in total body sodium. Am J Physiol
Regul Intergr Comp Physiol, 294, R17–25.
Kunita H, Obara T, Komatsu T, et al. (1976). The effects of dietary
sodium on the diurnal activity of the renin-angiotensin-
aldosterone system and the excretion of urinary electrolytes.
J Clin Endocrinol Metab, 43, 756–9.
Laragh JH, Sealey JE. (2011). The plasma renin test reveals the
contribution of body sodium-volume content (V) and renin-
angiotensin (R) vasoconstriction to long-term blood pressure.
Am J Hypertens, 24, 1164–80.
Lefebvre HP, Dossin O, Trumel C, Braun JP. (2008). Fractional
excretion tests: A critical review of methods and applications
in domestic animals. Vet Clin Pathol, 37, 4–20.
Lindquist TL, Beilin LJ, Knuiman MW. (1997). Influence of lifestyle,
coping, and job stress on blood pressure in men and women.
Hypertension 29, 1–7.
Martino TA, Tata N, Simpson JA, et al. (2011). The primary
benefits of angiotensin-converting enzyme inhibition on car-
diac remodeling occur during sleep time in murine pressure
overload hypertrophy. J Am Coll Cardiol, 57, 2020–8.
Mazzoccoli G, Sothern RB, Parrella P, et al. (2012). Comparison
of circadian characteristics for cytotoxic lymphocyte subsets
in non-small cell lung cancer patients versus controls. Clin Exp
Med, 12, 181–94.
RAAS and Blood Pressure Chronobiology in Dogs 15
! Informa Healthcare USA, Inc.
Chr
onob
iol I
nt D
ownl
oade
d fr
om in
form
ahea
lthca
re.c
om b
y N
ovar
tis P
harm
a on
08/
09/1
3Fo
r pe
rson
al u
se o
nly.

Mishina M, Watanabe T. (2008). Development of hypertension and
effects of benazepril hydrochloride in a canine remnant kidney
model of chronic renal failure. J Vet Med Sci, 70, 455–60.
Miyazaki H, Yoshida M, Samura K, et al. (2002). Ranges of diurnal
variation and the pattern of body temperature, blood pressure
and heart rate in laboratory beagle dogs. Exp Anim, 51, 95–8.
Morton DB, Hawkins P, Bevan R, et al. (2003). Refinements in
telemetry procedures. Seventh report of the BVAAWF/FRAME/
RSPCA/UFAW Joint Working Group on Refinement, Part A.
Lab Anim, 37, 261–99.
Muller AF, Manning EL, Riondel AM. (1958). Influence of position
and activity on the secretion of aldosterone. Lancet 1, 711–13.
Murali NS, Svatikova A, Somers VK. (2003). Cardiovascular physi-
ology and sleep. Front Biosci, 8, s636–52.
Nagaraja NV, Pechstein B, Erb K, et al. (2003). Pharmacokinetic/
pharmacodynamic modeling of luteinizing hormone (LH)
suppression and LH surge delay by cetrorelix after single and
multiple doses in healthy premenopausal women. J Clin
Pharmacol, 43, 243–51.
Nicholls MG, Richards AM, Crozier IG, et al. (1993). Cardiac
natriuretic peptides in heart failure. Ann Med, 25, 503–5.
Nozawa M, Sugimoto K, Ohmori M, et al. (2006). Dosing time-
dependent effect of temocapril on the mortality of stroke-prone
spontaneously hypertensive rats. J Pharmacol Exp Ther, 316,
176–81.
O’Connell JMB, Romeo JA, Mudge GH. (1962). Renal tubular
secretion of creatinine in the dog. Am J Physiol, 203, 985–90.
Ohmori M, Fujimura A. (2005). ACE inhibitors and chronotherapy.
Clin Exp Hypertens, 27, 179–85.
Palatini P, Mos L, Motolese M, et al. (1993). Effect of evening versus
morning benazepril on 24-hour blood pressure: A comparative
study with continuous intraarterial monitoring. Int J Clin
Pharmacol Ther Toxicol, 31, 295–300.
Passo SS, Assaykeen TA, Otsuka K, et al. (1971). Effect of
stimulation of the medulla oblongata on renin secretion in
dogs. Neuroendocrinology, 7, 1–10.
Pedersen HD, Koch J, Poulsen K, et al. (1995). Activation of the
renin-angiotensin system in dogs with asymptomatic and
mildly symptomatic mitral valvular insufficiency. J Vet Intern
Med, 9, 328–31.
Piccione G, Caola G, Refinetti R. (2005). Daily rhythms of blood
pressure, heart rate, and body temperature in fed and fasted
male dogs. J Vet Med A Physiol Pathol Clin Med, 52, 377–81.
Portaluppi F, Smolensky MH, Touitou Y. (2010). Ethics and
methods for biological rhythm research on animals and
human beings. Chronobiol Int, 27, 1911–29.
Reinhardt HW, Seeliger E, Lohmann K, et al. (1996). Changes of
blood pressure, sodium excretion and sodium balance due to
variations of the renin-angiotensin-aldosterone system. J Auton
Nerv Syst, 57, 184–7.
Rocha R, Porto M, Morelli MY, et al. (2002). Effect of environmental
stress on blood pressure during the work shift. Rev Saude
Publica, 36, 568–75.
Roche BM, Schwartz D, Lehnhard RA, et al. (2002). Changes in
concentrations of neuroendocrine hormones and catechol-
amines in dogs with myocardial failure induced by rapid
ventricular pacing. Am J Vet Res, 63, 1413–17.
Sandgaard NC, Andersen JL, Bie P. (2000). Hormonal regulation of
renal sodium and water excretion during normotensive sodium
loading in conscious dogs. Am J Physiol Regul Intergr Comp
Physiol, 278, R11–18.
Sayer MB, Atkins CE, Fujii Y, et al. (2009). Acute effect
of pimobendan and furosemide on the circulating renin-
angiotensin-aldosterone system in healthy dogs. J Vet Intern
Med, 23, 1003–6.
Schricker K, Holmer S, Hamann M, et al. (1994). Interrelation
between renin mRNA levels, renin secretion, and blood pres-
sure in two-kidney, one clip rats. Hypertension, 24, 157–62.
Seeliger E, Lohmann K, Nafz B, et al. (1999). Pressure-dependent
renin release: Effects of sodium intake and changes of total
body sodium. Am J Physiol, 277, R548–55.
Sheiner LB, Ludden TM. (1992). Population pharmacokinetics/
dynamics. Annu Rev Pharmacol Toxicol, 32, 185–209.
Smolensky MH, Haus E. (2001). Circadian rhythms and clinical
medicine with applications to hypertension. Am J Hypertens,
14, 280S–90S.
Smyth HS, Sleight P, Pickering GW. (1969). Reflex regulation of
arterial pressure during sleep in man. A quantitative method
of assessing baroreflex sensitivity. Circ Res, 24, 109–21.
Sole MJ, Martino TA. (2009). Diurnal physiology: Core principles
with application to the pathogenesis, diagnosis, prevention,
and treatment of myocardial hypertrophy and failure. J Appl
Physiol, 107, 1318–27.
Soloviev MV, Hamlin RL, Shellhammer LJ, et al. (2006). Variations
in hemodynamic parameters and ECG in healthy, conscious,
freely moving telemetrized beagle dogs. Cardiovasc Toxicol, 6,
51–62.
Spies CM, Cutolo M, Straub RH, et al. (2011). Prednisone chrono-
therapy. Clin Exp Rheumatol, 29, S42–5.
Staessen J, Guo C, De Cort P, et al. (1992). Mean and range of the
ambulatory pressure in normotensive subjects. Chin Med J
(Engl), 105, 328–33.
Thurau K. (1966). Influence of sodium concentration at macula
densa cells on tubular sodium load. Ann N Y Acad Sci, 139,
388–99.
Trinder J, Kleiman J, Carrington M, et al. (2001). Autonomic activity
during human sleep as a function of time and sleep stage.
J Sleep Res, 10, 253–64.
Turnbull F. (2003). Blood Pressure Lowering Treatment Trialists’
Collaboration. Effects of different blood-pressure-lowering
regimens on major cardiovascular events: Results of prospec-
tively-designed overviews of randomised trials. Lancet 362,
1527–35.
Uechi M, Terui H, Nakayama T, et al. (1994). Circadian variation
of urinary enzymes in the dog. J Vet Med Sci, 56, 849–54.
Van Orshoven NP, Oey PL, van Schelven LJ, et al. (2004).
Effect of gastric distension on cardiovascular parameters:
Gastrovascular reflex is attenuated in the elderly. J Physiol,
555, 573–83.
Watanabe Y, Halberg F, Otsuka K, Cornelissen G. (2013). Toward
a personalized chronotherapy of high blood pressure and a
circadian overswing. Clin. Exp. Hypertens. Advance online
publication. doi: 10.3109/10641963.2013.780073. Epub 2013
Mar 29.
Watkins Jr L, Burton JA, Haber E, et al. (1976). The renin-
angiotensin-aldosterone system in congestive failure in
conscious dogs. J Clin Invest, 57, 1606–17.
16 J. P. Mochel et al.
Chronobiology International
Chr
onob
iol I
nt D
ownl
oade
d fr
om in
form
ahea
lthca
re.c
om b
y N
ovar
tis P
harm
a on
08/
09/1
3Fo
r pe
rson
al u
se o
nly.