Chromosome‐level hybrid de novo genome assemblies as an ...
17
Mol Ecol Resour. 2020;00:1–17. wileyonlinelibrary.com/journal/men | 1 © 2020 John Wiley & Sons Ltd 1 | INTRODUCTION Whole genome sequencing is a major target in evolutionary biology, because it provides the material to study how a species’ genome evolves. Notably, whole genome data provide the opportunity to study recombination and large rearrangement events, differential molecular evolution across the genome, and imprints of selection throughout the genome, ultimately improving our knowledge of how species evolve and diverge (Ellegren, 2014; Rudman et al., 2018). To increase our understanding of such evolutionary processes, we need to expand the range of studied organisms to nonmodel organisms, for which the access to well-resolved genome assemblies is often lacking. Thanks to third-generation sequencing (3GS) from platforms such as PacBio (Rhoads & Au, 2015) and Nanopore (Urban, Bliss, Lawrence, & Gerbi, 2015), de novo genome assemblies of nonmodel organisms can be obtained, but one drawback from such technol- ogies is the high error rate. De novo hybrid assemblies combine long- and short-reads (Illumina technology; Bentley et al., 2008) to achieve high contiguity and accuracy while reducing sequencing costs through lower coverage of long-reads data (Ye, Hill, Wu, Ruan, & Ma, 2016). There is a constantly increasing panel of tools to assemble reads and polish genome assemblies. Identifying the pipeline most opti- mized to one's needs is one obstacle, and applying it to the actual data is another one, especially in the absence of bioinformatic exper- tise, because guidelines and practical implementations remain lim- ited. In addition, many of those pipelines are not tested on nonmodel organisms and assume that the samples are from model organisms where extreme inbreeding and high homozygosity are commonly Received: 24 September 2019 | Revised: 31 March 2020 | Accepted: 16 April 2020 DOI: 10.1111/1755-0998.13176 RESOURCE ARTICLE Chromosome-level hybrid de novo genome assemblies as an attainable option for nonmodel insects Coline C. Jaworski 1,2,3 | Carson W. Allan 1 | Luciano M. Matzkin 1,4,5 1 Department of Entomology, The University of Arizona, Tucson, AZ, USA 2 Univ Avignon, CNRS, IRD, IMBE, Aix Marseille Université, Marseille, France 3 Department of Zoology, University of Oxford, Oxford, UK 4 BIO5 Institute, The University of Arizona, Tucson, AZ, USA 5 Department of Ecology and Evolutionary Biology, The University of Arizona, Tucson, AZ, USA *Correspondence Coline C. Jaworski and Luciano M. Matzkin, Department of Entomology, The University of Arizona, Tucson, AZ, USA. Emails: [email protected]; lmatzkin@ email.arizona.edu Funding information Fondation Fyssen; Division of Integrative Organismal Systems, Grant/Award Number: IOS-1557697; National Science Foundation; University of Arizona Abstract The emergence of third-generation sequencing (3GS; long-reads) is bringing closer the goal of chromosome-size fragments in de novo genome assemblies. This allows the exploration of new and broader questions on genome evolution for a number of nonmodel organisms. However, long-read technologies result in higher sequencing error rates and therefore impose an elevated cost of sufficient coverage to achieve high enough quality. In this context, hybrid assemblies, combining short-reads and long-reads, provide an alternative efficient and cost-effective approach to generate de novo, chromosome-level genome assemblies. The array of available software pro- grams for hybrid genome assembly, sequence correction and manipulation are con- stantly being expanded and improved. This makes it difficult for nonexperts to find efficient, fast and tractable computational solutions for genome assembly, especially in the case of nonmodel organisms lacking a reference genome or one from a closely related species. In this study, we review and test the most recent pipelines for hybrid assemblies, comparing the model organism Drosophila melanogaster to a nonmodel cactophilic Drosophila, D. mojavensis. We show that it is possible to achieve excellent contiguity on this nonmodel organism using the DBG2OLC pipeline. KEYWORDS de novo assembly, genomics, long-read, merged assembly, nonmodel species, short-read
Transcript of Chromosome‐level hybrid de novo genome assemblies as an ...
Mol Ecol Resour. 2020;00:1–17. wileyonlinelibrary.com/journal/men | 1© 2020 John Wiley & Sons Ltd
1 | INTRODUC TION
Whole genome sequencing is a major target in evolutionary biology, because it provides the material to study how a species’ genome evolves. Notably, whole genome data provide the opportunity to study recombination and large rearrangement events, differential molecular evolution across the genome, and imprints of selection throughout the genome, ultimately improving our knowledge of how species evolve and diverge (Ellegren, 2014; Rudman et al., 2018). To increase our understanding of such evolutionary processes, we need to expand the range of studied organisms to nonmodel organisms, for which the access to well-resolved genome assemblies is often lacking.
Thanks to third-generation sequencing (3GS) from platforms such as PacBio (Rhoads & Au, 2015) and Nanopore (Urban, Bliss,
Lawrence, & Gerbi, 2015), de novo genome assemblies of nonmodel organisms can be obtained, but one drawback from such technol-ogies is the high error rate. De novo hybrid assemblies combine long- and short-reads (Illumina technology; Bentley et al., 2008) to achieve high contiguity and accuracy while reducing sequencing costs through lower coverage of long-reads data (Ye, Hill, Wu, Ruan, & Ma, 2016).
There is a constantly increasing panel of tools to assemble reads and polish genome assemblies. Identifying the pipeline most opti-mized to one's needs is one obstacle, and applying it to the actual data is another one, especially in the absence of bioinformatic exper-tise, because guidelines and practical implementations remain lim-ited. In addition, many of those pipelines are not tested on nonmodel organisms and assume that the samples are from model organisms where extreme inbreeding and high homozygosity are commonly
Received: 24 September 2019 | Revised: 31 March 2020 | Accepted: 16 April 2020
DOI: 10.1111/1755-0998.13176
R E S O U R C E A R T I C L E
Chromosome-level hybrid de novo genome assemblies as an attainable option for nonmodel insects
Coline C. Jaworski1,2,3 | Carson W. Allan1 | Luciano M. Matzkin1,4,5
1Department of Entomology, The University of Arizona, Tucson, AZ, USA2Univ Avignon, CNRS, IRD, IMBE, Aix Marseille Université, Marseille, France3Department of Zoology, University of Oxford, Oxford, UK4BIO5 Institute, The University of Arizona, Tucson, AZ, USA5Department of Ecology and Evolutionary Biology, The University of Arizona, Tucson, AZ, USA
*CorrespondenceColine C. Jaworski and Luciano M. Matzkin, Department of Entomology, The University of Arizona, Tucson, AZ, USA.Emails: [email protected]; [email protected]
Funding informationFondation Fyssen; Division of Integrative Organismal Systems, Grant/Award Number: IOS-1557697; National Science Foundation; University of Arizona
AbstractThe emergence of third-generation sequencing (3GS; long-reads) is bringing closer the goal of chromosome-size fragments in de novo genome assemblies. This allows the exploration of new and broader questions on genome evolution for a number of nonmodel organisms. However, long-read technologies result in higher sequencing error rates and therefore impose an elevated cost of sufficient coverage to achieve high enough quality. In this context, hybrid assemblies, combining short-reads and long-reads, provide an alternative efficient and cost-effective approach to generate de novo, chromosome-level genome assemblies. The array of available software pro-grams for hybrid genome assembly, sequence correction and manipulation are con-stantly being expanded and improved. This makes it difficult for nonexperts to find efficient, fast and tractable computational solutions for genome assembly, especially in the case of nonmodel organisms lacking a reference genome or one from a closely related species. In this study, we review and test the most recent pipelines for hybrid assemblies, comparing the model organism Drosophila melanogaster to a nonmodel cactophilic Drosophila, D. mojavensis. We show that it is possible to achieve excellent contiguity on this nonmodel organism using the dbg2olc pipeline.
K E Y W O R D S
de novo assembly, genomics, long-read, merged assembly, nonmodel species, short-read

2 | JAWORSKI et Al.
feasible. In the present study, we reviewed the most recent whole genome assembly pipelines, and selected a promising pipeline re-lying on hybrid technology (Chakraborty, Baldwin-Brown, Long, & Emerson, 2016). We tested it thoroughly with the aim of an opti-mized assembly, using DNA data from both Drosophila melanogaster as a model species and D. mojavensis from the Sonora, Mexico, pop-ulation as a nonmodel species. D. mojavensis is a cactophilic North American desert endemic species, ovipositing, developing and feed-ing as adults on necrotic cactus tissues (Heed, 1978). The species is composed of four distinct host populations (Sonoran Desert, Baja California, Mojave Desert and Santa Catalina Island) each utilizing a different cactus species (the population from Sonora utilizes the organpipe cactus, Stenocereus thurberi). Given its known ecology and ever-growing genomic tools, this species has become a model for the study of the genomics of local ecological adaptation and speciation (Benowitz, Coleman, & Matzkin, 2019; Bono, Matzkin, Kelleher, & Markow, 2011; Matzkin, 2014; Matzkin, Watts, Bitler, Machado, & Markow, 2006). Distantly related to D. melanogaster, D. mojavensis has a similar genome size (see Table 1) and six Muller elements, although all its chromosomes are acrocentric (Drosophila 12 Genomes Consortium, 2007; Schaeffer et al., 2008). Ultimately, this new D. mojavensis assembly from Sonora will be used in a much larger upcoming genomic study using de novo assemblies of multi-ple cactophilic species and populations (L. M. Matzkin, unpublished data). We provide here an analysis of the effects of different pa-rameters on the quality of the final assembly, assessed by a com-bination of universal tools: contig length and N50 as a measure of contiguity; BUSCO score as a measure of quality and complete-ness (Waterhouse et al., 2017) and a reference-based tool, Quast (Gurevich, Saveliev, Vyahhi, & Tesler, 2013), which compares the assembly to a reference genome. We show a significant improve-ment of assembly quality of D. melanogaster compared with results from Chakraborty et al. (2016) simply by tuning parameters and we provide guide parameters for assemblies with similar coverage of
nonmodel organism DNA. Finally, we tested the pipeline on D. mo-javensis from the California Santa Catalina Island population using Nanopore long-read data instead of PacBio data.
2 | MATERIAL S AND METHODS
2.1 | Drosophila mojavensis sequencing
We used flies from a D. mojavensis isofemale line (MJ 122) originally collected in Guaymas, Sonora, Mexico, in 1998 (hereafter SON). This isofemale line has been maintained since its collection under labo-ratory conditions (25°C and 14/10-hr day/night cycle), transferred every generation (4 weeks) into fresh 8-dram vials containing ba-nana-molasses medium (Coleman, Benowitz, Jost, & Matzkin, 2018). Before DNA extraction the flies were raised on banana-molasses medium with 125 µg/ml ampicillin and 12.5 µg/ml tetracycline to reduce bacterial contamination of the sequencing data. The se-quencing methods for short-read data (paired ends and mate pairs) have been described in Allan and Matzkin (2019b). Sequencing tech-nologies and coverage for the different data sets are summarized in Table 1.
2.1.1 | DNA extraction for PacBio sequencing – protocol optimization
Due to the long-read potential of PacBio sequencing systems, extra care must be taken during extraction to produce high-mo-lecular-weight DNA. Attempts at using both the Qiagen DNeasy Blood &Tissue Kit and Qiagen MagAttract HMW DNA Kit failed to produce sufficiently long strands of DNA. As such, a chloro-form-based extraction method was used. This relatively simple method is low-cost and the only specialized equipment needed is
OrganismGenome size
Sequencing technology
Data output Coverage
Drosophila melanogaster ~140 Mb Illumina HiSeq 2000 16.8 Gba 120×
PacBio RS II 16.1 Gbb 115×
Drosophila mojavensis (Sonora)
~160 Mb Illumina HiSeq 2500100 bp paired ends
10.1 Gba 63×
2,500 bp mate pairs 5.9 Gbc 37×
PacBio Sequel 10.4 Gbb 65×
Drosophila mojavensis (Catalina)
~160 Mb Illumina NextSeq 500
150 bp paired ends
9.1 Gba 55×
Oxford Nanopore MinION
15.2 Gb 95×
aCalculated as the total number of bases in data files after trimming from platanus_trim. bCalculated as the total number of bases in data files obtained from converting.bax.h5 files into.bam files, and converting the obtained subreads.bam files into fasta files, with no specific trimming cCalculated as the total number of bases in data files after trimming from platanus_internal_trim.
TA B L E 1 Sequencing technology and coverage of each data set

| 3JAWORSKI et Al.
a refrigerated centrifuge. To consistently recover enough DNA for two PacBio libraries, 150 flies of each sex were used for extrac-tion. Flies were starved for 2 hr in groups of 50 per vial and then frozen at −80°C in 1.5-ml tubes. A lysis solution containing 0.1 m Tris-HCI buffer pH 8.0, 0.1 m EDTA pH 8.0 and 1% sodium dode-clysulfate (SDS) was prepared and stored at room temperature to prevent the SDS from precipitating. While on ice, 500 µl of lysis solution was added to each tube of flies, followed by 2.5 µl of Qiagen Proteinase K to reduce DNA degradation. Using a plastic pestle, flies in each tube were hand-homogenized by gently grind-ing them. Hand homogenization resulted in slightly lower amounts of DNA recovered, although the size of DNA fragments was longer compared to when using a battery-operated pestle motor for ho-mogenization. The mixture was incubated at 65°C for 30 min with gentle mixing halfway through. To further reduce DNA fragmenta-tion, tubes were cooled to 37°C for 3 min and another 2.5 µl of Qiagen Proteinase K was added. Tubes were incubated for an ad-ditional 30 min at 37°C. After incubation, 70 µl of 4 m potassium acetate was added, mixed by inversion, and then placed on ice to incubate for 30 min. In a 4°C Eppendorf 5920R centrifuge, the
tubes were spun for 30 min at 18,000 g to pull debris to the bot-tom of the tubes. For each tube, the supernatant was transferred to new tubes avoiding as much debris as possible. One volume of chloroform/isoamyl alcohol 24:1 was added to each tube and gen-tly inverted 40 times, and then centrifuged at 4°C for 5 min at 10,500 g. The upper phase was transferred to a new tube while being careful to not disturb the interface. The DNA was precipi-tated by adding 350 µl of 2-propanol and gently inverting the tube. At this point visible threads of DNA were apparent. To pellet the precipitate, the tubes were centrifuged at 4°C for 5 min at 10,500 g. The supernatant was discarded and the pellet was washed with 1 ml of room-temperature 70% ethanol. The tube was inverted to ensure washing of the pellet and tube. A final 4°C centrifuga-tion for 2 min at 10,500 g was performed. The ethanol was re-moved completely as possible with a pipettor as and the pellet dried for 10–15 min in a fume hood. Then 30 µl of Tris-EDTA pH 8.0 was added to each tube to resuspend the DNA. While the pel-let normally goes into solution relatively easily, it can be placed at 4°C overnight to ensure resuspension. The six tubes were then combined to a single tube and 3 µl of Qiagen RNaseA was added
F I G U R E 1 Size profile of DNA from Drosophila mojavensis (Sonora) extracted with three different methods. Images of three gels, corresponding to each method, have been collated here, using the same ladder (sizes shown on the left)

4 | JAWORSKI et Al.
and incubated for 30 min at 37°C. The DNA was delivered as this resuspended solution for PacBio sequencing.
2.1.2 | PacBio sequencing
PacBio sequencing was performed at the Arizona Genomics Institute (Tucson, AZ, USA). DNA was sized in a 1% agarose pulsed field gel electrophoresed at 1–50-s linear ramp, 6 V/cm, 14°C in 0.5 × TBE buffer for 20 hr (BioRad). The marker used was a lambda ladder Midrange PFG I (New England Biolabs). The resultant DNA smear had a large mass in the range 35–65 kb (Figure 1). DNA purity was verified using a NanoDrop One Microvolume UV Spectrophotometer with ratios 260/280 and 260/230 over 1.8. Quantity (150 ng/µl in 180 µl = 27 µg) was determined by using a Qubit Fluorometer (Life Technologies), and was consistently lower than that measured with the Nanodrop. PacBio sequencing libraries were prepared from 6 µg starting material each, following the manufacturer's protocol for a 20-kb template preparation using BluePippin Size-Selection System (www.pacb.com). The library was size-selected, on a BluePippin, at 20 kb using high pass with S1 Marker (Sage Sciences). The final library was damage-repaired, bead-purified and quantified. Sequencing was performed on a PacBio Sequel instrument following the manufactur-er's instructions. The sequencing primer annealed was v3, and the sequencing kit was v2.1. Two libraries were loaded on two separate SMRT cells with magbeads at concentrations of 25 and 35 pmol, re-spectively. Sequencing was carried out for collection of 10-hr mov-ies on 1 million SMRT cells.
2.2 | Drosophila melanogaster and D. mojavensis public sequencing data
To generate the D. melanogaster assembly (hereafter, Dmel), PacBio data were retrieved from the NCBI Short-read Archive SRX499318 (Kim et al., 2014). This data set contained 42 PacBio RS II SMRT cells from male D. melanogaster ISO1 flies. We used data from just 20 ran-domly selected cells to obtain a coverage similar to our data sets (cell numbers SRR1204085, SRR1204088, SRR1204451, SRR1204466, SRR1204467, SRR1204469, SRR1204471, SRR1204472, SRR1204473, SRR1204481, SRR1204482, SRR1204485, SRR1204486, SRR1204615, SRR1204617, SRR1204690, SRR1204691, SRR1204692, SRR1204693 and SRR1204696). We used the Illumina HiSeq 2000 100-bp paired-end data from male D. melanogaster ISO1 flies, which was retrieved from the European Nucleotide Archive ERX645969.
For the D. mojavensis assembly from the California Santa Catalina Island population (hereafter, CAT), Nanopore sequencing data were kindly provided by Miller, Staber, Zeitlinger, and Hawley (2018a). Short-read Illumina data of D. mojavensis from Catalina were re-trieved from the NCBI Short-read Archive SRR6425997 2018b and from Sonora from NCBI BioProject PRJNA530196 (Allan & Matzkin, 2019a).
2.3 | Computing resources
All programs were run on the UA Research Computing High Performance Computing (HPC) at the University of Arizona. The cluster used is composed of 28 core processors with 168 GB RAM per node, and is run via a PBS-Pro grid system. All the programs used were installed under a user python virtual environment (pip). The majority of the programs used are available as Bioconda packages for easy installation in noncluster environments (Grüning et al., 2018). They are also provided as Docker containers through Bioconda, which can be run through Singularity (https://sylabs.io/) on cluster systems. All command lines are provided in the Appendix S1.
2.4 | Assembly pipelines
2.4.1 | DBG2OLC Pipeline
The DBG2OLC Pipeline is composed of three main steps: (a) hybrid assembly via the dbg2olc program, (b) long-read assembly only and (c) merging of those two assemblies (Figure 2).
Hybrid assemblydbg2olc uses contigs from a short-read assembly and maps them to the raw long-reads, which are then compressed into the list of the short-read's contig identifiers (Ye et al., 2016). A best overlap graph is constructed from those compressed long-reads before uncom-pressing them into a consensus sequence. This method is both highly accurate and extremely fast (Ye et al., 2016). The consensus con-tigs, or backbones, are then corrected using sparc (Ye & Ma, 2016). sparc builds a sparse k-mer graph (k-mers in different positions are treated independently) using the contigs identifier list associated with each raw long-read. All short-read contigs are then aligned to their associated long-read using the blastr aligner from the PacBio SMRT toolkit (SMRT Link version 4.0.0), previously pbdagcon, which is the most time-consuming step. sparc finally uses these alignments to refine the graph and create a polished consensus sequence. In the present study, we tested two competing short-read assem-blers, sparseassembler (provided with the dbg2olc installation pack-age) (Ye, Ma, Cannon, Pop, & Yu, 2012), and platanus version 1.2.4 (Kajitani et al., 2014). We used the March 2019 version of dbg2olc (Ye et al., 2016), the January 2015 version of sparc (Ye & Ma, 2016) and blastr 5.3.5 (b30da0) (SMRT Link version 4.0.0). Note that we began working with an older version of blastr which was signifi-cantly slower and led to slightly different results. For this reason, and because programs often include third party packages, it is im-portant to keep track of each version used and physically separate the repositories, so the SMRT toolkit was installed in an independent directory with no direct link to the user bin, except for the blastr program. We modified the split_and_run_sparc.sh script available from the sparc Github repository so as to call the split_reads_by_backbone.py script externally (Appendix S1 and to set the number of chores used by blastr from the command line. In this way, it is easier

| 5JAWORSKI et Al.
to rerun the time-consuming sparc step in case of crash from where it stopped, and after moving the already corrected backbones into another directory.
The hybrid assembly was then polished using the PacBio tool in the SMRT toolkit (SMRT Link version 4.0.0). The version of the
PacBio correction tool is frequently updated along with chemistry technology of PacBio sequencing, and therefore the version quiver (version 2.1.0) was used for D. melanogaster (sequenced in 2014 on a PacBio RS II system; Kim et al., 2014), and the version arrow (version 2.1.0) was used for D. mojavensis (sequenced in 2017 on a PacBio
F I G U R E 2 dbg2olc pipeline, including the final merging step and the polishing steps
6 | JAWORSKI et Al.
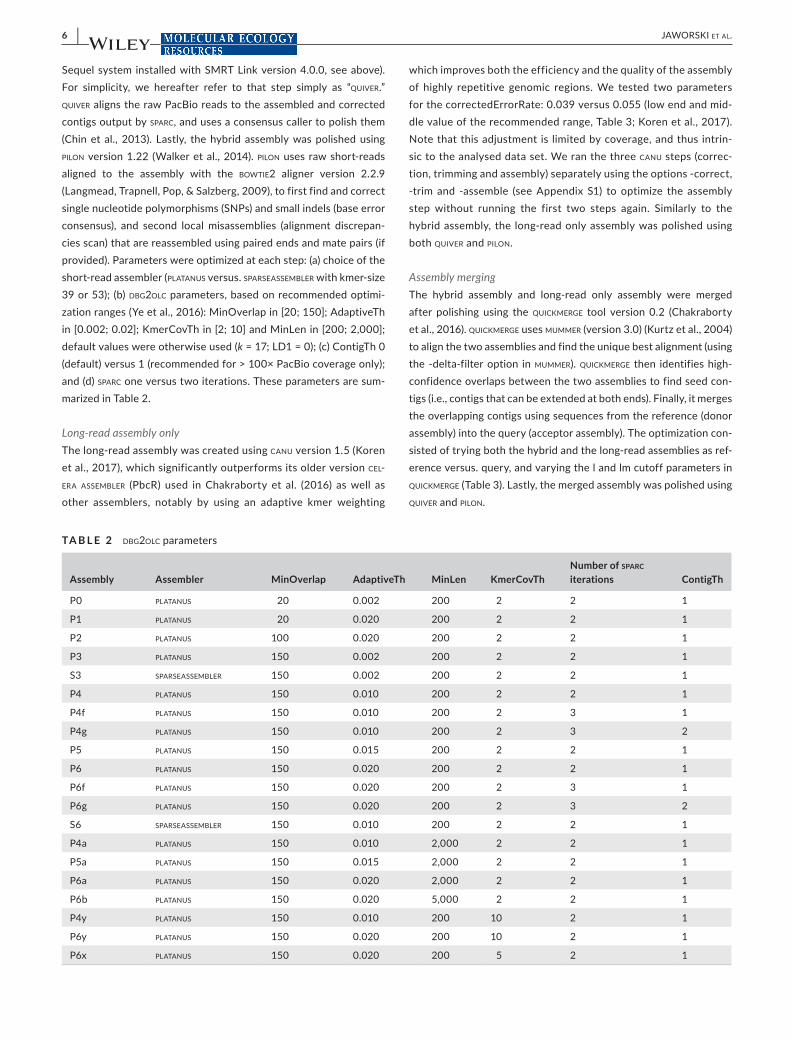
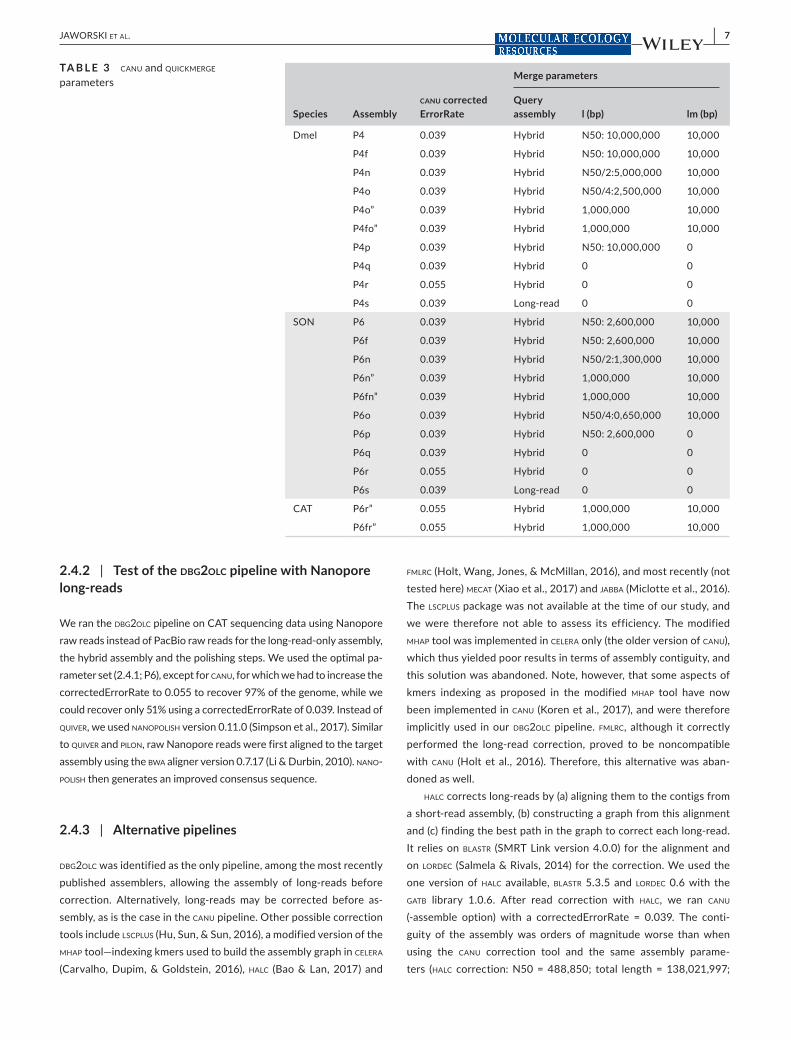
Sequel system installed with SMRT Link version 4.0.0, see above). For simplicity, we hereafter refer to that step simply as “quiver.” quiver aligns the raw PacBio reads to the assembled and corrected contigs output by sparc, and uses a consensus caller to polish them (Chin et al., 2013). Lastly, the hybrid assembly was polished using pilon version 1.22 (Walker et al., 2014). pilon uses raw short-reads aligned to the assembly with the bowtie2 aligner version 2.2.9 (Langmead, Trapnell, Pop, & Salzberg, 2009), to first find and correct single nucleotide polymorphisms (SNPs) and small indels (base error consensus), and second local misassemblies (alignment discrepan-cies scan) that are reassembled using paired ends and mate pairs (if provided). Parameters were optimized at each step: (a) choice of the short-read assembler (platanus versus. sparseassembler with kmer-size 39 or 53); (b) dbg2olc parameters, based on recommended optimi-zation ranges (Ye et al., 2016): MinOverlap in [20; 150]; AdaptiveTh in [0.002; 0.02]; KmerCovTh in [2; 10] and MinLen in [200; 2,000]; default values were otherwise used (k = 17; LD1 = 0); (c) ContigTh 0 (default) versus 1 (recommended for > 100× PacBio coverage only); and (d) sparc one versus two iterations. These parameters are sum-marized in Table 2.
Long-read assembly onlyThe long-read assembly was created using canu version 1.5 (Koren et al., 2017), which significantly outperforms its older version cel-era assembler (PbcR) used in Chakraborty et al. (2016) as well as other assemblers, notably by using an adaptive kmer weighting
which improves both the efficiency and the quality of the assembly of highly repetitive genomic regions. We tested two parameters for the correctedErrorRate: 0.039 versus 0.055 (low end and mid-dle value of the recommended range, Table 3; Koren et al., 2017). Note that this adjustment is limited by coverage, and thus intrin-sic to the analysed data set. We ran the three canu steps (correc-tion, trimming and assembly) separately using the options -correct, -trim and -assemble (see Appendix S1) to optimize the assembly step without running the first two steps again. Similarly to the hybrid assembly, the long-read only assembly was polished using both quiver and pilon.
Assembly mergingThe hybrid assembly and long-read only assembly were merged after polishing using the quickmerge tool version 0.2 (Chakraborty et al., 2016). quickmerge uses mummer (version 3.0) (Kurtz et al., 2004) to align the two assemblies and find the unique best alignment (using the -delta-filter option in mummer). quickmerge then identifies high-confidence overlaps between the two assemblies to find seed con-tigs (i.e., contigs that can be extended at both ends). Finally, it merges the overlapping contigs using sequences from the reference (donor assembly) into the query (acceptor assembly). The optimization con-sisted of trying both the hybrid and the long-read assemblies as ref-erence versus. query, and varying the l and lm cutoff parameters in quickmerge (Table 3). Lastly, the merged assembly was polished using quiver and pilon.
TA B L E 2 dbg2olc parameters
Assembly Assembler MinOverlap AdaptiveTh MinLen KmerCovThNumber of sparc iterations ContigTh
P0 platanus 20 0.002 200 2 2 1
P1 platanus 20 0.020 200 2 2 1
P2 platanus 100 0.020 200 2 2 1
P3 platanus 150 0.002 200 2 2 1
S3 sparseassembler 150 0.002 200 2 2 1
P4 platanus 150 0.010 200 2 2 1
P4f platanus 150 0.010 200 2 3 1
P4g platanus 150 0.010 200 2 3 2
P5 platanus 150 0.015 200 2 2 1
P6 platanus 150 0.020 200 2 2 1
P6f platanus 150 0.020 200 2 3 1
P6g platanus 150 0.020 200 2 3 2
S6 sparseassembler 150 0.010 200 2 2 1
P4a platanus 150 0.010 2,000 2 2 1
P5a platanus 150 0.015 2,000 2 2 1
P6a platanus 150 0.020 2,000 2 2 1
P6b platanus 150 0.020 5,000 2 2 1
P4y platanus 150 0.010 200 10 2 1
P6y platanus 150 0.020 200 10 2 1
P6x platanus 150 0.020 200 5 2 1
| 7JAWORSKI et Al.
2.4.2 | Test of the dbg2olc pipeline with Nanopore long-reads
We ran the dbg2olc pipeline on CAT sequencing data using Nanopore raw reads instead of PacBio raw reads for the long-read-only assembly, the hybrid assembly and the polishing steps. We used the optimal pa-rameter set (2.4.1; P6), except for canu, for which we had to increase the correctedErrorRate to 0.055 to recover 97% of the genome, while we could recover only 51% using a correctedErrorRate of 0.039. Instead of quiver, we used nanopolish version 0.11.0 (Simpson et al., 2017). Similar to quiver and pilon, raw Nanopore reads were first aligned to the target assembly using the bwa aligner version 0.7.17 (Li & Durbin, 2010). nano-polish then generates an improved consensus sequence.
2.4.3 | Alternative pipelines
dbg2olc was identified as the only pipeline, among the most recently published assemblers, allowing the assembly of long-reads before correction. Alternatively, long-reads may be corrected before as-sembly, as is the case in the canu pipeline. Other possible correction tools include lscplus (Hu, Sun, & Sun, 2016), a modified version of the mhap tool—indexing kmers used to build the assembly graph in celera (Carvalho, Dupim, & Goldstein, 2016), halc (Bao & Lan, 2017) and
fmlrc (Holt, Wang, Jones, & McMillan, 2016), and most recently (not tested here) mecat (Xiao et al., 2017) and jabba (Miclotte et al., 2016). The lscplus package was not available at the time of our study, and we were therefore not able to assess its efficiency. The modified mhap tool was implemented in celera only (the older version of canu), which thus yielded poor results in terms of assembly contiguity, and this solution was abandoned. Note, however, that some aspects of kmers indexing as proposed in the modified mhap tool have now been implemented in canu (Koren et al., 2017), and were therefore implicitly used in our dbg2olc pipeline. fmlrc, although it correctly performed the long-read correction, proved to be noncompatible with canu (Holt et al., 2016). Therefore, this alternative was aban-doned as well.
halc corrects long-reads by (a) aligning them to the contigs from a short-read assembly, (b) constructing a graph from this alignment and (c) finding the best path in the graph to correct each long-read. It relies on blastr (SMRT Link version 4.0.0) for the alignment and on lordec (Salmela & Rivals, 2014) for the correction. We used the one version of halc available, blastr 5.3.5 and lordec 0.6 with the gatb library 1.0.6. After read correction with halc, we ran canu (-assemble option) with a correctedErrorRate = 0.039. The conti-guity of the assembly was orders of magnitude worse than when using the canu correction tool and the same assembly parame-ters (halc correction: N50 = 488,850; total length = 138,021,997;
Species Assemblycanu correctedErrorRate
Merge parameters
Query assembly l (bp) lm (bp)
Dmel P4 0.039 Hybrid N50: 10,000,000 10,000
P4f 0.039 Hybrid N50: 10,000,000 10,000
P4n 0.039 Hybrid N50/2:5,000,000 10,000
P4o 0.039 Hybrid N50/4:2,500,000 10,000
P4o” 0.039 Hybrid 1,000,000 10,000
P4fo” 0.039 Hybrid 1,000,000 10,000
P4p 0.039 Hybrid N50: 10,000,000 0
P4q 0.039 Hybrid 0 0
P4r 0.055 Hybrid 0 0
P4s 0.039 Long-read 0 0
SON P6 0.039 Hybrid N50: 2,600,000 10,000
P6f 0.039 Hybrid N50: 2,600,000 10,000
P6n 0.039 Hybrid N50/2:1,300,000 10,000
P6n” 0.039 Hybrid 1,000,000 10,000
P6fn” 0.039 Hybrid 1,000,000 10,000
P6o 0.039 Hybrid N50/4:0,650,000 10,000
P6p 0.039 Hybrid N50: 2,600,000 0
P6q 0.039 Hybrid 0 0
P6r 0.055 Hybrid 0 0
P6s 0.039 Long-read 0 0
CAT P6r” 0.055 Hybrid 1,000,000 10,000
P6fr” 0.055 Hybrid 1,000,000 10,000
TA B L E 3 canu and quickmerge parameters

8 | JAWORSKI et Al.
TAB
LE 4
d
bg2o
lc p
aram
eter
opt
imiz
atio
n: c
ontig
uity
and
acc
urac
y. A
ssem
blie
s re
fer t
o pa
ram
eter
set
s de
fined
in T
able
2
Spec
ies
Ass
embl
yN
o. o
f fr
agm
ents
N50
(bp)
Larg
est f
ragm
ent
size
(bp)
No.
of g
loba
l m
isas
sem
blie
sN
o. o
f loc
al
mis
asse
mbl
ies
No.
of
mis
mat
ches
pe
r 100
kb
No.
Of i
ndel
s (p
er 1
00 k
b
BUSC
O s
core
(%)
Com
plet
e ge
nes
Frag
men
ted
gene
sM
issi
ng
gene
s
Dm
elP0
792
16,0
84,5
3225
,835
,722
2,35
61,
001
12.6
29.
5198
.11
0.57
1.32
P190
016
,023
,660
24,8
92,4
002,
656
1,02
711
.82
9.55
97.3
20.
612.
07
P229
221
,449
,278
24,8
67,0
571,
076
371
10.2
77.
3597
.07
0.64
2.07
P328
219
,409
,490
25,8
11,1
1389
037
010
.68
6.57
97.2
10.
502.
29
S331
419
,674
,671
24,8
95,7
3277
131
210
.03
7.03
95.6
40.
793.
57
P426
621
,413
,354
25,7
75,4
8562
326
78.
666.
4998
.75
0.57
0.68
P4f
267
21,4
13,1
8525
,776
,014
919
318
10.5
56.
7398
.75
0.57
0.68
P4g
227
21,4
12,8
1625
,796
,604
667
263
10.0
56.
4798
.39
0.57
1.04
P526
819
,684
,947
25,8
10,3
9988
232
310
.19
6.95
97.1
10.
572.
29
P626
121
,455
,994
24,8
61,2
6980
128
910
.65
7.02
97.1
10.
642.
25
S629
019
,674
,784
24,9
11,2
9172
633
110
.19
6.84
95.3
90.
823.
79
P4a
267
21,4
14,7
5925
,777
,026
920
338
10.7
96.
9498
.75
0.57
0.68
P5a
270
19,6
84,9
4725
,810
,399
892
323
10.1
96.
9597
.11
0.61
2.29
P6a
258
21,4
55,9
1824
,861
,450
553
282
9.11
6.36
97.1
10.
642.
25
P6b
259
21,4
55,9
6424
,861
,284
785
295
10.3
76.
9097
.11
0.64
2.25
P4y
239
21,4
13,1
0425
,789
,761
633
304
10.4
36.
8398
.71
0.57
0.71
P6x
257
21,4
50,5
1424
,861
,357
777
324
10.6
47.
0897
.11
0.64
2.25
P6y
242
21,4
55,9
9324
,861
,357
610
298
9.15
6.35
97.0
30.
642.
32
Ref.
geno
me
725
,286
,936
32,0
79,3
31N
AN
AN
AN
A98
.68
0.75
0.57
Ref. Cha
krab
orth
y et
al.
(P0)
NA
~23
Mb
NA
~5,5
00~3
,300
~18
130
NA
NA
NA
(Con
tinue
s)

| 9JAWORSKI et Al.
Spec
ies
Ass
embl
yN
o. o
f fr
agm
ents
N50
(bp)
Larg
est f
ragm
ent
size
(bp)
No.
of g
loba
l m
isas
sem
blie
sN
o. o
f loc
al
mis
asse
mbl
ies
No.
of
mis
mat
ches
pe
r 100
kb
No.
Of i
ndel
s (p
er 1
00 k
b
BUSC
O s
core
(%)
Com
plet
e ge
nes
Frag
men
ted
gene
sM
issi
ng
gene
s
SON
P034
828
,767
,831
34,2
46,7
678,
244
10,0
6432
8.42
265.
1298
.39
0.86
0.75
P149
521
,851
,486
34,2
52,6
419,
066
10,3
3032
9.18
266.
4998
.39
0.82
0.79
P213
227
,067
,002
33,1
45,7
257,
351
9,75
632
6.40
264.
2798
.25
0.96
0.79
P380
27,0
92,0
9534
,236
,744
7,18
99,
670
325.
2126
3.71
98.2
51.
000.
75
S390
18,9
84,3
1734
,265
,435
7,21
49,
687
324.
9726
2.72
98.3
60.
930.
71
P492
27,0
81,9
2133
,130
,663
7,16
69,
688
324.
9926
4.24
98.2
11.
040.
75
P597
27,0
73,3
3334
,231
,430
7,32
79,
782
324.
5826
3.90
98.3
60.
890.
75
P610
427
,074
,084
33,1
45,3
897,
168
9,75
332
4.69
264.
1698
.39
0.93
0.68
P6f
103
27,1
25,9
6633
,144
,936
7,17
39,
760
324.
8026
4.49
98.3
60.
960.
68
P6g
8027
,068
,405
37,1
17,1
637,
151
9,75
932
4.58
267.
3898
.39
0.96
0.64
S611
911
,627
,144
33,0
84,6
457,
280
9,73
732
4.83
263.
9698
.25
1.00
0.75
P4a
8827
,072
,608
34,2
17,1
777,
255
9,73
632
4.67
263.
7498
.32
0.89
0.79
P5a
9727
,081
,858
34,2
30,7
447,
391
9,75
032
4.72
264.
1098
.36
0.96
0.68
P6a
104
27,1
24,4
6533
,144
,017
7,17
99,
761
325.
0726
4.57
98.4
30.
890.
68
P6b
9827
,089
,768
34,2
32,1
917,
237
9,75
532
4.76
264.
3798
.39
0.93
0.68
P4y
9827
,058
,011
37,1
35,0
157,
391
9,79
832
4.25
267.
2698
.29
1.04
0.68
P6x
9927
,066
,010
33,0
76,0
497,
211
9,74
032
4.72
263.
2498
.32
0.89
0.79
P6y
100
27,0
61,5
3437
,152
,367
7,16
89,
753
324.
5626
7.59
98.3
21.
000.
68
Ref.
3926
,426
,104
33,7
38,5
61N
AN
AN
AN
A98
.14
0.93
0.93
TAB
LE 4
(C
ontin
ued)

10 | JAWORSKI et Al.
TAB
LE 5
c
an
u a
nd q
uic
km
erg
e par
amet
er o
ptim
izat
ion:
con
tigui
ty a
nd a
ccur
acy
Spec
ies
Ass
embl
yN
o. o
f fr
agm
ents
N50
(bp)
Larg
est
frag
men
t siz
e (b
p)N
o. o
f glo
bal
mis
asse
mbl
ies
No.
of l
ocal
m
isas
sem
blie
s
No.
of
mis
mat
ches
pe
r 100
kb
No.
of i
ndel
s pe
r 100
kb
BUSC
O s
core
Com
plet
e ge
nes
Frag
men
ted
gene
sM
issi
ng
gene
s
Dm
elP4
266
21,4
13,3
5425
,775
,485
623
267
8.66
6.49
98.7
50.
570.
68
P4f
267
21,4
13,1
8525
,776
,014
919
318
10.5
56.
7398
.75
0.57
0.68
P4o
265
21,4
13,3
5225
,775
,437
635
275
8.57
6.42
98.7
50.
570.
68
P4o”
210
21,4
13,3
4425
,775
,300
638
295
8.10
6.02
98.7
90.
570.
64
P4fo
”21
121
,413
,185
25,7
76,4
0894
334
09.
906.
2098
.79
0.57
0.64
P4q
116
21,4
13,3
6025
,775
,323
1,56
152
18.
725.
7798
.79
0.57
0.64
P4r
113
21,4
50,4
8325
,801
,485
1,75
158
28.
665.
7598
.61
0.75
0.64
P4s
338
14,5
28,0
0325
,770
,616
3,68
41,
145
12.3
47.
3498
.79
0.57
0.64
Ref.
725
,286
,936
32,0
79,3
31N
AN
AN
AN
A98
.68
0.75
0.57
SON
P610
427
,074
,084
33,1
45,3
897,
168
9,75
332
4.69
264.
1698
.39
0.93
0.68
P6f
103
27,1
25,9
6633
,144
,936
7,17
39,
760
324.
8026
4.49
98.3
60.
960.
68
P6n
8827
,074
,290
33,1
45,1
047,
357
9,78
832
4.44
263.
5898
.39
0.93
0.68
P6n”
6727
,074
,601
33,1
45,1
277,
261
9,72
832
5.29
263.
8098
.29
0.96
0.75
P6fn
”66
27,1
25,7
9533
,144
,975
7,27
19,
727
325.
2326
3.97
98.2
51.
000.
75
P6o
6527
,074
,498
33,1
45,1
497,
261
9,71
832
5.17
263.
7698
.32
0.93
0.75
P6q
6227
,074
,467
33,1
45,1
897,
470
9,75
232
5.83
263.
6398
.32
0.93
0.75
P6r
5827
,027
,841
34,1
17,4
497,
245
9,16
532
9.97
262.
7193
.25
0.93
5.82
P6s
151
27,1
22,7
2734
,181
,614
9,15
910
,205
328.
5926
3.06
98.1
40.
930.
93
Ref.
3926
,426
,104
33,7
38,5
61N
AN
AN
AN
A98
.14
0.93
0.9
CAT
P6n”
7912
,454
,906
23,0
97,5
992,
272
3,10
456
.41
67.3
998
.39
1.00
0.61
P6fn
”79
12,4
57,2
3823
,102
,169
2,27
42,
949
56.4
065
.70
98.6
40.
820.
54
Ref.
3926
,866
,924
34,1
48,5
56N
AN
AN
AN
A98
.11
0.93
0.96
Ref.
Mill
er
et a
l. (2
018a
)12
25.
0 M
bN
AN
AN
A0.
220.
052
98N
AN
A
Not
e: A
ssem
blie
s re
fer t
o pa
ram
eter
set
s de
fined
in T
able
3.
| 11JAWORSKI et Al.
TAB
LE 6
Im
prov
emen
t of c
ontig
uity
and
qua
lity
thro
ugho
ut th
e pi
pelin
e
Spec
ies
Ass
embl
yN
o. o
f fr
agm
ents
N50
(bp)
Larg
est
frag
men
t (bp
)N
o. o
f glo
bal
mis
asse
mbl
ies
No.
of l
ocal
m
isas
sem
blie
s
No.
of
mis
mat
ches
pe
r 100
kb
No.
of i
ndel
s pe
r 100
kb
BUSC
O s
core
Com
plet
e ge
nes
Frag
men
ted
gene
sM
issi
ng
gene
s
Dm
elSr
15,4
0422
,245
250,
600
138
223.
050.
6896
.96
2.07
0.96
H30
25,
369,
803
20,3
51,3
8744
939
128
.34
570.
4466
.02
15.5
118
.47
HQ
302
5,37
8,16
120
,387
,636
685
439
8.26
13.5
195
.03
2.00
2.97
HQ
P30
25,
378,
529
20,3
85,5
7568
946
48.
917.
7897
.89
0.57
1.54
Lr42
610
,086
,116
24,8
45,9
573,
935
2,12
616
.25
12.1
689
.03
6.50
4.47
LrQ
P42
610
,090
,934
24,8
62,0
054,
002
2,13
112
.23
8.07
98.2
10.
571.
21
M26
621
,413
,390
25,7
76,1
0160
328
88.
957.
1998
.75
0.57
0.68
MQ
P26
621
,413
,354
25,7
75,4
8562
326
78.
666.
4998
.75
0.57
0.68
Ref.
725
,286
,936
32,0
79,3
31N
AN
AN
AN
A98
.68
0.75
0.57
SON
Sr57
,046
3,38
545
,376
346
2,53
921
9.24
200.
0889
.10
7.93
2.97
H13
69,
893,
295
18,8
94,0
646,
773
9,55
833
1.40
457.
2288
.14
8.40
3.47
HQ
136
9,84
0,04
818
,808
,757
6,89
89,
646
324.
7227
1.29
98.5
40.
930.
54
HQ
P13
69,
834,
752
18,8
08,0
386,
893
9,66
332
4.81
265.
2198
.68
0.82
0.50
Lr34
32,
678,
315
8,94
2,85
08,
790
9,91
233
2.66
316.
5796
.57
1.93
1.50
LrQ
P34
32,
679,
816
8,94
5,44
19,
055
10,0
3532
8.02
262.
0498
.14
1.04
0.82
M10
427
,077
,180
33,1
46,1
127,
167
9,79
232
5.14
264.
4498
.43
0.89
0.68
MQ
P10
427
,074
,084
33,1
45,3
897,
168
9,75
332
4.69
264.
1698
.39
0.93
0.68
Ref.
3926
,426
,104
33,7
38,5
61N
AN
AN
AN
A98
.14
0.93
0.9
Abb
revi
atio
ns: H
, hyb
rid a
ssem
bly;
Lr,
long
-rea
d as
sem
bly;
M, m
erge
d as
sem
bly;
P, p
ilo
n p
olis
hing
. Her
e M
QP
corr
espo
nds
to P
4 fo
r Dm
el a
nd P
6 fo
r SO
N (T
able
s 4
and
5); Q
, qu
iver
pol
ishi
ng; S
r, sh
ort-
read
ass
embl
y.
12 | JAWORSKI et Al.
maximum length = 2,874,227; canu pipeline: N50 = 10,9,990,654; total length = 151,043,692; maximum length = 25,950,142). This might have been improved by parameter optimization of both the halc correction step and the assembly step with the canu assembler, but due to the strong difference in contiguity we chose to not utilize halc. Therefore, we focused on optimizing the dbg2olc pipeline only.
2.5 | Assembly quality check
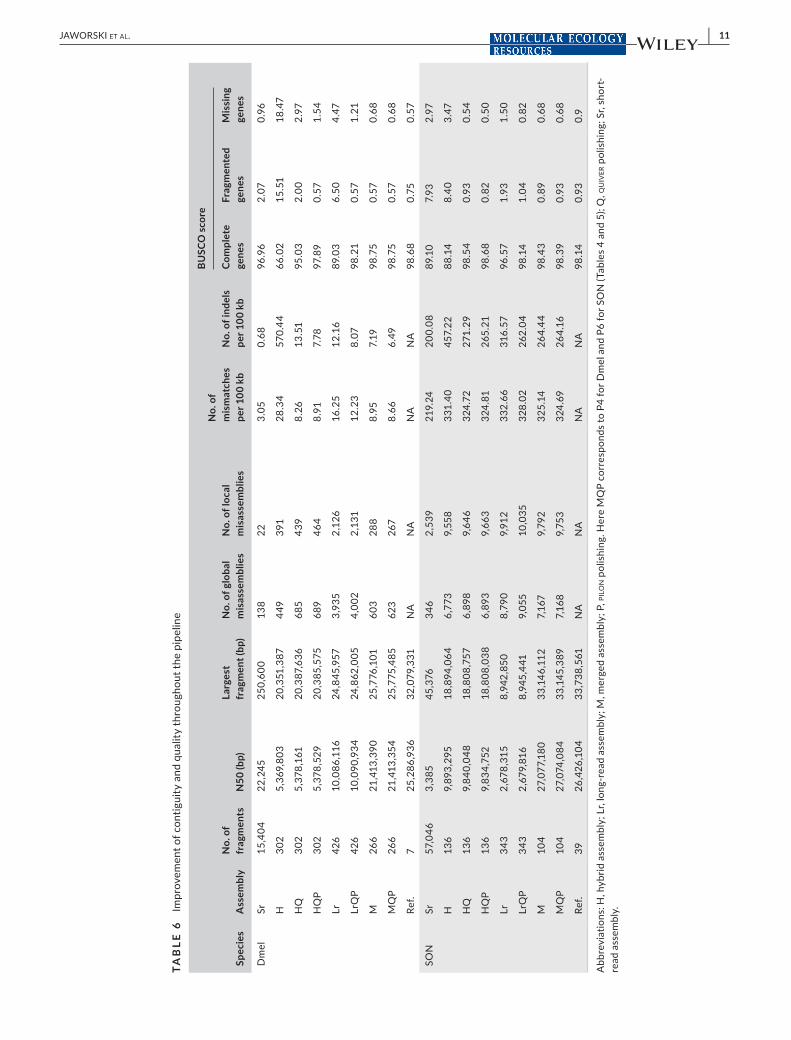
Comparisons between assemblies and quality assessment were performed based on assembly statistics from quast version 4.6.2 (Gurevich et al., 2013) by comparing each assembly to a reference genome to estimate the number of global and local misassemblies as well as the number of mismatches and indels. For both general statis-tics (number of fragments, N50) and error rates (presented in Tables 4–6), we used contigs longer than 400 bp only, so as to run the pro-gram faster. We also calculated busco scores using the diptera (odb9) set of Benchmarking Universal Single-Copy Orthologs (Waterhouse et al., 2017). We used the reference genomes FB2017_01 and FB2015_02 (Drosophila 12 Genomes Consortium DG, 2007) re-leased on FlyBase (Thurmond et al., 2019) for Dmel and CAT, respec-tively. For SON, we used a template assembly constructed based on the Catalina reference genome (Allan & Matzkin, 2019b). For each data set, we extracted only the fragments that have been previously designated to chromosomes (i.e., for Dmel, the four chromosomes; and for SON and CAT, the 39 biggest scaffolds), so as to run qual-ity assessment faster. We are aware that using a template assembly as a reference for SON may introduce biases especially in terms of the number of misassemblies, due to the evolutionary history of the D. mojavensis populations (Matzkin, 2014) and therefore the results must be considered carefully. However, this provides a valid guide to make relative comparisons between assemblies created here. quast relies on mummer version 3.23 (nucmer aligner version 3.1; Kurtz et al., 2004) to align the assembly to the reference genome, and in-cludes metrics and methods from the gage assessment tool (Salzberg et al., 2012) and other tools.
Finally, assemblies were aligned to their reference genome using mummer4 (Marçais et al., 2018) and plotted against the reference ge-nome using dot (https://github.com/dnane xus/dot).
2.6 | Test of the dbg2olc pipeline with Nanopore long-reads
We tested the dbg2olc pipeline on the D. mojavensis population Catalina using Nanopore long-reads instead of PacBio long-reads with parameters optimized for SON: platanus short-read assembler; dbg2olc parameters MinOverlap 150; AdaptiveTh 0.020; KmerCov 2; MinLen 200; number of sparc iterations 2 or 3 (both tested: P6r” vs. P6fr”. For the canu assembly, we used the correctedError-Rate = 0.055 because lower rates resulted in incomplete genome (0.039:73.7%; 0.045:86.7%; 0.055:93.8%). For the merged assembly,
we used parameters as optimized for SON: the hybrid assembly as query; l = 1 Mb and lm = 10,000 bp (Table 3).
3 | RESULTS
3.1 | DNA preparation
The custom chloroform extraction led to a remarkable increase in the sizes of DNA fragments (light band between 30 and 120 kb, right panel, Figure 1) compared with standard extraction kits (left and middle panels, Figure 1) for which the majority of fragments were shorter than 30 kb. Long fragments in DNA libraries significantly in-crease DNA quantity output by PacBio sequencing (www.pacb.com).
3.2 | Optimization of the dbg2olc pipeline
3.2.1 | Short-read assembler
platanus and sparseassembler with a kmer size of 53 bp resulted in very similar assemblies; sparseassembler with a kmer size of 39 bp led to reduced contiguity; and applying two successive rounds of spar-seassembler with a kmer size of 53-bp did not improve the short-read assembly. In the final merged assemblies, the use of sparseassembler always led to a slight decrease in contiguity (comparing P3 to S3 and P6 to S6 for both Dmel and SON, Table 4). sparseassembler slightly reduced error rates but also BUSCO scores for Dmel, with limited effects for SON (Figure 3b). We also observed that differences in P6 and S6 for SON mainly resided in highly repetitive regions.
3.2.2 | dbg2olc parameters
We varied the dbg2olc parameters MinOverlap, AdaptiveTh, KmerCovTh and MinLen to simultaneously optimize the contiguity and quality of the final assembly. Misassemblies created during the first steps of the hybrid assemblies were overall not resolved later, which makes that step key to the optimization. P0 corresponds to the reference set of parameters used in Chakraborty et al. (2016).
MinOverlap had a major effect on final assemblies, with a major improvement of contiguity (reduced number of fragments, increased N50, increased length of longest fragment; Figure 3a,c) and of ac-curacy (reduced number of global and local misassemblies, reduced number of mismatches and indels; Figure 3b,d) as seen in the P0 ver-sus P3 and P1 versus P6 comparisons. This came at a cost of a slight decrease in BUSCO score for Dmel but not for SON. Only an in-crease of MinOverlap up to 150 (the maximum recommended value for more than 50 × coverage of PacBio reads) led to an optimal lower number of misassemblies (P2 vs. P6).
AdaptiveTh had little influence, except when MinOverlap was kept low: it decreased contiguity and accuracy (P2 vs. P0). For assem-blies with high MinOverlap, we found that P3 was less fragmented

| 13JAWORSKI et Al.
than P4, P5 or P6 for SON and P4 was the least fragmented for Dmel. P6 was the best compromise between contiguity and accuracy for SON, with the highest BUSCO score. P4 was the best compromise and with the highest BUSCO score for Dmel. Although coverage in both Illumina short-reads and PacBio long-reads was lower in SON than Dmel (Table 1), the quality of PacBio long-reads was higher (longer reads thanks to DNA extraction protocol, and more recent PacBio technology), which might have facilitated the better results with the more stringent AdaptiveTh.
High KmerCovTh values resulted in major global misassemblies in SON (assessed with Mummer plots, not shown), with the larg-est fragment longer than the theoretical longest fragment in the Reference assembly (P4y vs. P4 and P6y,x vs. P6). It also caused a slight increase in error rates and a slight decrease in BUSCO score. In Dmel, no major global misassembly was detected, but error rates were higher and BUSCO scores slightly lower. We recommend use of KmerCovTh = 2, especially when using high AdaptiveTh. Using ContigTh = 1 had similar effects (major global misassemblies; P6g vs. P6 for SON) than high KmerCovTh values.
Increased MinLen from 200 to 2,000 resulted in a slight increase in contiguity for both Dmel and SON (PX vs. PXa). Error rates and BUSCO scores were not notably different, unless MinLen was in-creased up to 5,000 in which case too many reads were parsed out, leading to higher error rates.
Increasing the number of sparc iterations from two to three al-lowed a higher contiguity of large fragments, although with little ef-fect on overall statistics.
The following parameters were used throughout the next op-timization step: short-read assembler: platanus; MinOverlap 150; AdaptiveTh 0.020 for SON, 0.010 for Dmel; KmerCov 2; MinLen 200; ContigTh 0; and number of sparc iterations 3.
3.2.3 | canu parameters
Increasing correctedErrorRate from 0.039 to 0.055 slightly in-creased the contiguity of the merged assembly (P4q vs. P4r for Dmel and P6q vs. P6r for SON; Table 5). However, it also increased error rates overall, and decreased the BUSCO complete genes score, es-pecially for SON.
3.2.4 | quickmerge parameters
The parameters used in quickmerge are shown in Table 3, and the results in Table 5. Using the long-read assembly as the Query as-sembly resulted in a strong decrease in contiguity compared with the opposite (P4s vs. P4q for Dmel and P6s vs. P6q for SON). It also
F I G U R E 3 Contiguity (a, d), error level (b, e) and BUSCO score (c, f) for Dmel (a–c) and SON (d–f) assemblies, at each step of the pipeline. Significantly larger values are printed above dashed lines. Assembly parameters are described in Table 6
Assemblies
N
50,
L
arge
st fr
agm
ent (
Mb)
0
5
10
15
20
25
30
Sr H HQ HQP Lr LrQP M MQP Ref
0
100
200
300
400
500
Num
ber
of fr
agm
ents
Dmel − Contiguity
15,404
Assemblies
Num
ber
of m
isas
sem
blie
s (*
1K):
glob
al,
lo
cal
0
1
2
3
4
Sr H HQ HQP Lr LrQP M MQP
0
5
10
15
20
25
30
35
Num
ber
of
m
ism
atch
es a
nd
i
ndel
s pe
r 10
0 K
B
Dmel − Accuracy
570.44
Assemblies
Bus
co s
core
(%
gen
es)
60
70
80
90
100
Sr H HQ HQP Lr LrQP M MQP
Dmel − BUSCO score
CompleteFragmentedMissing
Assemblies
N
50,
L
arge
st fr
agm
ent (
Mb)
0
5
10
15
20
25
30
35
Sr H HQ HQP Lr LrQP M MQP Ref
0
100
200
300
400
500
Num
ber
of fr
agm
ents
SON − Contiguity
57,046
Assemblies
Num
ber
of m
isas
sem
blie
s (*
1K):
glob
al,
lo
cal
0
2
4
6
8
10
Sr H HQ HQP Lr LrQP M MQP
200
250
300
350
400
450
Num
ber
of
m
ism
atch
es a
nd
i
ndel
s pe
r 10
0 K
B
SON − Accuracy
Assemblies
Bus
co s
core
(%
gen
es)
60
70
80
90
100
Sr H HQ HQP Lr LrQP M MQP
SON − BUSCO score
CompleteFragmentedMissing
(a) (b) (c)
(d) (e) (f)

14 | JAWORSKI et Al.
considerably increased error rates for both species, and slightly de-creased BUSCO complete gene score for SON.
We also tested the impact of the l and lm parameters. Using low lm with high l resulted in identical assemblies (P4p vs. P4 for Dmel and P6p vs. P6 for SON) because backbones were already parsed out due to high lm. Also, using lm = N50 or l = N50/2 resulted in identi-cal assemblies for Dmel. Otherwise, decreasing l resulted in a lower number of fragments but higher error rates. However, using a too high lm value would prevent smaller fragments from being merged.
3.2.5 | Polishing
Polishing with both quiver/arrow and pilon did not affect the con-tiguity (number of fragments, N50 and largest fragment; Table 6, Figure 3) for either species. Conversely, it significantly reduced the number of indels on hybrid, long-read and merged assemblies. The number of mismatches was also reduced to a lesser extent. One drawback was the increase in the number of misassemblies, except for the merged assembly. Finally, polishing increased the BUSCO score, especially on the hybrid assembly.
3.3 | Test of the dbg2olc pipeline with Nanopore long-reads
Compared with Miller et al. (2018a), the CAT merged assembly was more contiguous and with a higher BUSCO score, but with higher error rates (Table 5, P6r” versus. Ref. Miller), probably due to the multiple polishing steps performed by Miller et al. (2018a). Also note that we used raw, uncorrected Nanopore reads for the CAT hybrid assembly similar to the SON hybrid assembly with raw PacBio reads. Read correction before the hybrid assembly might help reduce error rates (e.g., using the Nanopore basecall guppy algorithm; Wick, Judd, & Holt, 2019). Compared with SON, CAT assemblies were less con-tiguous but with higher BUSCO scores (CAT-P6r” vs. SON-P6n” and CAT-P6fr” vs. SON-P6fn”). The assignments of SON-P6fn” scaffolds to Muller elements can be found in Supporting Information S1.
4 | DISCUSSION
4.1 | Optimized dbg2olc pipeline
We performed an optimization of the dbg2olc pipeline at each step, using both the model species D. melanogaster and a nonmodel cac-tophilic Drosophila, D. mojavensis (population Sonora). Based on our analysis, we make the following recommendations.
First, we were able to replicate the results of Chakraborty et al. (2016): our P0 assembly had similar contiguity as theirs with ~100× coverage although with lower error rates. The short-read as-sembler had little impact, but we recommend using platanus, which is especially designed for genomes with a high level of heterozygosity
(Kajitani et al., 2014), and this is more likely in nonmodel organisms that have not been raised for many generations in the laboratory. Based on quast results and BUSCO scores, we found the follow-ing parameters to be optimal on our assembly for D. mojavensis: MinOverlap 150; AdaptiveTh 0.020; KmerCov 2; MinLen 200; ContigTh 0; number of sparc iterations 3 (SON assembly P6fn”). We also tested these parameters on the genomes of the other two D. mojavensis populations (from Baja California and Mojave Desert) and of two sibling species, D. arizonae and D. navojoa (L.M.M., unpub-lished data), and found that the most stringent value for MinOverlap and AdaptiveTh led to the best results, although AdaptiveTh had a smaller impact and its value may be safely reduced to 0.010, to be adjusted based on PacBio coverage. With these two parameters set to high values, we recommend not to increase KmerCovTh, MinLen and ContigTh because this would result in too many long-reads parsed out and we observed major misassemblies. Conversely, in-creasing sparc iterations, which is supposed to reduce the number of chimeras, had no negative effect. We found that with high PacBio read coverage, it is best to use the canu-correctedErrorRate as low as possible, to 0.039. This increases the contiguity and decreases errors in the long-read-only assembly. However, this is not always possible, and can cause the genome size to be shorter than ex-pected, as observed with the Nanopore reads. Finally, and similarly to Chakraborty et al. (2016), we recommend using the hybrid assem-bly as query and to adjust the quickmerge parameter l to an interme-diate value of 1 Mb, to prevent too many chimeric scaffolds while allowing smaller fragments to be merged. Note that BUSCO scores and general statistics can always be calculated even in the absence of a reference genome of a closely related species.
4.2 | Benefits of using the dbg2olc pipeline and demonstration of effectiveness on a nonmodel species
By merging hybrid and long-read-only assemblies, we considerably increased the contiguity compared with that of the hybrid assem-bly or the long-read-only assembly (Table 6, Figure 3), as shown in Chakraborty et al. (2016). Also, error rates were lower than the long-read assembly, especially for Dmel. To obtain such low error rates with long-read data only, a higher coverage would have been necessary representing a significant increase in sequencing cost (discussed in Chakraborty et al., 2016). For this study the D. mo-javensis Illumina sequencing was performed in 2011: if using cur-rent sequencing core prices this would total ~ $178 (PE 150 HiSeq lane ~$1,300 [only 1/12th of a lane needed for the 160-Mb D. mo-javensis genome]; quality control of library $15; library preparation $50–$400 [depending if done in-house or by a core]). The PacBio sequencing was performed using a Sequel system, totalling $3,190 (library preparation $495 × 2 libraries; SMRT cells $1,100 × 2). Given the recent release of PacBio's Sequel II system, the cost for a similar amount of long-reads would be ~$740 (library preparation ~$450, SMRT cell $1,750 [would only need 1/6th of a cell for D. mojavensis]),
| 15JAWORSKI et Al.
and therefore the de novo assembly described in this study could be built for less than $1,000.
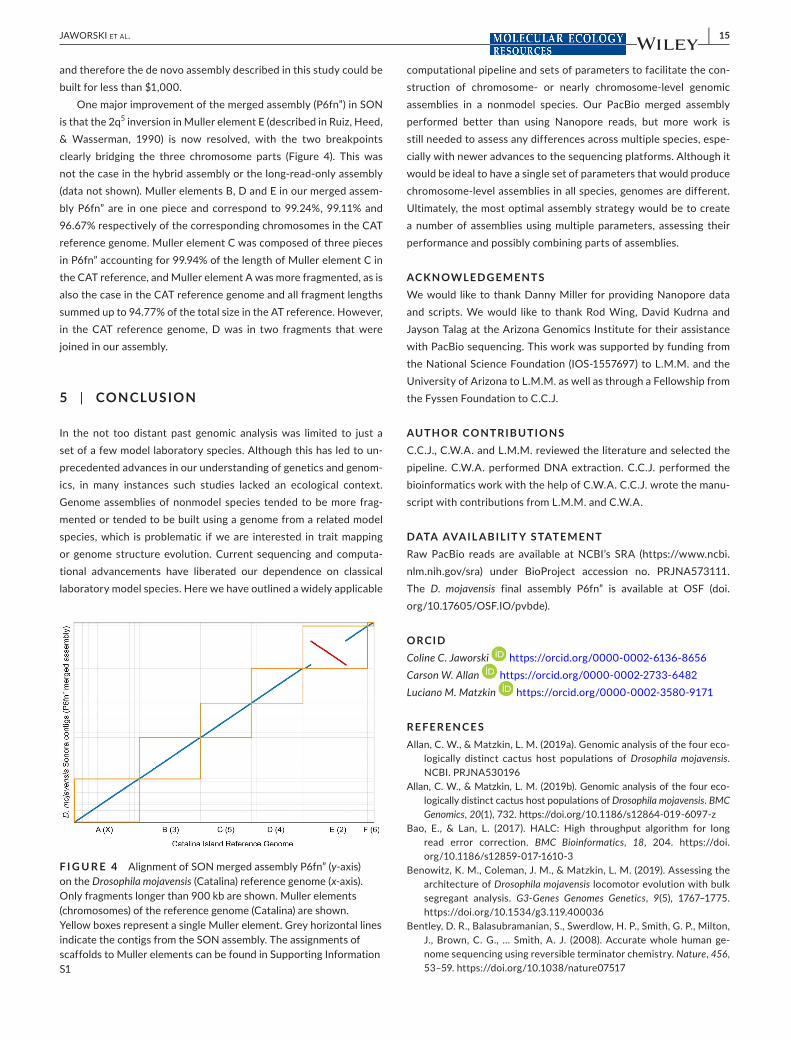
One major improvement of the merged assembly (P6fn”) in SON is that the 2q5 inversion in Muller element E (described in Ruiz, Heed, & Wasserman, 1990) is now resolved, with the two breakpoints clearly bridging the three chromosome parts (Figure 4). This was not the case in the hybrid assembly or the long-read-only assembly (data not shown). Muller elements B, D and E in our merged assem-bly P6fn” are in one piece and correspond to 99.24%, 99.11% and 96.67% respectively of the corresponding chromosomes in the CAT reference genome. Muller element C was composed of three pieces in P6fn” accounting for 99.94% of the length of Muller element C in the CAT reference, and Muller element A was more fragmented, as is also the case in the CAT reference genome and all fragment lengths summed up to 94.77% of the total size in the AT reference. However, in the CAT reference genome, D was in two fragments that were joined in our assembly.
5 | CONCLUSION
In the not too distant past genomic analysis was limited to just a set of a few model laboratory species. Although this has led to un-precedented advances in our understanding of genetics and genom-ics, in many instances such studies lacked an ecological context. Genome assemblies of nonmodel species tended to be more frag-mented or tended to be built using a genome from a related model species, which is problematic if we are interested in trait mapping or genome structure evolution. Current sequencing and computa-tional advancements have liberated our dependence on classical laboratory model species. Here we have outlined a widely applicable
computational pipeline and sets of parameters to facilitate the con-struction of chromosome- or nearly chromosome-level genomic assemblies in a nonmodel species. Our PacBio merged assembly performed better than using Nanopore reads, but more work is still needed to assess any differences across multiple species, espe-cially with newer advances to the sequencing platforms. Although it would be ideal to have a single set of parameters that would produce chromosome-level assemblies in all species, genomes are different. Ultimately, the most optimal assembly strategy would be to create a number of assemblies using multiple parameters, assessing their performance and possibly combining parts of assemblies.
ACKNOWLEDG EMENTSWe would like to thank Danny Miller for providing Nanopore data and scripts. We would like to thank Rod Wing, David Kudrna and Jayson Talag at the Arizona Genomics Institute for their assistance with PacBio sequencing. This work was supported by funding from the National Science Foundation (IOS-1557697) to L.M.M. and the University of Arizona to L.M.M. as well as through a Fellowship from the Fyssen Foundation to C.C.J.
AUTHOR CONTRIBUTIONSC.C.J., C.W.A. and L.M.M. reviewed the literature and selected the pipeline. C.W.A. performed DNA extraction. C.C.J. performed the bioinformatics work with the help of C.W.A. C.C.J. wrote the manu-script with contributions from L.M.M. and C.W.A.
DATA AVAIL ABILIT Y S TATEMENTRaw PacBio reads are available at NCBI’s SRA (https://www.ncbi.nlm.nih.gov/sra) under BioProject accession no. PRJNA573111. The D. mojavensis final assembly P6fn” is available at OSF (doi.org/10.17605/OSF.IO/pvbde).
ORCIDColine C. Jaworski https://orcid.org/0000-0002-6136-8656 Carson W. Allan https://orcid.org/0000-0002-2733-6482 Luciano M. Matzkin https://orcid.org/0000-0002-3580-9171
R E FE R E N C E SAllan, C. W., & Matzkin, L. M. (2019a). Genomic analysis of the four eco-
logically distinct cactus host populations of Drosophila mojavensis. NCBI. PRJNA530196
Allan, C. W., & Matzkin, L. M. (2019b). Genomic analysis of the four eco-logically distinct cactus host populations of Drosophila mojavensis. BMC Genomics, 20(1), 732. https://doi.org/10.1186/s1286 4-019-6097-z
Bao, E., & Lan, L. (2017). HALC: High throughput algorithm for long read error correction. BMC Bioinformatics, 18, 204. https://doi.org/10.1186/s1285 9-017-1610-3
Benowitz, K. M., Coleman, J. M., & Matzkin, L. M. (2019). Assessing the architecture of Drosophila mojavensis locomotor evolution with bulk segregant analysis. G3-Genes Genomes Genetics, 9(5), 1767–1775. https://doi.org/10.1534/g3.119.400036
Bentley, D. R., Balasubramanian, S., Swerdlow, H. P., Smith, G. P., Milton, J., Brown, C. G., … Smith, A. J. (2008). Accurate whole human ge-nome sequencing using reversible terminator chemistry. Nature, 456, 53–59. https://doi.org/10.1038/natur e07517
F I G U R E 4 Alignment of SON merged assembly P6fn” (y-axis) on the Drosophila mojavensis (Catalina) reference genome (x-axis). Only fragments longer than 900 kb are shown. Muller elements (chromosomes) of the reference genome (Catalina) are shown. Yellow boxes represent a single Muller element. Grey horizontal lines indicate the contigs from the SON assembly. The assignments of scaffolds to Muller elements can be found in Supporting Information S1

16 | JAWORSKI et Al.
Bono, J. M., Matzkin, L. M., Kelleher, E. S., & Markow, T. A. (2011). Postmating transcriptional changes in reproductive tracts of con- and heterospecifically mated Drosophila mojavensis females. Proceedings of the National Academy of Sciences, 108(19), 7878–7883. https://doi.org/10.1073/pnas.11003 88108
Carvalho, A. B., Dupim, E. G., & Goldstein, G. (2016). Improved assem-bly of noisy long reads by k-mer validation. Genome Research, 26, 1710–1720.
Chakraborty, M., Baldwin-Brown, J. G., Long, A. D., & Emerson, J. J. (2016). Contiguous and accurate de novo assembly of metazoan ge-nomes with modest long read coverage. Nucleic Acids Research, 44, e147.
Chin, C.-S., Alexander, D. H., Marks, P., Klammer, A. A., Drake, J., Heiner, C., … Korlach, J. (2013). Nonhybrid, finished microbial genome as-semblies from long-read SMRT sequencing data. Nature Methods, 10, 563–569. https://doi.org/10.1038/nmeth.2474
Coleman, J. M., Benowitz, K. M., Jost, A. G., & Matzkin, L. M. (2018). Behavioral evolution accompanying host shifts in cactophilic Drosophila larvae. Ecology & Evolution, 8, 6921–6931.
Drosophila 12 Genomes Consortium (2007). Evolution of genes and ge-nomes on the Drosophila phylogeny. Nature, 450, 203–218.
Ellegren, H. (2014). Genome sequencing and population genomics in non-model organisms. Trends in Ecology & Evolution, 29, 51–63. https://doi.org/10.1016/j.tree.2013.09.008
Grüning, D., Dale, R., Sjödin, A., Chapman, B. A., Rowe, J., Tomkins-Tinch, C. H., … Team, T. B. (2018). Bioconda: Sustainable and comprehensive software distribution for the life sciences. Nature Methods, 15, 475–476. https://doi.org/10.1038/s4159 2-018-0046-7
Gurevich, A., Saveliev, V., Vyahhi, N., & Tesler, G. (2013). quast: Quality assessment tool for genome assemblies. Bioinformatics, 29, 1072. https://doi.org/10.1093/bioin forma tics/btt086
Heed, W. B. (1978). Ecology and genetics of Sonoran desert Drosophila. In P. F. Brussard (Ed.), Ecological genetics: The interface (pp. 109–126). Berlin, Germany: Springer-Verlag.
Holt, J. M., Wang, J. R., Jones, C. D., & McMillan, L. (2016). Improved long read correction for de novo assembly using an FM-index. BioRxiv.https://doi.org/10.1101/067272
Hu, R., Sun, G., & Sun, X. (2016). LSCplus: A fast solution for improving long read accuracy by short read alignment. BMC Bioinformatics, 17, 451. https://doi.org/10.1186/s1285 9-016-1316-y
Kajitani, R., Toshimoto, K., Noguchi, H., Toyoda, A., Ogura, Y., Okuno, M., … Itoh, T. (2014). Efficient de novo assembly of highly heterozy-gous genomes from whole-genome shotgun short reads. Genome Research, 24, 1384–1395. https://doi.org/10.1101/gr.170720.113
Kim, K. E., Peluso, P., Babayan, P., Yeadon, P. J., Yu, C., Fisher, W. W., … Landolin, J. M. (2014). Long-read, whole-genome shotgun sequence data for five model organisms. Scientific Data, 1, 140045. https://doi.org/10.1038/sdata.2014.45
Koren, S., Walenz, B. P., Berlin, K., Miller, J. R., Bergman, N. H., & Phillippy, A. M. (2017). Canu: Scalable and accurate long-read assembly via adaptive k-mer weighting and repeat separation. Genome Research, 27, 722–736.
Kurtz, S., Phillippy, A., Delcher, A. L., Smoot, M., Shumway, M., Antonescu, C., & Salzberg, S. L. (2004). Versatile and open software for compar-ing large genomes. Genome Biology, 5, R12.
Langmead, B., Trapnell, C., Pop, M., & Salzberg, S. L. (2009). Ultrafast and memory-efficient alignment of short DNA sequences to the human genome. Genome Biology, 10, R25. https://doi.org/10.1186/gb-2009-10-3-r25
Li, H, & Durbin, R (2010). Fast and accurate long-read alignment with Burrows-Wheeler Transform. Bioinformatics, 26, 589–595. https://doi.org/10.1093/bioin forma tics/btp698
Marçais, G., Delcher, A. L., Phillippy, A. M., Coston, R., Salzberg, S. L., & Zimin, A. (2018). MUMmer4: A fast and versatile genome alignment
system. PLoS Computational Biology, 14, e1005944. https://doi.org/10.1371/journ al.pcbi.1005944
Matzkin, L. M. (2014). Ecological genomics of host shifts in Drosophila mo-javensis. Advances in Experimental Medicine and Biology, 781, 233–247.
Matzkin, L. M., Watts, T. D., Bitler, B. G., Machado, C. A., & Markow, T. A. (2006). Functional genomics of cactus host shifts in Drosophila mojavensis. Molecular Ecology, 15, 4635–4643. https://doi.org/10.1111/j.1365-294X.2006.03102.x
Miclotte, G., Heydari, M., Demeester, P., Rombauts, S., Van de Peer, Y., Audenaert, P., & Fostier, J. (2016). jabba: Hybrid error correction for long sequencing reads. Algorithms for Molecular Biology, 11, 10. https://doi.org/10.1186/s1301 5-016-0075-7
Miller, D. E., Staber, C., Zeitlinger, J., & Hawley, R. S. (2018a). Highly con-tiguous genome assemblies of 15 Drosophila species generated using Nanopore sequencing. G3: Genes, Genomes, Genetics, 8, 3131–3141.
Miller, D. E., Staber, C., Zeitlinger, J., & Hawley, R. S. (2018) WGS of Drosophila mojavensis males from stock 15081–1352.22. NCBI. SRR6425997.
Rhoads, A., & Au, K. F. (2015). PacBio sequencing and its applications. Genomics, Proteomics & Bioinformatics, 13, 278–289. https://doi.org/10.1016/j.gpb.2015.08.002
Rudman, S. M., Barbour, M. A., Csilléry, K., Gienapp, P., Guillaume, F., Hairston Jr, N. G., … Levine, J. M. (2018). What genomic data can reveal about eco-evolutionary dynamics. Nature Ecology & Evolution, 2, 9–15. https://doi.org/10.1038/s4155 9-017-0385-2
Ruiz, A., Heed, W. B., & Wasserman, M. (1990). Evolution of the mojaven-sis cluster of cactophilic Drosophila with descriptions of two new spe-cies. Journal of Heredity, 81, 30–42. https://doi.org/10.1093/oxfor djour nals.jhered.a110922
Salmela, L., & Rivals, E. (2014). lordec: Accurate and efficient long read error correction. Bioinformatics, 30, 3506–3514. https://doi.org/10.1093/bioin forma tics/btu538
Salzberg, S. L., Phillippy, A. M., Zimin, A., Puiu, D., Magoc, T., Koren, S., … Yorke, J. A. (2012). gage: A critical evaluation of genome assemblies and assembly algorithms. Genome Research, 22, 557–567. https://doi.org/10.1101/gr.131383.111
Schaeffer, S. W., Bhutkar, A., McAllister, B. F., Matsuda, M., Matzkin, L. M., O'Grady, P. M., … Kaufman, T. C. (2008). Polytene chromosomal maps of 11 Drosophila species: The order of genomic scaffolds in-ferred from genetic and physical maps. Genetics, 179(3), 1601–1655. https://doi.org/10.1534/genet ics.107.086074
Simpson, J. T., Workman, R. E., Zuzarte, P. C., David, M., Dursi, L. J., & Timp, W. (2017). Detecting DNA cytosine methylation using nanopore sequencing. Nature Methods, 14, 407. https://doi.org/10.1038/nmeth.4184
Thurmond, J., Goodman, J. L., Strelets, V. B., Attrill, H., Gramates, L. S., & Marygold, S. J. … & the FlyBase Consortium (2019). flybase 2.0: The next generation. Nucleic Acids Research, 47, D759–D765.
Urban, J. M., Bliss, J., Lawrence, C. E., & Gerbi, S. A. (2015) Sequencing ultra-long DNA molecules with the Oxford Nanopore MinION. bioRxiv.
Walker, B. J., Abeel, T., Shea, T., Priest, M., Abouelliel, A., Sakthikumar, S., … Earl, A. M. (2014). Pilon: An integrated tool for comprehensive mi-crobial variant detection and genome assembly improvement. PLoS ONE, 9, 1–14. https://doi.org/10.1371/journ al.pone.0112963
Waterhouse, R. M., Seppey, M., Simão, F. A., Manni, M., Ioannidis, P., Klioutchnikov, G., … Zdobnov, E. M. (2017). busco applications from quality assessments to gene prediction and phylogenomics. Molecular Biology and Evolution, 35, 543–548. https://doi.org/10.1093/molbe v/msx319
Wick, R. R., Judd, L. M., & Holt, K. E. (2019). Performance of neural net-work basecalling tools for Oxford Nanopore sequencing. Genome Biology, 20, 129. https://doi.org/10.1186/s1305 9-019-1727-y
Xiao, C.-L., Chen, Y., Xie, S.-Q., Chen, K.-N., Wang, Y., Han, Y., … Xie, Z. (2017). MECAT: Fast mapping, error correction, and de novo

| 17JAWORSKI et Al.
assembly for single-molecule sequencing reads. Nature Methods, 14, 1072–1074. https://doi.org/10.1038/nmeth.4432
Ye, C., Hill, C. M., Wu, S., Ruan, J., & Ma, Z. S. (2016). dbg2olc: Efficient assembly of large genomes using long erroneous reads of the third generation sequencing technologies. Scientific Reports, 6, 31900. https://doi.org/10.1038/srep3 1900
Ye, C., & Ma, Z. S. (2016). Sparc: A sparsity-based consensus algorithm for long erroneous sequencing reads. PeerJ, 4, e2016. https://doi.org/10.7717/peerj.2016
Ye, C., Ma, Z. S., Cannon, C. H., Pop, M., & Yu, D. W. (2012). Exploiting sparseness in de novo genome assembly. BMC Bioinformatics, 13, S1. https://doi.org/10.1186/1471-2105-13-S6-S1
SUPPORTING INFORMATIONAdditional supporting information may be found online in the Supporting Information section.
How to cite this article: Jaworski CC, Allan CW, Matzkin LM. Chromosome-level hybrid de novo genome assemblies as an attainable option for nonmodel insects. Mol Ecol Resour. 2020;00:1–17. https://doi.org/10.1111/1755-0998.13176