Christopher W. Landsea*, Andrew Hagen**, William ... · On-line Supplement for . A Reanalysis of...
32
On-line Supplement for A Reanalysis of the 1931 to 1943 Atlantic Hurricane Database Christopher W. Landsea*, Andrew Hagen**, William Bredemeyer**, Cristina Carrasco**, David A. Glenn***, Adrian Santiago**, Donna Strahan-Sakoskie****, and Michael Dickinson***** *NOAA/NWS/NCEP/National Hurricane Center, Miami, Florida, USA; **University of Miami, Miami, Florida, USA; ***NOAA/NWS/WFO Morehead City, Morehead City, North Carolina, USA; University of North Carolina at Charlotte, Charlotte, North Carolina, USA; Accurate Environmental Forecasting, Narragansett, Rhode Island, USA Submitted to Journal of Climate 12 August, 2013 1
Transcript of Christopher W. Landsea*, Andrew Hagen**, William ... · On-line Supplement for . A Reanalysis of...

On-line Supplement for
A Reanalysis of the 1931 to 1943 Atlantic Hurricane Database
Christopher W. Landsea*, Andrew Hagen**, William Bredemeyer**, Cristina Carrasco**, David A. Glenn***,
Adrian Santiago**, Donna Strahan-Sakoskie****, and Michael Dickinson*****
*NOAA/NWS/NCEP/National Hurricane Center, Miami, Florida, USA; **University of Miami, Miami,
Florida, USA; ***NOAA/NWS/WFO Morehead City, Morehead City, North Carolina, USA; University of
North Carolina at Charlotte, Charlotte, North Carolina, USA; Accurate Environmental Forecasting,
Narragansett, Rhode Island, USA
Submitted to Journal of Climate
12 August, 2013
1

1. Metadata file, Best Track Change Committee correspondence, and raw observations examples – the
1938 Great Atlantic Hurricane
All Atlantic basin tropical storms and hurricanes in the new best track database are accompanied by a
“metadata file”. This file consists of a day-by-day listing of peak meteorological observations and previous
estimates of the storm’s position and intensity. The metadata also contains a descriptive paragraph about the
particular methodology employed for making changes in the genesis, track, intensity and decay of that TC
including what sources were crucial for revising the best track, whether or not a wind-pressure relationship was
utilized, if wind decay models were used for inland wind estimates, and any other pertinent information. All of
the tropical storms and hurricanes for the period of 1931 to 1943 are considered “UNNAMED”. However,
many of these storms have been recognized by various informal names. These are included in the metadata file
when at all possible. The following is an example of a single metadata entry for Storm #6, 1938 – the "Great
New England Hurricane". After the metadata, the Comments from and Replies to the Best Track Change
Committee for this single hurricane are provided. Table A1 indicate significant (hurricane force and greater)
reports collected for this system and made available in the raw observations database.
Storm #6, 1938 (The Great New England Hurricane) Metadata
1938 Storm 6 (originally Storm 4) – Revised in 2012
29185 09/10/1938 M=13 4 SNBR= 647 NOT NAMED XING=1 SSS=3 29185 09/09/1938 M=15 6 SNBR= 647 NOT NAMED XING=1 SSS=3 ** ** * (The 9th is new to HURDAT.) 29190 09/09* 0 0 0 0* 0 0 0 0*128 194 30 0*130 206 30 0 29190 09/10* 0 0 0 0*142 215 35 0*144 238 35 0*146 250 35 0 29190 09/10*132 218 30 0*134 230 35 0*136 242 40 0*138 253 40 0 *** *** ** *** *** *** *** ** *** *** ** 29195 09/11*148 262 35 0*149 274 35 0*150 285 35 0*152 297 35 0 29195 09/11*140 263 45 0*142 274 45 0*145 285 45 0*147 297 45 0 *** *** ** *** ** *** ** *** ** 29200 09/12*153 310 40 0*154 324 40 0*155 337 40 0*156 348 40 0 29200 09/12*149 310 45 0*152 324 45 0*155 337 45 0*159 347 45 0
2
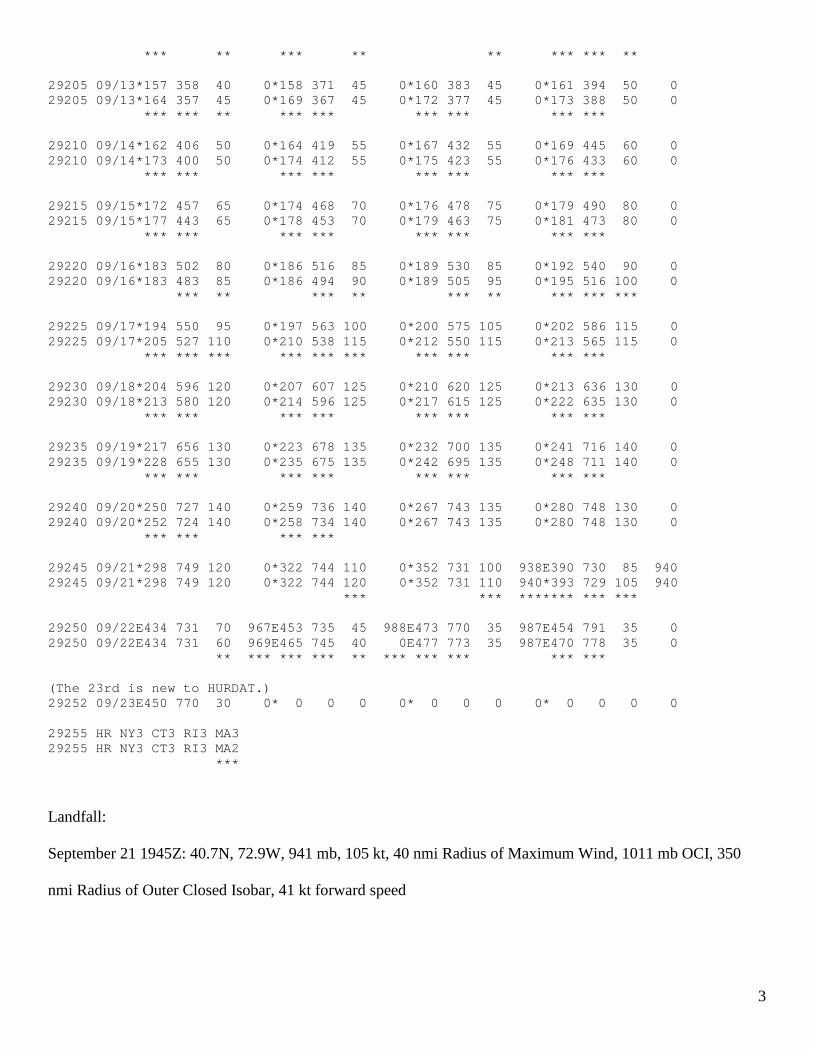
*** ** *** ** ** *** *** ** 29205 09/13*157 358 40 0*158 371 45 0*160 383 45 0*161 394 50 0 29205 09/13*164 357 45 0*169 367 45 0*172 377 45 0*173 388 50 0 *** *** ** *** *** *** *** *** *** 29210 09/14*162 406 50 0*164 419 55 0*167 432 55 0*169 445 60 0 29210 09/14*173 400 50 0*174 412 55 0*175 423 55 0*176 433 60 0 *** *** *** *** *** *** *** *** 29215 09/15*172 457 65 0*174 468 70 0*176 478 75 0*179 490 80 0 29215 09/15*177 443 65 0*178 453 70 0*179 463 75 0*181 473 80 0 *** *** *** *** *** *** *** *** 29220 09/16*183 502 80 0*186 516 85 0*189 530 85 0*192 540 90 0 29220 09/16*183 483 85 0*186 494 90 0*189 505 95 0*195 516 100 0 *** ** *** ** *** ** *** *** *** 29225 09/17*194 550 95 0*197 563 100 0*200 575 105 0*202 586 115 0 29225 09/17*205 527 110 0*210 538 115 0*212 550 115 0*213 565 115 0 *** *** *** *** *** *** *** *** *** *** 29230 09/18*204 596 120 0*207 607 125 0*210 620 125 0*213 636 130 0 29230 09/18*213 580 120 0*214 596 125 0*217 615 125 0*222 635 130 0 *** *** *** *** *** *** *** *** 29235 09/19*217 656 130 0*223 678 135 0*232 700 135 0*241 716 140 0 29235 09/19*228 655 130 0*235 675 135 0*242 695 135 0*248 711 140 0 *** *** *** *** *** *** *** *** 29240 09/20*250 727 140 0*259 736 140 0*267 743 135 0*280 748 130 0 29240 09/20*252 724 140 0*258 734 140 0*267 743 135 0*280 748 130 0 *** *** *** *** 29245 09/21*298 749 120 0*322 744 110 0*352 731 100 938E390 730 85 940 29245 09/21*298 749 120 0*322 744 120 0*352 731 110 940*393 729 105 940 *** *** ******* *** *** 29250 09/22E434 731 70 967E453 735 45 988E473 770 35 987E454 791 35 0 29250 09/22E434 731 60 969E465 745 40 0E477 773 35 987E470 778 35 0 ** *** *** *** ** *** *** *** *** *** (The 23rd is new to HURDAT.) 29252 09/23E450 770 30 0* 0 0 0 0* 0 0 0 0* 0 0 0 0 29255 HR NY3 CT3 RI3 MA3 29255 HR NY3 CT3 RI3 MA2 ***
Landfall:
September 21 1945Z: 40.7N, 72.9W, 941 mb, 105 kt, 40 nmi Radius of Maximum Wind, 1011 mb OCI, 350
nmi Radius of Outer Closed Isobar, 41 kt forward speed
3

September 21 2040Z: 41.3N, 72.9W, 946 mb, 100 kt, 40 nmi Radius of Maximum Wind, 1011 mb OCI, 350
nmi Radius of Outer Closed Isobar, 41 kt forward speed
Major changes are made to the track and major alterations to the intensity shown in Neumann et al. (1999).
Evidence for these alterations comes from the Historical Weather Map series, Monthly Weather Review,
Original Monthly Records from NCDC, the COADS ship database, Tannehill (1938), Pierce (1939), Myers and
Jordan (1956), Dunn and Miller (1960), Schwerdt et al. (1979), Ho et al. (1987), Jarrell et al. (1992), Boose et
al. (2001), and Kaplan and DeMaria (2001).
September 9: HWM analyzes a trough extending west-southwest out of West Africa. HURDAT does not yet
list this system. No gales or low pressures.
September 10: HWM does not analyze a closed low on this day. HURDAT listed this as a 35 kt tropical storm
at 14.2N, 21.5W. Available observations suggest that the 40 kt tropical storm was centered at 13.6N, 24.3W.
Ship highlights: 30 kt ENE with 1009 mb at 12Z at 15.5N, 24.3W (COA); 25 kt NE with 1005 mb at 18Z at
14.2N, 26.7W (COA). Land highlights: No gales or low pressures in Cape Verde Islands.
September 11: HWM analyzes an open trough located at 15N, 27W on this day. HURDAT listed this as a 35 kt
tropical storm at 15.0N, 28.5W. Available observations suggest that the 45 kt tropical storm was centered at
14.5N, 28.5W. Ship highlights: 40 kt S at 1 UTC at 12.5N, 25.2W (COA); 35 kt SW with 1012 mb at 10 UTC
at 11.5N, 27.5W (COA). Land highlights: No gales or low pressures in Cape Verde Islands.
September 12: HWM does not analyze a closed low on this day. HURDAT listed this as a 40 kt tropical storm
at 15.5N, 33.7W. Available observations suggest that the 45 kt tropical storm was centered at 15.5N, 33.7W.
Ship highlights: No gales or low pressures.
4

September 13: HWM does not analyze a closed low on this day. HURDAT listed this as a 45 kt tropical storm
at 16.0N, 38.3W. Available observations suggest that the 45 kt tropical storm was centered at 17.0N, 33.7W.
Ship highlights: No gales or low pressures due to lack of ships in the area. “There was some evidence of
cyclonic circulation central about 19N, 37W, on the morning of September 13, 1938, but the storm has not been
definitely charted prior to the evening of September 16, when it appears to have become a full developed
hurricane" (1938 MWR).
September 14: HWM does not analyze a closed low on this day. HURDAT listed this as a 55 kt tropical storm
at 16.7N, 43.2W. Available observations suggest that the 55 kt tropical storm was centered at 17.2N, 42.3W.
Ship highlights: No gales or low pressures due to lack of ships in the area.
September 15: HWM does not analyze a closed low on this day. HURDAT listed this as a 75 kt hurricane at
17.6N, 47.8W. Available observations suggest that the 75 kt hurricane was centered at 17.9N, 46.3W. Ship
highlights: No gales or low pressures due to lack of ships in the area.
September 16: HWM analyzes a closed low of at most 1010 mb centered near 22.5N, 50.0W. HURDAT listed
this as an 85 kt hurricane at 18.9N, 53.0W. Available observations suggest that the 95 kt hurricane was
centered at 18.9N, 50.5W. Ship highlights: 20 kt NW with 1006 mb at 15Z at 18.9N, 50.6W (COA); 30 kt ENE
with 1012 mb at 18Z at 23.8N, 51.5W (COA). Regarding the intensity: "There was some evidence of cyclonic
circulation central about 19N, 37W, on the morning of September 13, 1938, but the storm has not been
definitely charted prior to the evening of September 16, when it appears to have become a full developed
hurricane. At about 9:30 p.m., ships time, on September 16 [September 17 at 0130 UTC], the Brazilian S.S.
Alegrete was near the center in approximately 21 12 N., 52 46 W., barometer 28.31 (uncorrected) [958 mb],
wind force 12 [70 kt], shifting from east-northeast to east-southeast” (1938 MWR).
5

September 17: HWM analyzes a closed low of at most 995 mb centered near 21.5N, 54W. HURDAT listed this
as a 105 kt hurricane at 20.0N, 57.5W. The MWR Track of the Hurricane of September 16-22, 1938 (Chart IX)
shows a center near 21N, 55.2W at 12 UTC on this day. Available observations suggest that the 115 kt
hurricane was centered at 21.2N, 55.0W. Ship highlights: 70 kt ENE with 958 mb at 0130Z at 21.2N, 52.8W
(MWR); 45 kt NE and 996 mb at 12 UTC at 22.5N, 54.7W (HWM); 35 kt NE and 1012 mb at 16 UTC at
23.5N, 57.5W (COA); 45 kt NE and 1008 mb at 20 UTC at 22.5N, 58.5W (COA). Regarding the intensity:
"Early on the morning of September 17, the Netherlands S.S. Socrates encountered the storm while near 21N,
59W, and had increasing winds, backing from east-northeast to northwest and then to west-southwest, lowest
barometer 29.29 inches [992 mb]" (1938 MWR).
September 18: HWM analyzes a closed low of at most 995 mb centered near 21.5N, 61W. HURDAT listed this
as a 125 kt hurricane at 21.0N, 62.0W. The MWR Track of the Hurricane of September 16-22, 1938 (Chart IX)
shows a center near 21.2N, 58W at 0 UTC. The MWR Track of the Hurricane of September 16-22, 1938 (Chart
IX) shows a center near 21.5N, 62W at 12 UTC. Available observations suggest that the 125 kt hurricane was
centered at 21.7N, 61.5W. Ship highlights: 60 kt ENE and 1003 mb at 0 UTC at 22.5N, 58.5W (COA); 60 kt W
with 992 mb at 0135Z at 20.6N, 59.3W (MWR); 50 kt E and 1011 mb at 8 UTC at 22.5N, 58.5W (COA); 35 kt
NW-W and 1004 mb at 20 UTC at 21.2N, 66.3W (MWR Robin Goodfellow); 945 mb (time and location
unknown) (MWR). "The highest wind experienced [by British S.S. Socrates] was W-11 [60 kt] at 9:35 p.m.
[September 18 at 0035 UTC], ships time, in latitude 20 38 N, longitude 59 17 W" (1938 MWR). Regarding the
intensity: "A vessel reporting by radio gave [a] barometer reading[s] below 28 inches, the British S.S. Corrales,
27.90 inches [945 mb] on the 18th" (1938 MWR).
September 19: HWM analyzes a closed low of at most 990 mb centered near 24.5N, 70W. HURDAT listed
this as a 135 kt hurricane at 23.2N, 70.0W. The MWR Track of the Hurricane of September 16-22, 1938 (Chart
IX) shows a center near 21.8N, 65.5W at 0 UTC. The MWR Track of the Hurricane of September 16-22, 1938
(Chart IX) shows a center near 23.7N, 70.2W at 12 UTC. Available observations suggest that the 135 kt 6

hurricane was centered at 24.2N, 69.5W. Ship highlights: 35 kt NE and 1005 mb at 2 UTC at 28.4N, 69.3W
(MWR Pan America); 35 kt W and 1001 mb at 9 UTC at 23.6N, 73.8W (COA); 50 kt NE and 988 mb at 12
UTC at 25.7N, 70.0W (COA); 70 kt E and 982 mb at 14 UTC at 25.5N, 69.9W (MWR Gulfhawk); 45 kt SSW
and 1006 mb at 15 UTC at 24.3N, 72.7W (COA); 35 kt SE and 1006 mb at 18 UTC at 23.5N, 69.5W (COA); 45
kt NE and 1007 mb at 21 UTC at 27.4N, 73.4W (COA); 45 kt NE and 1007 mb at 21 UTC at 27.0N, 73.0W
(COA); 35 kt S with 1007 mb at 21 UTC at 25.6N, 72.8W (COA); 35 kt ENE and 1006 mb at 22 UTC at 27.2N,
74.1W (COA).
September 20: HWM analyzes a closed low of at most 990 mb centered near 27.5N, 75W. HURDAT listed this
as a 135 kt hurricane at 26.7N, 74.3W. The MWR Track of the Hurricane of September 16-22, 1938 shows a
center near 25.2N, 73W at 0 UTC. The MWR Track of the Hurricane of September 16-22, 1938 (Chart IX)
shows a center near 28.8N, 75.2W at 12 UTC. Available observations suggest that the 135 kt hurricane was
centered at 26.7N, 74.3W. Ship Highlights: 65 kt NE at 2 UTC at 26.3N, 74.2W (COA); 50 kt E and 986 at 5
UTC at 33.4N, 74.4W (COA); 50 kt SW at 6 UTC at 26.0N, 74.1W (COA); 70 kt SSE and 992 mb at 9 UTC at
27.8N, 72.6W (MWR Jean Lafitte); 45 kt NE and 956 mb at 9 UTC at 27.1N, 73.9W (MWR Antigua); 70 kt E
and 1005 mb at 9 UTC at 27.4N, 72.4W (COA); 70 kt E and 953 mb at 12 UTC at 27.1N, 74.6W (MWR
Atlantida); 50 kt SE and 1008 mb at 12 UTC at 27.6N, 72.6W (HWM); 60 kt S at 12 UTC at 25.6N, 73.9W
(COA); 70 kt SSE and 986 mb at 12 UTC at 27.6N, 73.8W (COA); 60 kt SE and 980 mb at 12 UTC at 27.8N,
72.5W (COA); 70 kt SSE and 995 mb at 12 UTC at 27.8N, 72.5W (COA); 50 kt SE and 1009 mb at 13Z at
27.4N, 72.4W (COA); 55 kt SE and 1009 mb at 13Z 27.0N, 72.0W (COA); 70 kt S and 976 mb at 15 UTC at
27.6N, 74.0W (MWR Phobos); 70 kt ENE and 950 mb at 23 UTC at 30.0N, 75.7W (MWR India Arrow); 943
mb (time and location unknown) (MWR). Several gales of 35 kt-45 kt observed. Regarding the intensity: "a
vessel reporting by radio gave a barometer reading below 28 inches...the British S. S. Carinthia, 27.85 [943 mb]
on the 20th" (MWR).
7

September 21: HWM analyzes an extratropical closed low of at most 990 mb centered near 37.5N, 74.5W
attached to a N-S cold front. HURDAT listed this as a 100 kt hurricane at 35.2N, 74.4W. The MWR Track of
the Hurricane of September 16-22, 1938 (Chart IX) shows a center near 30.2N, 76.0 W at 0 UTC. The MWR
Track of the Hurricane of September 16-22, 1938 (Chart IX) shows a center near 35.5N, 75.0W at 12 UTC.
Available observations suggest that the 110 kt hurricane was centered at 35.2N, 73.1W. Ship highlights: 60 kt S
and 1005 mb at 4 UTC at 30.5N, 72.5W (MWR); 70 kt W and 954 mb at 9 UTC at 33.4N, 74.4W (COA); 60 kt
N and 969 mb at 15Z at 36.2N, 74.6W (MWR); 70 kt SE and 952 mb at 17 or 18 UTC at 38.9N, 72.0W (MWR
Birmingham City); 70 kt NW and 970 mb at 17Z or 18Z at 39.3N, 73.8W (MWR Stewart); 45 kt NW with 972
mb at 17 UTC at 38.2N, 74.5W (COA). Land highlights: 53 kt at 9 UTC at Hatteras, North Carolina at 35.3N,
75.6W (NCDC); 53 kt W with 982 mb at 17 UTC at Atlantic City, New Jersey at 39.4N, 74.5W (NCDC,
MWR); 40 kt SE at 17 UTC at Providence, Rhode Island at 41.8N, 71.3W (NCDC); 44 kt N at 17 UTC at New
York City, New York at 40.8N, 74.0W (NCDC); calm center from 1850Z-1950Z at Brentwood, Long Island,
New York (40.8N, 73.2W) (MWR); 981 mb at 19 UTC at Newark Airport, New Jersey at 40.8N, 74.3W
(NCDC); 45 kt SE with 995 mb at 19 UTC at Nantucket, Massachusetts at 41.3N, 70.1W (NCDC); 946 mb at
1945 UTC at Bellport, Long Island, New York at 40.75N, 72.9W (NCDC); 76 kt SW and 979 mb at 20 UTC at
Providence, Rhode Island at 41.8N, 71.3W (NCDC); 95 kt (1-min/anemometer height unknown) at 2020Z at
Fishers Island (41.3N, 72.0W) (NCDC); 33 kt SE and 996 mb at 21 UTC at Nantucket, Massachusetts at 41.3N,
70.1W (NCDC); 63 kt S and 985 mb at 21 UTC at Boston at 42.4N, 71.0W (NCDC); 40 kt SE with 979 mb
(min p) at 22 UTC at Concord, New Hampshire at 43.2N, 71.5W (NCDC); 40 kt S with 975 mb (min p) at 22
UTC at Albany, New York at 42.7N, 73.8W (NCDC). "It was not until September 21 that the hurricane
approached any coastal or island area close enough to be felt seriously. At about 7:30 a.m. E.S.T. [1230 UTC]
of that day, the center was about 75 miles east or slightly north of east from Cape Hatteras, where the barometer
reading at that time was 29.30 and the wind velocity 50 miles an hour from the northwest. With the center
approximately the same distance east of Atlantic City, at about 1 p.m. [18 UTC], the hurricane caused a
maximum wind velocity of 61 miles an hour from the west at 12:55 p.m. [1755 UTC], simultaneously with the
lowest barometer reading, 28.99 inches. At Sandy Hook, the lowest reading was 28.71 inches, shortly after 2 8

p.m., maximum wind 56 N at 1 p.m. The calm center was felt at Brentwood, Long Island, between 1:50 p.m.
and 2:50 p.m. Drizzling rain was reported at intervals, with the sun shining during or three 5-minute periods.
The wind movement was so slight during that time that a cigarette could have been lighted in the open without
difficulty. Shortly before 4 p.m. the center reached the Connecticut coast passing between New Haven and
Bridgeport; lowest pressure at New Haven was 28.11 at 3:50 p.m. At Hartford the minimum pressure, 28.04,
was reached at 4:30 p.m. Moving at a very rapid rate, the center crossed Vermont between 6 and 9 p.m., its
course having changed from north by east to north by west, while crossing Massachusetts. At Northfield the
lowest barometer reading was 28.77 at 7:30 p.m. and at Burlington at 8 p.m." (1938 MWR). "NY, CT, RI, MA
– All Category 3 - 946 mb central pressure" (Jarrell et al.). "Environmental pressure - 1015 mb, Estimated
maximum sustained (equivalent 1 min) surface wind at landfall - 110 kt” (Schwerdt et al. 1979). "Sep. 21, 1938,
943 mb central pressure, 946 mb observed in Bellport, NY, RMW of 45 nmi, movement 48 kt, landfall at
40.7N, 72.9W, ‘storm becoming extratropical’” (Ho et al. 1987). "1938 Sep 21, All sections of New England,
Extreme Intensity ["Extreme" being 948 mb or less, maximum winds 136 kt and higher]" (Dunn and Miller).
"F2/F3 damages observed from wind-caused impacts, Suggests boosting winds at 21st/12Z from 100 to 110 kt,
18Z 85 to 110 kt, landfall at 20Z with 110 kt, 22nd/00Z from 70 to 90 kt, 06Z from 45 to 60 kt" (Boose et al.
2001). "Suggest maximum sustained surface winds of 85 kt" (Kaplan and DeMaria 2001).
September 22: HWM analyzes an extratropical closed low of at most 985 mb centered near 47.5N, 75.5W
attached to a stationary front. HURDAT listed this as a 35 kt extratropical low at 47.3N, 77.0W. The MWR
Track of the Hurricane of September 16-22, 1938 (Chart IX) shows a center near 43.5N, 73W at 0 UTC. The
MWR Track of the Hurricane of September 16-22, 1938 (Chart IX) shows a center near 46.5N, 77W at 12
UTC. Available observations suggest that the 35 kt extratropical low was centered at 47.7N, 77.3W. Land
highlights: 41 kt S and 971 mb at 2330Z at Burlington, Vermont at 44.5N, 73.2W (NCDC); 973 mb at 0 UTC at
Burlington, Vermont at 44.5N, 73.2W (NCDC); 995 mb at 0 UTC at Portland, Maine at 43.65N, 70.25W
(NCDC); 996 mb at 0 UTC at Providence, Rhode Island at 41.8N, 71.3W (NCDC); 993 mb at 0 UTC at Boston,
9

Massachusetts at 42,4N, 71.0W (NCDC); 982 mb at 0 UTC at Albany, New York at 42.7N, 73.8W (NCDC);
993 mb at 6 UTC at Burlington, Vermont at 44.5N, 73.2W (NCDC); several other gales and low pressures.
September 23: HWM analyzes an extratropical closed low of at most 1005 mb centered near 42.5N, 72.5W
attached to a stationary front. HURDAT does not list a position for this day. The MWR Track of the hurricane
of September 16-22, 1938 shows a center near 45.0N, 77.0W at 0 UTC. Available observations suggest that the
30 kt extratropical low was centered at 45.0N, 77.0W.
Genesis is begun 18 hours earlier, based upon land and ship observations on the 9th showing a closed low had
developed just off of the West African coast. Following a thorough examination of all available data and
records for each day of the storm’s existence, recommendations were made for moderate to major track
modifications to the HURDAT database. These include: 1) removal of unrealistic acceleration at the track
beginning, 2) removal of speed problem on the 12th, 3) added a stairstep track on the 17th, 4) only minor
changes to timing and position of landfall in New England, 5) added an additional 6 hr position for more
realistic end of track.
Recommendations were also made for generally minor intensity alterations to the HURDAT database for the
10th to the 12th, the 16th and 17th, and the 21st and 22nd, with the exception of a major increase of 20 kt at
18Z on the 21st. On the 10th at 18Z with the system located just southwest of the Cape Verde Islands, a 1005
mb peripheral pressure was recorded in association with the cyclone, and on the 11th at 01Z, a 40 kt wind was
recorded. The analyzed intensity at 00Z on the 11th is 45 kt (up from 35 kt originally). (It is of note that the 40
kt S wind is listed as being in nearly the same spot as the 20 kt S wind. However, given the rather poor
navigational tools available in 1938, it is quite likely that the relative positions of the two ships with regards to
the storm’s center may be off by 30 or even 60 nm.) After that, observations near the cyclone
were lacking until 17 September at 0130Z, when the SS Alegrete recorded a peripheral pressure of 958 mb with
hurricane force winds at 21.2N, 52.8W. A 958 mb peripheral pressure reading suggests maximum winds of 10
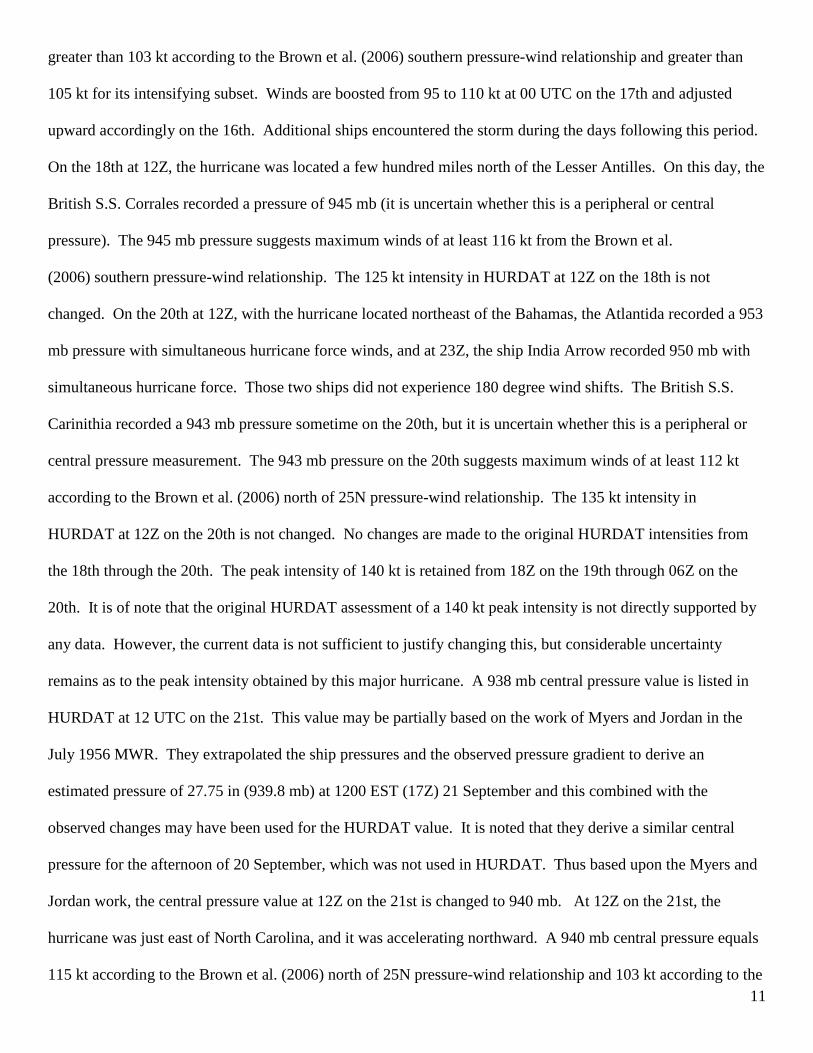
greater than 103 kt according to the Brown et al. (2006) southern pressure-wind relationship and greater than
105 kt for its intensifying subset. Winds are boosted from 95 to 110 kt at 00 UTC on the 17th and adjusted
upward accordingly on the 16th. Additional ships encountered the storm during the days following this period.
On the 18th at 12Z, the hurricane was located a few hundred miles north of the Lesser Antilles. On this day, the
British S.S. Corrales recorded a pressure of 945 mb (it is uncertain whether this is a peripheral or central
pressure). The 945 mb pressure suggests maximum winds of at least 116 kt from the Brown et al.
(2006) southern pressure-wind relationship. The 125 kt intensity in HURDAT at 12Z on the 18th is not
changed. On the 20th at 12Z, with the hurricane located northeast of the Bahamas, the Atlantida recorded a 953
mb pressure with simultaneous hurricane force winds, and at 23Z, the ship India Arrow recorded 950 mb with
simultaneous hurricane force. Those two ships did not experience 180 degree wind shifts. The British S.S.
Carinithia recorded a 943 mb pressure sometime on the 20th, but it is uncertain whether this is a peripheral or
central pressure measurement. The 943 mb pressure on the 20th suggests maximum winds of at least 112 kt
according to the Brown et al. (2006) north of 25N pressure-wind relationship. The 135 kt intensity in
HURDAT at 12Z on the 20th is not changed. No changes are made to the original HURDAT intensities from
the 18th through the 20th. The peak intensity of 140 kt is retained from 18Z on the 19th through 06Z on the
20th. It is of note that the original HURDAT assessment of a 140 kt peak intensity is not directly supported by
any data. However, the current data is not sufficient to justify changing this, but considerable uncertainty
remains as to the peak intensity obtained by this major hurricane. A 938 mb central pressure value is listed in
HURDAT at 12 UTC on the 21st. This value may be partially based on the work of Myers and Jordan in the
July 1956 MWR. They extrapolated the ship pressures and the observed pressure gradient to derive an
estimated pressure of 27.75 in (939.8 mb) at 1200 EST (17Z) 21 September and this combined with the
observed changes may have been used for the HURDAT value. It is noted that they derive a similar central
pressure for the afternoon of 20 September, which was not used in HURDAT. Thus based upon the Myers and
Jordan work, the central pressure value at 12Z on the 21st is changed to 940 mb. At 12Z on the 21st, the
hurricane was just east of North Carolina, and it was accelerating northward. A 940 mb central pressure equals
115 kt according to the Brown et al. (2006) north of 25N pressure-wind relationship and 103 kt according to the 11

Landsea et al. (2004) north of 35N pressure-wind relationship. A 110 kt intensity is chosen for 12Z on the 21st
(up from 100 kt originally). Ship data from prior to landfall as well as station data from landfall suggest that the
940 mb central pressure in HURDAT 18Z on the 21st should be retained in HURDAT.
At landfall (1945Z on the 21st), a pressure of 946 mb likely with calm or light winds measured in Bellport,
Long Island, New York (40.7N, 72.9W) was the lowest pressure recorded on land. A landfall central pressure
of 941 mb is analyzed here, which is in agreement with Jarvinen’s analysis which used SLOSH. This is close to
Ho et al.'s (943 mb) and HURDAT's 18Z (940 mb) values and somewhat deeper than Jarrell et al. (946 mb),
who apparently assumed that Bellport observed the central pressure. The position at 1945Z was determined to
be 40.7N, 72.9W, which is essentially over Bellport, Long Island. As described in Myers and Jordan, the
pressure center and the wind center for this hurricane were offset by about 15 nmi (with the wind center
southwest of the pressure center) due to its extreme translational speed. As is usually indicated in HURDAT,
the best track positions here are based upon the wind (circulation) center. Based on observations and
commentary from primary and secondary sources, the wind center is analyzed to have made landfall essentially
right where the 946 mb was recorded at Bellport, and the pressure center likely came through about 0.1 degrees
east of that location (near 72.8W when it made landfall on Long Island). Brentwood (40.8N, 73.2W) recorded
calm or very light winds lasting for 1 hour. 941 mb suggests maximum winds of 103 kt from the Landsea et al.
(2004) northern-pressure wind relationship. The RMW of the hurricane at landfall is estimated to be 40 nmi,
somewhat smaller than Ho et al.'s assessment. This is slightly larger than the 30 nmi RMW which would be
average given the central pressure and latitude (Vickery et al. 2000). However, the speed of the hurricane was
about 41 kt at landfall, which would significantly increase the winds on the right side of the storm. Another
consideration is that extratropical transition had been well underway and was nearly complete at landfall, and
the pressure-wind relationship is not valid for extratropical cyclones. There are no available wind
measurements from anemometers on Long Island to the right of the path of the center. There were only a few
wind estimates there in commentary from secondary sources.
12

It is estimated that the central pressure filled slightly - to 946 mb - at the second landfall in Connecticut. The
hurricane's second landfall was around 2040 UTC at 41.3N, 72.9W near New Haven. A central pressure of 946
mb equals 99 kt according to the Landsea et al. (2004) northern pressure-wind relationship. At both landfalls
the OCI and ROCI are analyzed at 1011 mb and 350 nmi, respectively. From a pressure-wind relationship
standpoint, the large size of the storm and the larger than average RMW are counteracted by the very fast speed
of the cyclone. Another consideration is that extratropical transition had been well underway and was nearly
complete at landfall, and the pressure-wind relationship is not valid for extratropical cyclones. The highest
official reliable wind observation recorded on land that was not influenced by terrain effects was 95 kt (1-
minute) at Fishers Island, NY (41.3N, 72.0W) at 2020Z. An investigation into obtaining the height of this
anemometer reveals that it was likely in the range of 10 to 15 meters. The observer at Fishers Island noted that
the anemometer failed at 2020Z, right after the 95 kt value was recorded. The observer estimated a highest one-
minute wind of 104 kt at 2035Z. Estimated maximum velocity reported by the observer at the Watch Hill Coast
Guard Station (41.3N, 71.8W) in Westerly, Rhode Island was 105 kt. A secondary source states that the
anemometer of a ship in the harbor at New London, CT at 41.35 degrees N, 71.1W recorded a value of exactly
87 kt before the anemometer blew away. The RMW of this hurricane was located between New London, CT
and Westerly, RI. At Block Island, RI (41.2N, 71.6W), a maximum 5-minute wind of 71 kt SE (14 m) converts
to a 10 m 1-min wind of 74 kt. Block Island’s fastest mile wind was measured at 79 kt, which converts to a
10m 1-min wind of 76 kt. Block Island was located about 10 to 15 nmi outside of the right RMW. Other
stations’ maximum winds, after converting to 10m 1-min values are: Providence, RI: 68 kt; Boston, MA: 64 or
71 kt (depending whether you convert from 5-min or from fastest mile). It is estimated that the maximum
surface sustained winds at the Long Island, NY landfall were about 105 kt, which is slightly below the Schwerdt
et al.'s and Boose et al.'s value (110 kt) and significantly above that suggested by Kaplan and DeMaria (85 kt)
and that shown originally in HURDAT (also 85 kt). Kaplan and DeMaria's analysis focused solely upon
observed wind values, and did not utilize the Army Corps source where the 95 kt observation was found. Other
than the winds mentioned above, the wind data coverage on the right side of the hurricane was rather sparse.
The right RMW is analyzed to have crossed eastern Long Island. This retains the hurricane as a Category 3 at 13

the first (NY) landfall. For the Connecticut landfall, winds are suggested to have dropped slightly to 100 kt.
Category 3 winds are likely to have been felt along the immediate coast of eastern Connecticut and extreme
western Rhode Island in a tiny area between 72.0W-71.8W. However, Massachusetts impact was analyzed to
be about Category 2, which is a downgrade from Category 3 originally estimated in HURDAT. An additional
post-landfall central pressure was added for the 00Z 22nd HURDAT of 969 mb based on a 971 mb reading
from Burlington, Vermont. This replaced a value of 967 mb originally in HURDAT. Following landfall, the
peak observed winds within two hours of the 00Z and 06Z on the 22nd synoptic times were land-based
observations of 60 kt from Boston, Massachusetts and 30 kt from Burlington, Vermont. The Kaplan and
DeMaria (2001) inland decay algorithm for New England suggested winds of 62 and 40 kt at 00Z and 06Z,
respectively. Consequently, winds in HURDAT were decreased from 70 to 60 kt at 00Z and from 45 to 40 kt at
06Z.
An application of SLOSH for this hurricane was provided by Jarvinen (2006). For his run, he utilized the
pressure center positions, which as mentioned earlier were about 15 nmi northeast of the wind center. Using
central pressures of 941 mb at landfall in New York and 946 mb at landfall in Connecticut and an RMW of 26
nmi (from the pressure center), SLOSH's output closely matches the observed storm surges at Providence,
Rhode Island and Buzzards Bay, Massachusetts. The SLOSH model gave maximum 1 min surface winds of
113 kt at the southern shoreline on eastern Long Island and 104 kt at the shoreline in Connecticut. However,
these values do not take into account any increases in stability due to the cool water near New England. Thus
the SLOSH model output is consistent with a large Category 3 at landfall.
One last consideration was whether the system was extratropical before or after landfall in New England.
Oddly, it was listed as extratropical in HURDAT at 18 UTC on the 21st (right before landfall), but the track is
shown in Neumann et al. (1999) as still retaining hurricane status until just after landfall. It has been officially
considered a hurricane at landfall in Jarrell et al. and in the Saffir-Simpson Hurricane Scale designation in
HURDAT. Pierce (1939) considered it extratropical, as he even showed frontal boundaries when the system 14

was as far south as 35N at 12 UTC on the 21st. However, ship observations near the core of the system were
lacking on the 21st. While it is clear that the system was extratropical soon after landfall in New England (and
was likely completely transitioned by 00 UTC on the 22nd), the lack of observations makes knowing its true
character at landfall ambiguous. Perhaps Ho et al.'s assessment of "becoming extratropical" at landfall is most
appropriate. Therefore, the 1938 Great New England hurricane will be retained with hurricane status just up to
landfall.
A final note is that the track for the 1938 New England Hurricane was extended an extra six hours on the 23rd
to accommodate some Historical Weather Map data showing that the system was still in existence on this date
and also to provide a more realistic velocity at its conclusion.
Storm #6, 1938 (The Great New England Hurricane) Best Track Change Committee Comments and Replies to
the Comments
Comments on the proposed revisions from the Best Track Supervisory Committee are in regular font. [Replies
to the Committee are in boldface.]
1938 Storm #6 (originally #4):
1. Please include a binder map for 9 September.
Done. After obtaining this and adding on the rather numerous COADS observations, a closed circulation
had developed by 12Z on the 9th just offshore from the West African coast. Thus genesis is begun 18
hours earlier than indicated in HURDAT.
2. On the plotted map for 0000 UTC 11 September, there is a S 50 kt/mph observation plotted next to a
S 25 kt/mph. Is the former observation the basis for raising the intensity at this time to 45 kt? If so, this looks a
little strange given the second, much lower, wind observation nearby. Please clarify this and include the
explanation in the metadata summary if need be. 15

Note that the initial work on this system conducted by Donna Strahan back in 2005 was plotted in units
of mph. Thus the observations in question are actually a S 40 kt and a S 20 kt reports, as correctly
indicated in the excel database and daily summary. The 40 kt observation is the reason for boosting the
assessed intensity from 35 to 45 kt at 00Z on the 11th. Given the rather poor navigational tools available
in 1938, it is quite likely that the relative positions of the two ships with regards to the storm’s center may
be off by 30 or even 60 nm.
3. The HWM show a ship with W 20 kt/mph and 1008 mb near 17N 37W at 1200 UTC 13 September.
If this is correct, is it possible that proposed position for that time (already nudged northward) needs to be
nudged farther northward?
There was a 15 kt WNW at 16.6N, 37.4W in COADS at 12Z on the 13th. Agreed to adjust the position
northward by 0.2N to 17.2N at that time.
4. The committee notes that the original HURDAT assessment of a 140 kt peak intensity is not directly
supported by any data. The current data is not sufficient to justify changing this, but the uncertainty should be
stated in the metadata summary.
Agreed and done.
5. The 938 mb central pressure at 1200 UTC 21 September may be at least partially based on the work
of Myers and Jordan in the July 1956 MWR. They extrapolated the ship pressures and the observed pressure
gradient to derive an estimated pressure of 27.75 in (939.8 mb) at 1200 EST (17Z) 21 September and this
combined with the observed changes may have been used for the HURDAT value. It is noted that they derive a
similar central pressure for the afternoon of 20 September, which was not used in HURDAT. Unless some
other source for the 938 mb reading can be found, the committee suggests changing this value to 939 or 940 mb.
The metadata summary should be re-written to reflect this.
Agreed to change the 938 mb central pressure in HURDAT at 12Z on the 21st to 940 mb passed upon the
work of Myers and Jordan.
16

6. As with some of the storms of 1937, there is an issue with the use of the Landsea et al wind pressure-
relationship for a system undergoing extratropical transition. The metadata summary should reflect this
uncertainty.
Agreed and added.
7. Two comments on the 21 September daily metadata: First, “W-E cold front” should probably be “N-
S cold front”. Second, this is a very long write-up. Please shorten it by removing the parts about the damages
and observations that are not necessary to determine the track and intensity.
Done.
8. The committee agrees with the proposed landfall intensities of 105 kt at Long Island and 100 kt in
Connecticut. The committee’s consensus is that the system was a tropical cyclone undergoing extratropical
transition during the two landfalls, then became extratropical over New England after landfall. Therefore, it
concurs with changing the time of extratropical transition in HURDAT. Richard Pasch’s comments: The
surface data do not indicate that cold air penetrated the core of the cyclone at landfall in New England.
Therefore, I agree that the system was still a tropical cyclone at 1800 UTC 21 September. Also, based on the
wind measurement at Fishers Island and the observed storm surges, the intensity at landfall should be that of a
major hurricane. A value of 105 kt, as shown in the revised best track, seems quite reasonable.
Agreed.
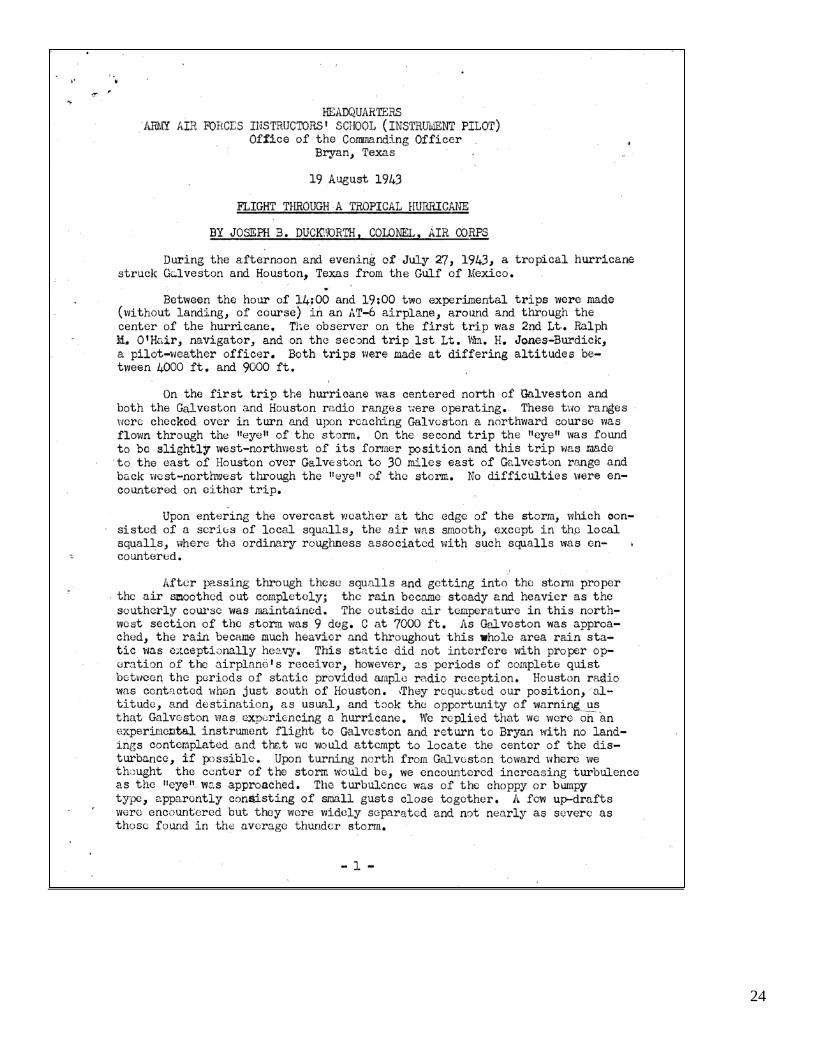
2. First aircraft flights into a hurricane
Figure A1 provides in full the original report of the first ever aircraft flights into a hurricane. These
were prepared by William H. Jones-Burdock, 1st Lt., U.S. Army Air Corps and Joseph B. Duckworth, Colonel,
U.S. Army Air Corps. The success of these impromptu missions eventually led to the aircraft reconnaissance
program of the U.S. Navy and U.S. Army Air Corps (now the U.S. Air Force) – the “Hurricane Hunters”.
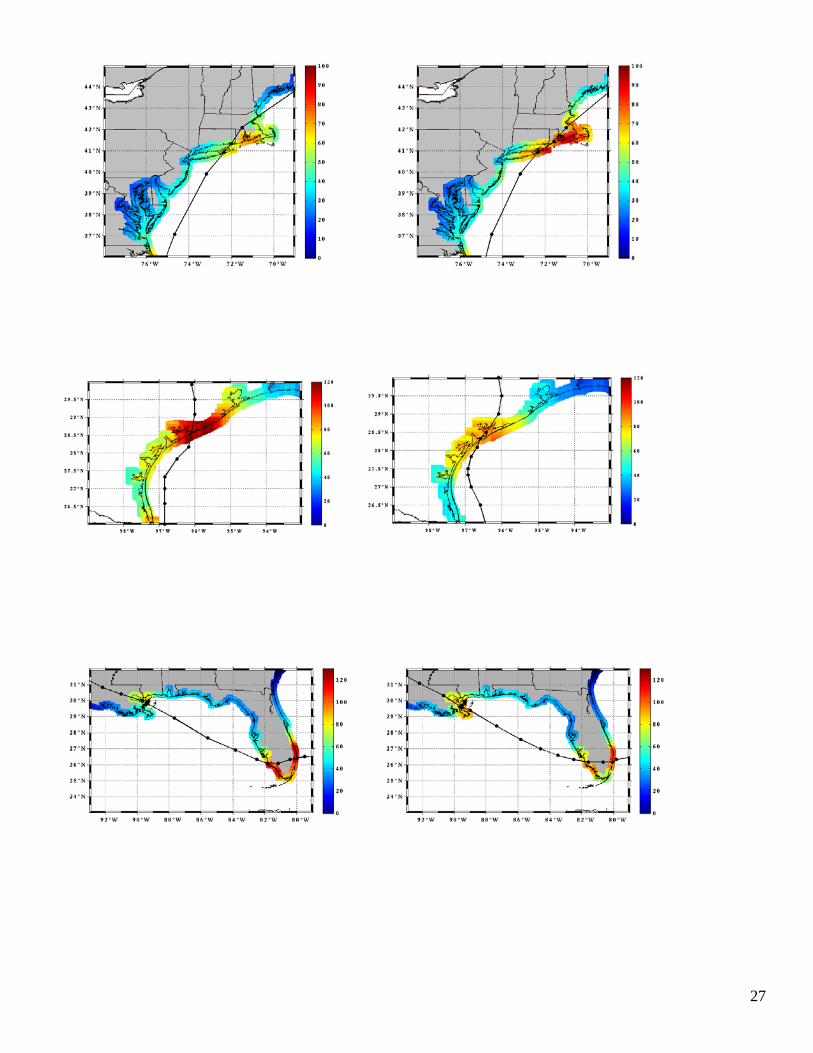
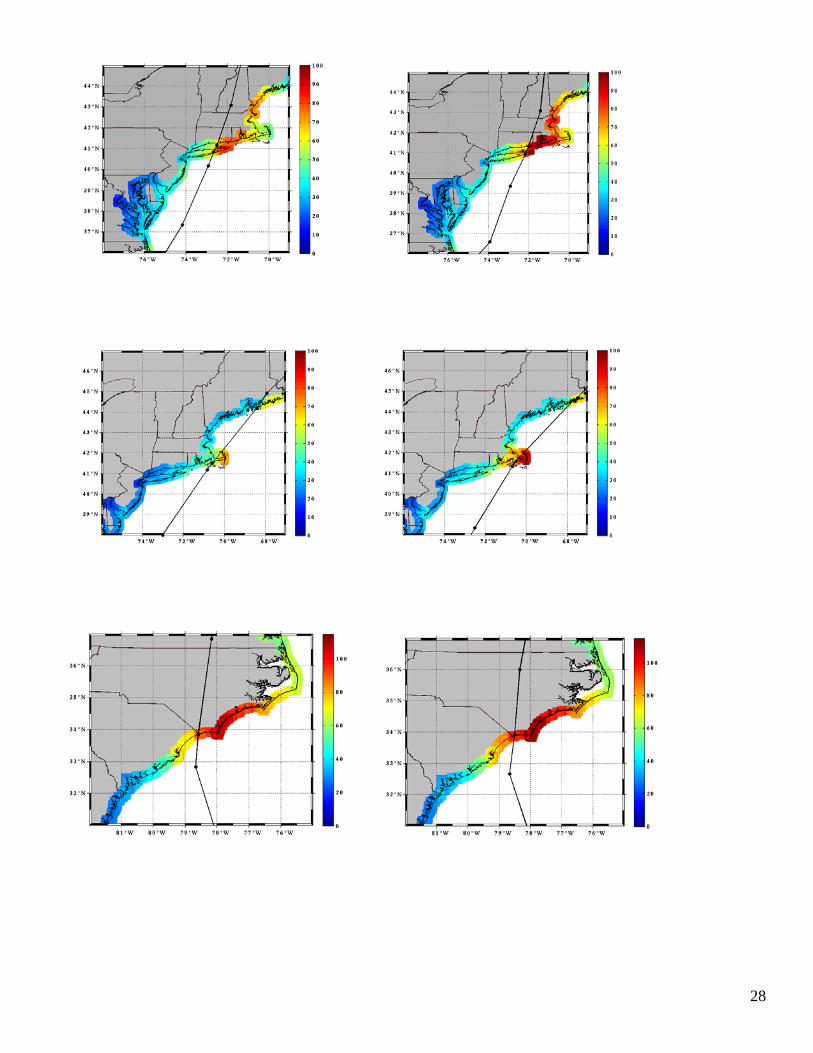
3. Coastal wind swaths for U.S. landfalling hurricanes 17
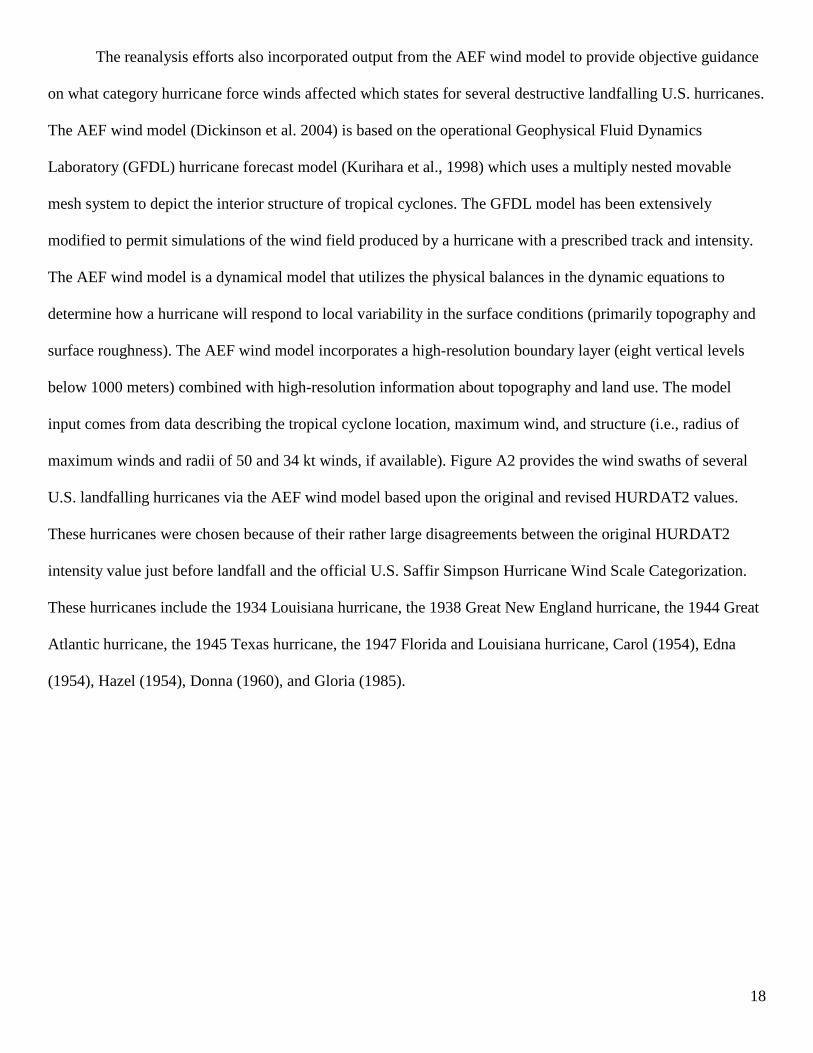
The reanalysis efforts also incorporated output from the AEF wind model to provide objective guidance
on what category hurricane force winds affected which states for several destructive landfalling U.S. hurricanes.
The AEF wind model (Dickinson et al. 2004) is based on the operational Geophysical Fluid Dynamics
Laboratory (GFDL) hurricane forecast model (Kurihara et al., 1998) which uses a multiply nested movable
mesh system to depict the interior structure of tropical cyclones. The GFDL model has been extensively
modified to permit simulations of the wind field produced by a hurricane with a prescribed track and intensity.
The AEF wind model is a dynamical model that utilizes the physical balances in the dynamic equations to
determine how a hurricane will respond to local variability in the surface conditions (primarily topography and
surface roughness). The AEF wind model incorporates a high-resolution boundary layer (eight vertical levels
below 1000 meters) combined with high-resolution information about topography and land use. The model
input comes from data describing the tropical cyclone location, maximum wind, and structure (i.e., radius of
maximum winds and radii of 50 and 34 kt winds, if available). Figure A2 provides the wind swaths of several
U.S. landfalling hurricanes via the AEF wind model based upon the original and revised HURDAT2 values.
These hurricanes were chosen because of their rather large disagreements between the original HURDAT2
intensity value just before landfall and the official U.S. Saffir Simpson Hurricane Wind Scale Categorization.
These hurricanes include the 1934 Louisiana hurricane, the 1938 Great New England hurricane, the 1944 Great
Atlantic hurricane, the 1945 Texas hurricane, the 1947 Florida and Louisiana hurricane, Carol (1954), Edna
(1954), Hazel (1954), Donna (1960), and Gloria (1985).
18

On-line Supplemental References:
Boose, E. R., K. E. Chamberlin, and D. R. Foster, 2001: Landscape and regional impacts of
hurricanes in New England. Ecol. Monogr., 71, 27-48.
Dunn, G. E., and B. I. Miller, 1960: Atlantic Hurricanes. Louisiana State University Press, 326 pp.
Ho, F., P, J. C. Su, K. L. Hanevich, R. J. Smith, and F. P. Richards, 1987: Hurricane climatology
for the Atlantic and Gulf coasts of the United States. NOAA Tech. Rep. NWS 38, 193 pp.
Jarrell, J. D., P. J. Hebert, and M. Mayfield, 1992: Hurricane experience levels of coastal county
populations from Texas to Maine. NOAA Tech. Memo. NWS NHC-46, 152 pp.
Jarvinen, B. R., 2006 "Storm Tides in Twelve Tropical Cyclones (including Four Intense New
England Hurricanes)." Report for FEMA/National Hurricane Center, 99pp.
http://www.aoml.noaa.gov/hrd/Landsea/12Tides.pdf
Kaplan, J., and M. DeMaria, 2001: On the decay of tropical cyclone winds after landfall in the
New England area. J. Appl. Meteor., 40, 280–286.
Myers, V. A., and E. S. Jordan, 1956: Winds and pressures over the sea in the hurricane of
September 1938. Mon. Wea. Rev., 84, 261-270.
Neumann, C. J., B. R. Jarvinen, C. J. McAdie, and G. R. Hammer, 1999: Tropical Cyclones of the
North Atlantic Ocean, 1871-1999. NOAA/NWS/NESDIS, Historical Climatology Series 6-
2, 206 pp.
Pierce, C. H., 1939: The meteorological history of the New England hurricane of Sept. 21, 1938.
Mon. Wea. Rev., 67, 237-285.
Schwerdt, R. W., F. P. Ho, and R. R. Watkins, 1979: Meteorological criteria for standard project
hurricane and probable maximum hurricane windfields, Gulf and East Coasts of the United
States. NOAA Tech. Rep. NWS 23, 317 pp.
Tannehill, I. R., 1938: Hurricanes, Their Nature and History, Particularly Those of the West
Indies and the Southern Coasts of the United States. Princeton University Press, 257 pp
19

20

21

22

23
24

Figure A1: The report – “Flight Through a Tropical Hurricane” – by William H. Jones-Burdock, 1st Lt., U.S.
Army Air Corps and Joseph B. Duckworth, Colonel, U.S. Army Air Corps.
25

26
27
28

Figure A1: Original (left) and revised (right) track and coastal wind swaths for the 1934 Louisiana hurricane,
the 1944 Great Atlantic hurricane, the 1945 Texas hurricane, the 1947 Florida and Louisiana hurricane, Carol
(1954), Edna (1954), Hazel (1954), Donna (1960), and Gloria (1985).
29

Table A1: Significant (hurricane force and greater) reports collected in the database for Storm #6, 1938 (the
Great New England Hurricane). Note that the complete database includes all reports of tropical storm force (34
kt) or stronger and 980 mb pressures or lower. Sources shown here are Monthly Weather Review (MWR),
Comprehensive Ocean Atmosphere Dataset (COA), the U.S. Weather Bureau Original Monthly Records
(OMR), airport weather station measurements (Airway wx), and other supplemental information (Supp).
1938 Storm 6 (originally Storm 4) – Great New England Hurricane
Date Time Pressure Wind Direction Air-T SST Location Lat. Lon. Source Name
17-Sep 0130Z 958 70 ENE SHIP 21.1 52.8 MWR Alegrete
18-Sep 945 SHIP MWR S.S. Corrales
19-Sep 14Z 982 70 E SHIP 25.5 69.9 MWR Gulfhawk
20-Sep 2Z 65 NE 82 83 SHIP 26.3 74.2 COA 409050
20-Sep 9Z 956 45 NE SHIP 27.1 73.9 COA US150810
20-Sep 9Z 1005 70 E 82 SHIP 27.4 72.4 COA
20-Sep 9Z 992 70 ESE-SSE SHIP 27.8 72.6 MWR Jean Lafitte
20-Sep 9Z 956 40 NE SHIP 27.1 73.9 MWR Antigua
20-Sep 12Z 953 70 E SHIP 27.1 74.6 MWR Atlantida
20-Sep 12Z 986 70 SSE 75 74 SHIP 27.6 73.8 COA NL013848
20-Sep 12Z 980 60 SE 83 79 SHIP 27.8 72.5 COA DL004807
20-Sep 12Z 995 70 SSE 82 80 SHIP 27.8 72.5 COA US162036
20-Sep 15Z 976 70 S SHIP 27.6 74.0 MWR Phobos
20-Sep 23Z 950 70 ENE SHIP 30.0 75.7 MWR India Arrow
20-Sep 943 SHIP MWR Carinthia
21-Sep 9Z 954 70 W 74 77 SHIP 33.4 74.4 COA
21-Sep 15Z 969 60 N SHIP 36.2 74.6 MWR San Benito
21-Sep 17Z 976 40 NNE-NW SHIP 38.6 73.9 MWR Gulfprince
21-Sep 17Z 972 40 NW SHIP 38.3 74.9 MWR Platano
21-Sep 17Z 972 45 NW 65 70 SHIP 38.2 74.5 COA PM003315
21-Sep 18Z 952 70 SE SHIP 38.9 72.0 MWR Birmingham City
21-Sep 18Z 970 70 NW SHIP 39.3 73.8 MWR R.G. Stewart
21-Sep 19Z 70 SE PROVIDENCE 41.8 71.4 OMR
21-Sep 19Z 65 NW NEW YORK (CITY) 40.7 74.0 OMR
21-Sep 19Z 980 26 E 73 NEW HAVEN (CITY)41.3 72.9 OMR
21-Sep 19Z 979 36+ NE 71 New Haven 41.3 72.9 Airway Wx
21-Sep 1915Z 972 SANDY HOOK, NJ 40.5 74.0 MWR MIN PRESSURE
30

21-Sep 1930Z 971 41+ WNW 59 FloydBen 40.6 73.9 AirwayWx
21-Sep 1943Z 973 56 NEW YORK (CITY) 40.7 74.0 OMR MIN PRESSURE
21-Sep 1945Z 946 BELLPORT, NY 40.7 72.9 MWR MIN PRESSURE
21-Sep 1950Z 961 48+ NE New Haven 41.3 72.9 Airway Wx
21-Sep ~1951Z 973 NEW YORK (CITY) 40.7 74.0 Sup MIN PRESSURE
21-Sep 1951Z 971 43+ NNW FloydBen 40.6 73.9 Airway Wx G 73
21-Sep 1955Z 71 SE BLOCK ISLAND, RI 41.2 71.6 OMR 5-min
21-Sep 2000Z 959 43+ NE New Haven 41.3 72.9 Airway Wx
21-Sep 20Z 972 50 WNW SHIP 40.5 73.8 MWR WASHINGTON
21-Sep 20Z 75 SE BLOCK ISLAND, RI 41.2 71.6 MWR
21-Sep 2000Z 79 SE BLOCK ISLAND, RI 41.2 71.6 OMR fastest mile
21-Sep 71 SE BLOCK ISLAND, RI 41.2 71.6 OMR 5-min max
21-Sep 2005Z 971 BLOCK ISLAND, RI 41.2 71.6 Sup MIN PRESSURE
21-Sep 2012Z 956 43+ NE 66 New Haven 41.3 72.9 Airway Wx
21-Sep 2015Z 971 68 BLOCK ISLAND, RI 41.2 71.6 OMR MIN PRESSURE
21-Sep 2020Z 95 measured Fishers Island, NY 41.3 72.0 supp 1-min
21-Sep 2030Z 973 47+ NW 58 FloydBen 40.6 73.9 Airway Wx 1-min
21-Sep 2030Z 979 80 SW PROVIDENCE 41.8 71.4 OMR MIN PRESSURE
21-Sep 2035Z 954 17+ NE 67 New Haven 41.3 72.9 Airway Wx
21-Sep 2039Z 70 NW NEW YORK (CITY) 40.7 74.0 OMR fastest mile
21-Sep 2045Z 954 19+ S 69 New Haven 41.3 72.9 Airway Wx
21-Sep 2045Z 979 73 PROVIDENCE 41.8 71.4 OMR MIN PRESSURE
21-Sep 958 Bridgeport, CT 41.2 73.2 supp MIN PRESSURE
21-Sep 2050Z 952 35 NE 69 NEW HAVEN (CITY)41.3 72.9 MWR MIN PRESSURE
21-Sep 2055Z 67 SE PROVIDENCE 41.8 71.4 OMR 5-min
21-Sep 21Z 954 17+ SW 69 New Haven 41.3 72.9 Airway Wx
21-Sep 2105Z 76 SW PROVIDENCE 41.8 71.4 OMR max 5-min
21-Sep 83 PROVIDENCE 41.8 71.4 OMR fastest mile
21-Sep 2108Z 52 S BLOCK ISLAND, RI 41.2 71.6 OMR 5-min
21-Sep 2112Z 959 20+ SW 69 New Haven 41.3 72.9 Airway Wx
21-Sep 2117Z 950 67 HARTFORD 41.8 72.7 OMR, supp MIN PRESSURE
21-Sep 2123Z 965 37+ SW 66 New Haven 41.3 72.9 Airway Wx
21-Sep 2130Z 950 HARTFORD 41.8 72.7 MWR No calm
21-Sep 2130Z 985 42+ WSW 58 FloydBen 40.6 73.9 Airway Wx G 65
21-Sep 2142Z 973 32+ SW 63 New Haven 41.3 72.9 AirwWx
21-Sep 971 Worchester, MA 42.3 71.8 supp MIN PRESSURE
21-Sep 962 Amherst, MA 42.4 72.5 supp MIN PRESSURE
21-Sep 22Z 977 37+ SW 65 New Haven 41.3 72.9 Airway Wx
31

21-Sep 22Z 960 35 ENE 69 Westfield, MA 42.1 72.8 Airway Wx
21-Sep 22Z 979 40 SE 70 CONCORD 43.2 71.5 OMR MIN PRESSURE
21-Sep 22Z 975 40 S 59 ALBANY 42.7 73.8 OMR MIN PRESSURE
21-Sep 2200Z 970 ALBANY 42.7 73.8 supp MIN PRESSURE
21-Sep 2230Z 985 65 S 70 BOSTON (AIRPORT)42.4 71.0 OMR MIN PRESSURE
21-Sep ~2230Z 63 S Boston, MA 42.4 71.0 OMR max 5-min
21-Sep ~2230Z 76 S Boston, MA 42.4 71.0 OMR fastest mile
21-Sep 2245Z 979 70 Concord, NH 43.2 71.5 OMR MIN PRESSURE
21-Sep 23Z 975 22 SW 64 Westfield, MA 42.1 72.8 Airway Wx
21-Sep 972 Hanover, NH 43.7 72.3 supp MIN PRESSURE
21-Sep 973 Rutland, VT 43.6 73 supp MIN PRESSURE
21-Sep 0030Z 974 45 S NORTHFIELD 44.2 72.7 MWR MIN PRESSURE
22-Sep 0030Z 974 25 S 65 Northfield, VT 44.2 72.7 OMR MIN PRESSURE
22-Sep 0030Z 976 65 White River Junct, VT43.6 72.3 OMR
22-Sep 0030Z 973 11 N 62 BURLINGTON 44.5 73.2 OMR
22-Sep 0100Z 971 12 N 63 BURLINGTON 44.5 73.2 OMR MIN PRESSURE
32