Christopher C. Gallen, M.D., Ph.D. Vice President, Wyeth Research Strategic Challenges in...
34
Christopher C. Gallen, M.D., Ph.D. Vice President, Wyeth Research Strategic Challenges in Strategic Challenges in Neuroprotective Drug Neuroprotective Drug Development Development March 15, 2003 Washington, D.C.
-
Upload
blaise-atkinson -
Category
Documents
-
view
215 -
download
2
Transcript of Christopher C. Gallen, M.D., Ph.D. Vice President, Wyeth Research Strategic Challenges in...
Christopher C. Gallen, M.D., Ph.D.Vice President, Wyeth Research
Strategic Challenges in Strategic Challenges in Neuroprotective Drug Neuroprotective Drug
DevelopmentDevelopment
March 15, 2003Washington, D.C.
The Current World of Pharma The Big Picture Challenge for R&D-Driven
Pharmaceutical Companies The Challenges of CNS R&D Meeting the Challenge Changing the Model A Strategy Going Forward

Source: OECD-OECD Health Data, 1998.*1997 data
U.K. Japan* Italy Netherlands Canada France Germany U.S.
As a Percentage of Gross Domestic Product in Major Industrialized Countries, 1997
Health Care Costs

Source: OECD-OECD Health Data, 1998.*1997 data
U.K. Japan*ItalyNetherlands Canada FranceGermanyU.S.
Pharmaceutical Costs
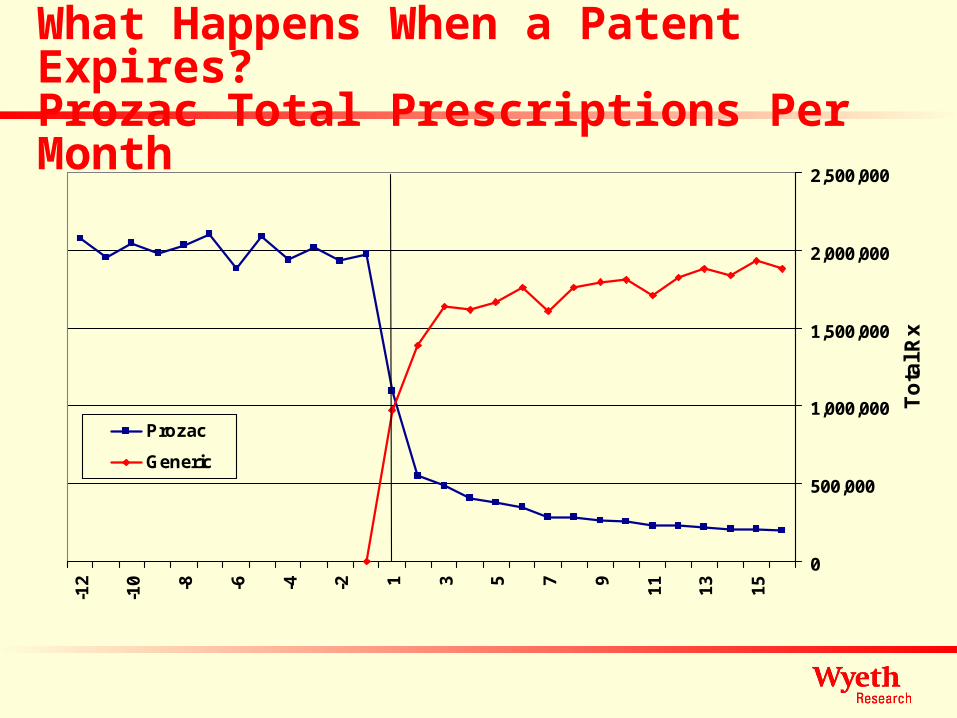
What Happens When a Patent Expires?Prozac Total Prescriptions Per Month
0
500,000
1,000,000
1,500,000
2,000,000
2,500,000
-12
-10 -8 -6 -4 -2 1 3 5 7 9
11
13
15
To
tal R
x
Prozac
Generic

Source: Cap Gemini Ernst and Young, 2002. Global Market Research & Analysis
0.0% 10.0% 20.0% 30.0% 40.0% 50.0%
Nov Nov 8%8%
Pfizer 14%Pfizer 14%GSK 18%GSK 18%Aventis 22%Aventis 22%Roche 24%Roche 24%Bristol-Myers 26%Bristol-Myers 26%Merck 27%Merck 27%Eli-Lilly 36%Eli-Lilly 36%Schering-Plough 41%Schering-Plough 41%AstraZeneca 50%AstraZeneca 50%
% of Total Sales to 2005 Vulnerable to Patent Expiration
The Patent Expiration Challenge
Over $100B of Products Face Generic Competition by 2005

Pharmaceutical R&D Investment is High
Source: PhRMA, 2001, Based on Data from PhRMA Annual Survey and Standard & Poor’s Compustat, a Division of McGraw-Hill
17.0%
15.6%
12.8%
10.5%
8.4%
7.8%
5.3%
4.7%
3.9%
1.2%
3.9%
0.73%
3.8%
Research-based Pharmaceutical Companies1
Domestic R&D
Industrial Sector Comparison:
Drugs & Medicine
Computer Software & Services
Office Equipment & Services
Automotive
Telecommunications
Leisure Time Products
Aerospace & Defense
Metals & Mining
Paper & Forest Products
All Industries
Global R&D
Electrical & Electronics

0% 20% 40% 60% 80% 100%
Sensory organs
Hormones
Dermatological
Blood
Respiratory
GU & Sex hormones
Musculo-skeletal
Antiinfectives
Alimentary & Metabolism
Cardiovascular
Cancer
Nervous system
Percentage of companies
0% 20% 40% 60% 80% 100%
Sensory organs
Hormones
Dermatological
Blood
Respiratory
GU & Sex hormones
Musculo-skeletal
Antiinfectives
Alimentary & Metabolism
Cardiovascular
Cancer
Nervous system
Percentage of companies
Major companies(n=14)
Other companies(n=24)
Therapeutic area ordered by decreasing number ofNASs in development on December 31st, 2001
IO0-1009924/05/02Source: Institute for Regulatory Science
Percentage of companies active in each therapeutic area
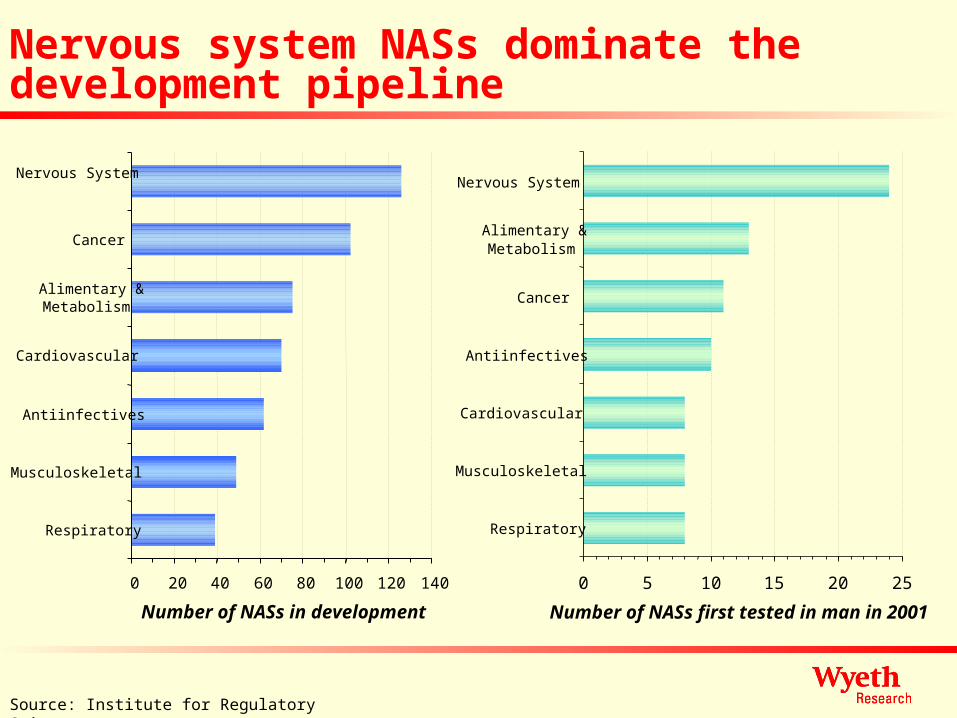
0 5 10 15 20 25
Respiratory
Musculoskeletal
Cardiovascular
Antiinfectives
Cancer
Alimentary &Metabolism
Nervous System
Number of NASs first tested in man in 2001
0 20 40 60 80 100 120 140
Respiratory
Musculoskeletal
Antiinfectives
Cardiovascular
Alimentary &Metabolism
Cancer
Nervous System
Number of NASs in development
Source: Institute for Regulatory Science
Nervous system NASs dominate the development pipeline

Source: PhRMA Annual Survey, 2001. U.S. FDA. Global Market Research & Analysis
But R&D Productivity is Decreasing
0
5
10
15
20
25
30
35
4019
80
1981
1982
1983
1984
1985
1986
1987
1988
1989
1990
1991
1992
1993
1994
1995
1996
1997
1999
2000
2001
2002
E
R&
D E
xp
en
dit
ure
s (
US
$ B
illi
on
s)
0
10
20
30
40
50
60
New
Molecular E
ntities Approved

Discovery and Development Costs are Increasing
84
214
336
54104
466
138
318
802
0
100
200
300
400
500
600
700
800
900
Mill
ion
s o
f 20
00 $
Preclinical Clinical Total
1970s approvals 1980s approvals 1990s approvals
Source: DiMasi et al., Tufts CSDD R&D Cost Study, 2002

Source: Boston Consulting Group, 1993; Peck, C., “Drug Development: Improving the Process,”Food & Drug Law Journal, Vol. 52, 1997.
Number of Trials
Clinical Trial Number Per NDA is Increasing
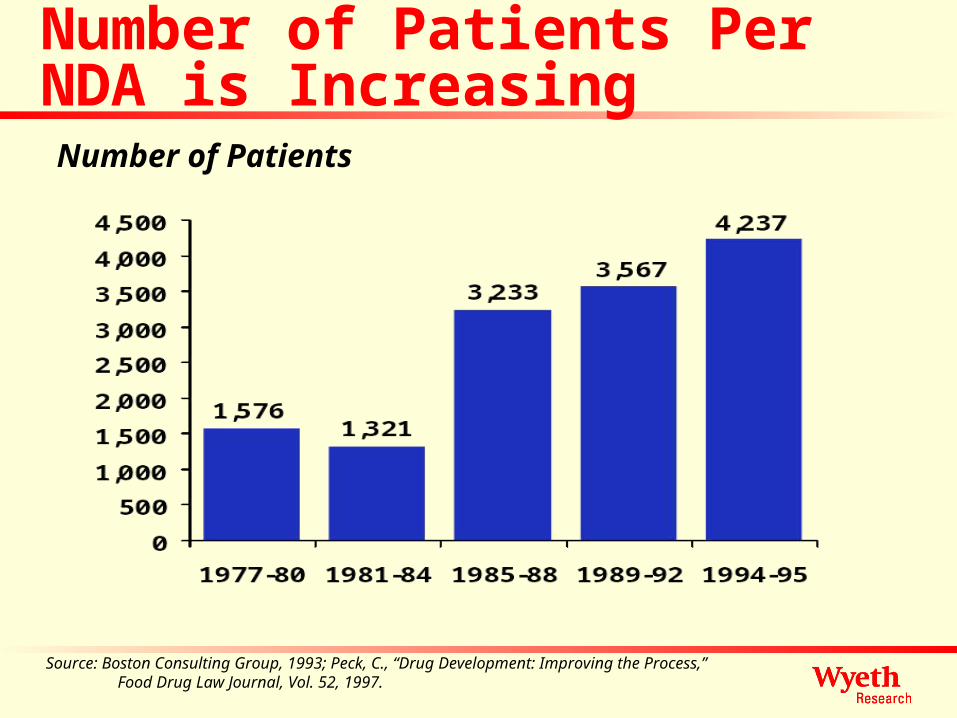
Source: Boston Consulting Group, 1993; Peck, C., “Drug Development: Improving the Process,”Food Drug Law Journal, Vol. 52, 1997.
Number of Patients
Number of Patients Per NDA is Increasing

Number of patients per phase III study to support first submission
0
200
400
600
800
1000
1200
Anti-in
fecti
ves
Alimen
tary
/met
aboli
sm
Respir
ator
y
Anti-c
ance
r
Mus
culos
kelet
al
Nervo
us sy
stem
CVS
Mean number of patients
Therapeutic area
Where enrolment completed 1999-01

R&D Cycle Times are Increasing
Source: Joseph A. DiMasi, “New Drug Development; Cost, Risk and Complexity”, Drug Information Journal, May 1995. (From R&D Directions, 1996)
0
2
4
6
8
10
12
14
16
1960s 1970s 1980s 1990s
Pre-IND Phase IND Phase NDA Phase
Yea
rs
3.23.2
2.52.5
2.42.4
5.15.1
4.14.1
2.12.1
5.95.9
5.55.5
2.82.8
6.16.1
6.16.1
2.62.6
8.1
11.6
14.2 14.8

Drug Approval Times are Increasing Again
Source: U.S. Food and Drug Administration
Mea
n A
pp
rova
l T
ime
(Mo
nth
s)
30.3 29.926.5
19.7 19.217.8
16.2
11.7 12.6
17.6 16.4
0
6
12
18
24
30
36
42
91 92 93 94 95 96 97 98 99 00 01
Calendar Year
3030 2626 2525 2222 2828 5353 3939 3535 2727 24243030 Total Number of New Drugs Approved in Each Year

Time to termination by therapeutic area(for NASs terminated 1999-2001)
0
25
50
75
100
0.0 2.0 4.0 6.0 8.0 10.0 12.0 14.0
Time from first human dose (years)
Per
cent
age
of N
AS
s te
rmin
ated
Nervous system Anti-infectives Cardiovascular
Source: CMR International

0%
5%
10%
15%
20%
25%
30%
35%
40%
45%
50%
Clinical efficacy ClinicalPk/bioavailability
Clinical safety Portfolioconsiderations
Toxicology Various
Per
cen
tag
e o
f te
rmin
atio
ns
Nervous system (n=127 )
All therapy areas excluding nervous system (n=360)
Breakdown of reasons for termination(for NASs terminated 1999-2001)
Source: CMR International

30
40
50
60
70
80
90
100
1.41.92.42.93.4
Average duration of phase III (decreasing left to right)
Su
cces
s ra
te:
ph
ase
III t
o s
ub
mis
sio
n
Anti-infectives
Respiratory
Nervous system
CVS
Musculo-skeletal
Alimentary/metabolism
Oncology
Bubble size = current market size (IMS); number in bubble = number of NASs in phase II/III development
Attractiveness profile of industry’s late stage pipeline
42
39
High success rate, slow cycle time
Fast cycle time,low success rate
High success rate,fast cycle time
Low success rate, slow cycle time
25
18
51
19
43

Why are Success Rates Declining?
Discovery issues Conceptual issues re disease models Clinical Trial issues
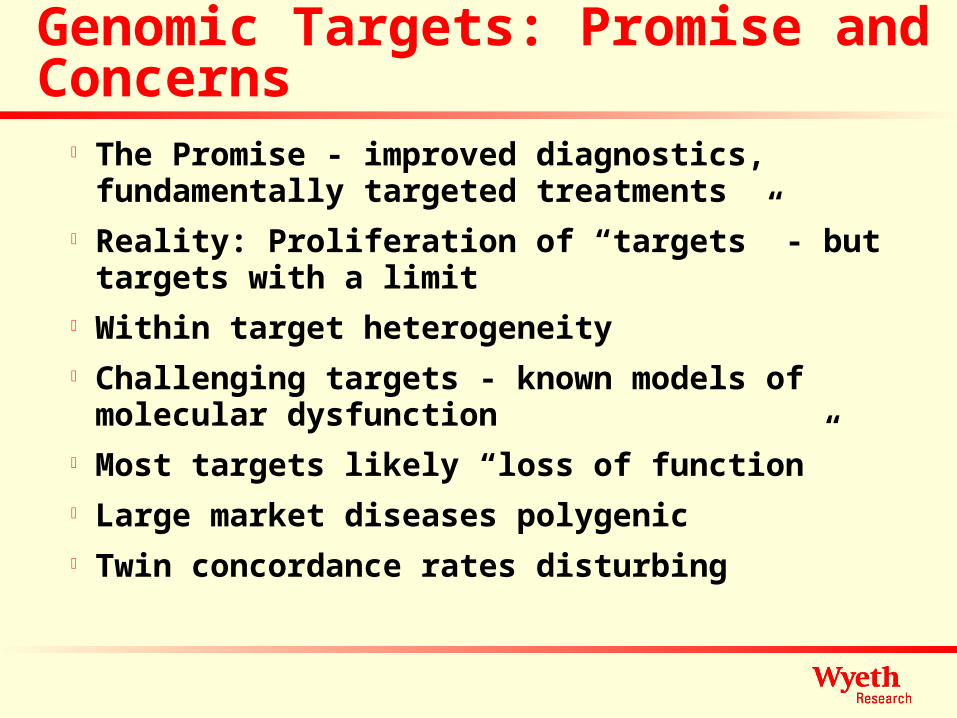
Genomic Targets: Promise and Concerns
The Promise - improved diagnostics, fundamentally targeted treatments
Reality: Proliferation of “targets” - but targets with a limit
Within target heterogeneity Challenging targets - known models of molecular
dysfunction Most targets likely “loss of function” Large market diseases polygenic Twin concordance rates disturbing

Technological Challenges
Structure-based Drug DesignMatch molecules to targets different from in-situ
conformation
Fit for in vitro viral proteins likely > CNS proteins
Combinatorial ChemistryExisting libraries limited by origins - monoamine
GPCRs, steroid receptors and serine-aspartyl proteases

Why is CNS Particularly Challenging?
Normal FunctioningIntimate connections, fine timing and pattern codeParallel paths, multiple systems/stepInstantaneous mutual regulationSelf regulation of the system over time
Antagonists versus agonists Single target bullets best for probes Therapies generally multi-target

CNS Disease Animal Models can be Misleading Model congruity with disease
Understand the animal modelUnderstand the human diseaseShow them to be congruent in all important respects
Cell CultureCell-cell interactions, relation to nutritional systems,
exogenous environment, phospholipid composition all differ
Mouse ModelsMajor failures of single genesStrain differences suggest a cause for concern

Meeting the Challenge: Clinical Rigor
Success rates are too low to tolerate avoidable flaws
Animal testing under one set of conditions, human trials under another
Ignoring the “does it make scientific sense?” test
Animal models measuring very different dependent variables
Inadequate determination of dose and duration

Using Technology to do Better Trials Key: Near-time trial conduct and analysis Scrutinize blinded data to detect poor sites Exploratory development - double-blind but not
triple blind Exploratory data analysis oriented database
and approach for better programs and submissions
Modeling and simulation for better trials Adaptive trial designs to optimize dose-ranging

Experimental Medicine - Part of the Solution
Is the compound absorbed? Does the compound penetrate to the desired
site of action? For appropriate period of time? Mechanism consistent with hypothesis? Biological effect? Free of class-associated limiting toxicities?

Disease Models Reality is a complex set of interactions Each step can be modeled as differential equations
Myriad publications describe individual piecesSupplemented with research to test the model
Technology allows generation of increasingly sophisticated disease models
Stronger model will produce the insights on target selection and effective therapies
Core Intellectual Property

Electronic Technologies can Improve Chemistry
NIH Protein Structure Initiative Increased supercomputer modeling of protein
folding and interactions Virtual screening Virtual combinatorial chemistry Moving past target to cross-assessing
potential toxic interactions and metabolism

Biological Technologies Have Great Promise
35% of the 37 NAS launched in 2001 Biologics have important attractions Typically less toxic, more predictable
Increasingly human derived
Easier to predict distribution, metabolism and elimination
Faster development Higher success rates Huge ability to match potential targets

Changing the Business Model Historical
Platform orientedFirst line treatments, one size fits all, mass population, easy
(oral) treatment, ameliorating chronic diseaseOne treatment per disease
Next GenerationDisease focusDefined populationsAdministered by specialistsTargeted treatmentsExpand treatments to capture therapeutic subpopulationsPolypharmacy in cases (similar to oncology development)
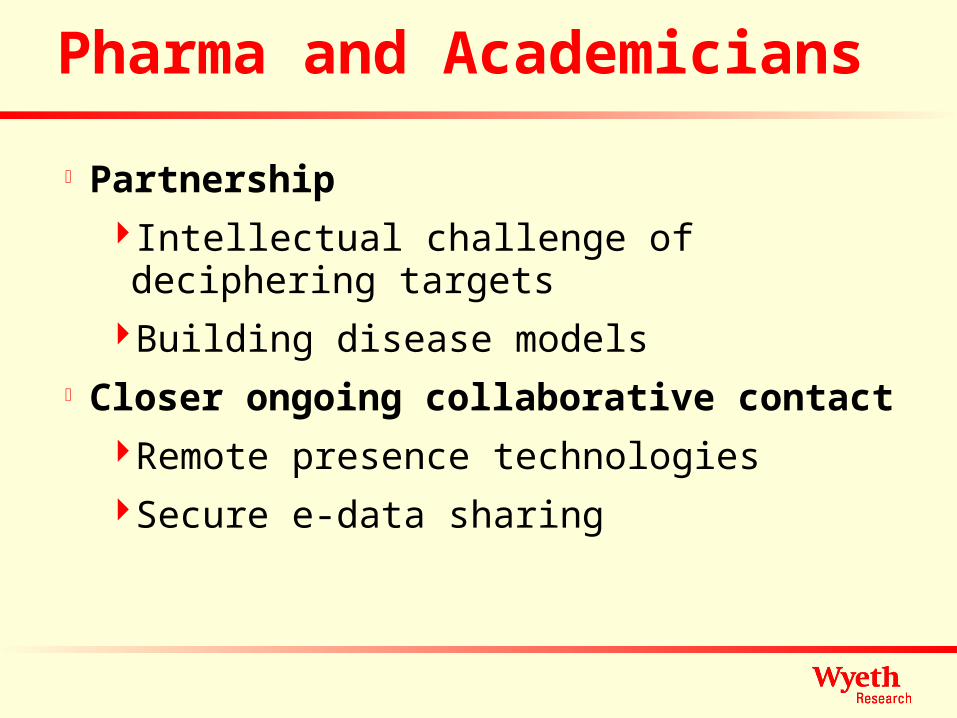
Pharma and Academicians
Partnership
Intellectual challenge of deciphering targets
Building disease models Closer ongoing collaborative contact
Remote presence technologies
Secure e-data sharing

Pharma and Regulators
Shifting to a model of early POC studies in man for both target and molecule validation calls for earlier consultations
Partnership Closer ongoing collaborative contact Rolling dossiers Marketing rights will change from being one-off
to continuous evaluation

A Strategy Going Forward
Focus on intellect and collaboration Pharma focus on disease model Experimental medicine model Tap the power of the information revolution Tap the power of biologic-based technologies Adapt the Business Model