Christian Reformed Church 2012 Survey Report to Synod Files available from Neil Carlson, Director,...
61
Christian Reformed Church 2012 Survey Report to Synod Files available from www.calvin.edu/go/crcsurvey Neil Carlson, Director, CSR Rodger Rice, Barnabas Foundation and CRHM June 10, 2013 1
-
Upload
roland-morris -
Category
Documents
-
view
216 -
download
1
Transcript of Christian Reformed Church 2012 Survey Report to Synod Files available from Neil Carlson, Director,...

Christian Reformed Church2012 SurveyReport to Synod
Files available fromwww.calvin.edu/go/crcsurvey
Neil Carlson, Director, CSRRodger Rice, Barnabas Foundation and CRHM
June 10, 2013
1
Gratitude
Participating churches and respondents (unnamed to protect the innocent).
Translators (named in report) Survey advisory team (named in
report). Rev. Gary Bekker for his
engagement with the project.
2
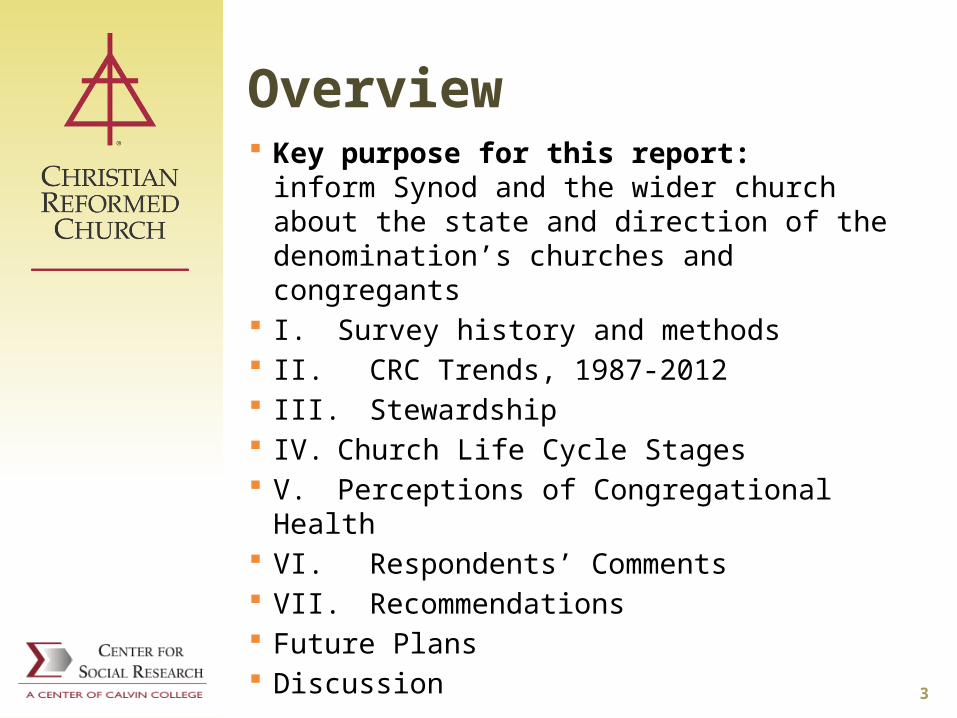
Overview Key purpose for this report:
inform Synod and the wider church about the state and direction of the denomination’s churches and congregants
I. Survey history and methods II. CRC Trends, 1987-2012 III. Stewardship IV. Church Life Cycle Stages V. Perceptions of Congregational Health VI. Respondents’ Comments VII. Recommendations Future Plans Discussion 3

Survey History and Methods
4

2012 Survey Methods Online survey took 20-45 minutes Fielded September 2012 to January 2013 Congregation-based sampling strategy
Sampled 233 congregations(113 repeats from 2007, 120 new).
Churches recruited respondents, including non-members
Second survey wave in which we can analyze individual congregations
Spanish, Korean and Chinese language versions
Massive email and phone recruitment efforts by CSR student team 5
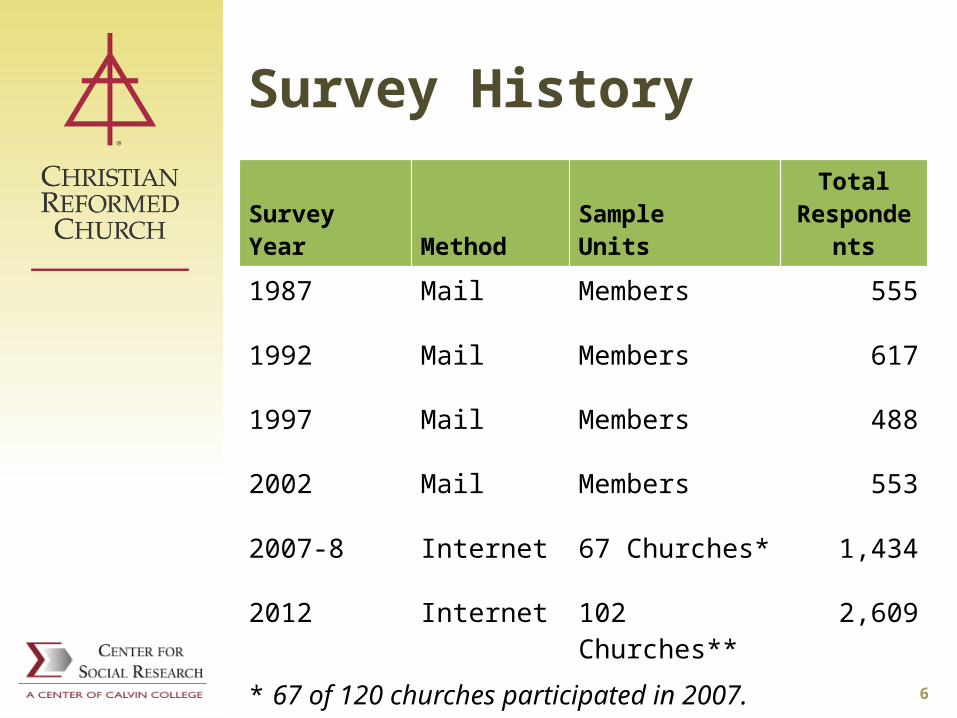
Survey History
Survey Year MethodSampleUnits
Total Respondents
1987 Mail Members 555
1992 Mail Members 617
1997 Mail Members 488
2002 Mail Members 553
2007-8 Internet 67 Churches* 1,434
2012 Internet 102 Churches** 2,609
* 67 of 120 churches participated in 2007.** 102 of 233 churches participated in 2012.
6
Congregational reports 21 congregations returning at least
30 responses received a detailed report.
First time CSR has included such rapid full reports, an offshoot of the Healthy Church reporting.
Effort led by Tom Sherwood ’11 and students Dan Molling ’13 and Melissa Lubbers ’14.
7
CRC Trends, 1987-2012
Six surveys over 25 years
8
Demographic Trends
Aging constituency Declining households with children Stable proportion of households
with children and with children in Christian schools 2007-2012
Stable proportion with college education 2007-2012
Household income trends mixed but increasing overall
9

Aging Population
20122007200219971992198740
42
44
46
48
50
52
54
56
53
51.3
53
51
49
46
54
52
5050
47
44
Mean Median
Age
in y
ears
10
Average age continues to increase
Figure 1on
Page 10

Age Categories by YearProportion over 60 now about 2 in 5
11
1987 1992 1997 2002 2007 20120%
10%
20%
30%
40%
50%
60%
70%
80%
90%
100%
42%33% 27% 22% 25% 23%
31%39%
42% 45% 45%39%
27% 27% 32% 34% 31%39%
Percent in age group for each survey year
60 yrs or older40-59 yearsUnder 40 years
Figure 2on
Page 11
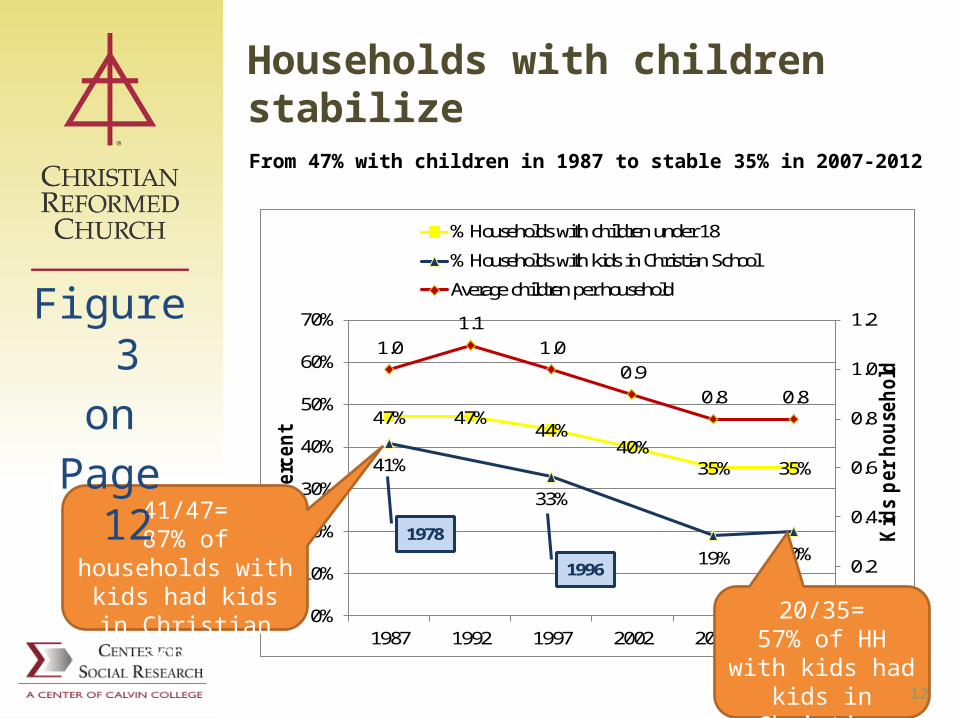
47% 47%44%
40%35% 35%41%
33%
19% 20%
1.01.1
1.00.9
0.8 0.8
0.0
0.2
0.4
0.6
0.8
1.0
1.2
0%
10%
20%
30%
40%
50%
60%
70%
1987 1992 1997 2002 2007 2012
Kid
s per house
hold
Perc
ent
% Households with children under 18
% Households with kids in Christian School
Average children per household
1978
1996
Households with children stabilize
From 47% with children in 1987 to stable 35% in 2007-2012
41/47=87% of households
with kids had kids in Christian school 20/35=
57% of HH with kids had kids in Christian
school 12
Figure 3on
Page 12
1987 1992 1997 2002 2007 20120%
10%
20%
30%
40%
50%
60%
70%
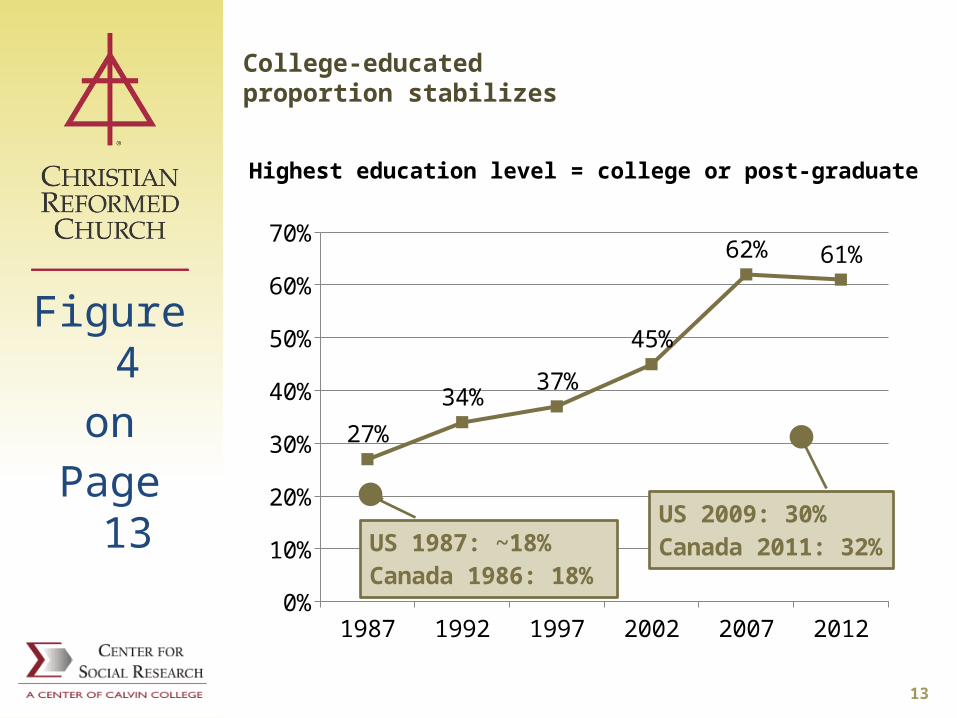
27%
34%37%
45%
62% 61%
US 1987: ~18%Canada 1986: 18%
US 2009: 30%Canada 2011: 32%
College-educated proportion stabilizes
Highest education level = college or post-graduate
13
Figure 4on
Page 13
$45,000
$50,000
$55,000
$60,000
$65,000
$70,000
$75,000
$80,000
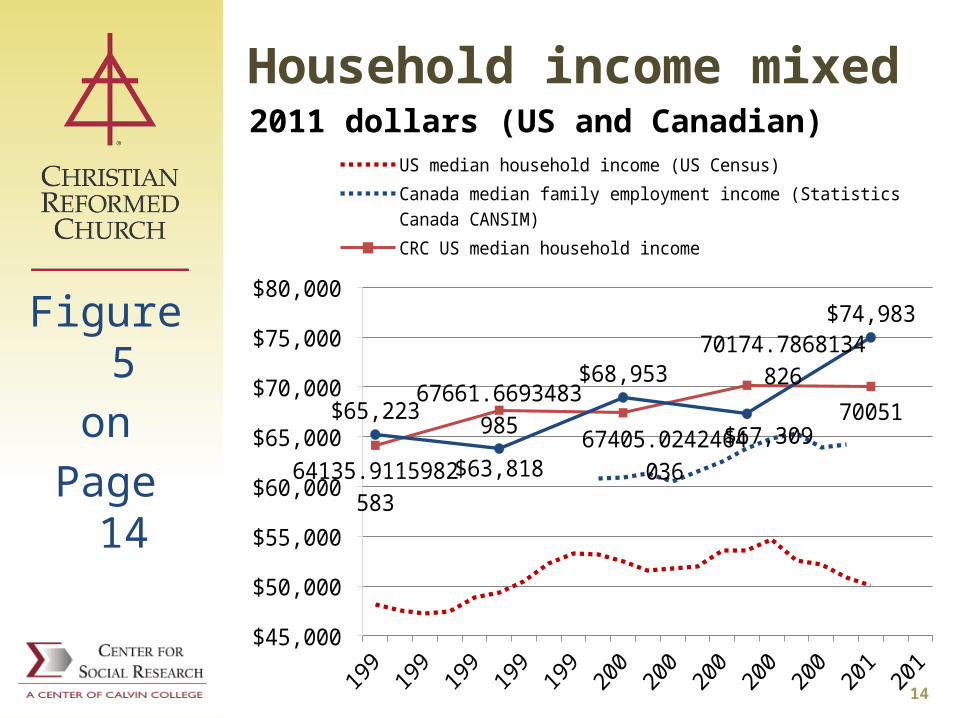
64135.9115982583
67661.6693483985
67405.0242464036
70174.7868134826
70051$65,223
$63,818
$68,953
$67,309
$74,983
US median household income (US Census)Canada median family employment income (Statistics Canada CANSIM)CRC US median household incomeCRC Canada median household income
Household income mixed2011 dollars (US and Canadian)
14
Figure 5on
Page 14
Church-Related Trends
Recovering loyalty to denomination to local church
Declining evening worship attendance
Declining frequency of devotional activities
15
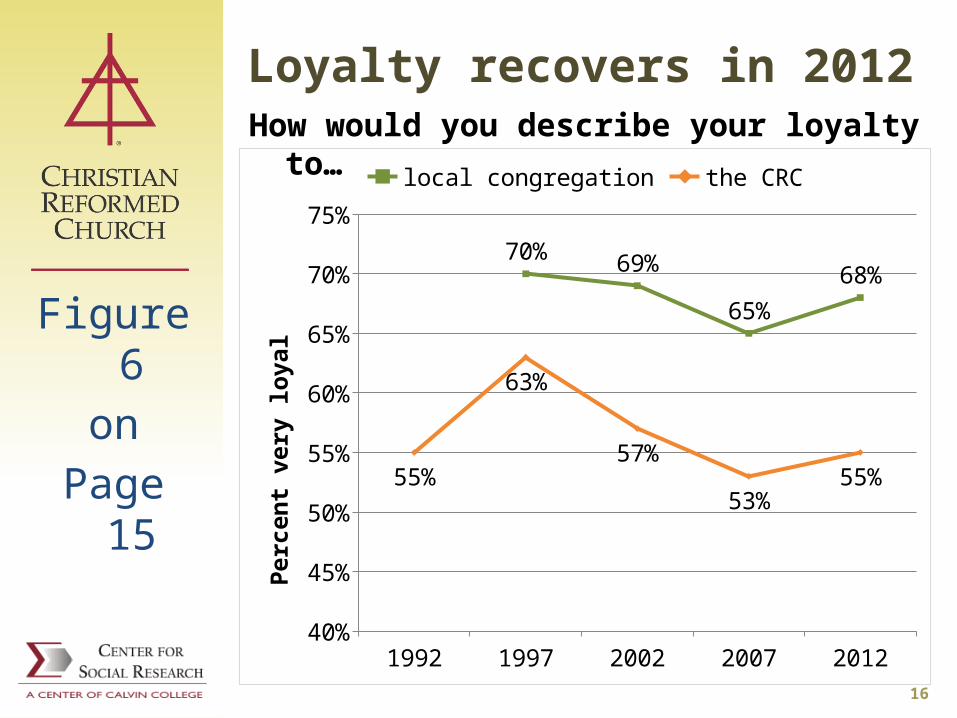
Loyalty recovers in 2012How would you describe your loyalty to…
Figure 6on
Page 15
16
1992 1997 2002 2007 201240%
45%
50%
55%
60%
65%
70%
75%
70% 69%
65%68%
55%
63%
57%
53%55%
local congregation the CRC
Perc
ent v
ery
loya
l

Loyalty varies by generationHow would you describe your loyalty to …[this congregation/ the CRCNA]? (2012)
17
Figure 7on
Page 16

Attendance falls AM and PM
19
1987 1992 1997 2002 2007 20120%
10%20%30%40%50%60%70%80%90%
100%87% 90% 92% 89% 91%
86%
51%57%
49% 46%
24%17%
How often do you attend Sunday [morn-ing/evening] worship services?
% every Sunday morning % every Sunday evening
Figure 9on
Page 18
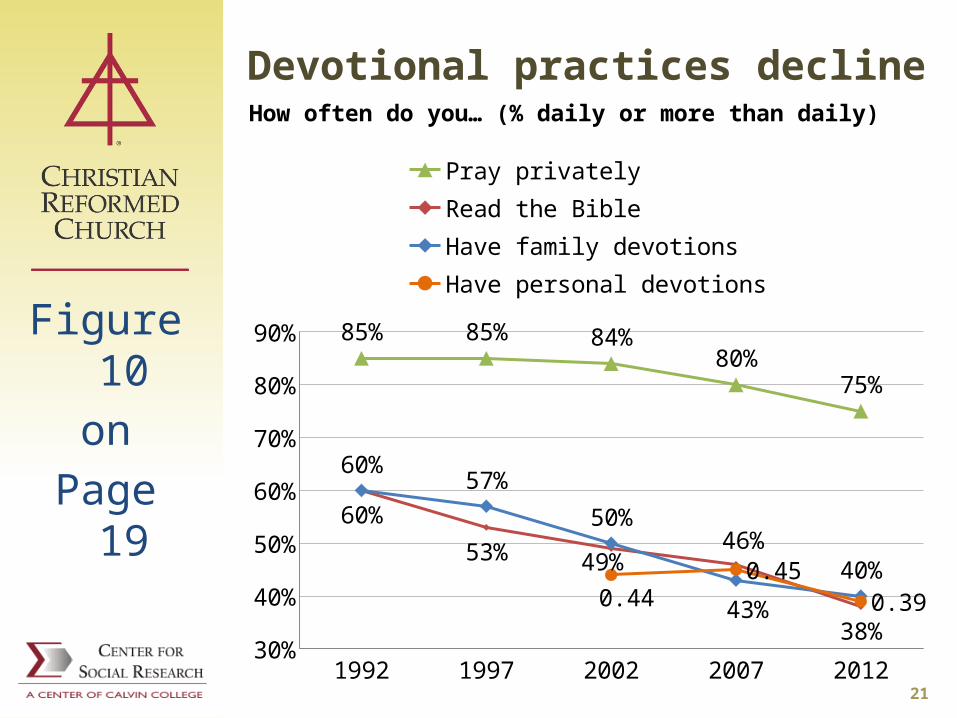
Devotional practices declineHow often do you… (% daily or more than daily)
211992 1997 2002 2007 2012
30%
40%
50%
60%
70%
80%
90% 85% 85% 84%80%
75%
60%
53%49%
46%
38%
60%57%
50%
43%
40%0.44
0.450.39
Pray privatelyRead the BibleHave family devotionsHave personal devotions
Figure 10on
Page 19

Stewardship
Focus on percent of incomegiven to congregation
22
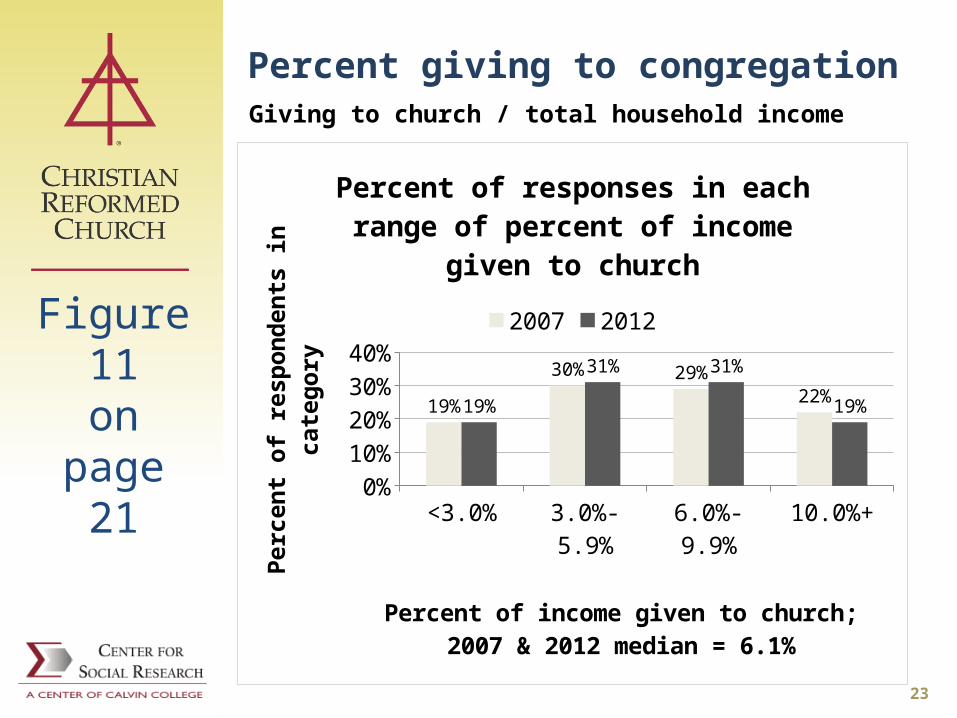
Percent giving to congregationGiving to church / total household income
Figure 11on
page 21
23
<3.0% 3.0%-5.9% 6.0%-9.9% 10.0%+0%
5%
10%
15%
20%
25%
30%
35%
19%
30% 29%
22%19%
31% 31%
19%
Percent of responses in each range of percent of income given to church
2007 2012
Percent of income given to church; 2007 & 2012 median = 6.1%
Perc
ent o
f res
pond
ents
in c
ateg
ory
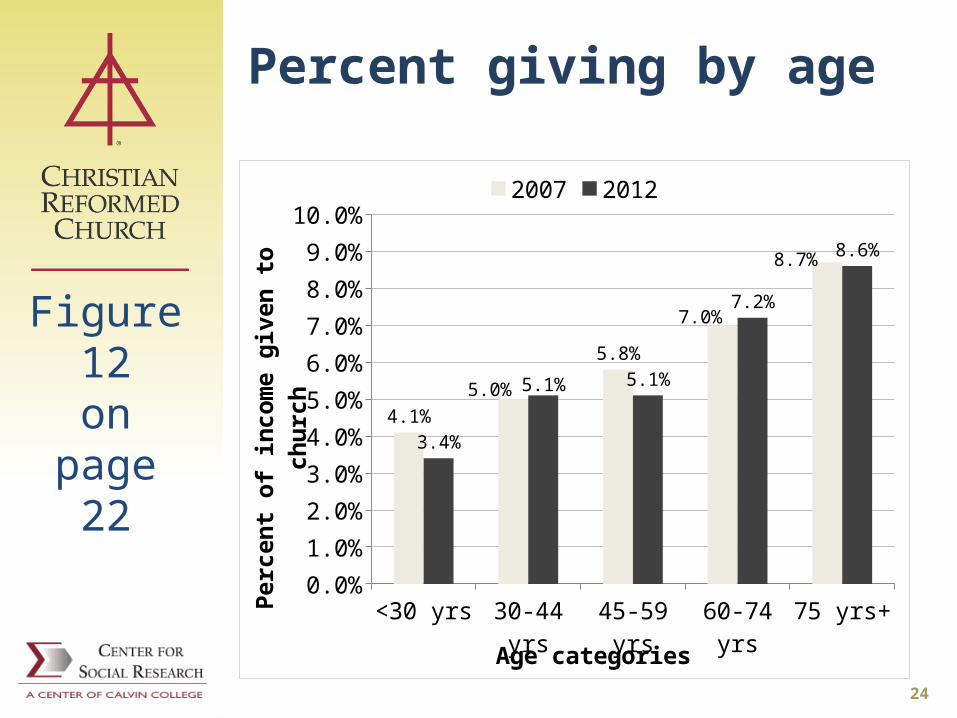
Percent giving by age
24
<30 yrs 30-44 yrs 45-59 yrs 60-74 yrs 75 yrs+0.0%
1.0%
2.0%
3.0%
4.0%
5.0%
6.0%
7.0%
8.0%
9.0%
10.0%
4.1%5.0%
5.8%
7.0%
8.7%
3.4%
5.1% 5.1%
7.2%
8.6%
2007 2012
Age categories
Perc
ent o
f inc
ome
give
n to
chu
rch
Figure 12on
page 22

Percent giving by income
25
<$30K $30K-$49,999
$50K-$69,999
$70K-$99,999
$100K or more
0.0%1.0%2.0%3.0%4.0%5.0%6.0%7.0%8.0%9.0%
7.0%7.7%
5.9% 5.6% 5.3%
6.6%
7.8%
6.3% 6.1%
5.1%
2007 2012
Income rangesPerc
ent o
f inc
ome
give
n to
chu
rch
Figure 13on
page 23

Percent giving by loyalty
27
2007 2012 2007 20120.0%
1.0%
2.0%
3.0%
4.0%
5.0%
6.0%
7.0%
8.0%
5.9%6.2%
3.6%4.1%
5.7% 5.5%
4.9% 5.1%
6.2%6.7% 6.9% 6.9%
Not very loyal Somewhat loyal Very loyal
Perc
ent o
f inc
ome
give
n to
chu
rch
Loyalty to CRC Loyalty to congregation
Figure 15on
page 25
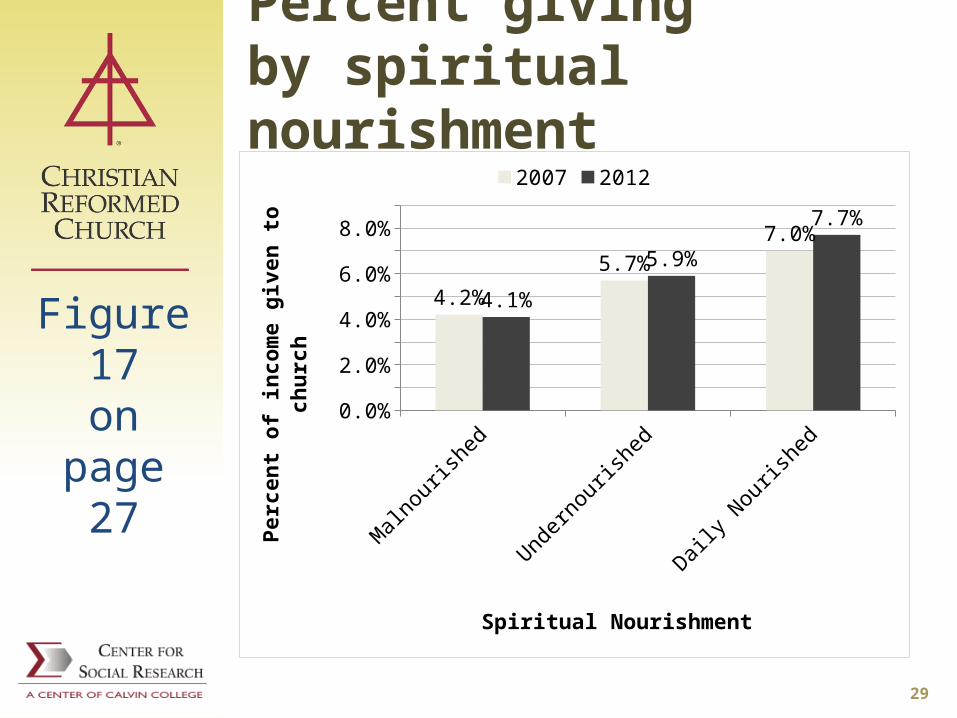
Percent giving by spiritual nourishment
29
Malnourished Undernourished Daily Nourished0.0%
1.0%
2.0%
3.0%
4.0%
5.0%
6.0%
7.0%
8.0%
9.0%
4.2%
5.7%
7.0%
4.1%
5.9%
7.7%
2007 2012
Spiritual Nourishment
Perc
ent o
f inc
ome
give
n to
chu
rch
Figure 17on
page 27
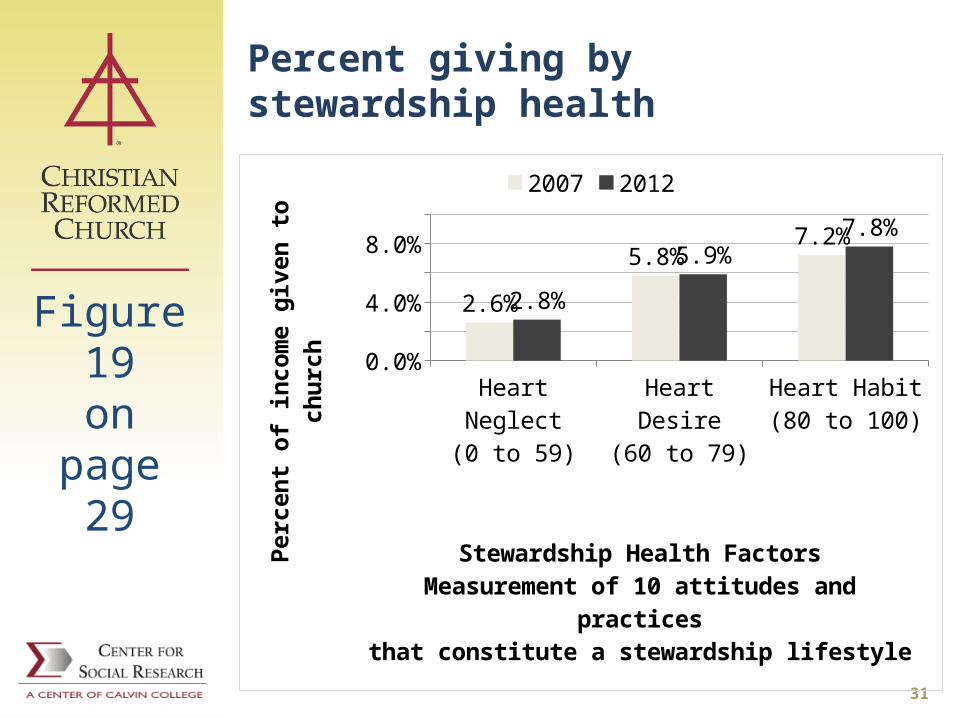
Percent giving bystewardship health
31
Heart Neglect(0 to 59)
Heart Desire(60 to 79)
Heart Habit(80 to 100)
0.0%1.0%2.0%3.0%4.0%5.0%6.0%7.0%8.0%9.0%
2.6%
5.8%
7.2%
2.8%
5.9%
7.8%
2007 2012
Stewardship Health FactorsMeasurement of 10 attitudes and practices
that constitute a stewardship lifestyle
Perc
ent o
f inc
ome
give
n to
chu
rch
Figure 19on
page 29

CongregationalLife Cycle Stages
Renewing mature and aging churches
33

Church Life Cycle Stages
Analogy (but not full similarity) to human life cycles
George Bullard,Pursuing the Full Kingdom Potential of Your Congregation. Infancy/childhood Adolescence Adulthood Maturity Empty nest/retirement Old age/dying
34
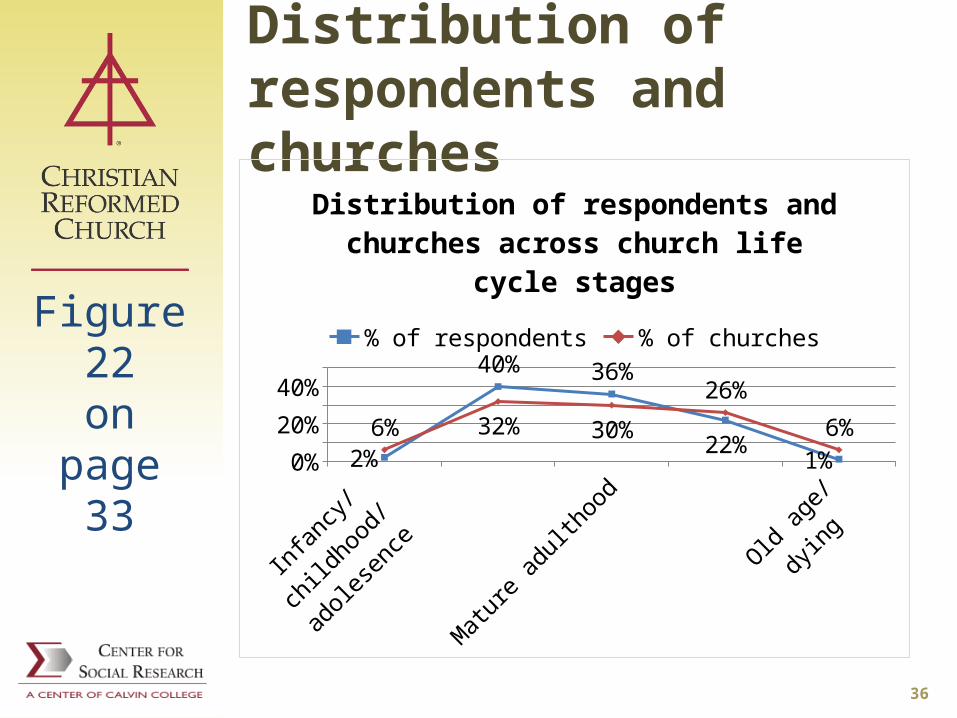
Distribution of respondents and churches
36
Infancy/childhood/adolesence
Young adulthood
Mature adulthood
Empty nest/
retirement
Old age/dying
0%5%
10%15%20%25%30%35%40%45%
2%
40%36%
22%
1%
6%
32% 30%26%
6%
Distribution of respondents and churches across church life cycle stages
% of respondents % of churches
Figure 22on
page 33

Membership changeby life cycle stage
Life Cycle Stage
Average number
of members
*% change last
five years*Infancy/childhood/adolescence 102 19%Young adulthood 439 1%Mature adulthood 385 0%Empty nest/retirement 259 -15%Old age/dying 186 -29%
37
Table 4on
page 33

Church health by life stage
38
Old age/dying
Empty nest/retirement
Mature adulthood
Young adulthood
Infancy/childhood/adolescence
0% 10% 20% 30% 40% 50% 60% 70% 80% 90%100%
0%
8%
26%
31%
33%
9%
47%
53%
52%
59%
30%
26%
16%
12%
5%
39%
13%
22%
Overall current health of your church?
Great Good Fair Poor Awful Unsure
Figure 23on Page 34

Healthy Church scales by life stage
39
Figure 24on Page 35

Enthusiasm by life stage
46
Old age/dying
Empty nest/retirement
Mature adulthood
Young adulthood
Infancy/childhood/adolescence
0% 10% 20% 30% 40% 50% 60% 70% 80% 90%100%
11%
10%
19%
26%
42%
25%
54%
59%
55%
50%
39%
24%
17%
15%
7%
18%
10%
4%
3%
1%
How much enthusiasm feel about work & programs of your church
Very high Moderately high Moderately lowVery low Unsure
Figure 26on Page 37
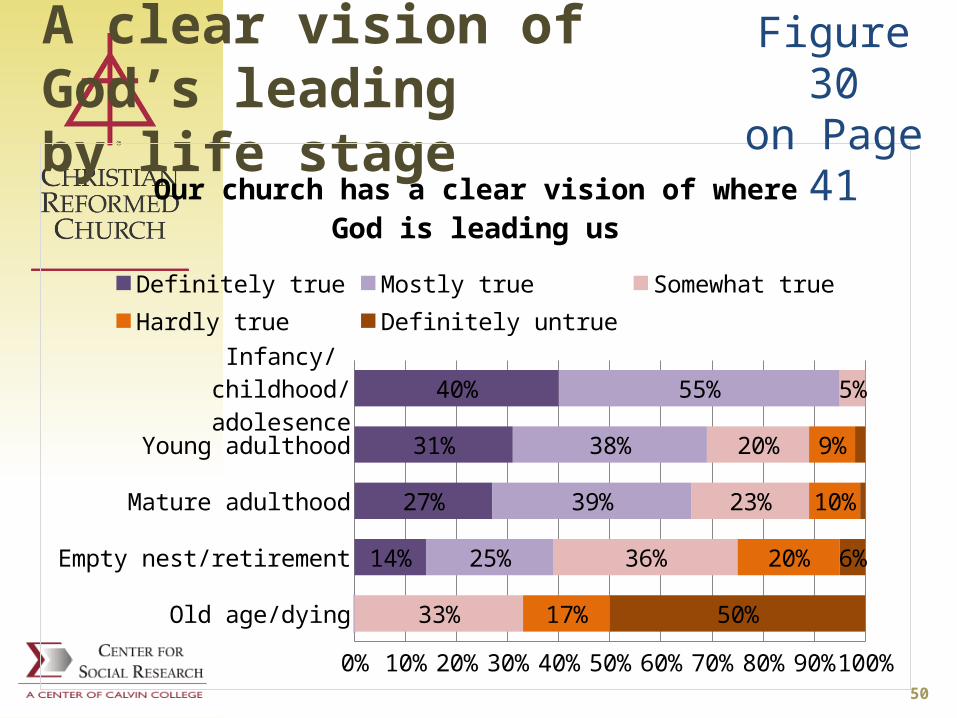
A clear vision of God’s leadingby life stage
50
Old age/dying
Empty nest/retirement
Mature adulthood
Young adulthood
Infancy/childhood/adolesence
0% 10% 20% 30% 40% 50% 60% 70% 80% 90% 100%
33%
36%
23%
20%
5%
17%
20%
10%
9%
50%
6%14%
27%
31%
40%
25%
39%
38%
55%
Our church has a clear vision of where God is leading us
Definitely true Mostly true Somewhat trueHardly true Definitely untrue
Figure 30on Page 41
Can these bones live?
Death is not inevitable; intervention can bring renewal
Leaders may be unaware of their church’s present life stage
Recasting vision is essential Financial resources are still
available even in decline Some members of aging churches
are still willing to make sacrifices51
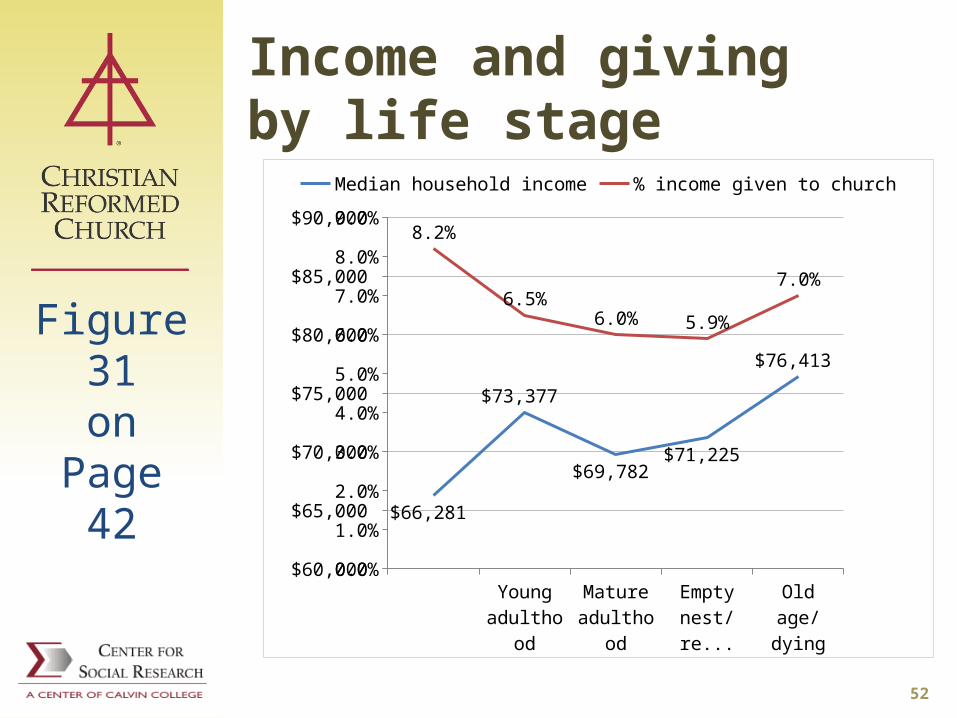
Income and givingby life stage
52
Old age/dying
Empty nest/re-
tire-ment
Mature adult-hood
Young adult-hood
Infancy/child-hood/
adoles-ence
$60,000
$65,000
$70,000
$75,000
$80,000
$85,000
$90,000
0.0%
1.0%
2.0%
3.0%
4.0%
5.0%
6.0%
7.0%
8.0%
9.0%
$76,413
$71,225 $69,782
$73,377
$66,281
7.0%
5.9%6.0%6.5%
8.2%
Median household income % income given to church
Figure 31on
Page 42

Commitment to missionby life stage
53
Old age/dying
Empty nest/retirement
Mature adulthood
Young adulthood
Infancy/childhood/adolesence
0% 10% 20% 30% 40% 50% 60% 70% 80% 90% 100%
17%
28%
31%
39%
40%
17%
32%
32%
27%
40%
67%
19%
10%
6%
16%
23%
24%
20%
5%
3%
3%
So committed to church's mission and vision that willing to make sacrifices
Definitely true Mostly true Somewhat true Hardly true Definitely untrue
Figure 32on
Page 43
Measuring and Explaining Congregational Health
Indexes based on theHealthy Church Survey
54
Focus on Healthy Congregations
Survey itself part of a message to congregations about denominational priorities
We included all items from the 2012 Healthy Church Survey (HCS) 11 health areas Evaluations of church and self 22 items seen by all respondents 4 of 22 sections shown randomly 40-50 items total 55

Perceptions of overall current health improve over 2007
56
Figure 33on
Page 44
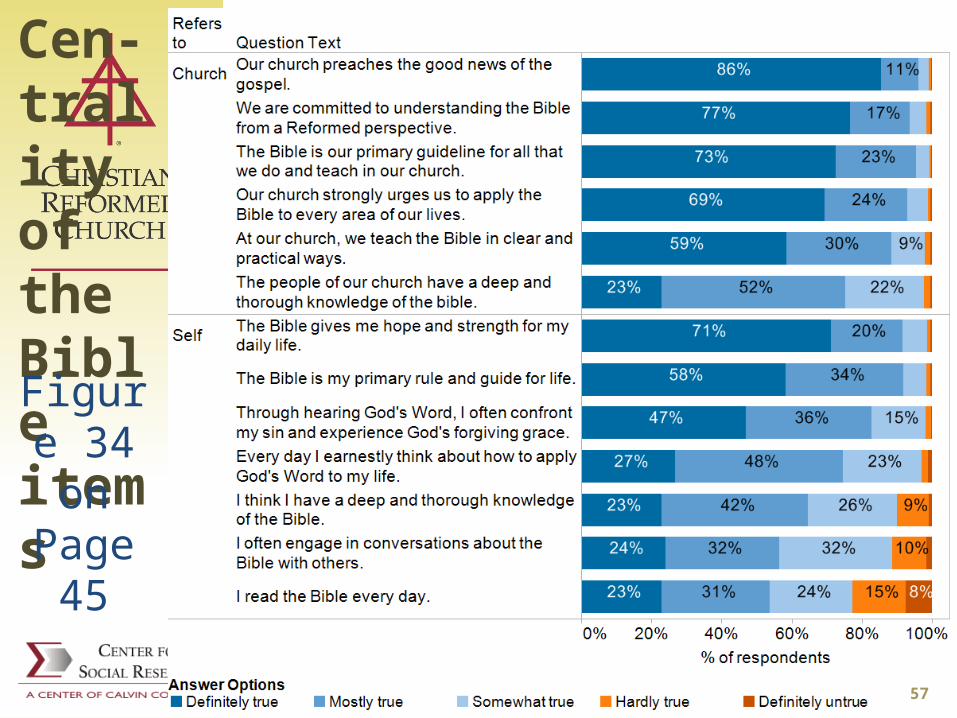
Cen-trality
of the
Bible items
57
Figure 34on
Page 45
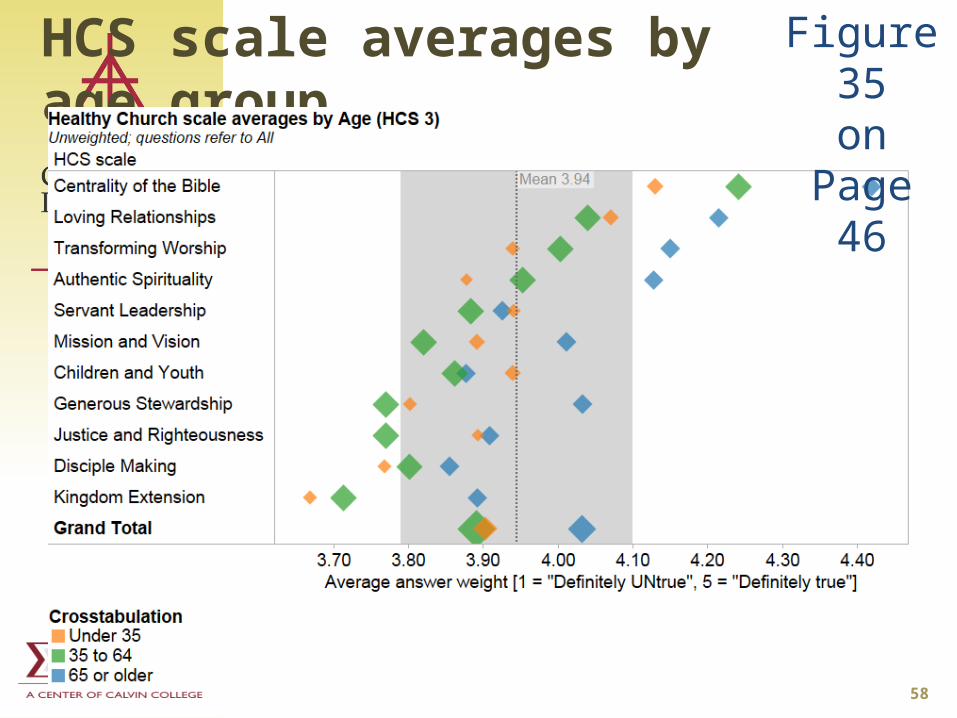
HCS scale averages by age group
58
Figure 35on
Page 46

Church- and self-rating items
59
HCS scale
3.60 3.70 3.80 3.90 4.00 4.10 4.20 4.30 4.40 4.50Average answer weight [1 = "Definitely UNtrue", 5 = "Definitely true"]
Centrality of the Bible
Loving Relationships
Transforming Worship
Authentic Spirituality
Servant Leadership
Mission and Vision
Children and Youth
Generous Stewardship
Justice and Righteousness
Disciple Making
Kingdom Extension
Grand Total
Mean 3.934.28
4.08
4.02
3.99
3.90
3.87
3.87
3.84
3.83
3.80
3.76
3.92
Healthy Church scale averages by Referent (Church/Self)Unweighted; questions refer to All
CrosstabulationChurchSelf
Figure 36on Page 47
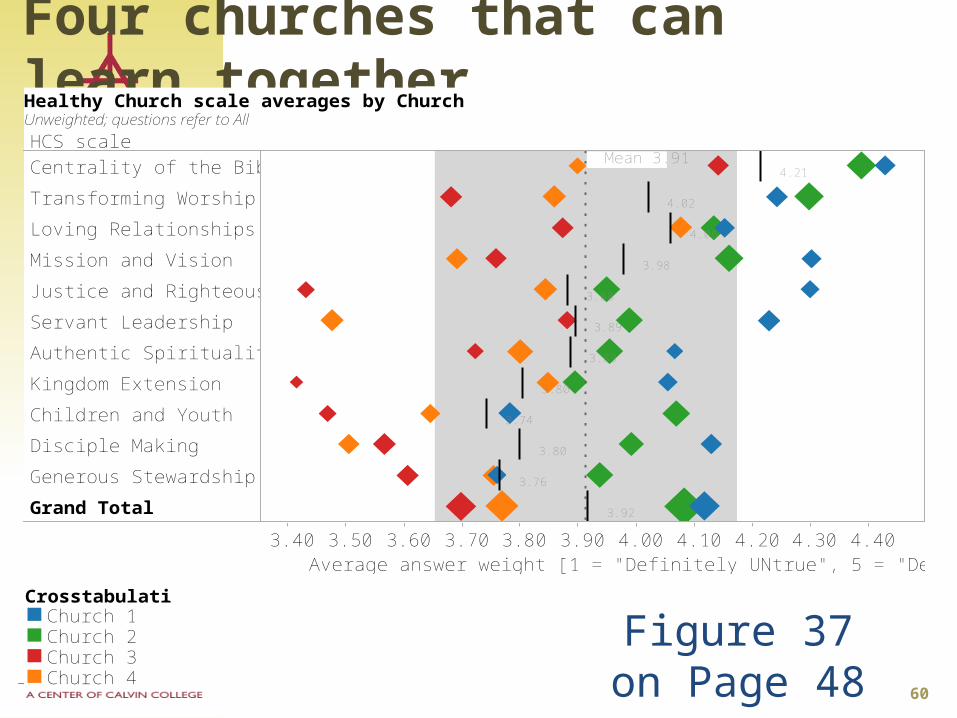
Four churches that can learn together
60
HCS scale
3.40 3.50 3.60 3.70 3.80 3.90 4.00 4.10 4.20 4.30 4.40Average answer weight [1 = "Definitely UNtrue", 5 = "Definitely true"]
Centrality of the Bible
Transforming Worship
Loving Relationships
Mission and Vision
Justice and Righteousness
Servant Leadership
Authentic Spirituality
Kingdom Extension
Children and Youth
Disciple Making
Generous Stewardship
Grand Total
Mean 3.914.21
4.02
4.06
3.98
3.88
3.89
3.89
3.80
3.74
3.80
3.76
3.92
Healthy Church scale averages by ChurchUnweighted; questions refer to All
CrosstabulationChurch 1Church 2Church 3Church 4
Figure 37on Page 48
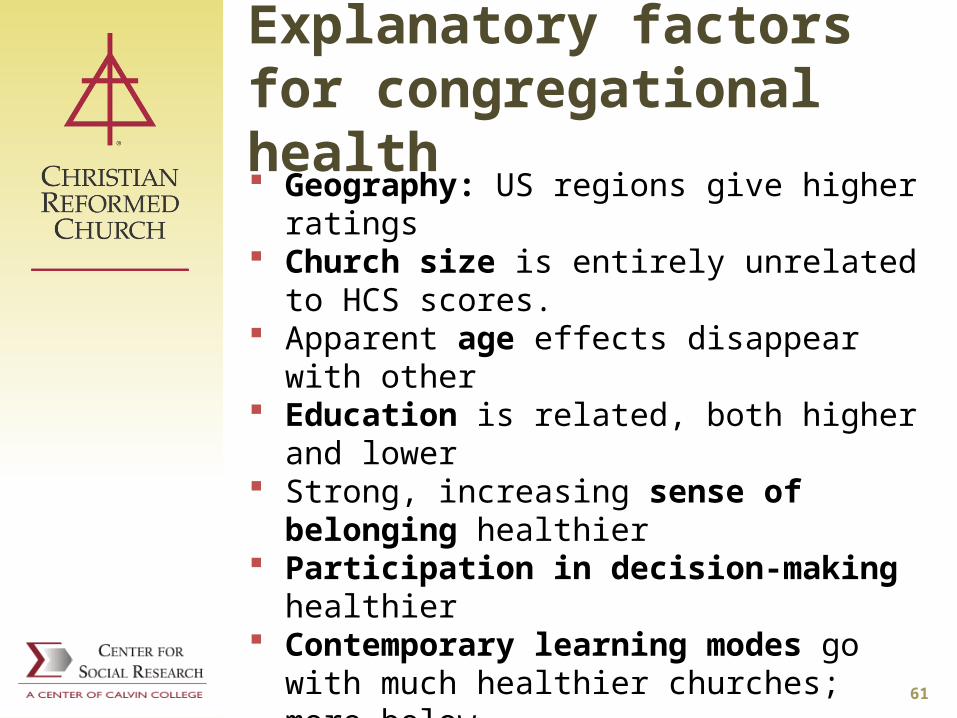
Explanatory factors for congregational health Geography: US regions give higher ratings Church size is entirely unrelated to HCS scores. Apparent age effects disappear with other Education is related, both higher and lower Strong, increasing sense of belonging healthier Participation in decision-making healthier Contemporary learning modes go with much
healthier churches; more below. Devotional frequency relates to healthier
churches. Stewardship health goes with higher self-ratings
and slightly lower church ratings.
61
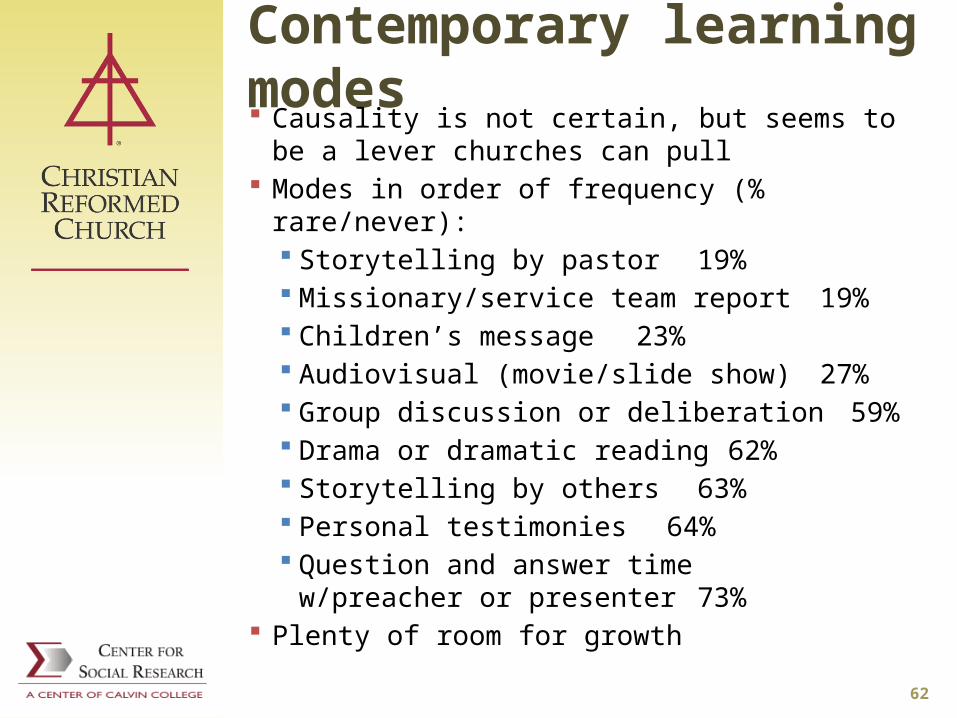
Contemporary learning modes Causality is not certain, but seems to be a lever
churches can pull Modes in order of frequency (% rare/never):
Storytelling by pastor 19% Missionary/service team report 19% Children’s message 23% Audiovisual (movie/slide show) 27% Group discussion or deliberation 59% Drama or dramatic reading 62% Storytelling by others 63% Personal testimonies 64% Question and answer time
w/preacher or presenter 73% Plenty of room for growth
62

Respondents’ comments
64

Coding methodology
Comments were moved to a separate database
100 comments from each section were reviewed to seek for major themes
Students coded all 779 comments Each comment can include one or
more themes
65
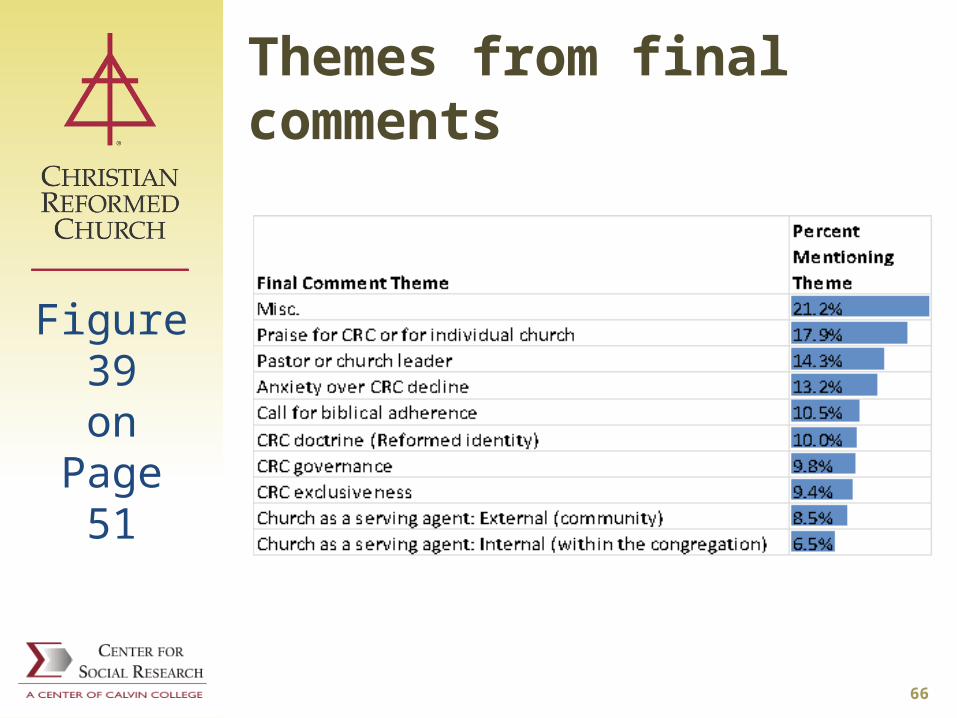
Themes from final comments
66
Figure 39on
Page 51
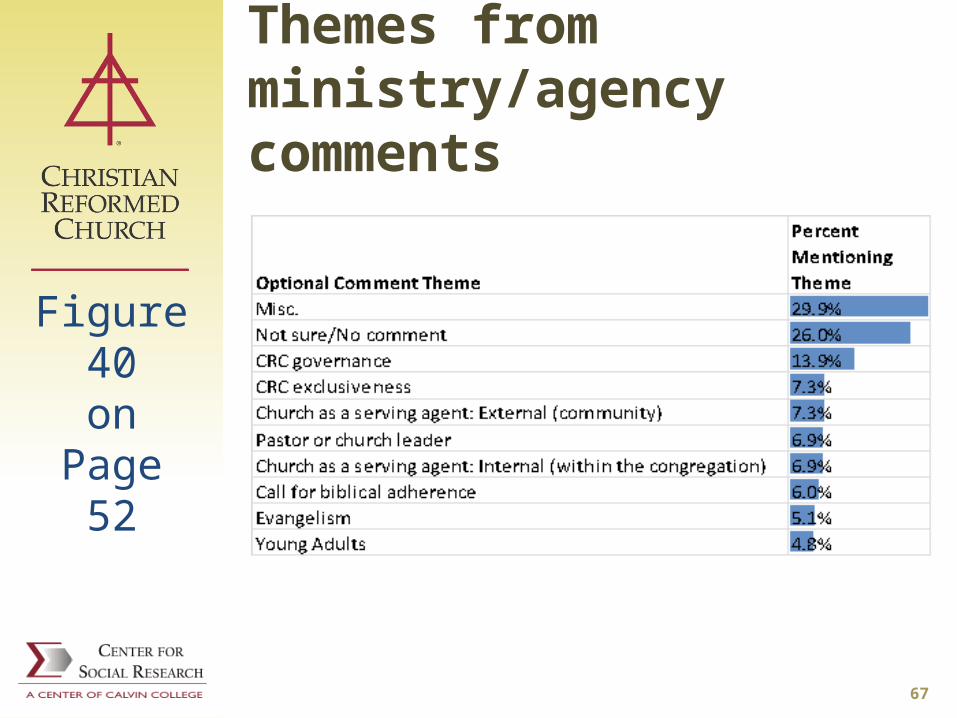
Themes from ministry/agency comments
67
Figure 40on
Page 52

Iconic positive comment I appreciated this opportunity to give my opinion about the CRCNA. This is my native denomination and I continue to feel a deep sense of loyalty and concern for its future. I am profoundly thankful for the training, nurture, and faith development I received as a child from my parents, Sunday school teachers, Christian day school teachers, and college professors. I owe so much of what I am today to the CRCNA and the local church in which I grew up. I struggle with how to move into the 21st century as a Reformed denomination, with the difficult, complicated, global issues we face. I continue to pray mightily for 'us'.
68

Concern about perceived driftI would like to see more emphasis put on our commitment and relationship with our God/Father. In my humble opinion, I feel as a church we are drifting away from our strong heritage. With trying to be [relevant] in today’s society, we are losing our deep knowledge and teaching of the past. The Bible is still true for today, and we must search the Scriptures to find our answers for today. I love how we are more eager to reach out to our neighbors, but we must keep our strong Bible teaching and worship. Our love for God and our commitment to him will win others for him.
69

Concern about exclusivity
[There was] nothing in [the] survey about doctrine. I have found that CRC and Reformed in general is closed-minded and superficial about accepting other denominations and individuals of STRONG Christian faith into the leadership of the church. They have a snob-appeal, country club attitude regarding the Reformed doctrine.
70

Agency connectionsAs a transplant from another denomination, I am very impressed with the connection that the local church has with the CRC as a denomination. The Banner is a great resource for communicating all of the ministry that is going on in the church and through the church. In addition, I am so excited about the work of the CRC locally and internationally—Back to God, CRWRC [World Renew], creation care. Wow! What a witness to the world around us!
71
Agency disconnections
I’m finding the agencies disconnected from the average church-goer in our community. The Board structures are puzzling, even confusing. It currently feels like a one-way relationship. We support many of those organizations, but I don’t really see how they serve our church specifically.
72
Discussion Vocal minority concerned about “drift”
away from heritage Vocal minority concerned that exclusivity
hinders renewal Reformed holism still builds bridges; the
line between “traditionalist” vs. “progressive” are not as brightly drawn as some may think.
Intentional efforts to address tension produce specific positive results
Do we talk enough about respect for the other parts of the body and their roles?
73

Recommendations
74

Five keys from 2007 report
Spiritual development, Stewardship education, Disciple-making, Leadership training, and Keeping in touch (communication
with congregants)
75

Three keys from 2012 report Church renewal, including Healthy
Church coaching; churches might learn from each other and be revitalized through coaching.
Contemporary learning modes:More children’s messages, storytelling, drama, audiovisual, testimony, mission reports, and discussion.
One body, with unity in diversityA concerted “I Corinthians 12” effort to teach each other about the God-given gifts of others.
76

The Future
Incorporating your ideas and questions Report sections:
More demographics More HCS data Same-church trends Church life cycles Stewardship (giving)
Replication with all minority churches? Collaboration with Healthy Church
77

Discussion
78