
Issue Mapping And Interventions Chris Rose [email protected].

UBC Social Ecological Economic Development Studies (SEEDS) Student Report
Drain Water Heat Recovery
Chris Frankowski
University of British Columbia
CEEN 596
May 6, 2013
Disclaimer: “UBC SEEDS provides students with the opportunity to share the findings of their studies, as well as their opinions,
conclusions and recommendations with the UBC community. The reader should bear in mind that this is a student project/report and
is not an official document of UBC. Furthermore readers should bear in mind that these reports may not reflect the current status of
activities at UBC. We urge you to contact the research persons mentioned in a report or the SEEDS Coordinator about the current
status of the subject matter of a project/report”.

Drain Water Heat Recovery
A review of performance, economics, practical issues and applications
CEEN 596 Final Project May 6, 2013 Chris Frankowski

1
Executive Summary
This project evaluates the economics of Drain Water Heat Recovery (DWHR), more specifically the
performance of a horizontal DWHR device manufactured by EcoDrain, the A1000. The device was tested
in a rig that mimics a typical real world installation. The temperature increase and flow rate of fresh
water passing through the device was recorded to determine the energy saved while showering. Both
the transient and steady state performance of the device was determined. By combining the testing
results with a dataset of Canadian household sizes, showering habits, and energy costs, a
recommendation is made for the conditions under which the installation of an EcoDrain would be
economically advantageous.
The testing simulates an installation where the fresh water being preheated supplies only the associated
fixture, which would be the easiest installation for an existing building. Testing showed an average
temperature increase of 12.2°C with a flow rate of 3.87 L/min of fresh water passing through the DWHR
device, which corresponds to a heat transfer rate (power savings) of 3.29 kW, and a total of 0.43 kWh
saved per shower.
The average Canadian household has a size of 2.59 people, with each person showering once a day for
8.5 minutes each. Energy costs vary significantly around the country, but the average electricity rate is
9.41¢/kWh and 7.13 $/GJ. For the average household, the NPV of DWHR is -$203.68 for homes with
electric water heaters and -$464.88 for homes with natural gas water heaters.
DWHR is much more economical for households with electric hot water heaters as their energy costs are
much higher. A household of 4 or more people with an electric hot water heater would benefit from
installing a DWHR device such as the EcoDrain. Locations with natural gas heaters would benefit from
DWHR if there are more than 14 users a day, or if natural gas prices return to more historic levels.

2
Acknowledgements
I would like to thank Dr. Eric Mazzi for finding this project opportunity and continuous help along the
way, and also for all the work he does for the CEEN program and its students. I would also like to thank
David Velan, who manages EcoDrain. David provided the EcoDrain A1000 for testing, as well as support
in securing an installation location and technical support regarding installation, testing, and general
information.
I would also like to thank Brenda Sawada, Lillian Zaremba, Jeff Giffin, and everyone at UBC Campus +
Community planning for their time and efforts in finding a location on campus to install the EcoDrain.
Although we weren’t able to secure a location for installation due to time constraints, the experience
was valuable and hopefully we’ve laid some groundwork for a future student.
Finally, I would like to thank those closest to me. My parents, who have shown me how much is possible
with hard work and have inspired me to follow my dreams no matter how challenging that journey may
be. Babcia, for your continuous support and endless kindness throughout my life. Dianne, you’ve
brought us to where we are today, thank you.

3
Table of Contents Executive Summary ....................................................................................................................................................... 1
Acknowledgements ....................................................................................................................................................... 2
Introduction ................................................................................................................................................................... 4
Background ............................................................................................................................................................... 4
Installation at UBC ..................................................................................................................................................... 8
Purpose and Objectives ............................................................................................................................................. 9
Motivation ............................................................................................................................................................... 10
Literature Review .................................................................................................................................................... 11
Data Sources and Methodology .................................................................................................................................. 12
Statement of Typical Conditions ............................................................................................................................. 14
DWHR Performance Evaluation .............................................................................................................................. 16
Testing Setup ...................................................................................................................................................... 16
Testing Methodology .......................................................................................................................................... 18
Results and Discussion ................................................................................................................................................. 19
Testing Results ........................................................................................................................................................ 19
Steady State Performance .................................................................................................................................. 19
Transient Response ............................................................................................................................................. 21
Installation and Maintenance Costs ........................................................................................................................ 23
NPV .......................................................................................................................................................................... 24
Sensitivity Analysis .................................................................................................................................................. 25
Break-Even .............................................................................................................................................................. 26
Scenarios ................................................................................................................................................................. 27
High Use .............................................................................................................................................................. 27
Atlantic Canada ................................................................................................................................................... 28
Improvements ..................................................................................................................................................... 29
Use for DMS and Implications ................................................................................................................................. 30
Other Considerations ................................................................................................................................................... 31
Conclusions .................................................................................................................................................................. 32
Significance of Work .................................................................................................................................................... 32
Recommendations ....................................................................................................................................................... 33
Works Cited ................................................................................................................................................................. 34
Appendix A – Calculations ........................................................................................................................................... 37
Appendix B – NRCAN DWHR testing procedure .......................................................................................................... 38
Appendix C – EcoDrain A1000 DataSheet .................................................................................................................... 39

4
Introduction
Background
Drain water heat recover (DWHR) is the process of transferring heat from an effluent flow to another
flow that requires heating, thereby utilizing energy that would have otherwise been wasted. A DWHR
device is a heat exchanger that allows this heat transfer to occur, while ensuring that the two flows do
not mix. This project analyzes the use of a DWHR device in a residential setting where the effluent
stream is greywater from a bathroom shower that is used to heat fresh water. A DWHR device must be
designed to withstand an effluent stream with irregular flow containing a mixture of various liquids and
solids, with little to no maintenance. This durability comes as a sacrifice of performance and size.
All of the DWHR devices currently eligible for Natural Resources Canada’s incentives (ThermoDrain,
Power-Pipe, and Watercycle) consist of a similar design including copper tubing wrapped around a
copper drain pipe that is to be installed in a vertical portion of drain piping. This project reviews the
performance of the A1000 DWHR device made by EcoDrain, which is a horizontal DWHR device.
Horizontal DWHR devices have several advantages over vertical DWHR devices including more flexible
installation options and opportunities for innovation and cost reductions. Installation options for a
vertical DWHR device are limited to perfectly vertical pipe. If the pipe is not perfectly vertical, the tested
heat transfer rate will not be achieved because the water will not completely and evenly cling to the
inside wall of the pipe as is necessary. Horizontal DWHR devices can be installed on horizontal or sloped
runs, which occur more frequently (installation is feasible in more locations), are closer to the fixture
(higher efficiencies due to lower heat loss, and lower likelihood of having cold effluent streams running
through the DWHR device), and are more accessible generally (construction will have a smaller and
more contained footprint).
5
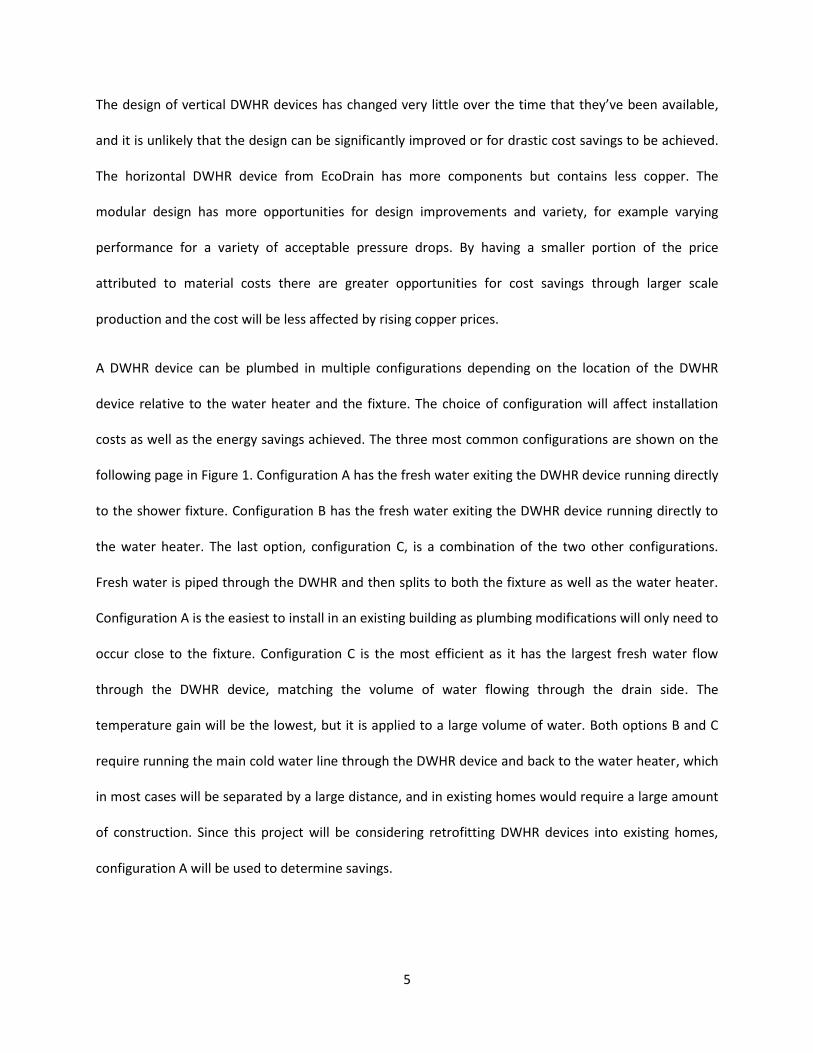
The design of vertical DWHR devices has changed very little over the time that they’ve been available,
and it is unlikely that the design can be significantly improved or for drastic cost savings to be achieved.
The horizontal DWHR device from EcoDrain has more components but contains less copper. The
modular design has more opportunities for design improvements and variety, for example varying
performance for a variety of acceptable pressure drops. By having a smaller portion of the price
attributed to material costs there are greater opportunities for cost savings through larger scale
production and the cost will be less affected by rising copper prices.
A DWHR device can be plumbed in multiple configurations depending on the location of the DWHR
device relative to the water heater and the fixture. The choice of configuration will affect installation
costs as well as the energy savings achieved. The three most common configurations are shown on the
following page in Figure 1. Configuration A has the fresh water exiting the DWHR device running directly
to the shower fixture. Configuration B has the fresh water exiting the DWHR device running directly to
the water heater. The last option, configuration C, is a combination of the two other configurations.
Fresh water is piped through the DWHR and then splits to both the fixture as well as the water heater.
Configuration A is the easiest to install in an existing building as plumbing modifications will only need to
occur close to the fixture. Configuration C is the most efficient as it has the largest fresh water flow
through the DWHR device, matching the volume of water flowing through the drain side. The
temperature gain will be the lowest, but it is applied to a large volume of water. Both options B and C
require running the main cold water line through the DWHR device and back to the water heater, which
in most cases will be separated by a large distance, and in existing homes would require a large amount
of construction. Since this project will be considering retrofitting DWHR devices into existing homes,
configuration A will be used to determine savings.

6
Configuration A
Configuration B
Configuration C
Figure 1: Installation configurations for DWHR devices
The DWHR device that is being studied in this project is the EcoDrain A1000. It is shown on the
next page in Figure 2. The device has a heat exchanger length of 122 cm (48’’), a total length of 142 cm
(56’’), a width of 13 cm (5’’), and a height of 11 cm (4.5’’). The body of the device is made of plastic. The
device consists of the upper drain water region where the effluent steam flows, having a flat copper
bottom. A photograph of the interior of the device is shown on a following page in Figure 3. The lower
region of the device is for the fresh water flow, and contains a turbulator to increase the heat transfer
coefficient of the fresh water passing through it. Most building and plumbing codes require a double

7
wall construction to ensure that grey water does not cross over into the fresh supply water. The A1000
has a double wall design and also features a vent connected to the interface between the double wall,
which provides an indication if either of the walls of the heat exchanger begin to leak. More
information, including dimensions, connection options, and installation schematics are available in
Appendix C, the datasheet for the EcoDrain A1000.
Figure 2: The EcoDrain A1000

8
Figure 3: The interior of the EcoDrain A1000
Installation at UBC
The initial scope of this project included the installation of the EcoDrain in an actual shower on UBC
campus. A suitable location would have a shower with heavy use that also had easy access to the DWHR
device while installed for testing purposes. Multiple locations were scouted over a three week period
including the Student Recreation Centre, War Memorial Gymnasium, UBC Aquatics Centre, and the
Chemical & Biological Engineering Building. The UBC Aquatic Centre was the best candidate because of
the high frequency of shower use and access below the showers, but an installation was unable to be
organized within the time constraints. The remainder of the buildings have their showers located on the

9
lowest level with drainage piping in the floor, which would have made testing difficult and installation
costs prohibitively high, making them unviable candidates.
Another concern with installing the DWHR device on campus was receiving approval of the UBC
plumbing inspector. The feedback that was given to a demo installation focused on health and safety
concerns regarding cross connection. Approval was given for a trial installation on the condition that a
reduced backflow device was required for potable water connections and that the leak vent indicator
needed to be plumbed to a high visibility drain. Certification of the device was a requirement for larger
scale deployment. At the time of this writing, the EcoDrain is in the process of being listed for the
Uniform Plumbing Code (UPC) by the International Association of Plumbing and Mechanical Officials
(IAPMO) in California, and the Canadian UPC (cUPC) by the Canadian Advisory Council on Plumbing
(CACP).
Purpose and Objectives
The purpose of this project is to evaluate the performance of a DWHR system in a real world setting in
order to assess the economics and practicality of using DWHR systems to reduce energy consumption. A
commercially available unit, the EcoDrain A1000, will be installed in a rig that mimics typical showering
plumbing and piping and the performance characteristics of the unit will be measured. This information
will form the basis of an economic assessment, including the net present value, of installing a DWHR
system under different conditions.
The key variables in the economic assessment of this system will be the capital and installation costs of
the device, the volume of drain water that flows through the system (which is the product of the flow
rate of the showerhead and the total length of showers taken), and the cost of heating water (energy
costs and heater efficiencies). The testing will find the conditions necessary for a DWHR system to be
economically viable and will produce a calculator tool that finds the net present value given an

10
estimated operating environment. A recommendation will be made with suitable applications for DWHR
systems and a consideration of employing incentives to increase DWHR system installations as a form of
demand side management (DSM).
Motivation
Heating water is the second biggest household energy use (after space heating) in Canada,
accounting for 17% of residential energy use in 2010 [1]. Canadians use approximately 347 PJ of energy
to heat water for residential and commercial use, and emit 18 megatons of CO2 equivalent greenhouse
gases to do so [2]. Other research finds that 25% to 41% of this hot water use can be attributed to
showering [3], [4]. Finally, 80-90% of the energy added in a water heater is still contained in the water
going down the drain of a shower [5]. These facts represent a massive opportunity for energy use and
greenhouse gas emissions reductions which can be realized by transferring energy from the hot drain
water to cold incoming fresh water using a heat exchanger.
It is my personal belief that the carbon and energy crises will be the greatest challenges faced by
humanity. Our societies have developed in the presence of cheap and abundant energy, and have
created infrastructure and lifestyles that rely on it. With the fast approaching end of conventional fossil
fuels and the need to drastically reduce carbon emissions, we must change the existing infrastructure
and lifestyles to work in a low carbon and low energy world. Effective DSM is critical to making this
transition.

11
Literature Review
There is a lack of significant research in the field of DWHR systems, and the studies that have been
completed are based on laboratory testing or computer simulation. The research is focused primarily on
efficiencies of different designs and does not address the practical and economic implications of
installing such a system.
A report titled “Drain Water Heat Recovery Characterization and Modeling” compared eight different
models (2 from 4 different manufacturers) of DWHR systems in terms of the Number of Thermal Units
(NTU) and effectiveness and found that NTU per wrapped foot ranged from 0.17 to 0.33 and that
effectiveness ranged from 0.1 to 0.16 per foot of wrapped length between the different models [6]. The
report focused on theoretical efficiencies and did not do a broad economic evaluation of DWHR
systems.
A 2011 ASHRAE journal article covers DWHR systems in the Emerging Technologies section, and
mentions efficiencies of up to 40% with payback ranging from 2-5 years [5].
Research from the Hong Kong Polytechnic University titled “Shower water heat recovery in high-rise
residential buildings of Hong Kong” showed that only 4-15% of shower water heat can be recovered
using a 1.5m long single-pass counter–flow heat exchanger on a 50 mm drainage pipe.[7]. The
experiment was performed using a lab setup and a custom DWHR unit with thermocouples at all inlets
and outlets and flow meters on both flows.
Another prototype built for testing purposes generated annual savings of $160, but was based on a
standard heat exchanger and not a commercial product specifically for DWHR [8]. A valid economic
assessment could not be made as real world costs were not included, and performance data could have
been potentially skewed due to the ideal conditions that the unit was operated under (not used in an
actual shower). No assessment of maintenance issues was made in any of the studies.

12
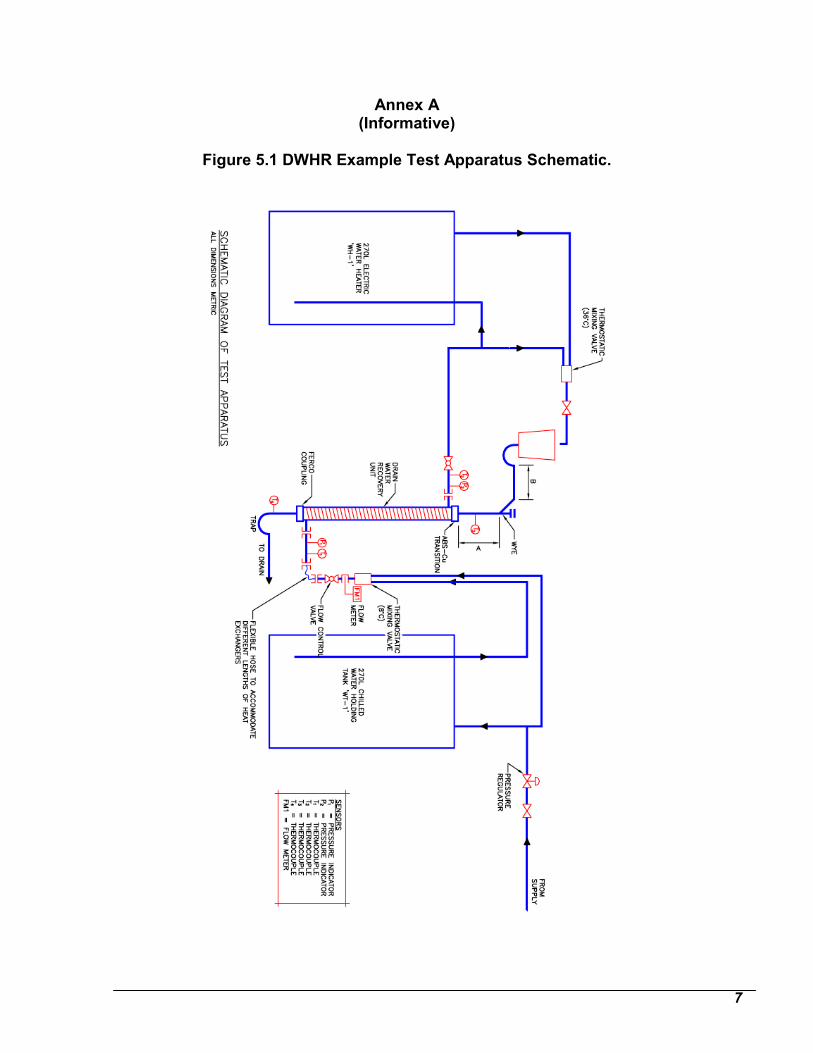
Natural Resources Canada (NRCan) has a protocol established to standardize testing procedures for
DWHR, but it is limited to vertical DWHR devices (Appendix B). The testing procedure stipulates even
flow conditions (drain water flow rate matches fresh water flow rate, configuration C described earlier).
The protocol employs an energy balance to ensure accuracy (the heat gained by fresh water must match
the heat loss on of the drain water within 5% for the results to be valid). The performance is based on
the steady state heat transfer, and the pressure drop of fresh water across the DWHR device is
measured.
Data Sources and Methodology
The economic analysis of DWHR units that is performed is the product of two sets of data. The first set
of data describes the conditions that a DWHR device will be exposed to in an average Canadian home.
This includes water heater type and efficiency (electric / natural gas), energy costs, showering water
temperatures, shower head flow rates, and the frequency and duration of showers. The second data set
is derived from the testing performed as part of this project. A test rig will be constructed that mimics
the plumbing associated with showers and the DWHR unit will be exposed to the conditions described in
the first data set. By combining these two data sets, the economics of installing a DWHR will be
determined.
The effectiveness of the system will be quantified by measuring the amount of energy added to the cold
water supply. This can be calculated by recording the inlet and outlet temperatures and flow rate of
fresh water through the DWHR system.

13
The temperature transfer efficiency can be calculated using the formula:
µ𝑡 = (𝑡2 − 𝑡1)
(𝑡3 − 𝑡1)
Where: µ𝑡 is the temperature transfer efficiency, and 𝑡1, 𝑡2, and 𝑡3 are the temperatures of the
incoming fresh water, incoming drain water, and outgoing freshwater, respectively.
The equipment used to measure temperature and flow rates during testing is presented below in Table
1. The temperature measurement has an accuracy of ±0.1°C.
Device Description
Drain Water Heat Recovery Unit EcoDrain A1000
Temperature Sensors Omega Thermistors, TH-10-44034-1/8-4-40
Temperature Logger Omega Logger, OM-USB-TEMP
IR Temperature Sensor SKF TMTL 260 ThermoLaser
Portable Water Meter Endress&Hauser Prosonic Flow 93P Table 1: Equipment used to measure DWHR system performance
14
Statement of Typical Conditions
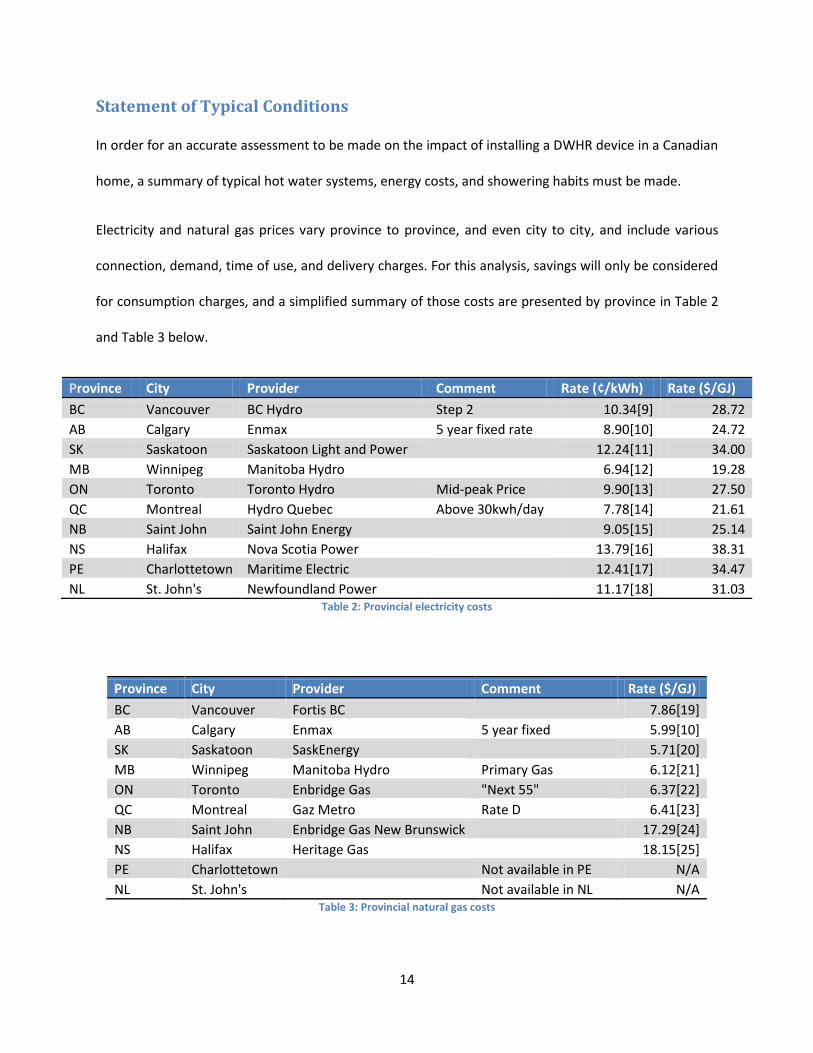
In order for an accurate assessment to be made on the impact of installing a DWHR device in a Canadian
home, a summary of typical hot water systems, energy costs, and showering habits must be made.
Electricity and natural gas prices vary province to province, and even city to city, and include various
connection, demand, time of use, and delivery charges. For this analysis, savings will only be considered
for consumption charges, and a simplified summary of those costs are presented by province in Table 2
and Table 3 below.
Province City Provider Comment Rate (¢/kWh) Rate ($/GJ)
BC Vancouver BC Hydro Step 2 10.34[9] 28.72
AB Calgary Enmax 5 year fixed rate 8.90[10] 24.72
SK Saskatoon Saskatoon Light and Power
12.24[11] 34.00
MB Winnipeg Manitoba Hydro
6.94[12] 19.28
ON Toronto Toronto Hydro Mid-peak Price 9.90[13] 27.50
QC Montreal Hydro Quebec Above 30kwh/day 7.78[14] 21.61
NB Saint John Saint John Energy
9.05[15] 25.14
NS Halifax Nova Scotia Power
13.79[16] 38.31
PE Charlottetown Maritime Electric
12.41[17] 34.47
NL St. John's Newfoundland Power
11.17[18] 31.03 Table 2: Provincial electricity costs
Province City Provider Comment Rate ($/GJ)
BC Vancouver Fortis BC
7.86[19]
AB Calgary Enmax 5 year fixed 5.99[10]
SK Saskatoon SaskEnergy
5.71[20]
MB Winnipeg Manitoba Hydro Primary Gas 6.12[21]
ON Toronto Enbridge Gas "Next 55" 6.37[22]
QC Montreal Gaz Metro Rate D 6.41[23]
NB Saint John Enbridge Gas New Brunswick
17.29[24]
NS Halifax Heritage Gas
18.15[25]
PE Charlottetown
Not available in PE N/A
NL St. John's
Not available in NL N/A Table 3: Provincial natural gas costs

15
As is shown in Table 2, the rate for the equivalent amount of energy in electricity is much higher than it
is for natural gas. This is caused by the inefficiencies of the conversion of thermal energy to electric
energy. The National average energy cost for electricity and natural gas were calculated by performing a
weighted average of provincial costs by provincial population. The weighted average costs were found
to be 9.41 ¢/kWh for electricity and 7.13 $/GJ for natural gas.
Hot water boilers fuelled by electricity and natural gas are both very common. The proportion of each by
province is shown below in Table 4, along with populations and household sizes. Electric hot water
heaters use immersed resistance coils and transfer nearly all of the electric energy to the water.
Efficiencies of natural gas boilers vary significantly depending on design and age, from 60% to 95%. For
the economic analysis performed in this project, a boiler efficiency of 80% is used.
Population Households People/Household % Electric HWH % Natural Gas HWH
Canada 34,484,000 13,320,610 2.59 41.2 48.2
B.C. 4,576,600 1,764,635 2.59 33 58.7
Alta. 3,778,100 1,390,275 2.72 5.2 84.2
Sask. 1,057,800 409,645 2.58 30.7 63
Man. 1,251,700 466,140 2.69 30.7 63
Ont. 13,366,300 4,887,510 2.73 22.1 67.9
Que. 7,978,000 3,395,340 2.35 89.1 2.7
N.B. 755,300 314,010 2.41 72.6 *
N.S. 948,500 390,280 2.43 72.6 *
P.E.I. 145,700 56,460 2.58 72.6 0
N.L. 512,900 208,845 2.46 72.6 0 Table 4: Canadian population, households, and HWH mix from Statistics Canada[26] and NRCan[27]
The duration of an average shower is difficult to determine, but based on research of showering and
water use, the average shower was found to be 8.5 minutes long [28] with a frequency of approximately
once a day. The temperature of a shower will also vary by user preference. To keep things consistent,
the temperature of 36°C from the NRCan DWHR testing protocol is used in this testing.

16
The lifetime of the DWHR device was evaluated at 15 years based on the “Measure of Life” study for
energy evaluation performed for the state of Wisconsin[29].
DWHR Performance Evaluation
Testing Setup
A test rig was constructed in order to replicate the conditions that would be experienced by a DWHR
unit installed in an actual shower. More specifically, the system was in configuration A, as described
earlier, where the cold water supplying the shower mixing valve passes through the DWHR unit where it
recovers heat from the drain water. A schematic of the layout and instrumentation is shown on the
following page in Figure 4
In order to measure the heat gained by the fresh water in the DWHR device, the temperature was
measured at the inlet and outlet. Immersion thermistors were used, which offer ±0.1°C accuracy. The
flow rate was measured at the inlet to the DWHR device using a clamp-on ultrasonic flow meter.
The temperature of the hot water supply was periodically checked using an infrared temperature sensor
to ensure that it remained at 45°C.
Following the mixing valve, the water was poured into a basin that slopes slightly towards a drain, as
would be present in an actual shower. The temperature and flow rate are measured to ensure
conformance with Canadian averages, 36°C and 9.5 L/min.
The drain plumbing replicates that of building code standards, including a p-trap. The drain connects to
the EcoDrain which is sloped at 3/8‘’ per foot (1.79°). The line then releases into an open building drain.
A photograph of the actual testing rig is shown in Figure 5.

17
Figure 4: Schematic of testing setup
Figure 5: The testing setup

18
Testing Methodology
The system was kept in a room temperature (20°C) environment for 30 minutes before each trial in
order to incorporate the effects of warming up the parts of the system. Including these transient effects
more accurately represent an actual shower system where showers are short and/or infrequent.
Before running the shower water through the system, the temperate and flow rate were set to their
target values. The temperature was measured via a thermistor probe inserted into the flow. The flow
rate was measured by timing the filling of a container of known volume, in this case a bottle that was 2L.
Adjustments were made until both values reached their target. Both measurements were then repeated
to confirm they were at their target. Next, the logging was started on the flow meter and the
temperature probes.
Finally, the shower flow was put into the shower drain system. With the shower water running through
the drainage piping and DWHR device, the system warmed up. As the DWHR system warmed up, it
transferred energy to the cold water supply, increasing its temperature which would have raised the
temperature of the shower water. The mixing valve was adjusted to increase the cold water flow rate to
maintain the temperature in the shower, and the hot water flow rate was decreased to maintain the
flow rate at 9.5 L/min.
The system was run until a steady state was reached and maintained for 5 minutes.
The water flow was turned off and the system was left for 30 minutes to allow the components to
return to room temperature before performing additional trails. The data processing and analysis are
described in the results section below. The test was repeated 3 times to ensure accuracy by verifying the
consistency of the results. The average energy transfer of the 3 tests was used in the following economic
analysis.

19
Results and Discussion
Testing Results
The following results are for the performance of the EcoDrain A1000 running in configuration A
described earlier. The shower water temperature was set at 36°C with a flow rate of 9.5 L/min. The
device was installed at a slope of 3/8‘’ per foot (1.79°). According to EcoDrain Performance can be
improved by 5-10% by installing the device at a larger slope, up to 75° [30].
Steady State Performance
The steady state conditions for the three runs are shown in Figure 6 on the following page and are
summarized below in Table 5. The average steady state values will be used in all further analysis.
Run 1 Run 2 Run 3 Average
Temp In (°C) 11.1 11.3 10.9 11.1
Temp Out (°C) 23.3 23.1 23.5 23.3
Drain (°C) 36.2 35.8 36.0 36.0
Flow (L/min) 3.83 3.94 3.83 3.87 Table 5: Summary of steady state characteristics
Based on the values in Table 5 above, the steady state heat transfer rate is 3284 W (calculation shown in
appendix A). For the average 8.5 minute shower, the DWHR device would save 0.465 kWh of water
thermal energy.

20
Figure 6: The steady state conditions of the 3 runs
0
5
10
15
20
25
30
35
40
0 10 20 30 40 50Time (s)
Run 1 Steady State
0
5
10
15
20
25
30
35
40
0 10 20 30 40 50Time (s)
Run 2 Steady State
0
5
10
15
20
25
30
35
40
0 10 20 30 40 50Time (s)
Run 3 Steady State

21
Transient Response
The transient response of the three runs is shown in Figure 7 on the following page and in Table 6
below. There is a delay of approximately 10 seconds after beginning the shower before there is an
increase in the temperature of the fresh water exiting the DWHR unit. A further 60 seconds are required
before the temperature of the water exiting the DWHR device reaches the steady state value. During
those 72 seconds, the DWHR device transfers 46.4% of the energy it would have if it were operating a
steady state levels.
Run 1 Run 2 Run 3 Average
Warm Up Time (min) 1:16 1:10 1:09 1:12
Average Heat Transfer (kW) 1.55 1.57 1.44 1.52
SS Heat Transfer (kW) 3.23 3.23 3.38 3.28
Transient % of SS 48.0% 48.6% 42.5% 46.4% Table 6: Summary of transient response characteristics

22
Figure 7: The transient response of the 3 runs
10
12
14
16
18
20
22
24
0 10 20 30 40 50 60 70 80 90Time (s)
Run 1 Transient Response
10
12
14
16
18
20
22
24
0 10 20 30 40 50 60 70 80 90Time (s)
Run 2 Transient Response
10
12
14
16
18
20
22
24
0 10 20 30 40 50 60 70 80 90Time (s)
Run 3 Transient Response

23
Installation and Maintenance Costs
The economic analysis assumes that the installation of the DWHR device occurs during a major
renovation of a bathroom. Under these circumstances, the marginal cost of installing the DWHR device
will be negligible compared to the remainder of the renovations being done. If an extremely
conservative approach is to be taken, then an installation cost of $200 can be applied, which will
decrease the NPVs presented in the following sections by $200.
The grey water side of the EcoDrain was designed to not add any additional restrictions to the effluent
flow compared to a 2’’ drain pipe. As a result, the maintenance cost of a shower with a DWHR device
will not be any different from a shower without one. If a shower clogged frequently before the
installation of a DWHR device, it will continue to clog frequently. If a shower did not normally clog, the
addition of a DWHR device should not increase the likelihood of clogs. Once again, taking an extremely
conservative approach, we can add an hour of maintenance every 3 years to correspond to a cleaning of
the drainage piping and DWHR device, which would decrease the NPVs in the following sections by
$267.76

24
NPV
The net present value of installing the EcoDrain A1000 was calculated based on the values in Table 7
below. The results by province are presented in Table 8 below. Example calculations are in Appendix A.
Values differ by province due to varying energy costs and household sizes. Note that natural gas is not
available in PEI and Newfoundland and Labrador.
Base case
Discount rate 5%
Cost ($) 600
Steady state heat transfer (kW) 3.28
Shower Length (minutes) 8.5
Electricity rate (¢/kWh) 9.41
Natural Gas rate ($/GJ) 7.13
Lifetime (years) 15 Table 7: NPV parameters
Annual Savings ($) NPV ($) Payback (years)
Electric Natural Gas Eletric Natural Gas Electric Natural Gas
Canada 38.18 13.02 -203.68 -464.88 15.71 46.09
B.C. 42.04 14.38 -163.63 -450.73 14.27 41.72
Alta. 37.92 11.48 -206.44 -480.81 15.82 52.25
Sask. 49.55 10.40 -85.69 -492.03 12.11 57.68
Man. 29.21 11.59 -296.76 -479.66 20.54 51.75
Ont. 42.44 12.29 -159.44 -472.48 14.14 48.84
Que. 28.66 10.63 -302.54 -489.71 20.94 56.47
N.B. 34.13 29.34 -245.78 -295.43 17.58 20.45
N.S. 52.54 31.12 -54.66 -276.99 11.42 19.28
P.E.I. 50.21 -78.88
11.95 N.L. 43.01 -153.58 13.95
Table 8: NPV and payback results
The NPV of installing a DWHR device is not positive for the average Canadian household. The NPV is
highest for homes with electric water heaters and high energy costs (Saskatchewan, Nova Scotia, and
PEI)

25
Sensitivity Analysis
Here a sensitivity analysis is performed to determine the variables that have the most significant impact
on the NPV of a DWHR system. Each variable from the base case NPV calculation is modified one at a
time to a value 20% higher and 20% lower than the base case, as shown in Table 9 below. The NPV and
% change from base case are calculated and shown below in Table 10 and Table 11
-20% Base case +20%
Discount rate 4% 5% 6%
Cost ($) 480 600 720
Steady state heat transfer (kW) 2.62 3.28 3.94
Number of users 2.07 2.59 3.11
Electric rate (¢/kWh) 7.53 9.41 11.29
Natural Gas rate ($/GJ) 5.70 7.13 8.56
Lifetime (years) 12 15 18 Table 9: Variable values for sensitivity analysis
For systems with electric water heaters, the NPV is most sensitive to the capital costs. Since a relatively
low discount rate was selected, the 20% increase or decrease does not have a significant impact on the
NPV. Since the steady state heat transfer, number of users, and energy rates are all linearly related to
the annual savings, the % change is the same for those 3 variables.
NPV
% Change
-20% Base Case +20% -20% 20%
Discount rate -175.39 -203.61 -229.09
14% -13%
Cost ($) -83.61 -203.61 -323.61
59% -59%
Steady state heat transfer (kW) -282.88 -203.61 -124.33
-39% 39%
Number of users -282.88 -203.61 -124.33
-39% 39%
Electric rate (¢/kWh) -282.88 -203.61 -124.33
-39% 39%
Natural Gas rate ($/GJ) Lifetime (years) -261.52 -203.61 -153.58
-28% 25%
Table 10: NPV response to sensitivity analysis for electric HWH

26
The lower energy costs of natural gas water heaters decrease the significance of the variables that
contribute to annual savings, further emphasizing the importance of capital cost in the final NPV value of
a DWHR unit.
NPV
% Change
-20% Base Case +20% -20% 20%
Discount rate -484.18 -491.87 -498.83
2% -1%
Cost ($) -371.87 -491.87 -611.87
24% -24%
Steady state heat transfer (kW) -513.50 -491.87 -470.25
-4% 4%
Number of users -513.50 -491.87 -470.25
-4% 4%
Electric rate (¢/kWh) Natural Gas rate ($/GJ) -513.50 -491.87 -470.25
-4% 4%
Lifetime (years) -507.67 -491.87 -478.23
-3% 3% Table 11: NPV response to sensitivity analysis for natural gas HWH
Break-Even
The break even analysis below is performed for each variable of the NPV calculation. The variable is
adjusted while keeping the other variables as base case until an NPV of 0 is reached, if possible. The
results of the analysis are shown below in Table 12. The analysis shows that energy rates above
14.24¢/kWh for electricity and 39.56 $/GJ for natural gas create a positive NPV under the conditions of
an average household. Households with electric hot water heaters having 4 or more people would also
be viable candidates for having DWHR installed. The breakeven for cost shows that a price of less than
$400 would create a positive NPV for the average household with an electric heater, but a much lower
cost is required for homes with natural gas water heaters. It is not possible to achieve a positive NPV by
varying discount rate alone.

27
Electric HWH
Natural Gas HWH NPV ($) NPV ($)
Discount rate 0% -27.16 0% -443.74
Cost ($) 396.39 0.00 108.13 0.00
Steady state heat transfer (kW) 4.96 0.00 18.20 0.00
Number of users 3.92 0.00 14.37 0.00
Electric rate (¢/kWh) 14.24 0.00
Natural Gas rate ($/GJ) 39.56 0.00
Lifetime (years) 31.56 0.00 1167 -391.66 Table 12: Break-even analysis for electric and natural gas HWH
Scenarios
Although the NPV calculation for provincial averages was negative, there are many cases where
installing a DWHR would provide a positive NPV. Below are 3 examples of cases where DWHR would
provide economic benefit.
High Use
This scenario describes an installation in a location where the DWHR device would receive much higher
usage then average, for example in a dormitory with common showers, or in recreational facility
showers. The number of users was increased to 48 (6 an hour for 8 hours). Maintaining all other
variables at base case settings, the total savings would be $1,800 for locations with natural gas water
heaters, and over $8,000 for locations with electric water heaters. Results are shown in Table 13 on the
following page.

28
NPV
Natural Gas Electric
Discount rate 5%
$1,807 $8,224
Cost ($) 600 Steady state heat transfer (kW) 3.28
Number of users (people) 48 Electric rate (¢/kWh) 9.41
NG rate ($/GJ) 7.13 Lifetime (years) 20
Table 13: NPV for high use scenario
Atlantic Canada
This scenario describes a household of 4 or more people in Atlantic Canada. According to Statistics
Canada, there are more than 3 million households in Canada with 4 or more people[26]. The
combination of above average usage and higher electrical (natural gas not available in parts of Atlantic
Canada) costs result in a positive NPV, as shown in Table 14 below.
NPV
Electric
Discount rate 5%
$337
Cost ($) 600 Steady state heat transfer (kW) 3.28
Number of users (people) 4 Electric rate (¢/kWh) 14.4
Natural Gas rate ($/GJ) Lifetime (years) 15
Table 14: NPV for Atlantic Canada scenario

29
Improvements
This scenario is based on further improvements to the EcoDrain A1000 design and performance, cost
reductions through mass production, and installation at a higher angle for a higher heat transfer rate.
With a 30% increase in performance and a 30% decrease in price, the DWHR device would be
economically beneficial for the average household with an electric hot water heater. The results are
shown in Table 15.
NPV
Natural Gas Electric
Discount rate 5%
-$284.26 $77.64
Cost ($) 420 Steady state heat transfer (kW) 4.264
Number of users (people) 2.5 Electric rate (¢/kWh) 9.41
Natural Gas rate ($/GJ) 7.13 Lifetime (years) 15
Table 15: NPV for improvements scenario

30
Use for DMS and Implications
The use of a DWHR device reduces the amount of energy a household uses to heat water for showering.
Utilities looking to reduce household energy demand could incentivise the installation of DWHR devices
by providing a rebate of the purchase price. Since the NPV calculation for the average house is negative,
the average homeowner would not realize a savings by installing a DWHR device based on current
conditions. A rebate could lower the cost and create a positive NPV, making the installation of a DWHR
device beneficial for the average Canadian.
The difficulty is in ensuring that the location where the device is installed will receive sufficient usage to
justify the incentive from the utility provider’s point of view. Most showers take place in the early
morning[28], so a DWHR device could also serve as method of peak shaving.
There is the possibility that the installation of a DWHR device could drive higher consumption rates. If
the user knows that the shower has a DWHR device installed, they may be more inclined to take a
longer shower. If users normally wait until the hot water temperature begins to fall as a result of the
water heater tank emptying, this would take longer to occur if a DWHR device is being used. It may be
possible for a HWH to keep up with a shower if a DWHR device is installed.

31
Other Considerations
There are some additional factors that should be considered when looking at this analysis. The amount
of use that the DWHR device receives is treated as a factor of household size. The analysis assumes that
all members of a household use a common shower where the DWHR device is installed. The number of
showers within a home will generally scale with the number of bedrooms, so a larger household will not
necessarily mean that an individual shower will be used more frequently. Newer homes are also more
likely to have a higher number of showers within them. The analysis also assumes that each member of
the household bathes by showering. While this is common for Western cultures, in many parts of the
world taking baths is more common. For the installation that was described in this project, there would
not be any energy savings realized with taking a bath due to the temporal gap between fresh water flow
and drain water flow. Lastly, the efficiencies of how water systems and flow rates of showers that were
used in the analysis reflect the standard for modern homes. Older homes with original equipment and
fixtures would receive greater benefits due higher energy consumption for equivalent heat production
out of the water heater, and also higher shower head flow rates.

32
Conclusions
Based on the preceding analysis, the conditions necessary for the economic use of a DWHR device have
been determined. Based on the configuration of the analysis, the average Canadian household would
not see a benefit from installing this DWHR device. Generally speaking, the current low costs of natural
gas make the economics of using a DWHR device in a household with a natural gas water heater
difficult. If natural gas prices return to more historical rates, this could change. The break-even analysis
revealed that a household size of 4 or more with an electric hot water heater would benefit from
installing a DWHR device. Canada has more than 3 million households of 4 or more people [26], which
would benefit from the installation of a DWHR device under current conditions. This analysis was
specific to the conditions mentioned, and broader adoption could be possible (ex. different installation
configuration).
Significance of Work
Preceding this work, little research has been done on the practicality of installing DWHR devices. The
scope of this project was limited to one set of tests performed on one model of horizontal DWHR
device. Changes to installation options such as slope, or installation configurations, could potentially
increase the performance of the DWHR device to the point where it would be economically
advantageous to be installed in the average Canadian home. There is a large opportunity for energy and
cost savings which could be achieved if DWHR devices are installed in suitable locations.

33
Recommendations
My recommendation for further work to be done in this area would be to have the device installed in an
actual shower for real world test results. While the setup of the testing performed attempted to mimic
actual shower conditions as closely as possible, it is still not an exact match. The drain water contains
other additives other than water, including soaps and shampoos, as well as dirt and debris.
Furthermore, my assessment did not monitor the pressure drop through the DWHR unit, which is part of
the NRCAN testing protocol for vertical DWHR system. Future research should include pressure drop
through DWHR units to ensure they do not negatively impact the remainder of the system.
Monitoring an installation in an actual shower will also allow an assessment of maintenance issues and
costs and the lifetime of a DWHR device. The economic assessment was based on a lifetime of 15 years
with no maintenance costs, and it is unknown whether this is representative of actual conditions.
Maintenance fees or a shorter (or longer) lifetime will impact the economic assessment of installing such
devices.

Works Cited
[1] Natural Resources Canada, “Energy Use Data Handbook Tables, 1990 and 2001 to 2010,” 17-Jan-2013. [Online]. Available: http://oee.nrcan.gc.ca/corporate/statistics/neud/dpa/showTable.cfm?type=HB§or=res&juris=00&rn=1&page=5&CFID=29287617&CFTOKEN=2a90e5d55c648a17-65B13E9B-DFDB-4646-09478C8527243864. [Accessed: 24-Jan-2013].
[2] M. Thomas, A. C. S. Hayden, O. Ghiricociu, R. L. D. Cane, and R. Gagnon, “A New Study of Hot-Water Use in Canada.,” ASHRAE Transactions, vol. 117, no. 1, pp. 673–682, May 2011.
[3] W. B. DeOreo and P. W. Mayer, “The End Uses of Hot Water in Single Family Home from Flow Trace Analysis,” 2001.
[4] B. Schoenbauer, D. Bohac, and M. Hewett, “Measured Residential Hot Water End Use.,” ASHRAE Transactions, vol. 118, no. 1, pp. 872–889, May 2012.
[5] A. Cooperman, J. Dieckmann, and J. Brodrick, “Drain Water Heat Recovery.,” ASHRAE Journal, vol. 53, no. 11, pp. 58–64, Nov. 2011.
[6] C. Zaloum, M. Lafrance, and J. Gusdorf, “Drain Water Heat Recovery Characterization and Modeling,” 2007.
[7] L. T. Wong, K. W. Mui, and Y. Guan, “Shower water heat recovery in high-rise residential buildings of Hong Kong,” Applied Energy, vol. 87, no. 2, pp. 703–709, Feb. 2010.
[8] S. Bartkowiak, R. Fisk, A. Funk, J. Hair, and S. J. Skerlos, “Residential Drain Water Heat Recovery Systems: Modeling, Analysis, and Implementation,” Journal of Green Building, vol. 5, no. 3, pp. 85–94, Aug. 2010.
[9] BC Hydro, “BC Hydro Residential Rates.” [Online]. Available: https://www.bchydro.com/accounts-billing/customer-service-residential/residential-rates.html. [Accessed: 01-Apr-2013].
[10] Enmax, “Enmax Residential Rates.” [Online]. Available: http://www.enmax.com/easymax/residential/questions/Current+Prices/Current+Prices.htm. [Accessed: 01-Apr-2013].
[11] Saskatoon Light and Power, “Saskatoon Light and Power Residential Rates.” [Online]. Available: http://www.saskatoon.ca/DEPARTMENTS/City Clerks Office/Documents/bylaws/2685.pdf. [Accessed: 01-Apr-2013].
[12] Manitoba Hydro, “Manitoba Hydro Residential Rates.” [Online]. Available: http://www.hydro.mb.ca/regulatory_affairs/energy_rates/electricity/current_rates.shtml#residential. [Accessed: 01-Apr-2013].
[13] Ontario Energy Board, “Toronto Hydro Residential Rates.” [Online]. Available: http://www.ontarioenergyboard.ca/OEB/Consumers/Electricity/Electricity Prices. [Accessed: 01-Apr-2013].
[14] Hydro Quebec, “Hydro Quebec Residential Rates.” [Online]. Available: http://www.hydroquebec.com/residential/understanding-your-bill/rates/residential-rates/rate-d/. [Accessed: 01-Apr-2013].
[15] Saint John Energy, “Saint John Energy Residential Rates.” [Online]. Available: http://www.sjenergy.com/cms/residential_rates. [Accessed: 01-Apr-2013].
[16] Nova Scotia Energy, “Nova Scotia Power Residential Rates.” [Online]. Available: http://www.nspower.ca/en/home/aboutnspower/ratesandregulations/electricityrates/domesticservicetariff.aspx. [Accessed: 01-Apr-2013].
[17] Maritime Electric, “Maritime Electric Residential Rates.” [Online]. Available: http://www.maritimeelectric.com/about_us/regulation/reg_irac_regulations_det.aspx?id=136&pagenumber=63. [Accessed: 01-Apr-2013].
[18] Newfoundland Power, “Newfoundland Power Residential Rates.” [Online]. Available: https://secure.newfoundlandpower.com/AboutUs/PDF/ratebook.pdf. [Accessed: 01-Apr-2013].
[19] Fortis BC, “Fortis BC Residential Rates.” [Online]. Available: http://www.fortisbc.com/NaturalGas/Homes/Rates/Pages/Lower-Mainland.aspx. [Accessed: 01-Apr-2013].
[20] SaskEnergy, “SaskEnergy Residential Rate.” [Online]. Available: http://www.saskenergy.com/residential/resrates_curr.asp. [Accessed: 01-Apr-2013].
[21] Manitoba Hydro, “Manitoba Hydro Residential Rates.” [Online]. Available: http://www.hydro.mb.ca/regulatory_affairs/energy_rates/natural_gas/current_rates.shtml. [Accessed: 01-Apr-2013].
[22] Enbridge Gas, “Enbridge Gas Residential Rates.” [Online]. Available: https://www.enbridgegas.com/homes/accounts-billing/residential-gas-rates/purchasing-gas-from-enbridge.aspx. [Accessed: 01-Apr-2013].
[23] Gaz Metro, “Gaz Metro Residential Rates.” [Online]. Available: http://www.grandeentreprise.gazmetro.com/data/media/conditionsservicetarif_an.pdf?culture=en-ca. [Accessed: 01-Apr-2013].
[24] Enbridge Gas New Brunswick, “Enbridge Gas New Brunswick.” [Online]. Available: https://secure.naturalgasnb.com/CMS/site/media/naturalgasnb/Handbook of Rates and Distribution Services - Oct 1 2012.pdf. [Accessed: 01-Apr-2013].
[25] Heritige Gas, “Heritige Gas Residential Rates.” [Online]. Available: http://www.heritagegas.com/residential/residential-rates.html. [Accessed: 01-Apr-2013].

[26] Statistics Canada, “2011 Census of Population and Statistics,” 2011.
[27] Natural Resources Canada, “Survey of Household Energy Use,” 2007.
[28] C. R. Wilkes, A. D. Mason, and S. C. Hern, “Probability Distributions for Showering and Bathing Water-Use Behavior for Various U.S. Subpopulations,” Risk Analysis, vol. 25, no. 2, pp. 317–337, 2005.
[29] PA Consulting Group, “State of Wisconsin Public Service Commission of Wisconsin,” 2009.
[30] EcoDrain, “EcoDrain A1000 Installation Manual.” .
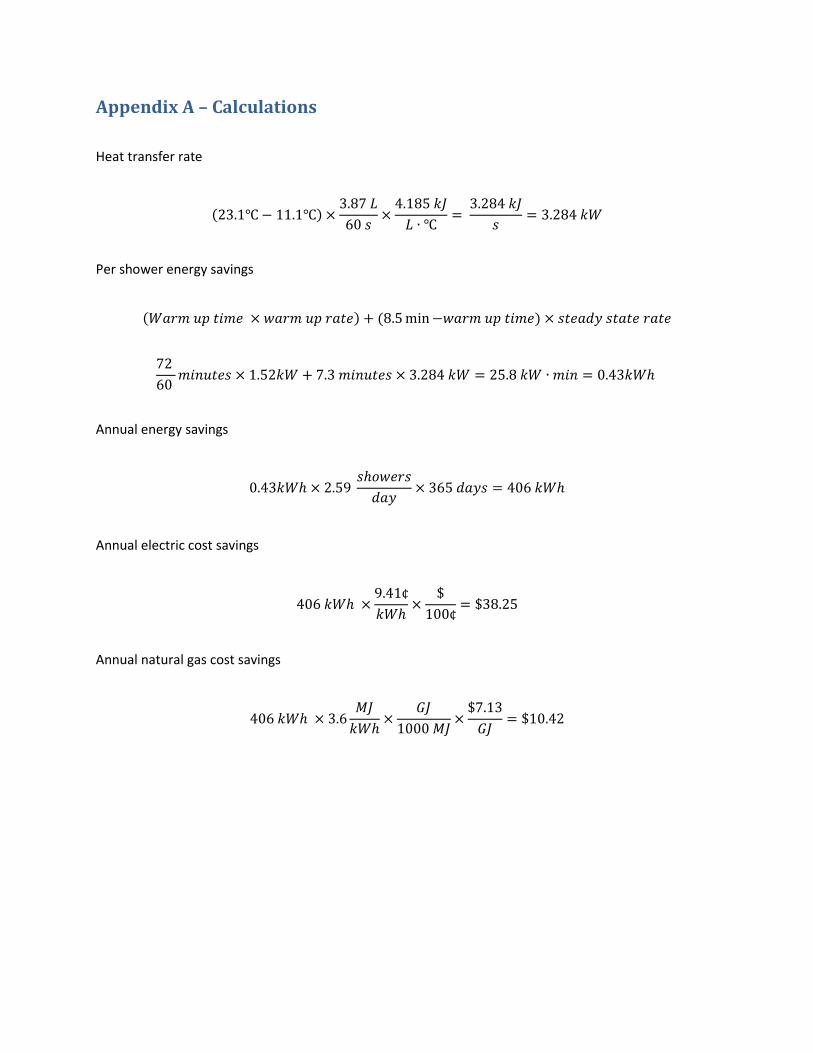
Appendix A – Calculations
Heat transfer rate
(23.1℃ − 11.1℃) ×3.87 𝐿
60 𝑠×
4.185 𝑘𝐽
𝐿 ∙ ℃=
3.284 𝑘𝐽
𝑠= 3.284 𝑘𝑊
Per shower energy savings
(𝑊𝑎𝑟𝑚 𝑢𝑝 𝑡𝑖𝑚𝑒 × 𝑤𝑎𝑟𝑚 𝑢𝑝 𝑟𝑎𝑡𝑒) + (8.5 min −𝑤𝑎𝑟𝑚 𝑢𝑝 𝑡𝑖𝑚𝑒) × 𝑠𝑡𝑒𝑎𝑑𝑦 𝑠𝑡𝑎𝑡𝑒 𝑟𝑎𝑡𝑒
72
60 𝑚𝑖𝑛𝑢𝑡𝑒𝑠 × 1.52𝑘𝑊 + 7.3 𝑚𝑖𝑛𝑢𝑡𝑒𝑠 × 3.284 𝑘𝑊 = 25.8 𝑘𝑊 ∙ 𝑚𝑖𝑛 = 0.43𝑘𝑊ℎ
Annual energy savings
0.43𝑘𝑊ℎ × 2.59 𝑠ℎ𝑜𝑤𝑒𝑟𝑠
𝑑𝑎𝑦× 365 𝑑𝑎𝑦𝑠 = 406 𝑘𝑊ℎ
Annual electric cost savings
406 𝑘𝑊ℎ ×9.41¢
𝑘𝑊ℎ×
$
100¢= $38.25
Annual natural gas cost savings
406 𝑘𝑊ℎ × 3.6𝑀𝐽
𝑘𝑊ℎ×
𝐺𝐽
1000 𝑀𝐽×
$7.13
𝐺𝐽= $10.42

Appendix B – NRCAN DWHR testing procedure
� � ��
������������� ������������� ��������� �������� �������������������������
������������������ ���������������� ��� ��������������������������� ���� �� �� � �������� �������� ��� ������� ��� ��� ��� ����� ��������� �� ���������������� �� ��� ��� ��� !"������������ ���� �������� �� ����������������������� ��������������������� !"������������# �������� ���������������������������� �� ������� ��� �� ������ ���� !"������������ ��������������������������� �!��"�� # ���������������������� ���� �� �� � �������� �������� ��� ���� ����� ��������� �� ��������� ������������ �� !"���������$����%&�����'(������)**�����+(������ � � !"�������� ���� ��#���������������������� ������������� ������ ����������� ������������������������ �����,������ �� ���������������������������������# ������# ��������������������� ��� ���������� �����������#� ���� �������������� ���� ��� �����,-���.�� � /��� #����� ������������������� �������������� � �� � ��������� ����� � �� � ���0��� ����� ��������� �������������������� �������� ���� ������� �� 1�� 1�������������������� ���� �������� �������#� ��������� ��� ������� ����������� ���#� ������ ���������# ����� ����� �� � �����2�� 1 ��� �� ������ ��������� ����������������������� �����3�������������� ��� ��� ����������������
���� �������"��$�����������������������������/ ����� � �� ������������ ��� �������#���������� 1� ��������� ����� ��������� �)�)���%��� ����������� ������������ �������������������������������4��������� �������������������&����'������(�2��������� �� ��� ��� ����������������� ����#� 3������ ��� 1����� �� ���� ���������� �� ��������������� ������������� ����)��$������ ����������������(��� ����#���5 ������������������ ����� ��� ���������������������� ����� �� �� ����� �������������������� �� �� ���������� ��������������#���� �������� ���� ��� ��������� �������#� �&�6��� ��� �� ������� �� � ���������� ���/ ���������� ���������*����$$������+�� ����������,�

� � ��
+�� ����������-�7� !"��������� ������ � ����������� ������������� �� ������ ���� ���������+�� ����������.�7� !"��������� ������������� �������������� �� ������ ���� ���������������������� �������� �������������������������+�� ����������+�7� !"��������� ������������� ���������� �������
��� 4��$����������������8�� ������ ������� ��#����������������/�0�����$���)������������ � !"������� �������������������������� ����������������������� �� ��� 1����� ��� ���� �� �����# �������� ������ ��������������4���� � �������� !"���������� �� ������������������� ��������������0�����#�� # �����#� ����� ������#����%&�����'(������)**�����+(������ � � !"��
����0���1���������1# �� ����������# �� ��������� ��� �������� ������������������ ����������� ���� �������������������1# #��� �������� ����������# �����������/������ �������� �������#�� �������#������ �����������# �/ ��������������� ��������������������� ���� ��������#�������� ������������#����������� � �� ���������� ���2���,���������������� ����������� ������������������������ � ������������������1#����������������� ��������1#�# �����������9����� ���������������# � ��� ����� ��� ������������� ��� �� ����#����������������:������ ��� �� ���������������� � !"��# ����� �� ���������� ������ � �� ����� ������ �������� �������������1#�#��� ����������# �� ��� ���������������+��;��))�����)+�-<�����1#�#%�!�� � �� ������ ������������# �������� �����'=>�������� ��������� � �� ������ ������������# �������� �����;>���1#�#/�,��� ��������� ����� ���������� ������������������� � !"�����������4�
��� � ��� ���������� ������ ����������� � ����� ������� ������������������ � !"�����������
#�� # ����������� �� ��������������� ���� ���������������� ���� ������� � !"�������
�1#�#1�

� � ��
�� ������������� � ���������� ������ �� ���������������� � !"��������# �� ���� ������������� ������������� ������� �������� ����� ���� ������ ����� �� ��� ���� ������� �� �� ���1#%�� ������������)��������� � �� ���� � ��������� ��� 1����� ������ ������# �� ���� �������� �������� ������� ��� � ��������1���������#� �� �������� ��
��
��
������ ����
�����
���
���
�
�
�
���� �
�� �� �?�� ��� 1����� � �� ���� � ��0�
���?������������ ������ ����������0�� ��?������������ ������ ���������0�� �����?������ ������������ 0�� ��?�� �������� ��� 0�� ����?��� � ��������1����� �������� ��� 0�� ����?�� ������ ���� ��� �� �� 0�� ����?�� ������ ���� ��� �� �� 0�� ���?��������� ���� ��� �� �� ���:���� � !"������������� ���� ��#������������������ ��� ������������� ����#������ �� ������ ������������� �� ��� ���� ���� � �� ���� � ������
���
��
����
����
��
��
�
��� �
�1#/�������������"��� �� �� ������������� � !"���������� �� ���������� ������ ��������� �� ����� �� �# �� ���� ���� ������#���� �������� ����� �� ������ �� �� �������� ������� ���� ������ � ��� ��� �� �� ������������� � !"��������1#1��)��$� $�3���"$�����������.���� ��������� ��� �� ������ �������� ��� !"���������� ������# ������ ���� ��� ���� ��� ��������������������������� ������������������������ ���������������������� ��� �������� �������#� �&�&������ �������� � ������������� ��� � ��� ��� ������������������ �� �������� ������ �� ��� � �� �� �� ��# �� � ������� � ��� ��� � �� ���� � �������� � �� �� �� ������ ������� �� � ������������� �� �� �� ����� �� �# �@;>����

� � ��
���$��1#1�!����������"�������+���������� ����)��$�4$�3�+�� ���������#�
���������� 5�$���
: ���!�� �.�� ��� �� �� ��
;>��
����!�� �.�� ��� �� �� �
'=>��
:������� � 6�&�-<����
�1#6���������������9����� ���������# ������� ����������#���5 �������������� ��#���� ����� ��� �����������# �� � ��� ������������ ���� �� ������ �����#���5 ����������������� ����������� ��������� ��� �� �� �����#� ���� �� �� ��� ��#���� ����1#7�+�$��$�������" ��� ��� �����/!�� �� ���� � �������� �� ���������� �����#� ���� ���� ������ � 1����� �������# �� � ��� ����� �������� ������ �� ������ �������������� ����#������ ��� ����� � ���1#7# ��� � �� ���� � ���������# �� � ��� ����� ����� ��������� � ����#������ ��������� � ������������ ��������� �&�'��1#7#���� � � ��� ��� ������/!��������# �������� �������� �� �� ����� �������� ������ �� �� ��� ������ �����#� ���� ���� ������ � !"�� 1����� ���� � ����#��������������� ��#���� ����1#���������.�$�������������"����$����� �����$���� � � ���#����� ���� ����� ���������# �� � ��� ��#��� �������� �� �� �� ��� ������ �����#� ���� ���� ������ � 1����� ������� �� �� �� ���������� ��������� ���� ������ � 1����� ��� � ����#����#����� ��������������������.���� �� �� �� ���������� ��������� ���� ������ ����� ����������������A�&B������ �� �� �� ��� ������ �����#� ���� ���� ���� �� ��� ��������������# ���� �� �������������1#8������"���������� ����)��$� $�3���� ������������� �� � � ���#������������������� �5 ��� � !"����������� ������ ������� � ��������� ��� ��������� �������#� �&�6���.������� ���� � ���� �� ��� ������ ������� � ���������������������� �� ������������������������� ����� ����� �� �� ��� � ���#��������:���� ����5�������������� ����� ����������� � !"���2�� 1�2�����������C8C������ ���� ���������� �������� �� 3��� ����� �� 3��� �������� �# �� ���� ����� ���������� !"�����*�&�� � ��������� �������������� � � �� ��#��C8C�������# ����� ��������'*&�������� �� ��������������������� ������� �#����������� ��� ������ � !"������������C2C��������# �=)*������

� � ��
2��������� ���������������������������# �28�� !D������������������ ������� ����������� �� �� � ������/ ������� � !"����������� ��� �������� �������������� ������ ��� �������������� ���������� ���� �� ����� ������ �������� ���E����� �� �� � ����������# ���/ ����� ����������� ���������� �������� �������������� ��� ������������������������ �� �# �� ��&�����)*����� ���� � ����������� �������� ��# ����� �� �������� ����������� �����# ����� �� ����2�� � ���#����� ��� �/�������# �� ��� ������ �� �� ����� ��������� ���� ���������� �������� � !"��� � ��� ����.����� ������������������������ �� �� �� ������������� ��������� ������# � ��������� �� �� �� ��� ������ ���������� ������ �� ����� ����� �������� ����� ������� � ������ �����

� � ��
���$��1#8������"���������� ����)��$� $�3���� ���������#�
���������� 5�$��� ��$������� +��������
.�� ��!�� �� �� �� � ��� �� �
@;>�� A�)>�� E�1����������� �� �� �� �+;>���
� �� ��:������� �� +��;��))�����)+�-<����
A�*�&�-<��� � ����������� ��� ��� �� ���#� ��
,����$� �������� D ������ A��@>� 2������#� ���������� ���������� �� ��������
2�#� ���� �� �� � 9��������� �� �
� �� �� ���� !"������
A�&>�� �
.���������!��� ��.�*�&� E��������� �
�
F�� �� ������2#�� � !"��,����
&*������� ������� !"������ � �
E��������� �
$� �������� ������������ ���������� ������������ �������� ���� ������������ � � ��������� ����� ���#� ��#����� ��
� �� �� �E �� � ���2������
A�*�@>�� E�1������� �
� �� �� ��������# ���/ ������� ���� ��� ������������� ������ ������ ���� ���
F �� �E �� � ���2������
A�*�@&B� E�1������� �
�� ����������������� ��� �� ���
:����E �� � ���2������
A�@B� E�1������� �
�
9� ���8����� � A�&B� E�1������� �
:�� ����������������������� �� �� ������ ��� ��� ���� ��������� ��������������
�
1# ����"�������
�� �����������������# � ��� �4���� ������� �������� ���#�� ���� � ��� ����������������� !"����������������/�������#������� ������� ���-<��������� � ��� ��� �� ����� �����B����� ������� �� ������������� �� � �� ������/F������������������� 2�� 1���� � !"������� ��� ����� ����� ��������� �����2�� 1���
� � ��
-���9�-�&*� ��������'�
�4������1# �������9��"$�������-""�������!�������#�
��

� � �
-���9�.�&2�������������*� ��������'�
��������������������������������$��)��"�����
�9���� ������ �����#��/ ������� ���� ���� ������ ������ ���� �������� ������������ ������������� ������� ������&�=���
)�� �������� ���� �� �� �� �������2���������G<3�*�)H���� ��� ��� ������� �� �� ���� ���� �� ���
@�� �������� ���:����� � ����2������������������ ���������� � ������ � �� �����$� ���:�8�+=*&������ ������������� �� � �������# ��������G<3�)B��
'�� �������� ����� �� �� ������������� �����#� ���� ���� ������ ��������� �� ��� ��� ������������# �� �� ������������ �������� �� ���� ��� �����$� ��� FI�)***83)**I����I�� ����������� ��������������G<3�*�@&B��� ��� ��������� ���� ����*����)**��������2���� ������ �� ���� �������� �� ��� ���� ��������� ��� �� �� ������ ��������� ���� ����������������� ������� �� �����# ����� ���� ������
+�� �.�������� ������������������� � � ������������������ � �������� ������ ���� ����/������� �� � ���������� ����������������� ������������ �� �� ������� �� ���� �����I�������� ��)%@9�9�@%*�-����$������ ��������/�� ������# ��� ���������� �� ����
&�� �.�������� ���� �� �� ��������� ��� ����2��� �����������1�������� ������ �������������� �� �� �� ������ �������� ���������������������1�������� ������ ���������� �������� ������ ����� �� ���� ����������'=>����� ������ ���������� �� ��� 1����� �� ������� ��1 �&3)@*���F�� ��9@+*���
=�� �������� ���F �� ��������� ��� ����2� ����������������� ������� ����� ���������� ������������� �� ������ ����� �� ���� �������� �� �� �������������� ���������� �������������# ���5 ������ ������������ �� �����������2�� 1�����������/��������� � �� ������� ����� ����� �� �� �� ������������������������
%�� �.�������� ���2�� 3����������������������������� ������� �������� �� �� ���������������� 3��1��� �������� ������� �� ������������� �� ��� �� �� �������� ����� ����������� ��������� ��� ����/���� ����� �� �� ����� ����������� ������� ����
;�� �.�������� ���!�� ������ ��������� ����/���������� ���� ���� �#�������������� �� �� ��������� ������;>��#������������ ���� ������������ �#������2�� 3����������������������������� ������� ���������/���� �� �� �� �� �������������
6�� �.�������� ����������� ���� ������� � ���� ���������� � !"����� �*�=������ ��� ������#�� ��� � !"������# � ���� ������������� ����������������� ���� ����������� ��������������� �������� ����� ������ ������ �����28����� �������� �����# ������� ������������ �� ������

� � �
���-���9�+�&*� ��������'�
�������������"�������"$�������"���!�������1#7# '�
��
��

� � ���
�

Appendix C – EcoDrain A1000 DataSheet

All rights reserved - Ecodrain Inc.Page 1 A1000HEU_DATA.pdf
HIGH PERFORMANCE HEAT EXCHANGER
A1000 HEAT EXCHANGER DATA SHEET
Design Part identification
A
BC
D
A
A
B
E
B
Ecodrain Inc. offers a 10 YEAR limited performance warranty and a four year guarantee free of factory defects, provided the device is used under normal shower drain water heat recovery applications (and no other application) and is used with potable water, free of excessive iron or hardness inducing salts and minerals. Defects from shipping, installation, repackaging, lackof proper maintenance of adjoining appurtenances and system connected fluid flow devices, alterations, misuse, mishandling even by plumbing contractors, the house owner or other service personnel, will not be covered.
Ecodrain Inc. will not accept liability or responsibility for any value of consequential damages (no matter what is the source) resulting in whatever replacement value, caused by whatever reason.
It is the responsibility of the Installation personnel to ensure full compliance to local codes and laws.
No other warranties/guarantees are implied or suggested beyond what is stated above.
In order to avail of additional accessories, like filter baskets, attachments, or types of connectors, the company is available for further consultation.
Warning:Preheated cold water from a shower water heat exchanger can accidentally cause scalding if not properly adjusted for temperature before use. Hot water can cause third degree burns in6 seconds at 60C (140F), and in 30 seconds at 54C (130F). In households where there are children, physically challenged individuals, or elderly persons, mixing valves at the point of use are recommended as a means to reduce the scalding potential of hot water. For your safety and to avoid damage caused by improper installation, this shower heat exchanger should be installed by a Certified Licensed Professional, and meet all applicable building codes. Ecodrain Inc.cannot be held responsible for accidental injuries resulting from improper or careless use of hot water.
A1000 Cut out viewwith interior tubing
A1000 Complete viewwith drain and p-trap connection
Grey water connection
Cold water connection
Double wall tube assembly
F
G P-trap and shower floor drain
D
E
G
FDrain and connector to fitexisting grey water connection
Atmospheric vent
E Shell
The A1000 Heat Exchanger is symmetric.Either grey water connector can function as the grey water inlet.Either cold water connector can function as the cold water inlet.For best performance, the cold water line should be connected such that cold water enters the device at the end opposite from which grey water will enter the device.
C

All rights reserved - Ecodrain Inc.Page 2 A1000HEU_DATA.pdf
HIGH PERFORMANCE HEAT EXCHANGER
A1000 HEAT EXCHANGER DATA SHEET
A
4 1/2”(114 mm)
B
INSTALLATION SLOPE PERFORMANCE CHARACTERISTICS
Model Box Tube
Length
Connector
A1000 - A - MC - 48 - 2
Check with local codes in order to validate the minimum angle required. Note that heat transfer performance will increase as the tilt angle increases. This can boost heat exchanger performance by 5%-10%. The reason is that at a higher tilt angle, the waste water travels faster. This generates turbulence in the waste water flow and as a result the waste water gives off heat at a higher rate. With the A1000 unit, a maximum slope of 75o is recommended to allow an efficient heat transfert. Beyond that slope, some of the grey water will travel down the center of the exchanger and will have reduced contact with the heat transfer tubes.
A1000 Heat Exchanger to be installed leveled in order to deliver optimal performance
6 5/8”(168 mm)
leveled
HOW TO SPECIFY
greywaterinlet
greywateroutlet
cold wateroutlet
cold waterinlet
A
B
75°maximalrecommendedslope
30°
1° (1/4”:12”)minimalslope
Heat exchanger performance varies based on several factors including installation configuration, cold water temperature, shower temperature, shower usage, type of water heater and cost of energy. Please consult website for greater performance details.
MATERIALS AND DIMENSIONS OPTIONS
A1000
Model
AABS
Box
CCopper
MCtype M copper
Tube
LCtype L copper
SSStainless Steel
48 inches
Heat TransferLength
OverallLength
72 inches
96 inches
Connector(B)
PPVC
4 inches
2 inches
3 inches
56 inches
80 inches
104 inches