
CHP Systems Analysis Methodology and Applications · • Provides at least a portion of the...
84
CHP Systems Analysis Methodology and Applications Marcia L. Karr, PE WSU Energy Program Halfmoon Education, Inc Portland, Oregon June 10, 2016
Transcript of CHP Systems Analysis Methodology and Applications · • Provides at least a portion of the...
CHP Systems AnalysisMethodology and
Applications
Marcia L. Karr, PEWSU Energy Program
Halfmoon Education, IncPortland, OregonJune 10, 2016

• Your unbiased energy experts
• National and regional experts onmany energy technologies
• Entrepreneurial, nimble, andresponsive
• Staff includes energy specialists,engineers, software developers,research librarians, and others
• Main office in Olympia, and anotherin Spokane
• We are part of the WSU College ofAgricultural, Human, and NaturalResource Sciences – reportingdirectly to the Dean
WSU Energy Program
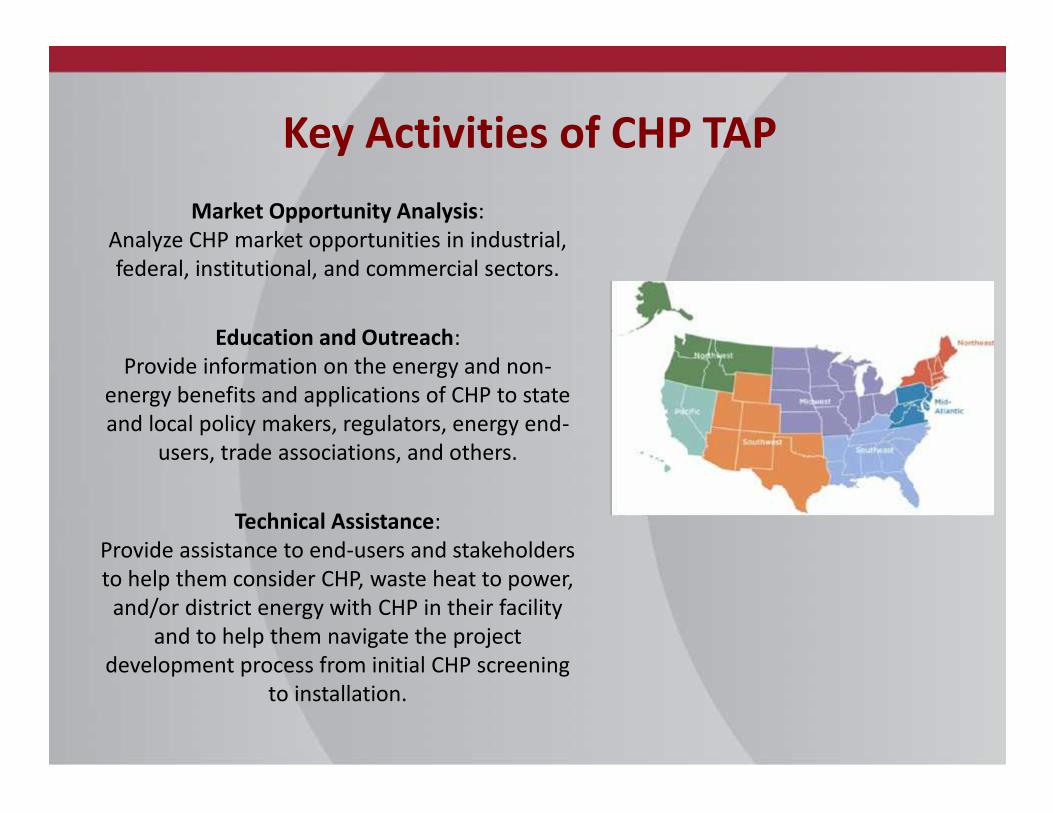
Market Opportunity Analysis:Analyze CHP market opportunities in industrial,federal, institutional, and commercial sectors.
Education and Outreach:Provide information on the energy and non-
energy benefits and applications of CHP to stateand local policy makers, regulators, energy end-
users, trade associations, and others.
Technical Assistance:Provide assistance to end-users and stakeholdersto help them consider CHP, waste heat to power,
and/or district energy with CHP in their facilityand to help them navigate the project
development process from initial CHP screeningto installation.
Key Activities of CHP TAP

Outline of Presentation
• Overview of CHP & benefits• CHP technology & equipment• Building codes• Project development process & CHP
Technical Assistance Partnership Services

Combined Heat and Power:A Key Part of Our Energy Future
• Located at or near a building or facility
• Provides at least a portion of the electrical load
• Uses thermal energy for:
– Space heating/cooling
– Process heating/cooling
– Dehumidification
CHP provides efficient,clean, reliable, affordable
energy – today and forthe future.
5

Over two-thirds of the fuel used to generate powerin the U.S. is lost as heat
Combined Heat and Power:A Key Part of Our Energy Future

• CHP is more efficient than separate generation ofelectricity and heat
• Higher efficiency translates to lower operating cost,(but requires capital investment)
• Higher efficiency reduces emissions of all pollutants
• CHP can also increase energy reliability and enhancepower quality
• On-site electric generation reduces grid congestionand avoids distribution costs
Benefits of Combined Heat and Power

National Goal: Additional 40 GW of CHP
Achieving this goal would:• Increase total CHP capacity in the U.S. by 50%• Save energy users $10 billion a year compared to current
energy use• Save one quadrillion Btus (Quad) of energy — equivalent to 1%
of all energy use in the U.S.• Reduce emissions by 150 million metric tons of CO2 annually
— equivalent to the emissions from over 25 million cars• Result in $40-$80 billion in new capital investment in
manufacturing and other U.S. facilities over the next decade
Source: DOE/EPA CHP: A Clean Energy Solution August 2012, www1.eere.energy.gov/manufacturing/distributedenergy/pdfs/chp_clean_energy_solution.pdf
8
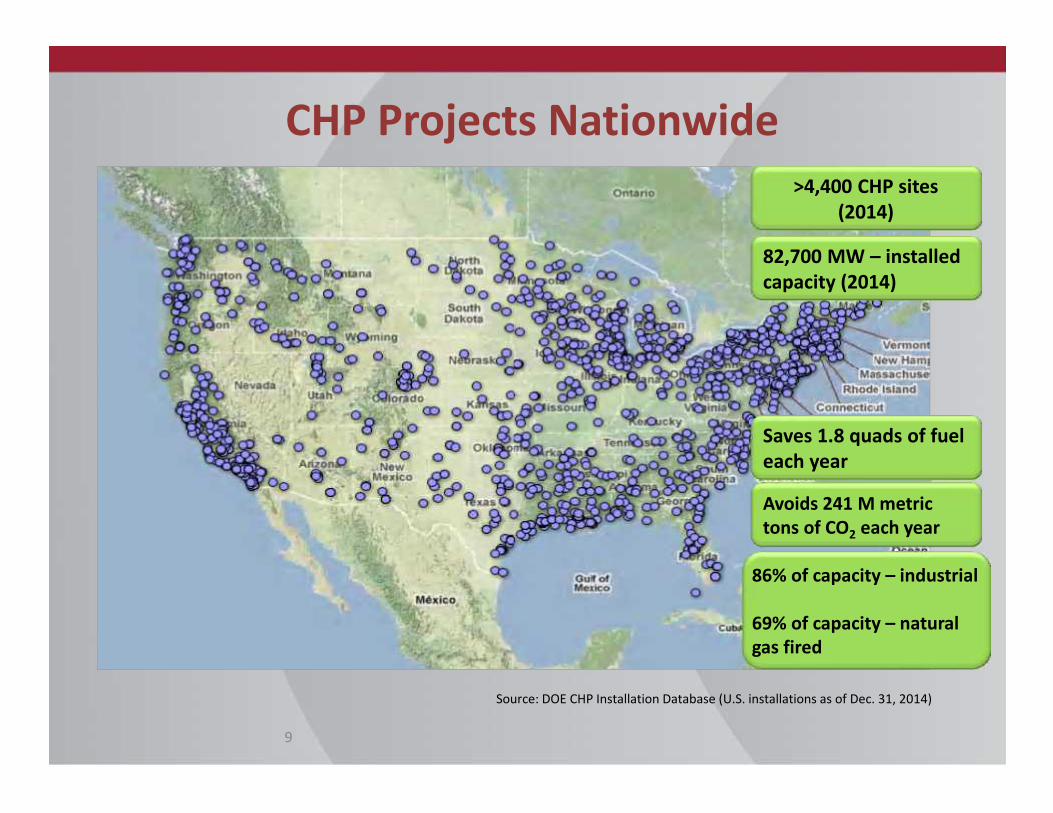
CHP Projects Nationwide
82,700 MW – installedcapacity (2014)
>4,400 CHP sites(2014)
Saves 1.8 quads of fueleach year
Avoids 241 M metrictons of CO2 each year
86% of capacity – industrial
69% of capacity – naturalgas fired
Source: DOE CHP Installation Database (U.S. installations as of Dec. 31, 2014)
9

Attractive CHP Markets
IndustrialChemical manufacturingEthanolFood processingNatural gas pipelinesPetrochemicalsPharmaceuticalsPulp and paperRefiningRubber and plastics
CommercialData centersHotels and casinosMulti-family housingLaundriesApartmentsOffice buildingsRefrigerated warehousesRestaurantsSupermarketsGreen buildings
InstitutionalHospitalsSchools (K-12)Universities & collegesWastewater treatmentResidentialCorrectional Facilities
AgriculturalDairiesWood waste (biomass)Animal feeding
operations
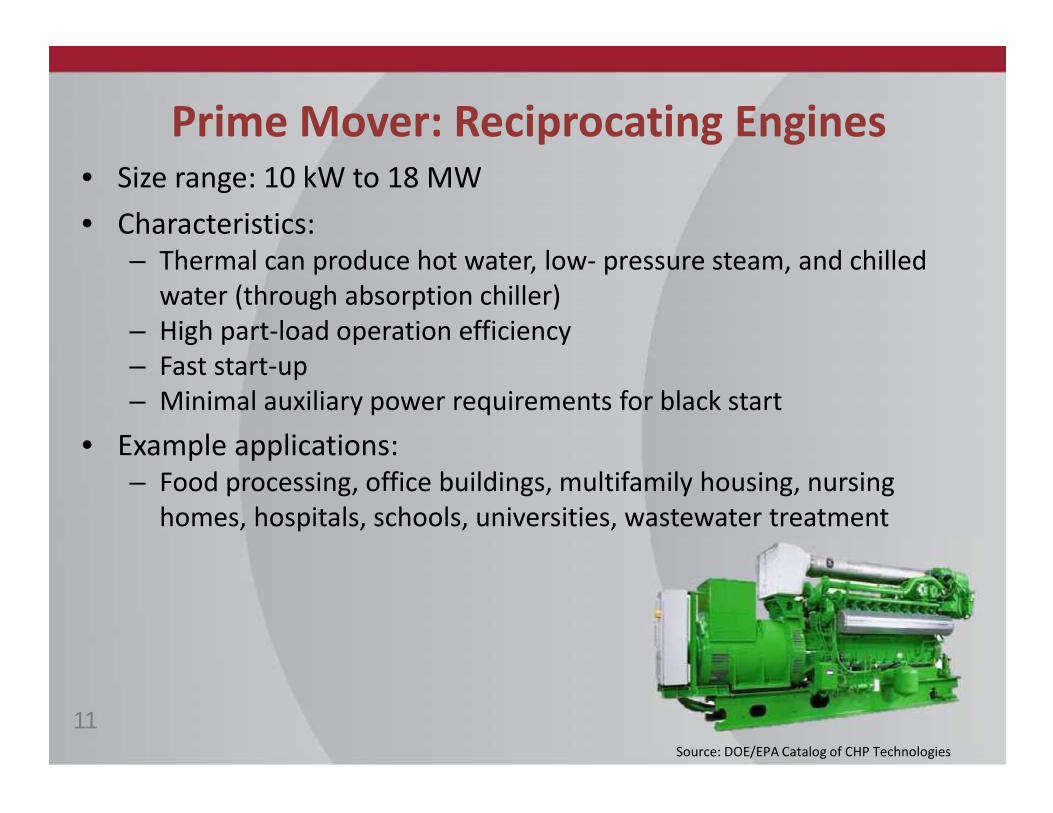
• Size range: 10 kW to 18 MW• Characteristics:
– Thermal can produce hot water, low- pressure steam, and chilledwater (through absorption chiller)
– High part-load operation efficiency– Fast start-up– Minimal auxiliary power requirements for black start
• Example applications:– Food processing, office buildings, multifamily housing, nursing
homes, hospitals, schools, universities, wastewater treatment
Prime Mover: Reciprocating Engines
Source: DOE/EPA Catalog of CHP Technologies
11

Reciprocating Engine Characteristics

• Size range: 500 kW to 300 MW• Characteristics:
– Produces high-quality, high-temperature thermal that can includehigh-pressure steam for industrial processes; and chilled water(with absorption chiller)
– Efficiency at part load can be substantially less than at full load• Example applications:
– Hospitals, universities, chemical plants, refineries,food processing, paper manufacturing, military bases
Prime Mover: Combustion Gas Turbine
Source: DOE/EPA Catalog of CHP Technologies13

Gas Turbine Characteristics
Cost & Performance Characteristics SYSTEM1 2 3 4 5
Exhaust Flow (1,000 lb/hr) 149.2 211.6 334 536 1047GT Exhaust Temperature (Fahrenheit) 838 916 913 874 861HRSG Exhaust Temperature (Fahrenheit) 336 303 322 326 300Steam Output (MMBtu/hr) 19.66 34.44 52.36 77.82 138.72Steam Output (1,000 lbs/hr) 19.65 34.42 52.32 77.77 138.64Steam Output (kW equivalent) 5,760 10,092 15,340 22,801 40,645Total CHP Efficiency (%) HHV 65.7% 70.4% 69.5% 70.5% 68.8%Power/Heat Ratio 0.57 0.7 0.65 0.89 1.09Net Heat Rate (Btu/kWh) 6,810 5,689 5,905 5,481 5,590Effective Electrical Efficiency (%) 50% 60% 58% 62% 61%Thermal Output as Fraction of Fuel Input 0.42 0.41 0.42 0.37 0.33Electric Output as Fraction of Fuel Input 0.24 0.29 0.27 0.33 0.36
Source: ICF vendor-supplied data

• Reduces cost of electricity– Up to 50% output without additional fuel
consumption
• Reduces environmental footprint– Emissions reduced by at least 30% per MWh
produced
• Increases flexibility and reliability– Hospitals, universities, chemical plants,
refineries, food processing, papermanufacturing, military bases
Heat Recovery Steam Generator (HRSG)
Source: DOE/EPA Catalog of CHP Technologies15

• Condensing turbines:– Industrial waste heat streams
can be used to produce steam– Excess steam can be used to
produce electrical energy
• Backpressure turbine:– Produces electrical energy at
locations where steam pressureis reduced with a PRV
Lower pressureapplications
Sub-atmosphericpressure
Steam Turbines:One of the oldest prime mover technologies still in use

• Size range: 30 kW to 330 kW• Characteristics:
– Thermal can produce hot water, steam, and chilled water– Compact size and light weight, brought on line quickly– Inverter-based generation can improve power quality– Usually below 200 kW unless multiple units utilized– Recuperator typical
• Example applications:– Multifamily housing, hotels, nursing homes,
wastewater treatment, gas and oil production
Prime Mover: Microturbines
17Source: DOE/EPA Catalog of CHP Technologies

Microturbine Characteristics
Microturbine Characteristics SYSTEM1 2 3 4 5 6
Nominal Electricity Capacity (kW) 30 65 200 250 333 1000Compressor Parasitic Power (kW) 2 4 10 10 13 50Net Electricity Capacity (kW) 28 61 190 240 320 950Fuel Input (MMBtu/hr) 0.434 0.876 2.431 3.139 3.894 12.155Required Fuel Gas Pressure (psig) 55-60 75-80 75-80 80-140 90-140 75-80Electric Heat Rate (Btu/kWh), LHV [2] 13,995 12,966 11,553 11,809 10,987 11,553Electric Efficiency (%), LHV [3] 24.4% 26.3% 29.5% 28.9% 31.1% 29.5%Electric Heat Rate (Btu/kWh), HHV 15,535 14,393 12,824 13,110 12,198 12,824
Electric Efficiency (%), HHV 21.9% 23.7% 26.6% 26.0% 28.0% 26.6%
CHP CharacteristicsExhaust Flow (lbs/sec) 0.68 1.13 2.93 4.7 5.3 14.7Exhaust Temperature (F) 530 592 535 493 512 535Heat Exchanger Exhaust Temperature (F) 190 190 200 190 190 200Heat Output (MMBtu/hr) 0.21 0.41 0.88 1.28 1.54 4.43
Source: ICF vendor-supplied data

• Size range: 3 kW to 2 MW• Characteristics:
– Relatively high electrical efficiencies due to electrochemical process– Uses hydrogen as the input fuel– Relatively low emissions without controls due to absence of
combustion process– Inverter-based generation can improve power quality– Relatively high installed cost, ~$5k/kW
• Example applications:– Data centers, hotels, office buildings,
wastewater treatment
Prime Mover: Fuel Cells
19Source: DOE/EPA Catalog of CHP Technologies

Fuel Cell Characteristics
Source: U.S. DOE Fuel Cell Technologies Program

Fuel Cell Characteristics

Approximating System Costs
Installed Costs O & M Costs
Reciprocating Engines $1,000 to $1,800 per kW $0.010 to .015 per kWh
Gas Turbines $800 to $1,500 per kW $0.005 to $0.008 per kWh
Microturbines $1,000 to $2,000 per kW $0.010 to $0.15 per kWh
Installed and O&M Cost Estimates:CHP Prime Movers with Heat Recovery for Standard Installations
Absorption chillers: $500 to $1,000/RT (dependent on size)

1,000,000
100 * 109
80 * 109
16,000,000
55 * 109
1.46
Thermal-to-Power Ratio (T/P) of FacilityDetermine what prime mover to select
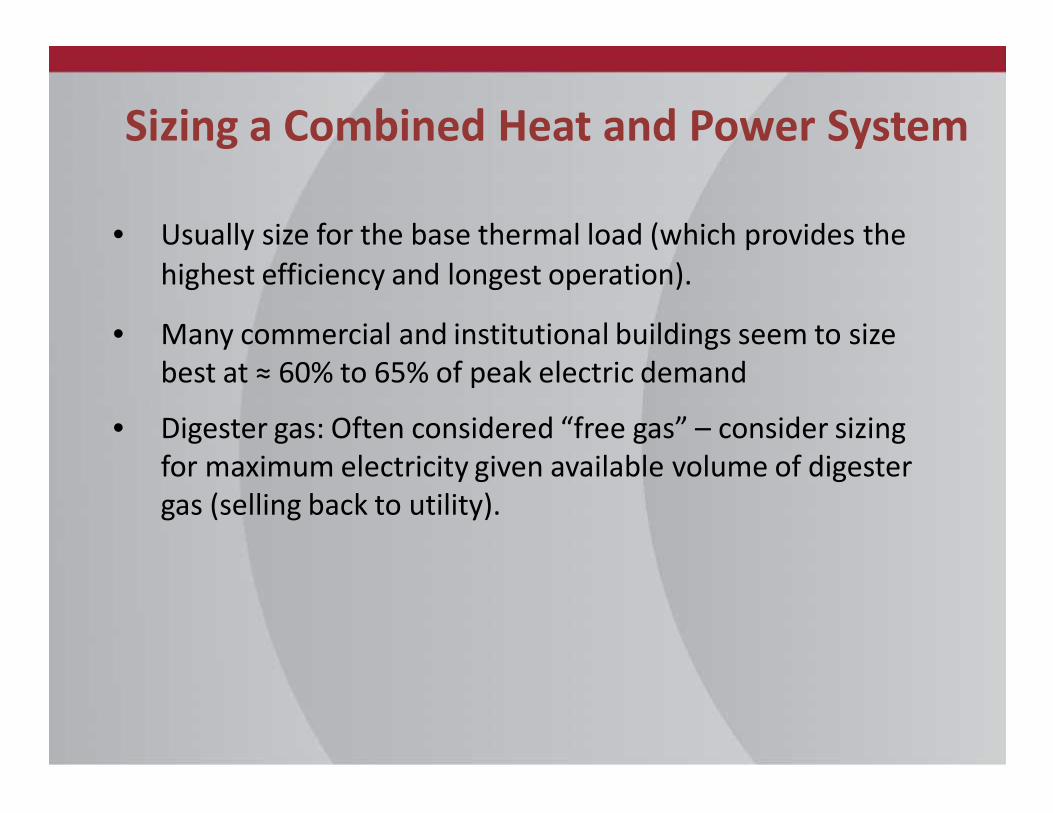
Sizing a Combined Heat and Power System
• Usually size for the base thermal load (which provides thehighest efficiency and longest operation).
• Many commercial and institutional buildings seem to sizebest at ≈ 60% to 65% of peak electric demand
• Digester gas: Often considered “free gas” – consider sizingfor maximum electricity given available volume of digestergas (selling back to utility).
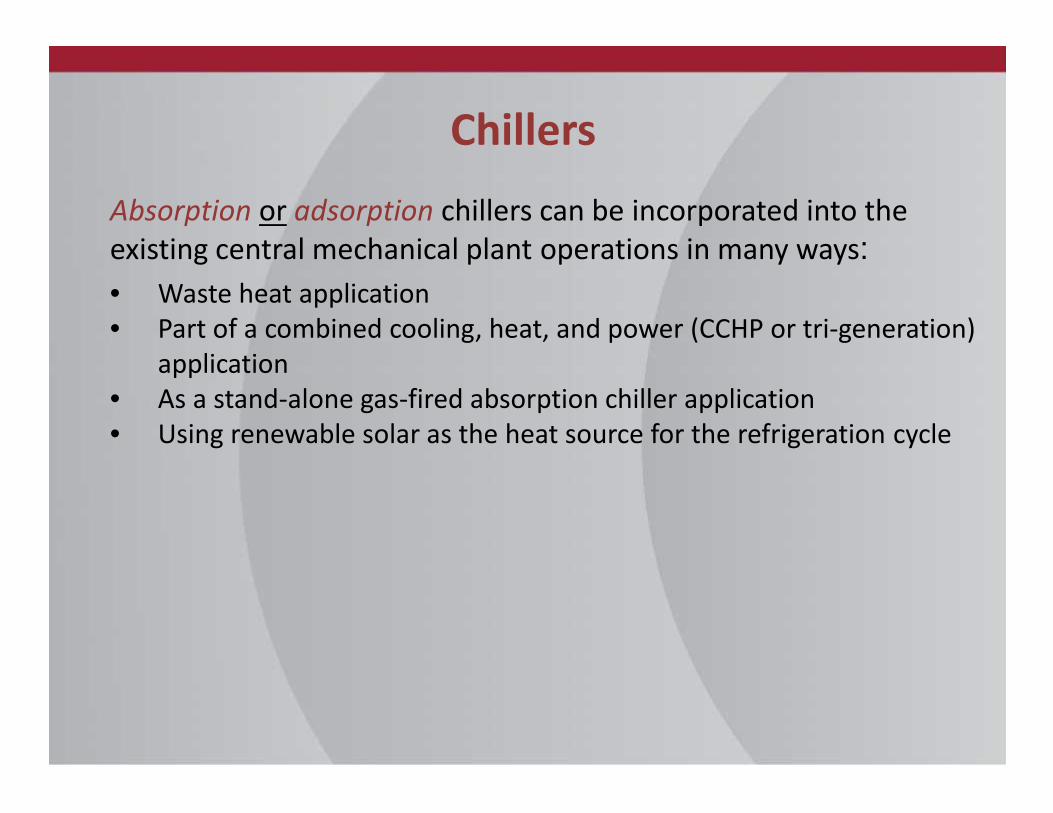
ChillersAbsorption or adsorption chillers can be incorporated into theexisting central mechanical plant operations in many ways:• Waste heat application• Part of a combined cooling, heat, and power (CCHP or tri-generation)
application• As a stand-alone gas-fired absorption chiller application• Using renewable solar as the heat source for the refrigeration cycle

Chillers
• As much as $100,000/month indemand charges
• Summer months due to DX chillers• Demand charge reduction possible
with absorption chillers

Benefits of Chillers
• Reduce energy costs• Stabilize risks associated with fluctuating energy costs• Improve equipment reliability• Reduce greenhouse gas emissions by up to 50% for the power
generated• Reduce grid congestion• Reduce electrical demand charges• Provide reliable power supply• Use low global warming and ozone-safe natural refrigerants like R717
(NH3) and R744 (CO2), water and air, which are promoted through theLEED certification program, ASHRAE, EPA, DOE and GSA (CHP can beshown to offer 5-9 LEED points)
http://www.epa.gov/chp/treatment-chp-leedr-building-design-and-construction-new-construction-and-major-renovations

Meeting Cooling Requirements withPrime Mover Recoverable Heat
How much absorption cooling can be delivered from a prime mover?How much electricity is offset by an absorption chiller?
Abso
rptio
n Ch
iller
s (Li
Br-H
20)

Codes that Apply to Using Natural Gasas a Fuel Source
• International Building Code (IBC) Chapter 27
• National Fire Protection Association (NFPA) 99 & 110
• National Electrical Code (NEC) Articles 700 & 701
• Center for Medicare and Medicaid Services (CMS) –define “low probability of failure”
29

International Building Code Ch. 27Related Definitions
Emergency• Voice communication• Exit signs• Egress illumination• Doors on I-3• Elevator car lighting• Fire detection and alarms• Fire pumps
Standby• Smoke control• Egress elevators/platforms• Sliding doors• Inflation for membrane structures• Power & lighting for fire command

NFPA 996.4.1.1.7 Uses for Essential Electrical System
The generating equipment used shall be either reservedexclusively for such service or normally used for other purposes ofpeak demand control, internal voltage control, load relief for theexternal utility, or cogeneration.
31

NFPA 110.5.1Energy Sources
5.1.1 The following sources* shall be permitted to be used for theemergency power supply (EPS):
• Liquid petroleum products at atmospheric pressure as specified inthe appropriate ASTM standards and as recommended by theengine manufacturer
• Liquefied petroleum gas (liquid or vapor withdrawal) as specified inthe appropriate ASTM standards and as recommended by theengine manufacturer
• Natural or synthetic gas
* Explanatory material can be found in Annex A of the NFPA codes32

NEC Article 700 & 701Emergency and Standby Fuel
33
“Article 700-12 (b)(3) Dual Supplies. Prime movers shall not be solelydependent on a public utility gas system for their fuel supply ormunicipal water supply for their cooling systems. Means shall beprovided for automatically transferring from one fuel supply toanother where dual fuel supplies are used.
Exception: Where acceptable to the authority having jurisdiction, theuse of other than on-site fuels shall be permitted where there is alow probability of a simultaneous failure of both the off-site fueldelivery system and power from the outside electrical utilitycompany.

Center for Medicare & Medicaid Services(CMS) - Low Probability of Failure Defined
Natural Gas Generator Reliability Letter Requirements:
• Statement of reasonable reliability of the natural gas delivery
• Brief description that supports the statement regarding the reliability
• Statement that there is a low probability of natural gas interruption
• Brief description that supports the statement regarding the lowprobability of interruption
• Signature of technical personnel from the natural gas vendor
Sources: CMS 2009 presentationhttp://chfs.ky.gov/NR/rdonlyres/4C745EDB-C9D8-4AA9-B111-38092C60EFB4/0/NaturalGasGenerators.pdf
34

Fuel Emissions

Cooley DickinsonHealth CareNorthampton, MA
Application/Industry: HospitalsCapacity (MW): 500 KWPrime Mover: Steam Turbine(s)Fuel Type: Wood chipsThermal Use: Heat and hot waterInstallation Year: 2006
Testimonial: This SECOND biomassboiler eliminated the need to burnoil during annual maintenancedowntime, reduces peak load by17.5%, and produces approx. 2million kWh electricity per year. Theplant also has full utility companyinterconnectivity and operates inparallel with the electrical grid.
Source: http://www.northeastchptap.org/Data/Sites/5/documents/profiles/CooleyDickinsonCaseStudy.pdf
Project Snapshot
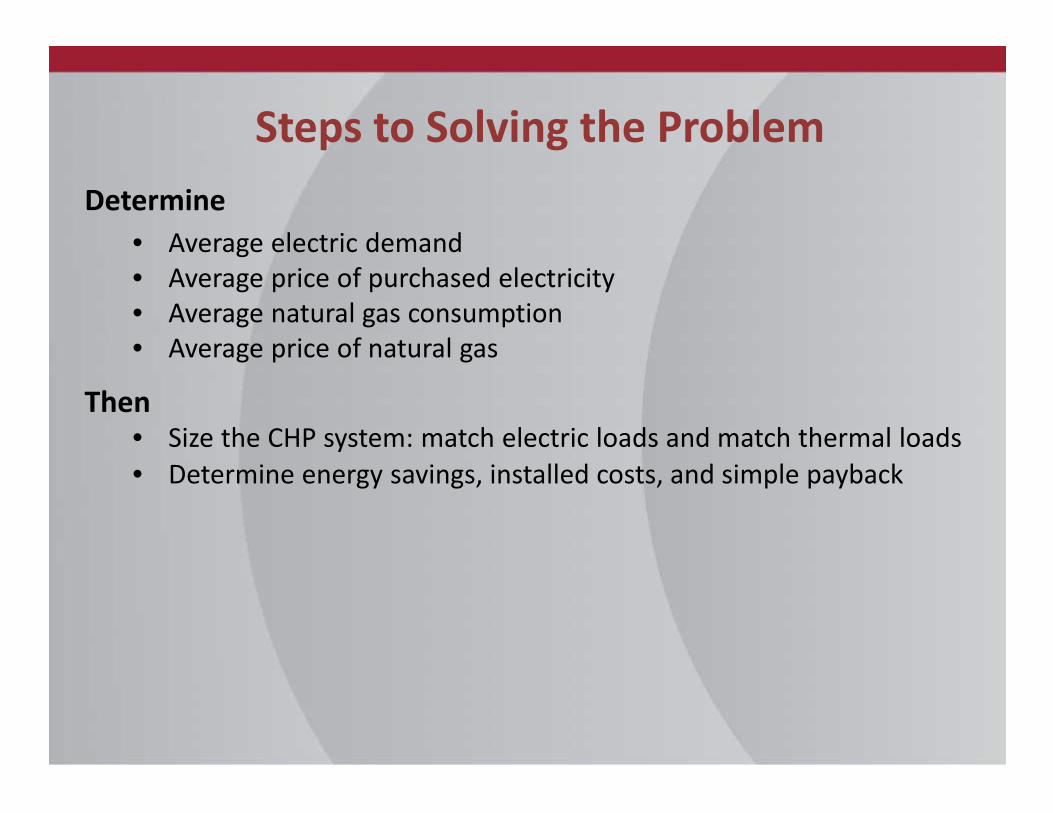
Steps to Solving the ProblemDetermine
• Average electric demand• Average price of purchased electricity• Average natural gas consumption• Average price of natural gas
Then• Size the CHP system: match electric loads and match thermal loads• Determine energy savings, installed costs, and simple payback
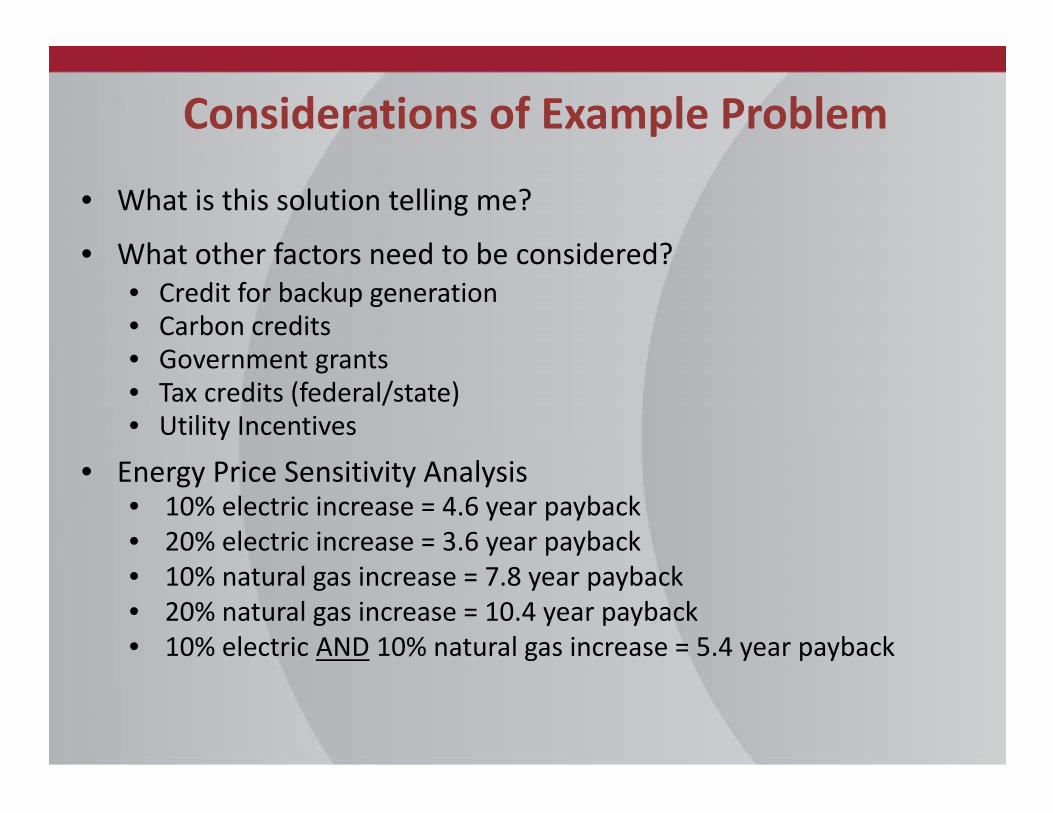
Considerations of Example Problem
• What is this solution telling me?
• What other factors need to be considered?• Credit for backup generation• Carbon credits• Government grants• Tax credits (federal/state)• Utility Incentives
• Energy Price Sensitivity Analysis• 10% electric increase = 4.6 year payback• 20% electric increase = 3.6 year payback• 10% natural gas increase = 7.8 year payback• 20% natural gas increase = 10.4 year payback• 10% electric AND 10% natural gas increase = 5.4 year payback

-120%
-100%
-80%
-60%
-40%
-20%
0%
20%
40%
- 2.0
4.0
6.0
8.0
10.0
12.0
14.0
Varia
tion
in P
aram
eter
Before-Tax Simple Payback
Installed CapitalCosts
Natural Gas:CHP Fuel Price
ElectricityPurchase Price
Private Grant
Federal ITC asGrant
(years)2/13/2016
Electricity at $0.06 / kWh, Propane at $21.834 / MMBtu, Wood Chips-Gasified at $0 / MMBtu,Plant Cost= $6700 / kW, Variable O&M = $0.001 / kWh
Average operation is 50% of derated capacity for 8760 hours at 100% availability (100% in Year 1)
Sample Sensitivity Diagram

Summary: When Looking at Your Facility,Consider…
• Will the selected configurationprovide adequate waste heatlevels for heating and/or cooling?
• Are there potential installationissues?
• Estimated installation costs?
• What do basic economics looklike?
• Is there a use for the CHPwaste/recycled heat?
• Is a major rehab or thermalequipment change planned?
• Is there sufficient “sparkspread”?
• Identify size and type of primemover to meet thermalrequirements (high efficiency).
Is the application worth pursuing with a formal analysis?

University
Electricity Electricity Electricity Natural Gas Natural Gas Natural GasMonth (kWh) ($) ($/kWh) ($) (therms) ($/MMBtu)
Jan--15 2,286,840 $ 222,981 $ 0.098 $ 302,095 346,440 8.72Feb 2,502,133 $ 243,245 $ 0.097 $ 237,035 271,830 8.72Mar 2,714,835 $ 261,044 $ 0.096 $ 215,854 247,540 8.72Apr 2,728,199 $ 263,761 $ 0.097 $ 184,201 211,240 8.72May 2,779,795 $ 267,913 $ 0.096 $ 102,573 117,630 8.72Jun 2,658,494 $ 255,518 $ 0.096 $ 49,064 118,600 4.14Jul 2,744,758 $ 265,473 $ 0.097 $ 38,598 93,300 4.14
Aug--14 2,569,171 $ 239,037 $ 0.093 $ 31,797 76,860 4.14Sep 2,892,800 $ 260,233 $ 0.090 $ 70,902 81,310 8.72Oct 3,069,088 $ 271,540 $ 0.088 $ 99,050 113,590 8.72Nov 2,446,105 $ 230,129 $ 0.094 $ 165,156 189,400 8.72Dec 2,790,018 $ 262,327 $ 0.094 $ 283,574 325,200 8.72
32,182,236 $3,043,201 $0.095 $1,779,899 2,192,940 $ 8.12
Annual Energy Use SummarySample
41

• $0.095/kWh = $27.8/MMBtu• Natural gas at $4.11/MMBtu = steam at $4.11
– (85% boiler efficiency) = $4.83/MMBtu
• “Spark Spread” is $22.97/MMBtu
Conclusion: Most of a CHP project’s revenue streamcomes from the production of electrical energy.
Costs of Natural Gas vs.Value of Electrical Energy
42

Monthly Average PowerElectrical Load Profile
43
0
500
1,000
1,500
2,000
2,500
3,000
3,500
4,000
4,500
Jan Feb Mar Apr May June Jul Aug Sep Oct Nov Dec
Aver
age
Elec
tric
al P
ower
, kW
Monthly Average Power

Monthly Average Steam FlowsSteam Flow Profile
44
0
5,000
10,000
15,000
20,000
25,000
30,000
35,000
40,000
45,000
Jan Feb Mar Apr May June Jul Aug Sep Oct Nov Dec
Aver
age
Stea
m P
rodu
ctio
n, lb
s/ho
ur
Monthly Average Steam Flows

• Gas turbine with heat recovery steam generator – HRSG (to qualifyas CHP)– Usually use natural gas as fuel, but can run on oil– Can add duct burner and even OSA firing capability to HRSG
• Backpressure, condensing, or condensing/extraction steam turbines• Combined cycle project (Brayton plus Rankine cycles)• Reciprocating engines• Bottoming cycle power plants (organic Rankine for waste heat
recovery). [Fouling, corrosion, erosion]
CHP Prime Mover Selection
45

Gas Turbine with HRSG
46

• Gas turbines are rated at ISO conditions (59⁰F at sea level, and60% relative humidity)
• The firing rate (MMBtu/hour) and heat rate (Btu/kWh) aregiven in terms of lower heating value (LHV)
• Fuel (natural gas or oil) is sold on the basis of its higher heatingvalue (HHV).
Lower Heating Value (LHV)
47

• The LHV assumes that the latent heat of vaporization of waterin the fuel and the reaction products is not recovered. It isuseful when comparing fuels and turbine performance wherecondensation of the combustion products is impractical.
• Higher heating value (HHV) assumes that all of the water in acombustion process is in a liquid state after a combustionprocess.
• For natural gas, fuel consumption (HHV) ≅ fuel consumption(LHV)/0.9.
LHV, continued
48
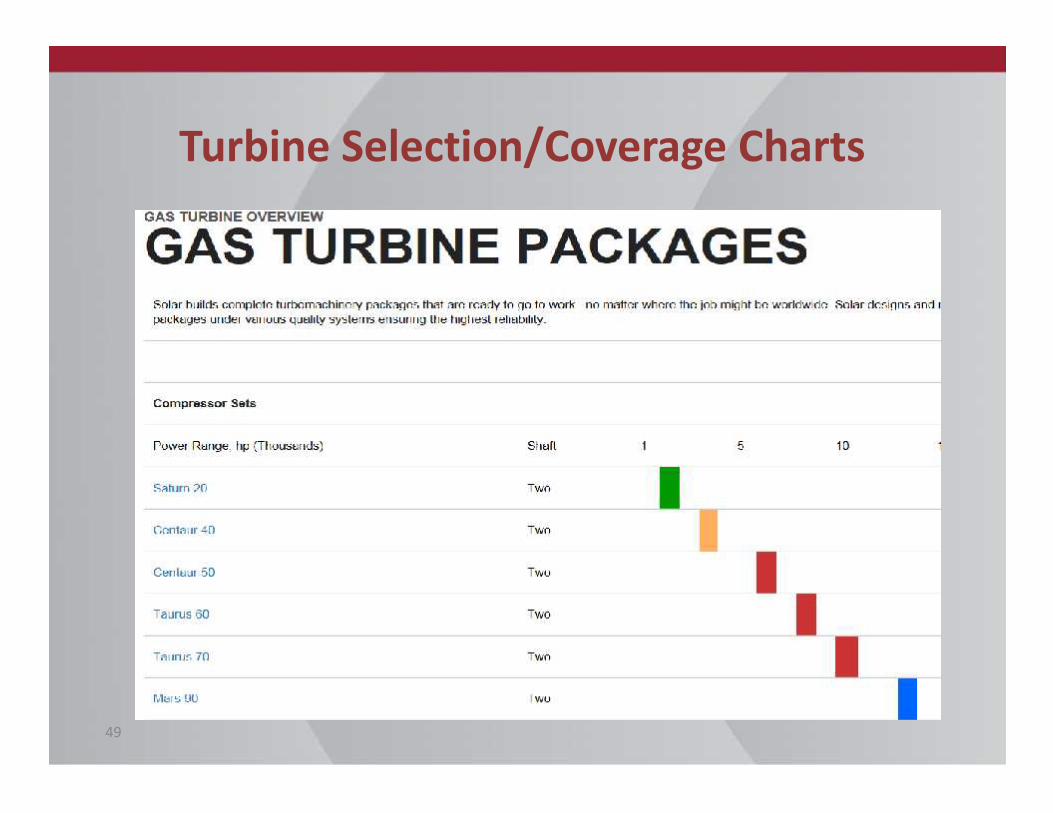
Turbine Selection/Coverage Charts
49
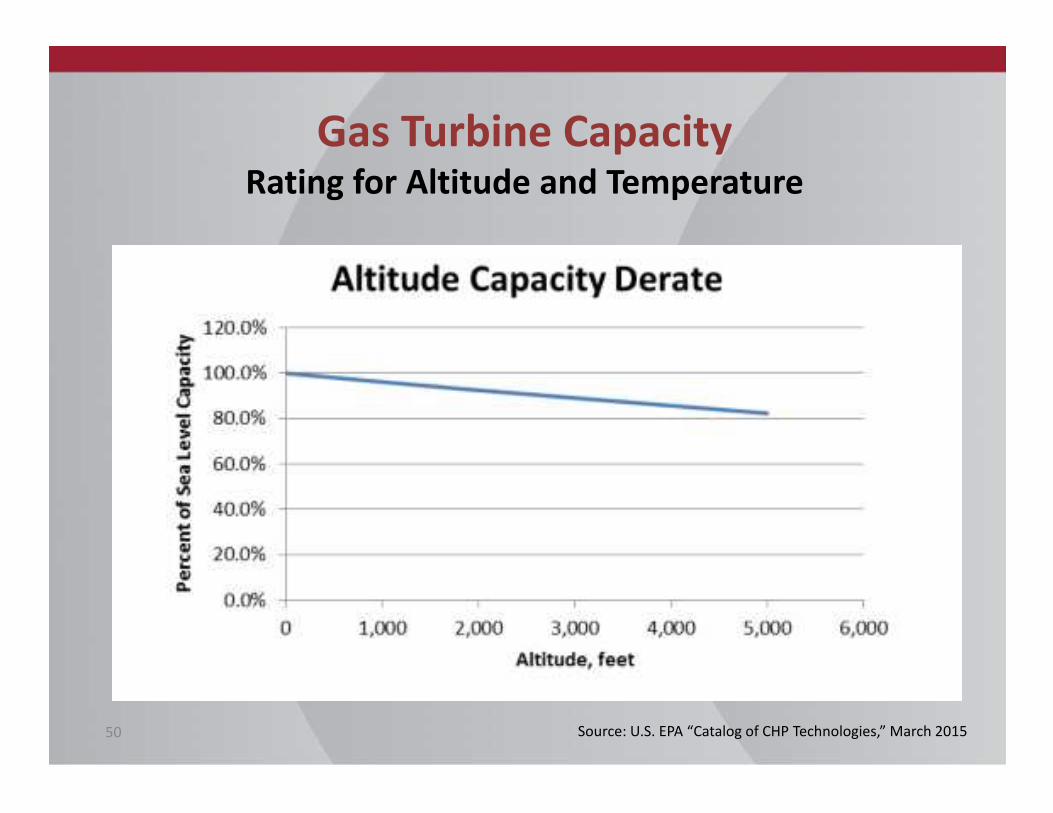
Gas Turbine CapacityRating for Altitude and Temperature
50 Source: U.S. EPA “Catalog of CHP Technologies,” March 2015

51

Site Altitude and Service LoadsSolar Centaur
52

Off-Design PerformanceSolar Centaur
53
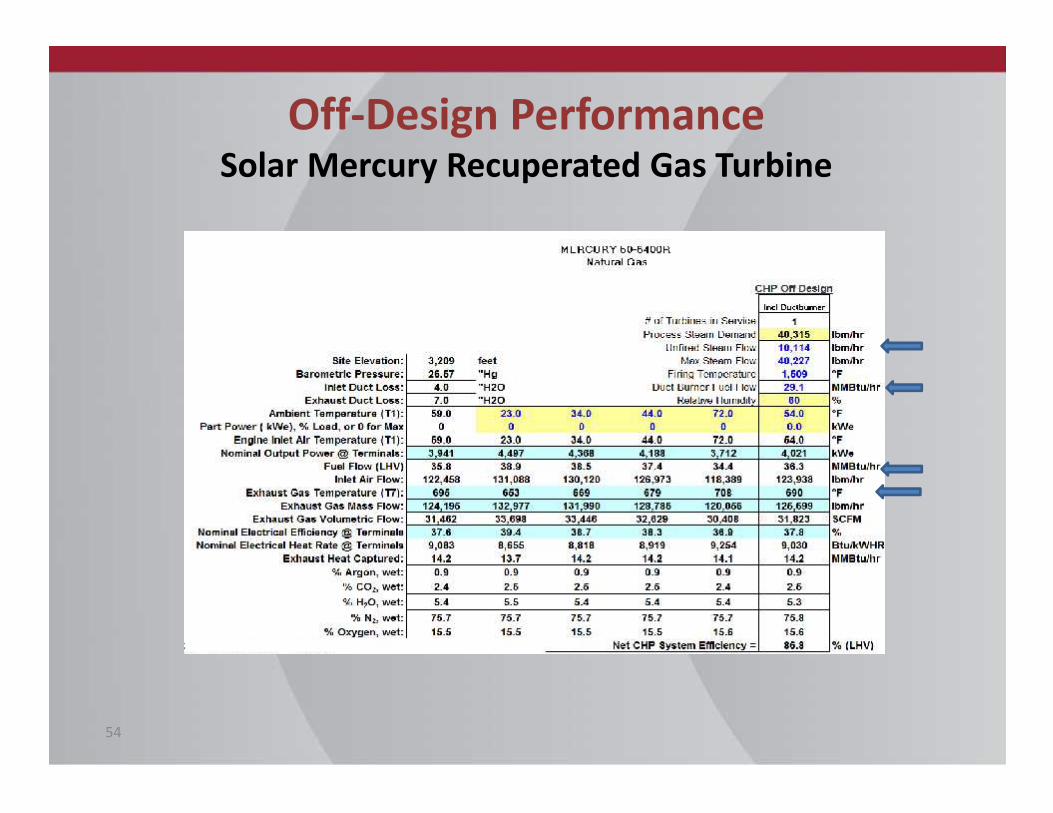
Off-Design PerformanceSolar Mercury Recuperated Gas Turbine
54

Part-Load Efficiency
55
Temperature, elevation, and part load affect performance/cost

• Total installed cost, $/kW• Heat rate, Btu/kWh• Transport gas availability and cost
Economies of Scale
56

Economies of ScaleGas Turbine Costs
57
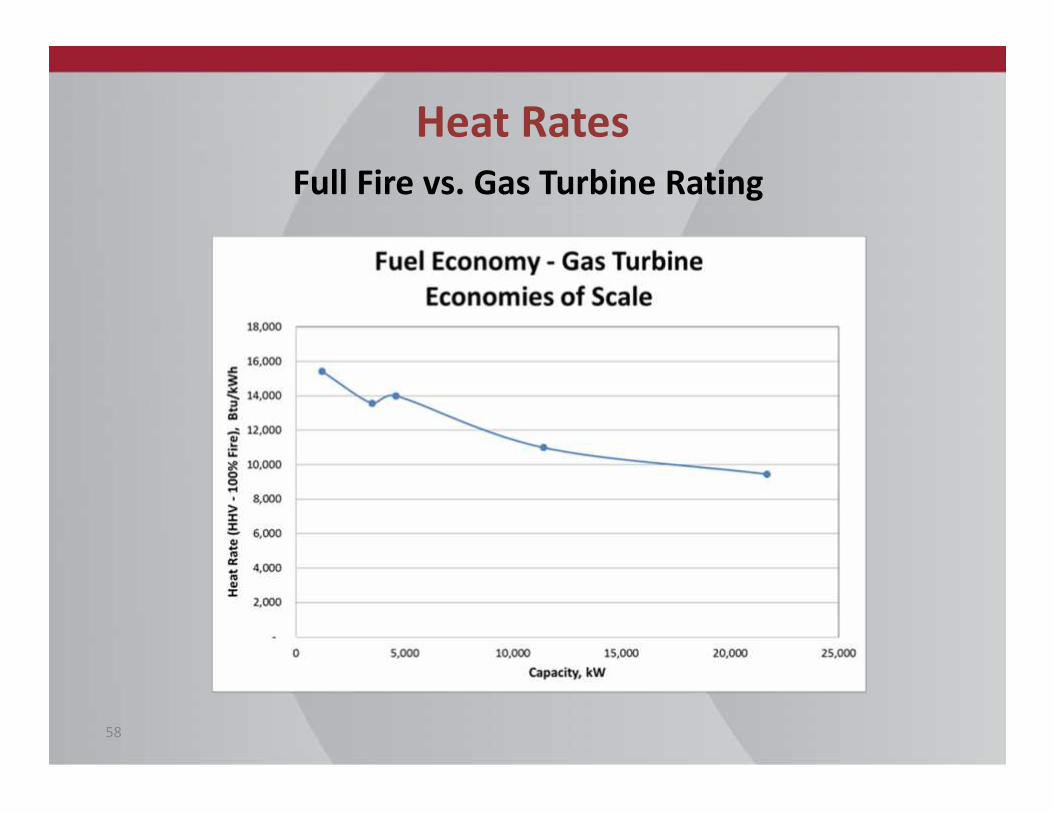
Heat RatesFull Fire vs. Gas Turbine Rating
58

Economies of ScaleReciprocating Engine Gensets
59

Heat RateRated Capacity vs. Power Rating
60

Cost Estimate for CHP Project Example
61

Steam ConsumptionAverage Monthly by Hour

Seasonality of Steam Generation

Exceedance Curve forElectrical Energy Purchases

Exceedance CurveElectrical Consumption – January

Exceedance CurveElectrical Consumption – July

Hourly Average Electrical Energy UseSeasonality Comparison
Assessment Tools
• CHP System Selection Analysis• Steam Turbine Monthly Analysis• Greenhouse Gas (GHG) Emissions Analysis• RelCost Financial Analysis

Washington State University Energy Program
Go Cougs!

Thank You!Questions?
Contact information:Marcia L. Karr, PE360-956-2144 [email protected]
David Sjoding, Director360-956-2004 [email protected]
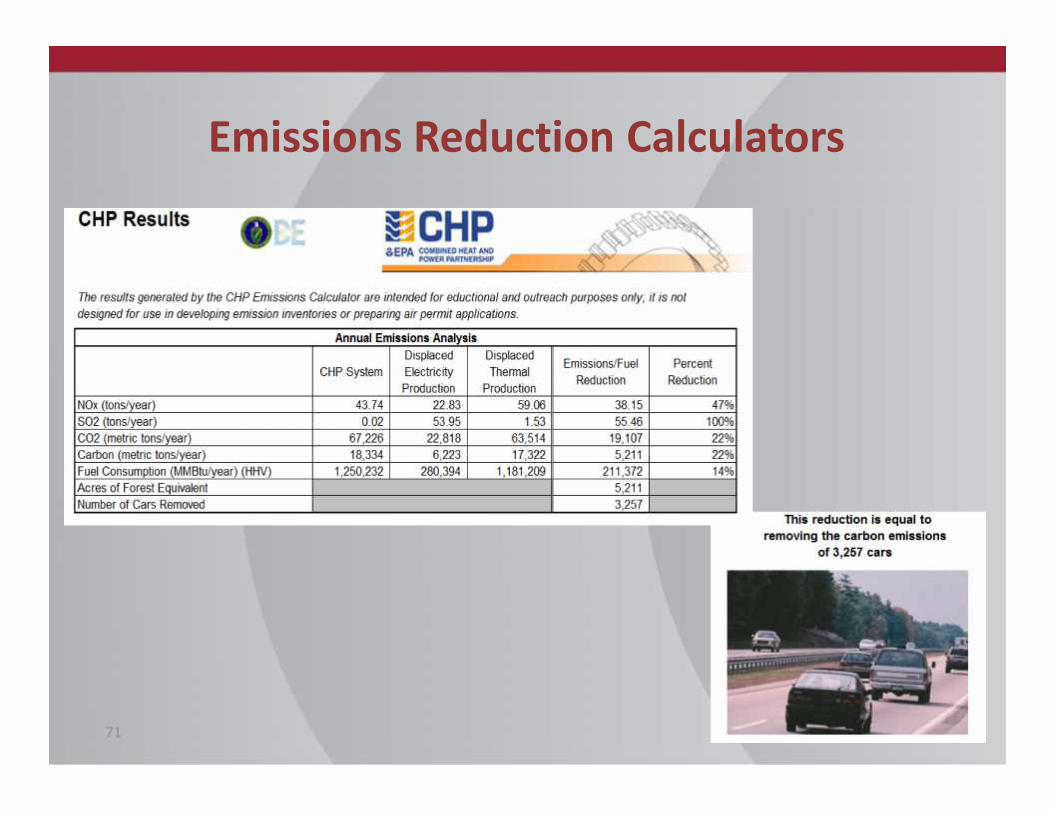
Emissions Reduction Calculators
71

Steam Turbine CalculatorU.S. DOE Office of Energy Efficiency and Renewable Energy
72
Two common methods for using the Steam Turbine Calculator• Calculate steam turbine (generator) power, given:
• Inlet pressure• Inlet temperature• Steam flow• Exhaust pressure
This is the most typical method when calculating ST output
• Calculate steam flow, given:• Inlet pressure• Inlet temperature• Exhaust pressure• Desired power (kWe)

Backpressure TurbineIsentropic Efficiency Defaults
73

Steam Properties Calculator
74

Boiler Combustion Efficiency CalculatorU.S. DOE Steam System Assessment Tool (SSAT)
75

• When nearing end-of-life, consider a new boiler of the same steamoutput and pressure (this is your baseline cost).
• Consider a new MP (300-psig) saturated steam boiler with abackpressure turbine between a MP header and the LP header.
• Consider a 600-psig HP boiler delivering 750F saturated steam tojustify a boiler size increase, possibly with a condensing andbackpressure turbine (or condensing/extraction unit).
• Consider a gas turbine with a HRSG if natural gas is available
Boiler Replacement Choices
76

• Packaged fire tube boilers and smaller water tube boilers(<35,000 lbs/hour of steam) are generally limited to providingsaturated steam at a pressure of 300-psig or less. Steamquality is reduced if routed through a backpressure turbine.
• Larger boilers can include super-heaters and provide steam at600-psig/750⁰F (this is somewhat of an industry standardrating).
Appropriate Boiler Pressures
77

Baseline SystemBiomass if Natural Gas is Not Available
78

Replacement MP Boiler300-psig Saturated
79

New HP Boiler600-psig/750⁰F Superheated Steam
80

• Routing saturated steam through a backpressure turbineresults in low-quality steam delivered to the LP header.Provide additional steam traps to remove the additionalmoisture.
• Optimize the steam system to reduce steam loads (such asincreased condensate return).
• Additional fuel is required to account for the energycontained in the generated electricity.
• Use an appropriate turbine isentropic efficiency.
Design Considerations
81

• The additional fuel consumption is the electrical energyproduced by the backpressure turbine multiplied by 3,413Btu/kWh, divided by the boiler and generator efficiencies(76% and 96%, respectively).
• Backpressure turbines produce electrical energy at close tothe boiler efficiency.
• Wood-fired boilers have full-load efficiencies between 69%and 76%, depending on wood species and moisture content.
Fuel Consumption Adjustment
82

Common Mistakes in CHP Assessments• Placing all the system costs on the electricity side and none on the
thermal side. Then, when comparing project costs on a per kWh basis tothe electric utility kWh costs, finding that “It doesn’t pencil out.”
• Assuming CHP is not applicable to building types, like a school.• Under-sizing the feed-auger in a biomass CHP, shortchanging the power
available.• Failing to understand equipment performance; the main thermal need
can be hot water or steam.• Recognizing that gas turbine firing rates are in terms of lower heating
value.• Not considering appropriate gas and steam turbine part-load efficiency
values.• Not considering on-site CHP-related electrical energy consumption
(service loads).

Common Mistakes in CHP Assessments(continued)
• Not using availability factors and O&M costs that are realistic andtechnology appropriate.
• Ignoring the game changing nature of fracking for future natural gaspricing.
• Not doing a detailed and site-specific CHP analysis.– Oregon alone has 41 retail electrical utilities with varying electrical rates, purchase
prices, and hookup requirements.
• Lack of experience in doing a true feasibility study. There is no CHPcertification.
• Incomplete feasibility study with no recommended size of system (0 to 8MW range).
• Gold plating (i.e., overpricing the system).