CHP Accellerator
105
Micro-CHP Accelerator Interim report November 2007
Transcript of CHP Accellerator

8/6/2019 CHP Accellerator
http://slidepdf.com/reader/full/chp-accellerator 1/104
Micro-CHP Accelerator
Interim reportNovember 2007

8/6/2019 CHP Accellerator
http://slidepdf.com/reader/full/chp-accellerator 2/104
Acknowledgements
The Carbon Trust would like to acknowledge the support and involvement of the following organisations in the Micro-CHPAccelerator: Baxi Innotech, Baxi-SenerTec, BERR, BRE, Cheltenham Borough Council, Communities and Local Government,DEFRA, Disenco, Dufn Associates, EA Technology, EC Power, E.On/Powergen, Energy Saving Trust, EnvironmentalChange Institute, Faber Maunsell, Gastec at CRE, Hama, Low Carbon Solutions, Microgen, Northern Ireland ElectricityEnergy, Northern Ireland Federation of Housing Associations, Ofgem, Phoenix Natural Gas, Stroud Borough Council,Sustain, TAC, University College London, Whispergen, Woking Borough Council.
Many thanks also to all the householders and commercial sites across the UK which have allowed monitoring equipmentto be installed and accessed for the purposes of this project.
8/6/2019 CHP Accellerator
http://slidepdf.com/reader/full/chp-accellerator 3/104
Contents
Executive summary 03
1 Introduction 11
1.1 The low-carbon challenge 11
1.2 About Micro-CHP 11
1.3 Scope of document 12
2 Micro-CHP technology overview 13
2.1 Introduction 13
2.2 Internal combustion engine Micro-CHP 13
2.3 Stirling engine Micro-CHP 14
2.4 Fuel cell Micro-CHP 15
2.5 How Micro-CHP can save carbon 15
2.6 Power-to-heat ratio 17
3 Carbon Trust Micro-CHP Accelerator 18
3.1 The Carbon Trust and technology
acceleration 18
3.2 Context and aims 18
3.3 Workstreams 18
3.4 Timescales 18
3.5 Key activities 19
3.6 Field trial methodology 19
3.6.1 Organisational structure 19
3.6.2 Site selection 20
3.6.3 Data collection 21
3.6.4 Data validation and energy balance 22
3.6.5 Data acceptance and substitution 23
3.7 Carbon performance assessment 25
3.7.1 Essential principles 25
3.7.2 Comparison metrics 26
3.7.3 Carbon emission factors 27
3.8 Micro-CHP eld trial 28
3.8.1 Introduction 283.8.2 Field trial units 30
3.8.3 Comparison with UK building stock 31
3.9 Condensing boiler eld trial 32
3.9.1 Introduction 32
3.9.2 Field trial units 33
3.9.3 Comparison with UK housing stock 33
3.10 Laboratory testing 34
4 Core eld trial ndings 35
4.1 Introduction 35
4.2 Condensing boiler performance 35
4.2.1 System efciency 35
4.2.2 Carbon Benets Ratio (CBR) 37
4.2.3 Seasonal variation 38
4.2.4 Boiler sizing and conguration 39
4.2.5 Summary 39
4.3 Domestic (Stirling engine) Micro-CHP
performance 40
4.3.1 System efciency 404.3.2 Carbon Benets Ratio (CBR) 42
4.3.3 Seasonal variation 44
4.3.4 Summary 44
4.4 Commercial (IC engine) Micro-CHP
performance 46
4.4.1 System efciency 46
4.4.2 Carbon Benets Ratio (CBR) 47
4.4.3 Seasonal variation 48
4.4.4 Summary 49
4.5 Comparing boilers and Micro-CHP 50
4.5.1 System efciency 51
4.5.2 Carbon Benets Ratio (CBR) 52
4.5.3 Absolute carbon emissions 54
4.5.4 Average efciency and CBR 56
4.5.5 Sensitivity to carbon intensity
assumptions 56
01Micro-CHP Accelerator
8/6/2019 CHP Accellerator
http://slidepdf.com/reader/full/chp-accellerator 4/104
8/6/2019 CHP Accellerator
http://slidepdf.com/reader/full/chp-accellerator 5/104
Executive summary
General points1. Micro-CHP is an emerging set of technologies with the
potential to provide carbon savings in both commercialand domestic environments
Combined Heat and Power (CHP) systems provide potentialreductions in carbon emissions and costs by generatingboth heat and electricity locally with efcient use of fueland by offsetting the use of centrally-generated electricityfrom the grid.
In recent years there has been much interest in producingnew Micro-CHP systems for use in small commercial anddomestic environments. If reliable and cost-effective systemscan be developed for such applications, these could offerworthwhile savings relative to conventional systems, suchas condensing boilers and grid-supplied electricity. A numberof Micro-CHP products are already commercially availableand others are nearing market deployment, but to datethere has been limited information available regarding thereal-world performance of Micro-CHP systems.
2. The Carbon Trust’s Micro-CHP Accelerator aims toinvestigate the potential benets of Micro-CHP and
understand the technical, commercial and regulatorybarriers to adoption
The Micro-CHP Accelerator involves one of the largestand most comprehensive assessments of Micro-CHP everundertaken. Over a period of four years, the Carbon Trusthas carried out a wide range of activities to better understandthe potential benets of different Micro-CHP technologiesand the barriers to their adoption. In particular, the projectaims to identify the end-use applications where Micro-CHPhas the greatest chance of offering carbon savings andto investigate the factors which have the most signicantimpact on Micro-CHP performance. It also aims to inform
future policy decisions relating to Micro-CHP and assistdevice manufacturers in their ongoing product development.
The project involves a major eld trial of 87 Micro-CHPunits in both domestic and small commercial environmentsas well as a corresponding eld trial of 27 condensingsystem boiler installations to provide a relevant baselineagainst which to compare Micro-CHP performance. Therelative performance of these technologies is also beingcompared directly under controlled laboratory conditions.The project has used an extremely rigorous methodologyto ensure high quality data capture and to allow robust,independent assessments to be made. At each site up to20 data parameters are measured at ve-minute intervalsthroughout each day and around 33,000 days of systemoperation have been analysed so far.
The project is ongoing and this report is an interim updatewhich presents a range of indicative ndings based on theconsiderable volume of data collected to date. It is intendedto inform a range of stakeholders, including policy makers,regulators, device manufacturers, end users, academics,energy suppliers and designers/installers of domestic andcommercial heating systems. Further work is in progressand a nal report is due to be published in 2008. This willcomment on results from the full data set, including a widerrange of annual performance data. It is also expected toinclude the results of laboratory work to identify the mostsignicant performance drivers and further analysis of the
economics of Micro-CHP.
3. The trial has demonstrated that the carbon and costsavings from Micro-CHP are generally better for buildingswhere they can operate for long and consistent heatingperiods
Micro-CHP systems are normally ‘heat-led’ and only generateelectricity, and therefore potentially save carbon, when thereis a demand for heating or hot water. Micro-CHP functionsbest with extended operating periods and minimisedcycling on and off. This reduces the impact of the start-upand shut-down periods either side of each operating cycle,
during which electricity is consumed rather than generated.For shorter running cycles, the electricity consumed by thesystem can be signicant relative to the amount of electricitygenerated, thus reducing, or even eliminating, the relativecarbon and cost-saving benets.
The eld trial has shown that maximising the running timeof Micro-CHP units is vital to achieve good performanceand that the carbon saving potential is much better forbuildings where they can operate for long and consistentheating periods. The key to high performance is matchingthe thermal output of the Micro-CHP unit to the heat demand
of the building, to ensure that it operates for many hoursat a time, rather than intermittently.
4. The key currently available Micro-CHP technologies areIC engines for small commercial applications and Stirlingengines for domestic applications
For small commercial applications, Micro-CHP devices havebeen commercially available for a number of years. The vastmajority of devices are based on internal combustion (IC)engine technology, originally adapted from the automotivesector, but substantially enhanced for use in Micro-CHPapplications. For domestic applications, most currently
available and near market Micro-CHP units in Europe arebased on Stirling engine technology.
03Micro-CHP Accelerator
8/6/2019 CHP Accellerator
http://slidepdf.com/reader/full/chp-accellerator 6/104
Although Stirling engines offer lower electrical efcienciesthan IC engine systems, they are generally consideredto be more appropriate for domestic applications as theyare quieter and have the potential for a longer operating
life1
. A few Organic Rankine Cycle (ORC) systems are alsocurrently under development, but little is known abouttheir performance relative to other devices at this stage.
In future, fuel cell-based Micro-CHP systems may offerhigher carbon savings due to their potential to operatewith higher electrical efciencies. By achieving a higherpower-to-heat ratio they could also potentially be usedmore effectively in applications where lower levels of heatare required. Although a number of fuel cell-based Micro-CHPsystems are under development, they are thought to bestill a few years away from being market-ready products.Therefore, in the short term, IC engines and Stirlingengines offer the most viable carbon saving opportunitiesfrom Micro-CHP technology.
Commercial Micro-CHP5. In small commercial applications, the eld trial has
shown that Micro-CHP systems can provide typical carbonsavings of 15% to 20% when installed as the lead boilerin appropriate environments
The eld trial results have shown that commercial Micro-CHPdevices can provide signicant carbon savings in applicationssuch as residential care homes, community housing schemes
and leisure centres, which have high and consistent heatingor hot water demands all year round. In such scenarios, theMicro-CHP plant is typically sized so that it runs consistentlythroughout the year to meet the base load requirementsfor heat, while the electricity generated is used to meeton-site requirements for electricity.
In small commercial applications, Micro-CHP systemscan typically provide heat outputs in the range of 50 to500MWh per year, depending on site requirements andsystem sizing. For such systems, the trial has shown thatcarbon savings in the range of 2-20 tCO 2 per year are likelyto be possible, equivalent to typical reductions in overallsite heating emissions in the range of 15% to 20% relativeto a conventional heating system using modern condensingboilers. The associated cost savings for such systems areexpected to be in the range of £1,000 to £10,000 per year,again depending on heat demand and system sizing.
6. There are some practical challenges associated withthe use of commercial Micro-CHP and the trial hasshown that appropriate expertise is vital to achieveeffective operation
A potential barrier to the effective use of commercialMicro-CHP relates to the general lack of understanding ofthe technology and the practical challenges associated withits installation, operation and maintenance in commercialboiler houses.
Where commercial Micro-CHP sites have access to skilledoperations and maintenance contractors and on-site staffhave been appropriately trained, devices have been seento work very effectively, offering consistent carbon andcost savings. However, the trial has also seen installationswhere existing contractors lack the appropriate expertise
or end users have insufcient understanding of the system.In such cases, Micro-CHP systems have often encounteredoperational issues, leading to extended periods of downtimeand sub-optimal performance.
The project has highlighted the importance of technicalsupport and expertise being available locally for commercialMicro-CHP installations. Although some suppliers prefer toprovide support from central service centres, this may notprovide the low cost, knowledgeable and customer-focusedadvice that is really needed to develop the market. There isa need for increased awareness raising and skill developmentwith local installers and maintenance contractors, whogenerally have limited experience with Micro-CHP technology.
The project has also highlighted the need for customers todevelop in-house expertise regarding Micro-CHP operation,provide appropriate training for key operational staff andensure that they have access to best practice operationalguidance.
1 Despite this a signicant number of IC engine domestic Micro- CHP systems have been sold in Japan, where they are t ypically located outside the dome stic premises.Some Stirling engine manufacturers are also building larger systems to targe t small commercial applications.
04 Micro-CHP Accelerator
8/6/2019 CHP Accellerator
http://slidepdf.com/reader/full/chp-accellerator 7/104
Domestic Micro-CHP7. In domestic applications the annual heat demand
has been found to be a useful metric for identifyinghouses with a high likelihood of achieving worthwhilecarbon savings
The eld trial results have shown a strong correlationbetween the length of time a domestic Micro-CHP systemtypically operates for and the associated potential for carbonsavings. The ndings suggest that in order to provide anet carbon saving benet relative to a condensing systemboiler, the currently available domestic Micro-CHP systemsmay need to run for over an hour without stopping, onaverage, each time they start. Longer run times have beenfound to be more likely to occur in houses with higher andmore consistent levels of heat demand.
Results from the eld trial suggest that as the level of heatdemand increases, so the statistical likelihood of achievingworthwhile carbon savings also increases. The annualheat demand has been found to be an appropriate andstraightforward metric to use for identifying which housesare most suitable for Micro-CHP. The eld trial resultsindicate that the Stirling engine Micro-CHP devices involvedin the trial, with a typical power-to-heat ratio of around1:10, are likely to be best targeted at houses with an annualheat demand of over 20,000kWh (after other cost effectiveand practical energy saving measures have already beenimplemented). The eld trial ndings suggest that typical
examples of such houses are likely to be those built before1920 or those with a oor area of over 110m 2.
8. The domestic Micro-CHP systems monitored in thetrial have the potential to provide typical carbon savingsof 5% to 10% for older, larger houses with high andconsistent heat demands
The most appropriate domestic applications for theMicro-CHP devices monitored in the eld trial appear to behouses with higher than average heat demands. These arelikely to be larger houses (e.g. more than three bedrooms)and older houses where it is neither practical nor costeffective to improve the insulation (e.g. older housing withsolid brick walls).
When assessing the potential carbon savings offered byMicro-CHP systems, it is of most interest to consider theperformance for applications where Micro-CHP is mostappropriate, and therefore most likely, to be installed. The
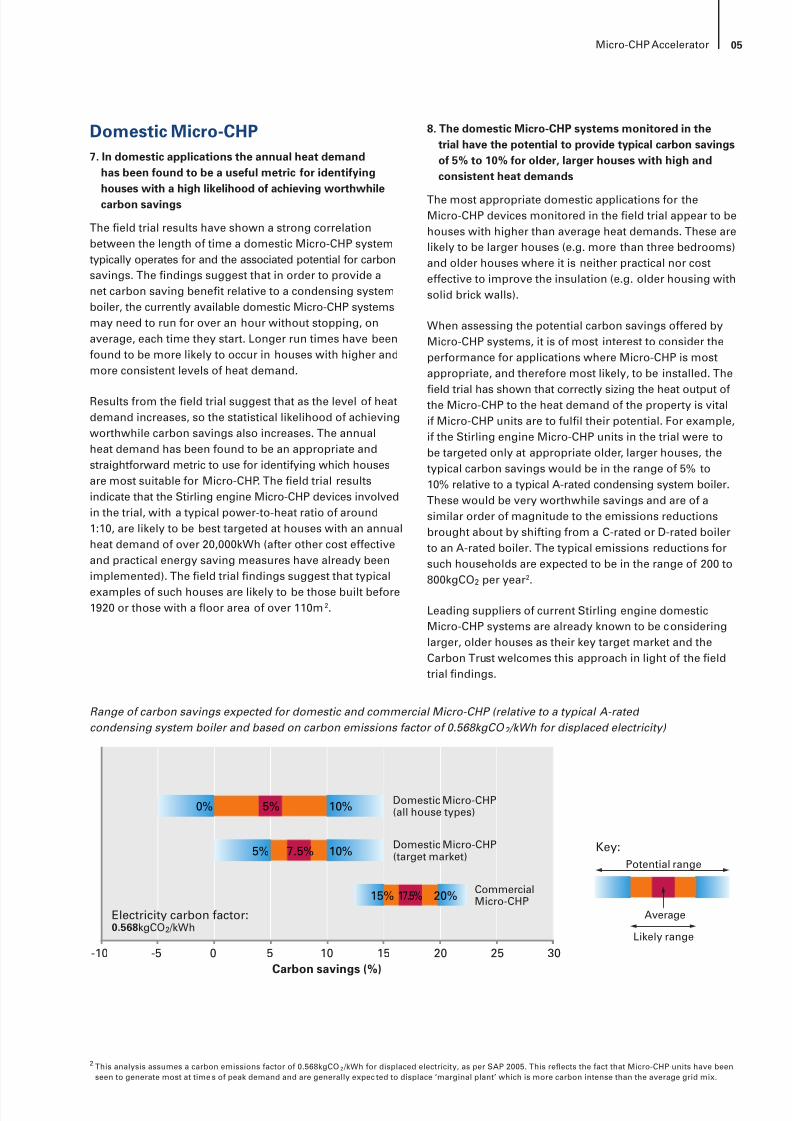
eld trial has shown that correctly sizing the heat output ofthe Micro-CHP to the heat demand of the property is vitalif Micro-CHP units are to full their potential. For example,if the Stirling engine Micro-CHP units in the trial were tobe targeted only at appropriate older, larger houses, thetypical carbon savings would be in the range of 5% to10% relative to a typical A-rated condensing system boiler.These would be very worthwhile savings and are of asimilar order of magnitude to the emissions reductionsbrought about by shifting from a C-rated or D-rated boilerto an A-rated boiler. The typical emissions reductions forsuch households are expected to be in the range of 200 to800kgCO 2 per year 2.
Leading suppliers of current Stirling engine domesticMicro-CHP systems are already known to be consideringlarger, older houses as their key target market and theCarbon Trust welcomes this approach in light of the eldtrial ndings.
2 This analysis assumes a carbon emissions factor of 0.568kgCO 2 /kWh for displaced electricity, as per SAP 2005. This reects the fact that Micro-CHP units have beenseen to generate most at time s of peak demand and are generally expec ted to displace ‘marginal plant’ which is more carbon intense than the average grid mix.
Range of carbon savings expected for domestic and commercial Micro-CHP (relative to a typical A-rated condensing system boiler and based on carbon emissions factor of 0.568kgCO 2 /kWh for displaced electricity)
05Micro-CHP Accelerator
Carbon savings (%)-10 -5 0 5 10 15 20 25 30
Key:
Electricity carbon factor:0.568 kgCO 2 /kWh
Domestic Micro-CHP(all house types)0% 5% 10%
Domestic Micro-CHP(target market)5% 7.5% 10%
CommercialMicro-CHP15% 17.5% 20%
Potential range
Average
Likely range
8/6/2019 CHP Accellerator
http://slidepdf.com/reader/full/chp-accellerator 8/104
9. Although current Micro-CHP systems can potentially savecarbon in some smaller, newer properties, this is not alwaysthe case and any savings are likely to be insignicant
Smaller and newer houses have been found to be less
likely to have an appropriate level of heat demand forMicro-CHP and may not see any carbon saving benetfrom installing the types of Stirling engine devices thatwere involved in the trial. The eld trial ndings suggestthat for smaller and newer houses, the typical carbonsavings from such devices will be less than 5%, withannual emissions reductions typically less than 100kgCO 2 per year. In some cases the results also suggest that theuse of a Micro-CHP system may actually lead to anincrease in emissions relative to a condensing boiler.
In light of tightening building regulations and drivers to
reduce heat demand in new homes, the eld trial ndingsindicate that domestic Micro-CHP devices of the type includedin the trial should generally be targeted as a retrot solutionfor larger, older homes, rather than targeting smaller homesor individual new-build housing. However, for larger new-build developments with community heating, commercialMicro-CHP systems could potentially be an effective solution,providing base-load heating or hot water requirements formultiple new houses.
10. The domestic Micro-CHP systems involved in the trialhave been found to provide potential annual savings inthe target market of around £40-£90 depending on thelevel of reward for exported electricity
Analysis of the eld trial data has shown that, for anappropriate UK target household with annual heat demandof 20,000kWh, a current domestic Stirling engine Micro-CHPunit could provide potential annual savings of £40-£90 relativeto an A-rated condensing system boiler. This range of savingsdepends on the electricity export reward tariff available andsavings of around £90 would only be possible if the exportreward was equivalent to the full retail electricity price.Savings of around £40 are possible with currently availableexport tariffs, which are roughly equivalent to half of theretail electricity price 3.
The current marginal cost of a domestic Micro-CHP unitrelative to an equivalent condensing boiler is estimated tobe around £1,500. This suggests that current payback periodsfor Micro-CHP devices are likely to be well over 20 years. Inlight of these ndings, it is likely that Micro-CHP products willbe better targeted initially at environmentally-aware earlyadopters rather than the fuel poor or those in social housing.Over the coming years, leading Micro-CHP manufacturersare believed to be targeting a marginal unit cost of around£600 relative to an equivalent condensing boiler whenmanufactured at volume. If this can be achieved, it would
imply a marginal payback period in the range of 7-15 years,but this could potentially be further reduced by achievinghigher system efciencies. Paybacks will vary with changesin relative gas and electricity prices and will also be shorter
for houses with higher annual heat demands.
11. Around half of all electricity generated by domesticMicro-CHP systems in the trial has been exported tothe grid, so wider adoption is likely to depend on theavailability of appropriate export reward tariffs
The eld trial has shown that, on average, around half ofthe electricity generated by a typical 1kW domestic Micro-CHPunit is exported to the grid. This is due to the volatile natureof domestic electricity demand, where the peak demand isoften ve to ten times the base load electricity requirement.Although the household demand often exceeds that being
generated by Micro-CHP, for signicant periods the demandis less than that being generated and the excess is exported.Although the proportion of export is relatively high, it is stillexpected to be lower than for some other micro-generationtechnologies due to the times of day and times of year whenMicro-CHP systems tend to generate electricity 4.
To reduce the level of electricity which is exported,manufacturers could in theory design devices with lowerlevels of electrical output, but this is likely to be undesirableas it would signicantly reduce the carbon saving benets.There are also other potential options which could reducelevels of export, including use of on-site electricity storagedevices or educating users on how to align their useof appliances with times when Micro-CHP is generating.However, these options are unlikely to have a signicantimpact in the near term and these ndings imply that mostdomestic Micro-CHP systems will export a signicantproportion of the electricity they generate.
If domestic Micro-CHP systems are to be more widelyadopted, it is likely to be essential that appropriate domesticexport reward tariffs are available. Higher export rewardswould not only improve the economic potential for customers,they would also provide a greater incentive for manufacturers
to enhance the electrical efciency of their devices, whichis the key to achieving carbon savings. It is thought thatthe current lack of widely available and stable export tariffsmay currently be restricting the manufacturers’ ability todesign Micro-CHP systems which deliver the maximumpossible carbon savings. Any export reward regime mustavoid providing incentives for systems to generate anddump excess heat in order to access rewards for generatedelectricity. However, with the power-to-heat ratios of currentMicro-CHP devices this is not expected to occur for anyplausible level of export reward.
3 This analysis only includes energy costs and does not include any cost s for ongoing maintenance and support for either boilers or Micro-CHP.4 For example, eld trial data made available to the Carbon Trust for a range of domestic solar PV and small wind system installations sugges ts that typical exp ort
levels for these technologies may be higher than for Micro-C HP.
06 Micro-CHP Accelerator
8/6/2019 CHP Accellerator
http://slidepdf.com/reader/full/chp-accellerator 9/104
12. The eld trial has demonstrated that domestic Micro-CHPsystems typically generate electricity at times of daywhich correspond with peaks in domestic electricitydemand
Comparing the net effect of multiple Micro-CHP unitsexporting to the grid has indicated that domestic Micro-CHPsystems typically generate most at periods of peak demand,notably in the daytime/evening, and in winter. Consequently,the net export effect appears to be benecial for the electricitynetwork during periods of peak demand and is likely toreduce the requirement for central generation, with exportedpower expected to be used by neighbouring houses.
The eld trial results suggest that, in general, energysuppliers, the national grid and electricity distributionnetworks should all see peak reduction benets from
widespread adoption of domestic Micro-CHP. However,there are other wider challenges relating to networkimpacts from the widespread roll-out of Micro-CHP andthese are outside the scope of this interim report.
13. Customer feedback suggests there are various practicaland service-related issues that must be addressed beforedomestic Micro-CHP systems are deployed at scale
Feedback from eld trial participants has highlighted arange of practical observations on the performance ofdomestic Micro-CHP units which need to be addressed.Most notably, it is clear that further improvements are
needed in the reliability of Micro-CHP systems and in theavailability of appropriate installation and maintenanceskills. In addition, consumers would benet from havingmore intuitive control interfaces, better levels of customersupport and an increased general awareness of how thesystems work and how they can be operated for optimumperformance.
Most of these issues are to be expected given the earlystage of technology development and are likely to beresolved, provided the necessary actions are taken bymanufacturers and suppliers. However, the more generalproblem of improving householder knowledge andunderstanding is likely to remain for some time, due to thechallenges associated with awareness-raising across sucha large and diverse group. As well as educating customersabout Micro-CHP, manufacturers should continue to focuson improving reliability as this will be essential to buildconsumer condence in the early years of a new market.
Condensing boilers14. The practical operating efciency of domestic condensing
boiler installations in the eld trial has been typically4-5% lower than the quoted SEDBUK ratings
In order to provide a relevant baseline against which toassess the overall carbon saving potential of Micro-CHP,the Carbon Trust is also running a eld trial of condensingboilers in domestic environments 5. The results to datesuggest that the efciencies achieved by condensing boilerinstallations in real houses are generally lower than theirSEDBUK 6 ratings, with performance for the installations inthe trial typically around 4-5% lower than those measuredunder controlled laboratory conditions. This is not to saythat the condensing boilers have failed to perform asdesigned, but rather that in actual installations the heatingsystem and householder control settings often constrainthem to less efcient operation. For example, systemshave frequently been found to be installed and conguredsuch that they operate at temperatures which are not lowenough for the boiler to achieve condensing operation.The results imply that more can be done to ensure thatcondensing boilers perform to their full potential when usedin UK houses, in particular by manufacturers and installerstaking a more holistic approach to ensure high overallsystem efciency.
15. Some condensing boiler installations have been foundto use considerably more electricity than others to
provide the same level of heat
The eld trial ndings show that to provide the same levelof heat output, different system boiler installations oftenuse very different amounts of electricity for pumps, fansand control systems. This variation in electrical consumptioncan have a signicant effect on domestic carbon emissions.In some instances, the monthly electrical consumptionassociated with a condensing boiler installation has beenfound to be as high as 15% of the overall householdelectrical consumption.
There appears to be an opportunity for manufacturers of
boilers, pumps, fans and controls to improve performanceby reducing electrical use, both in standby mode and duringoperation. This could potentially be addressed by wideningexisting product assessment standards to encouragemanufacturers to limit the electrical usage of their products.Also, in many cases this additional electricity use is due topoor quality installation and commissioning, with pumpsand other components congured to operate at higher powerlevels and for longer periods than necessary. This could beaddressed by enhancing best practice guidance and trainingmaterials for installers to encourage high quality installationand conguration of system components to minimise
electrical usage.
5 All of the units monitored are system boilers with hot water tanks; there are no combination boilers included. This is to allow consistent comparison with the Micro-CHPinstallations, all of which include hot water tanks.
6 SEDBUK = Seasonal Efciency of Domestic Boilers in the UK.
07Micro-CHP Accelerator
8/6/2019 CHP Accellerator
http://slidepdf.com/reader/full/chp-accellerator 10/104
16. The trial has shown that there are various complexdrivers which affect the performance of domesticheating systems
The eld trials of condensing boilers and Micro-CHP units
have together highlighted various common drivers whichaffect the performance of heating systems. These includethe behaviour of the end user, the type of building the systemis installed in, the heating device itself and the way in whichthe heating system is designed, installed and maintained.Although the interaction of different drivers is highly complexthere are some high-level trends emerging.
Results from a set of near-identical new domestic propertiestted with Micro-CHP indicate that householder behaviourhas a very signicant effect on the level of carbon emissions,with a two-fold variation across the properties. This suggests
that the interaction of occupants with the heating systemand controls is a major driver of efcient operation. Theevidence indicates that users would benet from guidanceon optimum operation of their heating system, includingadvice on the use of timers, thermostats and thermostaticradiator valves (TRVs).
The trials have also shown that appropriate integration withthe existing central heating system components is vital forboth Micro-CHP and condensing boilers. It is very importantthat the optimal device is selected for a given house andthat this is commissioned effectively. Performance is alsolikely to be enhanced if installers carry out basic checkson the existing system components and ensure that anynecessary improvements are carried out when the newheating device is installed. Where possible the mostefcient pumps and other external components should bechosen and these should be congured appropriately forefcient operation.
Policy implications17. Micro-CHP should be considered for additional policy
support, but on the condition that support is onlyprovided for devices installed in appropriate environments
In light of the eld trial ndings, it is appropriate thatMicro-CHP should be considered as an eligible technologyfor policy support programmes such as the Low CarbonBuildings Programme 7 and the Carbon Emissions ReductionTarget (CERT) 8. However, this must be on the condition thatMicro-CHP units are only installed in environments wherethey have a high likelihood of achieving a carbon savingrelative to condensing boilers. Any policy support forMicro-CHP, or indeed for any other carbon-saving technology,should be provided in proportion to the potential level ofcarbon savings available.
For the units that were monitored in the eld trial, theannual heat demand has been shown to be a useful metricfor determining which houses are suitable for Micro-CHP.For example, the trial ndings suggest that policy support
for current Stirling engine Micro-CHP devices, with apower-to-heat ratio of around 1:10, should ideally only beprovided for houses with a calculated annual heat demandin excess of 20,000kWh, after all practical energy efciencymeasures have been implemented. It is believed that supportschemes such as CERT could be adapted to ensure thatsupport is only provided for appropriate applications.However, support schemes will also need to be exibleenough to allow for future devices which may have differentrated heat outputs and power-to-heat ratios and maytherefore be appropriate for different types of houses.
18. The detailed eld trial ndings could be used to reviewand update relevant standards and procedures in futureto ensure these maximise the potential UK carbon savings
The Micro-CHP and condensing boiler eld trials providesome of the most detailed, up-to-date, independent androbust evidence available regarding the real performanceof UK heating systems. In light of these ndings, it maybe benecial to review existing methods used to assessthe performance of heating systems, such as SAP 9. Certainrelevant assumptions used in such methods could bevalidated against the real-world data from the eld trial toensure that they are as realistic and up to date as possiblein future iterations and therefore provide incentives forappropriate decisions in the design and installation ofheating systems.
Similarly, it is likely to be benecial to review the plannedmethods for future assessment of Micro-CHP performance(such as PAS67 10 and APM 11 ) in the light of the eld trialndings. This would ensure that, where appropriate, theoutputs of these methods correlate with the real-worldperformance of Micro-CHP systems observed in the eldtrial and therefore provide incentives for the most appropriatedecisions in system design and installation. There is alsoa need to update existing approved best practice guides
to include Micro-CHP and to encourage installers to ensurethat Micro-CHP systems are installed in appropriate housesand are well integrated with existing heating systems 12 .
In light of the ndings from the trials, it would also appearappropriate to review existing procedures for assessingcondensing boiler performance (such as SEDBUK) andconsider including assessment of the electrical performanceof boilers and wider heating system components in futureiterations. In particular, it would be useful to ensure thatfeedback on the UK experience is provided to those groupsresponsible for updating the European directives for boilertesting on which the UK tests and procedures are based.
7 The Low Carbon Buildings Programme provides Government grants for micro- generation technologies to householders, community organisa tions, schools,the public and not for prot sector and private businesses.
8 The Energy Efciency Commitment (EEC) is a requirement on electricity and gas suppliers to promote improvements in domestic energy efciency, shortlyto be renamed the Carbon Emissions Reduction Target (CERT) .
9 The Government’s Standard Assessment Procedure (SAP) is the national methodology used to evaluate the energy performance of domestic dwellings anddemonstrate compliance with Par t L of Building Regulations.
08 Micro-CHP Accelerator
8/6/2019 CHP Accellerator
http://slidepdf.com/reader/full/chp-accellerator 11/104
19. Future changes to the carbon intensity of centrallygenerated grid electricity are likely to have a majorimpact on the potential carbon savings from Micro-CHP
The magnitude and signicance of any carbon savings from
Micro-CHP systems are highly dependent on assumptionsregarding the carbon intensity of the grid electricity beingdisplaced. The majority of analysis in this report is basedon using a ‘marginal plant’ emissions factor (rather thanaverage grid mix) to reect the fact that Micro-CHP systemshave been shown to generate most electricity at times whenthe carbon intensity of the grid is expected to be higher,such as daytime/evening and winter peak demand periods 13 .
However, if the UK is to meet its targets for renewableelectricity generation, the average grid carbon intensity islikely to fall in future. As the grid carbon intensity reduces,
so the potential carbon saving benets from Micro-CHPwill reduce accordingly, although the performance ofMicro-CHP units is also expected to improve over the sameperiod. In light of this, policy makers should continue toreview support for Micro-CHP in conjunction with underlyingenergy supply forecasts and other policies which affect thegrid carbon intensity.
Looking forward20. There are various actions which could accelerate the
uptake of commercial Micro-CHP systems and ensureeffective ongoing operation and maintenance
There are various different internal combustion (IC) engineMicro-CHP units available commercially and over 17,500 unitsare thought to have been installed across Europe to date.However, only a limited number of systems have beeninstalled in small commercial applications in the UK. Giventhe signicant potential carbon and cost savings demonstratedby the project, actions should be considered to encouragemore widespread uptake of the existing IC enginetechnology, which is mature, proven and readily available.
The growth of the commercial Micro-CHP market couldpotentially be increased by new policy measures to encourage
the installation of the technology in public sector buildings.For example, housing schemes and other appropriate publicbuildings undergoing boiler house refurbishment could begiven incentives to adopt Micro-CHP systems in preferenceto conventional boiler-only installations.
Based on the trial ndings, the Carbon Trust will alsocontinue to promote the potential benets of commercialMicro-CHP to the businesses and public sector organisationsit works with, and will provide advice on how best to design,deploy and use Micro-CHP systems to achieve maximumcarbon and cost savings.
Given the challenges associated with effective operationand maintenance of commercial Micro-CHP units, supplierscould consider targeting their products at groups of similarcustomers in the same geographical regions and ensuring
additional appropriate training for local heating andventilation engineers to provide high quality maintenanceand support services.
Some suppliers of commercial Micro-CHP systems alsosell conventional boilers, and these businesses couldpotentially increase the attractiveness of their customerpropositions by offering packaged solutions. Rather thanoffering a ‘Micro-CHP only’ solution, they could provideMicro-CHP units and associated conventional boiler plantas a holistic system, with all the components installed andcommissioned together, by appropriately qualied experts.
21. The potential carbon savings from domestic Micro-CHPsystems could be increased if manufacturers are ableto further optimise the design and performance oftheir units
Although the results from trial provide an importantindication on the performance of the current devices, Stirlingengine Micro-CHP is an early-stage, evolving technologyand manufacturers are in an ongoing process of productdevelopment and innovation. It is expected that signicantprogress can be made with future products in much thesame way that current leading condensing boilers area signicant improvement on early models.
The carbon and cost savings from Micro-CHP are highlydependent on the amount of electricity generated as wellas the efciency with which gas is used. It will therefore beimportant that future product iterations focus on maximisingthe power-to-heat ratio of the device. Extrapolation of theeld trial results has shown that if manufacturers wereable to improve the electrical efciency of current domesticMicro-CHP units by just 3% (from a typical range of 6-8%to a range of 9-11%), while maintaining the same overallefciency, this could result in a dramatic improvement inthe carbon saving potential, with a near doubling of carbon
savings predicted for a typical household in the target market.In addition to potential enhancements to the core engine,manufacturers could also improve efciency by enhancingthe system control logic to maximise device run times, inparticular by avoiding cycling, and by reducing electricityusage outside of generating periods. At the time of writingit is known that leading manufacturers are developingdevices which they expect to have higher efciencies thanthose monitored in the trial.
09Micro-CHP Accelerator
10 Publicly Available Specication (PAS) 67 is a Micro-CHP laboratory test procedure.11 APM (Annual Performance Method ) is a method for predicting the annual performance of Micro -CHP systems bas ed on the results of PAS 67 testing
and allows the results to b e used by methods such as SAP.
12 An example is the ‘Domestic Heating and Compliance Guide’, an approved Communities and Local Government docume nt, providing guidance on howto comply with Building Regulations for domestic heating systems.
13 The core analysis in the report assumes a carbon emissions factor for electricity of 0.568kgCO 2 /kWh, as per SAP 2005. Using a long-te rm grid mix carbon factor(such as 0.43kgCO 2 /kWh) has the effect of considerably reducing the potential carbon savings.
8/6/2019 CHP Accellerator
http://slidepdf.com/reader/full/chp-accellerator 12/104
10 Micro-CHP Accelerator
Manufacturers could also enhance the performance oftheir systems by designing programmable controllers thatare easier to use, ensuring that pumps and other systemcomponents are as efcient as possible and providing
installers with guidance on how to size, install andcommission systems for optimal efciency. Guidance shouldideally include detailed system design methods for installers,which have been fully thought through and validated bythe product designers.
22. Domestic Micro-CHP manufacturers could alsoconsider designing units to allow operation withhigher electrical efciency in larger and older houses
Current domestic Micro-CHP devices are generally sized forpeak electrical generation of around 1kW. Manufacturers arebelieved to have chosen this level in an attempt to maximise
the amount of electricity used in the house and minimise theamount of export to the grid. However, as current Stirlingengines have a power-to-heat ratio of around 1:10, thisdesign decision effectively means that these units may notproduce enough heat output for larger and older domestichouses as they may be unable to provide the required levelsof comfort in the coldest weather without additional heating.
To overcome this, some manufacturers have includedauxiliary ‘boost’ burners in their Micro-CHP products toprovide faster warm-up or top-up heating in periods ofhigh heat demand. This has the benecial effect of allowingunits to be installed in larger houses, but effectively reducesthe overall electrical efciency of the device as more gasis used to produce heat rather than to produce both heatand electricity. Given the vital importance of achieving highelectrical efciencies, Micro-CHP manufacturers shouldconsider producing systems capable of meeting higherheat demands while still maintaining optimum electricalefciency, either through the use of more efciently controlled‘boost’ burners or through designing systems with higherelectrical outputs.
23. Suppliers of all domestic heating devices can signicantlyimprove performance by ensuring high quality design
and installationThe trial has shown that high quality design and installationare essential to achieve good performance for bothcondensing boilers and Micro-CHP systems. However, this hasbeen found to be difcult to achieve in practice and this maybe related to the highly fragmented nature of the UK installertrade. There is a clear need for further general training ofinstallers and incentives to improve quality and consistency.
The eld trial ndings also suggest that the conventionalmodel of small installation companies purchasing heatingsystems from local wholesalers, principally on grounds of
price, may not be appropriate for Micro-CHP devices, asthese generally require specialist expertise. A holistic serviceoffering, fronted by an energy supplier or other specialistservice organisation, would appear a preferable model toensure high quality design and installation.
24. Suppliers could potentially increase the uptake ofMicro-CHP by offering customers packaged solutionsof nancing, installation, maintenance and electricitybuy-back
Micro-CHP systems currently suffer from variousdisadvantages relative to conventional heating systems.These include higher capital costs, a lack of widespreadinstaller experience, more complex system operation, thepotential requirement for more specialist maintenance anda lack of clarity regarding export tariffs. As things stand,this could lead to low take-up, poor performance anddissatised users, which could damage the image of thenascent industry.
These disadvantages could, in principle, be offset by theadvantages offered by Micro-CHP, most notably the potential
reduced overall fuel costs for the user and potential peaklopping advantages for electricity suppliers. However, asonly some of these advantages directly benet the user,suppliers can potentially overcome these barriers by adoptingnew business models to share the benets. For example,suppliers could offer a packaged solution of nancing,installation, maintenance and electricity buy back. This modelreduces the capital cost burden for customers, increasesthe chance of good quality installation in appropriate housesand ensures ongoing maintenance provision. It shouldalso provide benets for suppliers in terms of longer-termcontracts, increased customer satisfaction and retention aswell as advantages with regard to offsetting peak demand.
25. There is cause for optimism regarding the future ofMicro-CHP, but the technologies must be appropriatelytargeted and some key issues remain to be addressed
Overall there is cause for optimism regarding the potentialfuture of Micro-CHP, but this needs to be tempered by arealistic view regarding the magnitude of carbon savingsthat are likely to be available and the need for a number ofoutstanding product, technical, operational and policy-relatedissues to be addressed. It is also vital that Micro-CHP systemsin both small commercial and domestic environments aretargeted at appropriate end-use applications, in order tomaximise the chances of providing carbon and cost savingsand to build consumer condence in Micro-CHP devices.
In order to capture the potential carbon savings fromMicro-CHP, there is a range of possible actions which canbe taken by manufacturers, suppliers/installers and policymakers to address barriers to adoption and to optimise theperformance of Micro-CHP units in future. If manufacturerscontinue to enhance devices and improve reliability, supplierstarget the right markets and provide appropriate technicalsupport and policy makers create the necessary supportframework to stimulate initial uptake, then Micro-CHP has the
potential to provide a signicant contribution to future UKcarbon savings.
8/6/2019 CHP Accellerator
http://slidepdf.com/reader/full/chp-accellerator 13/104
11Micro-CHP Accelerator
1 Introduction
1.1 The low-carbon challengeIn response to the threat of climate change the UKGovernment has committed to a 60% reduction in carbondioxide emissions by 2050 relative to 1990 levels. Reductionsin the range of 26-32% by 2020 are also expected under theClimate Change Bill. To achieve these aims it is clear thatreductions in emissions are urgently required from allparts of the economy, from the large-scale plant used forcentralised energy generation to the millions of end usersof energy in small commercial and domestic environments.
Combustion of oil and gas for the heating of UK domesticand commercial buildings results in emissions of around114 million tonnes of CO 2 per year 14 , representing over20% of overall UK carbon emissions 15 . Various actions arein place to reduce this, including the current (2006) BuildingRegulations which aim to cut emissions from new housingby around 20% over 2001 regulations. Beyond this, thereare plans for a move to zero carbon homes by 2016 througha further phased tightening of the regulations 16 . Thereare also various programmes in place to improve existingbuildings, including EEC 17 and the Low Carbon BuildingsProgramme 18 . Low-carbon measures and technologies willbe central to meeting the aims of all these programmes.The attractiveness of different technologies will dependon the extent to which they can cost-effectively reduce theneed for electricity, space heating and hot water from highcarbon sources, while performing reliably and meeting theneeds of the end user.
A wide range of proven energy efciency measures alreadyexists, including various forms of insulation, glazing andlow-energy lighting as well as more efcient heating systemsand electrical appliances. Such measures generally offerthe most practical and low-cost carbon savings and shouldgenerally be considered before other measures. However,
once all practical energy efciency measures have beenimplemented for a given building, it is likely that furthertechnologies will be required in order to reduce theemissions sufciently to meet future targets for emissionsreduction. In particular, micro-generation technologiessuch as Micro-CHP, which produce heat and power locally,offer the potential to further reduce the requirement forfossil fuel-based heating systems or grid supplied electricity.
Micro-generation technologies are receiving considerableattention from manufacturers and policy makers in lightof their potential for widespread adoption in the domesticmarket and the associated potential for reducing carbonemissions. In March 2006 the DTI (now BERR) published itsMicrogeneration Strategy 19 which highlighted Micro-CHPas a technology with potential to meet a signicant portionof UK electricity demand by 2050, but acknowledged thatthere have been relatively few installations in the UK to date.
1.2 About Micro-CHP
Combined Heat and Power (CHP) technology has beenused in a range of large-scale industrial and commercialapplications for many years. By generating electricity aswell as providing heat, and thus reducing the need forcentrally-generated grid electricity, CHP offers signicantpotential reductions in carbon emissions and associatedcost savings.
In recent years there has been much interest in producingMicro-CHP systems for domestic and small commercialenvironments. If reliable and cost-effective Micro-CHPsystems can be developed for such applications they wouldpotentially unlock signicant carbon and cost savings whenused in place of conventional heating systems, such ascondensing boilers. A few manufacturers already haveMicro-CHP units available commercially, although deploymenthas been fairly limited to date, and a number of additionalmanufacturers have units which are under development,intended for market launch in the next few years.
There is a range of different technical solutions for Micro-CHPsystems, ranging from fairly mature technology, such asinternal combustion engines adapted from automotiveapplications, to early stage technologies such as fuel cells.These different solutions each have particular benets
and it is expected that the market may ultimately supporta range of different Micro-CHP products. This will bedetermined by specic customer needs in terms of the levelsof heat and power generation required and the acceptablecost, size and reliability of systems in different applications.
14 Emissions from heating are 10.7 MtC (39.2 MtCO 2 ) per year for non-domestic buildings (Source: Market Transformation Programme) and 20.5 MtC (75.2 MtCO 2) per yearfor domestic buildings (Source: BRE).
15 Overall UK carbon emissions are 152 MtC (557 MtCO 2 ) per year (Source: Defra).16 ‘Building a Greener Future’, Communities and Local G overnment, July 2007.17 The Energy Efciency Commitment (EEC) is a requirement on electricity and gas suppliers to promote improvements in domestic energy efciency, shortly to be renamed
the Carbon Emissions Reduction Target (CERT).
18 The Low Carbon Buildings Programme provides Government grants for micro-generation technologies to householders, community organisations, schools, the publicand not for prot sector and private businesses .
19 ‘Our energy challenge: Power from the people’ – DTI Microgeneration Stra tegy, March 2006.
8/6/2019 CHP Accellerator
http://slidepdf.com/reader/full/chp-accellerator 14/104
12 Micro-CHP Accelerator
Although Micro-CHP systems are conceptually similar to theconventional heating systems they are intended to replace,they are in fact much more sophisticated and typicallyhave many more moving parts and more complex controlsystems. As such, any move from boilers to Micro-CHPsystems will represent a major change for customers andis likely to require a signicant increase in the levels ofinstallation and maintenance skills across the industry,and in the associated advice and support provided bymanufacturers and service providers.
To date there has been a lack of independent eld trials
and data to assess the performance of currently availableMicro-CHP units and to demonstrate the applications wherethis technology can offer the most signicant carbon savingsnow and in future. To address this need, the Carbon Trustis running the UK’s rst major eld trial of Micro-CHP systemsfor both domestic and small commercial applications.
1.3 Scope of documentThis report is an interim update on the status of theMicro-CHP Accelerator and follows an earlier Interim Reportpublished in November 2005 20 . It begins by explaining theaims of the project and the key activities involved. In additionto the eld trial of Micro-CHP units, these activities includerecent additions and enhancements to the project, includinga eld trial of condensing boilers and a set of detailedlaboratory testing of both Micro-CHP and boilers. The reportalso provides a detailed explanation of the underlyingassumptions used in the assessment of potential carbon
savings. It then presents the key results from the projectto date and gives an updated view of the performance ofdomestic and commercial Micro-CHP and the factors whichaffect this performance. These ndings are used to discussthe potential implications for the use of Micro-CHP systemsboth now and in future.
The analysis in this report is based on data from a signicantnumber of Micro-CHP units, operating over a much longermonitoring period than was available in November 2005.The results therefore build on and supersede those presentedpreviously. Initial results from the eld trial of condensingboilers are also included. Although this report draws on asignicant volume of independently audited, high qualitydata it should be noted that the analysis presented is stillof an interim nature and provides indicative insights ratherthan nal conclusions. A nal report will be published in2008 once the eld trials are complete.
20 The Carbon Trust’s Small-scale CHP Field Trial Update – November 2005 www.carbontrust.co.uk/publications/ctc513.pdf
8/6/2019 CHP Accellerator
http://slidepdf.com/reader/full/chp-accellerator 15/104
13Micro-CHP Accelerator
2 Micro-CHP technology overview
2.1 IntroductionThe term Micro-CHP refers to a group of different technologycategories where the common factor is the consumption ofa fuel to produce heat and electricity simultaneously.
A key parameter for all Micro-CHP systems is the amountof electricity generated. This varies both within a technologycategory, according to design, and also across technologiesdue to the fundamentals of operation.
There are ve main categories of Micro-CHP system,
as follows:• Internal combustion (IC) engine
• Stirling engine
• Fuel cell
• Organic Rankine cycle (ORC)
• Gas turbine.
The Carbon Trust Micro-CHP Accelerator involves internalcombustion engine, Stirling engine and fuel cell systems.These technologies are therefore described below in more
detail. There are no Organic Rankine Cycle or gas turbinesystems involved in the project.
None of these technologies is a new concept. The ideasbehind the Stirling engine, Rankine cycle, IC engine andfuel cell have all been around for over 150 years. However,there has been only limited experience of using thesetechnologies in Micro-CHP applications.
In all cases (except fuel cells) an engine drives a generatorto produce electricity and the waste heat it produces is thenrecovered and passed to the heating system.
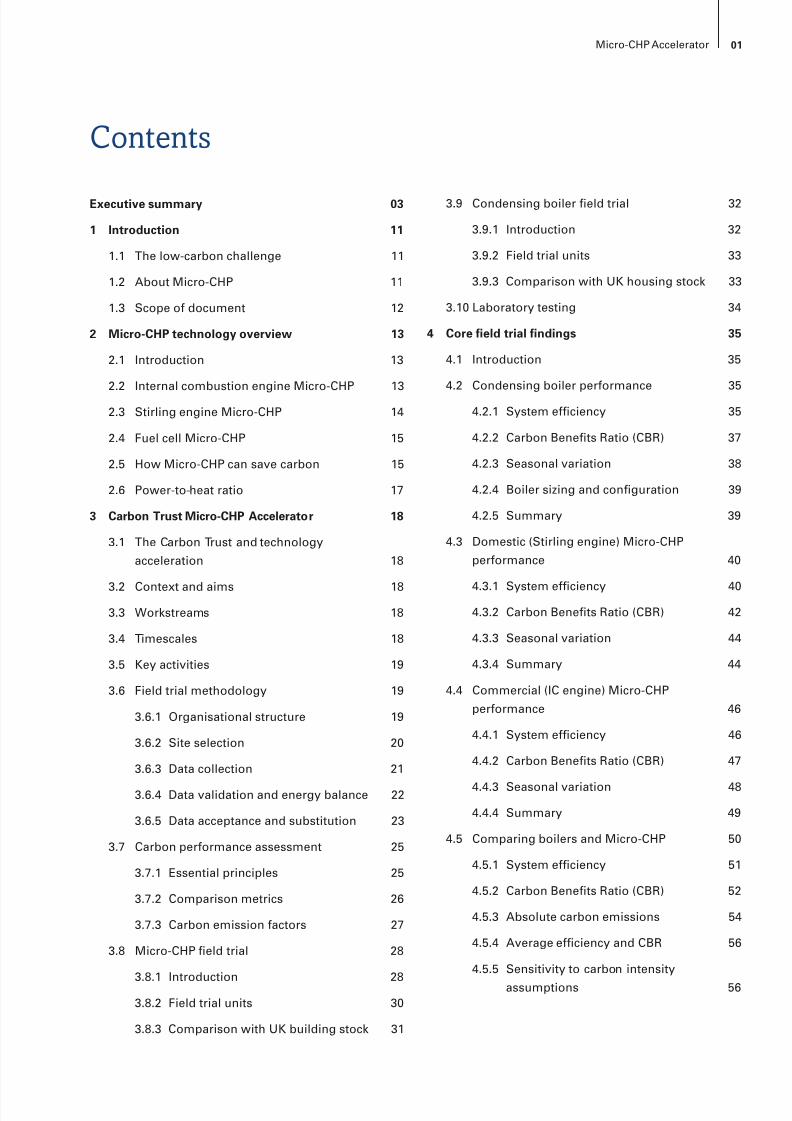
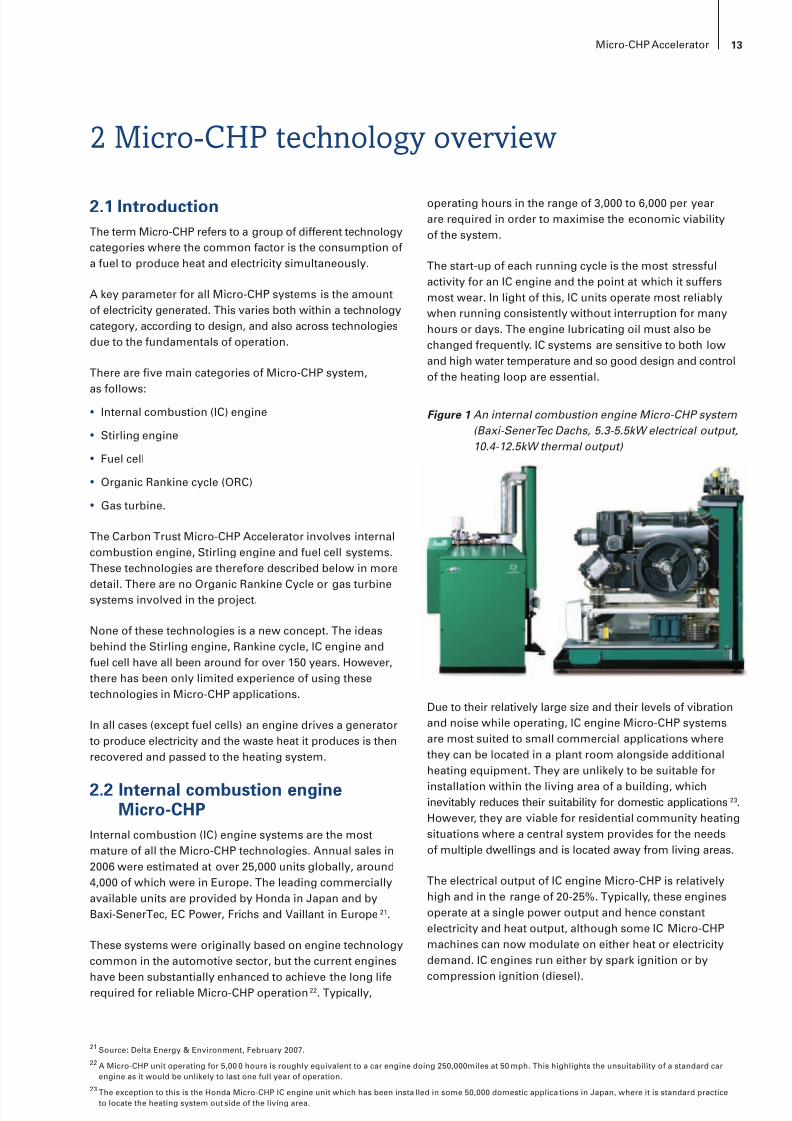
2.2 Internal combustion engineMicro-CHP
Internal combustion (IC) engine systems are the mostmature of all the Micro-CHP technologies. Annual sales in2006 were estimated at over 25,000 units globally, around4,000 of which were in Europe. The leading commerciallyavailable units are provided by Honda in Japan and byBaxi-SenerTec, EC Power, Frichs and Vaillant in Europe 21 .
These systems were originally based on engine technologycommon in the automotive sector, but the current engines
have been substantially enhanced to achieve the long liferequired for reliable Micro-CHP operation 22 . Typically,
operating hours in the range of 3,000 to 6,000 per yearare required in order to maximise the economic viabilityof the system.
The start-up of each running cycle is the most stressfulactivity for an IC engine and the point at which it suffersmost wear. In light of this, IC units operate most reliablywhen running consistently without interruption for manyhours or days. The engine lubricating oil must also bechanged frequently. IC systems are sensitive to both lowand high water temperature and so good design and controlof the heating loop are essential.
Due to their relatively large size and their levels of vibrationand noise while operating, IC engine Micro-CHP systemsare most suited to small commercial applications wherethey can be located in a plant room alongside additionalheating equipment. They are unlikely to be suitable for
installation within the living area of a building, whichinevitably reduces their suitability for domestic applications 23.However, they are viable for residential community heatingsituations where a central system provides for the needsof multiple dwellings and is located away from living areas.
The electrical output of IC engine Micro-CHP is relativelyhigh and in the range of 20-25%. Typically, these enginesoperate at a single power output and hence constantelectricity and heat output, although some IC Micro-CHPmachines can now modulate on either heat or electricitydemand. IC engines run either by spark ignition or bycompression ignition (diesel).
21 Source: Delta Energy & Environment, February 2007.
22 A Micro-CHP unit operating for 5,00 0 hours is roughly equivalent to a car engine doing 250,000miles at 50 mph. This highlights the unsuitability of a standard carengine as it would be unlikely to last one full year of operation.
23 The exception to this is the Honda Micro-CHP IC engine unit which has been insta lled in some 50,000 domestic applica tions in Japan, where it is standard practiceto locate the heating system out side of the living area.
Figure 1 An internal combustion engine Micro-CHP system(Baxi-SenerTec Dachs, 5.3-5.5kW electrical output,10.4-12.5kW thermal output)
8/6/2019 CHP Accellerator
http://slidepdf.com/reader/full/chp-accellerator 16/104
14 Micro-CHP Accelerator
Spark ignition
Spark ignition engines are a variation on the conventionalcar petrol engine but run on natural gas, although IC enginescan in theory be red with any ammable gas. A mixture
of gas and air is introduced into the cylinders and ignitedby a spark.
Diesel ignition
Diesel ignition engines compress air in the cylinder to raiseit to a very high temperature. A fuel is then injected whichburns spontaneously in the hot air. The thermodynamicefciency and part-load performance are higher than aspark ignition engine, and designs tend to be more robust.Diesel ignition engines have a good reputation for reliabilityand longevity in marine, heavy vehicle and stationaryapplications as they are built for long life. However, their
limitations are generally perceived to be higher weightand costs.
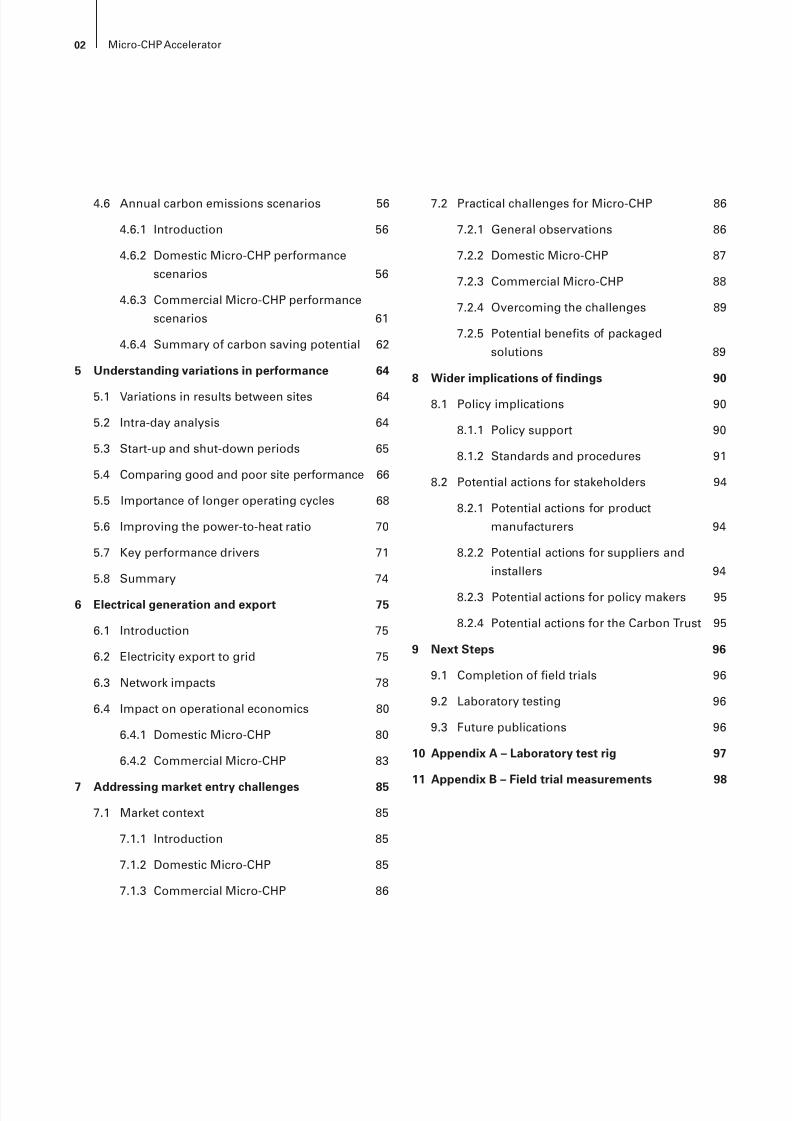
2.3 Stirling engine Micro-CHPStirling engine Micro-CHP is an emerging technology andis less mature than IC engine Micro-CHP. At the time ofwriting, the only commercially available Stirling engineMicro-CHP product is the Whispergen, but a number ofother units are under development 24 . Annual sales of theWhispergen were estimated at around 500 units in 2006.
The Stirling Engine is an external combustion engine
that has a high temperature heat input zone and a lowertemperature heat transfer zone. In Stirling engine Micro-CHPsystems, heat is input by continuous combustion at a ‘hotbulb’ end at ~500°C outside the cylinder while the ‘cold bulb’,also outside the cylinder, is cooled by water from the centralheating system at around 40°C to 70°C. A piston then movesthe heat using a compressed carrier gas from the hot to thecold bulb thereby releasing mechanical energy. The engineand lubrication system are typically fully sealed and, in agood design, engine life should be tens of thousand hourswhile requiring little maintenance.
The simplicity and potential long life of Stirling engines makethem well suited to Micro-CHP applications. In particularthey are more attractive than IC engines for use in domesticenvironments, due to their smaller size and lower levels of
noise and vibration.
The gross electrical efciency of Stirling engines cantheoretically approach that of internal combustion engines(~20%), but in practical, cost-effective designs the netoutput is often signicantly lower, at around 5-10%. Theexternal fuel source can be gas, oil or solid fuel, althoughin practice most Stirling engine Micro-CHP systems underdevelopment use natural gas. The carrier gas inside thecylinder is normally either helium or nitrogen, and forvarious technological reasons, high pressure heliumengines generally operate with higher efciency thannitrogen charged ones. There are many complex designs,ranging from single cylinder free piston to four cylinder‘wobble’ yoke.
In addition to the core Stirling engine, some manufacturersalso include an auxiliary ‘boost’ burner which allows thesystem to provide a higher level of heating for a givenelectrical output. Such auxiliary burners are intended toallow units to be installed in environments with higher heatdemands, without increasing the rated electrical outputwhich might lead to a higher system cost and a higherproportion of electricity being exported. When addinga boost burner there is a potential risk that this operates
excessively and degrades the electrical performance ofthe system. Such problems should be avoided with a goodcontrol strategy, although this can be difcult to implementin practice.
24 Stirling engine units from Disenco and Microgen have also been involved in the Micro-CHP eld trial.
Figure 2 A Stirling engine Micro-CHP system (Whispergen Mk5, 1kW electrical, 7.5-13kW thermal)
1 AC generator
2 Stirling engine
3 Burner
4 Heat exchanger
5 Auxiliary burner
6 Flue fan
1
2
3
4
5
6
8/6/2019 CHP Accellerator
http://slidepdf.com/reader/full/chp-accellerator 17/104
15Micro-CHP Accelerator
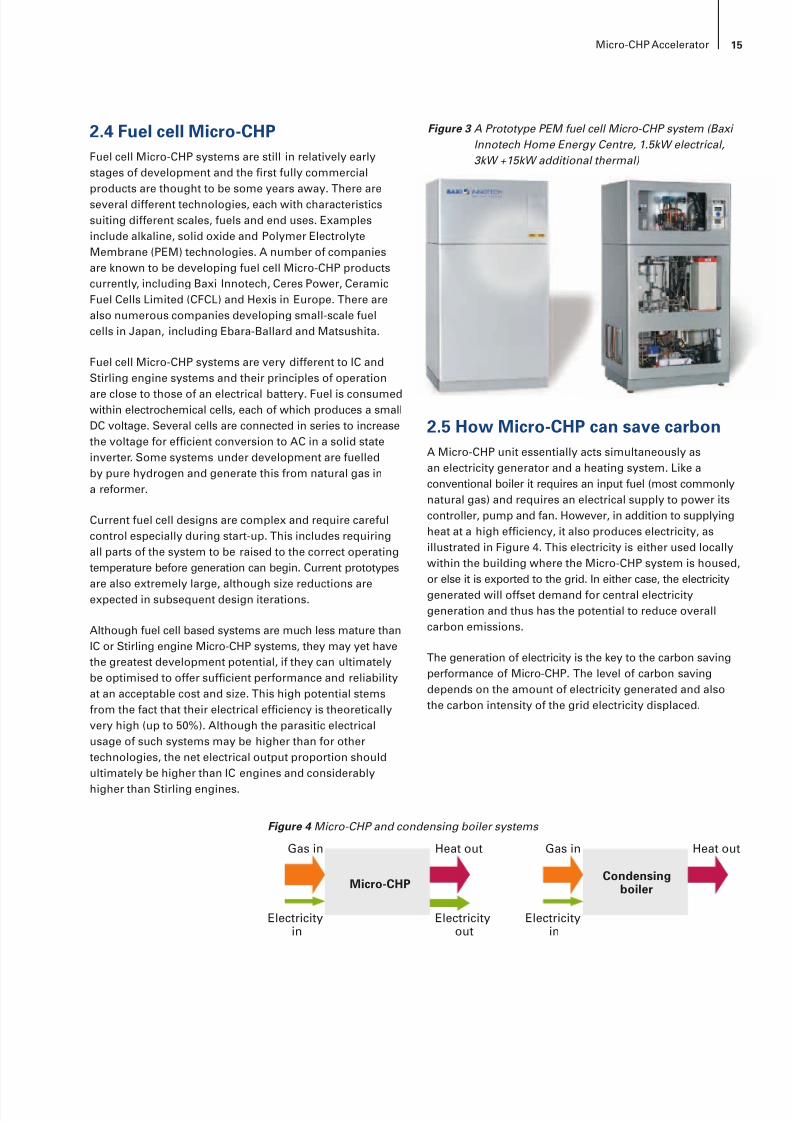
2.4 Fuel cell Micro-CHPFuel cell Micro-CHP systems are still in relatively earlystages of development and the rst fully commercialproducts are thought to be some years away. There areseveral different technologies, each with characteristicssuiting different scales, fuels and end uses. Examplesinclude alkaline, solid oxide and Polymer ElectrolyteMembrane (PEM) technologies. A number of companiesare known to be developing fuel cell Micro-CHP productscurrently, including Baxi Innotech, Ceres Power, CeramicFuel Cells Limited (CFCL) and Hexis in Europe. There arealso numerous companies developing small-scale fuelcells in Japan, including Ebara-Ballard and Matsushita.
Fuel cell Micro-CHP systems are very different to IC andStirling engine systems and their principles of operation
are close to those of an electrical battery. Fuel is consumedwithin electrochemical cells, each of which produces a smallDC voltage. Several cells are connected in series to increasethe voltage for efcient conversion to AC in a solid stateinverter. Some systems under development are fuelledby pure hydrogen and generate this from natural gas ina reformer.
Current fuel cell designs are complex and require carefulcontrol especially during start-up. This includes requiringall parts of the system to be raised to the correct operatingtemperature before generation can begin. Current prototypes
are also extremely large, although size reductions areexpected in subsequent design iterations.
Although fuel cell based systems are much less mature thanIC or Stirling engine Micro-CHP systems, they may yet havethe greatest development potential, if they can ultimatelybe optimised to offer sufcient performance and reliabilityat an acceptable cost and size. This high potential stemsfrom the fact that their electrical efciency is theoreticallyvery high (up to 50%). Although the parasitic electricalusage of such systems may be higher than for othertechnologies, the net electrical output proportion shouldultimately be higher than IC engines and considerably
higher than Stirling engines.
2.5 How Micro-CHP can save carbonA Micro-CHP unit essentially acts simultaneously asan electricity generator and a heating system. Like aconventional boiler it requires an input fuel (most commonlynatural gas) and requires an electrical supply to power itscontroller, pump and fan. However, in addition to supplyingheat at a high efciency, it also produces electricity, asillustrated in Figure 4. This electricity is either used locallywithin the building where the Micro-CHP system is housed,or else it is exported to the grid. In either case, the electricitygenerated will offset demand for central electricitygeneration and thus has the potential to reduce overallcarbon emissions.
The generation of electricity is the key to the carbon savingperformance of Micro-CHP. The level of carbon savingdepends on the amount of electricity generated and alsothe carbon intensity of the grid electricity displaced.
Figure 3 A Prototype PEM fuel cell Micro-CHP system (Baxi Innotech Home Energy Centre, 1.5kW electrical,3kW +15kW additional thermal)
Figure 4 Micro-CHP and condensing boiler systems
Gas in
Electricityin
Heat out
Electricityout
Micro-CHP
Gas in
Electricityin
Heat out
Condensingboiler
8/6/2019 CHP Accellerator
http://slidepdf.com/reader/full/chp-accellerator 18/104
16 Micro-CHP Accelerator
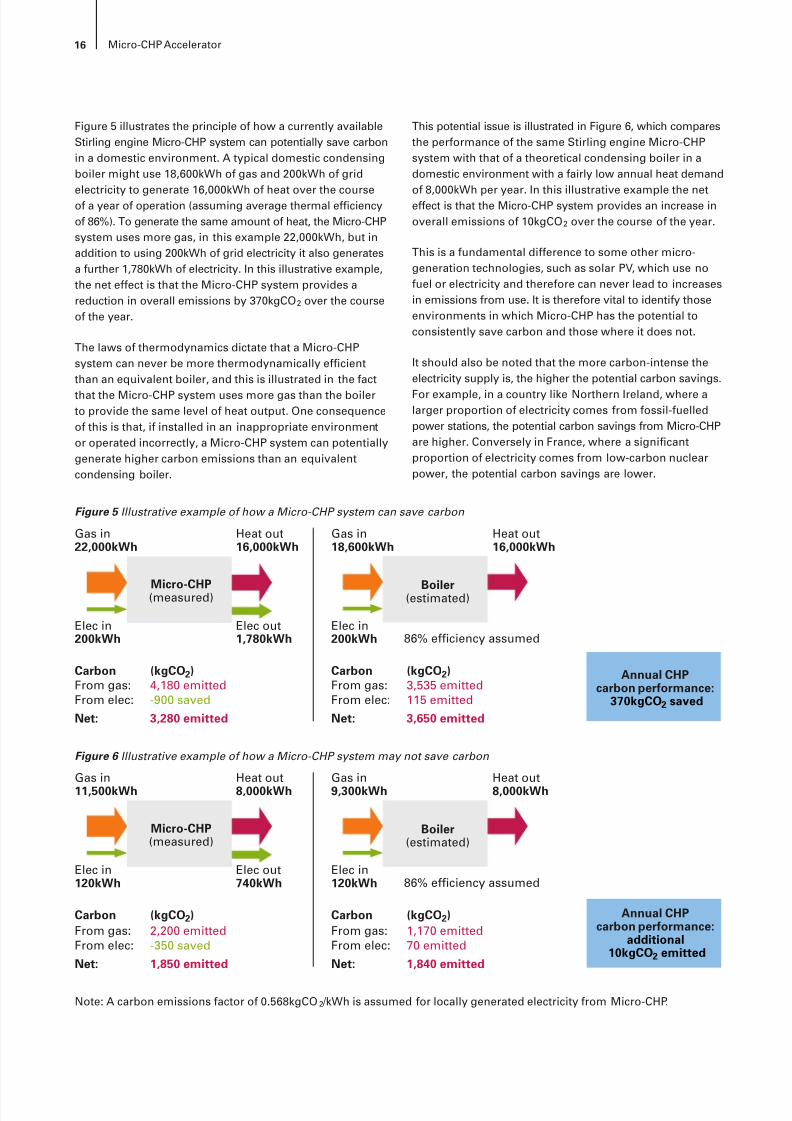
Figure 5 illustrates the principle of how a currently availableStirling engine Micro-CHP system can potentially save carbonin a domestic environment. A typical domestic condensingboiler might use 18,600kWh of gas and 200kWh of gridelectricity to generate 16,000kWh of heat over the courseof a year of operation (assuming average thermal efciencyof 86%). To generate the same amount of heat, the Micro-CHPsystem uses more gas, in this example 22,000kWh, but inaddition to using 200kWh of grid electricity it also generatesa further 1,780kWh of electricity. In this illustrative example,the net effect is that the Micro-CHP system provides areduction in overall emissions by 370kgCO 2 over the courseof the year.
The laws of thermodynamics dictate that a Micro-CHPsystem can never be more thermodynamically efcientthan an equivalent boiler, and this is illustrated in the fact
that the Micro-CHP system uses more gas than the boilerto provide the same level of heat output. One consequenceof this is that, if installed in an inappropriate environmentor operated incorrectly, a Micro-CHP system can potentiallygenerate higher carbon emissions than an equivalentcondensing boiler.
This potential issue is illustrated in Figure 6, which comparesthe performance of the same Stirling engine Micro-CHPsystem with that of a theoretical condensing boiler in adomestic environment with a fairly low annual heat demandof 8,000kWh per year. In this illustrative example the neteffect is that the Micro-CHP system provides an increase inoverall emissions of 10kgCO 2 over the course of the year.
This is a fundamental difference to some other micro-generation technologies, such as solar PV, which use nofuel or electricity and therefore can never lead to increasesin emissions from use. It is therefore vital to identify thoseenvironments in which Micro-CHP has the potential toconsistently save carbon and those where it does not.
It should also be noted that the more carbon-intense theelectricity supply is, the higher the potential carbon savings.
For example, in a country like Northern Ireland, where alarger proportion of electricity comes from fossil-fuelledpower stations, the potential carbon savings from Micro-CHPare higher. Conversely in France, where a signicantproportion of electricity comes from low-carbon nuclearpower, the potential carbon savings are lower.
Figure 5 Illustrative example of how a Micro-CHP system can save carbon
Figure 6 Illustrative example of how a Micro-CHP system may not save carbon
Gas in22,000kWh
Heat out16,000kWh
Elec in200kWh
Carbon (kgCO 2)From gas: 4,180 emittedFrom elec: -900 saved
Net: 3,280 emitted
Carbon (kgCO 2)From gas: 3,535 emittedFrom elec: 115 emitted
Net: 3,650 emitted
Elec out1,780kWh
Micro-CHP(measured)
Annual CHPcarbon performance:
370kgCO 2 saved
Gas in18,600kWh
Heat out16,000kWh
Elec in200kWh 86% efficiency assumed
Boiler(estimated)
Gas in11,500kWh
Heat out8,000kWh
Elec in120kWh
Carbon (kgCO 2)From gas: 2,200 emittedFrom elec: -350 saved
Net: 1,850 emitted
Carbon (kgCO 2)From gas: 1,170 emittedFrom elec: 70 emitted
Net: 1,840 emitted
Elec out740kWh
Annual CHPcarbon performance:
additional10kgCO 2 emitted
Micro-CHP(measured)
Gas in9,300kWh
Heat out8,000kWh
Elec in120kWh 86% efficiency assumed
Boiler(estimated)
Note: A carbon emissions factor of 0.568kgCO 2 /kWh is assumed for locally generated electricity from Micro-CHP.
8/6/2019 CHP Accellerator
http://slidepdf.com/reader/full/chp-accellerator 19/104
17Micro-CHP Accelerator
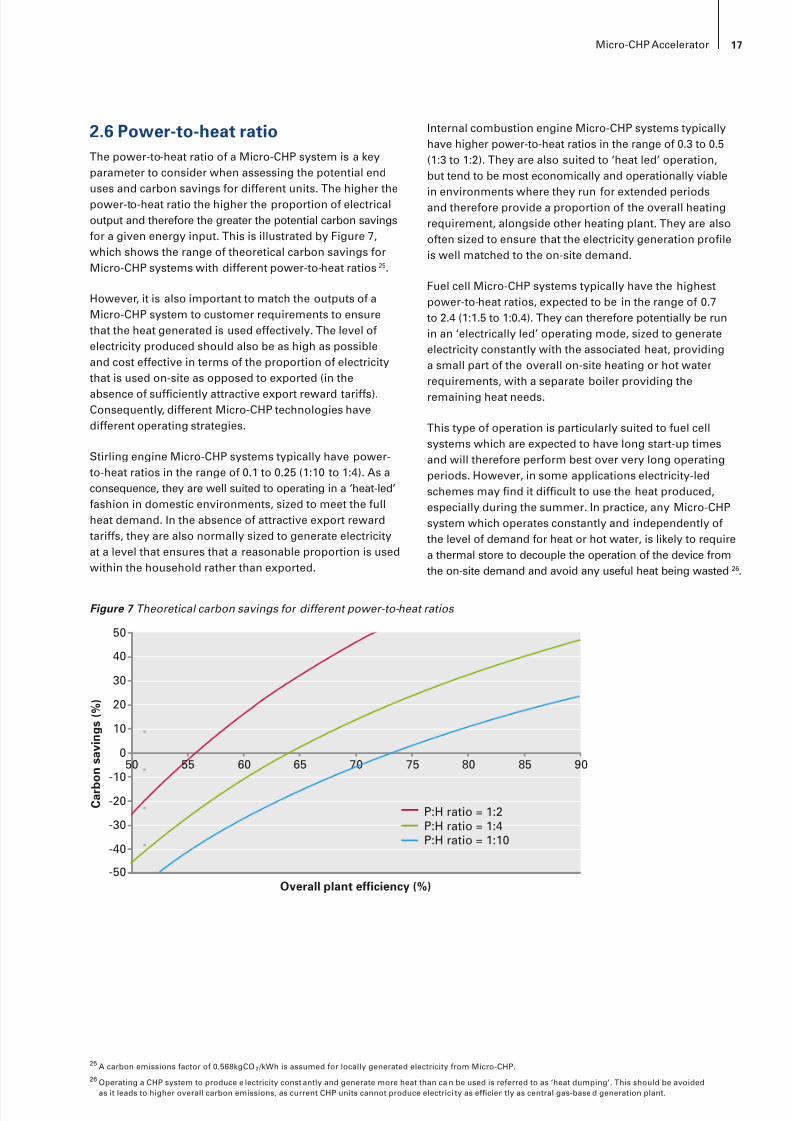
2.6 Power-to-heat ratioThe power-to-heat ratio of a Micro-CHP system is a keyparameter to consider when assessing the potential enduses and carbon savings for different units. The higher thepower-to-heat ratio the higher the proportion of electricaloutput and therefore the greater the potential carbon savingsfor a given energy input. This is illustrated by Figure 7,which shows the range of theoretical carbon savings forMicro-CHP systems with different power-to-heat ratios 25 .
However, it is also important to match the outputs of aMicro-CHP system to customer requirements to ensurethat the heat generated is used effectively. The level ofelectricity produced should also be as high as possibleand cost effective in terms of the proportion of electricitythat is used on-site as opposed to exported (in the
absence of sufciently attractive export reward tariffs).Consequently, different Micro-CHP technologies havedifferent operating strategies.
Stirling engine Micro-CHP systems typically have power-to-heat ratios in the range of 0.1 to 0.25 (1:10 to 1:4). As aconsequence, they are well suited to operating in a ‘heat-led’fashion in domestic environments, sized to meet the fullheat demand. In the absence of attractive export rewardtariffs, they are also normally sized to generate electricityat a level that ensures that a reasonable proportion is usedwithin the household rather than exported.
Internal combustion engine Micro-CHP systems typicallyhave higher power-to-heat ratios in the range of 0.3 to 0.5(1:3 to 1:2). They are also suited to ‘heat led’ operation,but tend to be most economically and operationally viable
in environments where they run for extended periodsand therefore provide a proportion of the overall heatingrequirement, alongside other heating plant. They are alsooften sized to ensure that the electricity generation proleis well matched to the on-site demand.
Fuel cell Micro-CHP systems typically have the highestpower-to-heat ratios, expected to be in the range of 0.7to 2.4 (1:1.5 to 1:0.4). They can therefore potentially be runin an ‘electrically led’ operating mode, sized to generateelectricity constantly with the associated heat, providinga small part of the overall on-site heating or hot waterrequirements, with a separate boiler providing theremaining heat needs.
This type of operation is particularly suited to fuel cellsystems which are expected to have long start-up timesand will therefore perform best over very long operatingperiods. However, in some applications electricity-ledschemes may nd it difcult to use the heat produced,especially during the summer. In practice, any Micro-CHPsystem which operates constantly and independently ofthe level of demand for heat or hot water, is likely to requirea thermal store to decouple the operation of the device fromthe on-site demand and avoid any useful heat being wasted 26.
50
40
20
0
-50
30
10
-10
-20
-30
-40
C a r b o n s a v i n g s
( % )
50 6560 70 75 80 85 90
Overall plant efficiency (%)
P:H ratio = 1:2P:H ratio = 1:4P:H ratio = 1:10
55
Figure 7 Theoretical carbon savings for different power-to-heat ratios
25 A carbon emissions factor of 0.568kgCO 2 /kWh is assumed for locally generated electricity from Micro-CHP.26 Operating a CHP system to produce e lectricity const antly and generate more heat than ca n be used is referred to as ‘heat dumping’. This should be avoided
as it leads to higher overall carbon emissions, as current CHP units cannot produce electrici ty as efcien tly as central gas-base d generation plant.
8/6/2019 CHP Accellerator
http://slidepdf.com/reader/full/chp-accellerator 20/104
18 Micro-CHP Accelerator
3 Carbon Trust Micro-CHP Accelerator
3.1 The Carbon Trust and technologyacceleration
The Carbon Trust is a private company set up by theGovernment in response to the threat of climate change.Its mission is to accelerate the move to a low carboneconomy by developing commercial low carbon technologiesand helping organisations reduce their carbon emissions.The Carbon Trust works with UK business and the publicsector to create practical business-focused solutions throughits external work in ve complementary areas: Insights,Solutions, Innovations, Enterprises and Investments.
Carbon Trust Innovations aims to get promising newlow carbon ideas to market faster. To stabilise and reducecarbon emissions effectively, we need a step change in thedevelopment of low carbon technologies and services. OurResearch and Development (R&D) activities support thedevelopment of new technical concepts; our Incubatorshelp to build viable low carbon businesses around promisingtechnical ideas; and our Technology Acceleration projectsaddress sector-wide barriers through a range of large scaledemonstration activities.
The Micro-CHP Accelerator is part of the Carbon Trust’sportfolio of Technology Acceleration activities 27 .
3.2 Context and aimsThe Carbon Trust is investing around £3.7m over four yearsin the Micro-CHP Accelerator. It includes a major Micro-CHPdemonstration programme and a range of complementaryactivities to build a greater understanding of the potentialbenets and barriers facing the technology.
The core aims of the project are to:
• Install a range of Micro-CHP units in real operatingenvironments representative of the likely UK installationsand obtain robust, independently monitoredperformance data
• Assess the carbon performance of the Micro-CHP unitsrelative to alternative technologies, such as condensingboilers
• Provide general information to inform future policydecisions relating to Micro-CHP.
It is hoped that the ndings from the project will also:
• Assist Micro-CHP device manufacturers in their ongoingproduct development
• Provide input to groups involved in the developmentof relevant industry-wide standards.
3.3 WorkstreamsTo achieve its objectives the Micro-CHP Accelerator is basedaround three distinct and complementary streams of work,as highlighted in Figure 8.
The Micro-CHP Accelerator combines eld demonstrationactivities with wider lab-based and theoretical analysis andexpects to ultimately deliver major insights, including:
• The most appropriate target markets for Micro-CHP
• The UK carbon saving potential of Micro-CHP relative
to condensing boilers• Optimal design characteristics of future Micro-CHP systems
• Potential measures to accelerate the roll-out of Micro-CHP.
3.4 TimescalesThe project was originally started at the end of 2003, butmanufacturers initially experienced delays in identifyingappropriate sites for the trial. The majority of the Micro-CHPunits were therefore installed in 2005 and 2006. As earlyndings emerged, it became apparent that some additionalactivities were needed to robustly assess the carbon saving
potential of Micro-CHP and the key factors affectingperformance.
After consultation with key industry groups and Governmentstakeholders, the eld trial was enhanced with two additionalactivities: a eld trial of condensing boilers and a programmeof investigative laboratory testing, starting in 2006, alongwith an associated budget and timescale extension.
The project will continue monitoring the performance ofMicro-CHP and boiler systems in the eld until the end of2007 with the nal project analysis expected to continueuntil summer 2008.
27 For more details on technology acceleration visit: www.carbontrust.co.uk/technology/technologyaccelerator
8/6/2019 CHP Accellerator
http://slidepdf.com/reader/full/chp-accellerator 21/104
19Micro-CHP Accelerator
3.5 Key activitiesThe Micro-CHP Accelerator consists of three main technicaldemonstration activities:
• Micro-CHP eld trial – this is the core project activity andinvolves monitoring a range of different Micro-CHP unitsin both domestic and small commercial environments.The units are installed in real, occupied properties anda range of key operational parameters are measuredat ve-minute intervals throughout each 24-hour period.The key aims are to understand how Micro-CHP unitsperform in different environments and to identify andunderstand those factors which have the greatest impacton performance. See Section 3.8 for more details aboutthe scope of the Micro-CHP eld trial and Sections 4.3and 4.4 for the main results to date.
• Condensing boiler eld trial – this involves monitoringa range of different condensing boiler units using thesame methodology as for the Micro-CHP eld trial 28 .The aim is to build a relevant baseline against whichto compare Micro-CHP performance. This baseline willtherefore reect the real operational performance ofcondensing boilers, rather than the theoretical performancesuggested by standard laboratory-based assessments,such as SEDBUK 29 . This eld trial focuses on A-ratedcondensing boilers in domestic environments. SeeSection 3.9 for more details about the scope of the boilereld trial and Section 4.2 for the main results to date.
• Laboratory testing – this aims to complement and buildon the results from the two eld trial activities. A state-of-the-art dynamic test rig is being used to recreatedifferent heat demand proles observed in the eld and
compare the performance of Micro-CHP and condensingboiler systems under controlled conditions. This testingwill be used to further validate the results from the eldtrials and also to recreate and investigate any unusualndings. By simulating eld conditions in the laboratoryand extending the range of scenarios being evaluated,the tests will also quantify the ‘envelope of performance’of the different technologies. The controlled laboratorytest environment should allow the key drivers affectingsystem performance to be identied and their relativeimpact ascertained. See Section 3.10 for more detailsabout the planned laboratory testing and Appendix Afor an overview of the dynamic test rig.
3.6 Field trial methodology3.6.1 Organisational structureThe key participants in the Micro-CHP Accelerator areconsortia which provide the Micro-CHP units involved inthe trial. These consortia typically consist of a Micro-CHPdevice manufacturer in partnership with a data monitoringorganisation. In each case the Carbon Trust contracted withthe lead consortium partner following an open Europeanprocurement process. A total of 10 consortia originallyentered into contract with the Carbon Trust, although two
of these were eventually unable to provide Micro-CHP units.
Figure 8 Key streams of work in the Carbon Trust Micro-CHP Accelerator
28 All of the units monitored are system boilers with hot water tanks; there are no combination boilers included. This is to allow consistent comparison with the Micro-CHPinstallations, all of which include hot water tanks.
29 Seasonal Efciency of Domestic Boilers in the UK.
Stream 1Field investigation
• Micro-CHP field trial• Condensing boiler field trial
• View on performance of current Micro-CHP units• Comparative benchmark of boiler performance• Knowledge of user demand profiles• Knowledge of installation/maintenance issues
Stream 2Wider analysisof key drivers
• Laboratory testing ofMicro-CHP and boilers(informed by ‘real world’field trial data)
• Desk-based analysis
• Identification of key factors affecting performance:e.g. heat demand, unit sizing, usage profiles,seasonality, integration with control systems
• Implications for test methodologies to assessperformance of Micro-CHP and boilers
Stream 3Futureapplications
• Extrapolation and analysisfrom Streams 1 and 2
• Review of productdevelopment plans forMicro-CHP technologies
• Insights into design of optimal Micro-CHP unitsboth now and in the longer term:e.g. heat/power ratios, efficiencies, engine types(IC, Stirling, fuel cell, other)
• Identification of optimum target building typesfor Micro-CHP and implications for market sizing
• Implications for developers and policy makersregarding both Micro-CHP units and boilers
Workstream Activities Outcomes
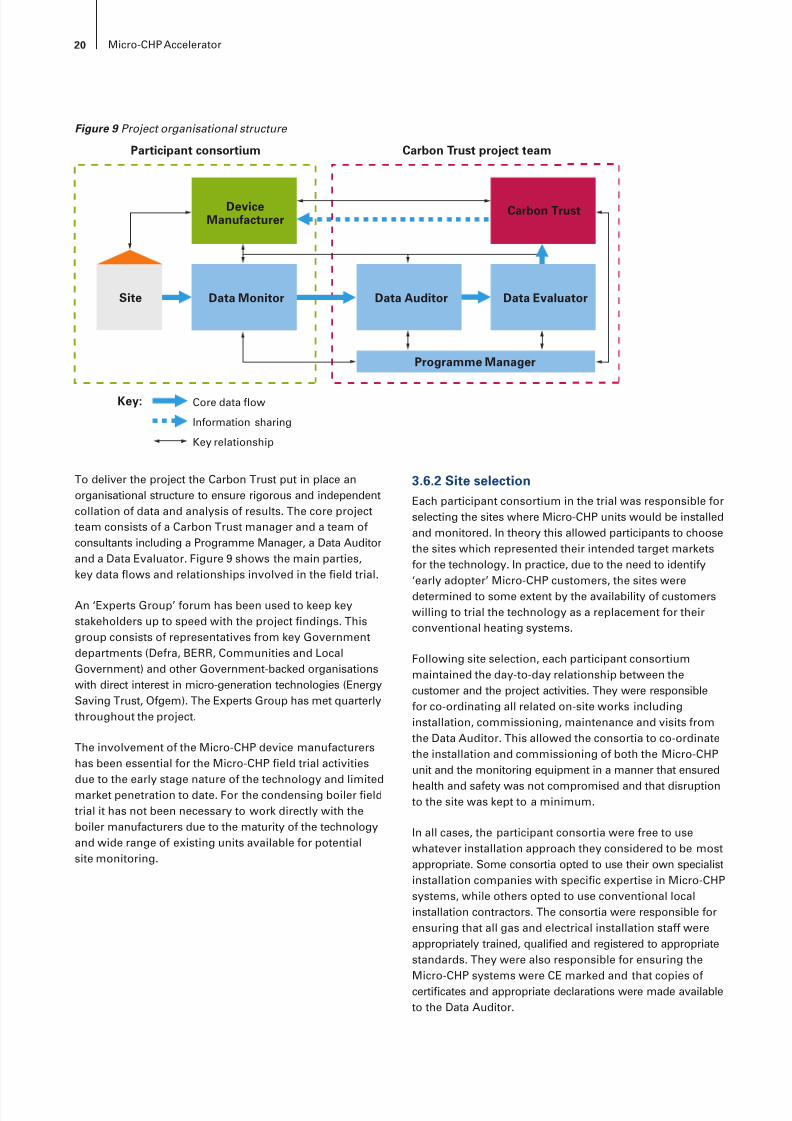
8/6/2019 CHP Accellerator
http://slidepdf.com/reader/full/chp-accellerator 22/104
20 Micro-CHP Accelerator
To deliver the project the Carbon Trust put in place anorganisational structure to ensure rigorous and independentcollation of data and analysis of results. The core projectteam consists of a Carbon Trust manager and a team ofconsultants including a Programme Manager, a Data Auditorand a Data Evaluator. Figure 9 shows the main parties,key data ows and relationships involved in the eld trial.
An ‘Experts Group’ forum has been used to keep keystakeholders up to speed with the project ndings. Thisgroup consists of representatives from key Governmentdepartments (Defra, BERR, Communities and LocalGovernment) and other Government-backed organisationswith direct interest in micro-generation technologies (EnergySaving Trust, Ofgem). The Experts Group has met quarterlythroughout the project.
The involvement of the Micro-CHP device manufacturershas been essential for the Micro-CHP eld trial activitiesdue to the early stage nature of the technology and limitedmarket penetration to date. For the condensing boiler eldtrial it has not been necessary to work directly with theboiler manufacturers due to the maturity of the technologyand wide range of existing units available for potentialsite monitoring.
3.6.2 Site selectionEach participant consortium in the trial was responsible forselecting the sites where Micro-CHP units would be installedand monitored. In theory this allowed participants to choosethe sites which represented their intended target marketsfor the technology. In practice, due to the need to identify‘early adopter’ Micro-CHP customers, the sites weredetermined to some extent by the availability of customerswilling to trial the technology as a replacement for theirconventional heating systems.
Following site selection, each participant consortiummaintained the day-to-day relationship between thecustomer and the project activities. They were responsiblefor co-ordinating all related on-site works includinginstallation, commissioning, maintenance and visits fromthe Data Auditor. This allowed the consortia to co-ordinatethe installation and commissioning of both the Micro-CHPunit and the monitoring equipment in a manner that ensured
health and safety was not compromised and that disruptionto the site was kept to a minimum.
In all cases, the participant consortia were free to usewhatever installation approach they considered to be mostappropriate. Some consortia opted to use their own specialistinstallation companies with specic expertise in Micro-CHPsystems, while others opted to use conventional localinstallation contractors. The consortia were responsible forensuring that all gas and electrical installation staff wereappropriately trained, qualied and registered to appropriatestandards. They were also responsible for ensuring theMicro-CHP systems were CE marked and that copies ofcerticates and appropriate declarations were made availableto the Data Auditor.
Figure 9 Project organisational structure
Micro-CHP(Measured)Data MonitorSite
DeviceManufacturer
Participant consortium Carbon Trust project team
Data Evaluator
Carbon Trust
Data Auditor
Key: Core data flow
Information sharing
Key relationship
Programme Manager
8/6/2019 CHP Accellerator
http://slidepdf.com/reader/full/chp-accellerator 23/104
21Micro-CHP Accelerator
Domestic Micro-CHP sites
The only constraint imposed on domestic Micro-CHP siteselection was that the Micro-CHP units needed to be capableof meeting the heating requirements of the properties
in which they were installed. This was to ensure that allcustomers experienced adequate levels of comfort withoutthe need to use secondary heating systems in addition toMicro-CHP. System sizing was typically assessed by the BREboiler sizing model using the principles behind the StandardAssessment Procedure (SAP). However, for some units withdifferent control strategies to those assumed by the BREsizing model, the participant consortia opted to use theirown assessment methods for sizing units to properties.
The Carbon Trust was also keen to ensure, whereverpossible, that the sites chosen were broadly reective ofthe wider UK housing stock. The resulting sites thereforeinclude a wide range of house types with different ages,sizes and thermal characteristics.
Domestic boiler sites
The choice of domestic condensing boiler sites was basedon locating properties which either recently had, orwere about to have, a standard system-based condensing(non-combination) boiler system installed. Sites wereselected to include boilers from a range of differentmarket-leading manufacturers and installation was carriedout by conventional installation contractors as per typicalboiler purchase and installation procedures. All but oneof the installations in the domestic boiler trial have A-ratedboilers. The original intention was to include a selectionof both A-rated and B-rated units, as B-rated appliances arethe minimum standard specied by Part L of the BuildingRegulations. However, all but one of the potential sitesapproached had opted for A-rated appliances, so only oneB-rated device was included. This is consistent with the factthat over 70% of new UK domestic boiler installations arenow A-rated 30 .
Although the site selection and installation approach for theboilers was slightly different to that used for the Micro-CHP
sites, the Data Auditor has conrmed that the standard ofinstallation achieved was broadly equivalent for both theMicro-CHP and boiler sites.
Commercial Micro-CHP sites
Unlike the domestic sites, where the trial aimed to investigatethe performance of Micro-CHP units in a wide range ofdifferent types of house, the trial of larger Micro-CHP unitsin small commercial environments was limited to a rangeof sites considered most suitable for such units. This wasdue mainly to the existing business models used by theleading commercial-scale Micro-CHP suppliers in the
UK. These suppliers specically target small commercialcustomers in certain sectors where the system economicsare considered to be most attractive.
In all cases the Micro-CHP systems were designed to act asthe lead boiler in a plant room. These systems were typicallysized to full the site’s hot water requirements, withadditional hot water and heating provided by conventional
boilers. There are generally two key aims to the design ofcommercial Micro-CHP systems. The rst is to ensure thatthe Micro-CHP system will run for the maximum possibleoperational period throughout the year (ideally more than6,000 hours per year). The second is to try to match theelectrical output of the Micro-CHP system to the electricalbase load of the site, in an attempt to minimise the amountof electricity being exported from the site and thereforemaximise the commercial benets (in the absence ofguaranteed export tariffs). All of the commercial sitesin the trial were designed to meet these aims.
3.6.3 Data collectionIn order to build a robust understanding of the performanceof Micro-CHP systems, a wide range of data parameters iscollected at ve-minute intervals throughout each 24-hourperiod. Wherever possible, the overall aim is to collecta full year’s worth of valid data for each unit in the trial.
The measurement parameters can be broadly categorisedas follows:
• Core electrical and thermal parameters – the parametersconsidered essential to assess the performance of theMicro-CHP or boiler system, including the amount ofenergy used or generated by the system and used withinthe building
• Calibration measurements – external measurementsused to calculate the energy contained within the gasconsumed by the site
• Temperature measurements – measurement oftemperature levels outside the dwelling and in one or moreinternal rooms (e.g. upstairs and downstairs for houses).This data is used to understand the comfort levels providedby the system and the external environment driving theneed for heat
• Other optional measurements – in some cases
additional measurements are taken to gain an enhancedunderstanding of how the overall heating system performs.
Capturing data at a ve-minute resolution allows detailedintra-day analysis to be carried out in addition to moreconventional analysis at a daily, monthly or annual level.Intra-day analysis can be used to gain an understandingof how the trial units interact with the customer and site,and to identify factors responsible for affecting carbonperformance. Such detailed insights from the trial willbe invaluable to inform technological development,approaches to installation and future government policy
support, where relevant.
30 Source: Energy Saving Trust.
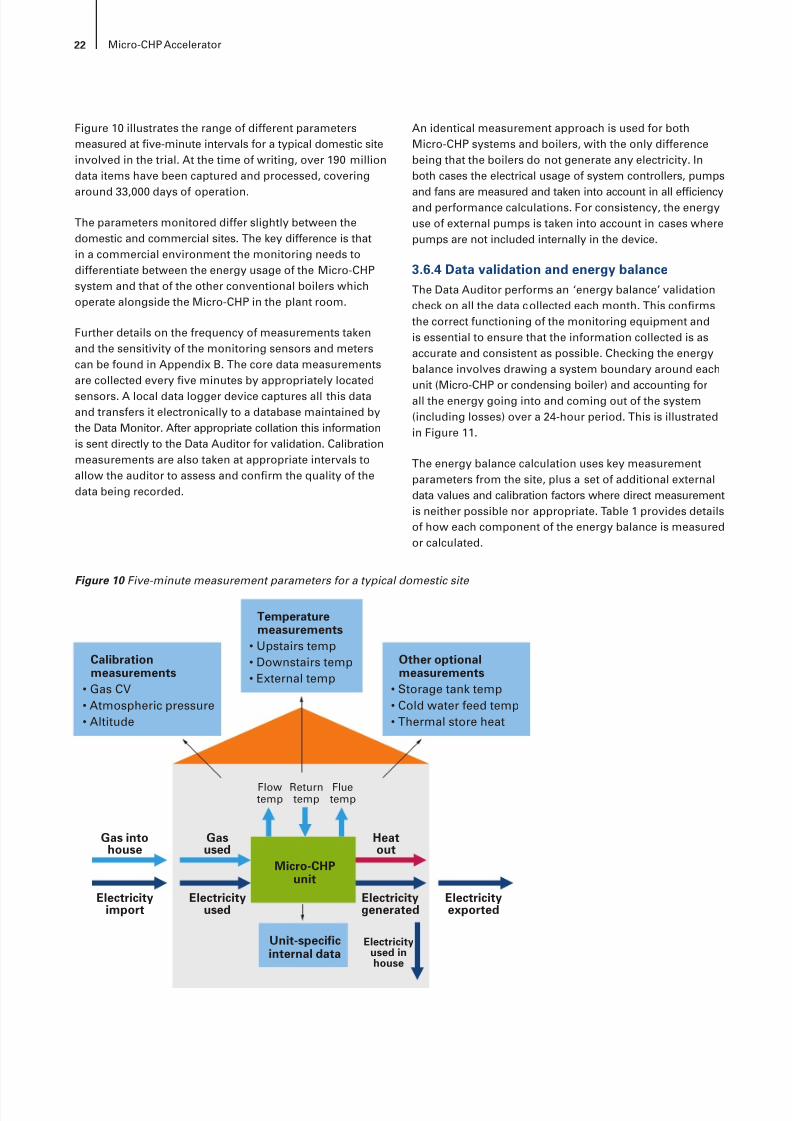
8/6/2019 CHP Accellerator
http://slidepdf.com/reader/full/chp-accellerator 24/104
22 Micro-CHP Accelerator
Figure 10 illustrates the range of different parametersmeasured at ve-minute intervals for a typical domestic siteinvolved in the trial. At the time of writing, over 190 milliondata items have been captured and processed, covering
around 33,000 days of operation.
The parameters monitored differ slightly between thedomestic and commercial sites. The key difference is thatin a commercial environment the monitoring needs todifferentiate between the energy usage of the Micro-CHPsystem and that of the other conventional boilers whichoperate alongside the Micro-CHP in the plant room.
Further details on the frequency of measurements takenand the sensitivity of the monitoring sensors and meterscan be found in Appendix B. The core data measurementsare collected every ve minutes by appropriately located
sensors. A local data logger device captures all this dataand transfers it electronically to a database maintained bythe Data Monitor. After appropriate collation this informationis sent directly to the Data Auditor for validation. Calibrationmeasurements are also taken at appropriate intervals toallow the auditor to assess and conrm the quality of thedata being recorded.
An identical measurement approach is used for bothMicro-CHP systems and boilers, with the only differencebeing that the boilers do not generate any electricity. Inboth cases the electrical usage of system controllers, pumps
and fans are measured and taken into account in all efciencyand performance calculations. For consistency, the energyuse of external pumps is taken into account in cases wherepumps are not included internally in the device.
3.6.4 Data validation and energy balanceThe Data Auditor performs an ‘energy balance’ validationcheck on all the data collected each month. This conrmsthe correct functioning of the monitoring equipment andis essential to ensure that the information collected is asaccurate and consistent as possible. Checking the energybalance involves drawing a system boundary around eachunit (Micro-CHP or condensing boiler) and accounting forall the energy going into and coming out of the system(including losses) over a 24-hour period. This is illustratedin Figure 11.
The energy balance calculation uses key measurementparameters from the site, plus a set of additional externaldata values and calibration factors where direct measurementis neither possible nor appropriate. Table 1 provides detailsof how each component of the energy balance is measuredor calculated.
Figure 10 Five-minute measurement parameters for a typical domestic site
Unit-specificinternal data
Gas intohouse
Electricityimport
Gasused
Electricityused
Heatout
Electricitygenerated
Electricityexported
Electricityused inhouse
Flowtemp
Returntemp
Fluetemp
Micro-CHPunit
Calibrationmeasurements
• Gas CV• Atmospheric pressure• Altitude
Temperaturemeasurements
• Upstairs temp• Downstairs temp• External temp
Other optionalmeasurements
• Storage tank temp• Cold water feed temp• Thermal store heat

8/6/2019 CHP Accellerator
http://slidepdf.com/reader/full/chp-accellerator 25/104
23Micro-CHP Accelerator
For the monitoring equipment to be conrmed asoperating acceptably, the calculated energy leaving thesystem must be within 93-103% of the calculated energy
entering the system on a daily basis. This band of uncertaintyis considered appropriate given the inherent tolerances inaccuracy of measurement equipment and the complexityof comparing measured data values from different sources.If the energy balance is outside these limits, the Data Auditorinvestigates the possible causes with the relevant participantconsortium. Once the causes are understood and anyappropriate changes are made to calibration factors, thedata set is passed to the Data Evaluator for acceptance,substitution or rejection.
3.6.5 Data acceptance and substitution
The data acceptance process aims to ensure that poor qualityor inaccurate data points are excluded but it is also designedto maximise the quantities of data available for analysis.To properly understand the behaviour of Micro-CHP or boilersystems, it is vital to investigate performance over a fullyear of operation. It is therefore important to retain and
use as much of the original collected data as possible,as long as it is all valid.
To achieve this the Data Evaluator applies a series of rulesto decide which days of data are accepted for further analysis,which periods of data can be substituted and which periodsare not suitable for inclusion in the analysis. In general,data substitution only takes place when there is a machinebreakdown, or failure of the monitoring equipment. Atthe time of writing, only 2.7% of days have required datasubstitution, indicating that the data is generally of goodquality and that the vast majority of data captured is ableto be used in the analysis.
Once appropriate substitution has been carried out, eachday of valid data is loaded into a common database. Thisdata is then grouped into valid months and valid years ofdata for each site as appropriate.
Figure 11 Energy balance components
Ref Parameter Type Determined Notes
A Electricity used Input Directly measured Measured in Wh
B Gas used Input Calculated from
measurements
Measured in m 3
Converted to Wh using:– Atmospheric pressure (Met Ofce)– Altitude (from OS map)– Caloric value (from supplier)– Temperature (measured)
C Electricity generated Output Directly measured Measured in Wh
D Heat supplied Output Directly measured Measured in Wh
E Case loss Output Calculated frommeasurements
Calculated in Wh based on:– Surface area of system– Temperature (measured at multiple
locations across the case)
F Flue loss Output Calculated frommeasurements
Calculated in Wh based on:– CO 2 spot measurements– Reference data– Temperature (measured at a set distance
from the end of the ue)
Table 1 Parameters for the energy balance calculation
Micro-CHP
orboiler system
Electricity used
Gas used
Electricity generated
Heat supplied
Case loss
Flue loss
ENERGY IN = ENERGY OUT
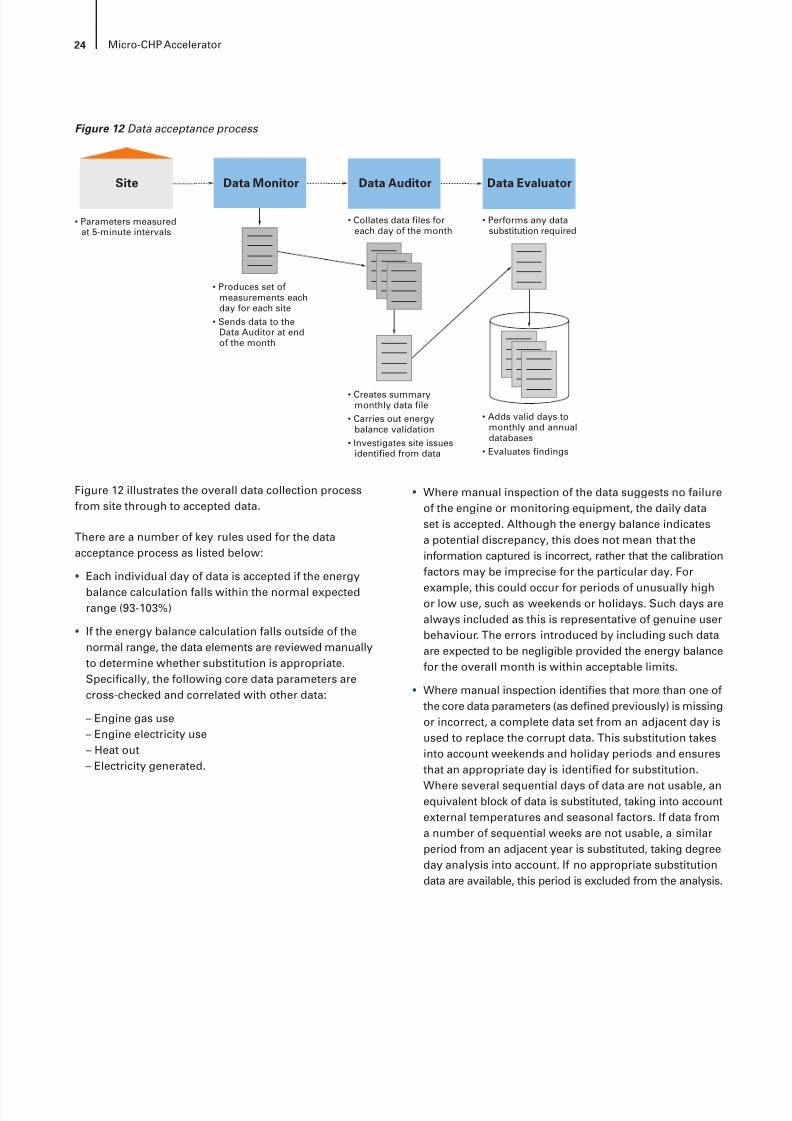
8/6/2019 CHP Accellerator
http://slidepdf.com/reader/full/chp-accellerator 26/104
24 Micro-CHP Accelerator
Figure 12 illustrates the overall data collection processfrom site through to accepted data.
There are a number of key rules used for the dataacceptance process as listed below:
• Each individual day of data is accepted if the energy
balance calculation falls within the normal expectedrange (93-103%)
• If the energy balance calculation falls outside of thenormal range, the data elements are reviewed manuallyto determine whether substitution is appropriate.Specically, the following core data parameters arecross-checked and correlated with other data:
– Engine gas use– Engine electricity use– Heat out– Electricity generated.
• Where manual inspection of the data suggests no failureof the engine or monitoring equipment, the daily dataset is accepted. Although the energy balance indicatesa potential discrepancy, this does not mean that theinformation captured is incorrect, rather that the calibrationfactors may be imprecise for the particular day. For
example, this could occur for periods of unusually highor low use, such as weekends or holidays. Such days arealways included as this is representative of genuine userbehaviour. The errors introduced by including such dataare expected to be negligible provided the energy balancefor the overall month is within acceptable limits.
• Where manual inspection identies that more than one ofthe core data parameters (as dened previously) is missingor incorrect, a complete data set from an adjacent day isused to replace the corrupt data. This substitution takesinto account weekends and holiday periods and ensuresthat an appropriate day is identied for substitution.
Where several sequential days of data are not usable, anequivalent block of data is substituted, taking into accountexternal temperatures and seasonal factors. If data froma number of sequential weeks are not usable, a similarperiod from an adjacent year is substituted, taking degreeday analysis into account. If no appropriate substitutiondata are available, this period is excluded from the analysis.
Figure 12 Data acceptance process
Data EvaluatorData AuditorSite
• Parameters measuredat 5-minute intervals
• Produces set ofmeasurements eachday for each site
• Sends data to theData Auditor at endof the month
• Collates data files foreach day of the month
• Creates summarymonthly data file
• Carries out energybalance validation
• Investigates site issuesidentified from data
• Performs any datasubstitution required
• Adds valid days tomonthly and annualdatabases
• Evaluates findings
Data Monitor
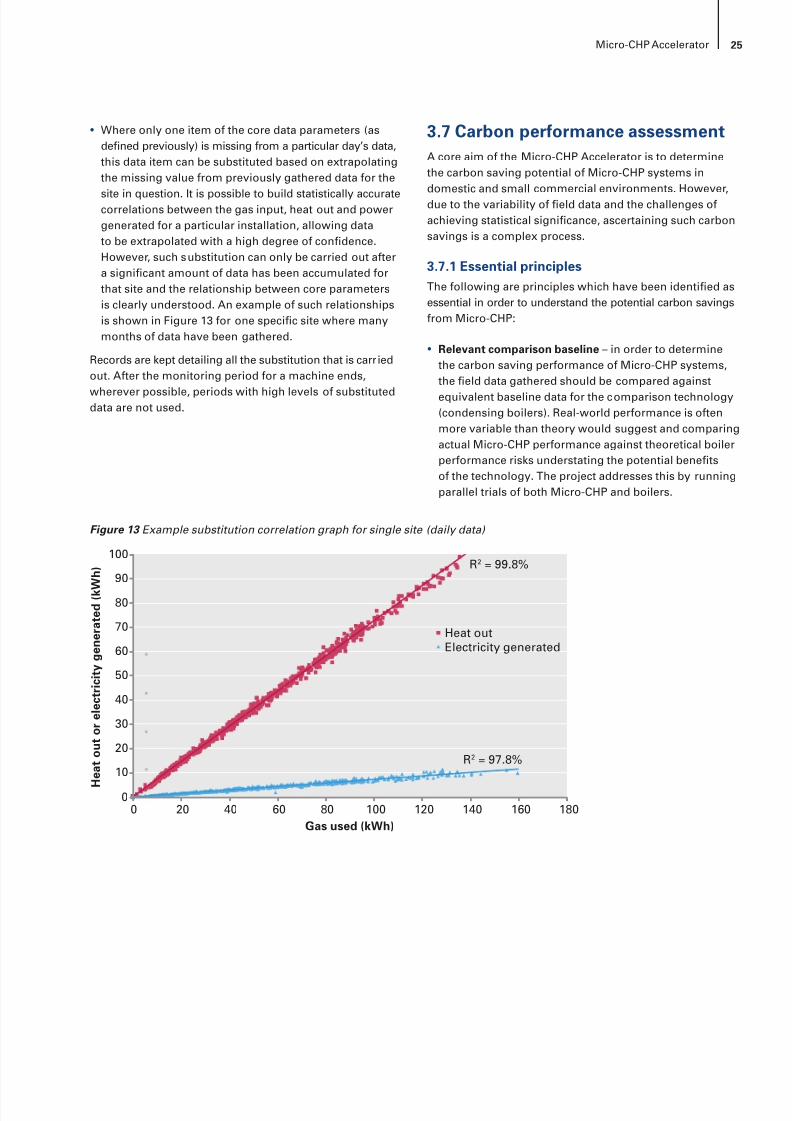
8/6/2019 CHP Accellerator
http://slidepdf.com/reader/full/chp-accellerator 27/104
25Micro-CHP Accelerator
• Where only one item of the core data parameters (asdened previously) is missing from a particular day’s data,this data item can be substituted based on extrapolatingthe missing value from previously gathered data for the
site in question. It is possible to build statistically accuratecorrelations between the gas input, heat out and powergenerated for a particular installation, allowing datato be extrapolated with a high degree of condence.However, such substitution can only be carried out aftera signicant amount of data has been accumulated forthat site and the relationship between core parametersis clearly understood. An example of such relationshipsis shown in Figure 13 for one specic site where manymonths of data have been gathered.
Records are kept detailing all the substitution that is carriedout. After the monitoring period for a machine ends,
wherever possible, periods with high levels of substituteddata are not used.
3.7 Carbon performance assessmentA core aim of the Micro-CHP Accelerator is to determinethe carbon saving potential of Micro-CHP systems indomestic and small commercial environments. However,due to the variability of eld data and the challenges ofachieving statistical signicance, ascertaining such carbonsavings is a complex process.
3.7.1 Essential principlesThe following are principles which have been identied asessential in order to understand the potential carbon savingsfrom Micro-CHP:
• Relevant comparison baseline – in order to determinethe carbon saving performance of Micro-CHP systems,the eld data gathered should be compared againstequivalent baseline data for the comparison technology(condensing boilers). Real-world performance is oftenmore variable than theory would suggest and comparingactual Micro-CHP performance against theoretical boilerperformance risks understating the potential benetsof the technology. The project addresses this by runningparallel trials of both Micro-CHP and boilers.
Figure 13 Example substitution correlation graph for single site (daily data)
100
90
80
70
60
50
40
30
20
10
00 20 40 60 80 100 120 140 160 180
H e a t o u t o r e l e c t r i c i t y g e n e r a t e d
( k W
h )
Gas used (kWh)
Heat outElectricity generated
R2 = 99.8%
R2 = 97.8%
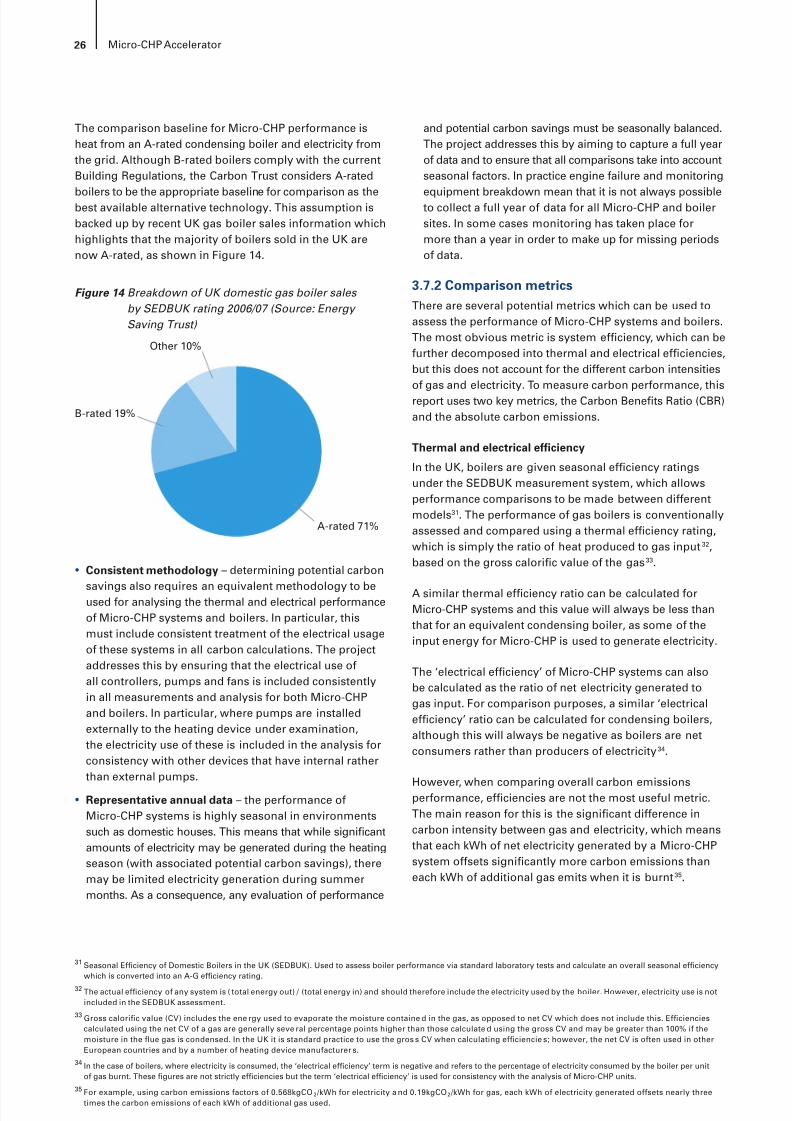
8/6/2019 CHP Accellerator
http://slidepdf.com/reader/full/chp-accellerator 28/104
26 Micro-CHP Accelerator
The comparison baseline for Micro-CHP performance isheat from an A-rated condensing boiler and electricity fromthe grid. Although B-rated boilers comply with the currentBuilding Regulations, the Carbon Trust considers A-rated
boilers to be the appropriate baseline for comparison as thebest available alternative technology. This assumption isbacked up by recent UK gas boiler sales information whichhighlights that the majority of boilers sold in the UK arenow A-rated, as shown in Figure 14.
• Consistent methodology – determining potential carbon
savings also requires an equivalent methodology to beused for analysing the thermal and electrical performanceof Micro-CHP systems and boilers. In particular, thismust include consistent treatment of the electrical usageof these systems in all carbon calculations. The projectaddresses this by ensuring that the electrical use ofall controllers, pumps and fans is included consistentlyin all measurements and analysis for both Micro-CHPand boilers. In particular, where pumps are installedexternally to the heating device under examination,the electricity use of these is included in the analysis forconsistency with other devices that have internal ratherthan external pumps.
• Representative annual data – the performance ofMicro-CHP systems is highly seasonal in environmentssuch as domestic houses. This means that while signicantamounts of electricity may be generated during the heatingseason (with associated potential carbon savings), theremay be limited electricity generation during summermonths. As a consequence, any evaluation of performance
and potential carbon savings must be seasonally balanced.The project addresses this by aiming to capture a full yearof data and to ensure that all comparisons take into accountseasonal factors. In practice engine failure and monitoring
equipment breakdown mean that it is not always possibleto collect a full year of data for all Micro-CHP and boilersites. In some cases monitoring has taken place formore than a year in order to make up for missing periodsof data.
3.7.2 Comparison metricsThere are several potential metrics which can be used toassess the performance of Micro-CHP systems and boilers.The most obvious metric is system efciency, which can befurther decomposed into thermal and electrical efciencies,but this does not account for the different carbon intensitiesof gas and electricity. To measure carbon performance, thisreport uses two key metrics, the Carbon Benets Ratio (CBR)and the absolute carbon emissions.
Thermal and electrical efciency
In the UK, boilers are given seasonal efciency ratingsunder the SEDBUK measurement system, which allowsperformance comparisons to be made between differentmodels 31 . The performance of gas boilers is conventionallyassessed and compared using a thermal efciency rating,which is simply the ratio of heat produced to gas input 32 ,based on the gross caloric value of the gas 33 .
A similar thermal efciency ratio can be calculated forMicro-CHP systems and this value will always be less thanthat for an equivalent condensing boiler, as some of theinput energy for Micro-CHP is used to generate electricity.
The ‘electrical efciency’ of Micro-CHP systems can alsobe calculated as the ratio of net electricity generated togas input. For comparison purposes, a similar ‘electricalefciency’ ratio can be calculated for condensing boilers,although this will always be negative as boilers are netconsumers rather than producers of electricity 34 .
However, when comparing overall carbon emissionsperformance, efciencies are not the most useful metric.The main reason for this is the signicant difference incarbon intensity between gas and electricity, which meansthat each kWh of net electricity generated by a Micro-CHPsystem offsets signicantly more carbon emissions thaneach kWh of additional gas emits when it is burnt 35 .
Figure 14 Breakdown of UK domestic gas boiler sales by SEDBUK rating 2006/07 (Source: Energy Saving Trust)
31 Seasonal Efciency of Domestic Boilers in the UK (SEDBUK). Used to assess boiler performance via standard laboratory tests and calculate an overall seasonal efciencywhich is converted into an A-G efciency rating.
32 The actual efciency of any system is ( total energy out) / (total energy in) and should therefore include the electricity used by the boiler. However, electricity use is notincluded in the SEDBUK assessment.
33 Gross caloric value (CV) includes the ene rgy used to evaporate the moisture containe d in the gas, as opposed to net CV which does not include this. Efcienciescalculated using the net CV of a gas are generally seve ral percentage points higher than those calculate d using the gross CV and may be greater than 100% if themoisture in the ue gas is condensed. In the UK it is standard practice to use the gros s CV when calculating efciencie s; however, the net CV is often used in otherEuropean countries and by a number of heating device manufacturer s.
34 In the case of boilers, where electricity is consumed, the ‘electrical efciency’ term is negative and refers to the percentage of electricity consumed by the boiler per unitof gas burnt. These gures are not strictly efciencies but the term ‘electrical efciency’ is used for consistency with the analysis of Micro-CHP units.
35 For example, using carbon emissions factors of 0.568kgCO 2 /kWh for electricity a nd 0.19kgCO 2 /kWh for gas, each kWh of electricity generated offsets nearly threetimes the carbon emissions of each kWh of additional gas used.
A-rated 71%
B-rated 19%
Other 10%
8/6/2019 CHP Accellerator
http://slidepdf.com/reader/full/chp-accellerator 29/104
27Micro-CHP Accelerator
Carbon Benets Ratio (CBR)
This report uses the CBR as one of the core metrics forassessing relative carbon performance. It is denedas follows:
where:
HeatOutput = space heating provided (kWh) +water heating provided (kWh)
ElectricityGenerated = gross electricity generated by thesystem (kWh)
GasUsed = gas used by the heating system (kWh)
ElectricityUsed = electricity used by the system(controller, pump etc) (kWh)
CEF gas = carbon emissions factor for gas(kgCO 2 /kWh)
CEF elec = carbon emissions factor forelectricity (kgCO 2 /kWh)
The CBR gives due credit for locally produced electricity aswell as accounting for electricity consumed by the unit andits controls. It can be used for both Micro-CHP systems andboilers (although the ElectricityGenerated will always bezero for boilers) and allows the carbon performance of thetwo technologies to be compared in a consistent manner.
The CBR can be calculated for data over any time periodbut it is generally agreed that the best method of analysingMicro-CHP and boiler performance is to consider the overallannual performance. However, monthly CBR gures alsoprovide a useful insight into key performance trends andoperation at different times of year.
Absolute carbon emissions
While the CBR provides an excellent metric for comparingthe relative performance of different systems, as a ratio it
provides no indication of the absolute carbon emissions fora given CBR value. In order to estimate the potential carbonsavings from switching from a condensing boiler to aMicro-CHP system, it is necessary to understand the absolutecarbon emissions for each technology and to identify theextent to which the actual emissions for Micro-CHP arelower than those for a boiler.
The key challenge in comparing performance using theabsolute carbon emissions is to ensure that like-for-likecomparisons are made. For example, the absolute
emissions for Micro-CHP and boilers could potentially becompared for houses which are equivalent in terms of thelevel of heat demand, age or size. As the houses used forthe Micro-CHP and boiler trials are necessarily different it
is not possible to directly measure the ‘carbon savings’ fora given property. However, by ensuring that similar typesof houses are included in both trials and by performingappropriate statistical comparisons, it is possible toestimate the typical carbon savings potential for certaingiven scenarios.
The absolute carbon emissions for Micro-CHP and boilersystems are as dened below:
CarbonEmissions = GasUsed x CEF gas + (ElectricityUsed – ElectricityGenerated) x CEF elec
Where ElectricityGenerated = 0 for boilers.
3.7.3 Carbon emission factorsThe carbon saving potential of Micro-CHP depends on itsability to generate electricity locally and offset the needfor an equivalent amount of electricity to be generatedby some form of central plant. When assessing the carbonperformance of Micro-CHP, it is therefore necessary to makeappropriate assumptions about which technology wouldhave generated the electricity, had the Micro-CHP unit notdone so.
At any given moment, UK grid electricity is derived from a
mix of different types of power generation. As a result, gridelectricity has a carbon intensity which is a composite ofthese forms of generation, ranging from near zero emissionstechnologies, such as nuclear and renewables, to plant withhigh carbon emissions, such as coal-red power stations.Thus, the potential carbon savings that can be attributedto the displacement of grid generated electricity varysignicantly, depending on the assumptions made regardingthe generating plant being displaced.
Before deregulation of the UK electricity market, the CentralElectricity Generating Board (CEGB) would determine whichplant operated according to the needs at the time. It wasrelatively easy to predict which plant would be displaced,should other forms of generation appear. However, in thecurrent deregulated market, the marginal plant is chosenon an economic basis depending on a complex mix of localand global factors, and short-term protability normallydetermines which plant are operated. In recent years, coalhas often been favoured over gas for a complex set ofreasons including the remaining economic life of the plant,the expected future cost of carbon and relative prices ofcoal and gas.
(HeatOutput x CEF gas + ElectricityGenerated x CEF elec )
(GasUsed x CEF gas + ElectricityUsed x CEF elec ) CBR =
8/6/2019 CHP Accellerator
http://slidepdf.com/reader/full/chp-accellerator 30/104
28 Micro-CHP Accelerator
This report uses the term carbon emissions factor (CEF, withunits of kgCO 2 /kWh) to refer to the ratio used to calculatethe carbon emissions associated with use of a particularsource of energy. The CEF for electricity is of particular
importance when assessing the potential carbon savingsfrom use of Micro-CHP systems. There are two mainoptions for determining the appropriate CEF for electricityto use when assessing the performance of Micro CHP andboilers, as follows:
• ‘Grid mix’ – the grid mix emissions factor is based onthe average carbon intensity seen on the UK grid over arelevant period. In recent years, a gure of 0.43kgCO 2 /kWhhas been used by most organisations in line with Defra’sEnvironmental Reporting Guidelines 36 . The 2005 versionof the Government’s Standard Assessment Procedure(SAP) for energy rating of dwellings suggests a similar
but slightly lower gure of 0.422kgCO 2 /kWh37
. However,at the time of writing the actual grid mix is believed tobe 20-30% higher than this (0.52kgCO 2 /kWh) in practicedue to the recent switch back to coal generation plantresulting from higher gas prices and other factors 38 .
• ‘Marginal plant’ – the marginal plant emissions factoris based on the premise that certain types of plant, mostnotably nuclear and some renewables, are expected togenerate constantly, regardless of the total UK electricitydemand. As a result, a fossil-mix carbon intensity is oftencalculated to represent the ‘marginal plant’ that might bedisplaced by electricity generating low-carbon technologies.
The 2005 version of the Standard Assessment Procedure(SAP) suggests a value of 0.568kgCO 2 /kWh for electricitydisplaced from the grid.
The benet of the ‘marginal plant’ approach is that it creditsMicro-CHP with the potential to displace generating plantthat is more carbon intense than average. This is backedup by the results presented in this report, which indicatethat Micro-CHP units are likely to generate electricity attimes of relatively high demand on the grid, includingdaytime/evening and during the winter.
The benet of the ‘grid mix’ approach is that it is more likelyto be reective of the carbon intensity of the grid in future.This is because the EU-wide and UK Government targetsfor decarbonising the electricity supply imply that the carbonintensity of the grid will necessarily be signicantly lowerin future. To this extent the marginal plant approach mayoverstate the future carbon savings potential of Micro-CHP.However, this is balanced by the fact that the performanceof Micro-CHP systems is expected to improve in thecoming years.
The Carbon Trust considers it more informative to obtaina robust view of current Micro-CHP performance using acurrent view of the grid, than to use the long-term grid mixwith a theoretical view on potential future performance of
Micro-CHP units.
For the purposes of clarity, a factor of 0.568kgCO 2 /kWh hasbeen used predominantly throughout this report. There isno one right value to use, but this has been adopted in lightof the above considerations. In particular, this includes thefact that the average carbon emissions factor is known tobe currently at a level well above the long-term grid mixand the fact that Micro-CHP units have been seen to generatemost at times of peak electricity demand.
However, in some parts of the report the effect of assuminga different factor is noted for reference. For consistency
of comparison, the same emissions factors are used incalculations for both Micro-CHP and boilers.
3.8 Micro-CHP eld trial3.8.1 IntroductionWhen the Micro-CHP Accelerator was developed in early2003, the technologies were classied as small-scale CHP(3-30kW electrical output) and micro-scale CHP (0-3kWelectrical output). However, the EU Cogeneration Directivedenes micro-cogeneration as units up to 50kW electricaloutput and small-scale cogeneration as units up to 1MW
electrical. To ensure consistency in terminology, theCarbon Trust has modied its denitions and now usesthe term Micro-CHP to refer to all the technologies includedin this project. The different technologies are then furthersub-divided into sub-categories of domestic Micro-CHPand commercial Micro-CHP.
In general the commercial Micro-CHP units in the trial arebased on proven IC engine technology which can providefor larger heat demands where long and consistent runtimes are expected. By contrast, the domestic Micro-CHPunits are based on Stirling engine technology, as the systemsare inherently smaller and quieter and thus more suited fordomestic use.
Domestic Micro-CHP
A domestic Micro-CHP installation involves a Micro-CHPunit being installed as the sole heating system in place ofa standard boiler to serve a single household (or a smallbusiness in a domestic-style property). The unit is sizedto provide the maximum heat demand expected for theproperty. Typical Stirling engine domestic Micro-CHP systemshave peak thermal outputs in the range of 8-15kW and peakelectrical outputs in the range of 1-3kW.
36 Until June 2007 the Defra Environmental Guidelines used 0.43kgCO 2 /kWh as the emissions factor for electricity. The revised version refers to this as the ‘long-termmarginal factor’ and shows that emissions factors have been higher than this in recent years: www.defra.gov.uk/environment/business/envrp/pdf/conversion-factors.pdf
37 Standard Assessment Procedure (SAP) 2005: http://projects.bre.co.uk/sap2005/pdf/SAP2005.pdf
38 Similarly the grid carbon intensity mix may reduce again over the coming years. For example, there may be an increa se in the use of CCGT electricit y generationin response to additional gas supplies reaching the UK via a new inter-connect or from Holland and increasing shipments of LNG.
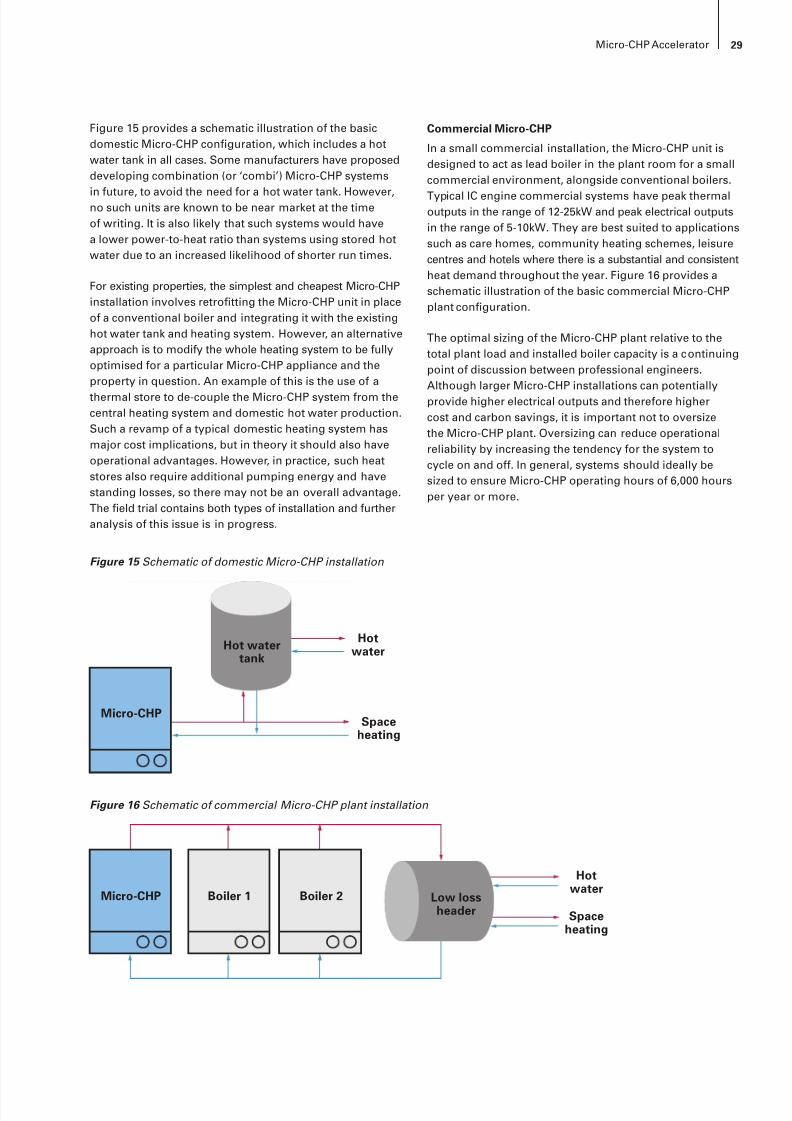
8/6/2019 CHP Accellerator
http://slidepdf.com/reader/full/chp-accellerator 31/104
29Micro-CHP Accelerator
Figure 15 provides a schematic illustration of the basicdomestic Micro-CHP conguration, which includes a hotwater tank in all cases. Some manufacturers have proposeddeveloping combination (or ‘combi’) Micro-CHP systems
in future, to avoid the need for a hot water tank. However,no such units are known to be near market at the timeof writing. It is also likely that such systems would havea lower power-to-heat ratio than systems using stored hotwater due to an increased likelihood of shorter run times.
For existing properties, the simplest and cheapest Micro-CHPinstallation involves retrotting the Micro-CHP unit in placeof a conventional boiler and integrating it with the existinghot water tank and heating system. However, an alternativeapproach is to modify the whole heating system to be fullyoptimised for a particular Micro-CHP appliance and theproperty in question. An example of this is the use of athermal store to de-couple the Micro-CHP system from thecentral heating system and domestic hot water production.Such a revamp of a typical domestic heating system hasmajor cost implications, but in theory it should also haveoperational advantages. However, in practice, such heatstores also require additional pumping energy and havestanding losses, so there may not be an overall advantage.The eld trial contains both types of installation and furtheranalysis of this issue is in progress.
Commercial Micro-CHP
In a small commercial installation, the Micro-CHP unit isdesigned to act as lead boiler in the plant room for a smallcommercial environment, alongside conventional boilers.
Typical IC engine commercial systems have peak thermaloutputs in the range of 12-25kW and peak electrical outputsin the range of 5-10kW. They are best suited to applicationssuch as care homes, community heating schemes, leisurecentres and hotels where there is a substantial and consistentheat demand throughout the year. Figure 16 provides aschematic illustration of the basic commercial Micro-CHPplant conguration.
The optimal sizing of the Micro-CHP plant relative to thetotal plant load and installed boiler capacity is a continuingpoint of discussion between professional engineers.Although larger Micro-CHP installations can potentiallyprovide higher electrical outputs and therefore highercost and carbon savings, it is important not to oversizethe Micro-CHP plant. Oversizing can reduce operationalreliability by increasing the tendency for the system tocycle on and off. In general, systems should ideally besized to ensure Micro-CHP operating hours of 6,000 hoursper year or more.
Figure 15 Schematic of domestic Micro-CHP installation
Figure 16 Schematic of commercial Micro-CHP plant installation
Micro-CHPSpace
heating
HotwaterHot water
tank
Micro-CHP Boiler 1 Boiler 2
Hotwater
Spaceheating
Low lossheader

8/6/2019 CHP Accellerator
http://slidepdf.com/reader/full/chp-accellerator 32/104
30 Micro-CHP Accelerator
In a building with space heating and modest hot waterrequirements, this can result in the specication of aMicro-CHP system with a thermal output of less than 15%of the installed capacity of the plant within the boiler house.
This may appear small, but the Micro-CHP unit, as the leadboiler, often still provides around one third of the overallannual heat demand.
For example, a Baxi Dachs unit (~12kW thermal) might bebest installed in a boiler house with a capacity of over 120kWwhereas an EC power unit (17-29kW thermal) might be bestinstalled in a boiler house with a capacity of over 250kW,although the latter is range rated. These values are veryindicative, as many existing boiler houses are considerablyoversized, especially if the heating is critical, as in anursing home.
Another key sizing consideration is the expected electricaloutput of the system relative to the site base load electricitydemand. In the absence of electricity export tariffs, suitablesites are often specically selected to ensure that all theelectricity generated will generally be used on-site. If exporttariffs were to be available, Micro-CHP units could beeconomically viable for a wider range of commercial sites,provided their heat demands are still large enough toensure good operational reliability.
In some cases there may also be benet from using a thermalstore to isolate the commercial Micro-CHP system from
the overall heating system. Such a design may provide anassociated reduction in stop/start operation and can alsoprovide an effective buffer to assist in the production ofhot water at times of peak demand. However, there arealso concerns that the heat losses associated with currentlyavailable thermal stores may be such as to undermineany potential benets. Most of the commercial Micro-CHPsystems in the Carbon Trust eld trial have been installedwithout thermal stores.
3.8.2 Field trial unitsThe Micro-CHP eld trial involves detailed ‘real-life’monitoring of 87 Micro-CHP installations at a variety ofdifferent sites across the UK. Of these sites, 72 are domestic
installations and the remaining 15 are in the commercial/ non-domestic sector.
The Carbon Trust intends to monitor each site for a minimumof one year so that seasonal variation in heat demand isaccounted for. By the end of June 2007, a total of 890 validmonths of domestic operation and 85 valid months ofcommercial operation had been collected. A total of 43domestic and three commercial sites had produced 12 ormore continuous months of valid data and the majority ofthese have now been decommissioned from the trial. Theremainder will continue to be monitored until they deliver
a full year of data, or until the end of the scheduled projectmonitoring period.
The eld trial units include ten different designs of Micro-CHPsystem using three different technologies as listed in Table 2.The majority of domestic Micro-CHP units in the trial areWhispergen Mk4 and Mk5 devices and the majority ofcommercial Micro-CHP units are Baxi Dachs devices.
39 In February 2007 BG group announced the closure of Microgen. In August 2007 the formation of Microgen Engine Corporation was announced, in partnership with Stirlingengine developer Sunpower and various European boiler manufacturers. This new company is expected to continue developing the original Microgen technology.
Ref Manufacturer Model Technology Status1 Baxi Dachs IC engine (natural gas) Mature
2 Baxi Dachs IC engine (oil) Mature
3 EC Power XRGI 13 IC engine Early market
4 Fiat Totem IC engine No longer made
5 Frichs Frichs 22 IC engine Mature
6 Disenco Home Power Plant Stirling engine In development
7 Microgen 39 Microgen Stirling engine In development
8 Whispergen Mk4 Stirling engine No longer made
9 Whispergen Mk5 Stirling engine Early market
10 Baxi Innotech Home Heat Centre PEM fuel cell Prototype
Table 2 Micro-CHP device types involved in eld trial
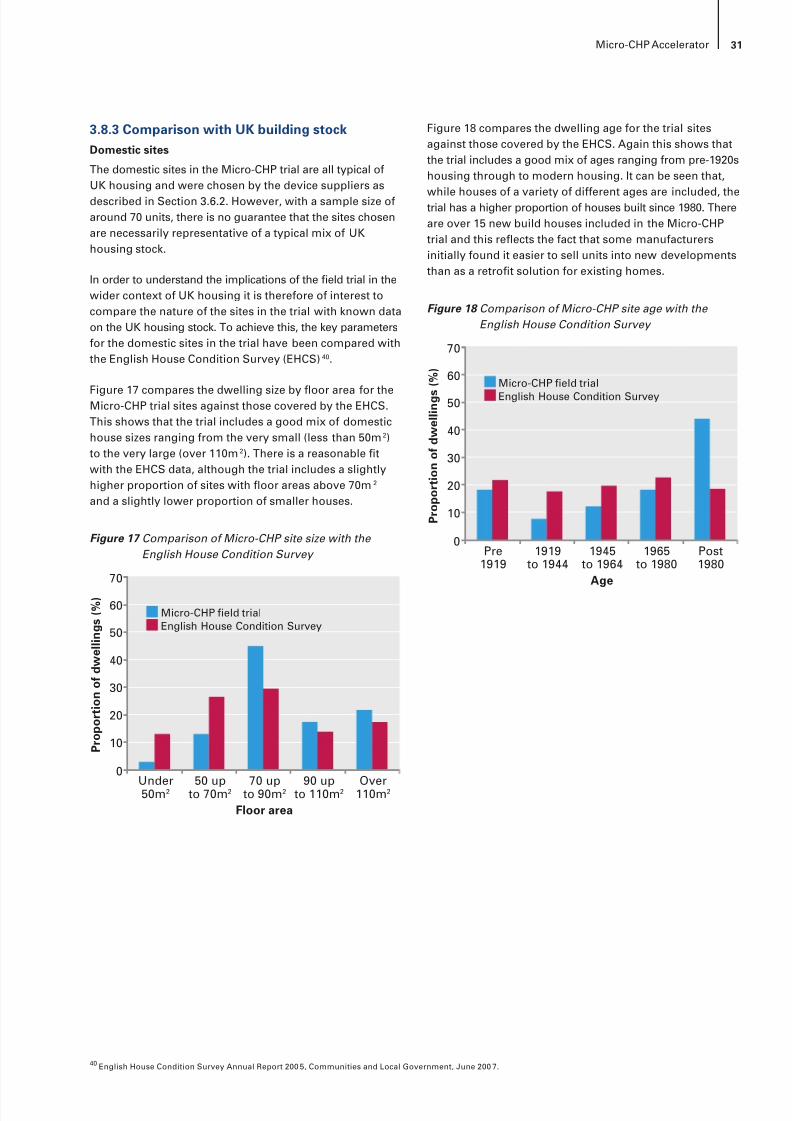
8/6/2019 CHP Accellerator
http://slidepdf.com/reader/full/chp-accellerator 33/104
31Micro-CHP Accelerator
3.8.3 Comparison with UK building stockDomestic sites
The domestic sites in the Micro-CHP trial are all typical ofUK housing and were chosen by the device suppliers asdescribed in Section 3.6.2. However, with a sample size ofaround 70 units, there is no guarantee that the sites chosenare necessarily representative of a typical mix of UKhousing stock.
In order to understand the implications of the eld trial in thewider context of UK housing it is therefore of interest tocompare the nature of the sites in the trial with known dataon the UK housing stock. To achieve this, the key parametersfor the domestic sites in the trial have been compared withthe English House Condition Survey (EHCS) 40 .
Figure 17 compares the dwelling size by oor area for theMicro-CHP trial sites against those covered by the EHCS.This shows that the trial includes a good mix of domestichouse sizes ranging from the very small (less than 50m 2)to the very large (over 110m 2). There is a reasonable twith the EHCS data, although the trial includes a slightlyhigher proportion of sites with oor areas above 70m 2 and a slightly lower proportion of smaller houses.
Figure 18 compares the dwelling age for the trial sitesagainst those covered by the EHCS. Again this shows thatthe trial includes a good mix of ages ranging from pre-1920shousing through to modern housing. It can be seen that,
while houses of a variety of different ages are included, thetrial has a higher proportion of houses built since 1980. Thereare over 15 new build houses included in the Micro-CHPtrial and this reects the fact that some manufacturersinitially found it easier to sell units into new developmentsthan as a retrot solution for existing homes.
Figure 17 Comparison of Micro-CHP site size with the English House Condition Survey
Micro-CHP field trialEnglish House Condition Survey
Floor area
P r o p o r t i o n o f d w e l l i n g s
( % )
Under50m 2 50 upto 70m 2 70 upto 90m 2 90 upto 110m 2 Over110m 2
0
10
20
30
40
50
60
70
Figure 18 Comparison of Micro-CHP site age with the English House Condition Survey
Micro-CHP field trialEnglish House Condition Survey
Age
P r o p o r t i o n o f d w e l l i n g s
( % )
Pre1919
1919to 1944
1945to 1964
1965to 1980
Post1980
0
10
20
30
40
50
60
70
40 English House Condition Survey Annual Report 200 5, Communities and Local Government, June 200 7.
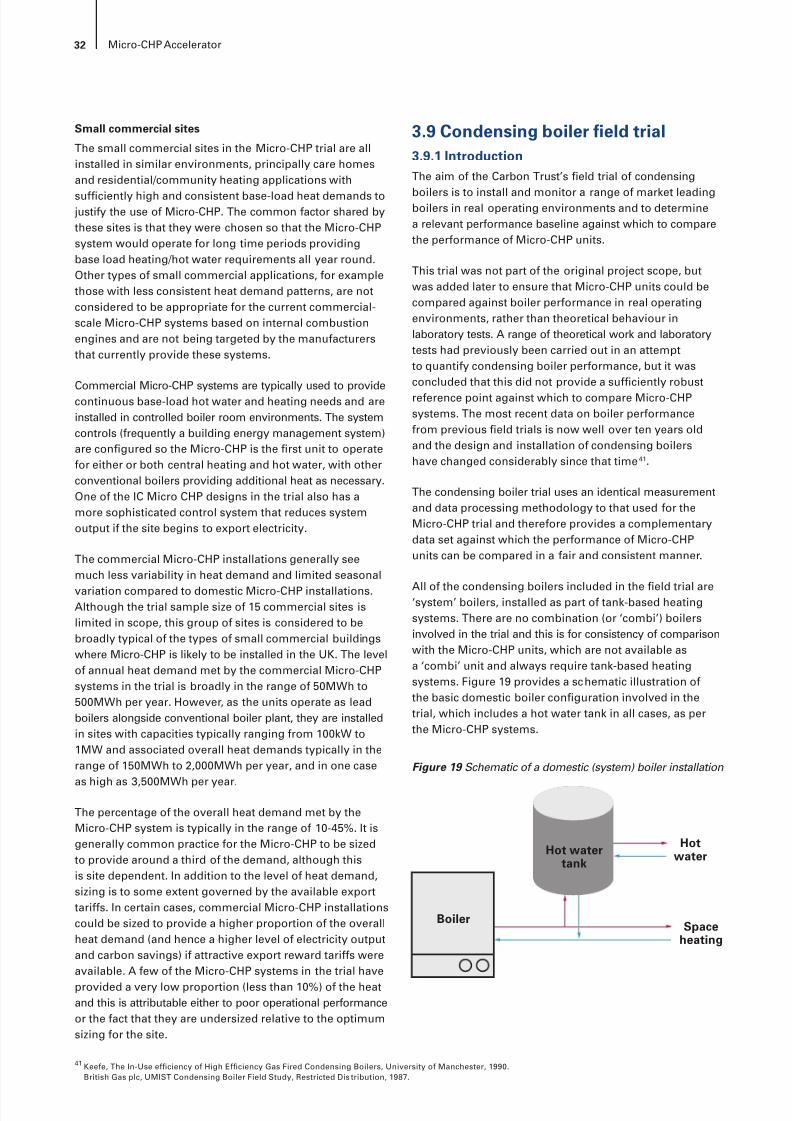
8/6/2019 CHP Accellerator
http://slidepdf.com/reader/full/chp-accellerator 34/104
32 Micro-CHP Accelerator
Small commercial sites
The small commercial sites in the Micro-CHP trial are allinstalled in similar environments, principally care homesand residential/community heating applications with
sufciently high and consistent base-load heat demands tojustify the use of Micro-CHP. The common factor shared bythese sites is that they were chosen so that the Micro-CHPsystem would operate for long time periods providingbase load heating/hot water requirements all year round.Other types of small commercial applications, for examplethose with less consistent heat demand patterns, are notconsidered to be appropriate for the current commercial-scale Micro-CHP systems based on internal combustionengines and are not being targeted by the manufacturersthat currently provide these systems.
Commercial Micro-CHP systems are typically used to providecontinuous base-load hot water and heating needs and areinstalled in controlled boiler room environments. The systemcontrols (frequently a building energy management system)are congured so the Micro-CHP is the rst unit to operatefor either or both central heating and hot water, with otherconventional boilers providing additional heat as necessary.One of the IC Micro CHP designs in the trial also has amore sophisticated control system that reduces systemoutput if the site begins to export electricity.
The commercial Micro-CHP installations generally seemuch less variability in heat demand and limited seasonal
variation compared to domestic Micro-CHP installations.Although the trial sample size of 15 commercial sites islimited in scope, this group of sites is considered to bebroadly typical of the types of small commercial buildingswhere Micro-CHP is likely to be installed in the UK. The levelof annual heat demand met by the commercial Micro-CHPsystems in the trial is broadly in the range of 50MWh to500MWh per year. However, as the units operate as leadboilers alongside conventional boiler plant, they are installedin sites with capacities typically ranging from 100kW to1MW and associated overall heat demands typically in therange of 150MWh to 2,000MWh per year, and in one case
as high as 3,500MWh per year.
The percentage of the overall heat demand met by theMicro-CHP system is typically in the range of 10-45%. It isgenerally common practice for the Micro-CHP to be sizedto provide around a third of the demand, although thisis site dependent. In addition to the level of heat demand,sizing is to some extent governed by the available exporttariffs. In certain cases, commercial Micro-CHP installationscould be sized to provide a higher proportion of the overallheat demand (and hence a higher level of electricity outputand carbon savings) if attractive export reward tariffs wereavailable. A few of the Micro-CHP systems in the trial haveprovided a very low proportion (less than 10%) of the heatand this is attributable either to poor operational performanceor the fact that they are undersized relative to the optimumsizing for the site.
3.9 Condensing boiler eld trial3.9.1 IntroductionThe aim of the Carbon Trust’s eld trial of condensing
boilers is to install and monitor a range of market leadingboilers in real operating environments and to determinea relevant performance baseline against which to comparethe performance of Micro-CHP units.
This trial was not part of the original project scope, butwas added later to ensure that Micro-CHP units could becompared against boiler performance in real operatingenvironments, rather than theoretical behaviour inlaboratory tests. A range of theoretical work and laboratorytests had previously been carried out in an attemptto quantify condensing boiler performance, but it wasconcluded that this did not provide a sufciently robustreference point against which to compare Micro-CHPsystems. The most recent data on boiler performancefrom previous eld trials is now well over ten years oldand the design and installation of condensing boilershave changed considerably since that time 41 .
The condensing boiler trial uses an identical measurementand data processing methodology to that used for theMicro-CHP trial and therefore provides a complementarydata set against which the performance of Micro-CHPunits can be compared in a fair and consistent manner.
All of the condensing boilers included in the eld trial are‘system’ boilers, installed as part of tank-based heatingsystems. There are no combination (or ‘combi’) boilersinvolved in the trial and this is for consistency of comparisonwith the Micro-CHP units, which are not available asa ‘combi’ unit and always require tank-based heatingsystems. Figure 19 provides a schematic illustration ofthe basic domestic boiler conguration involved in thetrial, which includes a hot water tank in all cases, as perthe Micro-CHP systems.
Figure 19 Schematic of a domestic (system) boiler installation
41 Keefe, The In-Use efciency of High Efciency Gas Fired Condensing Boilers, University of Manchester, 1990.British Gas plc, UMIST Condensing Boiler Field Study, Restricted Dis tribution, 1987.
Spaceheating
HotwaterHot water
tank
Boiler
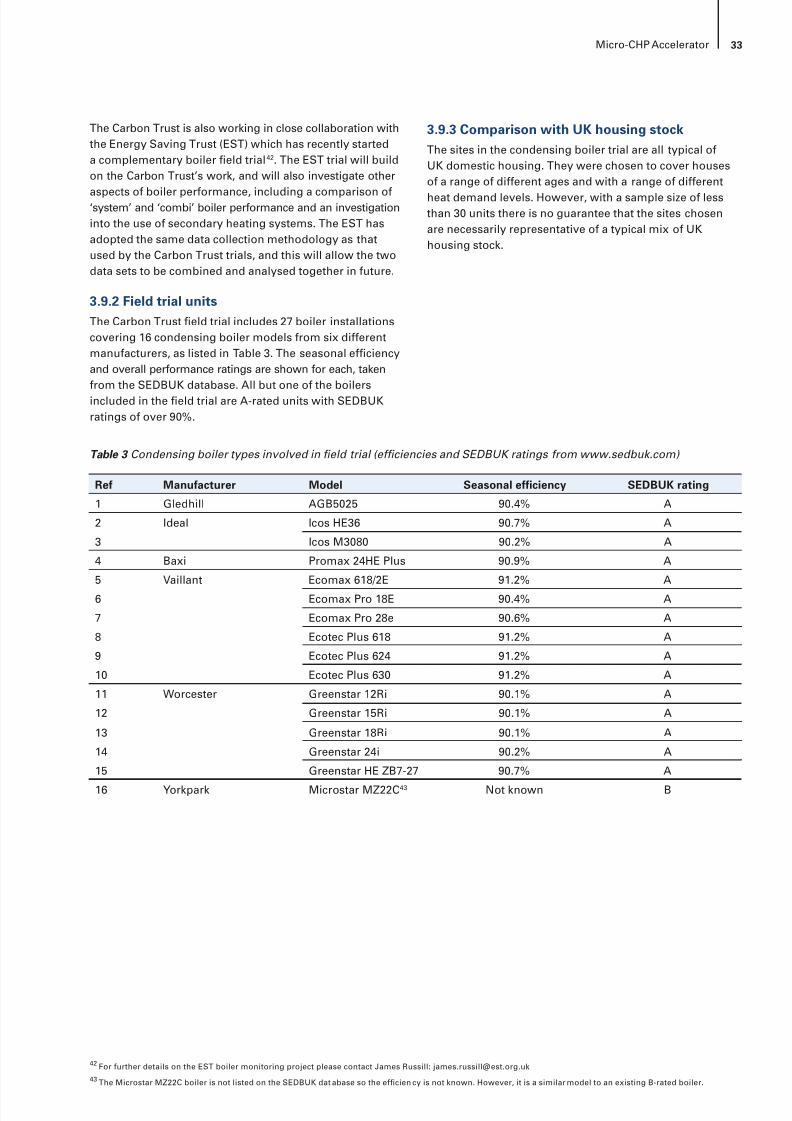
8/6/2019 CHP Accellerator
http://slidepdf.com/reader/full/chp-accellerator 35/104
33Micro-CHP Accelerator
The Carbon Trust is also working in close collaboration withthe Energy Saving Trust (EST) which has recently starteda complementary boiler eld trial 42 . The EST trial will buildon the Carbon Trust’s work, and will also investigate other
aspects of boiler performance, including a comparison of‘system’ and ‘combi’ boiler performance and an investigationinto the use of secondary heating systems. The EST hasadopted the same data collection methodology as thatused by the Carbon Trust trials, and this will allow the twodata sets to be combined and analysed together in future.
3.9.2 Field trial unitsThe Carbon Trust eld trial includes 27 boiler installationscovering 16 condensing boiler models from six differentmanufacturers, as listed in Table 3. The seasonal efciencyand overall performance ratings are shown for each, takenfrom the SEDBUK database. All but one of the boilersincluded in the eld trial are A-rated units with SEDBUKratings of over 90%.
3.9.3 Comparison with UK housing stockThe sites in the condensing boiler trial are all typical ofUK domestic housing. They were chosen to cover housesof a range of different ages and with a range of different
heat demand levels. However, with a sample size of lessthan 30 units there is no guarantee that the sites chosenare necessarily representative of a typical mix of UKhousing stock.
42 For further details on the EST boiler monitoring project please contact James Russill: [email protected] The Microstar MZ22C boiler is not listed on the SEDBUK dat abase so the efcien cy is not known. However, it is a similar model to an existing B-rated boiler.
Ref Manufacturer Model Seasonal efciency SEDBUK rating
1 Gledhill AGB5025 90.4% A
2 Ideal Icos HE36 90.7% A
3 Icos M3080 90.2% A
4 Baxi Promax 24HE Plus 90.9% A
5 Vaillant Ecomax 618/2E 91.2% A
6 Ecomax Pro 18E 90.4% A
7 Ecomax Pro 28e 90.6% A
8 Ecotec Plus 618 91.2% A
9 Ecotec Plus 624 91.2% A
10 Ecotec Plus 630 91.2% A
11 Worcester Greenstar 12Ri 90.1% A
12 Greenstar 15Ri 90.1% A
13 Greenstar 18Ri 90.1% A
14 Greenstar 24i 90.2% A
15 Greenstar HE ZB7-27 90.7% A
16 Yorkpark Microstar MZ22C 43 Not known B
Table 3 Condensing boiler types involved in eld trial (efciencies and SEDBUK ratings from www.sedbuk.com)
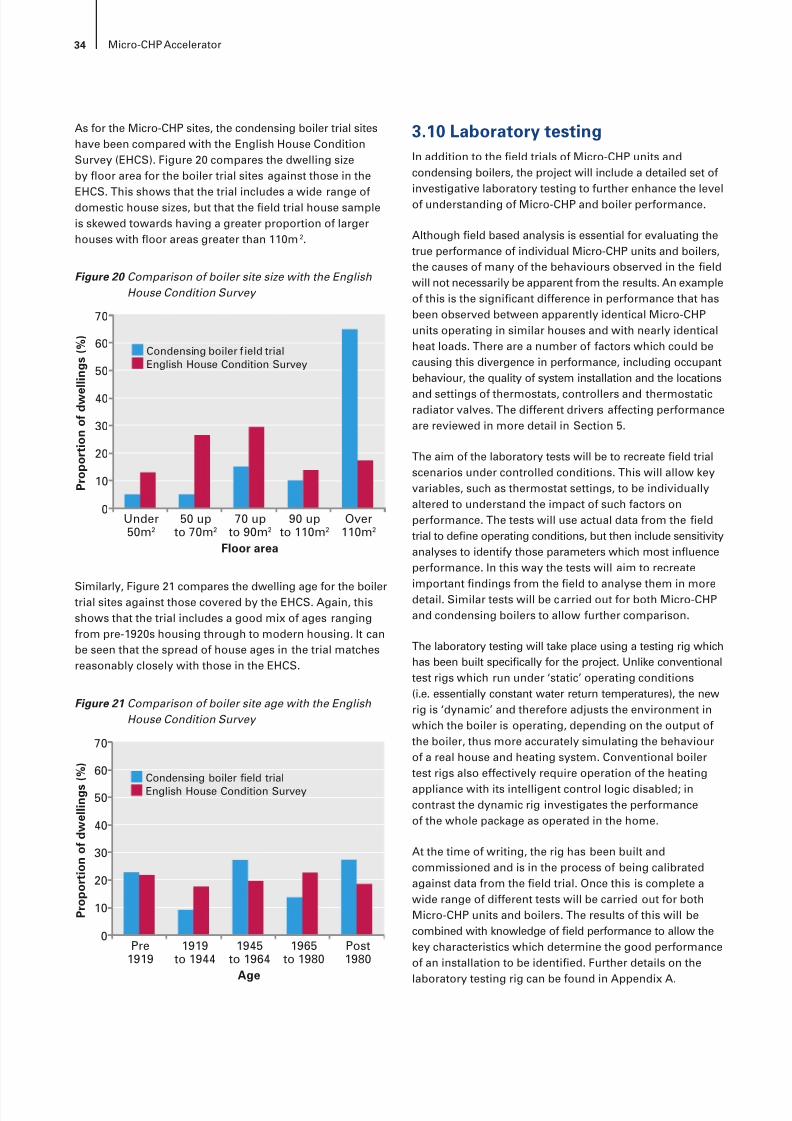
8/6/2019 CHP Accellerator
http://slidepdf.com/reader/full/chp-accellerator 36/104
34 Micro-CHP Accelerator
As for the Micro-CHP sites, the condensing boiler trial siteshave been compared with the English House ConditionSurvey (EHCS). Figure 20 compares the dwelling sizeby oor area for the boiler trial sites against those in the
EHCS. This shows that the trial includes a wide range ofdomestic house sizes, but that the eld trial house sampleis skewed towards having a greater proportion of largerhouses with oor areas greater than 110m 2.
Similarly, Figure 21 compares the dwelling age for the boilertrial sites against those covered by the EHCS. Again, thisshows that the trial includes a good mix of ages rangingfrom pre-1920s housing through to modern housing. It canbe seen that the spread of house ages in the trial matchesreasonably closely with those in the EHCS.
3.10 Laboratory testingIn addition to the eld trials of Micro-CHP units andcondensing boilers, the project will include a detailed set ofinvestigative laboratory testing to further enhance the levelof understanding of Micro-CHP and boiler performance.
Although eld based analysis is essential for evaluating thetrue performance of individual Micro-CHP units and boilers,the causes of many of the behaviours observed in the eldwill not necessarily be apparent from the results. An exampleof this is the signicant difference in performance that hasbeen observed between apparently identical Micro-CHPunits operating in similar houses and with nearly identicalheat loads. There are a number of factors which could becausing this divergence in performance, including occupantbehaviour, the quality of system installation and the locations
and settings of thermostats, controllers and thermostaticradiator valves. The different drivers affecting performanceare reviewed in more detail in Section 5.
The aim of the laboratory tests will be to recreate eld trialscenarios under controlled conditions. This will allow keyvariables, such as thermostat settings, to be individuallyaltered to understand the impact of such factors onperformance. The tests will use actual data from the eldtrial to dene operating conditions, but then include sensitivityanalyses to identify those parameters which most inuenceperformance. In this way the tests will aim to recreate
important ndings from the eld to analyse them in moredetail. Similar tests will be carried out for both Micro-CHPand condensing boilers to allow further comparison.
The laboratory testing will take place using a testing rig whichhas been built specically for the project. Unlike conventionaltest rigs which run under ‘static’ operating conditions(i.e. essentially constant water return temperatures), the newrig is ‘dynamic’ and therefore adjusts the environment inwhich the boiler is operating, depending on the output ofthe boiler, thus more accurately simulating the behaviourof a real house and heating system. Conventional boilertest rigs also effectively require operation of the heating
appliance with its intelligent control logic disabled; incontrast the dynamic rig investigates the performanceof the whole package as operated in the home.
At the time of writing, the rig has been built andcommissioned and is in the process of being calibratedagainst data from the eld trial. Once this is complete awide range of different tests will be carried out for bothMicro-CHP units and boilers. The results of this will becombined with knowledge of eld performance to allow thekey characteristics which determine the good performanceof an installation to be identied. Further details on the
laboratory testing rig can be found in Appendix A.
Figure 20 Comparison of boiler site size with the EnglishHouse Condition Survey
Condensing boiler f ield trialEnglish House Condition Survey
Floor area
P r o p o r t i o n o f d w e
l l i n g s ( % )
Under50m 2
50 upto 70m 2
70 upto 90m 2
90 upto 110m 2
Over110m 2
0
10
20
30
40
50
60
70
Figure 21 Comparison of boiler site age with the EnglishHouse Condition Survey
Condensing boiler field trialEnglish House Condition Survey
Age
P r o p o r t i o n o f d w e l l i n g s
( % )
Pre1919
1919to 1944
1945to 1964
1965to 1980
Post1980
0
10
20
30
40
50
60
70
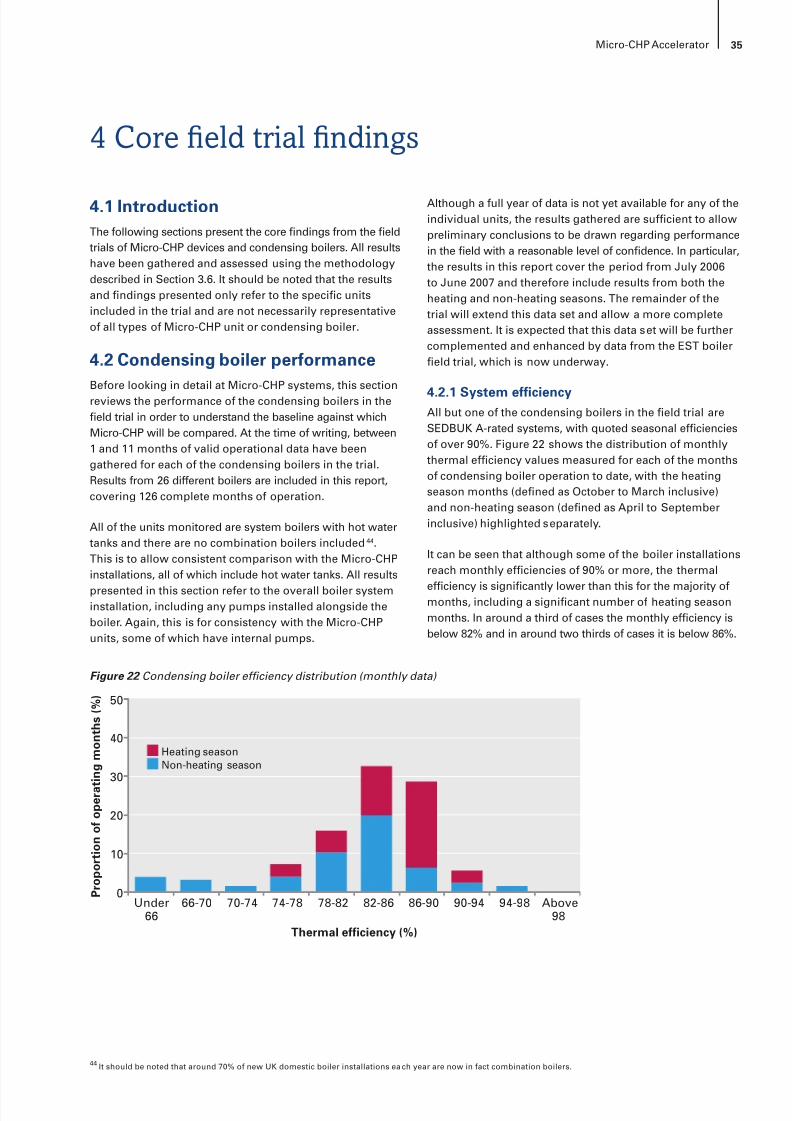
8/6/2019 CHP Accellerator
http://slidepdf.com/reader/full/chp-accellerator 37/104
35Micro-CHP Accelerator
4 Core eld trial ndings
4.1 IntroductionThe following sections present the core ndings from the eldtrials of Micro-CHP devices and condensing boilers. All resultshave been gathered and assessed using the methodologydescribed in Section 3.6. It should be noted that the resultsand ndings presented only refer to the specic unitsincluded in the trial and are not necessarily representativeof all types of Micro-CHP unit or condensing boiler.
4.2 Condensing boiler performanceBefore looking in detail at Micro-CHP systems, this sectionreviews the performance of the condensing boilers in theeld trial in order to understand the baseline against whichMicro-CHP will be compared. At the time of writing, between1 and 11 months of valid operational data have beengathered for each of the condensing boilers in the trial.Results from 26 different boilers are included in this report,covering 126 complete months of operation.
All of the units monitored are system boilers with hot watertanks and there are no combination boilers included 44 .This is to allow consistent comparison with the Micro-CHPinstallations, all of which include hot water tanks. All results
presented in this section refer to the overall boiler systeminstallation, including any pumps installed alongside theboiler. Again, this is for consistency with the Micro-CHPunits, some of which have internal pumps.
Although a full year of data is not yet available for any of theindividual units, the results gathered are sufcient to allowpreliminary conclusions to be drawn regarding performancein the eld with a reasonable level of condence. In particular,the results in this report cover the period from July 2006to June 2007 and therefore include results from both theheating and non-heating seasons. The remainder of thetrial will extend this data set and allow a more completeassessment. It is expected that this data set will be furthercomplemented and enhanced by data from the EST boilereld trial, which is now underway.
4.2.1 System efciencyAll but one of the condensing boilers in the eld trial areSEDBUK A-rated systems, with quoted seasonal efcienciesof over 90%. Figure 22 shows the distribution of monthlythermal efciency values measured for each of the monthsof condensing boiler operation to date, with the heatingseason months (dened as October to March inclusive)and non-heating season (dened as April to Septemberinclusive) highlighted separately.
It can be seen that although some of the boiler installationsreach monthly efciencies of 90% or more, the thermal
efciency is signicantly lower than this for the majority ofmonths, including a signicant number of heating seasonmonths. In around a third of cases the monthly efciency isbelow 82% and in around two thirds of cases it is below 86%.
44 It should be noted that around 70% of new UK domestic boiler installations ea ch year are now in fact combination boilers.
Figure 22 Condensing boiler efciency distribution (monthly data)
Heating seasonNon-heating season
Thermal efficiency (%)
P r o p o r t i o n o f o p e r a t
i n g m o n t h s
( % )
Under66
66-70 70-74 74-78 78-82 82-86 86-90 90-94 94-98 Above98
0
10
20
30
40
50
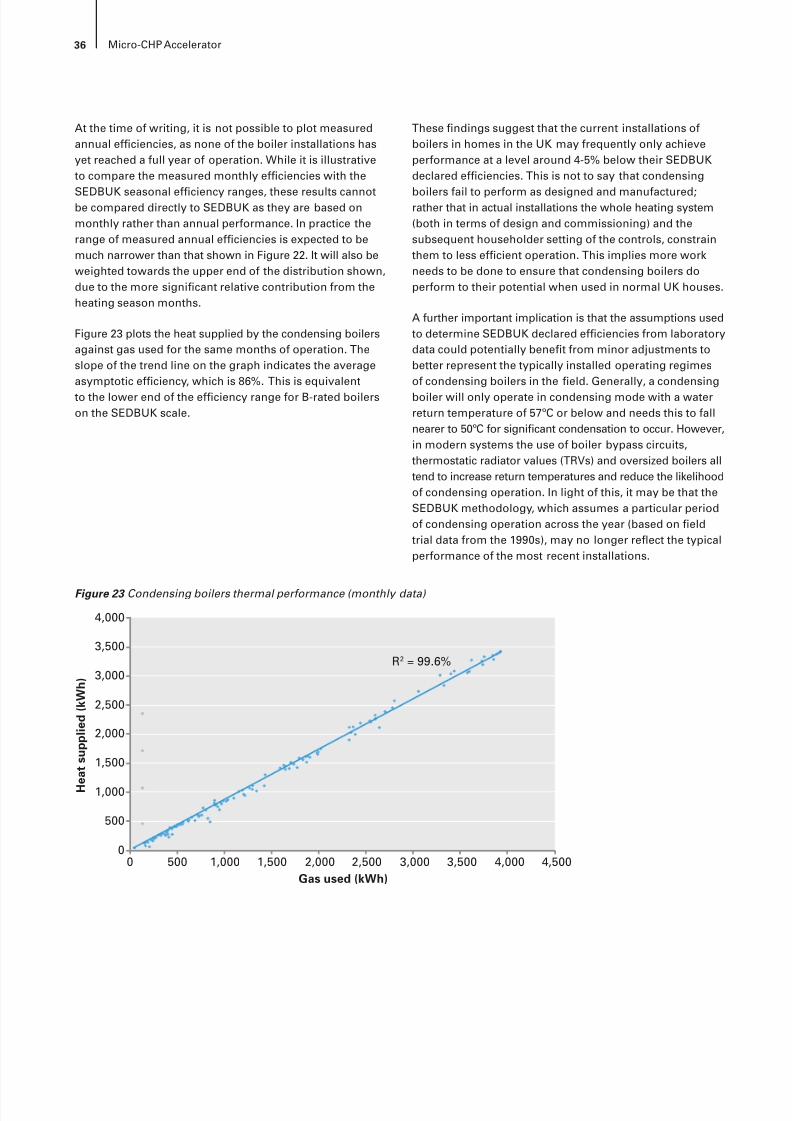
8/6/2019 CHP Accellerator
http://slidepdf.com/reader/full/chp-accellerator 38/104
36 Micro-CHP Accelerator
At the time of writing, it is not possible to plot measuredannual efciencies, as none of the boiler installations hasyet reached a full year of operation. While it is illustrativeto compare the measured monthly efciencies with the
SEDBUK seasonal efciency ranges, these results cannotbe compared directly to SEDBUK as they are based onmonthly rather than annual performance. In practice therange of measured annual efciencies is expected to bemuch narrower than that shown in Figure 22. It will also beweighted towards the upper end of the distribution shown,due to the more signicant relative contribution from theheating season months.
Figure 23 plots the heat supplied by the condensing boilersagainst gas used for the same months of operation. Theslope of the trend line on the graph indicates the averageasymptotic efciency, which is 86%. This is equivalentto the lower end of the efciency range for B-rated boilerson the SEDBUK scale.
These ndings suggest that the current installations ofboilers in homes in the UK may frequently only achieveperformance at a level around 4-5% below their SEDBUKdeclared efciencies. This is not to say that condensing
boilers fail to perform as designed and manufactured;rather that in actual installations the whole heating system(both in terms of design and commissioning) and thesubsequent householder setting of the controls, constrainthem to less efcient operation. This implies more workneeds to be done to ensure that condensing boilers doperform to their potential when used in normal UK houses.
A further important implication is that the assumptions usedto determine SEDBUK declared efciencies from laboratorydata could potentially benet from minor adjustments tobetter represent the typically installed operating regimesof condensing boilers in the eld. Generally, a condensingboiler will only operate in condensing mode with a waterreturn temperature of 57ºC or below and needs this to fallnearer to 50ºC for signicant condensation to occur. However,in modern systems the use of boiler bypass circuits,thermostatic radiator values (TRVs) and oversized boilers alltend to increase return temperatures and reduce the likelihoodof condensing operation. In light of this, it may be that theSEDBUK methodology, which assumes a particular periodof condensing operation across the year (based on eldtrial data from the 1990s), may no longer reect the typicalperformance of the most recent installations.
Figure 23 Condensing boilers thermal performance (monthly data)
4,000
3,500
3,000
2,500
2,000
1,500
1,000
500
00 500 1,000 1,500 2,000 2,500 3,000 3,500 4,000 4,500
H e a t s u p p l i e d
( k W h )
Gas used (kWh)
R2 = 99.6%
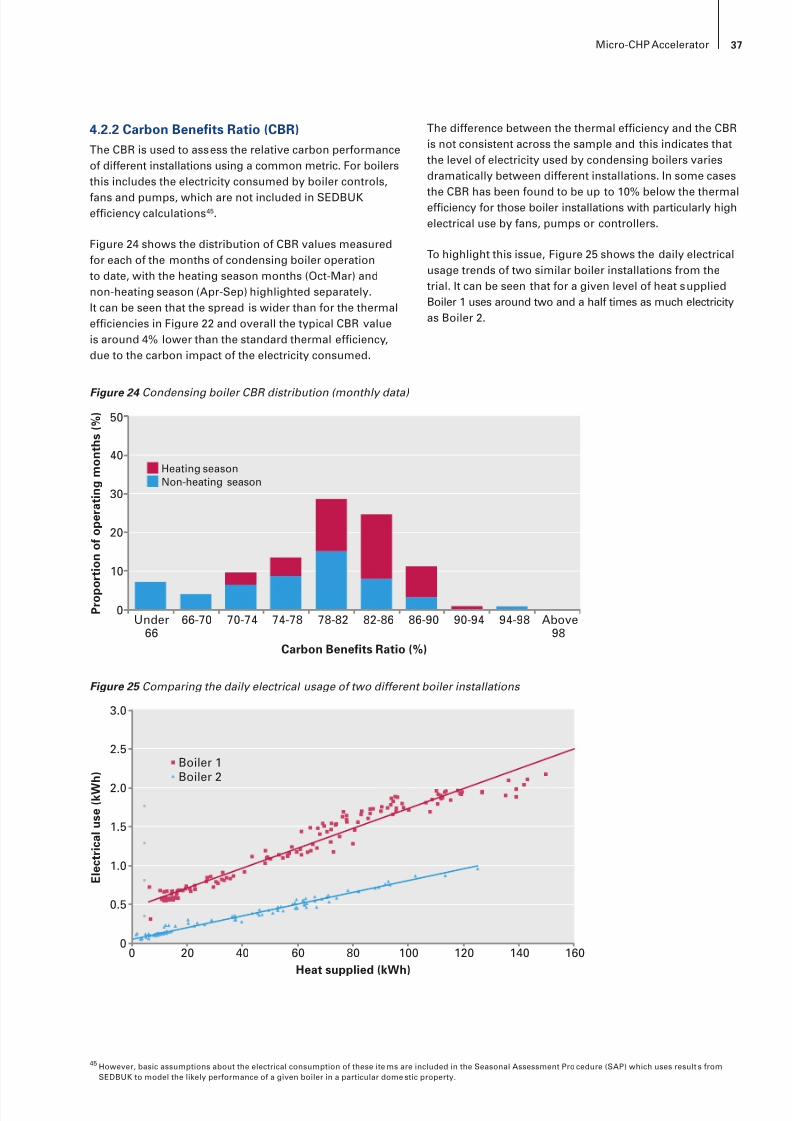
8/6/2019 CHP Accellerator
http://slidepdf.com/reader/full/chp-accellerator 39/104
37Micro-CHP Accelerator
4.2.2 Carbon Benets Ratio (CBR)The CBR is used to assess the relative carbon performanceof different installations using a common metric. For boilersthis includes the electricity consumed by boiler controls,
fans and pumps, which are not included in SEDBUKefciency calculations 45 .
Figure 24 shows the distribution of CBR values measuredfor each of the months of condensing boiler operationto date, with the heating season months (Oct-Mar) andnon-heating season (Apr-Sep) highlighted separately.It can be seen that the spread is wider than for the thermalefciencies in Figure 22 and overall the typical CBR valueis around 4% lower than the standard thermal efciency,due to the carbon impact of the electricity consumed.
The difference between the thermal efciency and the CBRis not consistent across the sample and this indicates thatthe level of electricity used by condensing boilers variesdramatically between different installations. In some cases
the CBR has been found to be up to 10% below the thermalefciency for those boiler installations with particularly highelectrical use by fans, pumps or controllers.
To highlight this issue, Figure 25 shows the daily electricalusage trends of two similar boiler installations from thetrial. It can be seen that for a given level of heat suppliedBoiler 1 uses around two and a half times as much electricityas Boiler 2.
Figure 24 Condensing boiler CBR distribution (monthly data)
Heating seasonNon-heating season
Carbon Benefits Ratio (%)
P r o p o r t i o n o f o p e r a t i n g m o n t h s
( % )
Under66
66-70 70-74 74-78 78-82 82-86 86-90 90-94 94-98 Above98
0
10
20
30
40
50
Figure 25 Comparing the daily electrical usage of two different boiler installations
3.0
2.5
2.0
1.5
1.0
0.5
00 20 40 60 80 100 120 140 160
E l e c t r i c a l u s e ( k W h )
Heat supplied (kWh)
Boiler 1Boiler 2
45 However, basic assumptions about the electrical consumption of these ite ms are included in the Seasonal Assessment Pro cedure (SAP) which uses result s fromSEDBUK to model the likely performance of a given boiler in a particular dome stic property.
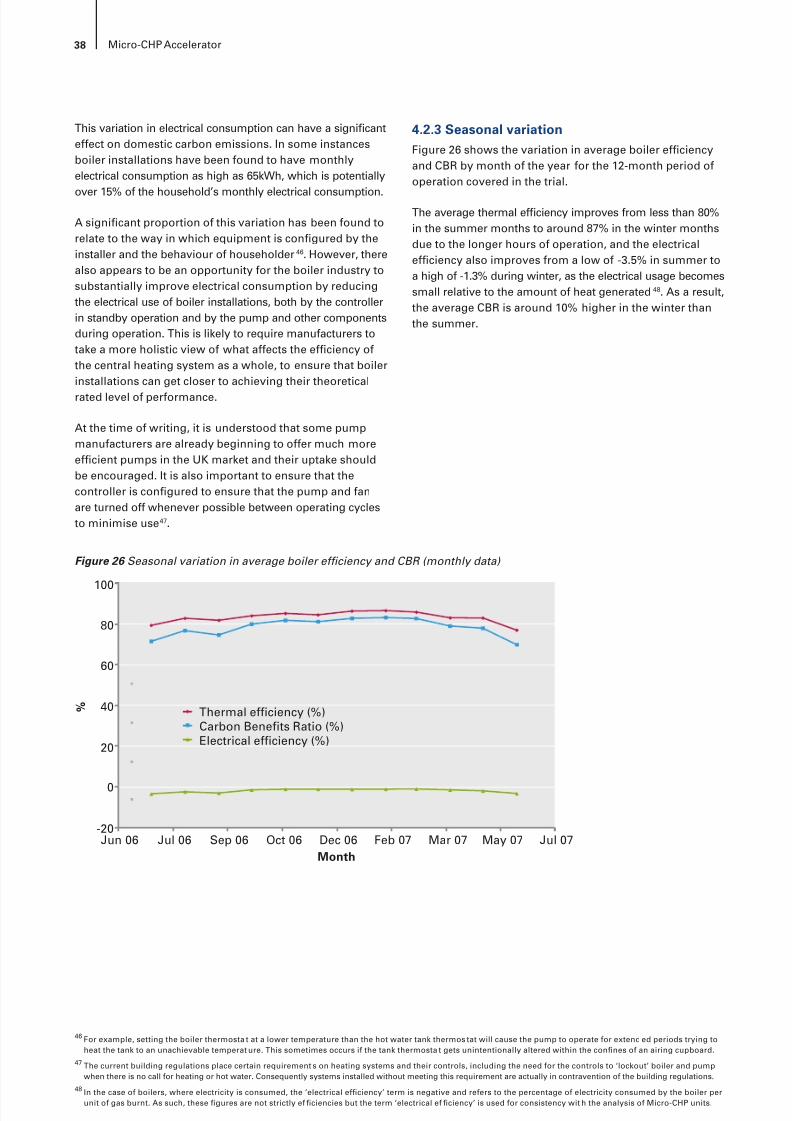
8/6/2019 CHP Accellerator
http://slidepdf.com/reader/full/chp-accellerator 40/104
38 Micro-CHP Accelerator
This variation in electrical consumption can have a signicanteffect on domestic carbon emissions. In some instancesboiler installations have been found to have monthlyelectrical consumption as high as 65kWh, which is potentially
over 15% of the household’s monthly electrical consumption.
A signicant proportion of this variation has been found torelate to the way in which equipment is congured by theinstaller and the behaviour of householder 46 . However, therealso appears to be an opportunity for the boiler industry tosubstantially improve electrical consumption by reducingthe electrical use of boiler installations, both by the controllerin standby operation and by the pump and other componentsduring operation. This is likely to require manufacturers totake a more holistic view of what affects the efciency ofthe central heating system as a whole, to ensure that boilerinstallations can get closer to achieving their theoreticalrated level of performance.
At the time of writing, it is understood that some pumpmanufacturers are already beginning to offer much moreefcient pumps in the UK market and their uptake shouldbe encouraged. It is also important to ensure that thecontroller is congured to ensure that the pump and fanare turned off whenever possible between operating cyclesto minimise use 47 .
4.2.3 Seasonal variationFigure 26 shows the variation in average boiler efciencyand CBR by month of the year for the 12-month period ofoperation covered in the trial.
The average thermal efciency improves from less than 80%in the summer months to around 87% in the winter monthsdue to the longer hours of operation, and the electricalefciency also improves from a low of -3.5% in summer toa high of -1.3% during winter, as the electrical usage becomessmall relative to the amount of heat generated 48 . As a result,the average CBR is around 10% higher in the winter thanthe summer.
46 For example, setting the boiler thermosta t at a lower temperature than the hot water tank thermos tat will cause the pump to operate for extend ed periods trying toheat the tank to an unachievable temperat ure. This sometimes occurs if the tank thermosta t gets unintentionally altered within the connes of an airing cupboard.
47 The current building regulations place certain requirement s on heating systems and their controls, including the need for the controls to ‘lockout’ boiler and pumpwhen there is no call for heating or hot water. Consequently systems installed without meeting this requirement are actually in contravention of the building regulations.
48 In the case of boilers, where electricity is consumed, the ‘electrical efciency’ term is negative and refers to the percentage of electricity consumed by the boiler perunit of gas burnt. As such, these gures are not strictly ef ciencies but the term ‘electrical ef ciency’ is used for consistency wit h the analysis of Micro-CHP units.
Figure 26 Seasonal variation in average boiler efciency and CBR (monthly data)
100
80
60
40
20
-20
0
Jun 06 Sep 06 Oct 06Jul 06 Dec 06 Feb 07 Mar 07 May 07 Jul 07
%
Month
Thermal efficiency (%)Carbon Benefits Ratio (%)Electrical efficiency (%)
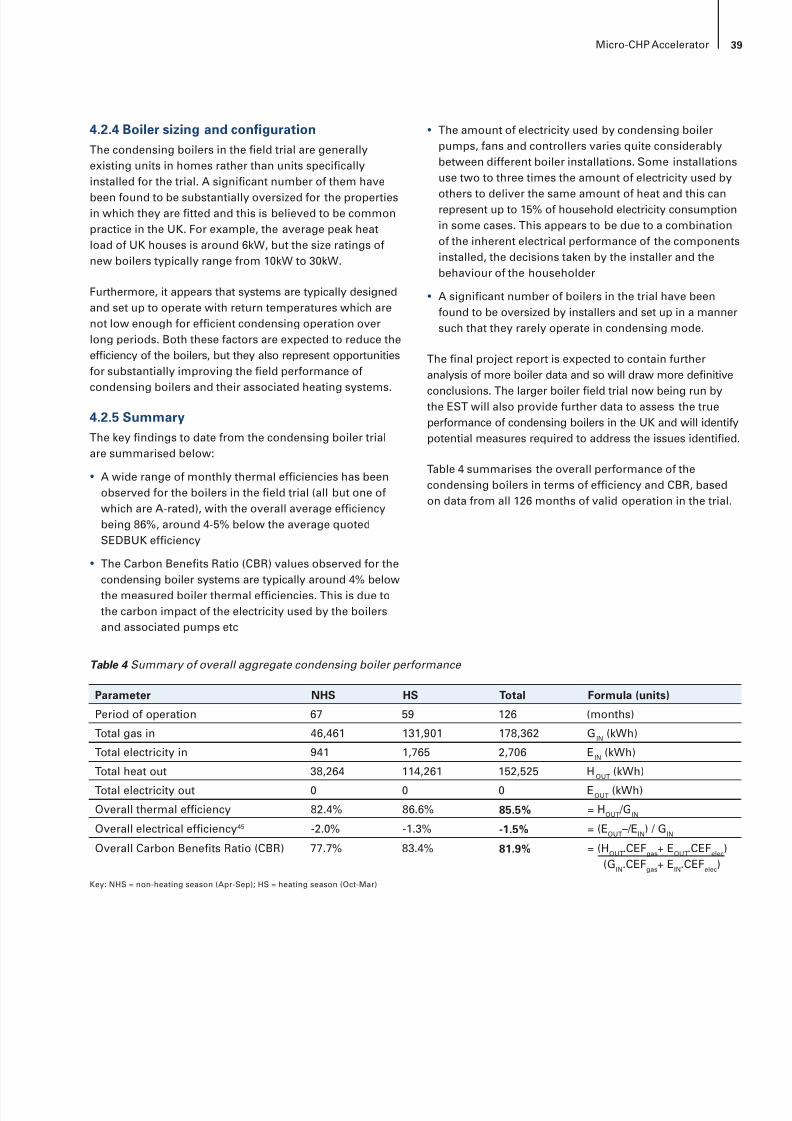
8/6/2019 CHP Accellerator
http://slidepdf.com/reader/full/chp-accellerator 41/104
39Micro-CHP Accelerator
4.2.4 Boiler sizing and congurationThe condensing boilers in the eld trial are generallyexisting units in homes rather than units specicallyinstalled for the trial. A signicant number of them have
been found to be substantially oversized for the propertiesin which they are tted and this is believed to be commonpractice in the UK. For example, the average peak heatload of UK houses is around 6kW, but the size ratings ofnew boilers typically range from 10kW to 30kW.
Furthermore, it appears that systems are typically designedand set up to operate with return temperatures which arenot low enough for efcient condensing operation overlong periods. Both these factors are expected to reduce theefciency of the boilers, but they also represent opportunitiesfor substantially improving the eld performance of
condensing boilers and their associated heating systems.
4.2.5 SummaryThe key ndings to date from the condensing boiler trialare summarised below:
• A wide range of monthly thermal efciencies has beenobserved for the boilers in the eld trial (all but one ofwhich are A-rated), with the overall average efciencybeing 86%, around 4-5% below the average quotedSEDBUK efciency
• The Carbon Benets Ratio (CBR) values observed for thecondensing boiler systems are typically around 4% belowthe measured boiler thermal efciencies. This is due tothe carbon impact of the electricity used by the boilersand associated pumps etc
• The amount of electricity used by condensing boilerpumps, fans and controllers varies quite considerablybetween different boiler installations. Some installationsuse two to three times the amount of electricity used by
others to deliver the same amount of heat and this canrepresent up to 15% of household electricity consumptionin some cases. This appears to be due to a combinationof the inherent electrical performance of the componentsinstalled, the decisions taken by the installer and thebehaviour of the householder
• A signicant number of boilers in the trial have beenfound to be oversized by installers and set up in a mannersuch that they rarely operate in condensing mode.
The nal project report is expected to contain furtheranalysis of more boiler data and so will draw more denitive
conclusions. The larger boiler eld trial now being run bythe EST will also provide further data to assess the trueperformance of condensing boilers in the UK and will identifypotential measures required to address the issues identied.
Table 4 summarises the overall performance of thecondensing boilers in terms of efciency and CBR, basedon data from all 126 months of valid operation in the trial.
Table 4 Summary of overall aggregate condensing boiler performance
Parameter NHS HS Total Formula (units)
Period of operation 67 59 126 (months)
Total gas in 46,461 131,901 178,362 G IN (kWh)
Total electricity in 941 1,765 2,706 E IN (kWh)
Total heat out 38,264 114,261 152,525 H OUT (kWh)
Total electricity out 0 0 0 E OUT (kWh)
Overall thermal efciency 82.4% 86.6% 85.5% = H OUT /G IN
Overall electrical efciency 45 -2.0% -1.3% -1.5% = (E OUT –/E IN) / G IN
Overall Carbon Benets Ratio (CBR) 77.7% 83.4% 81.9% = (H OUT.CEF gas + E OUT.CEF elec )(G IN.CEF gas + E IN.CEF elec )
Key: NHS = non-heating season (Apr-Sep); HS = heating season (Oct-Mar)
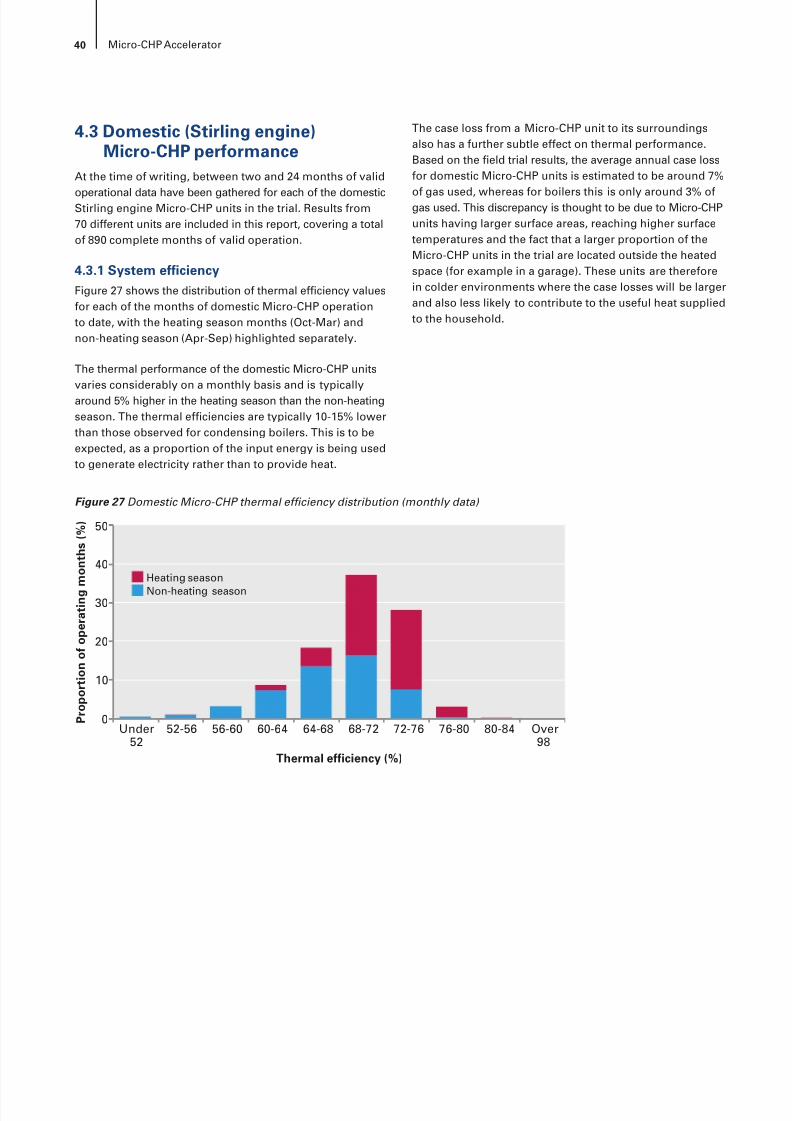
8/6/2019 CHP Accellerator
http://slidepdf.com/reader/full/chp-accellerator 42/104
40 Micro-CHP Accelerator
4.3 Domestic (Stirling engine)Micro-CHP performance
At the time of writing, between two and 24 months of valid
operational data have been gathered for each of the domesticStirling engine Micro-CHP units in the trial. Results from70 different units are included in this report, covering a totalof 890 complete months of valid operation.
4.3.1 System efciencyFigure 27 shows the distribution of thermal efciency valuesfor each of the months of domestic Micro-CHP operationto date, with the heating season months (Oct-Mar) andnon-heating season (Apr-Sep) highlighted separately.
The thermal performance of the domestic Micro-CHP unitsvaries considerably on a monthly basis and is typicallyaround 5% higher in the heating season than the non-heatingseason. The thermal efciencies are typically 10-15% lowerthan those observed for condensing boilers. This is to beexpected, as a proportion of the input energy is being usedto generate electricity rather than to provide heat.
The case loss from a Micro-CHP unit to its surroundingsalso has a further subtle effect on thermal performance.Based on the eld trial results, the average annual case lossfor domestic Micro-CHP units is estimated to be around 7%
of gas used, whereas for boilers this is only around 3% ofgas used. This discrepancy is thought to be due to Micro-CHPunits having larger surface areas, reaching higher surfacetemperatures and the fact that a larger proportion of theMicro-CHP units in the trial are located outside the heatedspace (for example in a garage). These units are thereforein colder environments where the case losses will be largerand also less likely to contribute to the useful heat suppliedto the household.
Figure 27 Domestic Micro-CHP thermal efciency distribution (monthly data)
Heating seasonNon-heating season
Thermal efficiency (%)
P r o p o r t i o n o f o p e r a t i n g m o n t h s
( % )
Under52
52-56 56-60 60-64 64-68 68-72 72-76 76-80 80-84 Over98
0
10
20
30
40
50
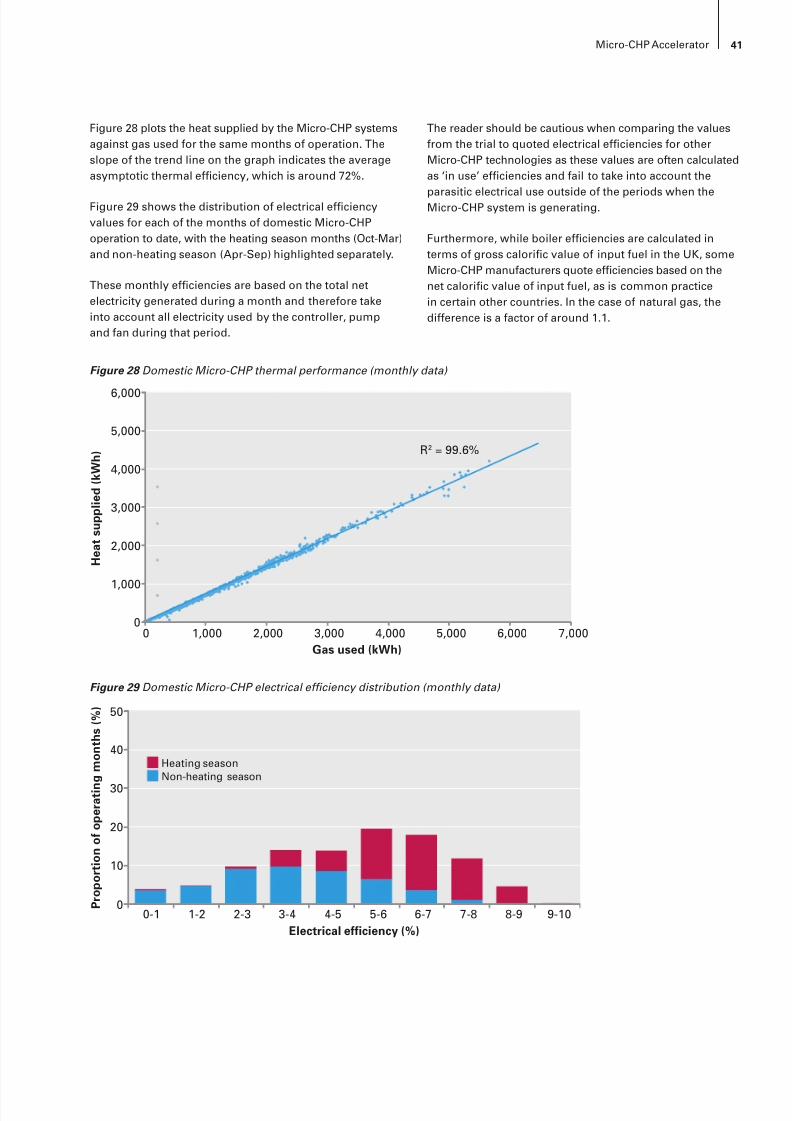
8/6/2019 CHP Accellerator
http://slidepdf.com/reader/full/chp-accellerator 43/104
41Micro-CHP Accelerator
Figure 28 plots the heat supplied by the Micro-CHP systemsagainst gas used for the same months of operation. Theslope of the trend line on the graph indicates the averageasymptotic thermal efciency, which is around 72%.
Figure 29 shows the distribution of electrical efciencyvalues for each of the months of domestic Micro-CHPoperation to date, with the heating season months (Oct-Mar)and non-heating season (Apr-Sep) highlighted separately.
These monthly efciencies are based on the total netelectricity generated during a month and therefore takeinto account all electricity used by the controller, pumpand fan during that period.
The reader should be cautious when comparing the valuesfrom the trial to quoted electrical efciencies for otherMicro-CHP technologies as these values are often calculatedas ‘in use’ efciencies and fail to take into account the
parasitic electrical use outside of the periods when theMicro-CHP system is generating.
Furthermore, while boiler efciencies are calculated interms of gross caloric value of input fuel in the UK, someMicro-CHP manufacturers quote efciencies based on thenet caloric value of input fuel, as is common practicein certain other countries. In the case of natural gas, thedifference is a factor of around 1.1.
Figure 28 Domestic Micro-CHP thermal performance (monthly data)
6,000
5,000
4,000
3,000
2,000
1,000
00 1,000 2,000 3,000 4,000 5,000 6,000 7,000
H e a t s u p p l i e d
( k W h )
Gas used (kWh)
R2 = 99.6%
Figure 29 Domestic Micro-CHP electrical efciency distribution (monthly data)
Heating seasonNon-heating season
Electrical efficiency (%)
P r o p o r t i o n o f o p e r a t i n g m o n t h s
( % )
0-1 1-2 2-3 3-4 4-5 5-6 6-7 7-8 8-9 9-100
10
20
30
40
50
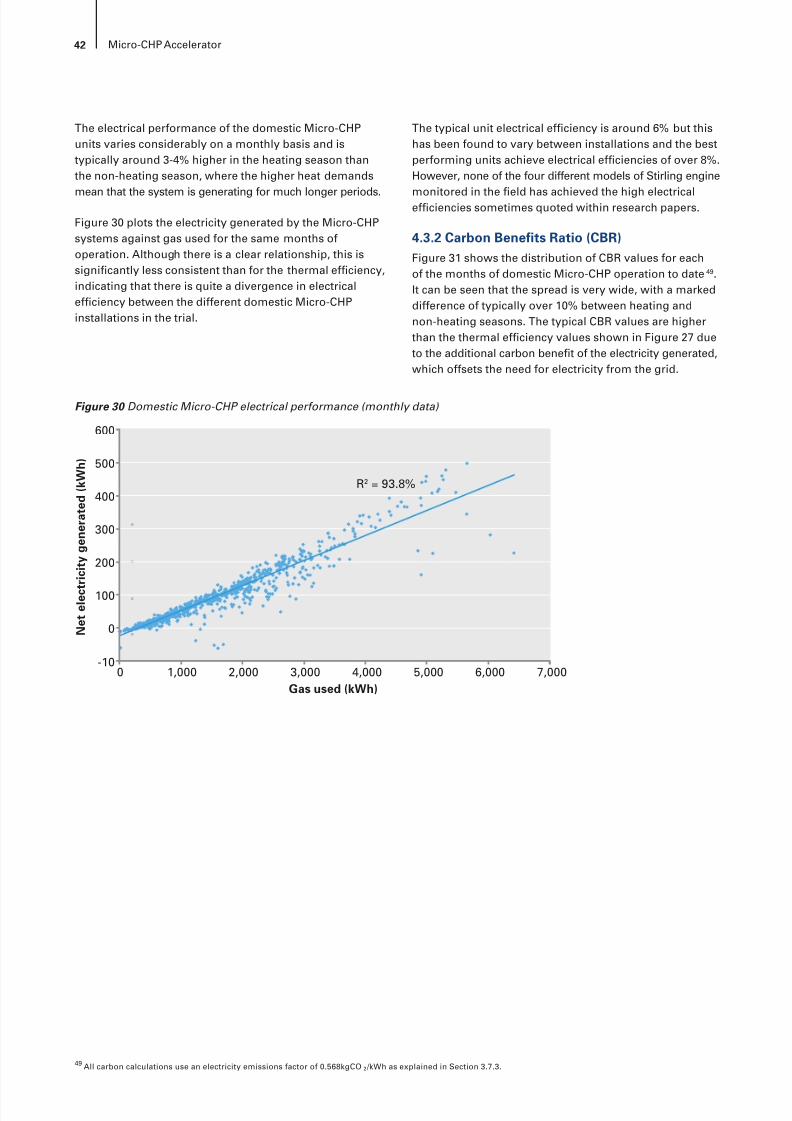
8/6/2019 CHP Accellerator
http://slidepdf.com/reader/full/chp-accellerator 44/104
42 Micro-CHP Accelerator
The electrical performance of the domestic Micro-CHPunits varies considerably on a monthly basis and istypically around 3-4% higher in the heating season thanthe non-heating season, where the higher heat demands
mean that the system is generating for much longer periods.
Figure 30 plots the electricity generated by the Micro-CHPsystems against gas used for the same months ofoperation. Although there is a clear relationship, this issignicantly less consistent than for the thermal efciency,indicating that there is quite a divergence in electricalefciency between the different domestic Micro-CHPinstallations in the trial.
The typical unit electrical efciency is around 6% but thishas been found to vary between installations and the bestperforming units achieve electrical efciencies of over 8%.However, none of the four different models of Stirling engine
monitored in the eld has achieved the high electricalefciencies sometimes quoted within research papers.
4.3.2 Carbon Benets Ratio (CBR)Figure 31 shows the distribution of CBR values for eachof the months of domestic Micro-CHP operation to date 49 .It can be seen that the spread is very wide, with a markeddifference of typically over 10% between heating andnon-heating seasons. The typical CBR values are higherthan the thermal efciency values shown in Figure 27 dueto the additional carbon benet of the electricity generated,which offsets the need for electricity from the grid.
Figure 30 Domestic Micro-CHP electrical performance (monthly data)
600
500
400
300
200
0
-100 1,000 2,000 3,000 4,000 5,000 6,000 7,000
100
N e t e l e c
t r i c i t y g e n e r a t e d
( k W h )
Gas used (kWh)
R2 = 93.8%
49 All carbon calculations use an electricity emissions factor of 0.568kgCO 2 /kWh as explained in Section 3.7.3.
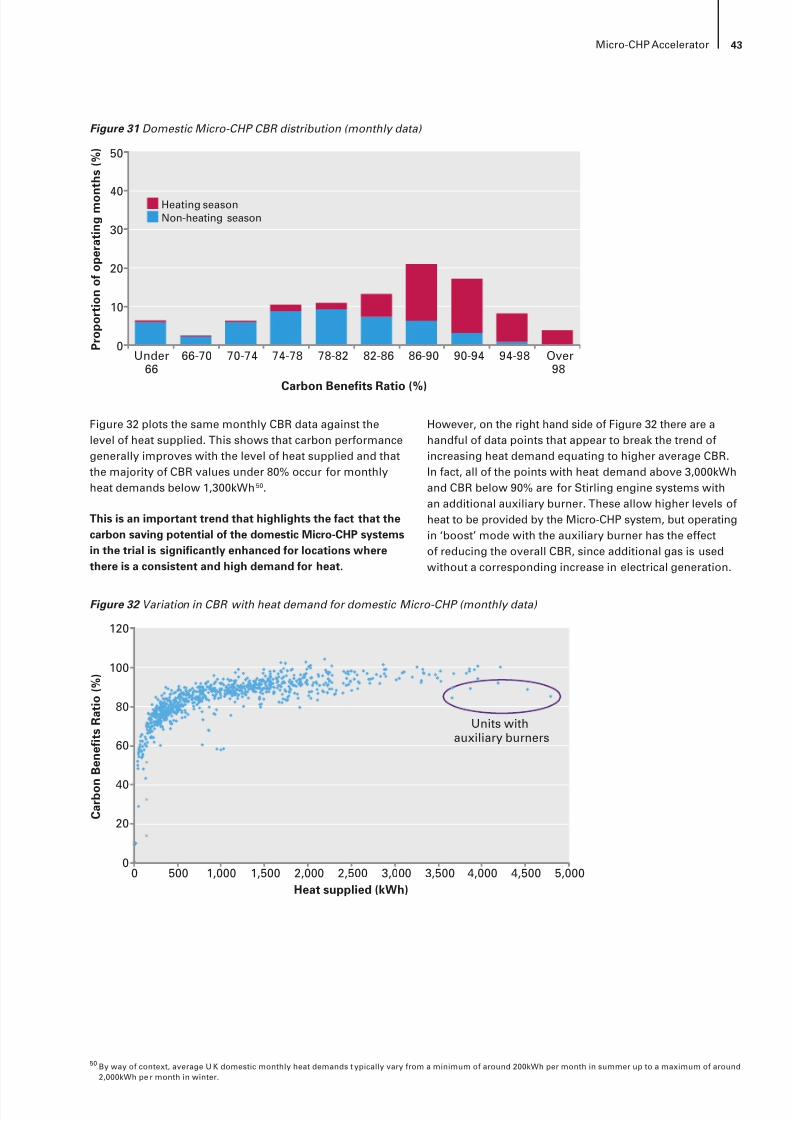
8/6/2019 CHP Accellerator
http://slidepdf.com/reader/full/chp-accellerator 45/104
43Micro-CHP Accelerator
Figure 32 plots the same monthly CBR data against thelevel of heat supplied. This shows that carbon performancegenerally improves with the level of heat supplied and thatthe majority of CBR values under 80% occur for monthlyheat demands below 1,300kWh 50 .
This is an important trend that highlights the fact that thecarbon saving potential of the domestic Micro-CHP systemsin the trial is signicantly enhanced for locations wherethere is a consistent and high demand for heat.
However, on the right hand side of Figure 32 there are ahandful of data points that appear to break the trend ofincreasing heat demand equating to higher average CBR.In fact, all of the points with heat demand above 3,000kWhand CBR below 90% are for Stirling engine systems withan additional auxiliary burner. These allow higher levels ofheat to be provided by the Micro-CHP system, but operatingin ‘boost’ mode with the auxiliary burner has the effectof reducing the overall CBR, since additional gas is usedwithout a corresponding increase in electrical generation.
Figure 31 Domestic Micro-CHP CBR distribution (monthly data)
Heating seasonNon-heating season
Carbon Benefits Ratio (%)
P r o p o r t i o n o f o p e r a t i n g m o n t h s
( % )
Under66
66-70 70-74 74-78 78-82 82-86 86-90 90-94 94-98 Over98
0
10
20
30
40
50
Figure 32 Variation in CBR with heat demand for domestic Micro-CHP (monthly data)
120
100
80
60
40
20
00 500 1,5001,000 2,000 2,500 3,000 3,500
Units withauxiliary burners
4,5004,000 5,000
C a r b o n
B e n e f i t s
R a t i o
( % )
Heat supplied (kWh)
50 By way of context, average U K domestic monthly heat demands t ypically vary from a minimum of around 200kWh per month in summer up to a maximum of around2,000kWh pe r month in winter.
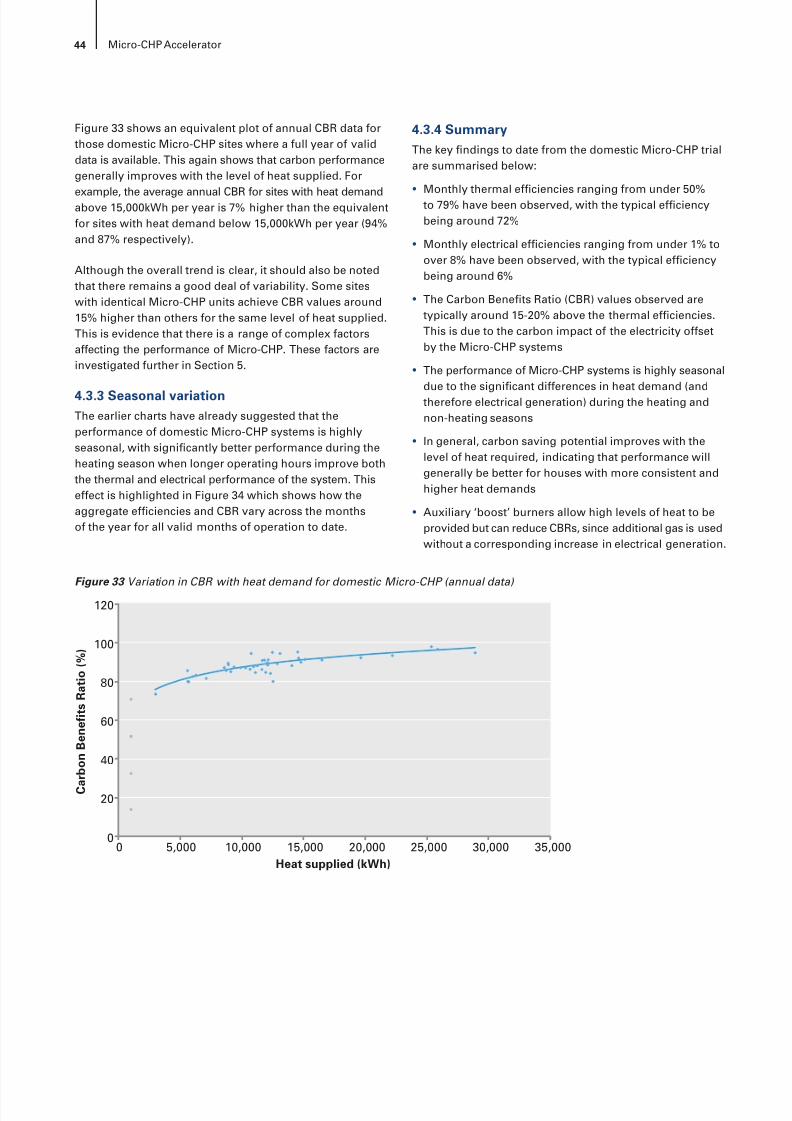
8/6/2019 CHP Accellerator
http://slidepdf.com/reader/full/chp-accellerator 46/104
44 Micro-CHP Accelerator
Figure 33 shows an equivalent plot of annual CBR data forthose domestic Micro-CHP sites where a full year of validdata is available. This again shows that carbon performancegenerally improves with the level of heat supplied. For
example, the average annual CBR for sites with heat demandabove 15,000kWh per year is 7% higher than the equivalentfor sites with heat demand below 15,000kWh per year (94%and 87% respectively).
Although the overall trend is clear, it should also be notedthat there remains a good deal of variability. Some siteswith identical Micro-CHP units achieve CBR values around15% higher than others for the same level of heat supplied.This is evidence that there is a range of complex factorsaffecting the performance of Micro-CHP. These factors areinvestigated further in Section 5.
4.3.3 Seasonal variationThe earlier charts have already suggested that theperformance of domestic Micro-CHP systems is highlyseasonal, with signicantly better performance during theheating season when longer operating hours improve boththe thermal and electrical performance of the system. Thiseffect is highlighted in Figure 34 which shows how theaggregate efciencies and CBR vary across the monthsof the year for all valid months of operation to date.
4.3.4 SummaryThe key ndings to date from the domestic Micro-CHP trialare summarised below:
• Monthly thermal efciencies ranging from under 50%to 79% have been observed, with the typical efciencybeing around 72%
• Monthly electrical efciencies ranging from under 1% toover 8% have been observed, with the typical efciencybeing around 6%
• The Carbon Benets Ratio (CBR) values observed aretypically around 15-20% above the thermal efciencies.This is due to the carbon impact of the electricity offsetby the Micro-CHP systems
• The performance of Micro-CHP systems is highly seasonaldue to the signicant differences in heat demand (andtherefore electrical generation) during the heating andnon-heating seasons
• In general, carbon saving potential improves with thelevel of heat required, indicating that performance willgenerally be better for houses with more consistent andhigher heat demands
• Auxiliary ‘boost’ burners allow high levels of heat to beprovided but can reduce CBRs, since additional gas is usedwithout a corresponding increase in electrical generation.
Figure 33 Variation in CBR with heat demand for domestic Micro-CHP (annual data)
120
100
80
60
20
00 5,000 10,000 15,000 20,000 25,000 30,000 35,000
40
C a r b o n
B e n e f i t s
R a t i o
( % )
Heat supplied (kWh)
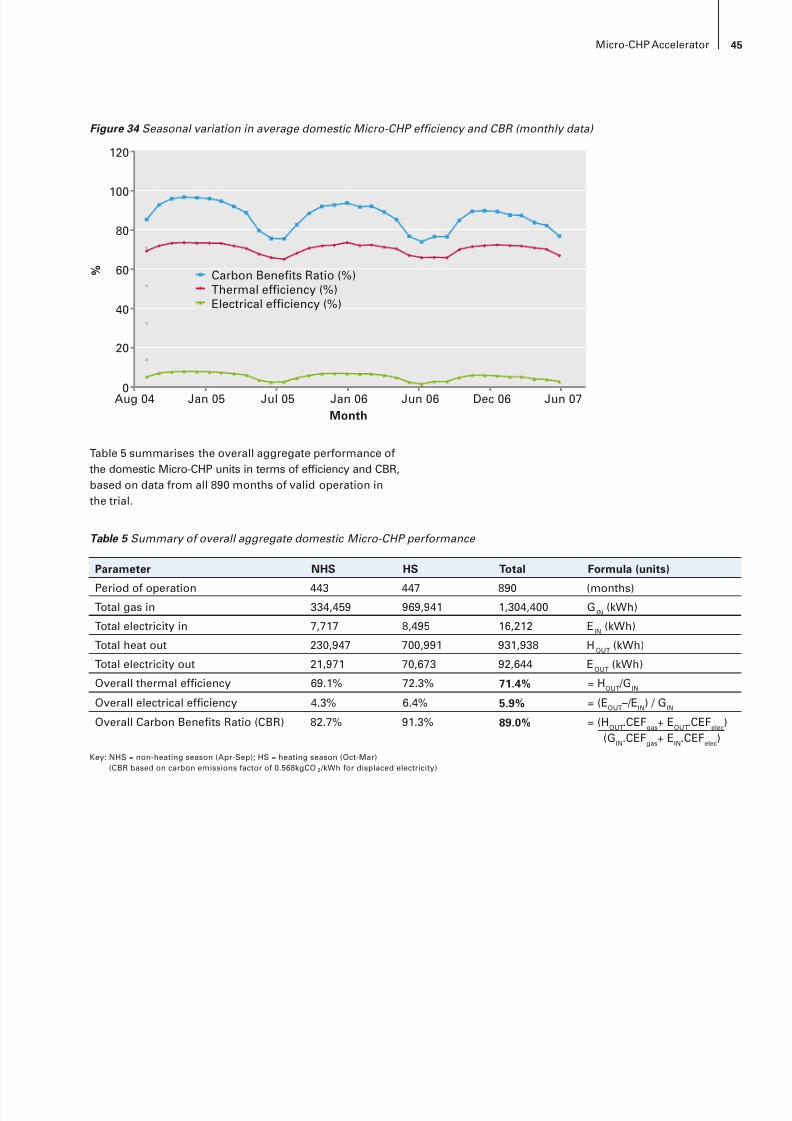
8/6/2019 CHP Accellerator
http://slidepdf.com/reader/full/chp-accellerator 47/104
45Micro-CHP Accelerator
Table 5 summarises the overall aggregate performance ofthe domestic Micro-CHP units in terms of efciency and CBR,based on data from all 890 months of valid operation inthe trial.
Figure 34 Seasonal variation in average domestic Micro-CHP efciency and CBR (monthly data)
120
100
80
60
40
0
20
Aug 04 Jul 05Jan 05 Jan 06 Jun 06 Dec 06 Jun 07
%
Month
Carbon Benefits Ratio (%)Thermal efficiency (%)Electrical efficiency (%)
Table 5 Summary of overall aggregate domestic Micro-CHP performance
Parameter NHS HS Total Formula (units)
Period of operation 443 447 890 (months)Total gas in 334,459 969,941 1,304,400 G IN (kWh)
Total electricity in 7,717 8,495 16,212 E IN (kWh)
Total heat out 230,947 700,991 931,938 H OUT (kWh)
Total electricity out 21,971 70,673 92,644 E OUT (kWh)
Overall thermal efciency 69.1% 72.3% 71.4% = H OUT /G IN
Overall electrical efciency 4.3% 6.4% 5.9% = (E OUT –/E IN) / G IN
Overall Carbon Benets Ratio (CBR) 82.7% 91.3% 89.0% = (H OUT.CEF gas + E OUT.CEF elec )(G IN.CEF gas + E IN.CEF elec )
Key: NHS = non-heating season (Apr-Sep); HS = heating season (Oct-Mar)(CBR based on carbon emissions factor of 0.568kgCO 2 /kWh for displaced electricity)
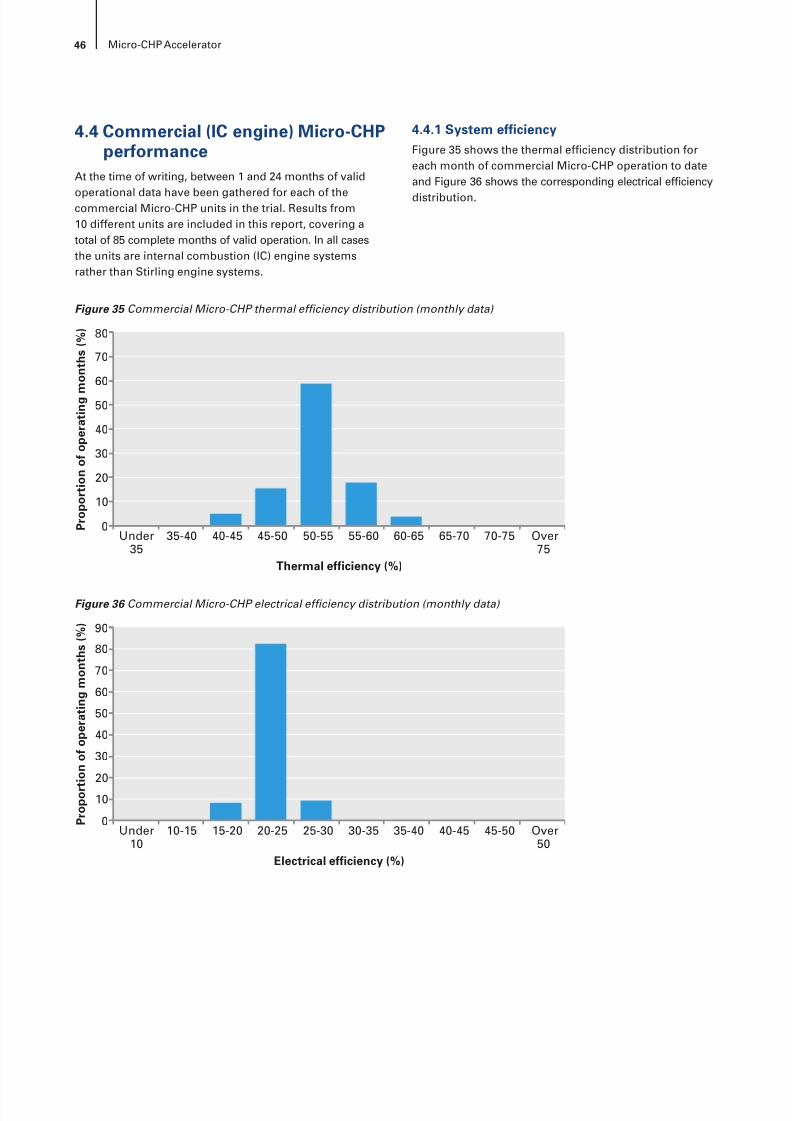
8/6/2019 CHP Accellerator
http://slidepdf.com/reader/full/chp-accellerator 48/104
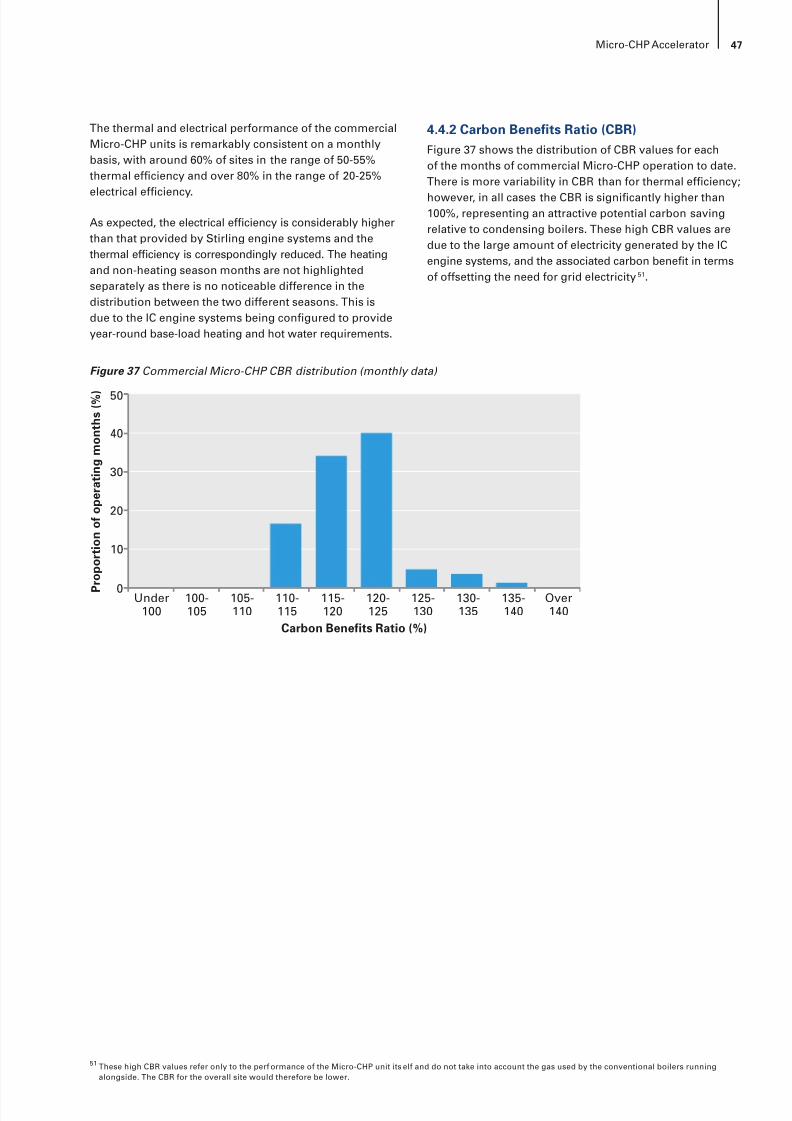
8/6/2019 CHP Accellerator
http://slidepdf.com/reader/full/chp-accellerator 49/104
47Micro-CHP Accelerator
The thermal and electrical performance of the commercialMicro-CHP units is remarkably consistent on a monthlybasis, with around 60% of sites in the range of 50-55%thermal efciency and over 80% in the range of 20-25%
electrical efciency.
As expected, the electrical efciency is considerably higherthan that provided by Stirling engine systems and thethermal efciency is correspondingly reduced. The heatingand non-heating season months are not highlightedseparately as there is no noticeable difference in thedistribution between the two different seasons. This isdue to the IC engine systems being congured to provideyear-round base-load heating and hot water requirements.
4.4.2 Carbon Benets Ratio (CBR)Figure 37 shows the distribution of CBR values for eachof the months of commercial Micro-CHP operation to date.There is more variability in CBR than for thermal efciency;
however, in all cases the CBR is signicantly higher than100%, representing an attractive potential carbon savingrelative to condensing boilers. These high CBR values aredue to the large amount of electricity generated by the ICengine systems, and the associated carbon benet in termsof offsetting the need for grid electricity 51 .
Figure 37 Commercial Micro-CHP CBR distribution (monthly data)
Carbon Benefits Ratio (%)
P r o p o r t i o n o f o p e r a t i n g m o n t h s
( % )
Under100
100-105
105-110
110-115
115-120
120-125
125-130
130-135
135-140
Over140
0
10
20
30
40
50
51 These high CBR values refer only to the perf ormance of the Micro-CHP unit its elf and do not take into account the gas used by the conventional boilers runningalongside. The CBR for the overall site would therefore be lower.
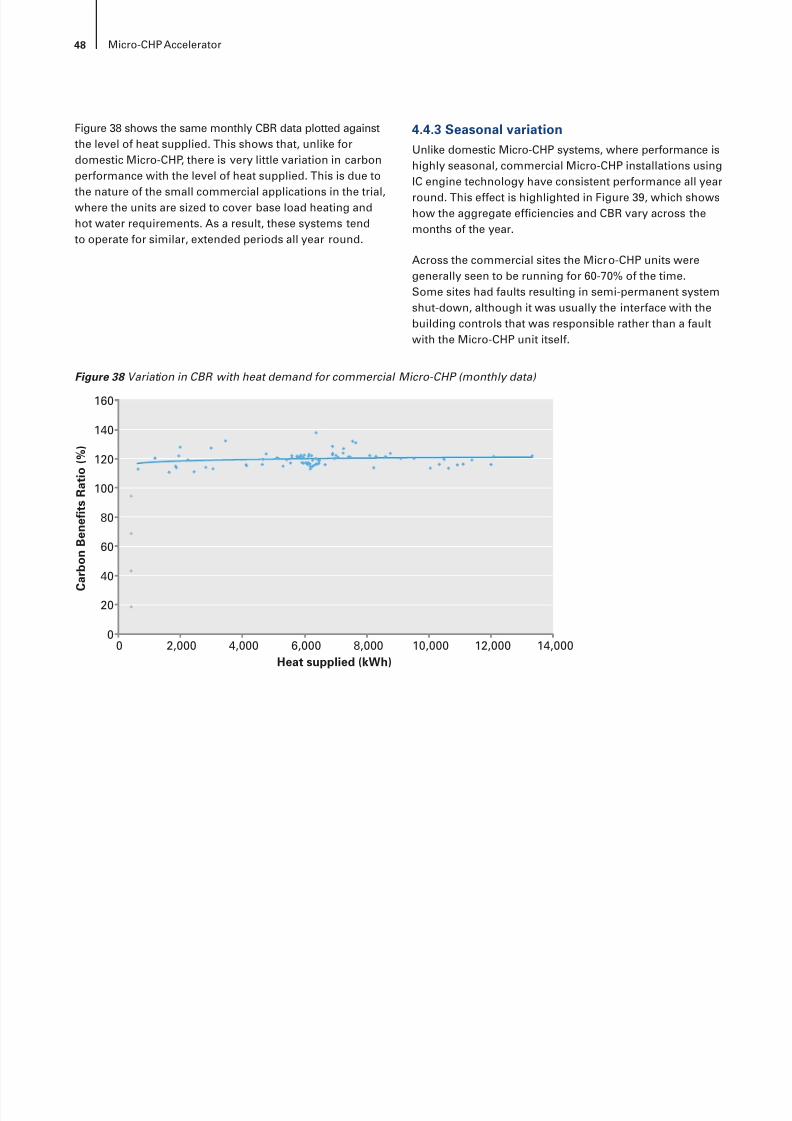
8/6/2019 CHP Accellerator
http://slidepdf.com/reader/full/chp-accellerator 50/104
48 Micro-CHP Accelerator
Figure 38 shows the same monthly CBR data plotted againstthe level of heat supplied. This shows that, unlike fordomestic Micro-CHP, there is very little variation in carbonperformance with the level of heat supplied. This is due to
the nature of the small commercial applications in the trial,where the units are sized to cover base load heating andhot water requirements. As a result, these systems tendto operate for similar, extended periods all year round.
4.4.3 Seasonal variationUnlike domestic Micro-CHP systems, where performance ishighly seasonal, commercial Micro-CHP installations usingIC engine technology have consistent performance all year
round. This effect is highlighted in Figure 39, which showshow the aggregate efciencies and CBR vary across themonths of the year.
Across the commercial sites the Micro-CHP units weregenerally seen to be running for 60-70% of the time.Some sites had faults resulting in semi-permanent systemshut-down, although it was usually the interface with thebuilding controls that was responsible rather than a faultwith the Micro-CHP unit itself.
Figure 38 Variation in CBR with heat demand for commercial Micro-CHP (monthly data)
160
140
120
80
20
00 2,000 4,000 6,000 8,000 10,000 12,000 14,000
100
60
40
C a r b o n
B e n e f i t s
R a t i o
( % )
Heat supplied (kWh)
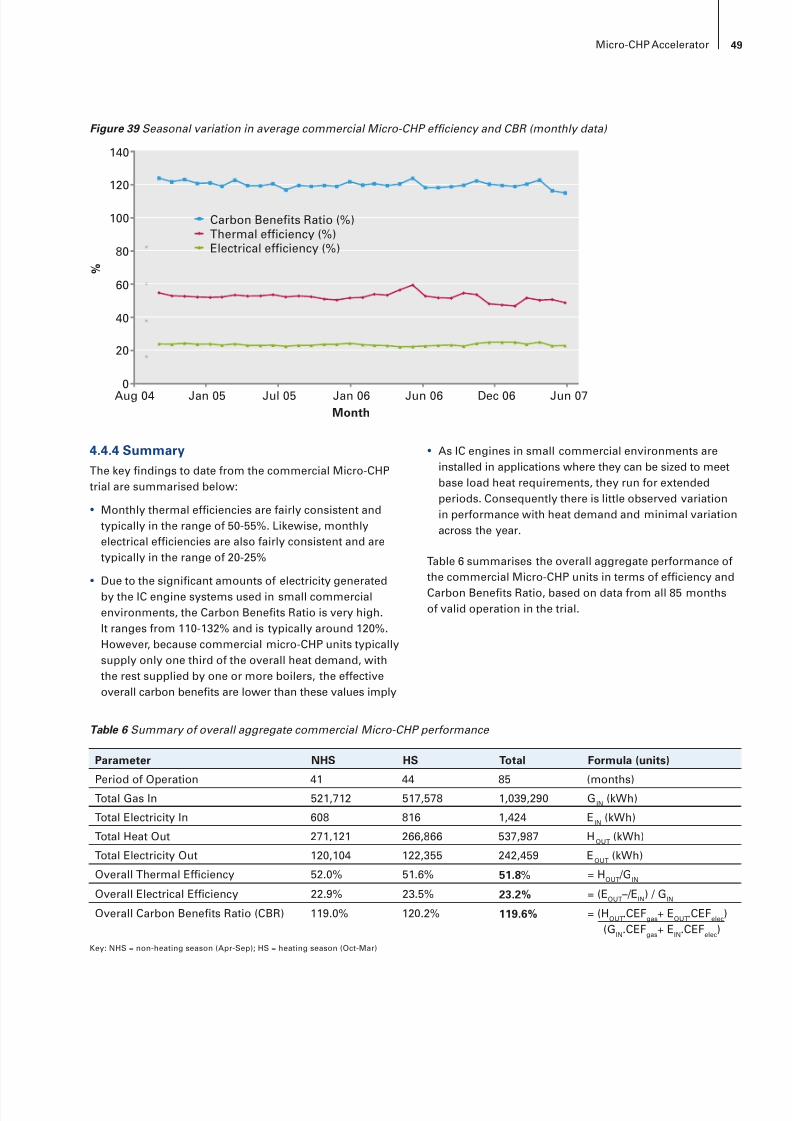
8/6/2019 CHP Accellerator
http://slidepdf.com/reader/full/chp-accellerator 51/104
49Micro-CHP Accelerator
4.4.4 SummaryThe key ndings to date from the commercial Micro-CHPtrial are summarised below:
• Monthly thermal efciencies are fairly consistent andtypically in the range of 50-55%. Likewise, monthlyelectrical efciencies are also fairly consistent and aretypically in the range of 20-25%
• Due to the signicant amounts of electricity generatedby the IC engine systems used in small commercialenvironments, the Carbon Benets Ratio is very high.It ranges from 110-132% and is typically around 120%.However, because commercial micro-CHP units typicallysupply only one third of the overall heat demand, withthe rest supplied by one or more boilers, the effectiveoverall carbon benets are lower than these values imply
• As IC engines in small commercial environments areinstalled in applications where they can be sized to meetbase load heat requirements, they run for extendedperiods. Consequently there is little observed variationin performance with heat demand and minimal variationacross the year.
Table 6 summarises the overall aggregate performance ofthe commercial Micro-CHP units in terms of efciency andCarbon Benets Ratio, based on data from all 85 monthsof valid operation in the trial.
Figure 39 Seasonal variation in average commercial Micro-CHP efciency and CBR (monthly data)
140
120
100
80
60
0
20
Aug 04 Jul 05Jan 05 Jan 06 Jun 06 Dec 06 Jun 07
40
%
Month
Carbon Benefits Ratio (%)Thermal efficiency (%)Electrical efficiency (%)
Table 6 Summary of overall aggregate commercial Micro-CHP performance
Parameter NHS HS Total Formula (units)
Period of Operation 41 44 85 (months)
Total Gas In 521,712 517,578 1,039,290 G IN (kWh)
Total Electricity In 608 816 1,424 E IN (kWh)
Total Heat Out 271,121 266,866 537,987 H OUT (kWh)
Total Electricity Out 120,104 122,355 242,459 E OUT (kWh)
Overall Thermal Efciency 52.0% 51.6% 51.8 % = H OUT /G IN
Overall Electrical Efciency 22.9% 23.5% 23.2% = (E OUT –/E IN) / G IN
Overall Carbon Benets Ratio (CBR) 119.0% 120.2% 119.6% = (H OUT.CEF gas + E OUT.CEF elec )(G IN.CEF gas + E IN.CEF elec )
Key: NHS = non-heating season (Apr-Sep); HS = heating season (Oct-Mar)
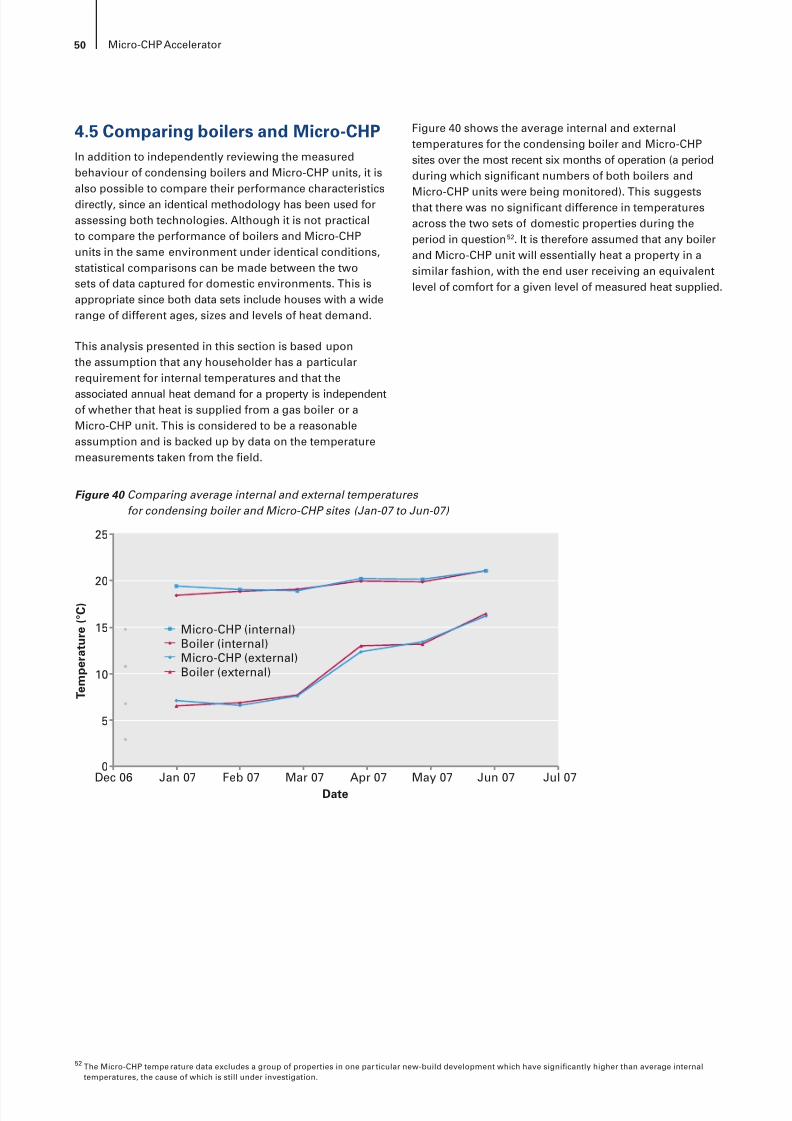
8/6/2019 CHP Accellerator
http://slidepdf.com/reader/full/chp-accellerator 52/104
50 Micro-CHP Accelerator
4.5 Comparing boilers and Micro-CHPIn addition to independently reviewing the measuredbehaviour of condensing boilers and Micro-CHP units, it isalso possible to compare their performance characteristicsdirectly, since an identical methodology has been used forassessing both technologies. Although it is not practicalto compare the performance of boilers and Micro-CHPunits in the same environment under identical conditions,statistical comparisons can be made between the twosets of data captured for domestic environments. This isappropriate since both data sets include houses with a widerange of different ages, sizes and levels of heat demand.
This analysis presented in this section is based uponthe assumption that any householder has a particularrequirement for internal temperatures and that the
associated annual heat demand for a property is independentof whether that heat is supplied from a gas boiler or aMicro-CHP unit. This is considered to be a reasonableassumption and is backed up by data on the temperaturemeasurements taken from the eld.
Figure 40 shows the average internal and externaltemperatures for the condensing boiler and Micro-CHPsites over the most recent six months of operation (a periodduring which signicant numbers of both boilers and
Micro-CHP units were being monitored). This suggeststhat there was no signicant difference in temperaturesacross the two sets of domestic properties during theperiod in question 52 . It is therefore assumed that any boilerand Micro-CHP unit will essentially heat a property in asimilar fashion, with the end user receiving an equivalentlevel of comfort for a given level of measured heat supplied.
Figure 40 Comparing average internal and external temperatures for condensing boiler and Micro-CHP sites (Jan-07 to Jun-07)
25
20
15
10
0Dec 06 Feb 07Jan 07 Mar 07 Apr 07 May 07 Jun 07 Jul 07
5
T e m p e r a t u r e
( ° C )
Date
Micro-CHP (internal)Boiler (internal)Micro-CHP (external)Boiler (external)
52 The Micro-CHP tempe rature data excludes a group of properties in one par ticular new-build development which have signicantly higher than average internaltemperatures, the cause of which is still under investigation.
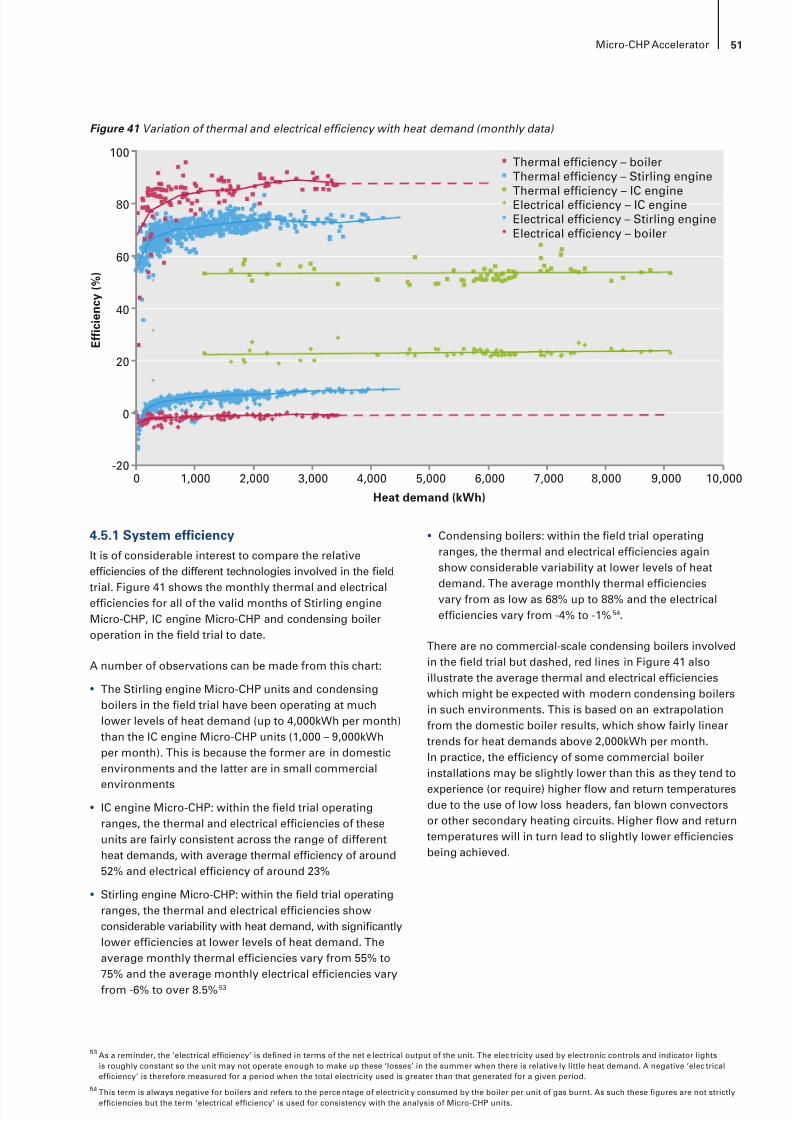
8/6/2019 CHP Accellerator
http://slidepdf.com/reader/full/chp-accellerator 53/104
51Micro-CHP Accelerator
4.5.1 System efciencyIt is of considerable interest to compare the relativeefciencies of the different technologies involved in the eld
trial. Figure 41 shows the monthly thermal and electricalefciencies for all of the valid months of Stirling engineMicro-CHP, IC engine Micro-CHP and condensing boileroperation in the eld trial to date.
A number of observations can be made from this chart:
• The Stirling engine Micro-CHP units and condensingboilers in the eld trial have been operating at muchlower levels of heat demand (up to 4,000kWh per month)than the IC engine Micro-CHP units (1,000 – 9,000kWhper month). This is because the former are in domesticenvironments and the latter are in small commercial
environments
• IC engine Micro-CHP: within the eld trial operatingranges, the thermal and electrical efciencies of theseunits are fairly consistent across the range of differentheat demands, with average thermal efciency of around52% and electrical efciency of around 23%
• Stirling engine Micro-CHP: within the eld trial operatingranges, the thermal and electrical efciencies showconsiderable variability with heat demand, with signicantlylower efciencies at lower levels of heat demand. Theaverage monthly thermal efciencies vary from 55% to75% and the average monthly electrical efciencies varyfrom -6% to over 8.5% 53
• Condensing boilers: within the eld trial operatingranges, the thermal and electrical efciencies againshow considerable variability at lower levels of heat
demand. The average monthly thermal efcienciesvary from as low as 68% up to 88% and the electricalefciencies vary from -4% to -1% 54 .
There are no commercial-scale condensing boilers involvedin the eld trial but dashed, red lines in Figure 41 alsoillustrate the average thermal and electrical efciencieswhich might be expected with modern condensing boilersin such environments. This is based on an extrapolationfrom the domestic boiler results, which show fairly lineartrends for heat demands above 2,000kWh per month.In practice, the efciency of some commercial boilerinstallations may be slightly lower than this as they tend to
experience (or require) higher ow and return temperaturesdue to the use of low loss headers, fan blown convectorsor other secondary heating circuits. Higher ow and returntemperatures will in turn lead to slightly lower efcienciesbeing achieved.
Figure 41 Variation of thermal and electrical efciency with heat demand (monthly data)
100
80
60
40
-200 3,0001,000 2,000 4,000 5,000 6,000 7,000 9,0008,000 10,000
20
0
E f f i c i e n c y ( % )
Heat demand (kWh)
Thermal efficiency – boilerThermal efficiency – Stirling engine
Thermal efficiency – IC engineElectrical efficiency – IC engineElectrical efficiency – Stirling engineElectrical efficiency – boiler
53 As a reminder, the ‘electrical efciency’ is dened in terms of the net e lectrical output of the unit. The elec tricity used by electronic controls and indicator lightsis roughly constant so the unit may not operate enough to make up these ‘losses’ in the summer when there is relative ly little heat demand. A negative ‘elec tricalefciency’ is therefore measured for a period when the total electricity used is greater than that generated for a given period.
54 This term is always negative for boilers and refers to the perce ntage of electricit y consumed by the boiler per unit of gas burnt. As such these gures are not strictlyefciencies but the term ‘electrical efciency’ is used for consistency with the analysis of Micro-CHP units.
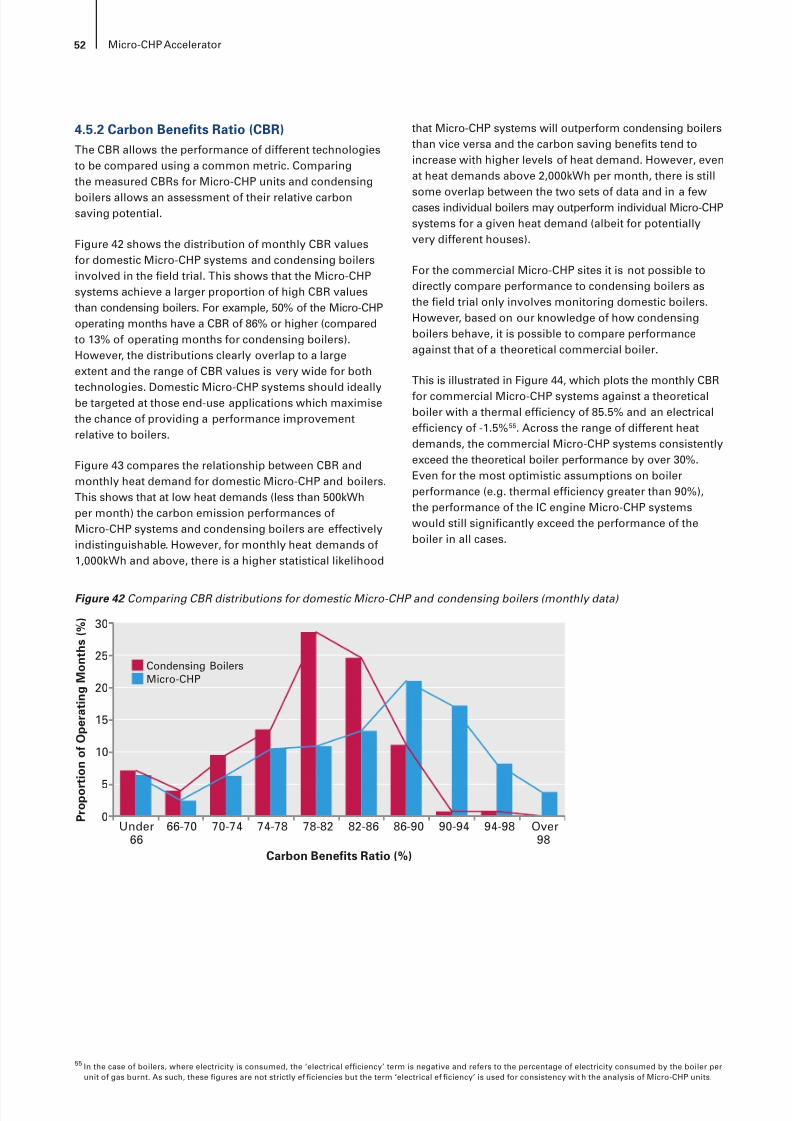
8/6/2019 CHP Accellerator
http://slidepdf.com/reader/full/chp-accellerator 54/104
52 Micro-CHP Accelerator
4.5.2 Carbon Benets Ratio (CBR)The CBR allows the performance of different technologiesto be compared using a common metric. Comparingthe measured CBRs for Micro-CHP units and condensing
boilers allows an assessment of their relative carbonsaving potential.
Figure 42 shows the distribution of monthly CBR valuesfor domestic Micro-CHP systems and condensing boilersinvolved in the eld trial. This shows that the Micro-CHPsystems achieve a larger proportion of high CBR valuesthan condensing boilers. For example, 50% of the Micro-CHPoperating months have a CBR of 86% or higher (comparedto 13% of operating months for condensing boilers).However, the distributions clearly overlap to a largeextent and the range of CBR values is very wide for both
technologies. Domestic Micro-CHP systems should ideallybe targeted at those end-use applications which maximisethe chance of providing a performance improvementrelative to boilers.
Figure 43 compares the relationship between CBR andmonthly heat demand for domestic Micro-CHP and boilers.This shows that at low heat demands (less than 500kWhper month) the carbon emission performances ofMicro-CHP systems and condensing boilers are effectivelyindistinguishable. However, for monthly heat demands of1,000kWh and above, there is a higher statistical likelihood
that Micro-CHP systems will outperform condensing boilersthan vice versa and the carbon saving benets tend toincrease with higher levels of heat demand. However, evenat heat demands above 2,000kWh per month, there is still
some overlap between the two sets of data and in a fewcases individual boilers may outperform individual Micro-CHPsystems for a given heat demand (albeit for potentiallyvery different houses).
For the commercial Micro-CHP sites it is not possible todirectly compare performance to condensing boilers asthe eld trial only involves monitoring domestic boilers.However, based on our knowledge of how condensingboilers behave, it is possible to compare performanceagainst that of a theoretical commercial boiler.
This is illustrated in Figure 44, which plots the monthly CBR
for commercial Micro-CHP systems against a theoreticalboiler with a thermal efciency of 85.5% and an electricalefciency of -1.5% 55 . Across the range of different heatdemands, the commercial Micro-CHP systems consistentlyexceed the theoretical boiler performance by over 30%.Even for the most optimistic assumptions on boilerperformance (e.g. thermal efciency greater than 90%),the performance of the IC engine Micro-CHP systemswould still signicantly exceed the performance of theboiler in all cases.
Figure 42 Comparing CBR distributions for domestic Micro-CHP and condensing boilers (monthly data)
Condensing BoilersMicro-CHP
Carbon Benefits Ratio (%)
P r o p o r t i o n o f O p e r a t i n g
M o n t h s
( % )
Under66
66-70 70-74 74-78 78-82 82-86 86-90 90-94 94-98 Over98
0
5
10
15
20
25
30
55 In the case of boilers, where electricity is consumed, the ‘electrical efciency’ term is negative and refers to the percentage of electricity consumed by the boiler perunit of gas burnt. As such, these gures are not strictly ef ciencies but the term ‘electrical ef ciency’ is used for consistency wit h the analysis of Micro-CHP units.
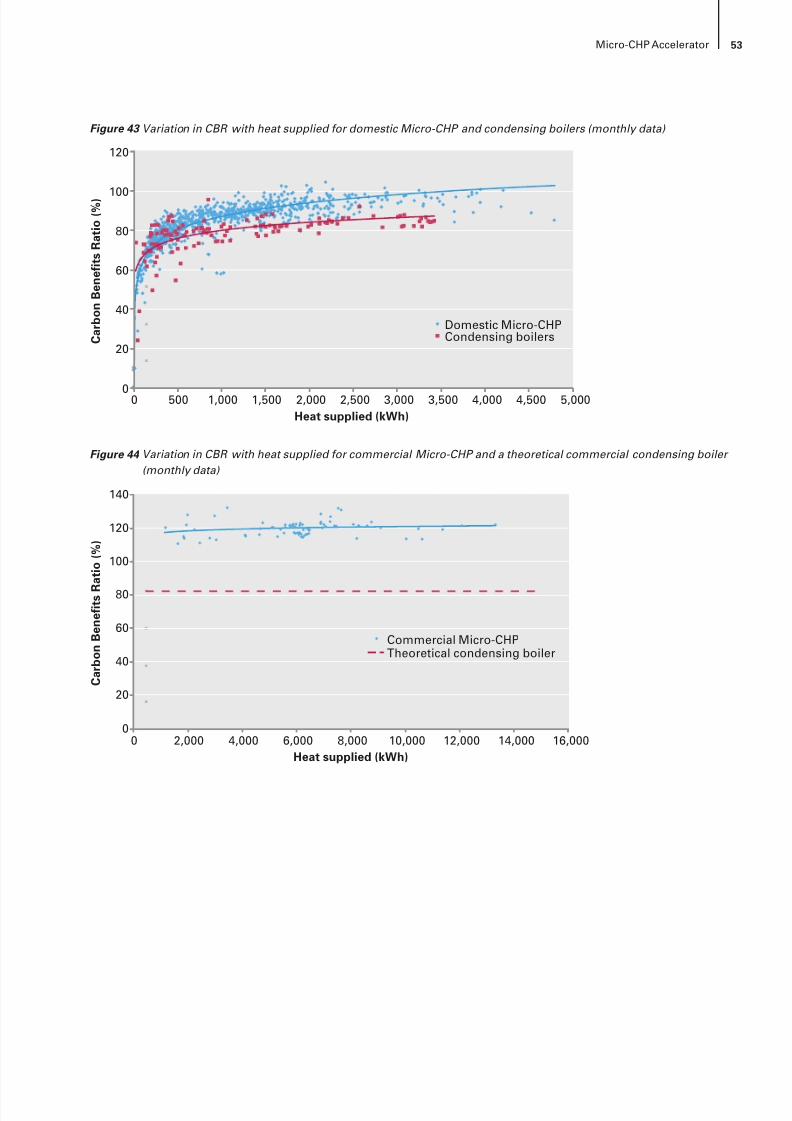
8/6/2019 CHP Accellerator
http://slidepdf.com/reader/full/chp-accellerator 55/104
53Micro-CHP Accelerator
Figure 43 Variation in CBR with heat supplied for domestic Micro-CHP and condensing boilers (monthly data)
120
100
80
60
20
0 0 500 1,000 1,500 2,000 2,500 3,000 3,500 4,000 4,500 5,000
40
C a r b o n
B e n e f i t s
R a t i o
( % )
Heat supplied (kWh)
Domestic Micro-CHPCondensing boilers
Figure 44 Variation in CBR with heat supplied for commercial Micro-CHP and a theoretical commercial condensing boiler (monthly data)
140
120
100
80
20
00 2,000 4,000 6,000 8,000 10,000 12,000 14,000 16,000
40
60
C a r b o n
B e n e f i t s R a t i o
( % )
Heat supplied (kWh)
Commercial Micro-CHPTheoretical condensing boiler
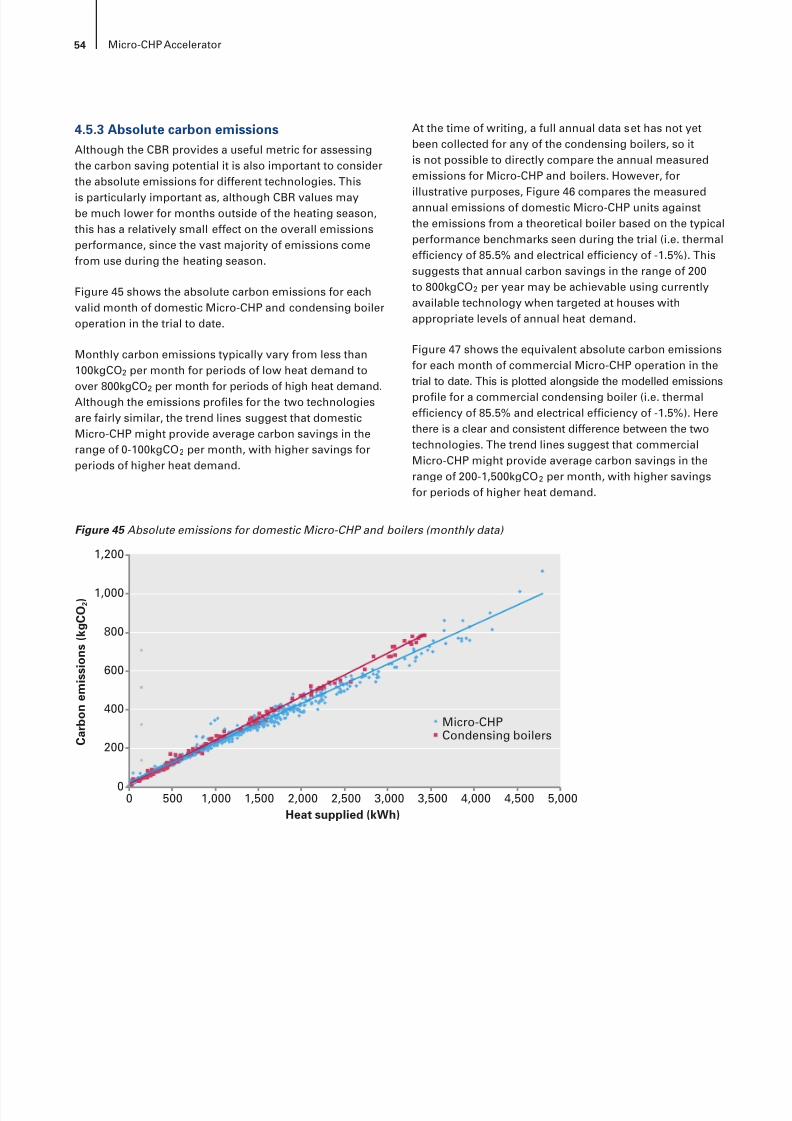
8/6/2019 CHP Accellerator
http://slidepdf.com/reader/full/chp-accellerator 56/104
54 Micro-CHP Accelerator
4.5.3 Absolute carbon emissionsAlthough the CBR provides a useful metric for assessingthe carbon saving potential it is also important to considerthe absolute emissions for different technologies. This
is particularly important as, although CBR values maybe much lower for months outside of the heating season,this has a relatively small effect on the overall emissionsperformance, since the vast majority of emissions comefrom use during the heating season.
Figure 45 shows the absolute carbon emissions for eachvalid month of domestic Micro-CHP and condensing boileroperation in the trial to date.
Monthly carbon emissions typically vary from less than100kgCO 2 per month for periods of low heat demand toover 800kgCO 2 per month for periods of high heat demand.Although the emissions proles for the two technologiesare fairly similar, the trend lines suggest that domesticMicro-CHP might provide average carbon savings in therange of 0-100kgCO 2 per month, with higher savings forperiods of higher heat demand.
At the time of writing, a full annual data set has not yetbeen collected for any of the condensing boilers, so itis not possible to directly compare the annual measuredemissions for Micro-CHP and boilers. However, for
illustrative purposes, Figure 46 compares the measuredannual emissions of domestic Micro-CHP units againstthe emissions from a theoretical boiler based on the typicalperformance benchmarks seen during the trial (i.e. thermalefciency of 85.5% and electrical efciency of -1.5%). Thissuggests that annual carbon savings in the range of 200to 800kgCO 2 per year may be achievable using currentlyavailable technology when targeted at houses withappropriate levels of annual heat demand.
Figure 47 shows the equivalent absolute carbon emissionsfor each month of commercial Micro-CHP operation in thetrial to date. This is plotted alongside the modelled emissionsprole for a commercial condensing boiler (i.e. thermalefciency of 85.5% and electrical efciency of -1.5%). Herethere is a clear and consistent difference between the twotechnologies. The trend lines suggest that commercialMicro-CHP might provide average carbon savings in therange of 200-1,500kgCO 2 per month, with higher savingsfor periods of higher heat demand.
Figure 45 Absolute emissions for domestic Micro-CHP and boilers (monthly data)
1,200
1,000
800
600
200
00 500 1,000 1,500 2,000 2,500 3,000 3,500 4,000 4,500 5,000
400
C a r b o n e m
i s s i o n s ( k g C O
2 )
Heat supplied (kWh)
Micro-CHPCondensing boilers
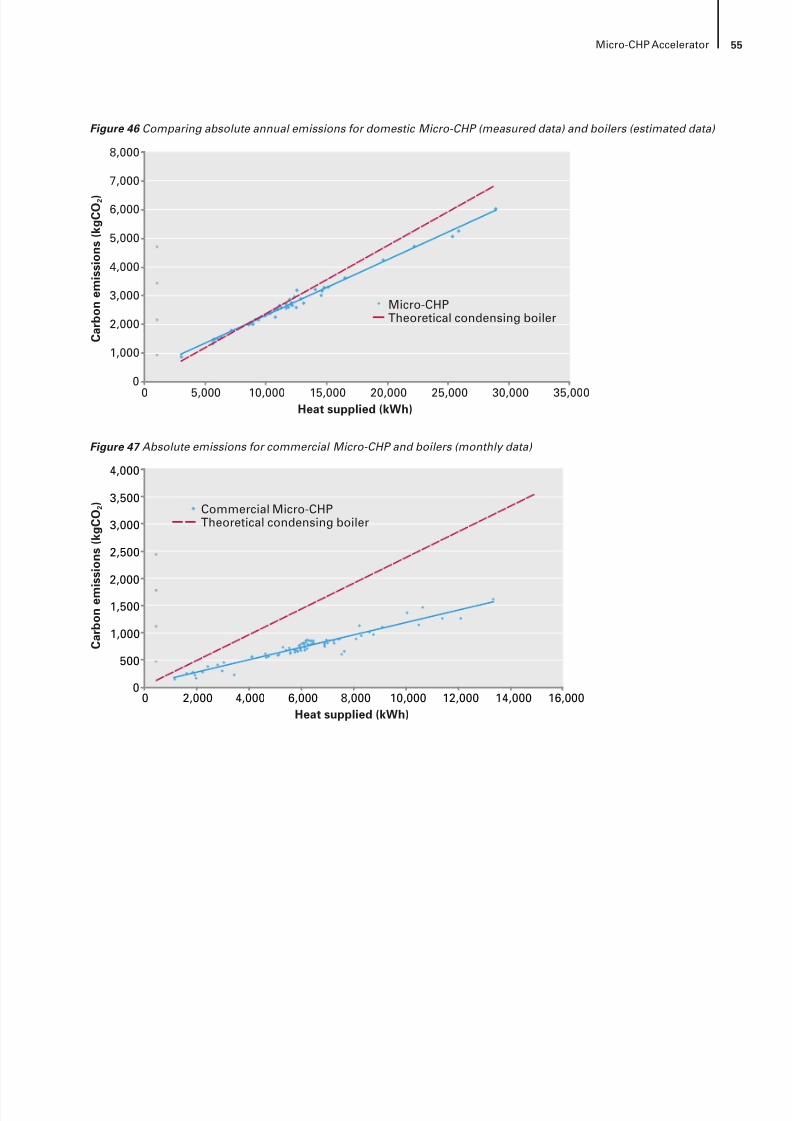
8/6/2019 CHP Accellerator
http://slidepdf.com/reader/full/chp-accellerator 57/104
55Micro-CHP Accelerator
Figure 46 Comparing absolute annual emissions for domestic Micro-CHP (measured data) and boilers (estimated data)
8,000
7,000
5,000
4,000
2,000
00 5,000 10,000 15,000 20,000 25,000 30,000 35,000
6,000
1,000
3,000
C a r b o n e m
i s s i o n s ( k g C O
2 )
Heat supplied (kWh)
Micro-CHPTheoretical condensing boiler
Figure 47 Absolute emissions for commercial Micro-CHP and boilers (monthly data)
C a r b o n e m
i s s i o n s ( k g C O
2 )
Heat supplied (kWh)
0
500
1,000
1,500
2,000
2,500
3,000
3,500
4,000
0 2,000 4,000 6,000 8,000 10,000 12,000 14,000 16,000
Commercial Micro-CHPTheoretical condensing boiler
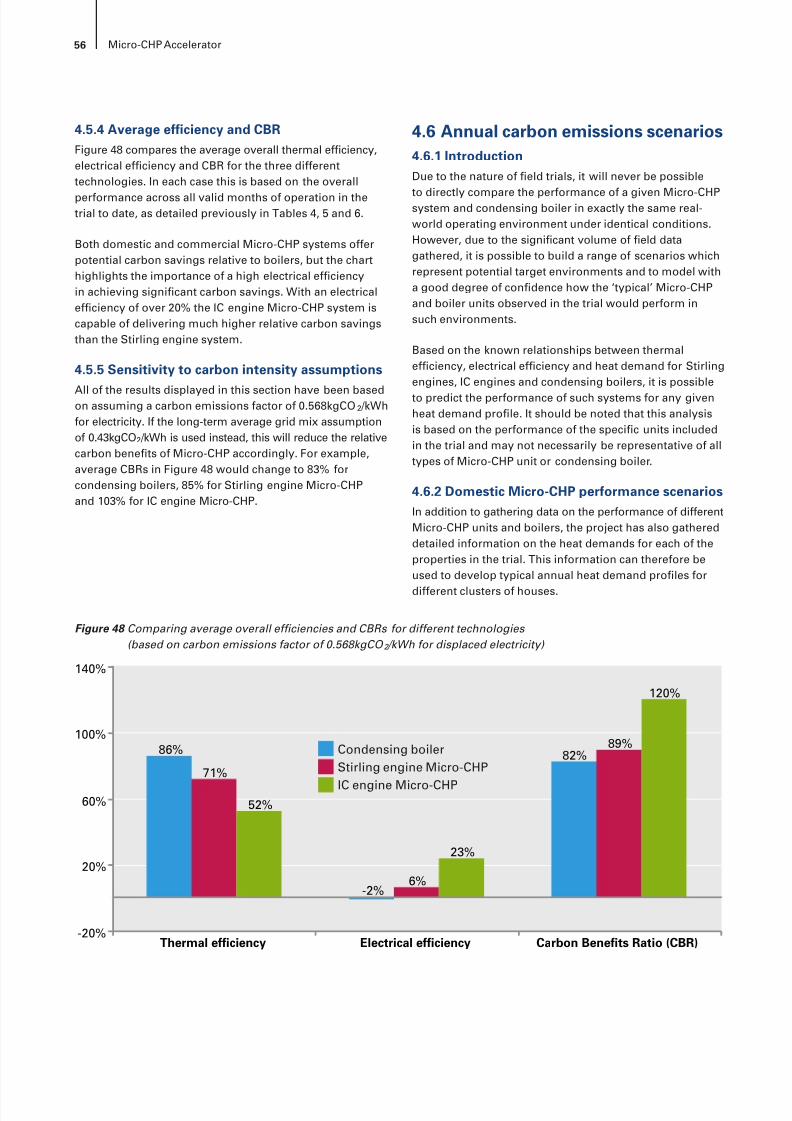
8/6/2019 CHP Accellerator
http://slidepdf.com/reader/full/chp-accellerator 58/104
56 Micro-CHP Accelerator
4.5.4 Average efciency and CBRFigure 48 compares the average overall thermal efciency,electrical efciency and CBR for the three differenttechnologies. In each case this is based on the overall
performance across all valid months of operation in thetrial to date, as detailed previously in Tables 4, 5 and 6.
Both domestic and commercial Micro-CHP systems offerpotential carbon savings relative to boilers, but the charthighlights the importance of a high electrical efciencyin achieving signicant carbon savings. With an electricalefciency of over 20% the IC engine Micro-CHP system iscapable of delivering much higher relative carbon savingsthan the Stirling engine system.
4.5.5 Sensitivity to carbon intensity assumptions
All of the results displayed in this section have been basedon assuming a carbon emissions factor of 0.568kgCO 2 /kWhfor electricity. If the long-term average grid mix assumptionof 0.43kgCO 2 /kWh is used instead, this will reduce the relativecarbon benets of Micro-CHP accordingly. For example,average CBRs in Figure 48 would change to 83% forcondensing boilers, 85% for Stirling engine Micro-CHPand 103% for IC engine Micro-CHP.
4.6 Annual carbon emissions scenarios4.6.1 IntroductionDue to the nature of eld trials, it will never be possible
to directly compare the performance of a given Micro-CHPsystem and condensing boiler in exactly the same real-world operating environment under identical conditions.However, due to the signicant volume of eld datagathered, it is possible to build a range of scenarios whichrepresent potential target environments and to model witha good degree of condence how the ‘typical’ Micro-CHPand boiler units observed in the trial would perform insuch environments.
Based on the known relationships between thermalefciency, electrical efciency and heat demand for Stirlingengines, IC engines and condensing boilers, it is possibleto predict the performance of such systems for any givenheat demand prole. It should be noted that this analysisis based on the performance of the specic units includedin the trial and may not necessarily be representative of alltypes of Micro-CHP unit or condensing boiler.
4.6.2 Domestic Micro-CHP performance scenariosIn addition to gathering data on the performance of differentMicro-CHP units and boilers, the project has also gathereddetailed information on the heat demands for each of theproperties in the trial. This information can therefore beused to develop typical annual heat demand proles for
different clusters of houses.
Figure 48 Comparing average overall efciencies and CBRs for different technologies (based on carbon emissions factor of 0.568kgCO 2 /kWh for displaced electricity)
Condensing boilerStirling engine Micro-CHP
IC engine Micro-CHP
86%
-2%
82%71%
6%
89%
52%
23%
120%
Thermal efficiency Electrical efficiency Carbon Benefits Ratio (CBR)-20%
20%
60%
100%
140%
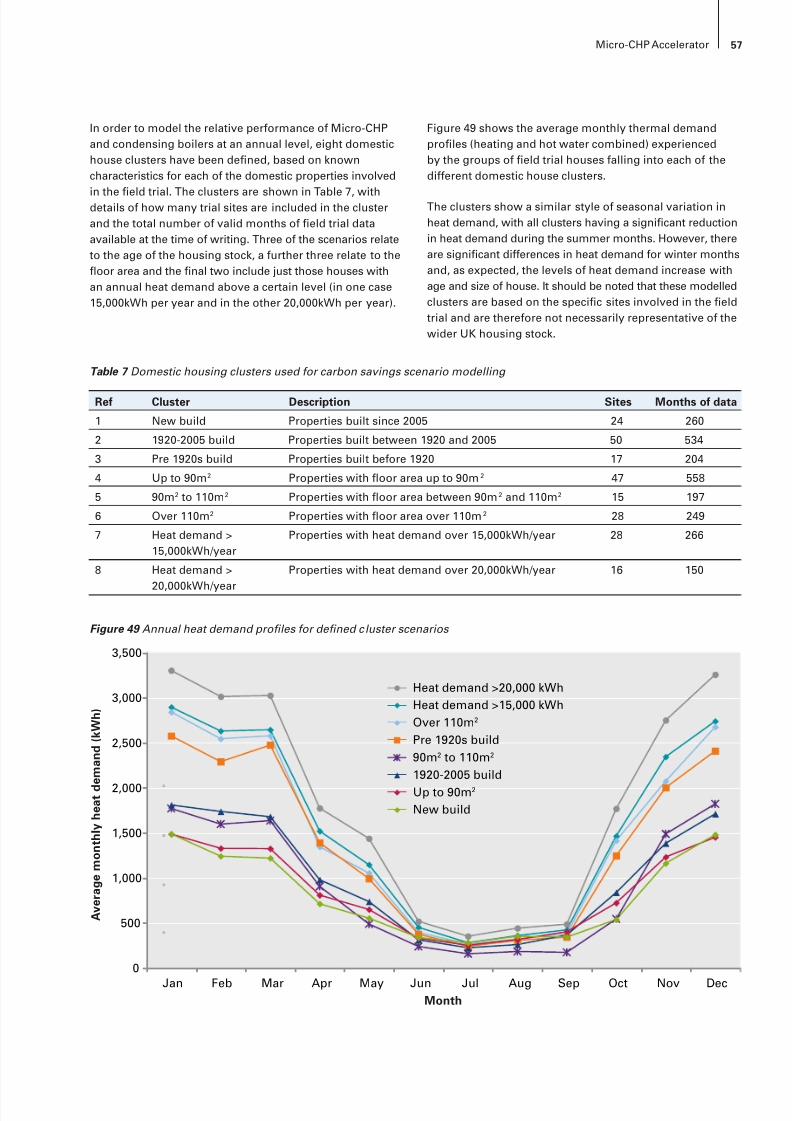
8/6/2019 CHP Accellerator
http://slidepdf.com/reader/full/chp-accellerator 59/104
57Micro-CHP Accelerator
In order to model the relative performance of Micro-CHPand condensing boilers at an annual level, eight domestichouse clusters have been dened, based on knowncharacteristics for each of the domestic properties involved
in the eld trial. The clusters are shown in Table 7, withdetails of how many trial sites are included in the clusterand the total number of valid months of eld trial dataavailable at the time of writing. Three of the scenarios relateto the age of the housing stock, a further three relate to theoor area and the nal two include just those houses withan annual heat demand above a certain level (in one case15,000kWh per year and in the other 20,000kWh per year).
Figure 49 shows the average monthly thermal demandproles (heating and hot water combined) experiencedby the groups of eld trial houses falling into each of thedifferent domestic house clusters.
The clusters show a similar style of seasonal variation inheat demand, with all clusters having a signicant reductionin heat demand during the summer months. However, thereare signicant differences in heat demand for winter monthsand, as expected, the levels of heat demand increase withage and size of house. It should be noted that these modelledclusters are based on the specic sites involved in the eldtrial and are therefore not necessarily representative of thewider UK housing stock.
Ref Cluster Description Sites Months of data
1 New build Properties built since 2005 24 260
2 1920-2005 build Properties built between 1920 and 2005 50 534
3 Pre 1920s build Properties built before 1920 17 204
4 Up to 90m 2 Properties with oor area up to 90m 2 47 558
5 90m 2 to 110m 2 Properties with oor area between 90m 2 and 110m 2 15 197
6 Over 110m 2 Properties with oor area over 110m 2 28 249
7 Heat demand >15,000kWh/year
Properties with heat demand over 15,000kWh/year 28 266
8 Heat demand >
20,000kWh/year
Properties with heat demand over 20,000kWh/year 16 150
Table 7 Domestic housing clusters used for carbon savings scenario modelling
Figure 49 Annual heat demand proles for dened cluster scenarios
A v e r a g e m o n t h l y
h e a t d e m a n d
( k W h )
Month
0
500
1,000
1,500
2,000
2,500
3,000
3,500
Jan Feb Mar Apr May Jun Jul Aug Sep Oct Nov Dec
Heat demand >20,000 kWhHeat demand >15,000 kWhOver 110m 2
Pre 1920s build90m 2 to 110m 2
1920-2005 buildUp to 90m 2
New build
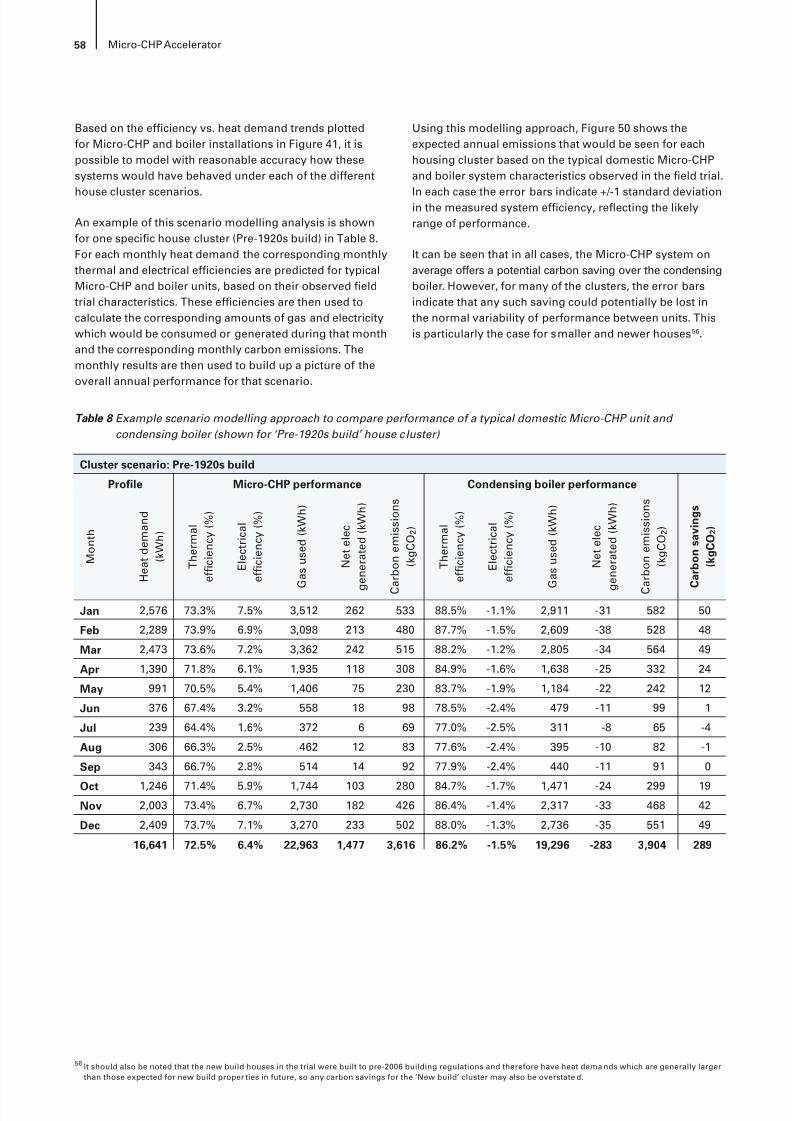
8/6/2019 CHP Accellerator
http://slidepdf.com/reader/full/chp-accellerator 60/104
58 Micro-CHP Accelerator
Based on the efciency vs. heat demand trends plottedfor Micro-CHP and boiler installations in Figure 41, it ispossible to model with reasonable accuracy how thesesystems would have behaved under each of the different
house cluster scenarios.
An example of this scenario modelling analysis is shownfor one specic house cluster (Pre-1920s build) in Table 8.For each monthly heat demand the corresponding monthlythermal and electrical efciencies are predicted for typicalMicro-CHP and boiler units, based on their observed eldtrial characteristics. These efciencies are then used tocalculate the corresponding amounts of gas and electricitywhich would be consumed or generated during that monthand the corresponding monthly carbon emissions. Themonthly results are then used to build up a picture of theoverall annual performance for that scenario.
Using this modelling approach, Figure 50 shows theexpected annual emissions that would be seen for eachhousing cluster based on the typical domestic Micro-CHPand boiler system characteristics observed in the eld trial.
In each case the error bars indicate +/-1 standard deviationin the measured system efciency, reecting the likelyrange of performance.
It can be seen that in all cases, the Micro-CHP system onaverage offers a potential carbon saving over the condensingboiler. However, for many of the clusters, the error barsindicate that any such saving could potentially be lost inthe normal variability of performance between units. Thisis particularly the case for smaller and newer houses 56 .
Table 8 Example scenario modelling approach to compare performance of a typical domestic Micro-CHP unit and condensing boiler (shown for ‘Pre-1920s build’ house cluster)
Jan 2,576 73.3% 7.5% 3,512 262 533 88.5% -1.1% 2,911 -31 582 50
Feb 2,289 73.9% 6.9% 3,098 213 480 87.7% -1.5% 2,609 -38 528 48
Mar 2,473 73.6% 7.2% 3,362 242 515 88.2% -1.2% 2,805 -34 564 49
Apr 1,390 71.8% 6.1% 1,935 118 308 84.9% -1.6% 1,638 -25 332 24
May 991 70.5% 5.4% 1,406 75 230 83.7% -1.9% 1,184 -22 242 12
Jun 376 67.4% 3.2% 558 18 98 78.5% -2.4% 479 -11 99 1
Jul 239 64.4% 1.6% 372 6 69 77.0% -2.5% 311 -8 65 -4
Aug 306 66.3% 2.5% 462 12 83 77.6% -2.4% 395 -10 82 -1
Sep 343 66.7% 2.8% 514 14 92 77.9% -2.4% 440 -11 91 0
Oct 1,246 71.4% 5.9% 1,744 103 280 84.7% -1.7% 1,471 -24 299 19Nov 2,003 73.4% 6.7% 2,730 182 426 86.4% -1.4% 2,317 -33 468 42
Dec 2,409 73.7% 7.1% 3,270 233 502 88.0% -1.3% 2,736 -35 551 49
16,641 72.5% 6.4% 22,963 1,477 3,616 86.2% -1.5% 19,296 -283 3,904 289
Cluster scenario: Pre-1920s build
Prole Micro-CHP performance Condensing boiler performance
M o n t h
H e a t d e m a n d
( k W h )
T h e r m a l
e f c i e n c y ( % )
E l e c t r i c a l
e f c i e n c y ( % )
G a s u s e d
( k W h )
N e t e l e c
g e n e r a t e d
( k W h )
C a r b o n e m
i s s i o n s
( k g C O 2
)
T h e r m a l
e f c i e n c y ( % )
E l e c t r i c a l
e f c i e n c y ( % )
G a s u s e d
( k W h )
N e t e l e c
g e n e r a t e d
( k W h )
C a r b o n e m
i s s i o n s
( k g C O
2 )
C a r b o n s a v
i n g s
( k g
C O
2 )
56 It should also be noted that the new build houses in the trial were built to pre-2006 building regulations and therefore have heat dema nds which are generally largerthan those expected for new build proper ties in future, so any carbon savings for the ‘New build’ cluster may also be overstate d.
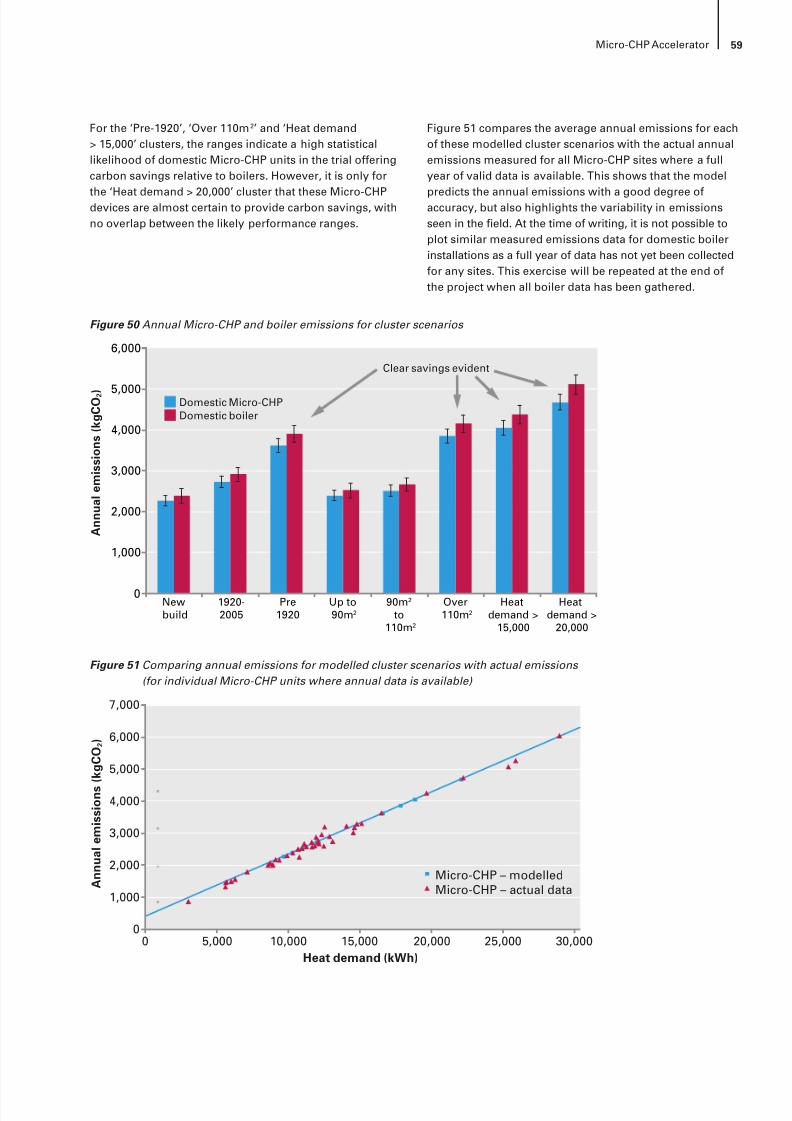
8/6/2019 CHP Accellerator
http://slidepdf.com/reader/full/chp-accellerator 61/104
59Micro-CHP Accelerator
For the ‘Pre-1920’, ‘Over 110m 2’ and ‘Heat demand> 15,000’ clusters, the ranges indicate a high statisticallikelihood of domestic Micro-CHP units in the trial offeringcarbon savings relative to boilers. However, it is only for
the ‘Heat demand > 20,000’ cluster that these Micro-CHPdevices are almost certain to provide carbon savings, withno overlap between the likely performance ranges.
Figure 51 compares the average annual emissions for eachof these modelled cluster scenarios with the actual annualemissions measured for all Micro-CHP sites where a fullyear of valid data is available. This shows that the model
predicts the annual emissions with a good degree ofaccuracy, but also highlights the variability in emissionsseen in the eld. At the time of writing, it is not possible toplot similar measured emissions data for domestic boilerinstallations as a full year of data has not yet been collectedfor any sites. This exercise will be repeated at the end ofthe project when all boiler data has been gathered.
Figure 50 Annual Micro-CHP and boiler emissions for cluster scenarios
Newbuild
1920-2005
Pre1920
Up to90m 2
90m 2 to
110m 2
Over110m 2
Heatdemand >
15,000
Heatdemand >
20,000
A n n u a l e m
i s s i o n s ( k g C O 2 )
1,000
2,000
3,000
4,000
5,000
6,000
0
Domestic Micro-CHPDomestic boiler
Clear savings evident
Figure 51 Comparing annual emissions for modelled cluster scenarios with actual emissions (for individual Micro-CHP units where annual data is available)
6,000
7,000
5,000
4,000
3,000
2,000
1,000
00 5,000 10,000 15,000 20,000 25,000 30,000
A n n u a l e m
i s s i o n s ( k g C O
2 )
Heat demand (kWh)
Micro-CHP – modelledMicro-CHP – actual data
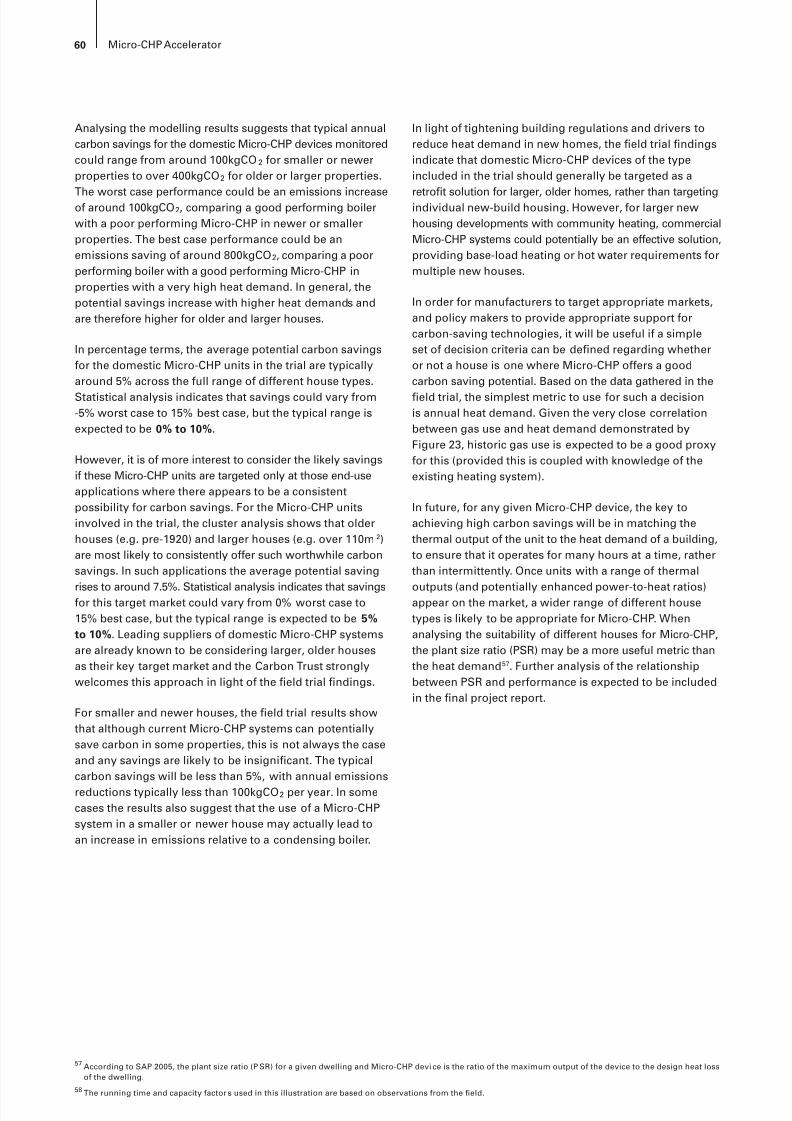
8/6/2019 CHP Accellerator
http://slidepdf.com/reader/full/chp-accellerator 62/104
60 Micro-CHP Accelerator
Analysing the modelling results suggests that typical annualcarbon savings for the domestic Micro-CHP devices monitoredcould range from around 100kgCO 2 for smaller or newerproperties to over 400kgCO 2 for older or larger properties.
The worst case performance could be an emissions increaseof around 100kgCO 2, comparing a good performing boilerwith a poor performing Micro-CHP in newer or smallerproperties. The best case performance could be anemissions saving of around 800kgCO 2, comparing a poorperforming boiler with a good performing Micro-CHP inproperties with a very high heat demand. In general, thepotential savings increase with higher heat demands andare therefore higher for older and larger houses.
In percentage terms, the average potential carbon savingsfor the domestic Micro-CHP units in the trial are typicallyaround 5% across the full range of different house types.Statistical analysis indicates that savings could vary from-5% worst case to 15% best case, but the typical range isexpected to be 0% to 10% .
However, it is of more interest to consider the likely savingsif these Micro-CHP units are targeted only at those end-useapplications where there appears to be a consistentpossibility for carbon savings. For the Micro-CHP unitsinvolved in the trial, the cluster analysis shows that olderhouses (e.g. pre-1920) and larger houses (e.g. over 110m 2)are most likely to consistently offer such worthwhile carbonsavings. In such applications the average potential saving
rises to around 7.5%. Statistical analysis indicates that savingsfor this target market could vary from 0% worst case to15% best case, but the typical range is expected to be 5%to 10% . Leading suppliers of domestic Micro-CHP systemsare already known to be considering larger, older housesas their key target market and the Carbon Trust stronglywelcomes this approach in light of the eld trial ndings.
For smaller and newer houses, the eld trial results showthat although current Micro-CHP systems can potentiallysave carbon in some properties, this is not always the caseand any savings are likely to be insignicant. The typicalcarbon savings will be less than 5%, with annual emissionsreductions typically less than 100kgCO 2 per year. In somecases the results also suggest that the use of a Micro-CHPsystem in a smaller or newer house may actually lead toan increase in emissions relative to a condensing boiler.
In light of tightening building regulations and drivers toreduce heat demand in new homes, the eld trial ndingsindicate that domestic Micro-CHP devices of the typeincluded in the trial should generally be targeted as a
retrot solution for larger, older homes, rather than targetingindividual new-build housing. However, for larger newhousing developments with community heating, commercialMicro-CHP systems could potentially be an effective solution,providing base-load heating or hot water requirements formultiple new houses.
In order for manufacturers to target appropriate markets,and policy makers to provide appropriate support forcarbon-saving technologies, it will be useful if a simpleset of decision criteria can be dened regarding whetheror not a house is one where Micro-CHP offers a goodcarbon saving potential. Based on the data gathered in theeld trial, the simplest metric to use for such a decisionis annual heat demand. Given the very close correlationbetween gas use and heat demand demonstrated byFigure 23, historic gas use is expected to be a good proxyfor this (provided this is coupled with knowledge of theexisting heating system).
In future, for any given Micro-CHP device, the key toachieving high carbon savings will be in matching thethermal output of the unit to the heat demand of a building,to ensure that it operates for many hours at a time, ratherthan intermittently. Once units with a range of thermal
outputs (and potentially enhanced power-to-heat ratios)appear on the market, a wider range of different housetypes is likely to be appropriate for Micro-CHP. Whenanalysing the suitability of different houses for Micro-CHP,the plant size ratio (PSR) may be a more useful metric thanthe heat demand 57 . Further analysis of the relationshipbetween PSR and performance is expected to be includedin the nal project report.
57 According to SAP 2005, the plant size ratio (P SR) for a given dwelling and Micro-CHP devi ce is the ratio of the maximum output of the device to the design heat lossof the dwelling.
58 The running time and capacity factor s used in this illustration are based on observations from the eld.
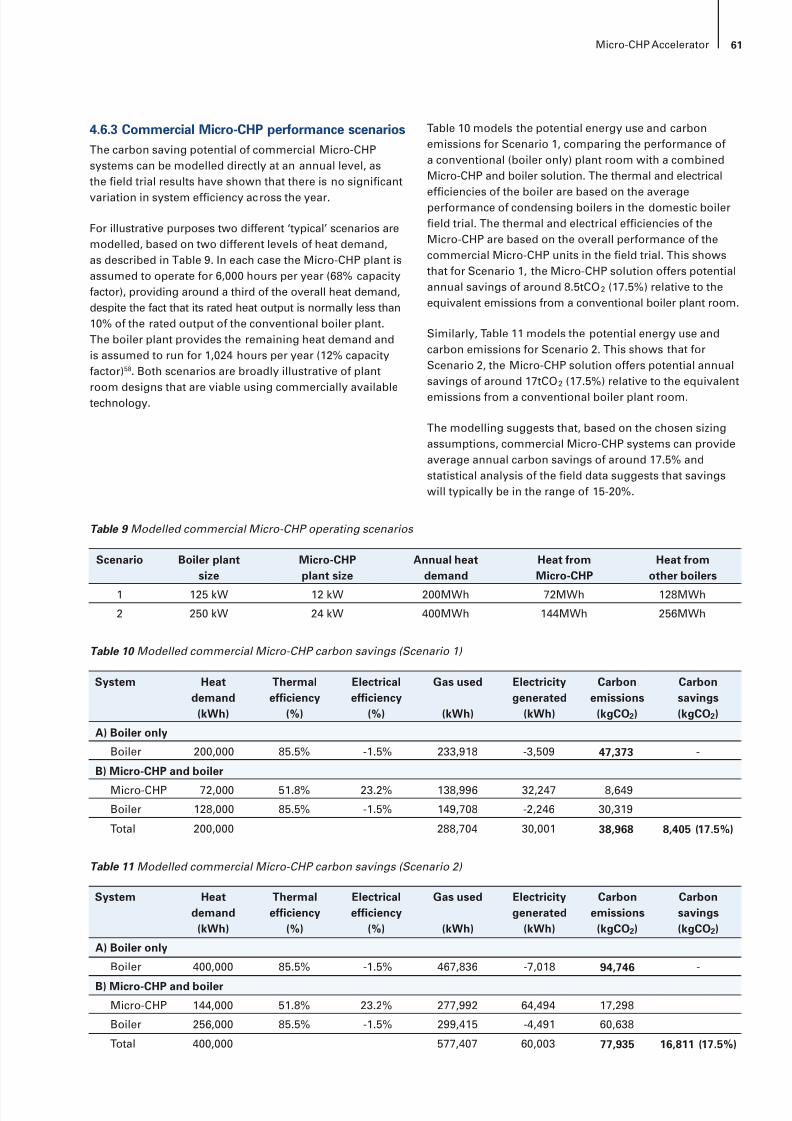
8/6/2019 CHP Accellerator
http://slidepdf.com/reader/full/chp-accellerator 63/104
61Micro-CHP Accelerator
4.6.3 Commercial Micro-CHP performance scenariosThe carbon saving potential of commercial Micro-CHPsystems can be modelled directly at an annual level, asthe eld trial results have shown that there is no signicant
variation in system efciency across the year.
For illustrative purposes two different ‘typical’ scenarios aremodelled, based on two different levels of heat demand,as described in Table 9. In each case the Micro-CHP plant isassumed to operate for 6,000 hours per year (68% capacityfactor), providing around a third of the overall heat demand,despite the fact that its rated heat output is normally less than10% of the rated output of the conventional boiler plant.The boiler plant provides the remaining heat demand andis assumed to run for 1,024 hours per year (12% capacityfactor) 58 . Both scenarios are broadly illustrative of plant
room designs that are viable using commercially availabletechnology.
Table 10 models the potential energy use and carbonemissions for Scenario 1, comparing the performance ofa conventional (boiler only) plant room with a combinedMicro-CHP and boiler solution. The thermal and electrical
efciencies of the boiler are based on the averageperformance of condensing boilers in the domestic boilereld trial. The thermal and electrical efciencies of theMicro-CHP are based on the overall performance of thecommercial Micro-CHP units in the eld trial. This showsthat for Scenario 1, the Micro-CHP solution offers potentialannual savings of around 8.5tCO 2 (17.5%) relative to theequivalent emissions from a conventional boiler plant room.
Similarly, Table 11 models the potential energy use andcarbon emissions for Scenario 2. This shows that forScenario 2, the Micro-CHP solution offers potential annualsavings of around 17tCO 2 (17.5%) relative to the equivalentemissions from a conventional boiler plant room.
The modelling suggests that, based on the chosen sizingassumptions, commercial Micro-CHP systems can provideaverage annual carbon savings of around 17.5% andstatistical analysis of the eld data suggests that savingswill typically be in the range of 15-20%.
Scenario Boiler plantsize
Micro-CHPplant size
Annual heatdemand
Heat fromMicro-CHP
Heat fromother boilers
1 125 kW 12 kW 200MWh 72MWh 128MWh
2 250 kW 24 kW 400MWh 144MWh 256MWh
Table 9 Modelled commercial Micro-CHP operating scenarios
Table 10 Modelled commercial Micro-CHP carbon savings (Scenario 1)
System Heatdemand
(kWh)
Thermalefciency
(%)
Electricalefciency
(%)
Gas used
(kWh)
Electricitygenerated
(kWh)
Carbonemissions
(kgCO 2)
Carbonsavings(kgCO 2)
Boiler 200,000 85.5% -1.5% 233,918 -3,509 47,373 -
Micro-CHP 72,000 51.8% 23.2% 138,996 32,247 8,649
Boiler 128,000 85.5% -1.5% 149,708 -2,246 30,319
Total 200,000 288,704 30,001 38,968 8,405 (17.5%)
A) Boiler only
B) Micro-CHP and boiler
Table 11 Modelled commercial Micro-CHP carbon savings (Scenario 2)
System Heatdemand
(kWh)
Thermalefciency
(%)
Electricalefciency
(%)
Gas used
(kWh)
Electricitygenerated
(kWh)
Carbonemissions
(kgCO 2)
Carbonsavings(kgCO 2)
Boiler 400,000 85.5% -1.5% 467,836 -7,018 94,746 -
Micro-CHP 144,000 51.8% 23.2% 277,992 64,494 17,298
Boiler 256,000 85.5% -1.5% 299,415 -4,491 60,638
Total 400,000 577,407 60,003 77,935 16,811 (17.5%)
A) Boiler only
B) Micro-CHP and boiler
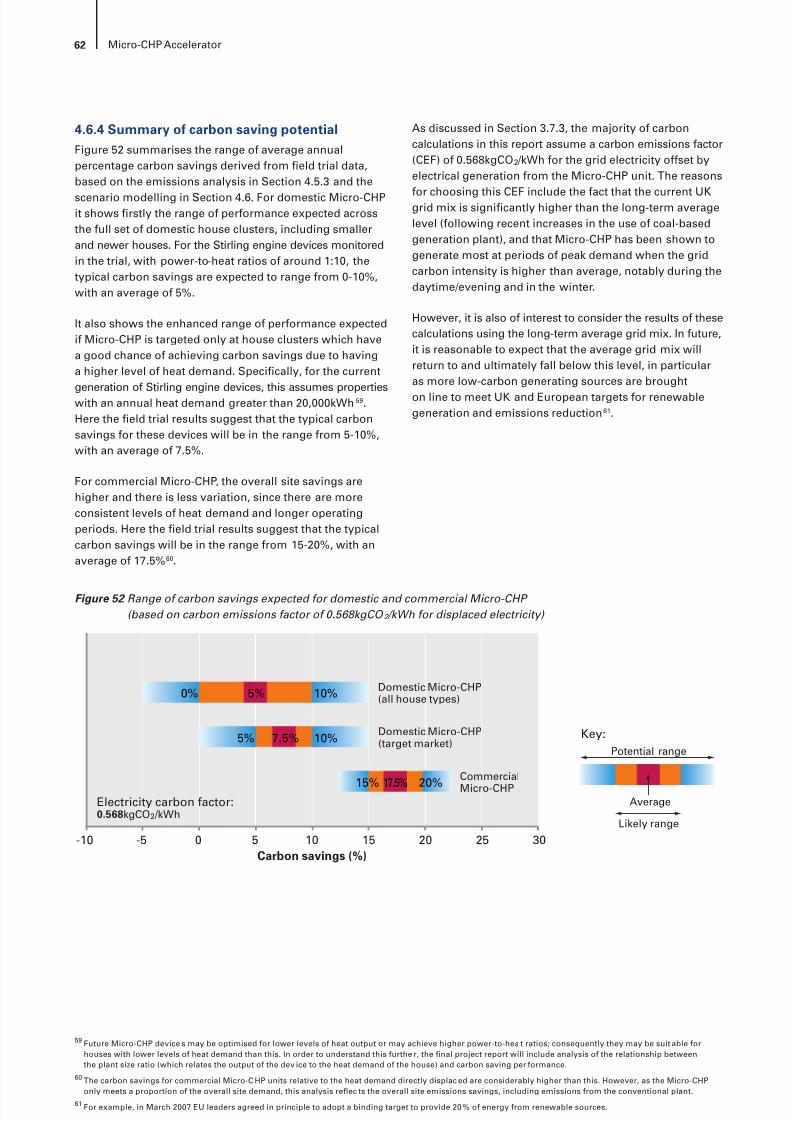
8/6/2019 CHP Accellerator
http://slidepdf.com/reader/full/chp-accellerator 64/104
62 Micro-CHP Accelerator
4.6.4 Summary of carbon saving potentialFigure 52 summarises the range of average annualpercentage carbon savings derived from eld trial data,based on the emissions analysis in Section 4.5.3 and the
scenario modelling in Section 4.6. For domestic Micro-CHPit shows rstly the range of performance expected acrossthe full set of domestic house clusters, including smallerand newer houses. For the Stirling engine devices monitoredin the trial, with power-to-heat ratios of around 1:10, thetypical carbon savings are expected to range from 0-10%,with an average of 5%.
It also shows the enhanced range of performance expectedif Micro-CHP is targeted only at house clusters which havea good chance of achieving carbon savings due to havinga higher level of heat demand. Specically, for the current
generation of Stirling engine devices, this assumes propertieswith an annual heat demand greater than 20,000kWh 59 .Here the eld trial results suggest that the typical carbonsavings for these devices will be in the range from 5-10%,with an average of 7.5%.
For commercial Micro-CHP, the overall site savings arehigher and there is less variation, since there are moreconsistent levels of heat demand and longer operatingperiods. Here the eld trial results suggest that the typicalcarbon savings will be in the range from 15-20%, with anaverage of 17.5% 60 .
As discussed in Section 3.7.3, the majority of carboncalculations in this report assume a carbon emissions factor(CEF) of 0.568kgCO 2 /kWh for the grid electricity offset byelectrical generation from the Micro-CHP unit. The reasons
for choosing this CEF include the fact that the current UKgrid mix is signicantly higher than the long-term averagelevel (following recent increases in the use of coal-basedgeneration plant), and that Micro-CHP has been shown togenerate most at periods of peak demand when the gridcarbon intensity is higher than average, notably during thedaytime/evening and in the winter.
However, it is also of interest to consider the results of thesecalculations using the long-term average grid mix. In future,it is reasonable to expect that the average grid mix willreturn to and ultimately fall below this level, in particularas more low-carbon generating sources are broughton line to meet UK and European targets for renewablegeneration and emissions reduction 61 .
Figure 52 Range of carbon savings expected for domestic and commercial Micro-CHP (based on carbon emissions factor of 0.568kgCO 2 /kWh for displaced electricity)
59 Future Micro-CHP device s may be optimised for lower levels of heat output or may achieve higher power-to-hea t ratios; consequently they may be suit able forhouses with lower levels of heat demand than this. In order to understand this furthe r, the nal project report will include analysis of the relationship betweenthe plant size ratio (which relates the output of the dev ice to the heat demand of the house) and carbon saving per formance.
60 The carbon savings for commercial Micro-C HP units relative to the heat demand directly displac ed are considerably higher than this. However, as the Micro-CHPonly meets a proportion of the overall site demand, this analysis reec ts the overall site emissions savings, including emissions from the conventional plant.
61 For example, in March 2007 EU leaders agreed in principle to adopt a binding target to provide 20 % of energy from renewable sources.
Carbon savings (%)-10 -5 0 5 10 15 20 25 30
Key:
Electricity carbon factor:0.568 kgCO 2 /kWh
Domestic Micro-CHP(all house types)0% 5% 10%
Domestic Micro-CHP(target market)5% 7.5% 10%
CommercialMicro-CHP15% 17.5% 20%
Potential range
Average
Likely range
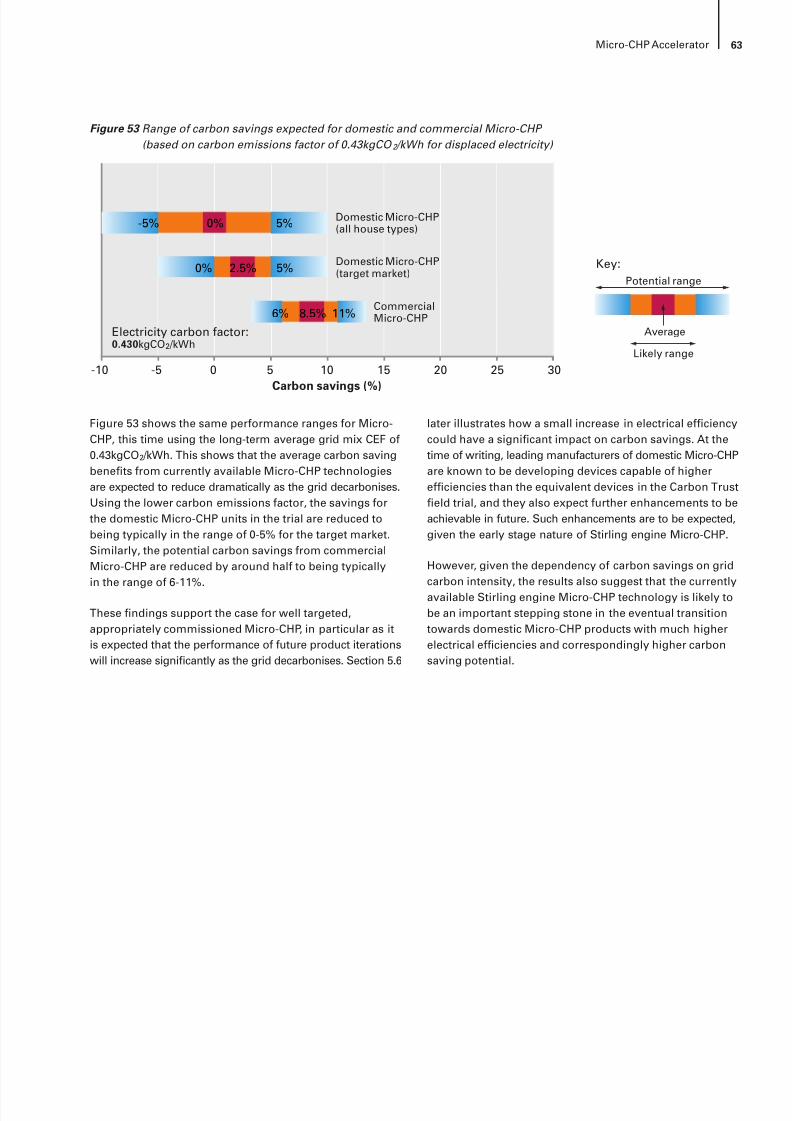
8/6/2019 CHP Accellerator
http://slidepdf.com/reader/full/chp-accellerator 65/104
63Micro-CHP Accelerator
Figure 53 shows the same performance ranges for Micro-CHP, this time using the long-term average grid mix CEF of0.43kgCO 2 /kWh. This shows that the average carbon savingbenets from currently available Micro-CHP technologiesare expected to reduce dramatically as the grid decarbonises.Using the lower carbon emissions factor, the savings forthe domestic Micro-CHP units in the trial are reduced tobeing typically in the range of 0-5% for the target market.Similarly, the potential carbon savings from commercialMicro-CHP are reduced by around half to being typicallyin the range of 6-11%.
These ndings support the case for well targeted,appropriately commissioned Micro-CHP, in particular as itis expected that the performance of future product iterationswill increase signicantly as the grid decarbonises. Section 5.6
later illustrates how a small increase in electrical efciencycould have a signicant impact on carbon savings. At thetime of writing, leading manufacturers of domestic Micro-CHPare known to be developing devices capable of higherefciencies than the equivalent devices in the Carbon Trusteld trial, and they also expect further enhancements to beachievable in future. Such enhancements are to be expected,given the early stage nature of Stirling engine Micro-CHP.
However, given the dependency of carbon savings on gridcarbon intensity, the results also suggest that the currentlyavailable Stirling engine Micro-CHP technology is likely tobe an important stepping stone in the eventual transitiontowards domestic Micro-CHP products with much higherelectrical efciencies and correspondingly higher carbonsaving potential.
Figure 53 Range of carbon savings expected for domestic and commercial Micro-CHP (based on carbon emissions factor of 0.43kgCO 2 /kWh for displaced electricity)
Carbon savings (%)-10 -5 0 5 10 15 20 25 30
Key:
Electricity carbon factor:0.430 kgCO 2 /kWh
Domestic Micro-CHP(all house types)
Domestic Micro-CHP(target market)0% 2.5% 5%
CommercialMicro-CHP6% 8.5% 11%
Potential range
Average
Likely range
-5% 0% 5%
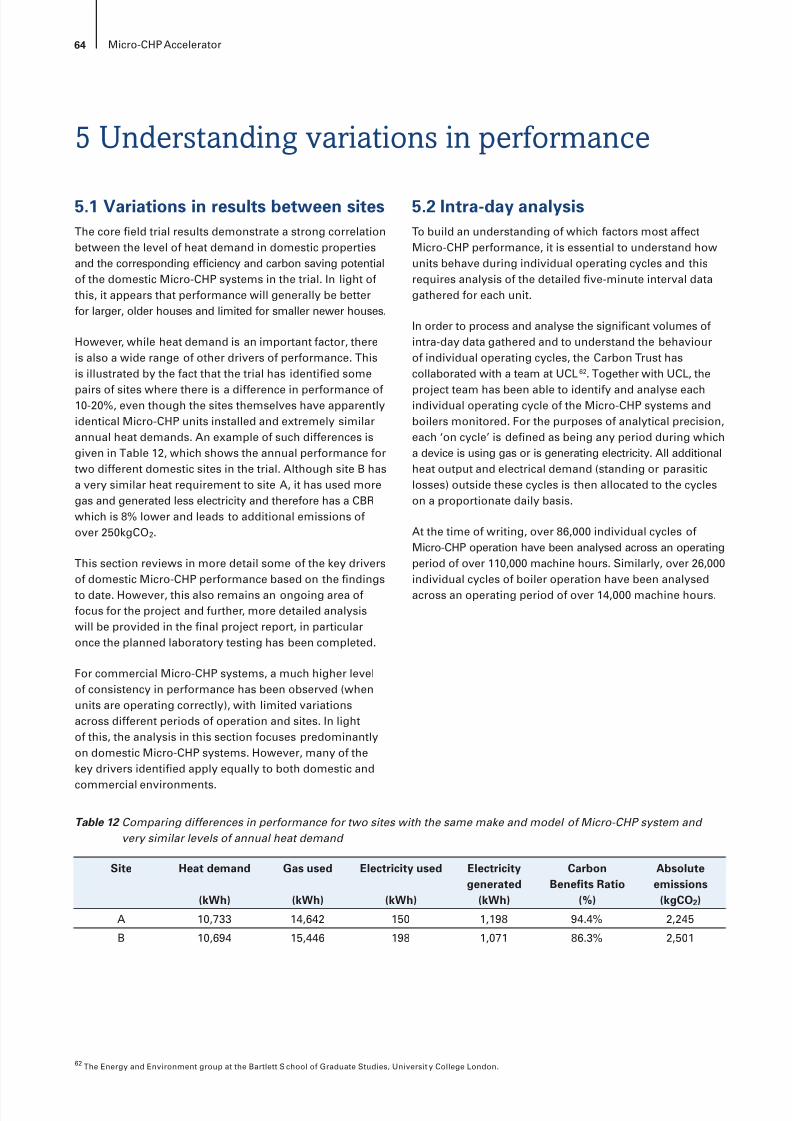
8/6/2019 CHP Accellerator
http://slidepdf.com/reader/full/chp-accellerator 66/104
64 Micro-CHP Accelerator
5 Understanding variations in performance
5.1 Variations in results between sitesThe core eld trial results demonstrate a strong correlationbetween the level of heat demand in domestic propertiesand the corresponding efciency and carbon saving potentialof the domestic Micro-CHP systems in the trial. In light ofthis, it appears that performance will generally be betterfor larger, older houses and limited for smaller newer houses.
However, while heat demand is an important factor, thereis also a wide range of other drivers of performance. Thisis illustrated by the fact that the trial has identied some
pairs of sites where there is a difference in performance of10-20%, even though the sites themselves have apparentlyidentical Micro-CHP units installed and extremely similarannual heat demands. An example of such differences isgiven in Table 12, which shows the annual performance fortwo different domestic sites in the trial. Although site B hasa very similar heat requirement to site A, it has used moregas and generated less electricity and therefore has a CBRwhich is 8% lower and leads to additional emissions ofover 250kgCO 2.
This section reviews in more detail some of the key driversof domestic Micro-CHP performance based on the ndingsto date. However, this also remains an ongoing area offocus for the project and further, more detailed analysiswill be provided in the nal project report, in particularonce the planned laboratory testing has been completed.
For commercial Micro-CHP systems, a much higher levelof consistency in performance has been observed (whenunits are operating correctly), with limited variationsacross different periods of operation and sites. In lightof this, the analysis in this section focuses predominantlyon domestic Micro-CHP systems. However, many of thekey drivers identied apply equally to both domestic and
commercial environments.
5.2 Intra-day analysisTo build an understanding of which factors most affectMicro-CHP performance, it is essential to understand howunits behave during individual operating cycles and thisrequires analysis of the detailed ve-minute interval datagathered for each unit.
In order to process and analyse the signicant volumes ofintra-day data gathered and to understand the behaviourof individual operating cycles, the Carbon Trust hascollaborated with a team at UCL 62 . Together with UCL, the
project team has been able to identify and analyse eachindividual operating cycle of the Micro-CHP systems andboilers monitored. For the purposes of analytical precision,each ‘on cycle’ is dened as being any period during whicha device is using gas or is generating electricity. All additionalheat output and electrical demand (standing or parasiticlosses) outside these cycles is then allocated to the cycleson a proportionate daily basis.
At the time of writing, over 86,000 individual cycles ofMicro-CHP operation have been analysed across an operatingperiod of over 110,000 machine hours. Similarly, over 26,000individual cycles of boiler operation have been analysedacross an operating period of over 14,000 machine hours.
Site Heat demand
(kWh)
Gas used
(kWh)
Electricity used
(kWh)
Electricitygenerated
(kWh)
CarbonBenets Ratio
(%)
Absoluteemissions
(kgCO 2)
A 10,733 14,642 150 1,198 94.4% 2,245
B 10,694 15,446 198 1,071 86.3% 2,501
Table 12 Comparing differences in performance for two sites with the same make and model of Micro-CHP system and very similar levels of annual heat demand
62 The Energy and Environment group at the Bartlett S chool of Graduate Studies, Universit y College London.
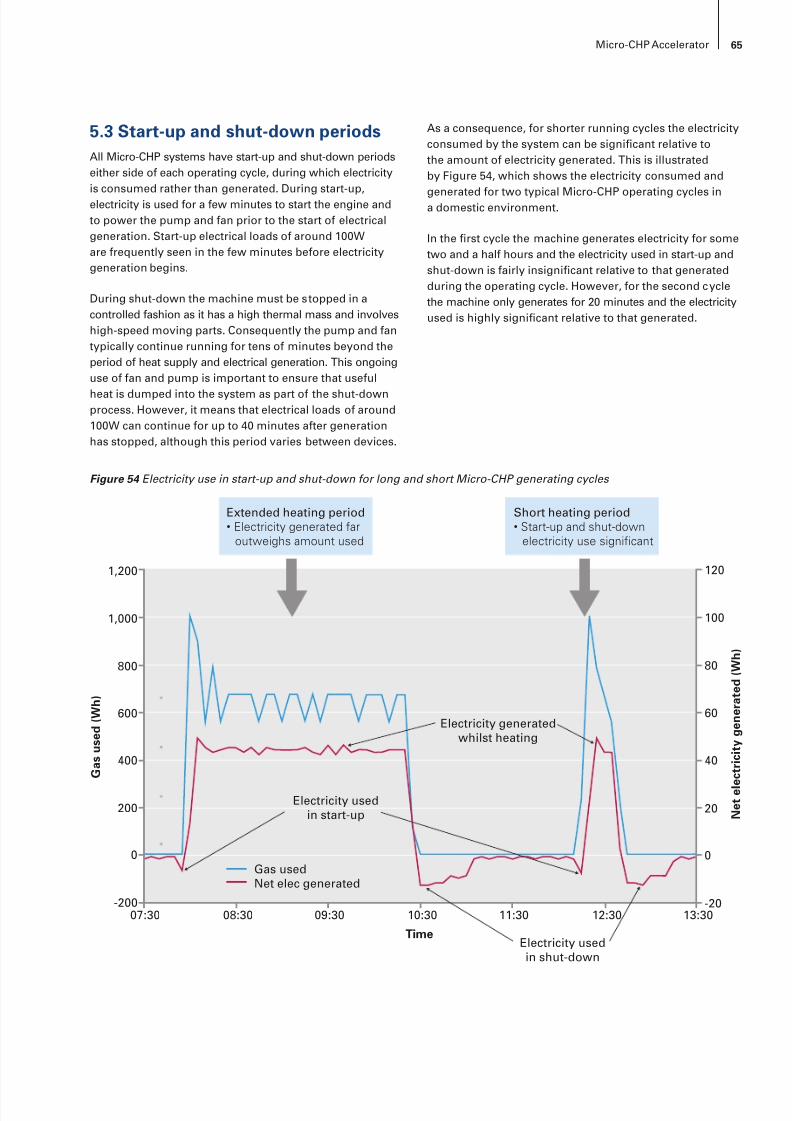
8/6/2019 CHP Accellerator
http://slidepdf.com/reader/full/chp-accellerator 67/104
65Micro-CHP Accelerator
5.3 Start-up and shut-down periodsAll Micro-CHP systems have start-up and shut-down periodseither side of each operating cycle, during which electricityis consumed rather than generated. During start-up,electricity is used for a few minutes to start the engine andto power the pump and fan prior to the start of electricalgeneration. Start-up electrical loads of around 100Ware frequently seen in the few minutes before electricitygeneration begins.
During shut-down the machine must be s topped in acontrolled fashion as it has a high thermal mass and involveshigh-speed moving parts. Consequently the pump and fantypically continue running for tens of minutes beyond theperiod of heat supply and electrical generation. This ongoinguse of fan and pump is important to ensure that useful
heat is dumped into the system as part of the shut-downprocess. However, it means that electrical loads of around100W can continue for up to 40 minutes after generationhas stopped, although this period varies between devices.
As a consequence, for shorter running cycles the electricityconsumed by the system can be signicant relative tothe amount of electricity generated. This is illustratedby Figure 54, which shows the electricity consumed and
generated for two typical Micro-CHP operating cycles ina domestic environment.
In the rst cycle the machine generates electricity for sometwo and a half hours and the electricity used in start-up andshut-down is fairly insignicant relative to that generatedduring the operating cycle. However, for the second cyclethe machine only generates for 20 minutes and the electricityused is highly signicant relative to that generated.
Figure 54 Electricity use in start-up and shut-down for long and short Micro-CHP generating cycles
600
800
1,000 100
80
60
40
20
0
-20
400
200
-200
0
G a s u s e d
( W h )
N e t e l e c t r i c i t y g e n e r a t e d
( W h )
Time
07:30 08:30 09:30 10:30 11:30 12:30 13:30
1,200 120
Gas usedNet elec generated
Electricity usedin start-up
Electricity generatedwhilst heating
Extended heating period• Electricity generated far
outweighs amount used
Short heating period• Start-up and shut-down
electricity use significant
Electricity usedin shut-down
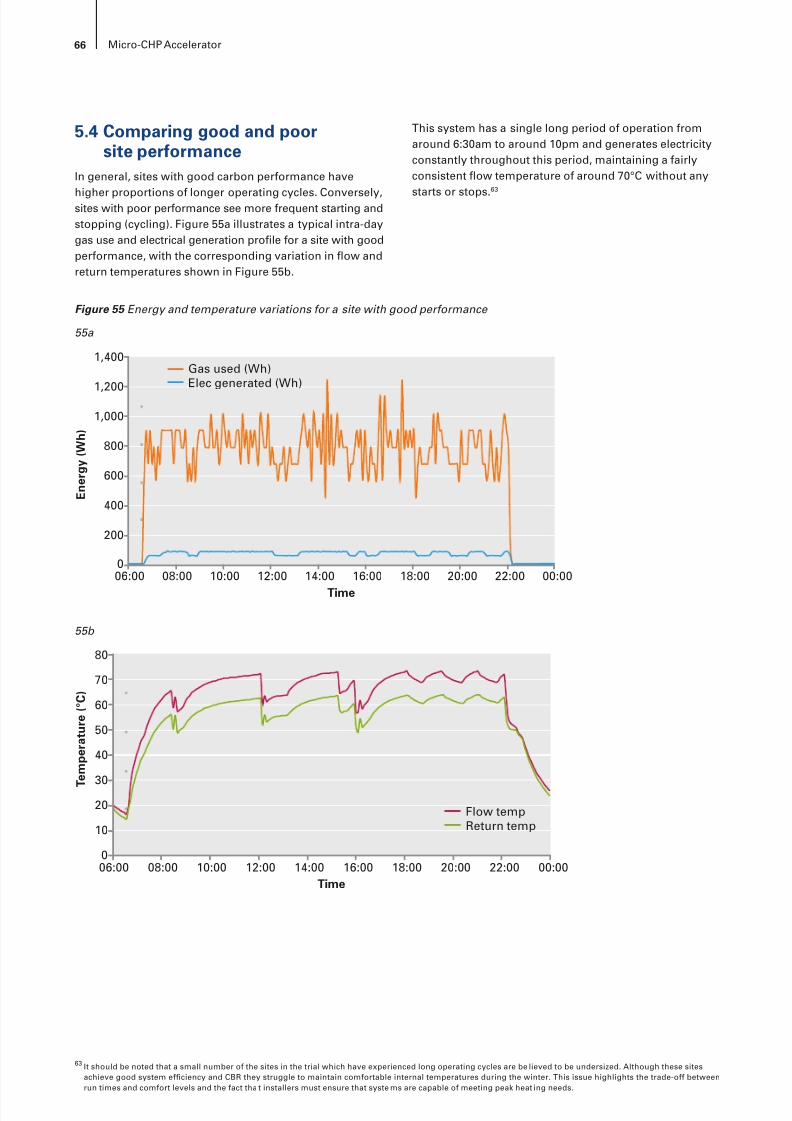
8/6/2019 CHP Accellerator
http://slidepdf.com/reader/full/chp-accellerator 68/104
66 Micro-CHP Accelerator
5.4 Comparing good and poorsite performance
In general, sites with good carbon performance have
higher proportions of longer operating cycles. Conversely,sites with poor performance see more frequent starting andstopping (cycling). Figure 55a illustrates a typical intra-daygas use and electrical generation prole for a site with goodperformance, with the corresponding variation in ow andreturn temperatures shown in Figure 55b.
This system has a single long period of operation fromaround 6:30am to around 10pm and generates electricityconstantly throughout this period, maintaining a fairlyconsistent ow temperature of around 70°C without any
starts or stops.63
63 It should be noted that a small number of the sites in the trial which have experienced long operating cycles are be lieved to be undersized. Although these sitesachieve good system efciency and CBR they struggle to maintain comfortable internal temperatures during the winter. This issue highlights the trade-off betweenrun times and comfort levels and the fact tha t installers must ensure that syste ms are capable of meeting peak heat ing needs.
Figure 55 Energy and temperature variations for a site with good performance
55a
800
1,000
1,200
1,400
600
400
200
0
E n e r g y ( W h )
Time06:00 08:00 10:00 12:00 14:00 16:00 18:00 20:00 22:00 00:00
Gas used (Wh)Elec generated (Wh)
50
60
70
80
40
3020
0
10
T e m p e r a t u r e
( ° C )
Time06:00 08:00 10:00 12:00 14:00 16:00 18:00 20:00 22:00 00:00
Flow tempReturn temp
55b
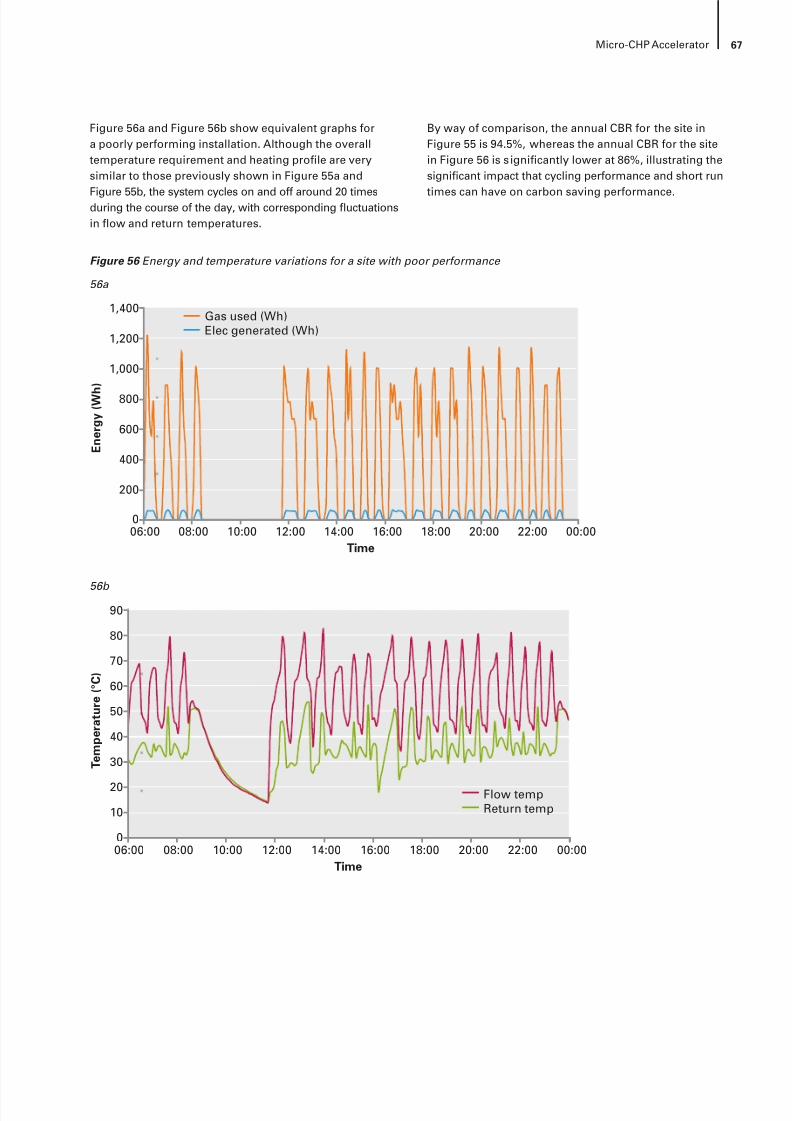
8/6/2019 CHP Accellerator
http://slidepdf.com/reader/full/chp-accellerator 69/104
67Micro-CHP Accelerator
Figure 56a and Figure 56b show equivalent graphs fora poorly performing installation. Although the overalltemperature requirement and heating prole are verysimilar to those previously shown in Figure 55a and
Figure 55b, the system cycles on and off around 20 timesduring the course of the day, with corresponding uctuationsin ow and return temperatures.
By way of comparison, the annual CBR for the site inFigure 55 is 94.5%, whereas the annual CBR for the sitein Figure 56 is s ignicantly lower at 86%, illustrating thesignicant impact that cycling performance and short run
times can have on carbon saving performance.
Figure 56 Energy and temperature variations for a site with poor performance
56a
800
1,000
1,200
1,400
600
400
200
0
E n e r g y ( W h )
Time06:00 08:00 10:00 12:00 14:00 16:00 18:00 20:00 22:00 00:00
Gas used (Wh)Elec generated (Wh)
50
60
70
80
90
40
30
20
0
10
T e m p e r a t u r e
( ° C )
Time06:00 08:00 10:00 12:00 14:00 16:00 18:00 20:00 22:00 00:00
Flow tempReturn temp
56b
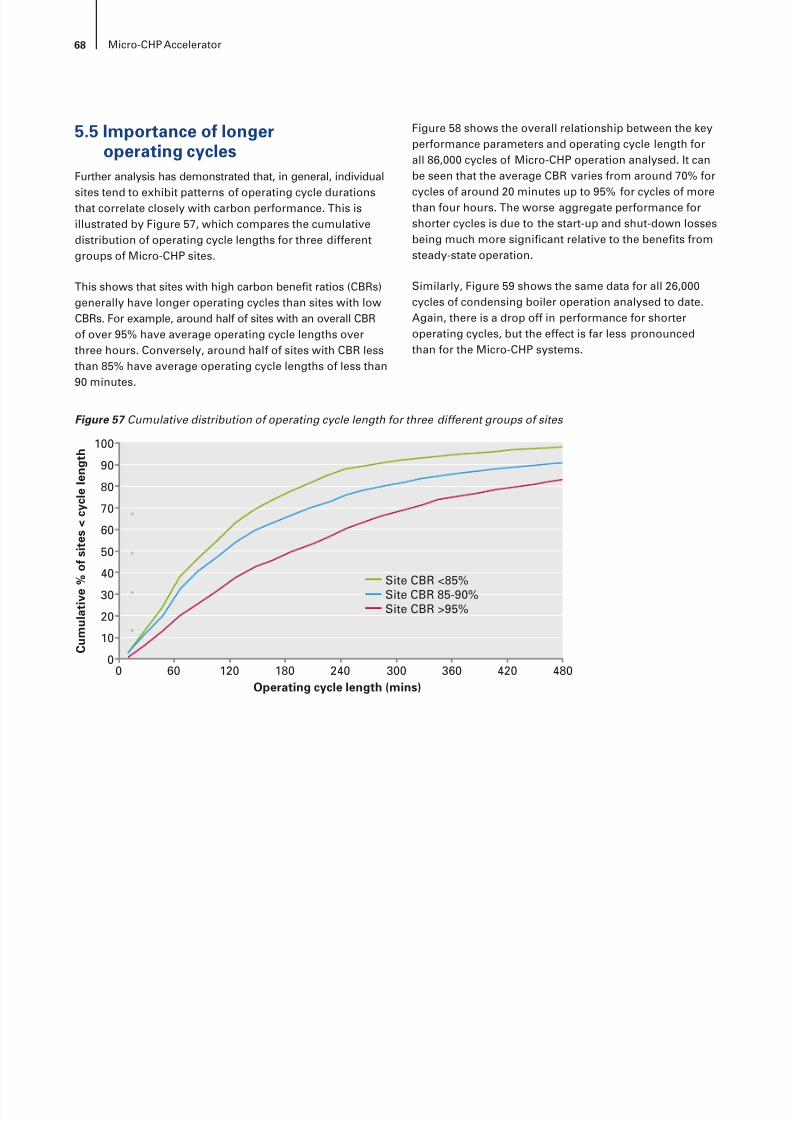
8/6/2019 CHP Accellerator
http://slidepdf.com/reader/full/chp-accellerator 70/104
68 Micro-CHP Accelerator
5.5 Importance of longeroperating cycles
Further analysis has demonstrated that, in general, individual
sites tend to exhibit patterns of operating cycle durationsthat correlate closely with carbon performance. This isillustrated by Figure 57, which compares the cumulativedistribution of operating cycle lengths for three differentgroups of Micro-CHP sites.
This shows that sites with high carbon benet ratios (CBRs)generally have longer operating cycles than sites with lowCBRs. For example, around half of sites with an overall CBRof over 95% have average operating cycle lengths overthree hours. Conversely, around half of sites with CBR lessthan 85% have average operating cycle lengths of less than90 minutes.
Figure 58 shows the overall relationship between the keyperformance parameters and operating cycle length forall 86,000 cycles of Micro-CHP operation analysed. It canbe seen that the average CBR varies from around 70% for
cycles of around 20 minutes up to 95% for cycles of morethan four hours. The worse aggregate performance forshorter cycles is due to the start-up and shut-down lossesbeing much more signicant relative to the benets fromsteady-state operation.
Similarly, Figure 59 shows the same data for all 26,000cycles of condensing boiler operation analysed to date.Again, there is a drop off in performance for shorteroperating cycles, but the effect is far less pronouncedthan for the Micro-CHP systems.
Figure 57 Cumulative distribution of operating cycle length for three different groups of sites
100
80
60
40
20
0 C u m u l a t i v e
% o f s i t e s < c y c l e
l e n g t h
Operating cycle length (mins)0 60 120 180 240 300 360 420 480
10
30
50
70
90
Site CBR <85%Site CBR 85-90%Site CBR >95%
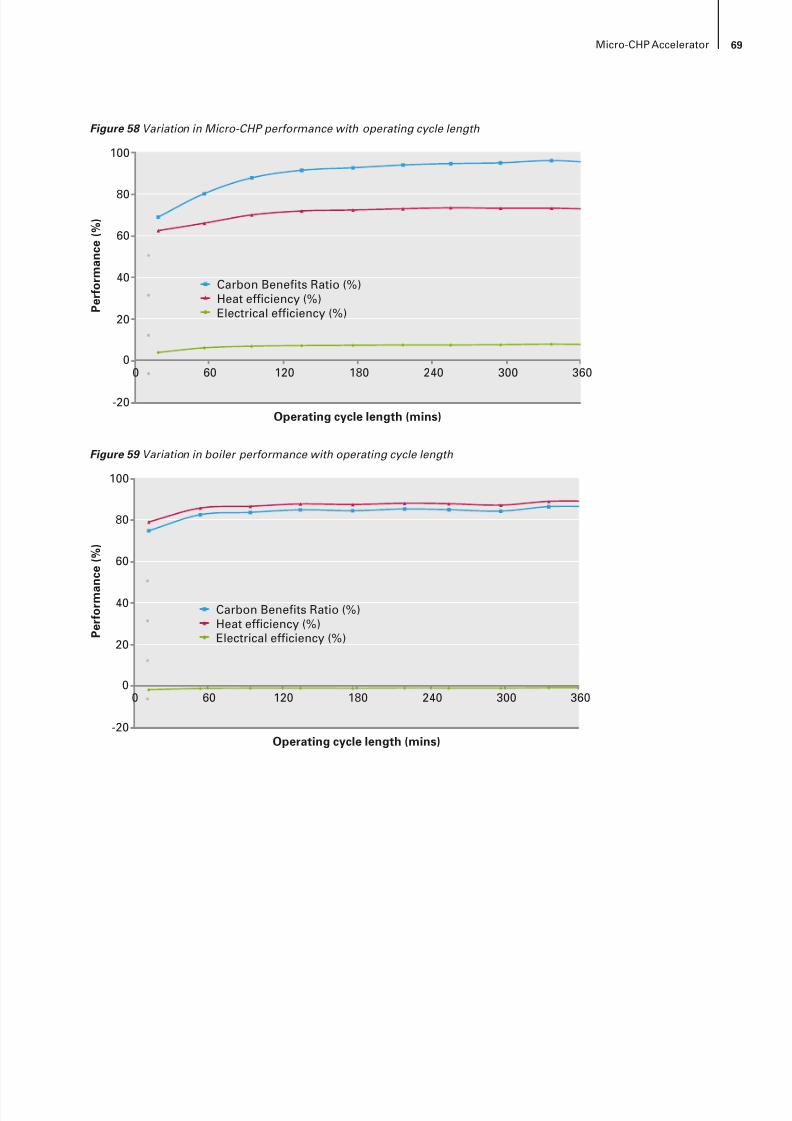
8/6/2019 CHP Accellerator
http://slidepdf.com/reader/full/chp-accellerator 71/104
69Micro-CHP Accelerator
Figure 58 Variation in Micro-CHP performance with operating cycle length
100
80
60
40
20
-20
0
P e r f o r m a n c e
( % )
0 60 120 180 240 300 360
Operating cycle length (mins)
Carbon Benefits Ratio (%)Heat efficiency (%)Electrical efficiency (%)
Figure 59 Variation in boiler performance with operating cycle length
100
80
60
40
20
-20
0
P e r f o r m a n c e
( % )
0 60 120 180 240 300 360
Operating cycle length (mins)
Carbon Benefits Ratio (%)Heat efficiency (%)Electrical efficiency (%)
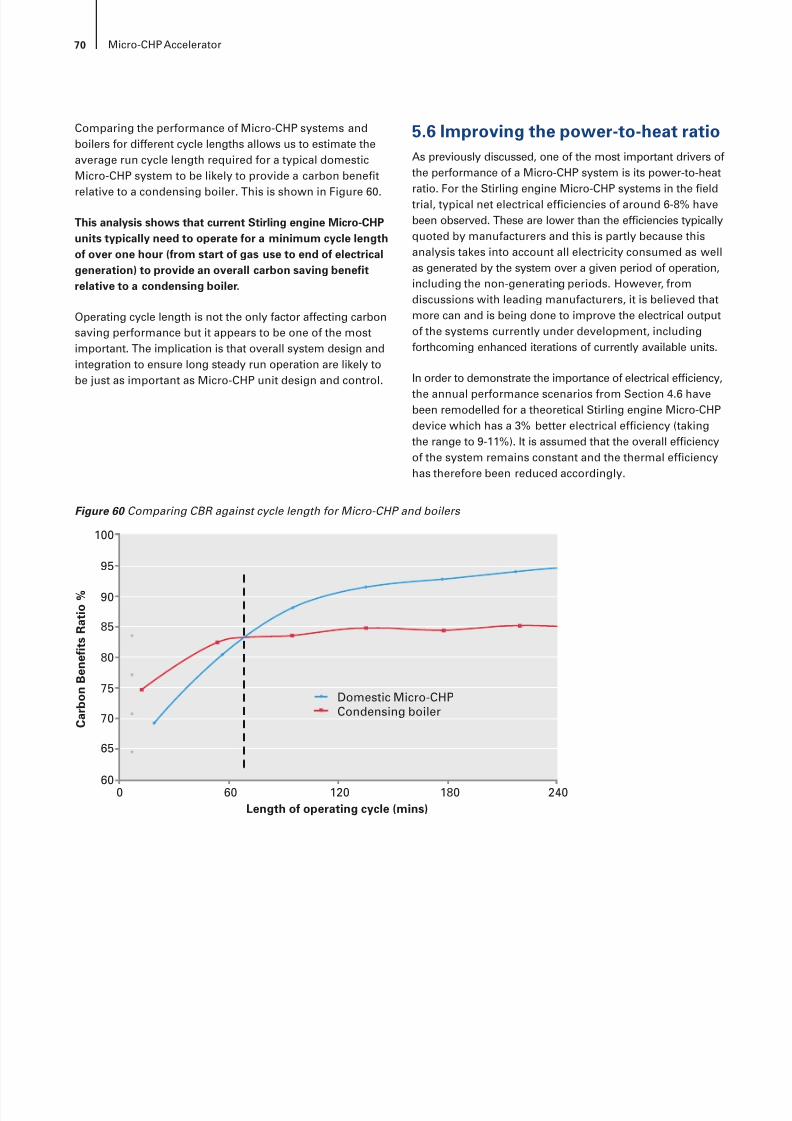
8/6/2019 CHP Accellerator
http://slidepdf.com/reader/full/chp-accellerator 72/104
70 Micro-CHP Accelerator
Comparing the performance of Micro-CHP systems andboilers for different cycle lengths allows us to estimate theaverage run cycle length required for a typical domesticMicro-CHP system to be likely to provide a carbon benet
relative to a condensing boiler. This is shown in Figure 60.
This analysis shows that current Stirling engine Micro-CHPunits typically need to operate for a minimum cycle lengthof over one hour (from start of gas use to end of electricalgeneration) to provide an overall carbon saving benetrelative to a condensing boiler.
Operating cycle length is not the only factor affecting carbonsaving performance but it appears to be one of the mostimportant. The implication is that overall system design andintegration to ensure long steady run operation are likely tobe just as important as Micro-CHP unit design and control.
5.6 Improving the power-to-heat ratioAs previously discussed, one of the most important drivers ofthe performance of a Micro-CHP system is its power-to-heatratio. For the Stirling engine Micro-CHP systems in the eldtrial, typical net electrical efciencies of around 6-8% havebeen observed. These are lower than the efciencies typicallyquoted by manufacturers and this is partly because thisanalysis takes into account all electricity consumed as wellas generated by the system over a given period of operation,including the non-generating periods. However, fromdiscussions with leading manufacturers, it is believed thatmore can and is being done to improve the electrical outputof the systems currently under development, includingforthcoming enhanced iterations of currently available units.
In order to demonstrate the importance of electrical efciency,
the annual performance scenarios from Section 4.6 havebeen remodelled for a theoretical Stirling engine Micro-CHPdevice which has a 3% better electrical efciency (takingthe range to 9-11%). It is assumed that the overall efciencyof the system remains constant and the thermal efciencyhas therefore been reduced accordingly.
Figure 60 Comparing CBR against cycle length for Micro-CHP and boilers
100
95
85
90
80
75
60
65
70
0 60 120 180 240
C a r b o n
B e n e f i t s
R a t i o
%
Length of operating cycle (mins)
Domestic Micro-CHPCondensing boiler
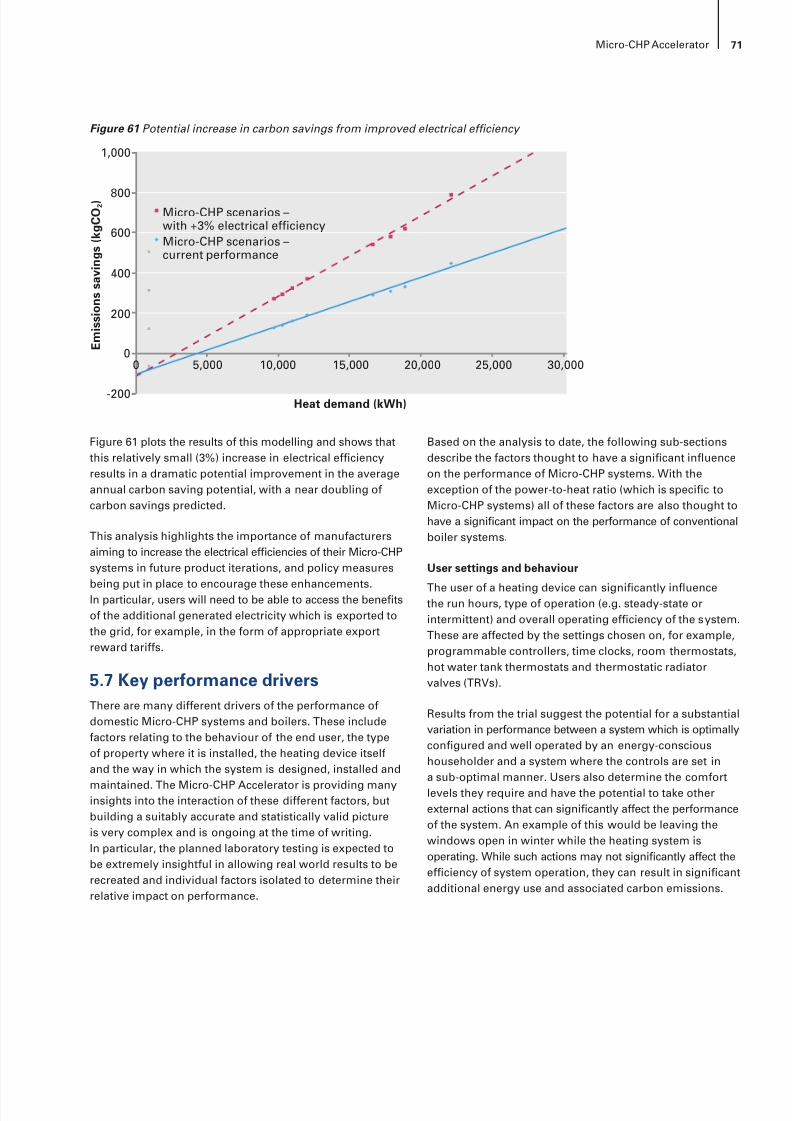
8/6/2019 CHP Accellerator
http://slidepdf.com/reader/full/chp-accellerator 73/104
71Micro-CHP Accelerator
Figure 61 plots the results of this modelling and shows thatthis relatively small (3%) increase in electrical efciencyresults in a dramatic potential improvement in the averageannual carbon saving potential, with a near doubling ofcarbon savings predicted.
This analysis highlights the importance of manufacturersaiming to increase the electrical efciencies of their Micro-CHPsystems in future product iterations, and policy measures
being put in place to encourage these enhancements.In particular, users will need to be able to access the benetsof the additional generated electricity which is exported tothe grid, for example, in the form of appropriate exportreward tariffs.
5.7 Key performance driversThere are many different drivers of the performance ofdomestic Micro-CHP systems and boilers. These includefactors relating to the behaviour of the end user, the typeof property where it is installed, the heating device itselfand the way in which the system is designed, installed and
maintained. The Micro-CHP Accelerator is providing manyinsights into the interaction of these different factors, butbuilding a suitably accurate and statistically valid pictureis very complex and is ongoing at the time of writing.In particular, the planned laboratory testing is expected tobe extremely insightful in allowing real world results to berecreated and individual factors isolated to determine theirrelative impact on performance.
Based on the analysis to date, the following sub-sectionsdescribe the factors thought to have a signicant inuenceon the performance of Micro-CHP systems. With theexception of the power-to-heat ratio (which is specic toMicro-CHP systems) all of these factors are also thought tohave a signicant impact on the performance of conventionalboiler systems.
User settings and behaviour
The user of a heating device can signicantly inuencethe run hours, type of operation (e.g. steady-state orintermittent) and overall operating efciency of the system.These are affected by the settings chosen on, for example,programmable controllers, time clocks, room thermostats,hot water tank thermostats and thermostatic radiatorvalves (TRVs).
Results from the trial suggest the potential for a substantialvariation in performance between a system which is optimallycongured and well operated by an energy-conscioushouseholder and a system where the controls are set ina sub-optimal manner. Users also determine the comfortlevels they require and have the potential to take otherexternal actions that can signicantly affect the performanceof the system. An example of this would be leaving thewindows open in winter while the heating system isoperating. While such actions may not signicantly affect theefciency of system operation, they can result in signicantadditional energy use and associated carbon emissions.
Figure 61 Potential increase in carbon savings from improved electrical efciency
5,000 10,000 15,000 20,000 25,000 30,000
0
1,000
800
600
400
200
-200
0 E m i s s i o n s s a v i n g s
( k g C O
2 )
Heat demand (kWh)
Micro-CHP scenarios –with +3% electrical efficiencyMicro-CHP scenarios –current performance
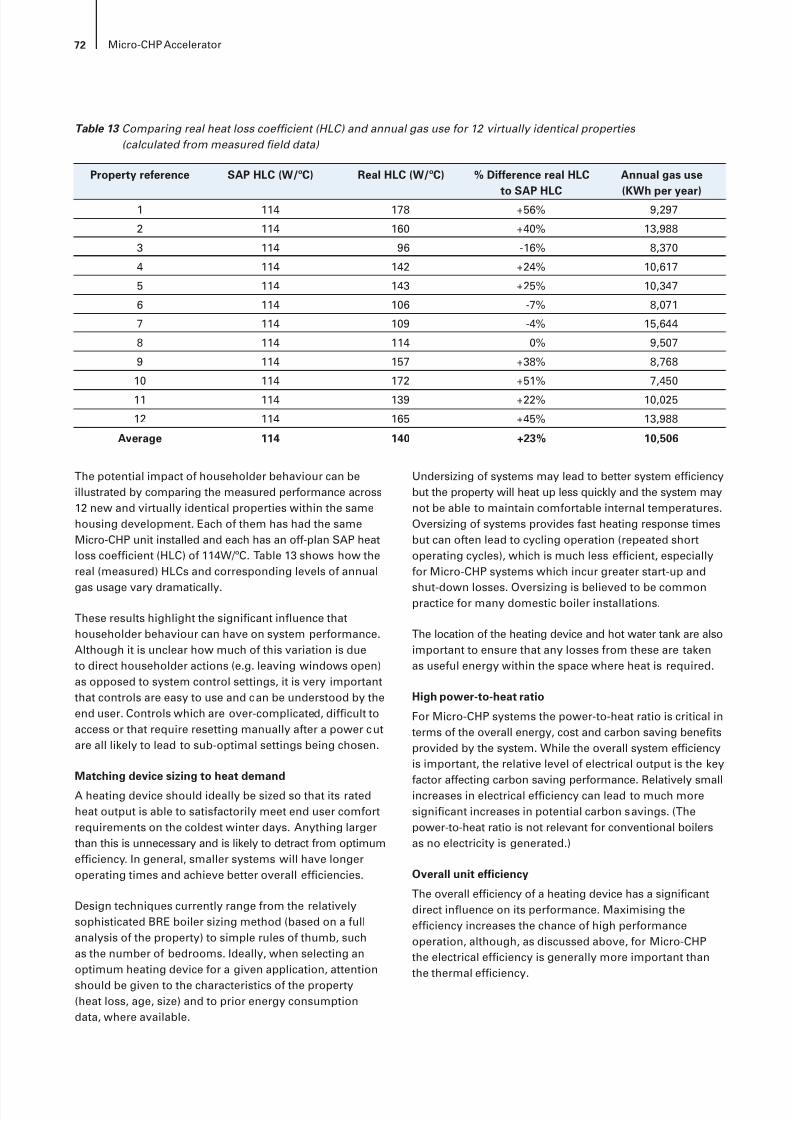
8/6/2019 CHP Accellerator
http://slidepdf.com/reader/full/chp-accellerator 74/104
72 Micro-CHP Accelerator
The potential impact of householder behaviour can beillustrated by comparing the measured performance across12 new and virtually identical properties within the samehousing development. Each of them has had the sameMicro-CHP unit installed and each has an off-plan SAP heatloss coefcient (HLC) of 114W/ºC. Table 13 shows how thereal (measured) HLCs and corresponding levels of annual
gas usage vary dramatically.
These results highlight the signicant inuence thathouseholder behaviour can have on system performance.Although it is unclear how much of this variation is dueto direct householder actions (e.g. leaving windows open)as opposed to system control settings, it is very importantthat controls are easy to use and can be understood by theend user. Controls which are over-complicated, difcult toaccess or that require resetting manually after a power cutare all likely to lead to sub-optimal settings being chosen.
Matching device sizing to heat demand
A heating device should ideally be sized so that its ratedheat output is able to satisfactorily meet end user comfortrequirements on the coldest winter days. Anything largerthan this is unnecessary and is likely to detract from optimumefciency. In general, smaller systems will have longeroperating times and achieve better overall efciencies.
Design techniques currently range from the relativelysophisticated BRE boiler sizing method (based on a fullanalysis of the property) to simple rules of thumb, suchas the number of bedrooms. Ideally, when selecting anoptimum heating device for a given application, attention
should be given to the characteristics of the property(heat loss, age, size) and to prior energy consumptiondata, where available.
Undersizing of systems may lead to better system efciencybut the property will heat up less quickly and the system maynot be able to maintain comfortable internal temperatures.Oversizing of systems provides fast heating response timesbut can often lead to cycling operation (repeated shortoperating cycles), which is much less efcient, especiallyfor Micro-CHP systems which incur greater start-up and
shut-down losses. Oversizing is believed to be commonpractice for many domestic boiler installations.
The location of the heating device and hot water tank are alsoimportant to ensure that any losses from these are takenas useful energy within the space where heat is required.
High power-to-heat ratio
For Micro-CHP systems the power-to-heat ratio is critical interms of the overall energy, cost and carbon saving benetsprovided by the system. While the overall system efciencyis important, the relative level of electrical output is the keyfactor affecting carbon saving performance. Relatively smallincreases in electrical efciency can lead to much moresignicant increases in potential carbon savings. (Thepower-to-heat ratio is not relevant for conventional boilersas no electricity is generated.)
Overall unit efciency
The overall efciency of a heating device has a signicantdirect inuence on its performance. Maximising theefciency increases the chance of high performanceoperation, although, as discussed above, for Micro-CHPthe electrical efciency is generally more important thanthe thermal efciency.
Property reference SAP HLC (W/ºC) Real HLC (W/ºC) % Difference real HLC
to SAP HLC
Annual gas use
(KWh per year)1 114 178 +56% 9,297
2 114 160 +40% 13,988
3 114 96 -16% 8,370
4 114 142 +24% 10,617
5 114 143 +25% 10,347
6 114 106 -7% 8,071
7 114 109 -4% 15,644
8 114 114 0% 9,507
9 114 157 +38% 8,768
10 114 172 +51% 7,450
11 114 139 +22% 10,025
12 114 165 +45% 13,988
Average 114 140 +23% 10,506
Table 13 Comparing real heat loss coefcient (HLC) and annual gas use for 12 virtually identical properties (calculated from measured eld data)
8/6/2019 CHP Accellerator
http://slidepdf.com/reader/full/chp-accellerator 75/104
73Micro-CHP Accelerator
Many steps have been taken in recent years to encouragethe adoption of heating systems with higher overallefciencies, notably the move towards installing A and Brated condensing boilers in domestic environments. While
this is a positive trend, it is important to remember that the1-2% differences between the rated seasonal efciencies ofthe best modern heating systems are likely to be dwarfedin practice by the 10% or greater variation in performance inthe eld due to other factors. The design of modern heatingsystems is such that they can generally achieve their ratedefciency consistently if operated at steady state for extendedperiods. In most installations the differences in actualoperational efciency arise from differences in the integration,control and operation of the device. The installer and enduser therefore have signicant inuence on the practicalefciencies achieved.
Performance of internal control logic
Many modern heating systems use intelligent controllersto determine the optimum heating cycles in order to meeta particular demand for space or water heating. Thesecontrollers analyse data relating to the required heatingprole (from user time clock settings), internal roomtemperatures, room thermostat settings, hot water tankthermostat settings and, in some cases, external temperaturemeasurements. This information is used to determine thepoint at which the system switches on or off, or modulatesto a higher or lower output level.
The performance of the controller is vital to ensure that theappliance operates in the most efcient manner possiblefor any given set of conditions. This is particularly the casefor Micro-CHP systems, where ensuring long run times isvital to achieving high performance. The controller mustalso ensure that other components, such as the pump andfan, operate for the optimum periods of time in order tomaximise the heat delivered to the system and minimisethe system electrical use.
Manufacturers face a complex trade-off between designingappliances to work with standard low-cost controls and
restricting installers to using specic controls which offeroptimal performance but may be more expensive.
The trial has also shown that some householders canbecome frustrated with advanced control logic, particularlyif this means that the heating system starts operating atunexpected times of day or appears not to turn off on request.Manufacturers must take such factors into account whendesigning control algorithms.
Efciency of pump & other ancillary components
There are some heating system components, such as pumps,which can either be integrated within a heating device orare installed separately alongside. Such components requireelectricity and their efciency and run times therefore impactthe overall energy use and carbon emissions. Whetherintegrated within heating devices or installed separately,
it is important that pumps and other ancillary components areas efcient as possible. For example, the best modern pumpsrequire dramatically less energy than traditional pumps.
Furthermore, it is important that such components arecongured such that they only operate when necessaryand at the minimum required power output level. In someinstances found during the trial, pumps have been set tooperate constantly and at higher output levels, signicantlyincreasing the overall electricity consumption by the heatingsystem. Such conguration issues are sometimes attributableto the installer and sometimes to the control settings chosenby the householder. The best examples of modern pumpshave automatic control of power to optimise operation andreduce energy consumption.
Well designed house heating system
The overall performance of a heating device may dependas much on the overall heating system as it does on theinherent behaviour of the device itself. In particular, it isimportant to ensure that the ow and return temperaturesto and from the device are optimised, both to maximiseheating device efciency and to meet customer comfortrequirements. Key factors in the overall design include thesizing and location of radiators and the sizing and thermalperformance of the hot water tank.
Commissioning and integration with rest of heating system
In addition to choosing a correctly sized, high efciencyheating device and ensuring that the house heating systemis well designed, it is also important that the device is wellcommissioned and integrated appropriately with the restof the heating system. For example, the compact heatexchangers used in some modern boilers and Micro-CHPsystems are less tolerant than older systems to the sludgeand debris that may have built up over time. Consequently,the heating circuit should be ushed prior to tting thenew device to prevent premature failure or reductionsin performance.
Many modern appliances require a system by-pass to
maintain minimum water ow. Evidence from the eld trialsuggests that these are often incorrectly sized or adjusted.As this alters the return water temperature, this cansignicantly affect appliance operation and must be takeninto account by installers at the point of commissioning.One solution to this might be to t a pressure operatedvalve on the by-pass.
In addition to the initial commissioning, it is also importantthat the heating device is regularly and well maintainedduring its operating life in order to maximise performance.
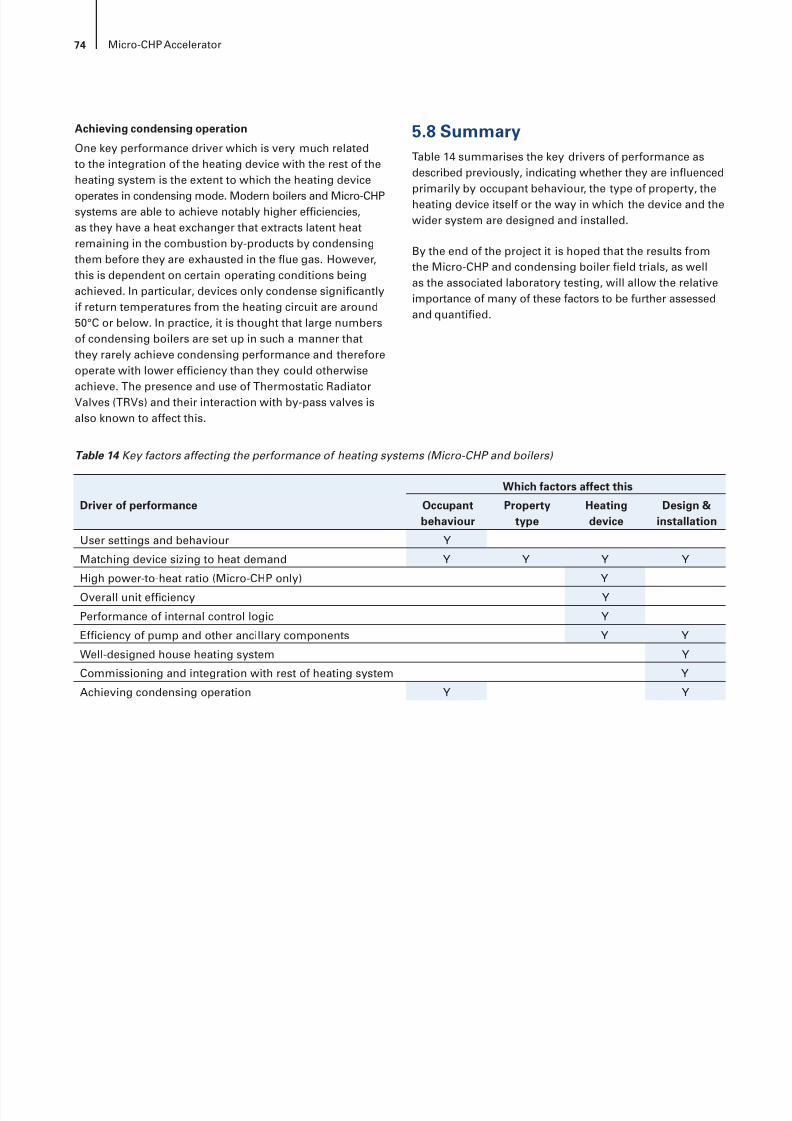
8/6/2019 CHP Accellerator
http://slidepdf.com/reader/full/chp-accellerator 76/104
74 Micro-CHP Accelerator
Achieving condensing operation
One key performance driver which is very much relatedto the integration of the heating device with the rest of theheating system is the extent to which the heating device
operates in condensing mode. Modern boilers and Micro-CHPsystems are able to achieve notably higher efciencies,as they have a heat exchanger that extracts latent heatremaining in the combustion by-products by condensingthem before they are exhausted in the ue gas. However,this is dependent on certain operating conditions beingachieved. In particular, devices only condense signicantlyif return temperatures from the heating circuit are around50°C or below. In practice, it is thought that large numbersof condensing boilers are set up in such a manner thatthey rarely achieve condensing performance and thereforeoperate with lower efciency than they could otherwiseachieve. The presence and use of Thermostatic RadiatorValves (TRVs) and their interaction with by-pass valves isalso known to affect this.
5.8 SummaryTable 14 summarises the key drivers of performance asdescribed previously, indicating whether they are inuencedprimarily by occupant behaviour, the type of property, theheating device itself or the way in which the device and thewider system are designed and installed.
By the end of the project it is hoped that the results fromthe Micro-CHP and condensing boiler eld trials, as wellas the associated laboratory testing, will allow the relativeimportance of many of these factors to be further assessedand quantied.
Driver of performance Occupantbehaviour
Propertytype
Heatingdevice
Design &installation
User settings and behaviour Y
Matching device sizing to heat demand Y Y Y Y
High power-to-heat ratio (Micro-CHP only) Y
Overall unit efciency Y
Performance of internal control logic Y
Efciency of pump and other ancillary components Y Y
Well-designed house heating system Y
Commissioning and integration with rest of heating system Y
Achieving condensing operation Y Y
Table 14 Key factors affecting the performance of heating systems (Micro-CHP and boilers)
Which factors affect this

8/6/2019 CHP Accellerator
http://slidepdf.com/reader/full/chp-accellerator 77/104
75Micro-CHP Accelerator
6 Electrical generation and export
6.1 IntroductionThe results from the eld trial provide interesting andunique insights into the electrical generation proles ofMicro-CHP units and the wider gas and electricity demandproles in the range of different properties in which theyare installed. These aspects of Micro-CHP performance areimportant for two main reasons:
• The economics are highly dependent on the proportionof the generated electricity that is exported from the deviceand the extent to which the owner of the unit is rewardedfor the electricity exported
• Integration into the distribution network presentschallenges, as the UK’s low voltage network was neitherdesigned nor built for the integration of distributedgeneration.
Noting these practical issues, it is accepted that, withinreasonable limits, all the electricity generated by Micro-CHPshould have the same carbon saving benet whether usedwithin the building or exported to the local network.
6.2 Electricity export to gridThe majority of domestic Stirling engine Micro-CHP systemsinvolved in the trials have a maximum electrical poweroutput of around 1kW, in some cases with a further, lowerpower setting producing about 0.7kW of electrical outputwith an associated reduction in heat output. Another systemin the trial has a maximum electrical output of 3kW.
Electricity is only generated by Micro-CHP when there is ademand for heat and thus it may best be seen as a by-productof heating. However, the eld trial results show that while
all the heat supplied is used in the house, a signicantproportion of the electricity generated is exported to the gridbecause electrical demand and heat demand do not coincide.
The electricity demand in a house varies depending on thetime of day, day of week, season and weather conditionsand it also changes second-by-second due to equipmentbeing in operation. Consequently the electricity demandproles for the houses in the eld trial vary greatly bothover time and between different houses.
The minimum demand seen in the trial is typically less than50W and the maximum above 10kW (based on ve-minuteaverages). The electricity generated is used in the house aslong as demand matches or exceeds the output level of theMicro-CHP unit. However, when the household demand fallsbelow this output level, the excess electricity is exportedto the local network. Similarly, when demand in the house ishigher than the output of the Micro-CHP unit, electricity willbe imported from the grid in the normal manner.
The electricity supply and demand proles at individual trialsites show that signicant amounts of electricity are exportedto the grid, even at times of relatively high aggregate demand.This is due to the volatile nature of domestic electricity use,
where the peak demand is often ve to ten times the baseload electricity requirement. On a per-second basis, theelectricity required often exceeds that being generated byMicro-CHP and the output is used in the house. However,for signicant periods, the base load electricity requirementis less than the level being generated by Micro-CHP andthe excess is exported.
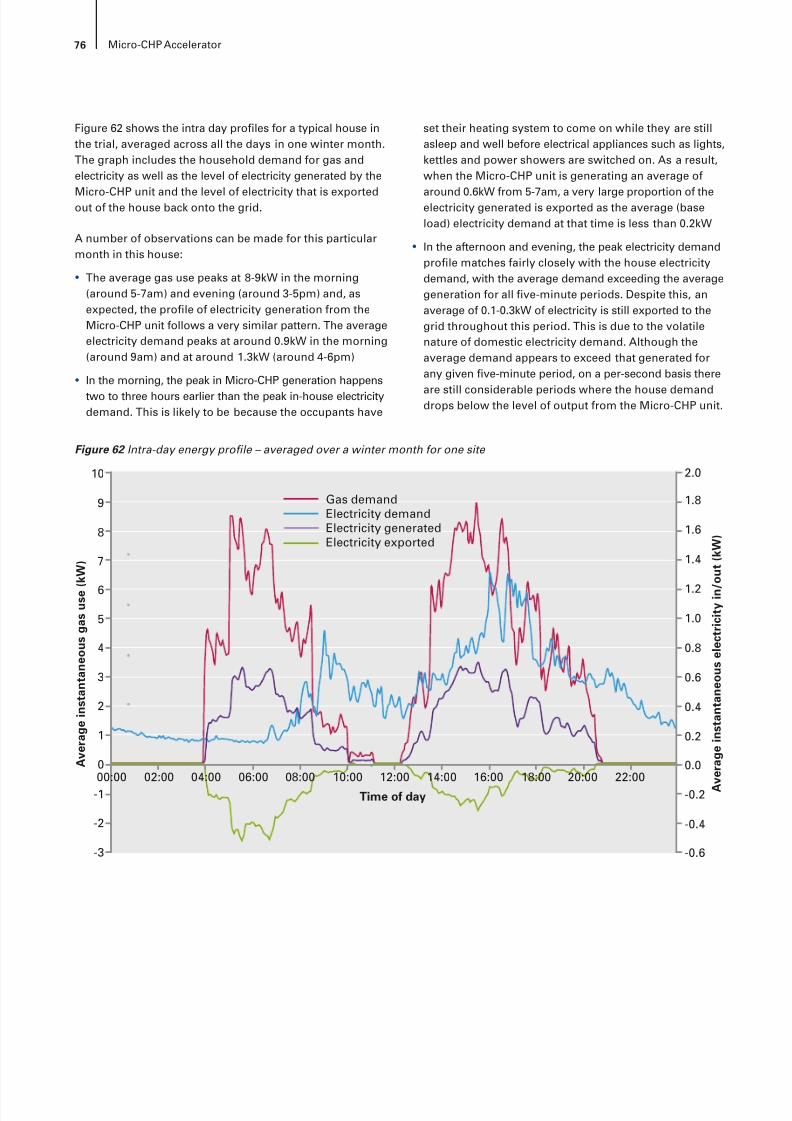
8/6/2019 CHP Accellerator
http://slidepdf.com/reader/full/chp-accellerator 78/104
76 Micro-CHP Accelerator
Figure 62 shows the intra day proles for a typical house inthe trial, averaged across all the days in one winter month.The graph includes the household demand for gas andelectricity as well as the level of electricity generated by the
Micro-CHP unit and the level of electricity that is exportedout of the house back onto the grid.
A number of observations can be made for this particularmonth in this house:
• The average gas use peaks at 8-9kW in the morning(around 5-7am) and evening (around 3-5pm) and, asexpected, the prole of electricity generation from theMicro-CHP unit follows a very similar pattern. The averageelectricity demand peaks at around 0.9kW in the morning(around 9am) and at around 1.3kW (around 4-6pm)
• In the morning, the peak in Micro-CHP generation happens
two to three hours earlier than the peak in-house electricitydemand. This is likely to be because the occupants have
set their heating system to come on while they are stillasleep and well before electrical appliances such as lights,kettles and power showers are switched on. As a result,when the Micro-CHP unit is generating an average of
around 0.6kW from 5-7am, a very large proportion of theelectricity generated is exported as the average (baseload) electricity demand at that time is less than 0.2kW
• In the afternoon and evening, the peak electricity demandprole matches fairly closely with the house electricitydemand, with the average demand exceeding the averagegeneration for all ve-minute periods. Despite this, anaverage of 0.1-0.3kW of electricity is still exported to thegrid throughout this period. This is due to the volatilenature of domestic electricity demand. Although theaverage demand appears to exceed that generated forany given ve-minute period, on a per-second basis there
are still considerable periods where the house demanddrops below the level of output from the Micro-CHP unit.
Figure 62 Intra-day energy prole – averaged over a winter month for one site
7
8
10 2.0
1.8
1.6
1.4
1.2
1.0
0.8
0.6
0.4
0.2
0.0
5
4
0
2
A v e r a g e
i n s t a n t a n e o u s g a s u s e
( k W )
A v e r a g e
i n s t a n t a n e o u s e l e c t r i c i t y
i n / o u t ( k W )
Time of day
04:0002:00 06:00 10:0008:00 12:00 14:00 18:0016:00 20:00 22:00
3
1
-2
-1
-3
6
9
-0.2
-0.4
-0.6
Gas demandElectricity demandElectricity generatedElectricity exported
00:00
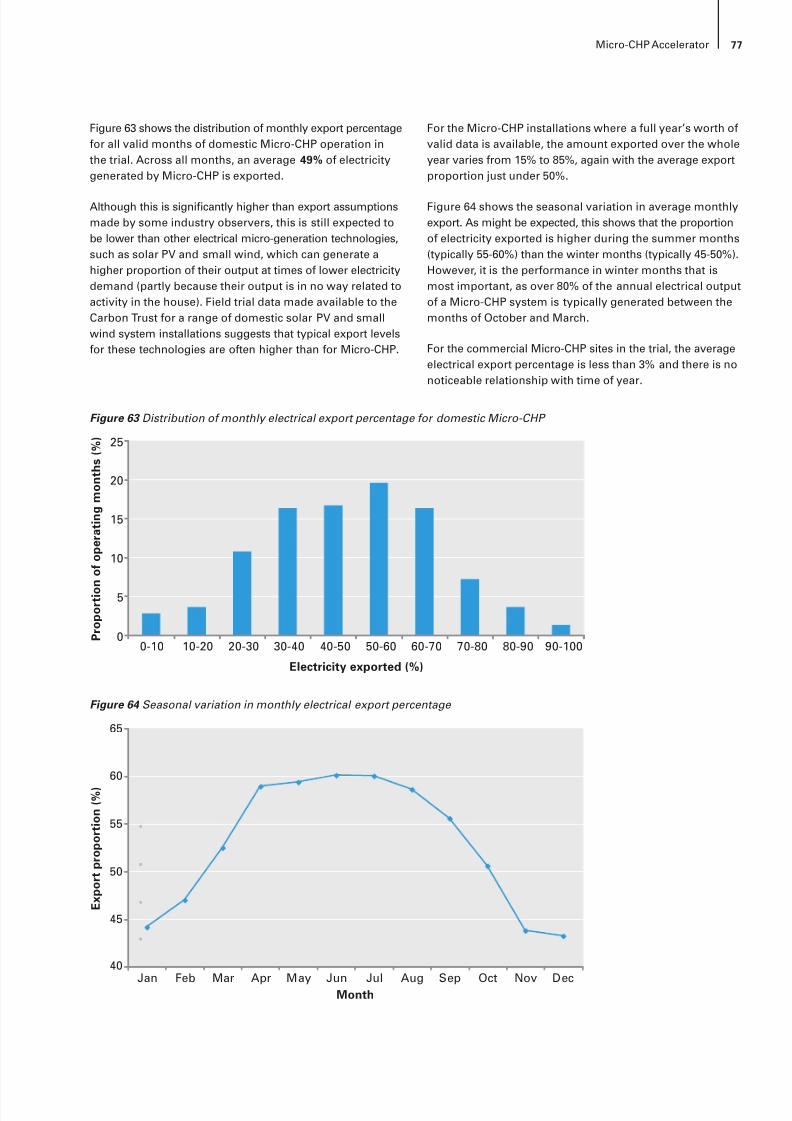
8/6/2019 CHP Accellerator
http://slidepdf.com/reader/full/chp-accellerator 79/104
77Micro-CHP Accelerator
Figure 63 shows the distribution of monthly export percentagefor all valid months of domestic Micro-CHP operation inthe trial. Across all months, an average 49% of electricitygenerated by Micro-CHP is exported.
Although this is signicantly higher than export assumptionsmade by some industry observers, this is still expected tobe lower than other electrical micro-generation technologies,such as solar PV and small wind, which can generate ahigher proportion of their output at times of lower electricitydemand (partly because their output is in no way related toactivity in the house). Field trial data made available to theCarbon Trust for a range of domestic solar PV and smallwind system installations suggests that typical export levelsfor these technologies are often higher than for Micro-CHP.
For the Micro-CHP installations where a full year’s worth ofvalid data is available, the amount exported over the wholeyear varies from 15% to 85%, again with the average exportproportion just under 50%.
Figure 64 shows the seasonal variation in average monthlyexport. As might be expected, this shows that the proportionof electricity exported is higher during the summer months(typically 55-60%) than the winter months (typically 45-50%).However, it is the performance in winter months that ismost important, as over 80% of the annual electrical outputof a Micro-CHP system is typically generated between themonths of October and March.
For the commercial Micro-CHP sites in the trial, the averageelectrical export percentage is less than 3% and there is nonoticeable relationship with time of year.
Figure 63 Distribution of monthly electrical export percentage for domestic Micro-CHP
Electricity exported (%)
P r o p o r t i o n o f o p e r a t i n g m o n t h s
( % )
0-10 10-20 20-30 30-40 40-50 50-60 60-70 70-80 80-90 90-1000
5
10
15
20
25
Figure 64 Seasonal variation in monthly electrical export percentage
65
60
55
50
40
Jan MarFeb Apr May Jun Jul Aug Sep Oct Nov Dec
45 E x p o r t p r o p o r t i o n
( % )
Month
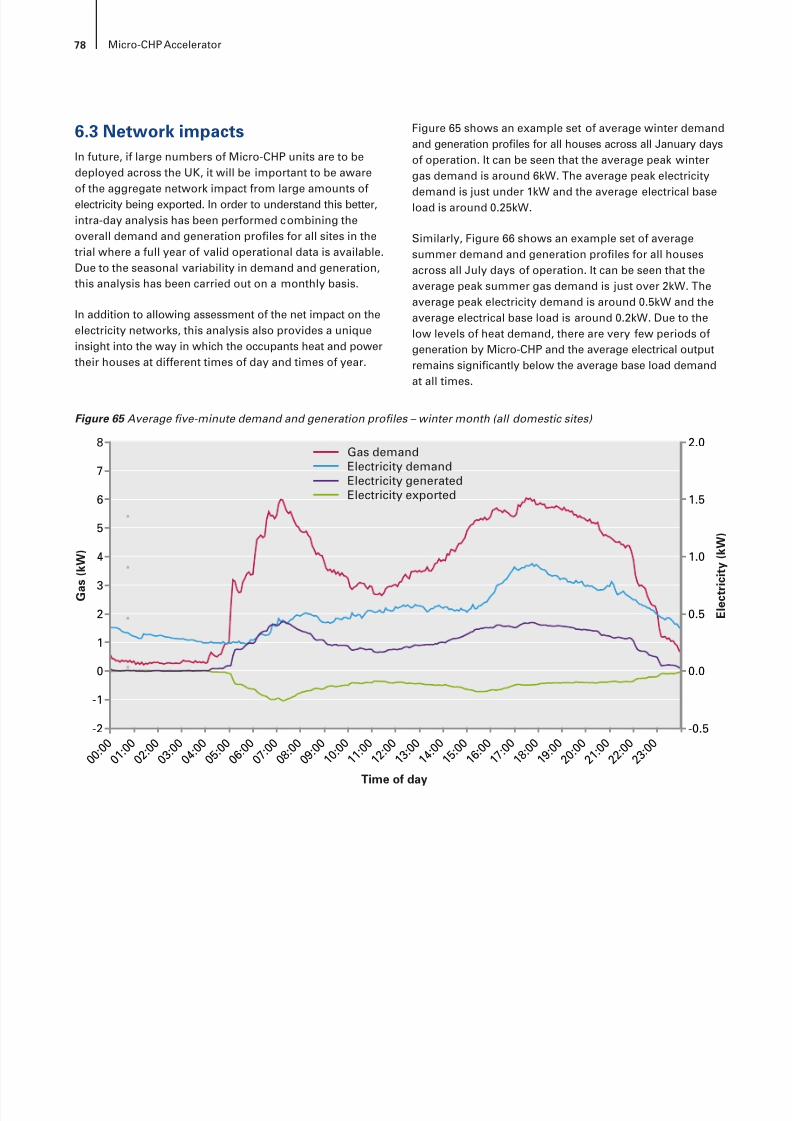
8/6/2019 CHP Accellerator
http://slidepdf.com/reader/full/chp-accellerator 80/104
78 Micro-CHP Accelerator
6.3 Network impactsIn future, if large numbers of Micro-CHP units are to bedeployed across the UK, it will be important to be awareof the aggregate network impact from large amounts ofelectricity being exported. In order to understand this better,intra-day analysis has been performed combining theoverall demand and generation proles for all sites in thetrial where a full year of valid operational data is available.Due to the seasonal variability in demand and generation,this analysis has been carried out on a monthly basis.
In addition to allowing assessment of the net impact on theelectricity networks, this analysis also provides a uniqueinsight into the way in which the occupants heat and powertheir houses at different times of day and times of year.
Figure 65 shows an example set of average winter demandand generation proles for all houses across all January daysof operation. It can be seen that the average peak wintergas demand is around 6kW. The average peak electricity
demand is just under 1kW and the average electrical baseload is around 0.25kW.
Similarly, Figure 66 shows an example set of averagesummer demand and generation proles for all housesacross all July days of operation. It can be seen that theaverage peak summer gas demand is just over 2kW. Theaverage peak electricity demand is around 0.5kW and theaverage electrical base load is around 0.2kW. Due to thelow levels of heat demand, there are very few periods ofgeneration by Micro-CHP and the average electrical outputremains signicantly below the average base load demandat all times.
Figure 65 Average ve-minute demand and generation proles – winter month (all domestic sites)
G a s
( k W )
E l e c t r i c i t y ( k W )
Time of day
-2
-1
0
1
2
3
4
5
6
7
8
0 0 : 0 0
0 1 : 0 0
0 2 : 0 0
0 3 : 0 0
0 4 : 0 0
0 5 : 0 0
0 6 : 0 0
0 7 : 0 0
0 8 : 0 0
0 9 : 0 0
1 0 : 0 0
1 1 : 0 0
1 2 : 0 0
1 3 : 0 0
1 4 : 0 0
1 5 : 0 0
1 6 : 0 0
1 7 : 0 0
1 8 : 0 0
1 9 : 0 0
2 0 : 0 0
2 1 : 0 0
2 2 : 0 0
2 3 : 0 0
-0.5
0.0
0.5
1.0
1.5
2.0Gas demandElectricity demandElectricity generatedElectricity exported
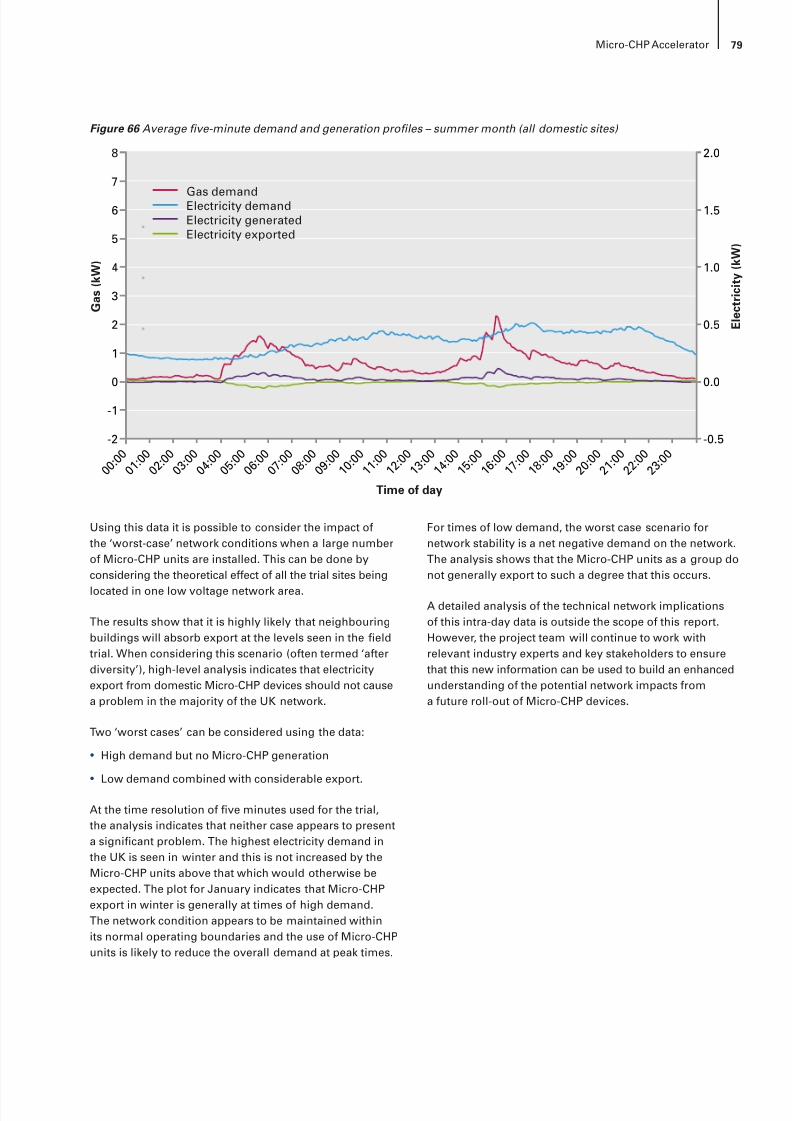
8/6/2019 CHP Accellerator
http://slidepdf.com/reader/full/chp-accellerator 81/104
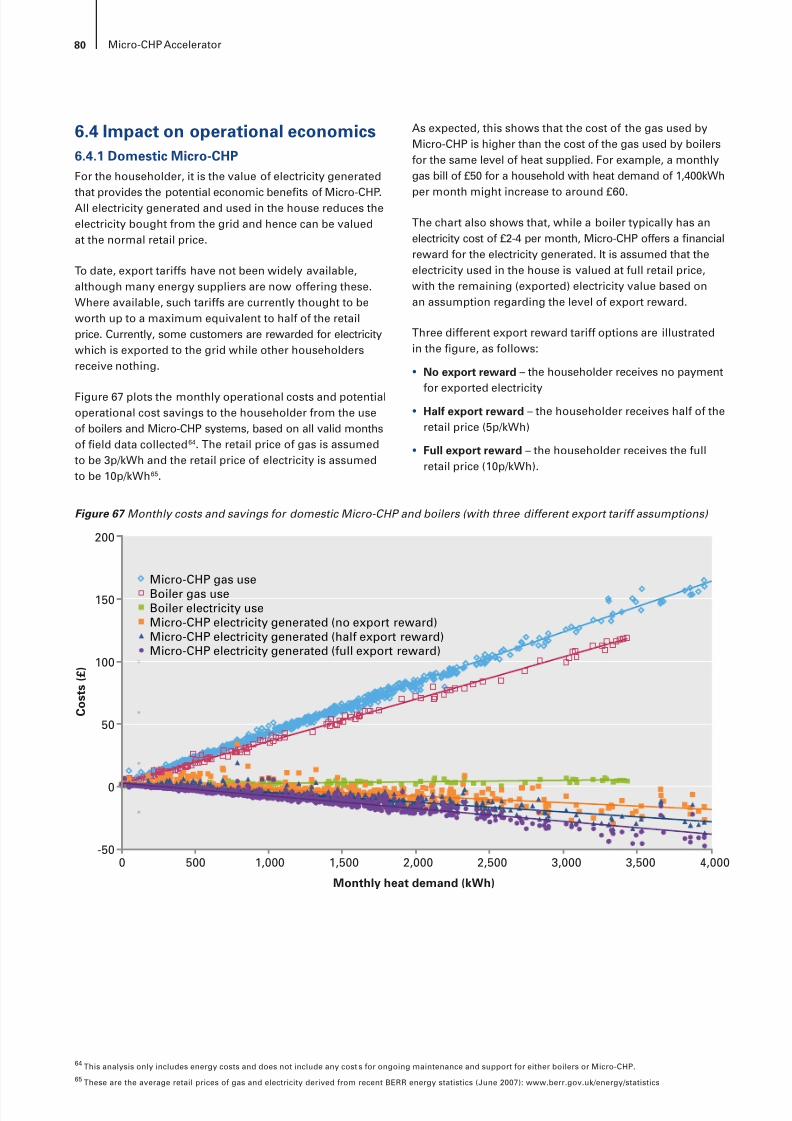
8/6/2019 CHP Accellerator
http://slidepdf.com/reader/full/chp-accellerator 82/104
80 Micro-CHP Accelerator
6.4 Impact on operational economics6.4.1 Domestic Micro-CHPFor the householder, it is the value of electricity generated
that provides the potential economic benets of Micro-CHP.All electricity generated and used in the house reduces theelectricity bought from the grid and hence can be valuedat the normal retail price.
To date, export tariffs have not been widely available,although many energy suppliers are now offering these.Where available, such tariffs are currently thought to beworth up to a maximum equivalent to half of the retailprice. Currently, some customers are rewarded for electricitywhich is exported to the grid while other householdersreceive nothing.
Figure 67 plots the monthly operational costs and potentialoperational cost savings to the householder from the useof boilers and Micro-CHP systems, based on all valid monthsof eld data collected 64 . The retail price of gas is assumedto be 3p/kWh and the retail price of electricity is assumedto be 10p/kWh 65 .
As expected, this shows that the cost of the gas used byMicro-CHP is higher than the cost of the gas used by boilersfor the same level of heat supplied. For example, a monthlygas bill of £50 for a household with heat demand of 1,400kWh
per month might increase to around £60.
The chart also shows that, while a boiler typically has anelectricity cost of £2-4 per month, Micro-CHP offers a nancialreward for the electricity generated. It is assumed that theelectricity used in the house is valued at full retail price,with the remaining (exported) electricity value based onan assumption regarding the level of export reward.
Three different export reward tariff options are illustratedin the gure, as follows:
• No export reward – the householder receives no payment
for exported electricity• Half export reward – the householder receives half of the
retail price (5p/kWh)
• Full export reward – the householder receives the fullretail price (10p/kWh).
Figure 67 Monthly costs and savings for domestic Micro-CHP and boilers (with three different export tariff assumptions)
200
150
50
-500 500 1,000 1,500 2,000 2,500 3,000 3,500 4,000
0
100
C o s t s
( £ )
Monthly heat demand (kWh)
Micro-CHP gas useBoiler gas useBoiler electricity useMicro-CHP electricity generated (no export reward)Micro-CHP electricity generated (half export reward)Micro-CHP electricity generated (full export reward)
64 This analysis only includes energy costs and does not include any cost s for ongoing maintenance and support for either boilers or Micro-CHP.65 These are the average retail prices of gas and electricity derived from recent BERR energy statistics (June 2007): www.berr.gov.uk/energy/statistics
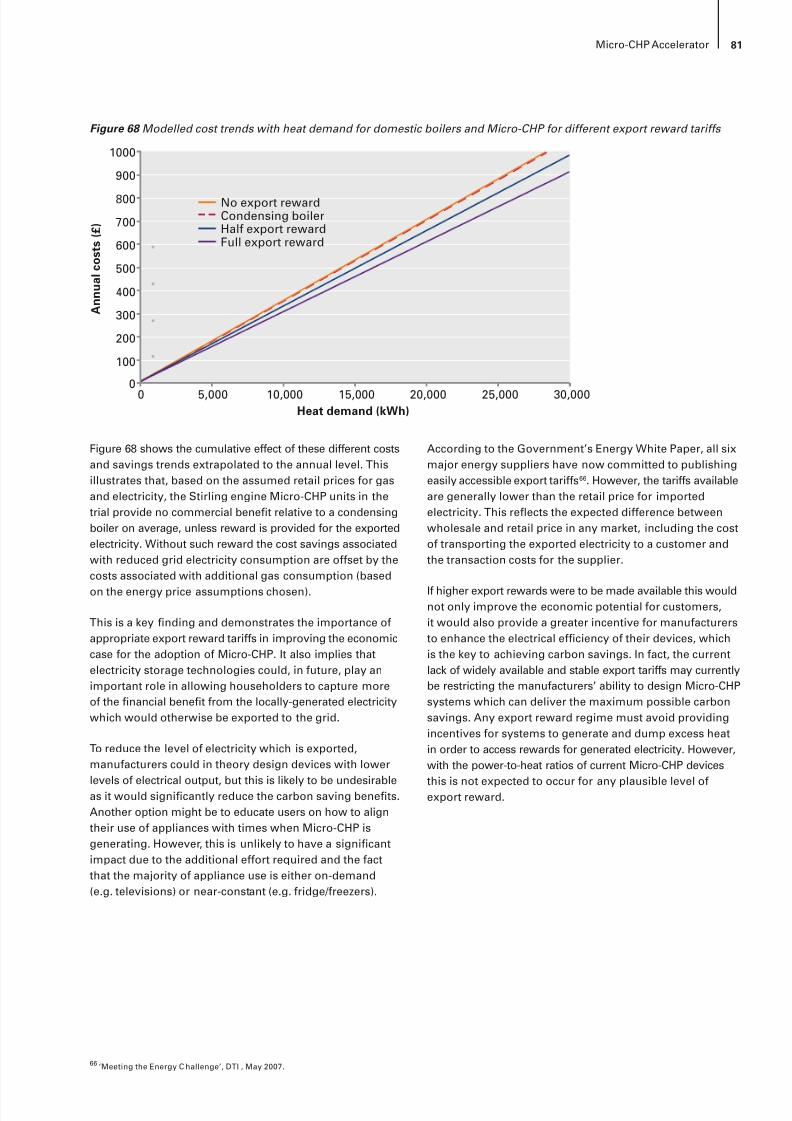
8/6/2019 CHP Accellerator
http://slidepdf.com/reader/full/chp-accellerator 83/104
81Micro-CHP Accelerator
Figure 68 shows the cumulative effect of these different costsand savings trends extrapolated to the annual level. Thisillustrates that, based on the assumed retail prices for gasand electricity, the Stirling engine Micro-CHP units in thetrial provide no commercial benet relative to a condensingboiler on average, unless reward is provided for the exportedelectricity. Without such reward the cost savings associatedwith reduced grid electricity consumption are offset by thecosts associated with additional gas consumption (based
on the energy price assumptions chosen).
This is a key nding and demonstrates the importance ofappropriate export reward tariffs in improving the economiccase for the adoption of Micro-CHP. It also implies thatelectricity storage technologies could, in future, play animportant role in allowing householders to capture moreof the nancial benet from the locally-generated electricitywhich would otherwise be exported to the grid.
To reduce the level of electricity which is exported,manufacturers could in theory design devices with lower
levels of electrical output, but this is likely to be undesirableas it would signicantly reduce the carbon saving benets.Another option might be to educate users on how to aligntheir use of appliances with times when Micro-CHP isgenerating. However, this is unlikely to have a signicantimpact due to the additional effort required and the factthat the majority of appliance use is either on-demand(e.g. televisions) or near-constant (e.g. fridge/freezers).
According to the Government’s Energy White Paper, all sixmajor energy suppliers have now committed to publishingeasily accessible export tariffs 66. However, the tariffs availableare generally lower than the retail price for importedelectricity. This reects the expected difference betweenwholesale and retail price in any market, including the costof transporting the exported electricity to a customer andthe transaction costs for the supplier.
If higher export rewards were to be made available this wouldnot only improve the economic potential for customers,it would also provide a greater incentive for manufacturersto enhance the electrical efciency of their devices, whichis the key to achieving carbon savings. In fact, the currentlack of widely available and stable export tariffs may currentlybe restricting the manufacturers’ ability to design Micro-CHPsystems which can deliver the maximum possible carbonsavings. Any export reward regime must avoid providingincentives for systems to generate and dump excess heatin order to access rewards for generated electricity. However,with the power-to-heat ratios of current Micro-CHP devices
this is not expected to occur for any plausible level ofexport reward.
Figure 68 Modelled cost trends with heat demand for domestic boilers and Micro-CHP for different export reward tariffs
500
400
200
00 5,000 10,000 15,000 20,000 25,000 30,000
600
700
800
900
1000
100
300 A n n u a l c o s t s
( £ )
Heat demand (kWh)
No export rewardCondensing boilerHalf export rewardFull export reward
66 ‘Meeting the Energy C hallenge’, DTI , May 2007.
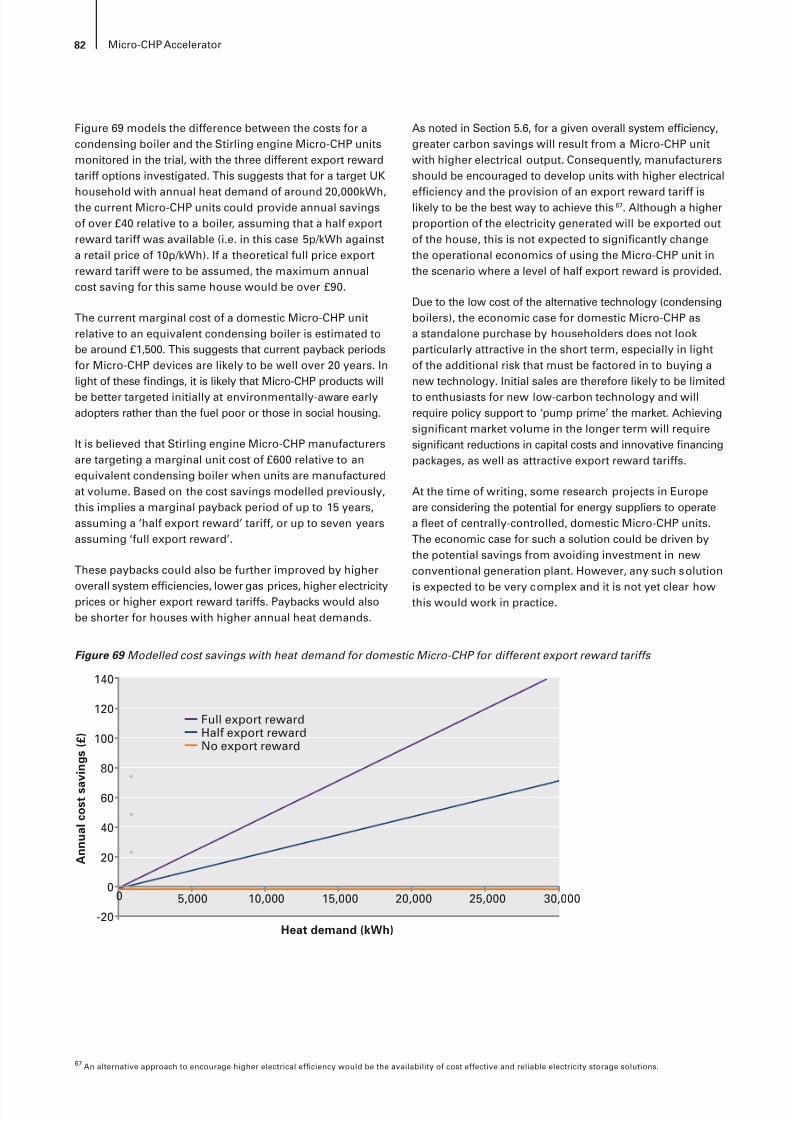
8/6/2019 CHP Accellerator
http://slidepdf.com/reader/full/chp-accellerator 84/104
82 Micro-CHP Accelerator
Figure 69 models the difference between the costs for acondensing boiler and the Stirling engine Micro-CHP unitsmonitored in the trial, with the three different export rewardtariff options investigated. This suggests that for a target UK
household with annual heat demand of around 20,000kWh,the current Micro-CHP units could provide annual savingsof over £40 relative to a boiler, assuming that a half exportreward tariff was available (i.e. in this case 5p/kWh againsta retail price of 10p/kWh). If a theoretical full price exportreward tariff were to be assumed, the maximum annualcost saving for this same house would be over £90.
The current marginal cost of a domestic Micro-CHP unitrelative to an equivalent condensing boiler is estimated tobe around £1,500. This suggests that current payback periodsfor Micro-CHP devices are likely to be well over 20 years. Inlight of these ndings, it is likely that Micro-CHP products willbe better targeted initially at environmentally-aware earlyadopters rather than the fuel poor or those in social housing.
It is believed that Stirling engine Micro-CHP manufacturersare targeting a marginal unit cost of £600 relative to anequivalent condensing boiler when units are manufacturedat volume. Based on the cost savings modelled previously,this implies a marginal payback period of up to 15 years,assuming a ‘half export reward’ tariff, or up to seven yearsassuming ‘full export reward’.
These paybacks could also be further improved by higher
overall system efciencies, lower gas prices, higher electricityprices or higher export reward tariffs. Paybacks would alsobe shorter for houses with higher annual heat demands.
As noted in Section 5.6, for a given overall system efciency,greater carbon savings will result from a Micro-CHP unitwith higher electrical output. Consequently, manufacturersshould be encouraged to develop units with higher electrical
efciency and the provision of an export reward tariff islikely to be the best way to achieve this 67 . Although a higherproportion of the electricity generated will be exported outof the house, this is not expected to signicantly changethe operational economics of using the Micro-CHP unit inthe scenario where a level of half export reward is provided.
Due to the low cost of the alternative technology (condensingboilers), the economic case for domestic Micro-CHP asa standalone purchase by householders does not lookparticularly attractive in the short term, especially in lightof the additional risk that must be factored in to buying anew technology. Initial sales are therefore likely to be limitedto enthusiasts for new low-carbon technology and willrequire policy support to ‘pump prime’ the market. Achievingsignicant market volume in the longer term will requiresignicant reductions in capital costs and innovative nancingpackages, as well as attractive export reward tariffs.
At the time of writing, some research projects in Europeare considering the potential for energy suppliers to operatea eet of centrally-controlled, domestic Micro-CHP units.The economic case for such a solution could be driven bythe potential savings from avoiding investment in newconventional generation plant. However, any such solution
is expected to be very complex and it is not yet clear howthis would work in practice.
Figure 69 Modelled cost savings with heat demand for domestic Micro-CHP for different export reward tariffs
100
80
20
40
-20
0 5,000 10,000 15,000 20,000 25,000 30,000
120
140
0
60
A n n u a l c o s t s a v i n g s
( £ )
Heat demand (kWh)
Full export rewardHalf export rewardNo export reward
67 An alternative approach to encourage higher electrical efciency would be the availability of cost effective and reliable electricity storage solutions.
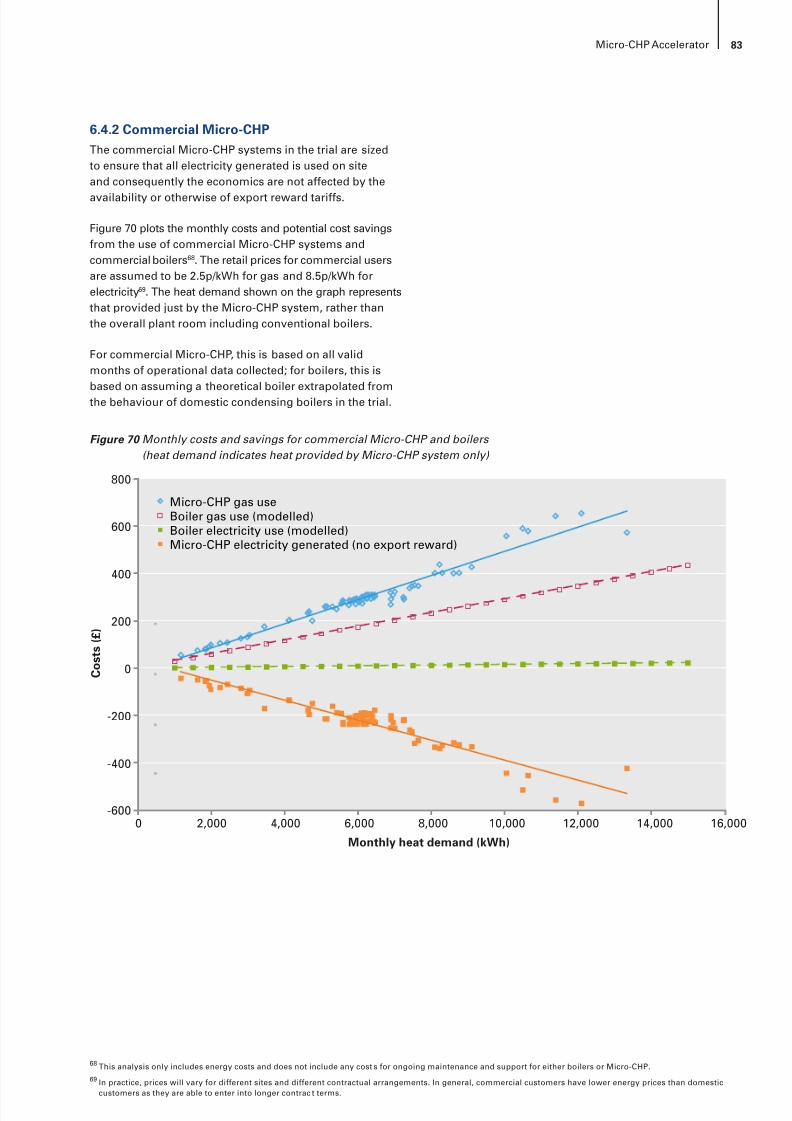
8/6/2019 CHP Accellerator
http://slidepdf.com/reader/full/chp-accellerator 85/104
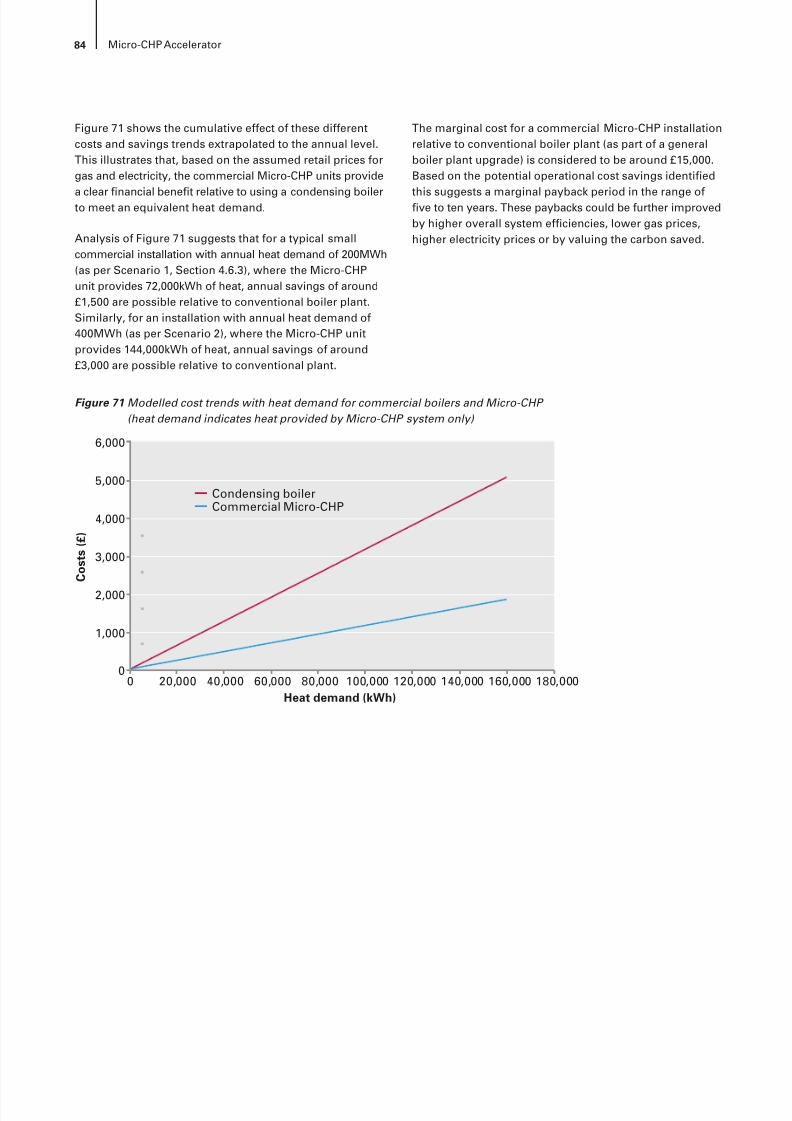
8/6/2019 CHP Accellerator
http://slidepdf.com/reader/full/chp-accellerator 86/104
84 Micro-CHP Accelerator
Figure 71 shows the cumulative effect of these differentcosts and savings trends extrapolated to the annual level.This illustrates that, based on the assumed retail prices forgas and electricity, the commercial Micro-CHP units provide
a clear nancial benet relative to using a condensing boilerto meet an equivalent heat demand.
Analysis of Figure 71 suggests that for a typical smallcommercial installation with annual heat demand of 200MWh(as per Scenario 1, Section 4.6.3), where the Micro-CHPunit provides 72,000kWh of heat, annual savings of around£1,500 are possible relative to conventional boiler plant.Similarly, for an installation with annual heat demand of400MWh (as per Scenario 2), where the Micro-CHP unitprovides 144,000kWh of heat, annual savings of around£3,000 are possible relative to conventional plant.
The marginal cost for a commercial Micro-CHP installationrelative to conventional boiler plant (as part of a generalboiler plant upgrade) is considered to be around £15,000.Based on the potential operational cost savings identied
this suggests a marginal payback period in the range ofve to ten years. These paybacks could be further improvedby higher overall system efciencies, lower gas prices,higher electricity prices or by valuing the carbon saved.
Figure 71 Modelled cost trends with heat demand for commercial boilers and Micro-CHP (heat demand indicates heat provided by Micro-CHP system only)
5,000
4,000
2,000
00 20,000 40,000 60,000 80,000 100,000 120,000 140,000 160,000 180,000
6,000
1,000
3,000
C o s t s
( £ )
Heat demand (kWh)
Condensing boilerCommercial Micro-CHP
8/6/2019 CHP Accellerator
http://slidepdf.com/reader/full/chp-accellerator 87/104
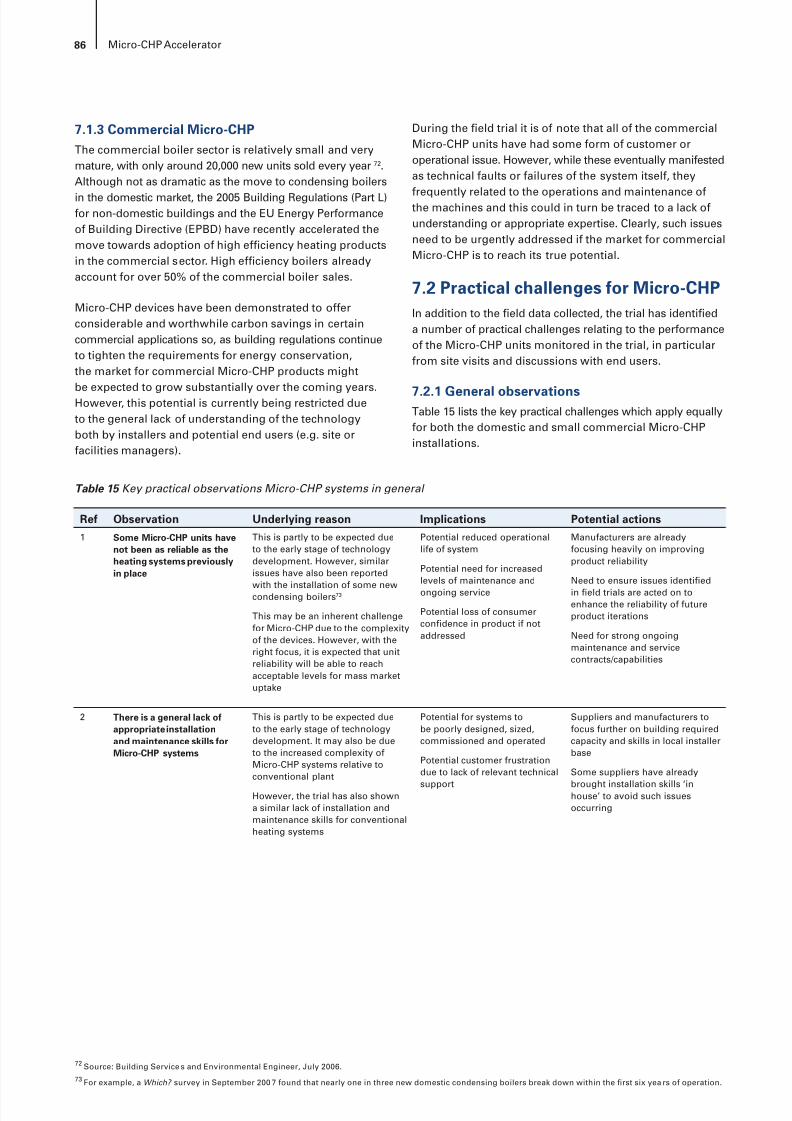
8/6/2019 CHP Accellerator
http://slidepdf.com/reader/full/chp-accellerator 88/104
86 Micro-CHP Accelerator
7.1.3 Commercial Micro-CHPThe commercial boiler sector is relatively small and verymature, with only around 20,000 new units sold every year 72.Although not as dramatic as the move to condensing boilers
in the domestic market, the 2005 Building Regulations (Part L)for non-domestic buildings and the EU Energy Performanceof Building Directive (EPBD) have recently accelerated themove towards adoption of high efciency heating productsin the commercial sector. High efciency boilers alreadyaccount for over 50% of the commercial boiler sales.
Micro-CHP devices have been demonstrated to offerconsiderable and worthwhile carbon savings in certaincommercial applications so, as building regulations continueto tighten the requirements for energy conservation,the market for commercial Micro-CHP products might
be expected to grow substantially over the coming years.However, this potential is currently being restricted dueto the general lack of understanding of the technologyboth by installers and potential end users (e.g. site orfacilities managers).
During the eld trial it is of note that all of the commercialMicro-CHP units have had some form of customer oroperational issue. However, while these eventually manifestedas technical faults or failures of the system itself, they
frequently related to the operations and maintenance ofthe machines and this could in turn be traced to a lack ofunderstanding or appropriate expertise. Clearly, such issuesneed to be urgently addressed if the market for commercialMicro-CHP is to reach its true potential.
7.2 Practical challenges for Micro-CHPIn addition to the eld data collected, the trial has identieda number of practical challenges relating to the performanceof the Micro-CHP units monitored in the trial, in particularfrom site visits and discussions with end users.
7.2.1 General observationsTable 15 lists the key practical challenges which apply equallyfor both the domestic and small commercial Micro-CHPinstallations.
72 Source: Building Service s and Environmental Engineer, July 2006.73 For example, a Which? survey in September 200 7 found that nearly one in three new domestic condensing boilers break down within the rst six yea rs of operation.
Ref Observation Underlying reason Implications Potential actions1 Some Micro-CHP units have
not been as reliable as theheating systems previouslyin place
This is partly to be expected dueto the early stage of technologydevelopment. However, similarissues have also been reported
with the installation of some newcondensing boilers 73
This may be an inherent challengefor Micro-CHP due to the complexityof the devices. However, with theright focus, it is expected that unitreliability will be able to reachacceptable levels for mass marketuptake
Potential reduced operationallife of system
Potential need for increasedlevels of maintenance andongoing service
Potential loss of consumercondence in product if notaddressed
Manufacturers are alreadyfocusing heavily on improvingproduct reliability
Need to ensure issues identiedin eld trials are acted on toenhance the reliability of futureproduct iterations
Need for strong ongoingmaintenance and servicecontracts/capabilities
2 There is a general lack ofappropriate installationand maintenance skills forMicro-CHP systems
This is partly to be expected dueto the early stage of technologydevelopment. It may also be dueto the increased complexity ofMicro-CHP systems relative toconventional plant
However, the trial has also showna similar lack of installation andmaintenance skills for conventionalheating systems
Potential for systems tobe poorly designed, sized,commissioned and operated
Potential customer frustrationdue to lack of relevant technical
support
Suppliers and manufacturers tofocus further on building requiredcapacity and skills in local installerbase
Some suppliers have already
brought installation skills ‘inhouse’ to avoid such issuesoccurring
Table 15 Key practical observations Micro-CHP systems in general
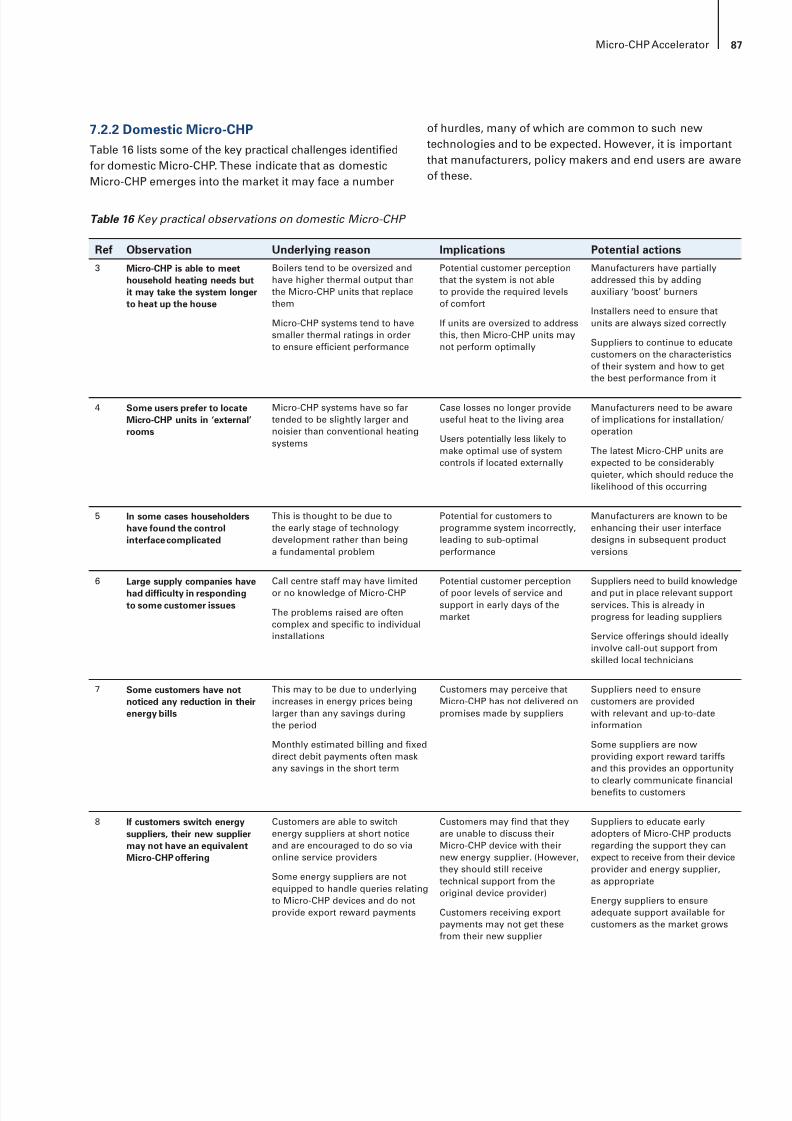
8/6/2019 CHP Accellerator
http://slidepdf.com/reader/full/chp-accellerator 89/104
87Micro-CHP Accelerator
7.2.2 Domestic Micro-CHPTable 16 lists some of the key practical challenges identiedfor domestic Micro-CHP. These indicate that as domesticMicro-CHP emerges into the market it may face a number
of hurdles, many of which are common to such newtechnologies and to be expected. However, it is importantthat manufacturers, policy makers and end users are awareof these.
Ref Observation Underlying reason Implications Potential actions3 Micro-CHP is able to meet
household heating needs butit may take the system longerto heat up the house
Boilers tend to be oversized andhave higher thermal output thanthe Micro-CHP units that replacethem
Micro-CHP systems tend to havesmaller thermal ratings in orderto ensure efcient performance
Potential customer perceptionthat the system is not ableto provide the required levelsof comfort
If units are oversized to addressthis, then Micro-CHP units maynot perform optimally
Manufacturers have partiallyaddressed this by addingauxiliary ‘boost’ burners
Installers need to ensure thatunits are always sized correctly
Suppliers to continue to educatecustomers on the characteristicsof their system and how to getthe best performance from it
4 Some users prefer to locateMicro-CHP units in ‘external’rooms
Micro-CHP systems have so fartended to be slightly larger andnoisier than conventional heatingsystems
Case losses no longer provideuseful heat to the living area
Users potentially less likely tomake optimal use of systemcontrols if located externally
Manufacturers need to be awareof implications for installation/ operation
The latest Micro-CHP units areexpected to be considerablyquieter, which should reduce thelikelihood of this occurring
5 In some cases householdershave found the controlinterface complicated
This is thought to be due tothe early stage of technologydevelopment rather than beinga fundamental problem
Potential for customers toprogramme system incorrectly,leading to sub-optimalperformance
Manufacturers are known to beenhancing their user interfacedesigns in subsequent productversions
6 Large supply companies havehad difculty in respondingto some customer issues
Call centre staff may have limitedor no knowledge of Micro-CHP
The problems raised are oftencomplex and specic to individualinstallations
Potential customer perceptionof poor levels of service andsupport in early days of themarket
Suppliers need to build knowledgeand put in place relevant supportservices. This is already inprogress for leading suppliers
Service offerings should ideallyinvolve call-out support fromskilled local technicians
7 Some customers have notnoticed any reduction in theirenergy bills
This may to be due to underlyingincreases in energy prices beinglarger than any savings duringthe period
Monthly estimated billing and xeddirect debit payments often maskany savings in the short term
Customers may perceive thatMicro-CHP has not delivered onpromises made by suppliers
Suppliers need to ensurecustomers are providedwith relevant and up-to-dateinformation
Some suppliers are nowproviding export reward tariffsand this provides an opportunityto clearly communicate nancialbenets to customers
8 If customers switch energysuppliers, their new suppliermay not have an equivalentMicro-CHP offering
Customers are able to switchenergy suppliers at short noticeand are encouraged to do so viaonline service providers
Some energy suppliers are notequipped to handle queries relatingto Micro-CHP devices and do notprovide export reward payments
Customers may nd that theyare unable to discuss theirMicro-CHP device with theirnew energy supplier. (However,they should still receivetechnical support from theoriginal device provider)
Customers receiving exportpayments may not get thesefrom their new supplier
Suppliers to educate earlyadopters of Micro-CHP productsregarding the support they canexpect to receive from their deviceprovider and energy supplier,as appropriate
Energy suppliers to ensureadequate support available forcustomers as the market grows
Table 16 Key practical observations on domestic Micro-CHP
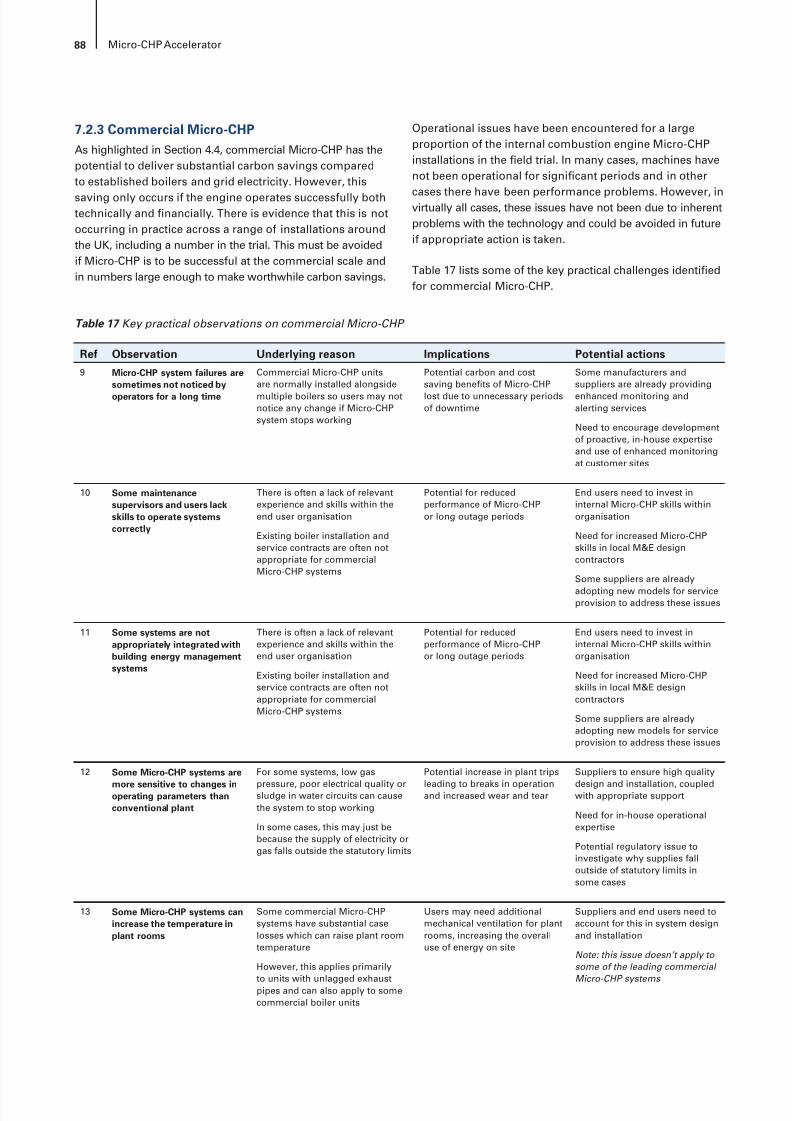
8/6/2019 CHP Accellerator
http://slidepdf.com/reader/full/chp-accellerator 90/104
88 Micro-CHP Accelerator
7.2.3 Commercial Micro-CHPAs highlighted in Section 4.4, commercial Micro-CHP has thepotential to deliver substantial carbon savings comparedto established boilers and grid electricity. However, this
saving only occurs if the engine operates successfully bothtechnically and nancially. There is evidence that this is notoccurring in practice across a range of installations aroundthe UK, including a number in the trial. This must be avoidedif Micro-CHP is to be successful at the commercial scale andin numbers large enough to make worthwhile carbon savings.
Operational issues have been encountered for a largeproportion of the internal combustion engine Micro-CHPinstallations in the eld trial. In many cases, machines havenot been operational for signicant periods and in other
cases there have been performance problems. However, invirtually all cases, these issues have not been due to inherentproblems with the technology and could be avoided in futureif appropriate action is taken.
Table 17 lists some of the key practical challenges identiedfor commercial Micro-CHP.
Table 17 Key practical observations on commercial Micro-CHP
Ref Observation Underlying reason Implications Potential actions9 Micro-CHP system failures are
sometimes not noticed byoperators for a long time
Commercial Micro-CHP unitsare normally installed alongsidemultiple boilers so users may notnotice any change if Micro-CHPsystem stops working
Potential carbon and costsaving benets of Micro-CHPlost due to unnecessary periodsof downtime
Some manufacturers andsuppliers are already providingenhanced monitoring andalerting services
Need to encourage developmentof proactive, in-house expertiseand use of enhanced monitoringat customer sites
10 Some maintenancesupervisors and users lackskills to operate systemscorrectly
There is often a lack of relevantexperience and skills within theend user organisation
Existing boiler installation andservice contracts are often notappropriate for commercialMicro-CHP systems
Potential for reducedperformance of Micro-CHPor long outage periods
End users need to invest ininternal Micro-CHP skills withinorganisation
Need for increased Micro-CHPskills in local M&E designcontractors
Some suppliers are already
adopting new models for serviceprovision to address these issues
11 Some systems are notappropriately integrated withbuilding energy managementsystems
There is often a lack of relevantexperience and skills within theend user organisation
Existing boiler installation andservice contracts are often notappropriate for commercialMicro-CHP systems
Potential for reducedperformance of Micro-CHPor long outage periods
End users need to invest ininternal Micro-CHP skills withinorganisation
Need for increased Micro-CHPskills in local M&E designcontractors
Some suppliers are alreadyadopting new models for serviceprovision to address these issues
12 Some Micro-CHP systems are
more sensitive to changes inoperating parameters thanconventional plant
For some systems, low gas
pressure, poor electrical quality orsludge in water circuits can causethe system to stop working
In some cases, this may just bebecause the supply of electricity orgas falls outside the statutory limits
Potential increase in plant trips
leading to breaks in operationand increased wear and tear
Suppliers to ensure high quality
design and installation, coupledwith appropriate support
Need for in-house operationalexpertise
Potential regulatory issue toinvestigate why supplies falloutside of statutory limits insome cases
13 Some Micro-CHP systems canincrease the temperature inplant rooms
Some commercial Micro-CHPsystems have substantial caselosses which can raise plant roomtemperature
However, this applies primarily
to units with unlagged exhaustpipes and can also apply to somecommercial boiler units
Users may need additionalmechanical ventilation for plantrooms, increasing the overalluse of energy on site
Suppliers and end users need toaccount for this in system designand installation
Note: this issue doesn’t apply to some of the leading commercial
Micro-CHP systems

8/6/2019 CHP Accellerator
http://slidepdf.com/reader/full/chp-accellerator 91/104
8/6/2019 CHP Accellerator
http://slidepdf.com/reader/full/chp-accellerator 92/104
90 Micro-CHP Accelerator
8 Wider implications of ndings
8.1 Policy implicationsThe results from the eld trial have important implicationsfor policy makers in two areas:
• Potential policy support – to provide nancial incentivesto support the wider uptake of Micro-CHP technologywhere it has been shown to offer potential carbon savings
• Development of standards and procedures – to ensurethat the real world ndings of the trial (for both Micro-CHPand boilers) are incorporated in existing standards andprocedures used to assess the selection of heating systems
for domestic and commercial applications.
8.1.1 Policy supportThere are several existing Government policy mechanismswhich provide support to encourage the adoption of micro-generation technologies. The ndings presented in thisreport suggest that Micro-CHP devices should be consideredeligible for support alongside other micro-generationtechnologies.
However, any such support must be based on a set of robustcriteria to ensure that the technology will only be installedin environments where worthwhile carbon savings are verylikely to be achieved. Based on the trial ndings, a set ofsuggested key criteria for Micro-CHP support is laid out inBox 1.
Low Carbon Buildings Programme
The Low Carbon Buildings Programme (LCBP) providesGovernment grants for micro-generation technologies tohouseholders, community organisations, schools, the publicand not for prot sector and private businesses 75 . Grantsare only available for technology categories which have beenaccredited and to date, Micro-CHP has not been includedin the list of accredited technologies 76 .
At the time of writing, the accreditation for LCBP is beingtransferred from historic lists of products and installers toa new UK Microgeneration Certication Scheme, where allthe products and installers will ultimately be re-accredited.This represents an ideal opportunity to reassess thepotential for the inclusion of Micro-CHP as an accreditedtechnology category 77 .
UK Microgeneration Certication Scheme
The UK Microgeneration Certication Scheme is run byBRE on behalf of the Government (BERR) and providesaccreditation of micro-generation products and installers 78 .It is intended to underpin the Low Carbon BuildingsProgramme (LCBP), such that LCBP grants will only beavailable to applicants using both products and installers
certied under the scheme.
Box 1: Suggested key criteria for Micro-CHP support
• Installation of Micro-CHP should only be incentivisedwhere it has a high likelihood of providing carbonsavings. For example, for the Stirling engine devicesmonitored in the trial, the results suggest this will bethe case for houses with a calculated annual heat
demand of over 20,000kWh per year
• Prior to assessing the annual heat demand, all othercost effective and practical energy saving measuresshould have been applied rst 74 . This will avoid thesituation where a Micro-CHP unit is installed prior toother measures which then result in a signicantreduction to the annual heat demand and reduce theeffectiveness of the Micro-CHP operation
• As for other low-carbon technologies, the level ofsupport provided for Micro-CHP must be in proportionto the range of potential carbon savings available
• Support must be structured to deliver good qualityinstallations and not provide an incentive foroversizing as this can signicantly reduce theperformance of Micro-CHP systems. For example,policy support should not reward on the basis of ‘perkW of system capacity installed’ as this would providean incentive to oversize.
74 For example, the Low Carbon Buildings Programme has criteria whereby householders reques ting grants for micro-generation produc ts must have rst installedappropriate loft insulation, cavit y wall insulation (if possible), low energy light bulbs and basic heating system controls, including room thermostat a ndprogrammer or timer.
75 For more information visit: www.lowcarbonbuildings.org76 The accredited te chnology categories curre ntly include solar photovoltaics, wind turbines, sma ll hydro, solar thermal hot water, ground source heat pumps and biomass.77 In practice, any such change is likely to only apply to Phase 1 of LCBP (the ongoing grant programme for domestic, commerc ial and public sector). Phase 2 of LCBP
(which focuses specic ally on public sector organisations and charitable bodies) has an existing pre -qualied list of framework suppliers for each technolog y andMicro-CHP was not considere d as an eligible technology when this list of suppliers was agreed.
78 For more information visit: www.ukmicrogeneration.org
8/6/2019 CHP Accellerator
http://slidepdf.com/reader/full/chp-accellerator 93/104
91Micro-CHP Accelerator
The scheme will evaluate products and installers againstrobust criteria for each micro-generation technology, andis intended to provide greater protection for consumersand to ensure that the Government grant funding is spent
in an effective manner. Third party certication is basedon testing and assessment of policies and practices atmanufacturing facilities, installation contractor’s ofcesand at installation site(s).
In order to dene the certication procedures for eachmicro-generation technology, a set of industry workinggroups has been set up to develop the appropriate standardsand processes. At the time of writing, the working groupfor Micro-CHP has started work but as yet no certicationstandards for Micro-CHP equipment and installers havebeen agreed.
In light of the detailed understanding of current Micro-CHPperformance gained from the eld trial, it is important thatthis working group uses the ndings from the trial to ensureappropriate certication procedures are put in place. TheCarbon Trust will continue to play an active role in thisprocess. It is recommended that the basis for approval ofcertication procedures for Micro-CHP takes into accountthe ndings in this report and is also reviewed again indetail once the nal results from the eld trial are availablein 2008.
Carbon Emissions Reduction Target (CERT)
The Government’s Energy Efciency Commitment (EEC)requires electricity and gas suppliers to achieve targets forthe promotion and delivery of energy efciency into theircustomers’ homes. Suppliers can choose from a range ofmeasures in order to deliver their obligation. To date, thesehave focused on different types of insulation, double glazing,heating controls and appliances.
The current phase of the commitment (EEC2) ends in 2008and this will be followed by a third stage, to be known asthe Carbon Emissions Reduction Target (CERT), which willrun from 2008-2011. CERT will extend the list of certiedmeasures to include a range of micro-generationtechnologies.
The current consultation on CERT includes the followingin relation to Micro-CHP 79 :
Micro combined heat and power (m-CHP) units are currently the object of a Carbon Trust trial measuring their in situ performance. However, it looks like there may be delays in launching commercial products and micro-CHP may not be deployed in signicant numbers during the EEC3 period.It is therefore not included in the Illustrative Mix. Of course micro-CHP would be eligible under EEC3 if the savings can
be veried, for example following the Carbon Trust trials.
The results presented in this document suggest that thereis a case for considering Micro-CHP as suitable for supportunder CERT, provided that the implementation of suchsupport can meet the four key criteria laid out in Box 1 at
the start of Section 8.1.1. The Carbon Trust will assist theauthors of CERT to incorporate the Micro-CHP eld trialresults into their existing models.
8.1.2 Standards and proceduresPrior to the Carbon Trust’s Micro-CHP Accelerator, verylittle information was available regarding the real-worldperformance of Micro-CHP devices. Consequently, wherethe technology has been referred to in existing standardsand procedures, this is based on projected performanceand theoretical models. As such, the actual operatingperformance of Micro-CHP units is likely to differ fromthe assumptions made in such models.
Given that a wide body of independently audited data isnow available, it is appropriate to review the assumptionsused in existing models in order to validate and informsuch assumptions for future iterations of these models. Itis important to conrm the validity of such models so thatpolicy makers can have condence that the standards andprocedures encourage appropriate actions to reduce carbonemissions. There are also some standards and procedureswhich do not take Micro-CHP into account or were notdesigned with Micro-CHP devices in mind. It is thereforeappropriate to review these too.
The project has also identied some key differences betweenthe theoretical performance of condensing boilers and thatobserved under eld conditions. It is therefore of interestto review key standards and procedures relating to boilersin light of data from the boiler eld trial, as well as dataexpected from the associated EST boiler eld trial, whichis now underway.
Some important examples of eld trial ndings whichcould impact assumptions in existing standards andprocedures include:
• The typical operating hours of domestic Micro-CHPsystems are lower than has been assumed in muchof the published material, leading to less electricitybeing generated
• The proportion of electricity exported from domesticproperties is higher than assumed previously, therebyhaving an impact on the economics of Micro-CHP
• There is evidence to show that a large proportion ofcondensing boilers do not appear to perform in the eldas expected and often do not achieve condensing operation
• Current models for estimating heating demand in
properties do not appear to correlate particularly wellwith actual heating demand.
79 CERT consultation, May 2007: www.defra.gov.uk/corporate/consult/cert2008-11/consultation.pdf
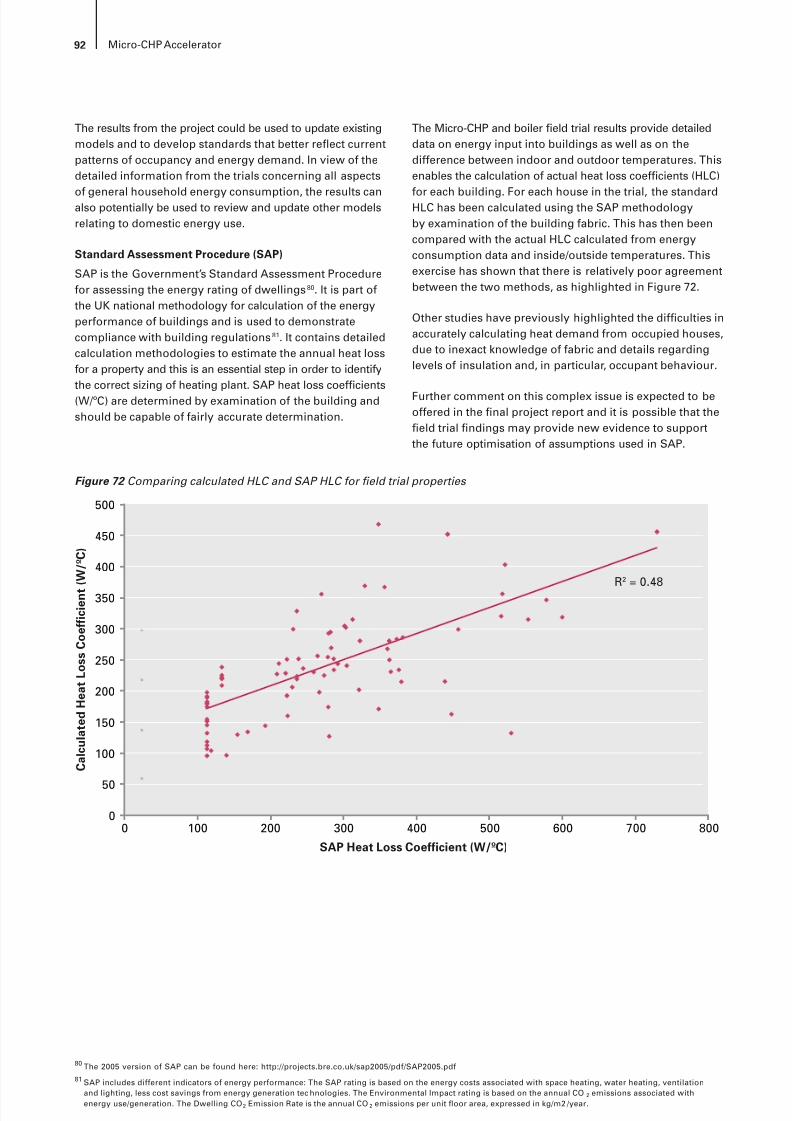
8/6/2019 CHP Accellerator
http://slidepdf.com/reader/full/chp-accellerator 94/104
92 Micro-CHP Accelerator
The results from the project could be used to update existingmodels and to develop standards that better reect currentpatterns of occupancy and energy demand. In view of thedetailed information from the trials concerning all aspects
of general household energy consumption, the results canalso potentially be used to review and update other modelsrelating to domestic energy use.
Standard Assessment Procedure (SAP)
SAP is the Government’s Standard Assessment Procedurefor assessing the energy rating of dwellings 80 . It is part ofthe UK national methodology for calculation of the energyperformance of buildings and is used to demonstratecompliance with building regulations 81 . It contains detailedcalculation methodologies to estimate the annual heat lossfor a property and this is an essential step in order to identifythe correct sizing of heating plant. SAP heat loss coefcients(W/ºC) are determined by examination of the building andshould be capable of fairly accurate determination.
The Micro-CHP and boiler eld trial results provide detaileddata on energy input into buildings as well as on thedifference between indoor and outdoor temperatures. Thisenables the calculation of actual heat loss coefcients (HLC)
for each building. For each house in the trial, the standardHLC has been calculated using the SAP methodologyby examination of the building fabric. This has then beencompared with the actual HLC calculated from energyconsumption data and inside/outside temperatures. Thisexercise has shown that there is relatively poor agreementbetween the two methods, as highlighted in Figure 72.
Other studies have previously highlighted the difculties inaccurately calculating heat demand from occupied houses,due to inexact knowledge of fabric and details regardinglevels of insulation and, in particular, occupant behaviour.
Further comment on this complex issue is expected to beoffered in the nal project report and it is possible that theeld trial ndings may provide new evidence to supportthe future optimisation of assumptions used in SAP.
Figure 72 Comparing calculated HLC and SAP HLC for eld trial properties
C a l c u l a t e d
H e a t
L o s s C o e f f i c i e n t
( W / º C )
SAP Heat Loss Coefficient (W/ºC)
0
50
100
150
200
250
300
350
400
450
500
0 100 200 300 400 500 600 700 800
R2 = 0.48
80 The 2005 version of SAP can be found here: http://projects.bre.co.uk/sap2005/pdf/SAP2005.pdf81 SAP includes different indicators of energy performance: The SAP rating is based on the energy costs associated with space heating, water heating, ventilation
and lighting, less cost savings from energy generation tec hnologies. The Environmental Impact rating is based on the annual CO 2 emissions associated withenergy use/generation. The Dwelling CO 2 Emission Rate is the annual CO 2 emissions per unit oor area, expressed in kg/m2 /year.
8/6/2019 CHP Accellerator
http://slidepdf.com/reader/full/chp-accellerator 95/104
93Micro-CHP Accelerator
Best practice guides
In light of the eld trial ndings, existing approved bestpractice guides may need to be updated to include relevantdetails on Micro-CHP. In particular, these should encourage
installers to ensure that Micro-CHP systems are installedin appropriate houses and are well integrated with theexisting heating system. An example is the ‘Domestic Heatingand Compliance Guide’, an approved Communities andLocal Government document, which provides guidanceon how to comply with building regulations for domesticheating systems.
PAS 67 and the Annual Performance Method (APM)
Publicly Available Specication (PAS) 67 is a Micro-CHPlaboratory test procedure. Its development is being facilitatedby the BSI (British Standards Institute) with input from many
industry stakeholders and support from the Energy SavingTrust. The output from PAS 67 testing is a set of tables listinginput and output energy for different operating scenarios.At the time of writing, PAS 67 is being nalised and isabout to be published. In future, all commercially availableMicro-CHP systems are expected to be tested against PAS 67.
In order to allow the behaviour of a Micro-CHP device to beassessed for any given building, a three-stage process hasbeen developed:
1. Using PAS 67, the 24-hour performance of a system istested at 100%, 30%,10% and domestic hot water (DHW)
heat loads to assess performance across the range ofdifferent operating conditions
2. The results from PAS 67 testing are fed into the AnnualPerformance Method (APM), which produces a chartof seasonal efciencies to allow prediction of annualperformance under specied heat demands
3. The results from APM are then fed into an appropriateassessment procedure (such as SAP for domestic housesor SBEM 82 for non-domestic buildings) in order to predicthow the Micro-CHP device would be expected to behavefor a given building.
This end-to-end procedure involves a wide range ofcomplex assumptions and, at the time of writing, has notyet been fully validated. As the eld trial has demonstratedreal world performance of Micro-CHP units in a range ofdifferent environments, it would be of considerable benetto compare the output of this end-to-end assessment processagainst the results of the trial and consider adjustmentsto the assumptions based on the signicant body of eldevidence gathered.
The results of the analytical PAS 67 and APM processesand a set of equivalent results from eld testing will nevermatch very closely, due to the variability of eld trial data.Nevertheless it is important to ensure that the high-level
ndings of both are directionally similar.
Ultimately, manufacturers and policy makers need to havecondence that the results of the PAS 67 and APM processeswill bear some relation to the performance that will beachieved in the eld. For example, where the eld trial hasshown that a currently available Micro-CHP device is verylikely to offer a carbon saving relative to a boiler for a giventype of house, the results of the PAS 67 and APM processesfor the same Micro-CHP device should show a similar overalloutcome when fed into SAP and compared to an equivalentcondensing boiler.
SEDBUK (Seasonal Efciency of Domestic Boilers in the UK)
SEDBUK measures the average annual efciency achieved byboilers in typical domestic conditions and provides a basisfor fair comparison of the energy performance of differentboilers. Calculated SEDBUK annual efciencies are classiedin a set of bands in a range from A to G, with A-rated boilersbeing the most efcient. SEDBUK was established as astandard around ten years ago and is based on Europeanboiler testing standards. Tests are based on set operatingconditions and carried out under controlled conditions ina laboratory.
The use of SEDBUK efciencies to compare relative boilerperformance has achieved some notable success and hasled to a steady improvement in the performance of boilerssince it was introduced. Furthermore, recently introducedregulations now require the use of A or B-rated condensingboilers as assessed by SEDBUK.
However, the eld trial of boilers appears to show thatassessment procedures such as SEDBUK (and the Europeanstandards on which it is based) could potentially be furtherenhanced to provide a more robust assessment of the bestperforming boilers in the eld.
In particular there is a need to move away from assessinga boiler based solely on its thermal efciency towards a moreholistic assessment that accounts for all carbon emissionsfrom boilers and their associated central heating systems.
82 SBEM (Simplied Building Energy Model) is used to evaluate the energy per formance of non-domes tic buildings.
8/6/2019 CHP Accellerator
http://slidepdf.com/reader/full/chp-accellerator 96/104
94 Micro-CHP Accelerator
There are two particular potential enhancements to thecurrent assessment procedures which are apparent fromthe eld trial:
• There needs to be a formal method for measuring the
electricity consumption of a heating system, as well asthe use of fossil or biomass fuel. The trial has shown thatsome boiler installations use two to three times the amountof electricity used by others for the same level of heatprovided; much of this is undoubtedly attributable toadjustment by installers and setting of the controls byhouseholders, but the whole area is worthy of investigation.While there would no doubt be additional complexityinvolved in incorporating electricity use into a futureassessment procedure, this variability is likely to continueunless manufacturers and installers are provided withincentives to minimise electricity consumption and
optimise overall system performance.• The test conditions used in SEDBUK may not necessarily
represent the operating conditions most commonlyfound in the eld. Consequently, a boiler which achievesa very high efciency in the SEDBUK test may performwith an efciency which is 5-10% lower in the eld. Theeld trial results, along with those expected from thecorresponding EST trial, provide an opportunity to validateand potentially revise existing test assumptions in orderto best reect performance under real-world conditionsand encourage improvements in the future.
It should be noted that the PAS 67 test standard, whileintended for Micro-CHP devices, has the potential to addresssome of these issues and could, in principle, be used toassess boiler performance in future.
8.2 Potential actions for stakeholdersThe results and observations from the project havehighlighted a range of potential actions for the manufacturersof heating devices (Micro-CHP and boilers), the suppliers/ installers of such products, policy makers and the CarbonTrust, in order to improve domestic heating provision andaccelerate the development and adoption of Micro-CHP
where appropriate.
8.2.1 Potential actions for product manufacturers• Optimise Micro-CHP devices for the highest possible
power-to-heat ratio. Carbon and cost savings are entirelydependent on the amount of electricity generated, somaximising electrical efciency must therefore be centralto all future product iterations
• Maximise the overall efciency of the unit, includingtaking steps to minimise ‘standby’ electrical use, as wellas the electricity used in start-up and shut-down
• Ensure programmable controllers are well designed andeasy to use. This will improve the chances of end usersbeing able to congure and operate the system efciently
• Design control logic to maximise device run times andefciency, in particular by avoiding unnecessary cycling,ensuring fans and pumps are turned off wheneverpossible and enabling units to operate in condensing
mode for longer• Ensure that pumps and other internal system components
are as efcient as possible and do not compromise theoverall efciency of the installed system
• Provide installers with guidance on how to install andoperate devices efciently and, where possible, play anactive role in the commissioning of these installations.Guidance should include detailed heating system designmethods for installers, which have been fully thoughtthrough and validated by product designers
• Provide extended warranty periods to demonstrate
condence in the technology and to ensure that Micro-CHPdevices are maintained properly throughout their lifetimes.
8.2.2 Potential actions for suppliers and installersFor Domestic Micro-CHP:
• Ensure heating devices are sized correctly for a givenhouse and occupant needs. Devices should be largeenough to ensure that adequate levels of comfort canbe provided, but oversizing should be avoided as thisreduces the efciency of operation
• Provide end users with clear guidance on optimumoperation of their overall heating system. This shouldinclude advice on the location, use and interactionof time clocks, thermostats and thermostatic radiatorvalves (TRVs)
• Ensure that any necessary enhancements to the designof the overall heating system are also carried out at thepoint a new heating device is installed. Room thermostats,hot water tank thermostats and TRVs should be installedappropriately and in locations where they are visible andaccessible to end users
• Choose the most efcient pumps and other externalcomponents as part of the overall installation and ensure
these are congured appropriately for maximum efciency
• Ensure that the device is correctly commissioned andwell integrated with the overall heating system and takesteps to maximise the likelihood of the device operatingin condensing mode
• Consider offering customers packaged solutions ofnancing, installation, maintenance and electricitybuy-back to accelerate market uptake

8/6/2019 CHP Accellerator
http://slidepdf.com/reader/full/chp-accellerator 97/104
95Micro-CHP Accelerator
For Commercial Micro-CHP:
• Consider installing Micro-CHP units in groups of buildingsin the same geographical region and training localengineers to provide appropriate maintenance and support
• Consider offering packaged solutions for commercialcustomers, where the Micro-CHP unit and associatedconventional boiler backup plant are provided as aholistic system, with all components installed andcommissioned together.
8.2.3 Potential actions for policy makers• Consider Micro-CHP eligible for support programmes
such as the Low Carbon Buildings Programme andCarbon Emissions Reduction Target (CERT), providedthat such support can meet the key criteria laid out inSection 8.1.1
• Ensure provision of fair and competitive export tariffsfor electricity exported by micro-generation devices suchas Micro-CHP
• Stimulate the growth of the commercial Micro-CHPmarket by encouraging the installation of Micro-CHPtechnology in appropriate public sector buildings
• Review existing procedures for assessing condensingboilers (such as SEDBUK) in light of the eld trial ndingson condensing boiler performance
• Consider reviewing existing methods used to assess
the performance of heating systems in domestic andcommercial environments (such as SAP) in light of theeld trial ndings
• Consider reviewing planned methods for futureassessment of Micro-CHP performance (such as PAS 67and APM) in the light of the eld trial ndings. Ensurethat, where appropriate, their outputs correlate with thereal-world performance of Micro-CHP systems observedin the eld trial and provide incentives for the mostappropriate decisions in the design and installationof Micro-CHP systems
• Ensure existing approved best practice guides are updatedto include Micro-CHP and to encourage installers to ensurethat Micro-CHP systems are installed in appropriate housesand are well integrated with existing heating systems.
8.2.4 Potential actions for the Carbon Trust• Complete the Micro-CHP Accelerator as planned and
carry out an extended range of analysis to address thekey remaining questions, with ongoing input from industry
participants and other key stakeholders
• Continue to support Micro-CHP manufacturers intheir product development by discussing the detailedimplications of the eld trial ndings
• Further promote the benets of commercial Micro-CHPtechnology to the businesses and public sectororganisations which the Carbon Trust works with ona day-to-day basis
• Continue to collaborate with the Energy Saving Trust toensure that the key insights relating to domestic boilerperformance are carried forward with the ongoing EST
boiler trials with results and recommendation fed backto industry and policy makers.

8/6/2019 CHP Accellerator
http://slidepdf.com/reader/full/chp-accellerator 98/104
96 Micro-CHP Accelerator
9 Next steps
9.1 Completion of eld trialsThe eld trials of Micro-CHP units and condensing boilerswere due to run until the end of 2007. However, due tounexpected delays in the start of operation for some ofthe condensing boilers in the trial, full monitoring will needto continue into the early part of 2008. However, by spring2008 it is expected that all data monitoring and collectionwill be complete.
Once data monitoring is complete, the nal data sorting andcleansing exercise will be carried out in order to maximise
the number of valid complete months and complete yearsof operation which are available for analysis. The completedata set will then be analysed in a similar manner to theanalysis carried out for this report.
Data which is specic to individual manufacturers will alsobe made available to those manufacturers for their ownanalysis. A wider set of non-sensitive (i.e. not device specic)data will also be put into the public domain for use byacademic groups and other interested stakeholders.
9.2 Laboratory testing
Following design, build and calibration of the laboratorytesting rig, a phase of detailed investigative testing is dueto be started towards the end of 2007. This will involvecomparing the performance of different domestic Micro-CHPunits and condensing boilers under controlled conditionsand will provide supporting evidence to back up the eldtrial results and investigate issues raised in the eld trialdata set.
Ultimately it is hoped that the laboratory testing will allowidentication and prioritisation of the key drivers affectingthe performance of Micro-CHP systems and boilers. Suchinformation should then prove invaluable in further reningstandards and procedures relating to the design andinstallation of heating systems. It should also be useful tomanufacturers as part of their ongoing product development.
9.3 Future publicationsFollowing completion of the eld trial activities, laboratorytesting and associated analysis, a nal project reportwill be published and the relevant ndings disseminatedwidely to interested stakeholders, including policy makers,regulators, device manufacturers, end users, academics,energy suppliers and designers/installers of domestic andcommercial heating systems.
The nal report is due to be published in 2008. This willcomment on results from the full data set, including a
wider range of annual performance data. It is also expectedto include the results of laboratory work to identify themost signicant performance drivers and further analysisof the economics of Micro-CHP.
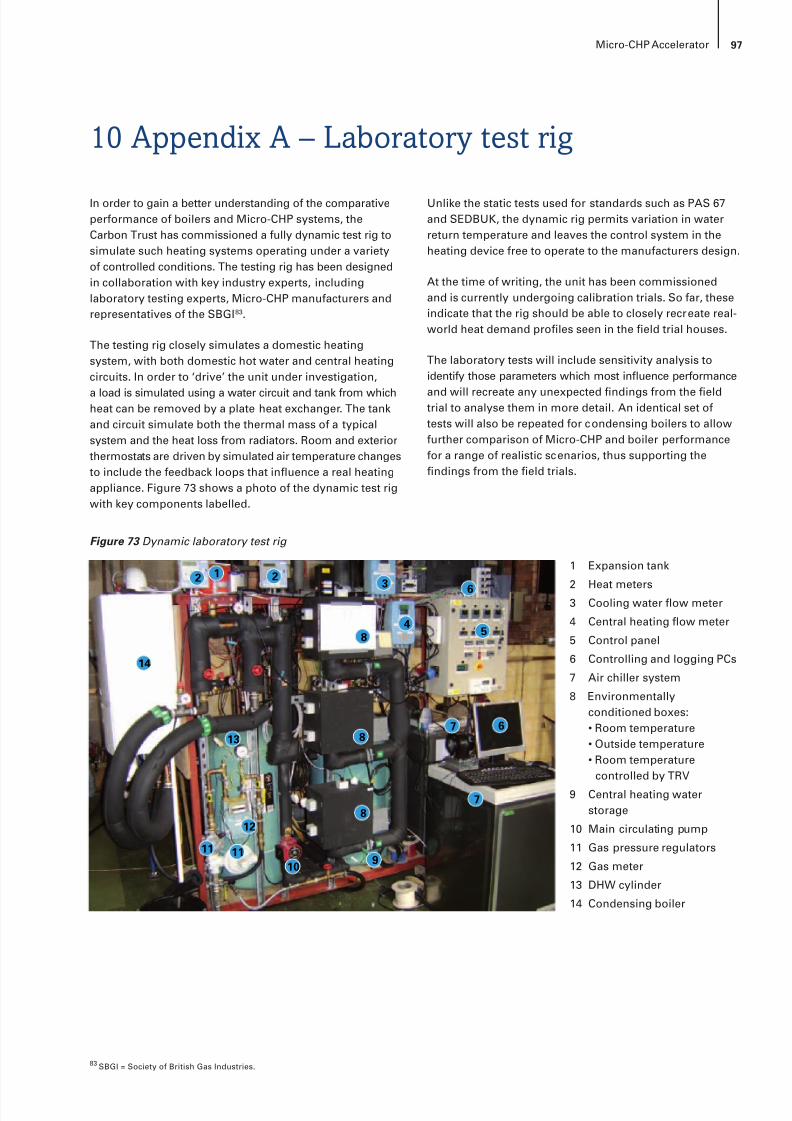
8/6/2019 CHP Accellerator
http://slidepdf.com/reader/full/chp-accellerator 99/104
97Micro-CHP Accelerator
10 Appendix A – Laboratory test rig
In order to gain a better understanding of the comparativeperformance of boilers and Micro-CHP systems, theCarbon Trust has commissioned a fully dynamic test rig tosimulate such heating systems operating under a varietyof controlled conditions. The testing rig has been designedin collaboration with key industry experts, includinglaboratory testing experts, Micro-CHP manufacturers andrepresentatives of the SBGI 83 .
The testing rig closely simulates a domestic heatingsystem, with both domestic hot water and central heatingcircuits. In order to ‘drive’ the unit under investigation,
a load is simulated using a water circuit and tank from whichheat can be removed by a plate heat exchanger. The tankand circuit simulate both the thermal mass of a typicalsystem and the heat loss from radiators. Room and exteriorthermostats are driven by simulated air temperature changesto include the feedback loops that inuence a real heatingappliance. Figure 73 shows a photo of the dynamic test rigwith key components labelled.
Unlike the static tests used for standards such as PAS 67and SEDBUK, the dynamic rig permits variation in waterreturn temperature and leaves the control system in theheating device free to operate to the manufacturers design.
At the time of writing, the unit has been commissionedand is currently undergoing calibration trials. So far, theseindicate that the rig should be able to closely recreate real-world heat demand proles seen in the eld trial houses.
The laboratory tests will include sensitivity analysis toidentify those parameters which most inuence performance
and will recreate any unexpected ndings from the eldtrial to analyse them in more detail. An identical set oftests will also be repeated for condensing boilers to allowfurther comparison of Micro-CHP and boiler performancefor a range of realistic scenarios, thus supporting thendings from the eld trials.
83 SBGI = Society of British Gas Industries.
Figure 73 Dynamic laboratory test rig
12 2
3
45
6
67
7
8
8
8
9101111
12
13
14
1 Expansion tank
2 Heat meters3 Cooling water ow meter
4 Central heating ow meter
5 Control panel
6 Controlling and logging PCs
7 Air chiller system
8 Environmentallyconditioned boxes:• Room temperature• Outside temperature• Room temperature
controlled by TRV
9 Central heating waterstorage
10 Main circulating pump
11 Gas pressure regulators
12 Gas meter
13 DHW cylinder
14 Condensing boiler
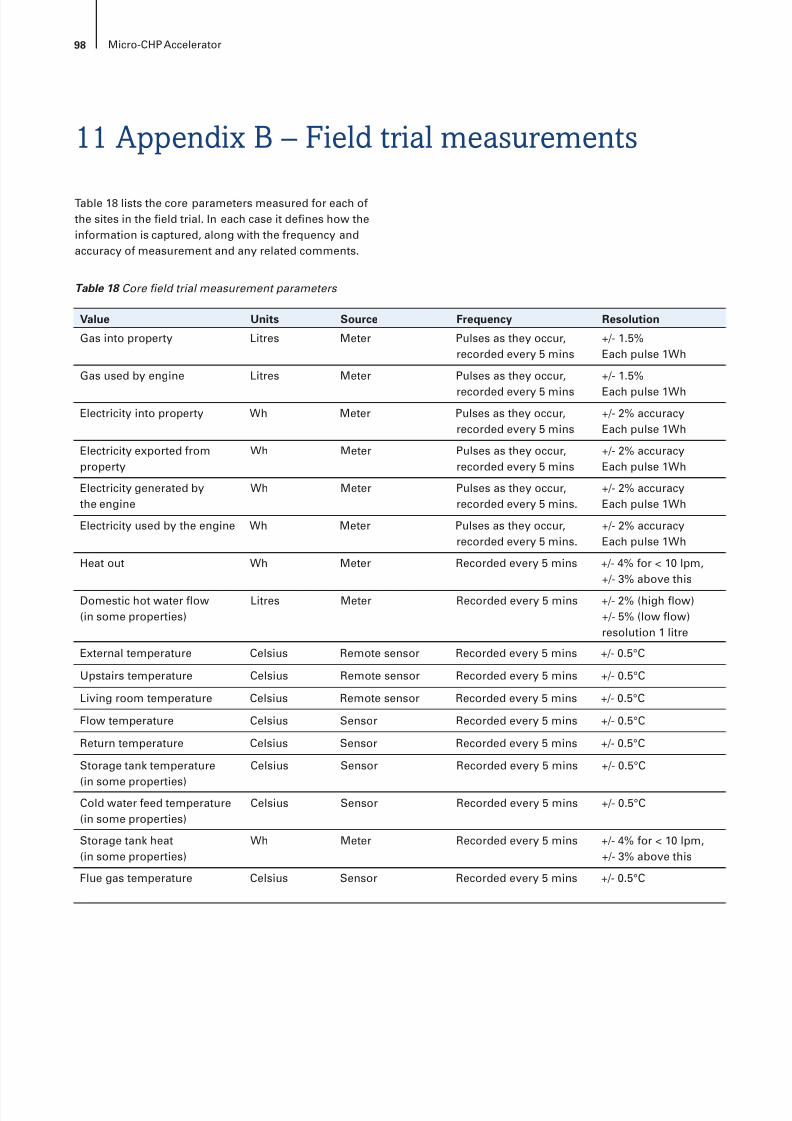
8/6/2019 CHP Accellerator
http://slidepdf.com/reader/full/chp-accellerator 100/104
98 Micro-CHP Accelerator
11 Appendix B – Field trial measurements
Table 18 lists the core parameters measured for each ofthe sites in the eld trial. In each case it denes how theinformation is captured, along with the frequency andaccuracy of measurement and any related comments.
Value Units Source Frequency Resolution
Gas into property Litres Meter Pulses as they occur,recorded every 5 mins
+/- 1.5%Each pulse 1Wh
Gas used by engine Litres Meter Pulses as they occur,
recorded every 5 mins
+/- 1.5%
Each pulse 1WhElectricity into property Wh Meter Pulses as they occur,
recorded every 5 mins+/- 2% accuracyEach pulse 1Wh
Electricity exported fromproperty
Wh Meter Pulses as they occur,recorded every 5 mins
+/- 2% accuracyEach pulse 1Wh
Electricity generated bythe engine
Wh Meter Pulses as they occur,recorded every 5 mins.
+/- 2% accuracyEach pulse 1Wh
Electricity used by the engine Wh Meter Pulses as they occur,recorded every 5 mins.
+/- 2% accuracyEach pulse 1Wh
Heat out Wh Meter Recorded every 5 mins +/- 4% for < 10 lpm,+/- 3% above this
Domestic hot water ow(in some properties)
Litres Meter Recorded every 5 mins +/- 2% (high ow)+/- 5% (low ow)resolution 1 litre
External temperature Celsius Remote sensor Recorded every 5 mins +/- 0.5°C
Upstairs temperature Celsius Remote sensor Recorded every 5 mins +/- 0.5°C
Living room temperature Celsius Remote sensor Recorded every 5 mins +/- 0.5°C
Flow temperature Celsius Sensor Recorded every 5 mins +/- 0.5°C
Return temperature Celsius Sensor Recorded every 5 mins +/- 0.5°C
Storage tank temperature
(in some properties)
Celsius Sensor Recorded every 5 mins +/- 0.5°C
Cold water feed temperature(in some properties)
Celsius Sensor Recorded every 5 mins +/- 0.5°C
Storage tank heat(in some properties)
Wh Meter Recorded every 5 mins +/- 4% for < 10 lpm,+/- 3% above this
Flue gas temperature Celsius Sensor Recorded every 5 mins +/- 0.5°C
Table 18 Core eld trial measurement parameters

8/6/2019 CHP Accellerator
http://slidepdf.com/reader/full/chp-accellerator 101/104

8/6/2019 CHP Accellerator
http://slidepdf.com/reader/full/chp-accellerator 102/104
100 Micro-CHP Accelerator
Notes

8/6/2019 CHP Accellerator
http://slidepdf.com/reader/full/chp-accellerator 103/104

8/6/2019 CHP Accellerator
http://slidepdf.com/reader/full/chp-accellerator 104/104
The Carbon Trust is a UK-wide company,with headquarters in London, andbases in Northern Ireland, Scotland,Wales and the English regions.
The Carbon Trust was set up in 2001 by Government as anindependent company, in response to the threat of climate change.
Our mission is to accelerate the move to a low carbon economyby working with organisations to reduce carbon emissions anddevelop commercially viable low carbon technologies.
We do this through 5 complementary business areas:
Insights – explains the opportunities surrounding climate changeSolutions – delivers carbon reduction solutionsInnovations – develops low carbon technologiesEnterprises – creates low carbon businessesInvestments – nances clean energy businesses.
www.carbontrust.co.uk
0800 085 2005