
Choosing360
58
CENTER FOR CREATIVE LEADERSHIP CHOOSING 360 A GUIDE TO EVALUATING MULTI-RATER FEEDBACK INSTRUMENTS FOR MANAGEMENT DEVELOPMENT Ellen Van Velsor Jean Brittain Leslie John W . Fleenor
-
Upload
center-for-creative-leadership -
Category
Documents
-
view
78 -
download
0
Transcript of Choosing360

CENTER FOR CREATIVE LEADERSHIP
CHOOSING 360A GUIDE TO EVALUATINGMULTI-RATER FEEDBACK
INSTRUMENTS FORMANAGEMENT DEVELOPMENT
Ellen Van VelsorJean Brittain Leslie
John W. Fleenor

CHOOSING 360A GUIDE TO EVALUATING
MULTI-RATER FEEDBACK INSTRUMENTS
FOR MANAGEMENT DEVELOPMENT

ii Choosing 360

iii
CHOOSING 360A GUIDE TO EVALUATING
MULTI-RATER FEEDBACK INSTRUMENTS
FOR MANAGEMENT DEVELOPMENT
Ellen Van VelsorJean Brittain Leslie
John W. Fleenor
Center for Creative LeadershipGreensboro, North Carolina
iv Choosing 360
The Center for Creative Leadership is an international, nonprofit educational institutionfounded in 1970 to advance the understanding, practice, and development of leadershipfor the benefit of society worldwide. As a part of this mission, it publishes books andreports that aim to contribute to a general process of inquiry and understanding in whichideas related to leadership are raised, exchanged, and evaluated. The ideas presented in itspublications are those of the author or authors.
The Center thanks you for supporting its work through the purchase of this volume. Ifyou have comments, suggestions, or questions about any CCL Press publication, pleasecontact the Director of Publications at the address given below.
Center for Creative LeadershipPost Office Box 26300
Greensboro, North Carolina 27438-6300www.ccl.org
©1997 Center for Creative Leadership
All rights reserved. No part of this publication may be reproduced, stored in a retrievalsystem, or transmitted, in any form or by any means, electronic, mechanical, photocopy-ing, recording, or otherwise, without the prior written permission of the publisher. Printedin the United States of America.
CCL No. 334
Library of Congress Cataloging-in-Publication Data
Van Velsor, EllenChoosing 360 : a guide to evaluating multi-rater feedback instruments for
management development / Ellen Van Velsor, Jean Brittain Leslie, John W. Fleenor.p. cm.
Update ed. of: Feedback to managers, vol. 1. 1991.Includes bibliographical references (p. ).ISBN 1-882197-30-51. Organizational effectiveness—Evaluation—Methodology. 2. Feedback
(Psychology). 3. Executives—Rating of. I. Leslie, Jean Brittain. II. Fleenor, John W.III. Morrison, Ann M. Feedback to managers. IV. Title.HD58.9.V36 1997658.4'03—dc21 97-18853
CIP
v
Table of Contents
Foreword .................................................................................................................... vii
Acknowledgments ...................................................................................................... ix
Introduction ................................................................................................................. 1
STEP 1: FIND OUT WHAT IS AVAILABLE .......................................................................... 1
STEP 2: COLLECT A COMPLETE SET OF MATERIALS........................................................... 2
STEP 3: COMPARE YOUR INTENDED USE TO INSTRUMENT CHARACTERISTICS ...................... 3
STEP 4: EXAMINE THE FEEDBACK SCALES ........................................................................ 4
STEP 5: FAMILIARIZE YOURSELF WITH THE INSTRUMENT-DEVELOPMENT PROCESS ................ 5
STEP 6: LEARN HOW ITEMS AND FEEDBACK SCALES WERE DEVELOPED ............................ 6
STEP 7: FIND OUT HOW CONSISTENT SCORES TEND TO BE ............................................... 9
STEP 8: ASSESS BASIC ASPECTS OF VALIDITY—DOES THE INSTRUMENT MEASURE
WHAT IT CLAIMS TO MEASURE? ................................................................................... 13
STEP 9: THINK ABOUT FACE VALIDITY .......................................................................... 20
STEP 10: EXAMINE THE RESPONSE SCALE ...................................................................... 20
STEP 11: EVALUATE THE FEEDBACK DISPLAY................................................................. 22
STEP 12: UNDERSTAND HOW BREAKOUT OF RATER RESPONSES IS HANDLED ................... 23
STEP 13: LEARN WHAT STRATEGIES ARE USED TO FACILITATE INTERPRETATION
OF SCORES ................................................................................................................... 24
STEP 14: LOOK FOR DEVELOPMENT AND SUPPORT MATERIALS ........................................ 28
STEP 15: COMPARE COST—VALUE FOR THE PRICE ......................................................... 31
STEP 16: CONSIDER LENGTH A MINOR ISSUE ................................................................. 32
Conclusion ................................................................................................................. 32
References ................................................................................................................. 33

vi Choosing 360
Suggested Readings ................................................................................................... 34
Glossary of Terms ..................................................................................................... 35
Instrument Evaluation Checklist ............................................................................... 39
vii
Foreword
At the end of 1991, CCL published the two-volume Feedback to Man-agers (Volume I: A Guide to Evaluating Multi-rater Feedback Instruments;Volume II: A Review and Comparison of Sixteen Multi-rater FeedbackInstruments). Since that time, there has been a notable increase of interest inmulti-rater, or 360-degree, instruments: More are available; they are beingused for a wider range of purposes; and much has been learned about theiruse. A revision is thus in order. What you will find here is an updated editionof the first volume (with a new edition of the second currently in progress).
The text has been thoroughly reviewed by the authors—Ellen VanVelsor and Jean Brittain Leslie, who wrote the original edition, and JohnFleenor, who joined the team for this version—and changes have been madeto reflect current understandings in the field—for instance, new informationon the proper use of norms and on “item banks” (a collection of instrumentitems that have been tested for reliability and validity) has been added, andthe section on validity has been redone.
You will note that this work has been retitled and that it is no longerreferred to as the first volume of a set. We wanted to make this guide, whichcan help practitioners begin to make sense of the complexity and proliferationof instruments, as visible as possible. The update of the second volume, alsoto be a stand-alone publication, will aid practitioners by providing in-depthdescriptions of selected instruments, including some that were not included inthe previous edition, and discussion of key issues in their use. The two canstill, of course, be used together, and we invite people to do so.
Walter W. TornowVice President, Research and Publication

viii Choosing 360

ix
Acknowledgments
We would like to express our appreciation to the many reviewers whosecomments, ideas, and criticisms greatly improved the quality of this manu-script. These include David DeVries, Janet Spence, Russ Moxley, MichaelHoppe, Maxine Dalton, Lloyd Bond, and members of the Center for CreativeLeadership’s Writers’ Group. We are also indebted to Clark Wilson, WaltTornow, David Campbell, and Philip Benson for several ideas presented here.

x Choosing 360

1
Introduction
Many organizations are using 360-degree-feedback instruments to helptheir managers become better leaders. These instruments are designed tocollect information from different sources (or perspectives) about a targetmanager’s performance. The principal strength of 360-degree-feedbackinstruments is their use of multiple perspectives. In most cases, the differentsources of information (the raters) are the supervisor (or boss), the peers, andthe direct reports of the target manager, although some instruments now allowmanagers to use internal and/or external customers as raters.
This report presents a nontechnical, step-by-step process you can use toevaluate any 360-degree-feedback instrument intended for management orleadership development. Although we have simplified this process as much aspossible, it still will require some effort on your part—but effort that will payoff in terms of your having a high-quality instrument that best meets yourneeds.
The steps in evaluating a 360-degree-feedback instrument are laid outhere sequentially. Yet all steps are not equal in complexity or importance. Wesuggest that you make the most critical decisions early in the process; in thisway you can save some effort by eliminating instruments that don’t meet yourneeds in terms of content and that don’t pass muster when it comes to reliabil-ity and validity.
A checklist of the steps is included, for your convenience, at the end ofthis report. There the reader will also find a glossary of many of the technicalwords used here and a list of suggested readings.
STEP 1:FIND OUT WHAT IS AVAILABLE
The availability of 360-degree-feedback instruments is increasing at atremendous pace. You can expect that there are as many promising instru-ments under development as there are good instruments for sale. So your firsttask should be to gain some knowledge of what is out there in order to choosethe best possible sample of instruments to review.
In the short run, a good way to familiarize yourself with what is avail-able is to search one of several guides that categorize and review instruments.Feedback to Managers, Volume II (Van Velsor & Leslie, 1991) is one suchguide. It provides basic descriptive and technical data on 360-degree-feedback instruments available for use for management development. Other

2 Choosing 360
guides include Mental Measurements Yearbook (Conoley & Impara, 1995);Business and Industry Testing: Current Practices and Test Reviews (Hogan &Hogan, 1990); Psychware Sourcebook (Krug, 1993); and Tests: A Compre-hensive Reference for Assessment in Psychology, Education and Business(Sweetland & Keyser, 1990). These can usually be found in the referencesection of libraries. Over time, it may be useful as well to keep a file of theinstrument brochures you obtain, because many of the directories are notpublished often enough to keep you updated on the very newest products.
STEP 2:COLLECT A COMPLETE SET OF MATERIALS
When you have identified several instruments you wish to evaluate, youneed to obtain five pieces of information about each of them. You cannotmake an informed decision using only a copy of the instrument or a promo-tional brochure.
Specifically, for each instrument you wish to consider, you shouldobtain the following:
• A copy of the instrument itself. If the instrument has one form for theindividual to rate himself or herself and a separate form for the otherswho will rate him or her, get both.
• A sample feedback report (a representation of what the manager willreceive after the instrument is scored). You can’t tell what type offeedback your managers will actually receive by looking at theinstrument they will fill out. The sample could be a complete report,or it could be part of a report such as an example of the feedbackdisplay in the technical or trainer’s manual. Either type will do.
• A technical manual or other publication that outlines in detail thedevelopmental and psychometric research done on the instrument.
• Information about any supporting materials that accompany thescored feedback, such as interpretive materials, development guides,goal-planning materials, and the like.
• Information about price, scoring, and whatever certification or train-ing may be required to purchase or use the instrument.
It is not at all unreasonable to request this quantity of information.American Psychological Association guidelines (APA, 1985) require that thisinformation be available upon request when an instrument is offered for sale.
In addition to seeking the recommended information, you should,through all the steps that follow, look for evidence of a commitment to
3
continuous improvement on the part of each instrument’s developer. This isespecially true if an instrument has been around for awhile. As we willdiscuss in the section on validity, research should always be in progress,because no instrument can ever be considered valid once and for all. Expectrevisions in the scales over time; these are often made when additionalvalidation studies have been completed. Expect revisions in the presentationof feedback as well; these are often made as the developer learns from theexperience of those who have used an instrument. It is not uncommon forgood instruments to have more than one copyright date, because even smallrevisions to content can cause changes in other areas, such as scaleweightings or instrument norms.
STEP 3:COMPARE YOUR INTENDED USE TO
INSTRUMENT CHARACTERISTICS
It is improbable that one instrument will meet the needs of all managersin an organization. Job demands differ somewhat by organizational level, andeven at the same management level, skills that are needed for effectivenessmay change over time. In addition, the dimensions on which managers areassessed should be in line with organizational visions for leadership. To theextent that these visions vary across organizations, it is also highly unlikelythat one instrument will meet the needs of all kinds of organizations. Thus, insearching for an instrument to provide feedback to managers, a person istypically looking for one that will satisfy the needs of a particular group ofmanagers in an organization with specific leadership or management needs.
Although nearly every 360-degree-feedback instrument has a statementof purpose describing the level of management it targets, there seems to belittle relationship between management level and the domains of activity orbehavior assessed. An instrument targeted toward all levels of managementmight not be right for middle managers in your organization because thecapacities assessed are not in line with company-wide management-development goals. An instrument targeted toward higher levels might beright for your middle managers if the competencies assessed agree with yourmanagement-development goals.
More important than considering the advertised audience is discoveringthe norm group, if any, to which managers will be compared. By norm group,we mean the group of managers whose scores are stored in the vendor’sdatabase and are output as the comparison group on every individual feed-
Step 3: Compare Your Intended Use to Instrument Characteristics

4 Choosing 360
back report. If the norm group is comprised of senior-level managers, whoseskills are likely to be more highly developed, the scores of middle managerswill probably appear worse than they would if they were compared to manag-ers similar to themselves. Therefore, look for instruments that have beennormed on a sample similar to your target managers; consider level, organiza-tion type, and demographics (for example, ethnicity and gender).
But be forewarned: The feedback instruments we are concerned withhere have been developed for use in management-development efforts, eitherin the classroom or in individual feedback settings. These are instruments thathave not been developed or tested for other purposes—such as makingselection or promotion decisions.
STEP 4:EXAMINE THE FEEDBACK SCALES
In evaluating individual instruments, you should begin by examiningthe scales on which feedback will be received. Are you comfortable withwhat it measures?
There is a detailed discussion of scales in step 6, but what you need toknow at this point is that the scales are made up of several items on theinstrument and represent the content or competencies on which managers willbe evaluated. Each individual scale represents a slice of managerial work (forexample, planning) or a single kind of competency (for example, decisive-ness); as a whole the scales provide a portrait of leadership or managerialeffectiveness. Using the sample feedback you have obtained, you shouldconsider the following when looking at the scales:
• Is your organization wedded to a particular way of representing whatit takes to be effective in your business or do you have a particularmodel underlying management-development efforts?
• Does the range of scales fit with what you see as relevant competen-cies for managers in your target group?
• Does the number of scales seem reasonable?• If, in your judgment, an instrument does not have enough scales that
seem relevant to your target group, or if it has too many that seemirrelevant, drop it from further consideration.

5
STEP 5:FAMILIARIZE YOURSELF WITH THE
INSTRUMENT-DEVELOPMENT PROCESS
In order to know how to identify quality instruments, you must under-stand the basics of sound instrument development.
The development process can be seen as occurring in four stages:
• developing instrument items and feedback scales,• assessing reliability and validity,• designing the feedback display, and• creating supporting materials.
At each stage different issues are being addressed.When items and scales (fully defined in step 6 below) are being devel-
oped, the author must identify, as much as possible, the full range of behav-iors or skills that he or she believes represents management or leadershipcompetency. Another question at this stage is whether items of behavior orcompetency cluster in groups that are internally consistent, distinct from eachother, and useful for feedback purposes.
To assess reliability, the author of an instrument must consider whetherthe measurement of these skills or competencies is stable in a variety of ways.To assess validity, the author must determine whether the scales reallymeasure the dimensions they were intended to measure and whether they arerelated to effectiveness as a manager or leader. Because 360-degree-feedbackinstruments are primarily intended for individual development, the questionof whether the areas assessed can be developed also must be considered.
When designing feedback, the author should try to maximize themanager’s understanding of the data to enhance its impact. In creating sup-porting materials, the aim of the author is to help the feedback recipient gaindeeper understanding of the theory or research behind the instrument andthereby enhance the ability to interpret and work with the data. Your task asan evaluator is to assess the work completed in each of these four stages andbalance what you find against the needs of your target group.

6 Choosing 360
STEP 6:LEARN HOW ITEMS AND FEEDBACK SCALES WERE DEVELOPED
Instruments that assess managerial competence or leadership effective-ness are dealing with complicated phenomena. These phenomena cannot beadequately represented by a single behavior or characteristic because they arecomprised of many closely related behaviors and skills. To adequately mea-sure these complex capacities, instruments must have scales that are made upof several items.
The process of instrument development typically begins with thewriting of items that represent behaviors or characteristics believed to berelated to effective management or leadership.
Items can come from a variety of places. Sometimes the author refers toa theory (leadership theory, theory of managerial work, competency models)to develop specific behavioral statements or statements describing character-istics or skills. At other times researchers create descriptions of characteristicsor skills based on data they have collected. Another way items can be writtenis by basing them on the organizational experience of the author(s). Peoplewho frequently work in training or consulting with managers may feel theycan capture in a set of statements the essence of the leadership or manage-ment effectiveness they have observed.
The better instruments tend to be those that have used a combination ofapproaches in their development. A basis in theory provides an instrumentwith a set of validation strategies, while empirical research can provide datafrom working managers. Ultimately, the quality of the final product dependson a combination of the quality of the theory, research, and experience of thedeveloper; his or her skill in translating theory, research, and experience intowritten items; and the attention paid to instrument development and feedbackdesign. A complete evaluation on your part will reveal the level of quality atall these stages.
The nature of items can vary, regardless of their origin. Items can bephrased behaviorally (for example, “Walks around to see how our work isgoing”), phrased as skills or competencies (for example, “Is good at influenc-ing the right people”), or phrased as traits or personal characteristics (forexample, “Is highly motivated”).
Instrument feedback is usually presented to the target manager as scoreson scales (groups of items). Because scales tend to be more abstract thanitems (for example, “Resourcefulness”), it may be difficult for target manag-ers to set goals for change based on this type of data. To help managers

7
process their data, some instruments provide scores on the individual itemsthat comprise these scales.
Feedback on behavioral items may be easiest for managers to use insetting goals for change because they are the most concrete. Behavioralchanges are the easiest for co-workers to see as well. Change on this typeitem, however, can be the most superficial in terms of enhancing personaldevelopment. At the other extreme, feedback on characteristics such asmotivation can be the most difficult to use, and change on this type item canbe the hardest to observe. But change on these items may be more likely toenhance personal development. Feedback on specific skills probably fallssomewhere between these two extremes: It is moderately easy to use whenchanges are observable and it involves some real skill development.
The items discussed above are good examples. If one receives a lowscore on a behavioral item such as “Walks around to see how our work isgoing,” it will be relatively easy to change (that is, “Walk around more”) butwill probably lead to little in the way of personal development for that man-ager. If one receives a low score on a skill-based item such as “Is good atinfluencing the right people,” it will be harder to change, because the man-ager will have to find out how to become better and then will need to im-prove. But the result can be important skill development. Finally, receiving alow score on an item such as “Is highly motivated” can be the hardest of all tochange. Change will require the manager to reflect and discover why motiva-tion is low, and to decide what it will take to feel more motivated. Then themanager will have to make whatever personal or life changes are necessary.This kind of change, however, can be the more developmental.
If individuals are left on their own to process feedback (no trainer orfacilitator is available), or if an instrument is not accompanied by comprehen-sive interpretive and development materials, the clarity of item content iscritical. The harder items are to interpret, the more difficulty managers willhave in benefiting from the feedback and the more important the quantity andquality of support becomes.
Once items are created, instrument development proceeds to the task ofconstructing the scales on which feedback will be given. Multiple items aregrouped together to represent the set of closely related skills or behaviors thatmake up a managerial competency (for instance, “Resourcefulness” or“Planning and Organizing”). Responses to the items on a scale should grouptogether to form a coherent whole, internally homogeneous and distinct fromother scales.
How the scale-development process is conducted is critical, because theresulting scales will form the basis of the model of leadership, management,
Step 6: Learn How Items and Feedback Scales Were Developed

8 Choosing 360
or effective performance that you will be presenting to the manager. Yourtask as the evaluator is to discover whether the process of scale constructionseems reasonable and complete. To determine that, you will need to look inthe technical manual or in published technical reports.
There are typically two aspects of scale development: the statistical andthe rational/intuitive. The statistical aspect involves using procedures such asfactor analysis, cluster analysis, or item-scale correlations to group items intoscales based on the degree of similarity in response patterns of the raters (forinstance, people rated high on one item are also rated high on other items inthat scale). The rational/intuitive aspect involves grouping items togetherbased on the author’s expectations or experience about how different skills orbehaviors relate to one another. Some instruments have used one of the twoprocesses in developing scales from items and some have used both.
Look for some evidence of statistical analysis such as factor analysis,cluster analysis, or item-scale correlations. Although it is not important thatyou understand the details of these statistical procedures, it is critical torealize that their goal is to reduce a large number of items to a smaller numberof scales by grouping items together based on how these behaviors or charac-teristics are related to each other and allowing for the deletion of items thatare not working.
For example, one way of determining how well the items relate to thescales being measured is by examining the relationship between the indi-vidual items that comprise each scale and the overall scale scores. High item-scale correlations indicate that the chosen items do indeed relate closely to thescales being measured. On the other hand, items with low item-scale correla-tions should be dropped from the scale.
Also look at whether items grouped together by the statistical tech-niques make sense. Because these techniques group items according to theirstatistical relationship, items that are conceptually unrelated may end up onthe same scale. For example, “Being attentive to the personal needs of directreports” may be empirically related to “Maintaining an orderly work space,”not because these two skills are conceptually linked but because the managersused in the analysis happened to score high on both. An intuitive look at scalecomposition can weed out item groupings that make little sense.
On the other hand, if feedback scales appear to have been created solelyby intuitive means, be aware that there is no data to show, in fact, how wellthe behaviors, skills, or traits actually work together to measure a moreabstract construct—the question of whether these item groupings representactual competencies among managers remains unanswered.

9
An important consideration in the development of items and scales isthe issue of customization. Some instruments use an “open architecture”approach that allows items to be added on client request. These items areusually chosen from what is known as an “item bank.” Although this featureis designed to meet customer needs, there is currently professional disagree-ment about the degree to which this practice reduces the integrity of theinstrument or adds to the knowledge base about the emerging demands ofleadership.
STEP 7:FIND OUT HOW CONSISTENT SCORES TEND TO BE
Information for this step and the next will again be found in the techni-cal material for the instrument. First, look for a section on “Reliability,” orsections on “Test-retest Reliability,” “Internal Consistency,” and “InterraterAgreement.”
Basically, reliability is consistency. There are three aspects toreliability:
• homogeneity within scales,• agreement within rater groups, and• stability over time.
Without evidence of reliability, we do not know whether the items and scalesof an instrument are good enough to hold up even under stable conditionswith similar raters. In other words, we do not know whether items that aregrouped together in a scale are measuring the same competency (homogene-ity within scales); we do not know whether groups of raters who bear thesame relationship to a manager tend to interpret the items similarly (agree-ment within rater groups); and we do not know whether the meaning of itemsis clear enough so that a single rater will rate a manager the same way over arelatively short period of time (stability over time).
Homogeneity within Scales:Basic Issues in Internal Consistency
Homogeneity within scales is called internal consistency. This type ofreliability applies to the scales on which feedback is to be given, rather thanto the individual items to which raters respond. Reliability is assessed using astatistic called the correlation coefficient, which indicates the degree ofrelationship between two measures. Correlation coefficients can range from
Step 7: Find Out How Consistent Scores Tend to Be

10 Choosing 360
–1 (perfect negative relationship) to +1 (perfect positive relationship). Acorrelation of zero means there is no relationship between the two measuresof interest.
Internal consistency measures are based on the average correlationamong items and the number of items in the scale. Fundamentally, it askswhether all the items that make up a single scale are, in fact, measuring thesame thing, as their inclusion in a single scale suggests. Managers whoexhibit one of the behaviors that defines the scale should also exhibit thebehaviors described by other items on that scale. If this correlation is low,either the scale contains too few items or the items have little in common.
Though several statistical procedures exist for testing internal consis-tency, Cronbach’s alpha is the most widely used. An alpha of .7 or higher isgenerally considered to be acceptable. Low reliabilities are often the result ofitems that are not clearly written.
It should be noted here that the interpretation of reliability coefficients(how high they should be) is a subjective process. Although we provide rulesof thumb for deciding whether a particular type of coefficient is high or low,there are many issues involved in making such interpretations. For example,factors such as the number of items on a scale and what skills are beingmeasured by a scale can affect its reliability. So it’s probably a good idea tocompare the reliability coefficients reported for several similar instrumentsbefore deciding what level of reliability seems to be acceptable.
Agreement within Rater Groups:Basic Issues in Interrater Reliability
Agreement within rater groups is commonly called interrater reliabil-ity. This concept assumes that two or more direct reports, peers, or supervi-sors, with an adequate opportunity to observe a manager’s behavior, shouldtend to agree on the level of performance of that manager, given reliableitems and scales.
Interrater reliability does not tend to be very high for 360-degree-feedback instruments for several reasons. First, the raters are typically un-trained. Trained raters may produce higher reliability by using a commonevaluative framework. The people who usually complete these instruments,however, often rely on nothing more than their own perceptions, and percep-tions tend to vary. Second, a group of direct reports may be managed differ-ently by their boss. Their within-group reliability may be relatively lowbecause the target manager actually interacts differently with each of them.Third, some behaviors may elicit higher interrater reliability than others

11
because they are easier to observe and rate. And fourth, interrater reliabilityamong peers may be lower to the extent that managers interface differentlywith different kinds of organizational peers.
Again, this type of reliability coefficient does not tend to be very highfor 360-degree-feedback instruments; it should not, however, be extremelylow. Look for correlation coefficients, within specific rater groups (that is,peers, direct reports), that are at least .4.
Additional ConsiderationsIt is not uncommon to find instruments that have not been tested for
interrater reliability. There is some disagreement about whether this is neces-sary or useful for multiple-perspective instruments, because the perspectivestaken by various raters (peers, boss, direct reports) will differ according to theorganizational relationship they have with the target manager. The argumentis that these differences in organizational perspective will be reflected byartificially low interrater correlations.
Yet careful analysis can be, and has been, done on reliability within thedifferent perspectives. When approached this way, there should be higherreliability within rater groups than between them. For example, a singlegroup, say peers, should show higher within-group reliability than do peers ascompared to direct reports. This approach recognizes both the desirability ofreasonable reliability among raters of the same type and the reality thatdisagreement exists between raters of different types.
In looking at reliability within rater groups, one needs to be wary ofvery high correlations, because they may be an indication of raters’ overallbias toward the individual (the so-called halo effect), instead of a clearreflection of the individual’s performance. Therefore, as a rule of thumb,within-group reliability should not be lower than .4 or much higher than .7.
Stability over Time:Basic Issues in Test-retest Reliability
Stability over short periods of time is called test-retest reliability. It isstudied in relation to both items and scales. An item or scale should be stableenough to produce a similar response this week and next week, given that nosignificant event, such as training, has intervened. If the meaning of an item isunclear or debatable, it may produce varying responses because of thisambiguity. Low test-retest results indicate the item should be revised andretested or dropped from the scale.
Step 7: Find Out How Consistent Scores Tend to Be

12 Choosing 360
Look in the technical materials for test-retest coefficients of at least .4,which is minimally adequate, with .7 to .8 quite high. This coefficient tends tobe low for items on 360-degree instruments because others’ perceptions ofbehavior or competence may be unstable. Yet it is still important that thedeveloper has weeded out of the instrument those items with very low stabil-ity over time.
Additional ConsiderationsA few instrument developers argue that test-retest reliability is inappro-
priate for 360-degree-feedback instruments. These developers argue that thesimple act of completing a questionnaire will affect responses on a retest, andthat an instrument designed to stimulate change shouldn’t be assessed onthese criteria. Although both of these assertions may be partly true, neithernegates the need to examine test-retest correlations to look at basic item andscale stability.
Responding to a set of test items may, in fact, alert respondents todimensions of managerial effectiveness of which they had previously beenunaware. As a result, respondents may rate a manager somewhat differentlyon the second rating opportunity, having now had time to observe the desiredbehavior. This may be another reason why test-retest correlations do nottypically turn out higher than .6 or so for 360-degree-feedback instruments.
Adequate test-retest reliability is especially important if you expect touse an instrument before and after training or over time to measure programimpact or individual change. If test-retest reliability has not been demon-strated, you cannot know whether changes in scores over time represent realchanges in performance or are merely the result of instability in the instru-ment itself.
In order to make a meaningful statistical comparison, the appropriateway to conduct test-retest reliability studies is to compare data from twoadministrations of the instrument that are completed three to six weeks apart,with no intervening feedback or training. With this method, study participantsprobably won’t remember their initial ratings when they complete the instru-ment for the second time.
Although completing the form may influence the way raters observemanagers or influence the way managers rate themselves, managers are notlikely to change significantly merely by completing the instrument. Reallysignificant behavioral change is quite difficult to achieve, usually requiringboth powerful feedback and intense follow-up.
13
STEP 8:ASSESS BASIC ASPECTS OF VALIDITY—DOES THE INSTRUMENT
MEASURE WHAT IT CLAIMS TO MEASURE?
The next step is to look for evidence of validity. In the instrument-development process, this is the process of reality testing. It is here that thedeveloper begins to see whether the model holds up for real managers inreal jobs.
In other words, validity is integrity. If you do not know for sure whetheran instrument measures what it says it measures and you do not have evi-dence that scores are related to effectiveness on the job, you will not knowhow to interpret data from that instrument. If you have not seen evidence thatmanagers can improve their performance, you cannot know whether theinstrument’s scales represent areas in which managers are able to developthemselves.
These considerations are especially important because managers typi-cally will use the feedback to set performance goals or to try to change theirbehavior, and most will take what others say very seriously. Establishedvalidity is also helpful in dealing with managers who receive very negativefeedback from others. These managers may, to maintain their self-respect,attack the integrity of the instrument by arguing that it assesses areas thatdon’t make a difference or are areas over which the manager has little control.
Studying the validity of 360-degree-feedback instruments involvesthree separate, but related, areas. The first is determining whether the instru-ment actually measures what it is intended to measure. For instance, does itmeasure leadership rather than intelligence or power? The second is seeingwhether what is measured really makes a difference. Are higher scoresactually related to greater effectiveness in real organizations? The third isevaluating whether what is measured can change as a result of training,feedback, or other developmental experiences. Can the instrument’s scales beshown to represent domains that are amenable to development?
Look in the technical materials for a section on validity. There may beseveral sections labeled “Construct Validity,” “Concurrent Validity,” and thelike. One does not have to be thoroughly versed in the different aspects ofvalidity to get enough information about the extent of validity evidence forthe instrument. (The interested reader can find a discussion of the meaning ofthe different aspects of validity in the “Additional Considerations” sectionbelow.)
The modern view of validity, in fact, is that the different “types” ofvalidity are actually aspects of a single concept—construct validity. Construct

14 Choosing 360
validity indicates what meaning can be attached to the scores from an instru-ment. Rather than examining the several, often overlapping types of validity,one should focus on the main inferences that underlie the use of an instru-ment. And by use we mean both the use for which it was intended and the useyou plan to make of it. The typical assumptions underlying the use of instru-ments for management development are, as indicated above, that the instru-ment is measuring what it says it measures, that scores are related to effec-tiveness, and that the constructs measured are amenable to change.
Look in the validity section of the technical materials for studies thatcompare scores on the instrument to scores on another validated instrument(that is, an instrument whose psychometric properties are known). Favorableresults in this type of study will provide some evidence that the instrumentmeasures what it was intended to measure. Another kind of study to look forwould be one that tests hypotheses about observable behaviors. For example,the instrument developer may hypothesize that certain scales on the instru-ment will be related to certain personality characteristics. Other types ofstudies that can test this assumption are described below in the “ConstructValidity” section.
The next underlying assumption to be tested is that scores on theinstrument are related to important aspects of managerial effectiveness on thejob. The typical way to test this hypothesis is to compare scores on theinstrument to some other data relating to effectiveness or competence. Thesedata, if collected at the same time as the ratings on the instrument, reflectcurrent effectiveness. Raters may be asked to rate the target manager on adifferent effectiveness measure; current performance-appraisal data may becollected; or data may be obtained that relate to current employee or work-group productivity. In addition, effectiveness data or data on promotions maybe collected after some time has elapsed, so that we can know whether per-formance can be predicted by scores on the instrument from an earlier time.
Look for any information about studies that relate scores on the instru-ment to another measure of effectiveness on the job. This other measure couldbe another instrument that has been completed on the manager, or it could bea rating on effectiveness done by the manager’s boss or co-workers. In acorrelational study, look for correlations that are at least moderate in magni-tude (.3 or higher). Or look for a study that has compared instrument scoresfor groups of managers considered to be performing effectively or ineffec-tively—high performers or low performers. In this case, look for a result thatshows that scores on the instrument were able to predict membership in thehigh and low groups (that is, scores of managers in the high group weregreater than scores of managers in the low group).

15
The third type of study to look for is one that shows that the conceptsmeasured are amenable to change as a result of training, feedback, or otherdevelopmental experiences. This is the most difficult study to find, becausevery few instrument developers have done this research. Studies of changeresulting from feedback are very scarce.
One additional issue in examining validity is the sample used in any ofthe studies. How well do the characteristics of the sample reflect those ofyour target population? If the sample was primarily white males and yourtarget audience will be more diverse, check to see whether gender or ethnicdifferences were found in the research on the instrument in question.
If you plan to use an instrument internationally, issues to be concernedwith include the quality of translation, the availability of international norms,and evidence of reliability and validity for international samples.
Translating an instrument should be a carefully executed, multistageprocess, including both translation from English to the other language, as wellas independent translation from the other language back into English. The useof back-translation ensures that meaning has not been changed in the process.Careful attention should be paid to idioms during this process. For example,“putting out fires” is common jargon among North American managers buthas a different, more literal interpretation in both the nonmanagement arenaand in areas outside the United States.
It is not always the case that an instrument translated for internationaluse includes translated feedback and development materials. Many instrumentvendors have translated only the instrument itself but not the feedback reportor development guide. Products such as this can be used for English-speakingmanagers whose raters are not fluent in English. They cannot, however, beused for managers who themselves are not fluent in English because they willbe unable to read their feedback. Thus, if your target managers do not speakEnglish, check thoroughly the completeness of translation for all materialsrelated to the instrument.
Finally, instruments developed from research, theory, or experiencewith North American managers must undergo further testing with the popula-tion for whom the instrument will be used. At a minimum, norms should beavailable for each language in which the instrument is translated. To compareNorth American managers’ scores to scores of managers from other cultures,look for statistical evidence supporting score equivalence. This would includefactor analyses, scale alphas, and mean comparisons for each intended popu-lation. Vendors who have substantial databases should have statistical evi-dence, such as differential item functioning (DIF), item response theory (see,for example, Ellis, 1989), and logistic regression (LR) (see, for example,
Step 8: Assess Basic Aspects of Validity
16 Choosing 360
Swaminathan & Rogers, 1990) supporting the equivalence of the questions.Also, cross-cultural validity studies should be undertaken to verify that scoreson the instrument are related to effectiveness in the other cultures.
The pace at which instrument publishers are translating instruments forinternational users has increased, and it is not uncommon to find instrumentsthat have been translated into more than one language. It is, however, difficultto find North American-developed instruments that have been validated forthe population for which they’re translated.
So a cautious approach is warranted when selecting North American-developed instruments for non-English-speaking managers. Look for one thathas been carefully translated and which has been studied with respect tocross-cultural differences in norms, factor structure or scale reliabilitiesacross different groups, and whether scores are related to effectiveness insimilar ways across different cultures.
Keep in mind, however, that no instrument is ever proven valid onceand for all. Validity is an ongoing process that involves collecting evidenceover time in varying situations for different populations. In fact, any time theintended use of an instrument departs significantly from the assumptionsunderlying validity research to date, more research needs to be done.
It is useful to think of validity as a continuum ranging from no evidencethat the inferences underlying the instrument are valid, to some evidence, to agood deal of evidence among varying groups and in different contexts. Ingeneral, the number of validity studies done should correspond roughly tohow long the instrument has been around. Newer instruments will have fewerstudies reported, but all instruments that offer feedback from co-workersshould have at least one study completed that indicates the instrument ismeasuring what it claims to measure, and one that shows that its scores arerelated to effectiveness.
Additional Considerations: Ways of Defining ValidityAccording to psychometricians and statisticians, there are several
aspects of validity: construct, concurrent, predictive, and content. Construct Validity. A construct is an abstract variable that cannot be
directly measured. Temperature and humidity are not constructs; but leader-ship, resourcefulness, and integrity are.
Construct validity refers to the ability of the instrument to measurephenomena that are hypothesized to exist but for which we can have no directmeasure. All the different “types” of validity (content, concurrent, predictive)are actually aspects of construct validity. Every validity study represents atest of hypotheses about relationships between a set of constructs. Some
17
constructs are narrow, in the sense that they may be completely described bya few behaviors. Other constructs are so large or broad that they may never beperfectly defined by even a very large number of behaviors. Broad constructs,like leadership, are usually measured using only a subset of all possiblebehaviors.
Thinking about construct validity begins with thinking about the theory,if any, that has been used to specify the meaning of the construct; how theconstruct should be related to other constructs; and how it should be related tospecific observable behaviors. One way construct validation research canproceed is by testing hypotheses generated about observable behaviors.Another strategy may be to compare scores on the target instrument to scoreson a similar instrument whose psychometric properties are known.
Because constructs cannot be directly measured, another way to ap-proach construct validity is through a multimethod study. For example, if weare measuring more than one construct (resourcefulness and integrity) andcan measure them in multiple ways (paper-and-pencil and rater observations),then we can discern how much of the correlation between these two con-structs is due to the measurement method and how much is due to overlap inthe constructs themselves. To obtain evidence of construct validity in ourexample, the correlation between the paper-and-pencil and rater observationmeasures of resourcefulness should be greater than the correlation betweenresourcefulness and integrity using the same measurement technique. Conver-gent validity is the label given to the condition of a high correlation betweenthe same construct measured by two different methods.
Concurrent and Predictive Validity. These two aspects of validity,known collectively as criterion-related validity, have to do with the relation-ship of the scores to some other attribute, called a criterion variable. With360-degree-feedback instruments, we are usually concerned with criteria thatmeasure managerial performance or effectiveness.
Both concurrent and predictive validity are temporal in nature. Concur-rent validity has to do with the relationship between scores on an instrumentand performance or effectiveness measured at approximately the same timethe instrument was completed. The relevant question is: How accurate is theinstrument’s assessment of current performance or effectiveness? Predictivevalidity has to do with the relationship between scores on the instrument andperformance or effectiveness sometime in the future. (Though some peopleuse the term predictive to cover any study that looks at the relationship witheffectiveness, we will limit our use of this term to mean only those studiesthat relate current scores to future performance.) The relevant question
Step 8: Assess Basic Aspects of Validity

18 Choosing 360
here is: How accurately can the instrument predict future performance oreffectiveness?
Both concurrent and predictive studies are relevant for instruments usedfor management development, because in helping managers become moreeffective we are interested in both current effectiveness and effectivenessover the long term.
Criterion issue. In studies of both these types, the nature and measure-ment of the criterion variable is a key issue. Examining the criterion measureemployed to validate an instrument can be as important as examining thestudy’s findings.
Remember that all leadership and management instruments are intendedto assess factors associated with success or effectiveness. But success can bethought of as upward movement in one’s career (that is, promotion in theorganization), or it can be thought of in terms of effectiveness as a leader ormanager (that is, how satisfied others are with the individual’s performance,how well the manager’s direct reports perform, measures of profit-and-loss,and the like). These two phenomena are not necessarily the same (Luthans,1988). Understanding how success has been defined in the research on aninstrument and knowing how that compares with your own intended use of itis key to interpreting the results of any validity study.
According to Dalton (1996), the main, and only really appropriate, useof data from a 360-degree-feedback instrument is for management develop-ment or assessment for development. Most instruments of this type have notbeen developed or extensively tested for other uses (for example, selection orpromotion). These instruments are basically dealing with people’s perceptionsof behavior or competence, rather than any completely objective measure ofperformance (if one exists). An individual or organization planning to use aninstrument of this sort for selection, promotion, pay, or performance purposesis in treacherous territory and will need to become aware of the relevantprofessional standards (SIOP, 1987) and government guidelines (Mohrman,Resnick-West, & Lawler, 1990), which are not covered in this report.
For management development, the main inferences to be drawn are that(1) high scores are related to effective current performance and (2) the com-petencies represent areas managers are able to develop.
Finding an appropriate criterion for a study of the first inference wouldinvolve choosing a definition of effective performance: If it is defined as theboss’s perception of the individual’s performance, the criterion variable mightbe performance-appraisal data; if it is defined by direct reports’ perceptions,the criterion might be “effectiveness” as rated by direct reports; and if it isdefined as success in the organization, the criterion might be promotions.

19
Variables less directly related to managerial effectiveness, such as bottom-line business profitability, may not be the best criterion measures. Businessescan be profitable for reasons other than good management, and businessescan fail despite good management.
A useful study of the second inference would show that managers areable to improve their scores as a result of training, feedback, or other develop-mental efforts on their part. As mentioned earlier, this type of study is moredifficult to find.
Choosing the criterion variable for a validity study is one of the moreproblematic but critical phases of the research. The choice should be madewith reference to the main inference(s) to be drawn from the instrumentscores. In general, criterion data from an independent source (that is, a sourcedifferent from the person or persons providing ratings on the instrument) areusually considered better data because using an independent source reducesthe bias that occurs when both pieces of data come from the same person.
Reliability of criterion measure. A good criterion measure should havea high degree of reliability. In other words, whatever it measures should beconstant over time. When effectiveness ratings are used as the criterionmeasures, they are subject to some of the same reliability concerns as theinstrument itself. For example, raters’ judgments about the overall effective-ness of their leaders may be unstable over short periods of time. Although thisissue is an important one to think about in evaluating the quality of a validitystudy, it may be difficult to find such research because few instrument devel-opers have taken the time to study the reliability of their criterion measures.
Content Validity. Content validity has to do with the degree to whichthe items are a representative and comprehensive measure of the phenomenonin question, in this case leadership or management skills. For example, a 360-degree-feedback instrument should cover areas that are important for effec-tive performance for the job in question. Often this information can be de-rived from the theory or model on which the instrument was developed, orfrom the experience of the instrument developer. Content validity is oftenmore a matter of professional judgment than statistical analysis.
There Is No Perfect Instrument: Balance Is the Key
Remember throughout this process that there is no perfect instrument—no one instrument that is perfect for everyone, no one instrument that willalways be ideal for you, and no one instrument that can’t be improved. Assolid and powerful as some are, each feedback tool has its weaknesses as wellas its strengths.
Step 8: Assess Basic Aspects of Validity

20 Choosing 360
The key to good instrument selection is balance—knowing what youneed and seeking a balance between your needs and quality standards. Youmay have already made some conscious trade-offs, and before this selectionprocess ends you may make some more—sacrificing one good to get another.But to maximize the value of your choice—to most effectively use the instru-ment you choose—you need to be aware of the trade-offs you have made—what you have lost and what you have gained.
Keep in mind that no instrument is proven valid once and for all.Validation is an ongoing process. Several good validity studies definingeffectiveness in varying ways are stronger than a single study or severalstudies that define effectiveness in the same way.
Now that you have reviewed the origin of items and feedback scalesand have examined the evidence of reliability and validity for the instruments,you have available one or more instruments that you believe have beenconstructed according to sound psychometric principles. At this point you canbegin to evaluate and compare instruments in terms of their potential im-pact—what kind of feedback will be provided and how that will be delivered.
STEP 9:THINK ABOUT FACE VALIDITY
Go to the instrument itself—the items to which the manager willrespond. Read through the items carefully. Experiment with them by trying toapply them to a manager whose skills you can observe in your organization.Do the items make sense when applied to someone you know? If you gothrough this exercise with several different managers in mind, you will get asense of how managers who complete the instrument will feel about its facevalidity. Face validity isn’t validity in the technical sense but rather whetherthe instrument looks appropriate for your managers. If the items are awkwardor hard to apply, think about dropping this instrument from consideration.
STEP 10:EXAMINE THE RESPONSE SCALE
Look at the main response scale—the choices people will have whenthey respond to each item. Examining this helps you understand how peoplewill be asked to think about the competencies measured by the instrument.

21
Will they be asked to rate the competencies as either “Strengths” or “Areasfor development” or will they be asked to make finer distinctions in ratinglevels of skill?
Response scales (also called rating scales) usually range from 2 pointsto 10 points. Both shorter and longer scales have their advantages as well astheir disadvantages. A 2-point scale will force one to choose between alterna-tives such as “Yes/No,” “Strength/Development needed,” or “Do more/Doless.” The advantage of the shorter scale is simplicity of feedback.
The trade-off with a shorter scale is in data richness. With a shortresponse scale, raters will not be able to report middle levels of competencyand may fail to respond to items if they are unwilling to say definitely “Yes”or “No,” definitely “Strength” or “Development needed.” And short scalesare not useful if one intends to use a pre- and post-test design to look at theimpact of feedback or training, because these can fail to pick up the subtlechanges fostered by even the best training or change efforts. If any follow-upstudies will be conducted down the road, an instrument with a longer re-sponse scale will be needed.
A longer scale (5 to 7 points) will allow raters to make finer distinc-tions. The trade-off with a longer scale may be some ambiguity in the mean-ing of what may be too many response categories. Choosing between “Occa-sionally” and “Sometimes” may be difficult on some items or for somemanagers. Some examples of longer scales include:
Never Very uncharacteristic Among the bestOccasionally Uncharacteristic Better than mostSometimes Slightly uncharacteristic AverageUsually Slightly characteristic Worse than mostAlways Characteristic Among the worst
Very characteristic
As can be seen in the three examples above, some response scales giveraters a middle-of-the-road choice, such as “Average,” whereas others forceraters to take at least a slightly positive or slightly negative position.
In addition, a response scale may have “Don’t know” or “Not appli-cable” alternative choices. These may be useful if you are using the instru-ment for a combined population of managers and nonmanagers—or withpeople new to their positions—and want people to have these rating options.The downside is that raters may overuse the “Don’t know” option to avoidmaking difficult rating choices.
Step 10: Examine the Response Scale

22 Choosing 360
STEP 11:EVALUATE THE FEEDBACK DISPLAY
Type of Display
There are two types of feedback display: graphic and narrative. Manyfeedback displays use a combination of styles to present data.
Graphic displays are charts or graphs that provide a visual picture ofhow managers view themselves in comparison to their raters and the instru-ment norms.
Narrative display is computer-generated feedback in text format ratherthan graphic format. It is both a presentation and a personalized interpretationof the scored data, as opposed to boilerplate recommendations for change.The text produced often incorporates some of the same strategies for framingfeedback as can be found in graphic displays (see the section below [Step 13]on strategies for facilitating interpretation and change).
Narrative interpretation differs from development materials (discussedon pages 28-29) in that narrative is personalized, based on the manager’sindividual feedback and output as a result of the scoring process. Develop-ment materials are off-the-shelf manuals, workbooks, and readings.
Clarity of Feedback Display
Open and review the sample feedback as if it were your own. It isprobably best not to use your own feedback (if you’ve already taken theinstrument) in this step, because your feelings about your own results mayimpede an objective analysis.
Carefully read through the instructions and look at the display. Can youunderstand it? How easy is this for you? Your own experience in trying tointerpret the feedback is a good measure of how others will experience it. If ittakes you several attempts to understand the graphic display, it is probablytoo complicated.
Although people should ideally never be handed instrument feedbackwithout some guidance, it is not always possible to provide large groups ofmanagers with intensive support. In general, the more interpretation and goal-setting that managers will have to do for themselves, the more you should beconcerned about the clarity of the feedback display.
23
STEP 12:UNDERSTAND HOW BREAKOUT OF
RATER RESPONSES IS HANDLED
RESPONSES IS HANDLEDBy rater responses, we mean the responses that come from the people
who rated the manager. This usually includes direct reports, peers, boss(es),and customers. Find out how rater data are treated in the feedback display.
Most 360-degree-feedback instruments present boss, peer, direct report,and customer ratings as separate average scores, but some combine theratings of all “others” into one average score. Other instruments display theaverage rating from direct reports separately but combine boss ratings withpeers.
Using separate ratings for each rater group may be more powerful, inthat it gives the manager more information. It can also be more complicatedto interpret, more compromising of rater anonymity, and more painful toreceive. Again, consider how much guidance and support you, or others inyour organization, will be providing managers when they receive their feed-back. The more guidance people receive, the better they are able to benefitfrom the enhanced impact that feedback from separate rater groups canprovide.
An issue with providing separate boss feedback is that rater confidenti-ality is compromised. If only one supervisor completes the instrument on amanager, his or her responses will be exposed under the “boss” category.Even if supervisors have been made aware (as they should be) that theirresponses will be known to the manager, confidentiality is still an issue toconsider.
Raters who know or believe that their responses will not be confidentialmay not be completely open in their evaluations, compromising the quality oftheir data. Although breakout of rater data increases impact, it may decreaseconfidentiality and, occasionally, data quality. However, we believe thatbecause the various rater groups often have very different perspectives of amanager’s performance, it is better to present the ratings from each perspec-tive separately.
24 Choosing 360
STEP 13:LEARN WHAT STRATEGIES ARE USED TO FACILITATE
INTERPRETATION OF SCORES
FACILITATE INTERPRETATION OF SCORESEnhancing performance or changing behavior is difficult, even when
feedback on these areas has been comprehensive. The difficulty is partlybecause the feedback can be overwhelming, especially if there is a lot of it, ifit is negative, or if it comes from many different perspectives. Without somemap or guidance about what is most important to direct one’s attention to, therecipient can get lost, miss important data, or give up on processing theinformation.
Rather than just presenting self and rater scores, an instrument shouldbuild some kind of framework for corrective action into the feedback display.
There are at least seven strategies for helping managers understand theirfeedback:
• comparison to norms,• highlighting largest self-rater discrepancies,• item-level feedback,• highlighting high/low scores,• comparison to ideal,• importance to job or success, and• “Do more/Do less” feedback.
These can be built into either graphic or narrative displays.Any feedback display should use at least one of these strategies because
without any of them, the manager has no way of knowing what to make of hisor her scores. The better feedback displays usually use a combination of twoor more strategies.
If well-laid out and clearly integrated, the use of multiple strategies mayincrease the meaningfulness as well as the impact of the data. This is becauseit will give the manager many viewpoints from which to examine the infor-mation and make it more difficult for the recipient to dispute negative feed-back. Yet, past a point, more may not be better. For some managers, moreinformation may be too much, especially if the display is comprehensive butnot entirely clear. Again, it is up to you to decide whether the balance be-tween information/impact and clarity/simplicity is right for your target group.
Comparison to Norms
Comparison to norms is probably the most widely used of all strategies.Norms usually represent an average for all people who have taken the instru-

25
ment but sometimes are based on one specific target group (middle managers,for example). These averages are presented for each scale on which feedbackis received so that the manager can compare his or her own scores to thenorm. The manager uses this information to ask himself or herself: How am Idoing compared to others? The more the norm group resembles the managerin terms of managerial level, the more relevant this comparison will be.
Norms can be displayed in a variety of ways. They can be listed as aseparate column of data to be compared visually to one’s own score, or one’sown score can be plotted against norm data. When this latter strategy is used,the graphic display contains standard scores or percentiles. A standard scoreis a statistical computation that allows individual scores to be compared to thetotal distribution of scores by taking into account the mean and standarddeviation of the population. A percentile represents the percentage of personswho have lower scores than the individual being rated.
Norms for diverse populations (for example, gender, industry, country)are usually located in the trainer’s manual. How often a vendor updates normswill depend on assumptions about the theory behind the instrument. If skillsand abilities measured by an instrument are believed to be sensitive tochanges over time, then norms should be updated on a regular basis. Whenthis is the case, skills do not disappear from effective managers’ repertoire,but instead the relative importance of them changes with trends in organiza-tions. For example, managers today are more aware of the importance ofteamwork as organizations have become flatter in their structure. If, on theother hand, there is no reason to believe that the importance of skills andabilities will fluctuate over time and if there is statistical evidence to supportthis, then cumulative norms or norms that include everyone who has taken theinstrument are sufficient. Newly developed instruments and instruments thathave recently been translated will most likely use cumulative norms becauseonly a small number of managers have taken the instrument.
Highlighting Largest Self-rater Differences
Although by definition all 360-degree-feedback instruments presentself-ratings compared to others’ ratings, some feedback displays go beyondthese comparisons to highlight scores on scales where self-rater discrepanciesare meaningful. Managers often wonder how much of a difference betweenratings is enough to be meaningful, and this type of highlighting lets themknow. It can be very useful, especially when combined with rater breakout ofdata. For example, the ratings of self and peers on scales that concern manag-ing people may be similar, whereas the ratings of direct reports may be
Step 13: Learn What Strategies Are Used to Facilitate Interpretation of Scores

26 Choosing 360
significantly lower than self-ratings. This can happen because supervisoryskills are often most visible to those being supervised.
Item-level Feedback
Though item-level feedback can be unreliable (that is, single items donot adequately represent complex phenomena), it can be helpful when used inconjunction with feedback on scales because items provide more detailedinformation. Learning that you scored low on “Resourcefulness,” for ex-ample, may not be as helpful as knowing how you scored on the specificitems linked to “Resourcefulness.” Item-level feedback can give the managersome leads about what to begin to do differently in order to be more effective.
Highlighting High/Low Scores
High and low scores are sometimes presented on individual items andsometimes on scales. This type data can be presented as graphs or as listingswith symbols to denote the highest and lowest scores.
Highlighting the high and low scores can provide participants with aquick overview of their strengths and weaknesses, especially when they arereceiving a lot of feedback. The danger is that when high and low scores areitem scores, what is presented can be a smattering of items from many differ-ent scales—which may be an unreliable summary of the data. The moreuseful approach may be to present high and low scale scores, with representa-tive high or low items highlighted within scales.
Comparison to Ideal
Comparison to an ideal is not widely used. When used, it may representa theoretical ideal for leadership or management, or it may be data providedby the manager himself or herself (for example, What kind of leader do I seeas ideal?) or by raters (for example, What kind of leader do raters see asideal?). Self or rater data on actual performance can then be compared to datafrom self or raters on the ideal leader.
Importance to Job or Success
Importance ratings may reflect perceptions of how important a skill orpractice is to effectiveness in one’s job or to longer-term success in one’sorganization. These data are usually collected from managers and/or fromtheir raters when the instrument is completed. Sometimes raters rate each

27
item or scale in terms of its importance (to the job or to success), andsometimes they choose a certain number of items and scales that are mostimportant.
The use of this strategy can be very powerful in prioritizing which partsof the feedback may need greatest attention, especially when the manager andhis or her boss agree. Managers who are rated low on several scales can checkthe importance data and focus their developmental efforts on areas that wereseen as important for their short-term or longer-term effectiveness. When themanager and boss do not agree, importance data can provide a fairly non-threatening way to begin a conversation about the overall results.
Some caution should be used, however, in working with ratings ofimportance to job or success. Importance ratings may reflect people’s impres-sions of what has gotten executives to the top as much as real and criticalleadership competencies. These ratings may vary depending on the perspec-tive of the person providing the data (the manager’s boss, peers, or directreports). Mid-level managers may rate importance for success differently thanexecutives. And ratings may change over time with changes in organizationalculture or business strategy. In addition, few instrument developers whoprovide this type feedback have assessed the reliability of importance ratings.
“Do More/Do Less” Feedback
“Do more/Do less” feedback is not used by many instruments but canbe a valuable piece of information, especially when respondents are allowedto rate how frequently a behavior or practice is observed. “Monitoring theprogress of direct reports’ work” is a good example. A high score wouldmean the manager monitors work frequently, or does a lot of monitoring.What the manager cannot know from this is whether it is good to do a lot ofmonitoring or whether he or she is doing the appropriate amount. Althoughnorms will tell the manager how he or she is doing relative to other managers,they will not shed light on whether direct reports are satisfied with this levelof behavior. Asking raters to indicate whether managers should do more or doless provides an opportunity to see their side of the picture.
Linking Strategies Together:Issues in Considering Impact of Feedback
Different combinations of feedback strategies will produce differentkinds of impact on the manager receiving the feedback and may result indifferent conclusions being drawn from the data. Consider the blend of
Step 13: Learn What Strategies Are Used to Facilitate Interpretation of Scores

28 Choosing 360
strategies presented in the feedback design, what that blend will highlight formanagers, and what the impact will be. Again, maximum impact may notalways be desired. The goal should be meaningful feedback with appropriateimpact.
If you still have several possible choices once you’ve gotten to thispoint in the selection process, it may be worthwhile to take these instrumentsyourself, have them scored, and receive your own feedback. This kind ofexperience is especially important if you have any doubts about the impactthe feedback will have or whether the depth of intervention will be appropri-ate. A second-best alternative is to fill one out, as an exercise for yourselfonly, on someone else. As you complete the questionnaire itself, consider thefeel or nature of the items. Sometimes items which look just fine becomeunclear or awkward when you actually have to use them to rate a real person.
If you do have the opportunity to review your own feedback, payattention to your own reactions to the competencies being measured by thescales, how rater data are broken out, and what graphic strategies are used inthe feedback display to help managers understand and interpret their scores.
STEP 14:LOOK FOR DEVELOPMENT AND SUPPORT MATERIALS
Support for the Manager’s Development
At this point in the process, having considered potential impact, you arenow ready to consider what support will be available with each instrument forboth the manager receiving feedback and the trainer or facilitator responsiblefor one-on-one consultation or classroom training.
During a feedback process, managers should be carefully led throughthe graphic presentation of their scores where they learn something abouttheir strengths and development needs. Yet they may remain unaware of whatthese scores mean. They may have an answer to the question, “What are mystrengths and weaknesses as a leader?” but may lack answers to, “So whatdoes that mean?” and “Now what should I do?” With feedback instruments,the “So what?” question can be addressed by development materials and the“Now what?” question by a goal-planning process. These kinds of supportmaterials accompany the feedback packet with some instruments but are not apart of some others.
Instruments can have exquisite accompanying materials ranging fromnicely bound development guides for managers (including in-depth interpre-
29
tive materials, suggestions for development, and goal-planning guides), tonotebooks, manuals, overhead materials, extra norm data, and group profileoptions for trainers. Some instruments, however, offer very little besides thefeedback.
We have intentionally left what an instrument offers in this regard asone of the last steps in our evaluation process. It would be a mistake to selectan instrument because of its glitzy package without considering the integrityof its development and the quality of its feedback display. Once you knowyou’ve gotten the best instrument for you in those two arenas, you may wantto choose the one with the best accompanying materials.
And, with supporting materials, quantity is not necessarily the same asquality. More is not necessarily better. For example, for most audiences, it isbest to look for materials that help managers come up with solutions andgoals of their own, because people are more motivated to implement theirown ideas than to do what they have been told. Yet some development guidesare very prescriptive. They have a “Do A, B, and C” approach to develop-ment. And some materials appear to be presented in a boilerplate fashion.Sophisticated managers may lose faith in an instrument that appears to giveeveryone the same advice.
Trainer Support
To evaluate support for the trainer, what is available must be comparedto your own needs as a trainer or facilitator (or the needs of those who will beresponsible for feedback facilitation). Some instruments come with trainingguides that give a more in-depth understanding of how to interpret scores onthe instrument. Find out if attendance in a certification workshop is requiredfor purchase and use. Supplemental norms may be available, either in theform of organizational norms or norms on unique subsamples (for example,health-care workers, cross-cultural groups, student leaders, high-level execu-tives, and so forth). Videotapes may be available for classroom use, as mightother additional materials including transparencies, handouts, or supplementaltechnical reports.
Scoring Process
Computer scoring is the most common method of producing feedback.Computer scoring can be done by the vendor; licensed scoring programs; orself-administered, self-scoring computer software. Some instruments havemanually scored (hand-scored) versions available as well.
Step 14: Look for Development and Support Materials

30 Choosing 360
Computer ScoringIn general, although all computer scoring tends to increase the total
price to the consumer, this method has many benefits. The depth and qualityof computer-generated feedback tends to be high. Instead of the managersifting through mounds of data to find, for example, the ten highest rateditems, the computer program can sort and arrange the information in a frac-tion of the time. Human errors in scoring the data and calculating scale scorescan be eliminated by using computer scoring. It also can provide raters withgreater anonymity and can enhance the quality of their responses becausethey know the target managers will not see their rating forms. Computerscoring can be done by the vendor or software can be purchased from thevendor.
Vendor Scoring. Returning instruments to the source where they werepurchased is a very common form of instrument scoring. It does, of course,increase the cost per instrument, as well as introduce the issue of turnaroundtime (the time it takes to mail forms or fax forms to the vendor, have thosescored, and have feedback reports produced and returned to the client).Though there may be some problems, many managers and trainers findvendor scoring to be the most expedient method because it can reduce manag-ers’ and trainers’ time by relieving them of the job of hand-scoring theinstruments. It also tends to produce some of the highest quality feedback in avisual sense.
Some vendors license their scoring programs to clients. Initial costs ofthe license can be high, but for organizations that purchase large quantities ofinstruments, this method can be cost effective.
Licensed scoring arrangements will vary according to the clients’ needsand work environment. Organizations may be able to purchase software toscore instruments on-site or may be able to use both on-site scoring andvendor assistance through remote scoring (using a modem to send data to thevendor to score). Computer programs for mainframes also can sometimes bepurchased through the vendor. If your organization has the appropriateequipment (for example, modem, fax machine, optical scanner, personalcomputer, and printer) and the resources to support these systems, this scoringmethod can provide quick turnaround of high-quality reports for those whoprocess a large number of instruments.
Computer Software. Instruments that are sold for use with personalcomputers usually have scoring programs built into the software. The qualityof the feedback can be as good as any other computer-scored instrument. Thismethod can, however, have a benefit over other computer-scoring methods, inthat the software can be reused over time.

31
Each of these scoring methods has its advantages and disadvantages.Time, costs, equipment, frequency of use, quantity and quality of feedback,and confidentiality are all issues that require your consideration beforedeciding which method best suits your organizational needs.
Manual ScoringHand-scored instruments allow managers to compile their own data and
produce their own feedback. This scoring method gives managers a firsthandknowledge of how scores are calculated and plotted, and it allows for imme-diate turnaround of feedback to the manager.
Although hand-scoring has these benefits, its strengths can easilybecome its weaknesses. Asking inexperienced users to score their owninstruments increases the likelihood of error and invalid results.
Assuring rater confidentiality is another difficulty with hand-scoredinstruments. Some instruments require managers to transfer raters’ scoresonto summary sheets. It can be possible for managers to guess who each ratermight be from the number of respondents, their handwriting, or the pattern ofresponses. Such a compromise of confidentiality can damage the quality ofthe data by reducing the frankness of the raters’ evaluations. In cases whererater confidentiality is of a particular concern, a person not involved in therating process can be chosen to hand-score instruments.
STEP 15:COMPARE COST—VALUE FOR THE PRICE
Cost is always a consideration, but what is included in the price canvary so extensively that selecting an instrument based solely on cost canresult in a less than optimal instrument for your use.
To adequately conduct the feedback process for one manager, youwould need one self-report instrument, at least three instruments for raters(usually the minimum to have rater data scored), a development guide, and anarrangement for scoring. Sometimes the cost includes all these and sometimesit includes only single copies of the instrument. Certification workshops,organizational profiles, trainers’ guides, introductory videos, and post-assessment may all be available but at additional cost. It takes thoroughinvestigation to determine what is included in the quoted price and whatsupplemental services may be available at additional cost.
Step 15: Compare Cost—Value for the Price

32 Choosing 360
STEP 16:CONSIDER LENGTH A MINOR ISSUE
Time is often a factor when choosing between one instrument with afew and another instrument with a large number of questions. Some managersmay find an instrument that requires 45 minutes to an hour to complete abothersome task and may reject its use. Though a longer instrument mayrequire more initial completion time, the depth of feedback it produces maybe worth the initial investment.
Conclusion
Congratulations! You have completed the selection process and nowhave one or more carefully developed and well-designed feedback instru-ments for possible use in your organization.
You probably have made some compromises along the way. Be awareof what those are and think through their implications. Doing this may helpyou make the final choice if you are left with more than one possible instru-ment. You may also want to contact vendors again for any additional infor-mation that can help you choose between instruments or aid in the under-standing or use of your instrument of choice. And remember to remain awareof the implications of any trade-offs you have made.
33
References
American Psychological Association (APA). (1985). Standards for educational andpsychological testing. Washington, DC: Author.
Conoley, J. C., & Impara, J. C. (Eds.). (1995). Mental measurements yearbook. TheBuros Institute of Mental Measurements (12th ed.). Lincoln, NE: The University ofNebraska.
Dalton, M. (1996). Multirater feedback and conditions for change. ConsultingPsychology Journal: Practice and Research, 48, 12-16.
Ellis, B. B. (1989). Differential item functioning: Implications for test translations.Journal of Applied Psychology, 74(6), 912-921.
Hogan, J., & Hogan, R. (1990). Business and industry testing: Current practices andtest reviews. Austin, TX: Pro-Ed.
Krug, S. E. (1993). Psychware sourcebook. Champaign, IL: Metritech, Inc.Luthans, F. (1988). Successful vs. effective real managers. The Academy of Manage-
ment Executive, 2, 127-132.Mohrman, A., Resnick-West, S., & Lawler, E. (1990). Designing performance
appraisal systems. San Francisco: Jossey-Bass.Society for Industrial and Organizational Psychology (SIOP). (1987). Principles for
the validation and use of selection procedures. College Park, MD: Author.Swaminathan, H., & Rogers, H. J. (1990). Detecting differential item functioning
using logistic regression procedures. Journal of Education and Measurement, 27,361-370.
Sweetland, R., & Keyser, D. J. (Eds.). (1990). Tests: A comprehensive reference forassessment in psychology, education and business (3rd ed.). Austin, TX: Pro-Ed.
Van Velsor, E., & Leslie, J. (1991). Feedback to managers, volume II: A review andcomparison of sixteen multi-rater feedback instruments. Greensboro, NC: Centerfor Creative Leadership.

34 Choosing 360
Suggested Readings
American Psychological Association (APA). (1993). Responsible test use: Casestudies for assessing human behavior. Washington, DC: Author.
Anastasi, A. (1988). Psychological testing (6th ed.). New York: McMillan.Bracken, D. (1994, September). Straight talk about multirater feedback. Training and
Development, pp. 44-51.Clark, K., & Clark, M. (Eds.). (1990). Measures of leadership. West Orange, NJ:
Leadership Library of America.Ghiselli, E., Campbell, J., & Zedeck, S. (1981). Measurement theory for the behav-
ioral sciences. San Francisco: W. H. Freeman.Hollenbeck, G., Dalton, M., Pollman, V., Bracken, D., Jako, R., & McCauley, D. (in
press). Forum: Should 360-degree feedback be used for administrative as well asdevelopment purposes? Greensboro, NC: Center for Creative Leadership.
Jones, J., & Bearley, W. (1996). 360-degree feedback: Strategies, tactics, andtechniques for developing leaders. Amherst, MA: HRD Press.
Lyman, H. (1986). Test scores and what they mean (4th ed.). Englewood Cliffs, NJ:Prentice Hall.
Nowack, K. (1993, January). 360-degree feedback: The whole story. Training andDevelopment, pp. 69-72.
Peters, D. (1985). Directory of human resource development instrumentation. SanDiego, CA: University Associates.
Prince, J. M., & Fleenor, J. W. (in press). Using 360-degree feedback in organiza-tions: An annotated bibliography. Greensboro, NC: Center for CreativeLeadership.
Tornow, W. W., London, M., & Associates. (in press). Maximizing the value of 360-degree feedback: A process for individual and organizational development. SanFrancisco: Jossey-Bass.
Yukl, G. (1995, December). How to get the most out of 360-degree feedback.Training, 32, 45-50.
Zeidner, M., & Most, R. (Eds.). (1992). Psychological testing: An inside view. PaloAlto, CA: Daves-Black.

35
Glossary of Terms
Behavioral item—A word, phrase, or sentence that describes some aspect ofbehavior.
Cluster analysis—A statistical analysis that groups like objects or items.
Concurrent validity—The relationship between scores on an instrument andperformance or effectiveness measured at about the same time the instrumentwas completed.
Construct—An abstract variable that cannot be directly measured.
Construct validity—The ability of the instrument to measure phenomenathat are hypothesized to exist but for which we can have no direct measure.
Content validity—The degree to which the items are a representative and acomprehensive measure of the phenomenon in question.
Correlation coefficient—A number, resulting from statistical analysis, thatindicates the strength of a relationship between two measures.
Criterion variable—A behavior or phenomenon separate from, but presum-ably related to, ratings produced by the instrument.
Cronbach’s alpha—A measure of the internal consistency of scales, basedon the average correlation among items and the number of items; if thiscoefficient is low, either the scale contains too few items or the items havelittle in common.
Differential item functioning (DIF)—A statistical analysis that tests equiva-lence of an instrument for two populations that have equal abilities.
Empirical—Capable of being demonstrated or verified by scientific (usuallystatistical) methods.
Face validity—Whether the instrument looks like it measures what it isintended to measure.
Factor analysis—A set of statistical approaches to grouping items or vari-ables into categories known as factors.

36 Choosing 360
Feedback—Information about a person’s performance or behavior, or theimpact of performance or behavior, that is intentionally delivered to thatperson in order to facilitate change or improvement.
Feedback display—The presentation of scored data, represented graphicallyor in narrative form.
Graphic display—Charts or graphs that provide a visual numeric portrayalof data.
Halo effect—High correlations resulting from raters’ overall bias toward theindividual.
Hypothesis—An expectation or prediction about observable phenomenaderived from theory.
Independent criteria—A criterion variable that comes from a differentsource or is external to the instrument itself.
Internal consistency—The average correlation among items included on thesame scale.
Internally homogeneous—Having high internal consistency.
Interrater reliability—Agreement among ratings within rater groups.
Item—A word, phrase, or sentence that describes an aspect of behavior,performance, skill, or personal characteristic.
Item content—The behavior, skill, or characteristic to which an item refers.
Item level—Referring to each item individually.
Item response theory (IRT)—A statistical analysis that tests whether mem-bers of different populations (for example, English and French), who areassumed to be “matched” on the abilities measured by an instrument, answerthe questions in a similar fashion. Examinees are matched using the itemscore patterns.
Item-scale correlations—The relationship(s) between responses to indi-vidual items and computed scores on scales.

37
Logistic regression (LR)—A statistical analysis that tests the equivalence ofan instrument for two populations by using the total instrument score (or ascore adjusted by deleting questionable items) to match examinees.
Mean—Arithmetic average of a set of data points or numbers.
Model—A set of hypotheses about the relationships between variables orconstructs.
Multimethod study—A study that compares the correlation between twoconstructs measured by different methods (for example, rater observation andpaper-and-pencil methods). The correlation between the two different con-structs measured similarly should be lower than that between a single con-struct measured using different methods.
Narrative display—Data presented in text format, usually with personalizedinterpretation.
Norm group—Group of managers whose scores are stored in the vendor’stest database and are output as a comparison on every individual feedbackreport.
Norms—The average scores of all people who have taken the instrument orthe average scores of specific target groups.
Population—The whole universe or group from which samples are drawn.
Predictive validity—The relationship between scores on an instrument andperformance or effectiveness measured at a future time.
Psychometrics—The study or practice of statistically measuring aspects ofperformance, behavior, personal characteristics, and other human attributes.
Rater groups—Groups of individuals providing responses to items on aninstrument.
Raters—Individuals providing responses on an instrument.
Rational/intuitive scale development—Grouping items together based onthe authors’ expectations or experience about how different skills or behav-iors relate to one another.
Response scale—A set of response choices provided on an instrument forraters to use in evaluating behavior, performance, or skill.
Glossary of Terms

38 Choosing 360
Sample—A subset of individuals drawn from the total population ordatabase.
Scale—A group of items that have logical and empirical coherence.
Standard deviation—A statistical index indicating the amount of spread inthe distribution of scores around the average score of a sample.
Statistical scale development—Using statistical-grouping procedures suchas factor analysis, cluster analysis, or item-scale correlations to sort items intoscales based on the degree of similarity in the response patterns of raters.
Target population—A group, sometimes with particular characteristics,for whom the instrument is intended; the group that will be rated on aninstrument.
Test-retest reliability—Stability of scores over short periods of time.
Validation strategy—The process or set of studies used to collect evidenceregarding the uses to which scores from an instrument can be reasonably andmeaningfully applied.
Validity—The extent to which an instrument measures what it is supposed tomeasure; the appropriateness of the inferences made about scores from aninstrument.
Variable—Any measurable entity whose value is not constant or given.
Weighting—Assigning differential value to points on a scale.

39
Instrument Evaluation Checklist
GETTING STARTED
(1) Find out what is available.
Have you done a thorough search for management or leadership devel-opment instruments? Check the source book(s) you’ve examined.
____ Feedback to Managers, Volume II
____ Business and Industry Testing: Current Practices and TestReviews
____ Mental Measurements Yearbook
____ Tests: A Comprehensive Reference for Assessment inPsychology, Education and Business
____ Psychware Sourcebook
____ promotional brochures from instrument publishers
____ other sources
(2) Collect a complete set of materials.
Do you have all of the following for each instrument being reviewed?
____ a copy of the instrument
____ a sample feedback report
____ a technical manual
____ supporting materials (sample development guide, list oftrainer materials, etc.)
____ purchasing information (price, scoring, certification, etc.)

40 Choosing 360
(3) Compare your intended use to instrument characteristics. What arethe special needs, job demands, etc., of your target managers?
List below any competencies important to your organization or in theprogram in which the instrument will be used.
Has the instrument been normed on a sample similar to your targetmanagers, in terms of level, gender, ethnicity, etc.?
____ Yes ____ No
(4) Examine the feedback scales.
Are the instrument’s scales a good fit with your organization’s ortraining program’s management or leadership model?
____ Yes ____ No ____ Maybe
Are the instrument’s scales a good fit with your target audience (leveland role of employees/managers who will get feedback)?
____ Yes ____ No ____ Maybe
CHECKPOINT: ELIMINATE NOW THOSE INSTRUMENTS NOT MEET-ING YOUR NEEDS IN TERMS OF TARGET AUDIENCE OR DOMAINS(FEEDBACK SCALES).
(5) Familiarize yourself with instrument-development process.

41
(6) Learn how items and feedback scales were developed.
What is the source of the instrument’s items? (more than one mayapply)
____ theory
____ research
____ experience
What is the nature of item content? (more than one may apply)
____ behavioral
____ skill-based
____ trait or characteristic-based
What types of statistical methods were used for scale development?
____ factor analysis
____ cluster analysis
____ item-scale correlations
(7) Find out how consistent scores tend to be.
Internal consistency
____ scales have coefficients between .6 and .8
Interrater agreement
____ scales have coefficients between .4 and .7
Test-retest
____ scales have coefficients greater than .4
Instrument Evaluation Checklist

42 Choosing 360
(8) Assess basic aspects of validity—does the instrument measure whatit claims to measure? (Look in technical manual.)
Found at least one study showing instrument measures what it says itmeasures (for example, comparing scores on this instrument to hypoth-eses about scores or to scores on another instrument)?
____ Yes ____ No
Found at least one study showing scores on the instrument are related toa measure of effectiveness?
____ Yes ____ No
The sample used in research studies reflects characteristics of yourtarget audience?
____ Yes ____ No
If instrument will be used internationally:
Has it been translated and back-translated?
____ Yes ____ No
____ Instrument itself
____ Feedback report
____ Development materials
Are international norms available?
____ Yes ____ No
Have reliability and validity been studied internationally?
____ Yes ____ No
CHECKPOINT: ELIMINATE NOW THOSE INSTRUMENTS HAVINGLITTLE EVIDENCE OF RELIABILITY OR VALIDITY.
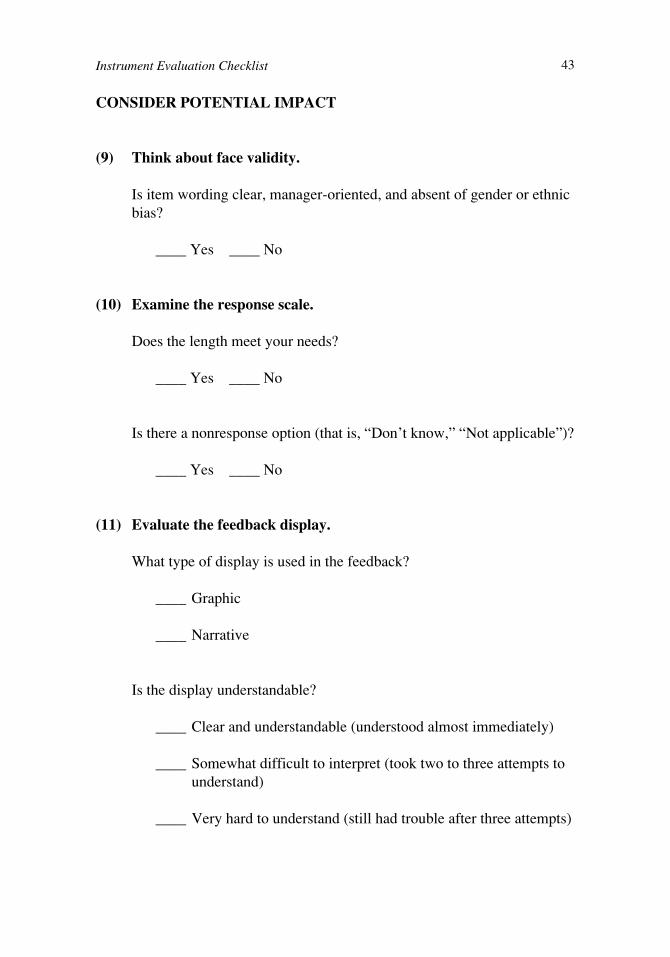
43
CONSIDER POTENTIAL IMPACT
(9) Think about face validity.
Is item wording clear, manager-oriented, and absent of gender or ethnicbias?
____ Yes ____ No
(10) Examine the response scale.
Does the length meet your needs?
____ Yes ____ No
Is there a nonresponse option (that is, “Don’t know,” “Not applicable”)?
____ Yes ____ No
(11) Evaluate the feedback display.
What type of display is used in the feedback?
____ Graphic
____ Narrative
Is the display understandable?
____ Clear and understandable (understood almost immediately)
____ Somewhat difficult to interpret (took two to three attempts tounderstand)
____ Very hard to understand (still had trouble after three attempts)
Instrument Evaluation Checklist

44 Choosing 360
(12) Understand how breakout of rater responses is handled. (More thanone category may apply.)
____ Feedback from boss shown separately
____ Feedback from peers shown separately
____ Feedback from direct reports shown separately
____ No breakout of rater data (all of the above categories combined)
(13) Learn what strategies are used to facilitate interpretation of scores.
____ Comparison to norms
____ Highlighting largest self-rater discrepancies
____ Item-level feedback
____ Highlighting high/low scores
____ Comparison to ideal
____ Importance to job or success
____ “Do more/Do less” feedback
CHECKPOINT: AT THIS TIME, ELIMINATE THOSE INSTRUMENTSWITH ITEMS THAT DO NOT MAKE SENSE OR ARE INAPPROPRI-ATE, HAVE RESPONSE SCALES THAT DO NOT MEET YOUR NEEDS(IN TERMS OF LENGTH OR NONRESPONSE OPTIONS), OR HAVESTRATEGIES FOR INTERPRETING SCORES THAT ARE DIFFICULTTO USE OR UNDERSTAND.

45
(14) Look for development and support materials.
Is there support for the manager’s development?
____ Development guide
____ Goal-planning worksheets
____ Workshop available
____ Vendor hotline
Is there trainer support?
____ Trainer’s manual
____ Workshop available
____ Overheads
____ Video
____ Supplemental norms available
Is certification required?
____ Yes ____ No
How is scoring done?
____ Manually scored
____ Computer-scored
____ Vendor-scored
____ Computer software
Instrument Evaluation Checklist

46 Choosing 360
OTHER CONSIDERATIONS
(15) Compare cost—value for the price.
Does the price of the instrument compare favorably to others and is itwithin the range you can afford?
____ Yes ____ No
(16) Consider length a minor issue.
Is the instrument either excessively long or too brief to be useful andacceptable for your managers?
____ Yes ____ No
Ordering InformationTo get more information, to order additional CCL Press publica-
tions, or to find out about bulk-order discounts, please contact us
by phone at 336-545-2810 or visit our online bookstore at
www.ccl.org/publications.

CHOOSING 360A GUIDE TO EVALUATING MULTI-RATER FEEDBACK
INSTRUMENTS FOR MANAGEMENT DEVELOPMENT
Feedback is a rare commodity in organizational life, but it is key to managerial effec-tiveness. One increasingly popular vehicle for getting feedback from one’s boss, peers, andsubordinates is the multiple-perspective, or 360-degree, feedback instrument. Use of such aninstrument can enhance self-confidence by highlighting individual strengths and canfacilitate greater self-awareness by pointing out areas in need of further development.
Because of the availability of so many feedback instruments, finding the best instru-ments for an organization’s needs is difficult. This book, which updates Feedback toManagers, Volume I: A Guide to Evaluating Multi-rater Feedback Instruments (1991, CCL),presents a step-by-step process that shows how to evaluate multiple-feedback instrumentsintended for management development. The steps take you through such issues as instru-ment development, validity and reliability, feedback display, scoring strategies, and cost.
About the AuthorsEllen Van Velsor is a research scientist at CCL in Greensboro, NC. In addition to
numerous articles published in the areas of personality assessment and transfer of training,Van Velsor has published extensively about women’s career development. She is coauthorof Breaking the Glass Ceiling: Can Women Reach the Top of America’s Largest Corpora-tions? (Updated ed., 1992, Addison-Wesley) and Feedback to Managers, Volume II:A Review and Comparison of Sixteen Multi-rater Feedback Instruments (1991, CCL). VanVelsor has a Ph.D. in sociology from the University of Florida.
Jean Brittain Leslie is a research associate at CCL. She is coauthor of Feedback toManagers, Volume II: A Review and Comparison of Sixteen Multi-rater Feedback Instru-ments (1991, CCL), A Look at Derailment Today: North America and Europe (1996, CCL),and several articles published in management and sociology-related journals. Leslie has anM.A. in sociology from the University of North Carolina at Greensboro.
John W. Fleenor is a research scientist at CCL. He is coauthor of LeaderQuest (1996,CCL), a 360-degree-feedback instrument for managers. Fleenor has published in journalssuch as Leadership Quarterly, Educational and Psychological Measurement, and Journal ofBusiness and Psychology, in addition to reviewing instruments for the Mental MeasurementsYearbook. He has a Ph.D. in industrial and organizational psychology from North CarolinaState University, where he is an adjunct member of the psychology faculty.


