Choosing Appropriated Significance Test - … · Choosing Appropriated Significance Test Lulu Eva...
65
Choosing Appropriated Significance Test Lulu Eva Rakhmilla, dr., M.KM Epidemiology and Biostatistics Department 2013
Transcript of Choosing Appropriated Significance Test - … · Choosing Appropriated Significance Test Lulu Eva...
Choosing Appropriated Significance Test
Lulu Eva Rakhmilla, dr., M.KMEpidemiology and Biostatistics
Department2013

Research Method
Statistical MethodRESEARCH DESIGN
RESEARCH QUESTION
HYPOTHESIS
Causal inference
Error
Sampling and sample size
Statistical test
variable
Conclusion

Learning Check1. Is the following set of hypotheses appropriate for a directional or
a nondirectional hypothesis test?H0: μ = 35H1: μ ≠ 35
2. A researcher conducts a one–independent sample z test. The zstatistic for the upper-tail critical test at a .05 level of significancewas Zobt = 1.84. What is the decision for this test?
3. A researcher conducts a hypothesis test and finds that theprobability of selecting the sample mean is p = .0689 if the valuestated in the null hypothesis is true. What is the decision for ahypothesis test at a .05 level of significance?
4. Which type of test, one-tailed or two-tailed, is associated withgreater power to detect an effect when the null hypothesis isfalse?
Introduction
Choosing Your Test• Choosing an appropriate type of significance
test is a very important consideration inanalyzing data. If an inappropriate test is used,the analysis will not only be meaningless, butalso misleading.
• The purpose is to test our study hypothesis

Statistical inference(Role of chance)
Reason and intuition Empirical observation
Scientific knowledge
Formulate hypotheses
Collect data to test hypothesis

Statistical inference(Role of chance)
Random error (chance) can be controlled by statistical significanceor by confidence interval
Formulate hypotheses
Collect data to test hypotheses
Accept hypothesis Reject hypothesis
C H A N C E
Systematic error

Testing of hypotheses(Significance test)
Female, 30 years old, P2A0, married, with chief complaint of postcoitalbleeding
Female, 28 years old, P0A1, single, with chief complaint of vaginal discharge
lifetime sexual partner = 1age at first sexual intercourse = 22smoking (+)family history of cervical cancer (+)
lifetime sexual partner = 3age at first sexual intercourse = 16not smokingfamily history of cervical cancer (-)
• Which of those two patients is more likely to havecervical cancer?
• Is it possible that the “true” association between lifetime sexual partner with cervical cancer didn’tbecause of sampling error?

What is the main study hypothesis?
Research Questions:• What are the prevalence of depression among
housewives in Kecamatan Jatinangor?• Is the prevalence of depression among
housewives in Kecamatan Jatinangor less than 10 %?
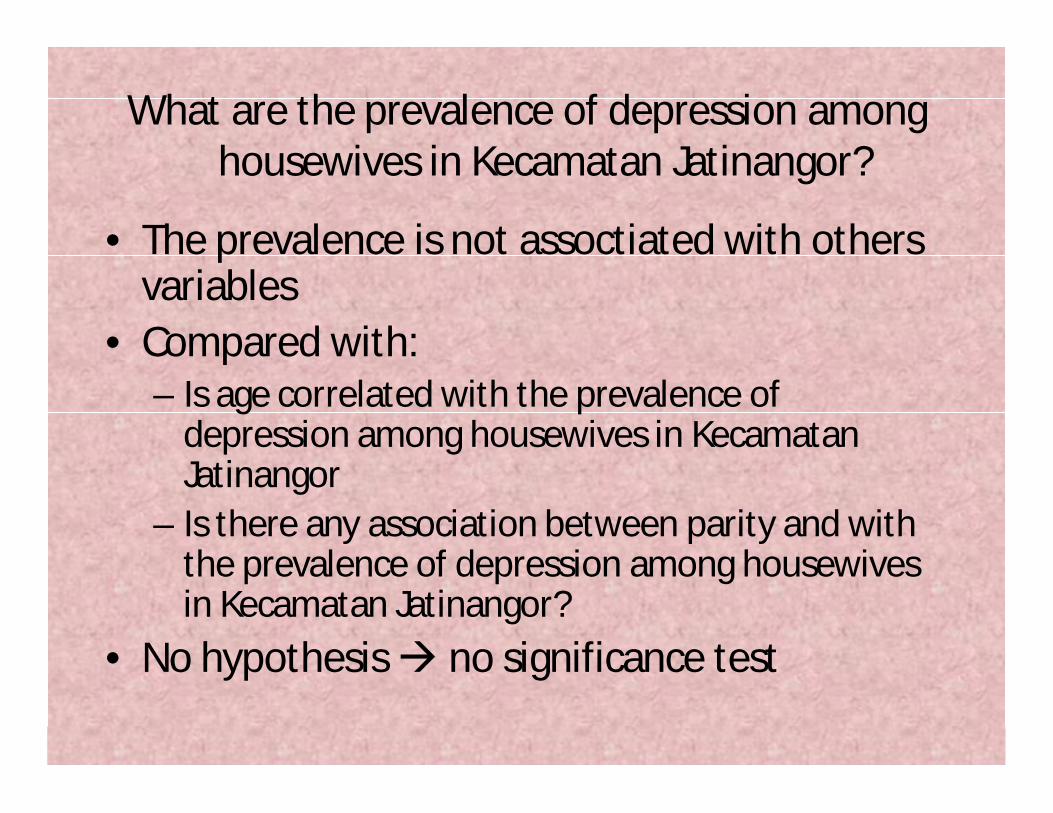
What are the prevalence of depression among housewives in Kecamatan Jatinangor?
• The prevalence is not assoctiated with others variables
• Compared with:– Is age correlated with the prevalence of
depression among housewives in Kecamatan Jatinangor
– Is there any association between parity and with the prevalence of depression among housewives in Kecamatan Jatinangor?
• No hypothesis no significance test

Is the prevalence of depression among housewives in Kecamatan Jatinangor less than 10 %?
• A priopri judgment• Confirmatory or exploratory• Contain statement about : corelate with,
greater than, less tahn, causes, lead to, compared with, more likely than, associated with, related to, similar to.
• Have hypothesis need statistical test

What kind of research problems you have?
•Categorical variable•Numerical variable
Descriptive Statistics
•Bivariate•Multivariable
Analytical Statistics

• Categorical variable only put data presentation about frequency or percentage
table

graph
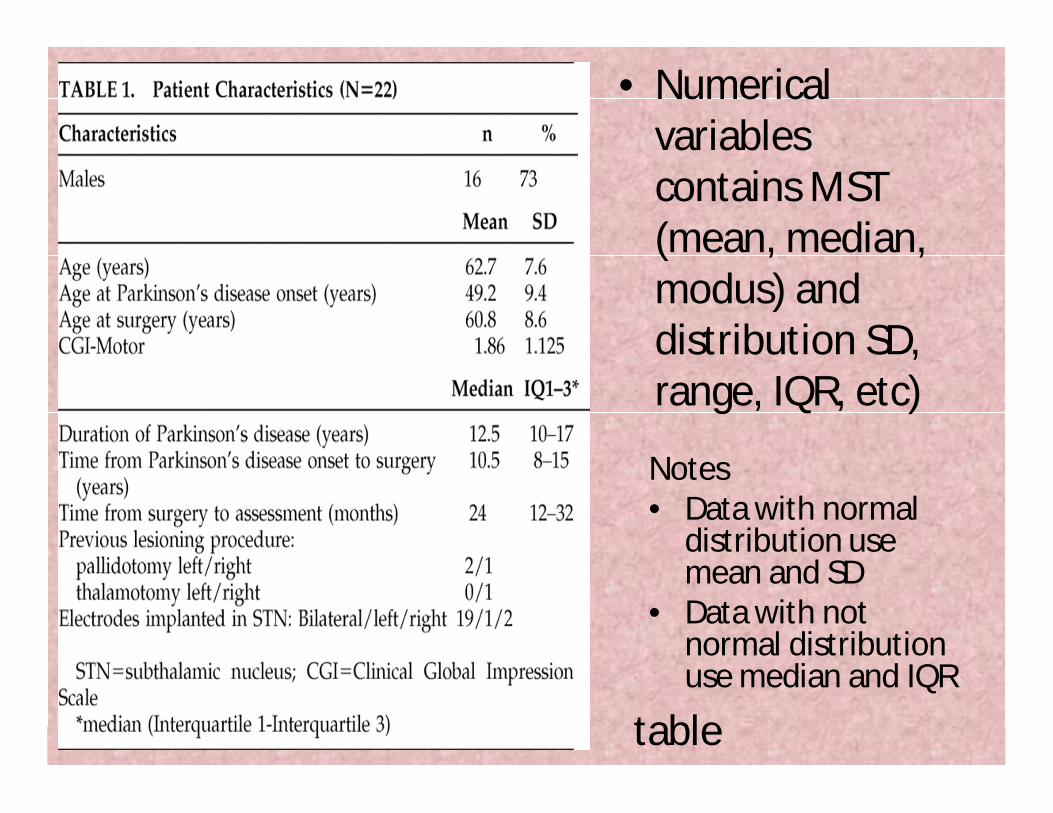
• Numerical variables contains MST (mean, median, modus) and distribution SD, range, IQR, etc)
Notes• Data with normal
distribution use mean and SD
• Data with not normal distribution use median and IQR
table

graph

Descriptive Statistics
Scale of measurement Data distributionMeasure of
central tendency
Measure of variability/dispe
rsion
Numerical
Normally distributed MeanStandard deviation
Not normally distributedMedian
RangeInterquartile
range
Categorical
Ordinal
Distribution freeNominal Mode, counts or proportion
Statistical Significance
• Statistical methods used to test the nullhypothesis are commonly called tests ofstatistical significance.
• This ideology misinforms statisticalresearchers and the general public intobelieving "that the research results areimportant for this reason". (correlationbetween the two variables was significant atthe .05 level)

• In reality statistical researchers and personsinterested in research might be persuadedinto surmising that the results of research isfocal because it is "statistically significant“ oropposite: "that a research result is notimportant because it is not statisticallysignificant”
• Use of Confident Interval are moreinformative than p value
Statistical Significance

Steps in the Test of Significance1. State the null hypothesis.2. State the alternative hypothesis.3. Set the level of significance associated with the null
hypothesis (Type I Error).4. Select the appropriate test statistic.5. Compute the test statistic value.6. Determine the critical value needed for rejection of
the null hypothesis for the particular statistic.7. Compare the obtained value to the critical value.8. Make a decision: Accept or reject the null
hypothesis.

All These Tests!How do I know which one?
• The type of statistical test you use depends on several factors:– Number of independent and
dependent variables– Number of groups of the
independent variable(s)– Independent vs. dependent
samples (between vs. within groups design)
– Scale of measurement of the dependent variable
Keep in the track!
• In order to determine which type of statisticaltest is most appropriate for your analysis,consider the following three questions:
1. What type of data are you analyzing?2. How many variables are being measured?3. How many groups are involved?

Type of Data
Is your data categorical or quantitative?• Sometimes the answer to that question is as
easy as asking if the data consists of words(categorical) or numbers (quantitative), butthe distinction isn’t always so clear.
• Based on the research questions

ExamplesA medical school student’s grade level could bethought of as categorical (freshmen year, 2nd year,junior, senior), or it could be considered quantitative(81,82, 83, 84, 85, 86, 87, 88). The distinction dependson how you, the researcher, will use the data.If you are interested in the proportion of the samplefalling into each category, treat the data as categorical.If, on the other hand, you are interested in calculatingthe average grade level of the students in your sampleor you want to know how grade level is related to GPA,treat the data as quantitative.

Determining the type of data

Number of Variabel
How many variables are being measured?• You may have collected data comprised of
dozens of variables, but when conducting asignificance test, you will not necessarily useall variables in a single test.
• Focus on the specific question the significancetest is answering.

For example• If you conducted a survey in which you asked each
subject their gender, ethnicity, religious affiliation,political preference, age, height, grade level, GPA, SATscores, favorite movie genre, and number of cell phoneminutes used last month, you have collected datacomprised of eleven variables.
• Before conducting a significance test, you need to:1. Focus on a specific question2. Determine how many variables are needed to answer
that question.• As is often the case in statistics, the answer is not
always clear cut.

Determining the number of variables
Examples
1. Is there any relationship between age, gender, SES, and smoking with lung cancer?
2. Is there any association between scores of CRP, BHP, PHOP with GPA score?
3. Is there any correlation between intake of protein, CH, and lipid with physical fitness?
4. Is there any differences between Hb, trombosit, and hematocrit among DSS patients?
Number of Groups
• Another important consideration when deciding whichtype of significance test is most appropriate is thenumber of groups involved.
• Is the analysis being done on a single group of subjects,or are two or more groups being compared?
• Comparative studies, those that show how one groupdiffers from another, are often more relevant thansingle‐sample studies.
• Correlative studies, those that show how one groupdiffers from another, are often common single‐samplestudies with continuous data.

For example
If you want to conduct a study comparingteenage pregnancy rates among differentsocio‐economic groups.
or
Sample from several students from each socio‐economic group separately
Take one large sample and then separate those subjects into different socio‐economic groups.

Five types of statistical analysis
Descriptive
Inferential
Differences
Associative
Predictive
What are the characteristics of the respondents?
What are the characteristics of the population?
Are two or more groups the same or different?
Are two or more variables related in a systematic way?
Can we predict one variable if we know one or more other variables?

State Your Decision
• Define variable of the study (independent vs dependent, or predictor vs outcome)
• Scale of measurement (categoric vs numeric)• Pair and number of group• Type of hypotesis (comparation vs correlation)• Data distribution (normal vs not normal or
parametric vs non parametric)
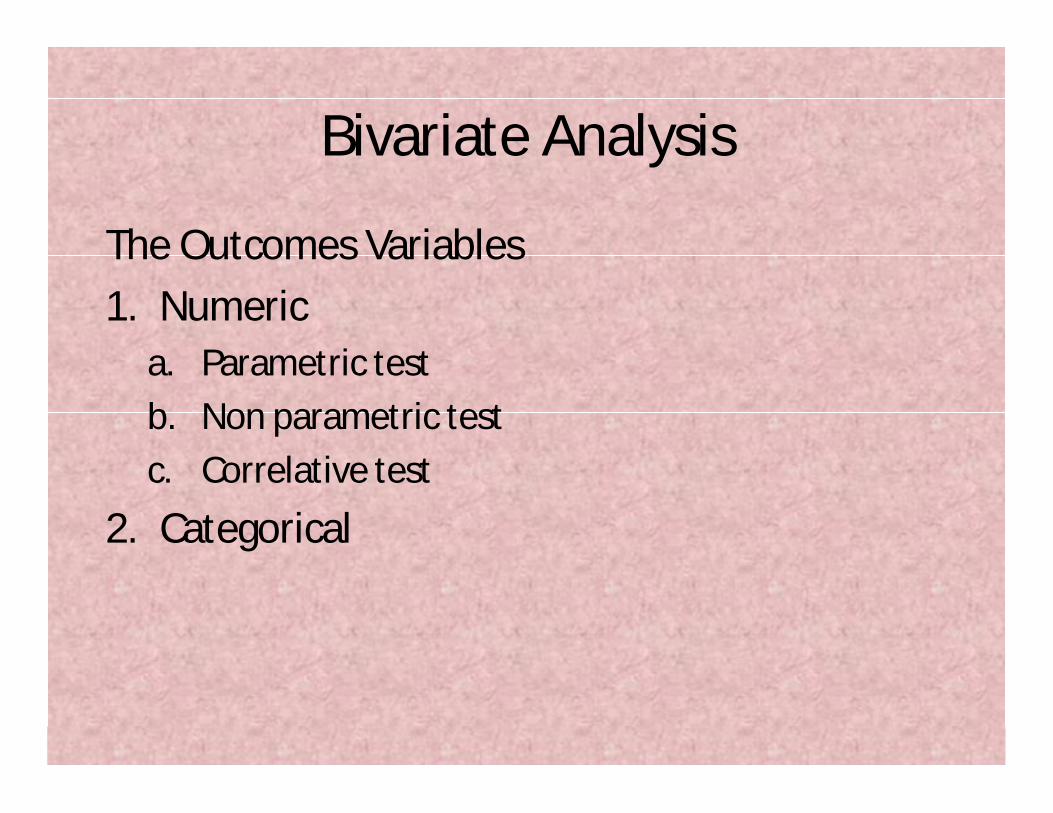
Bivariate Analysis
The Outcomes Variables1. Numeric
a. Parametric testb. Non parametric testc. Correlative test
2. Categorical
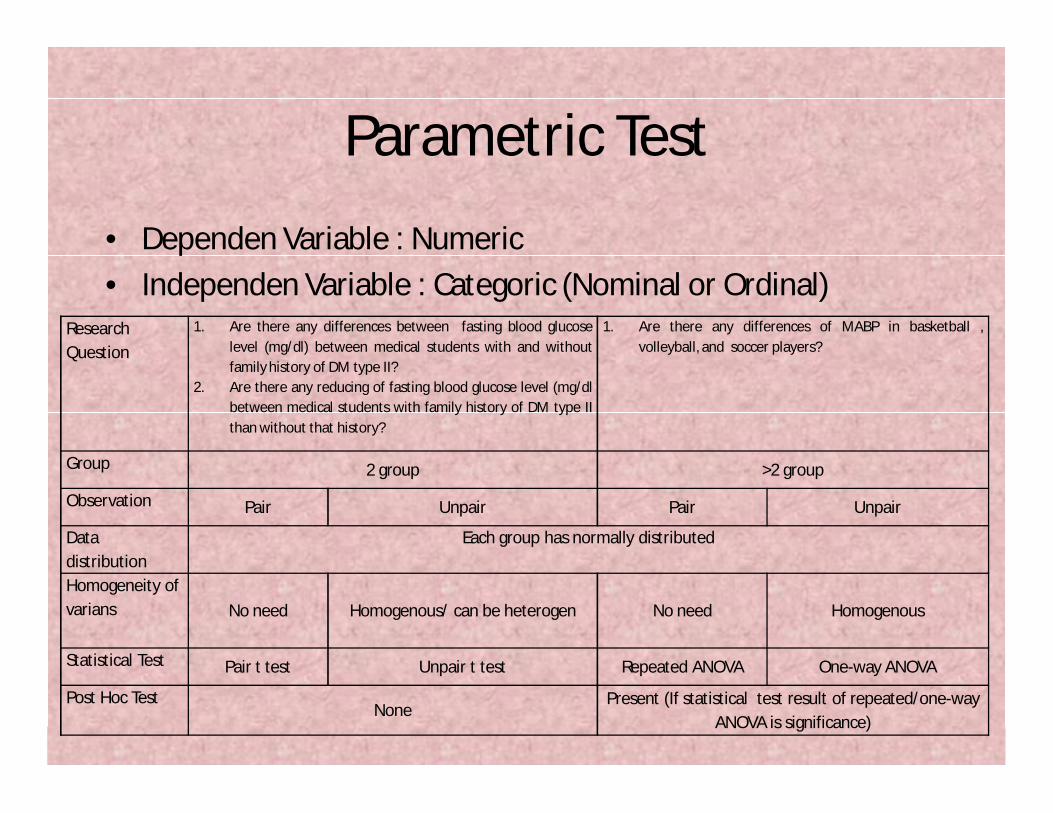
Parametric Test
• Dependen Variable : Numeric• Independen Variable : Categoric (Nominal or Ordinal)
Research Question
1. Are there any differences between fasting blood glucoselevel (mg/dl) between medical students with and withoutfamily history of DM type II?
2. Are there any reducing of fasting blood glucose level (mg/dlbetween medical students with family history of DM type IIthan without that history?
1. Are there any differences of MABP in basketball ,volleyball, and soccer players?
Group 2 group >2 group
Observation Pair Unpair Pair Unpair
Data distribution
Each group has normally distributed
Homogeneity of varians No need Homogenous/ can be heterogen No need Homogenous
Statistical Test Pair t test Unpair t test Repeated ANOVA One-way ANOVA
Post Hoc TestNone
Present (If statistical test result of repeated/one-way ANOVA is significance)

Non Parametric Test• Dependen Variable : Ordinal or Numeric ( doesn’t has
normally distributed or homogenity of varians)• Independen Variable : Categoric (Nominal or Ordinal)
ResearchQuestion
1. Are there any differences between fasting blood glucose level (mg/dl) between medical students with and without family history of DM type II?
2. Are there any reducing of fasting blood glucose level (mg/dl between medical students with family history of DM type II than without that history?
1. Are there any differences of MABP in basketball , volleyball, and soccer players?
Group2 group >2 group
ObservationPair Unpair Pair Unpair
Test StatisticsWilcoxon Test Mann-Whitney Test Friedman Kruskal-Wallis
Post Hoc Test
None
Present (if statistical test with Friedman or Kruskal-Wallis is significance)
Wilcoxon Test Mann-Whitney Test
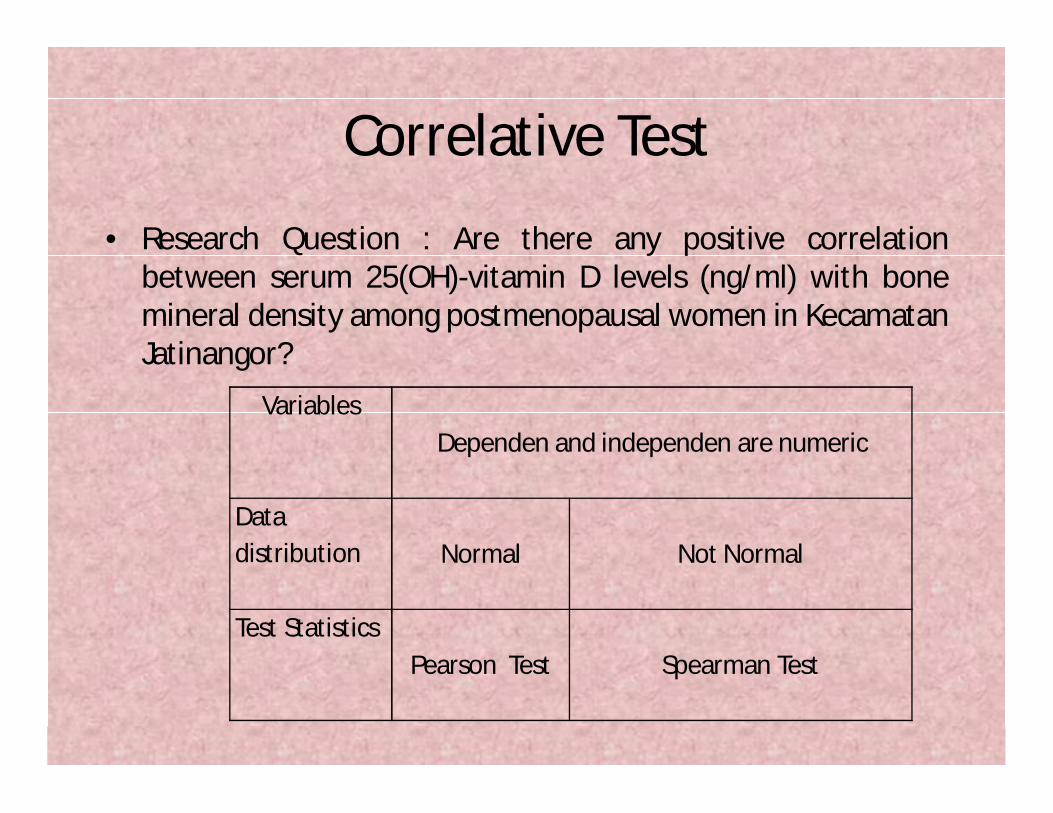
Correlative Test
• Research Question : Are there any positive correlationbetween serum 25(OH)-vitamin D levels (ng/ml) with bonemineral density among postmenopausal women in KecamatanJatinangor?
VariablesDependen and independen are numeric
Data distribution Normal Not Normal
Test StatisticsPearson Test Spearman Test

Categorical Data
Research Question
1. Are there any association between knowledge of intakeCalcium with attitude among breast feeding mothers inKecamatan Jatinangor?
Observation Unpair PairData distribution
No need
Statistical Test Chi square testFisher
Kolmogorov Smirnov
Mc Nemar, CochranMarginal Homogeneity
Wilcoxon, Friedman
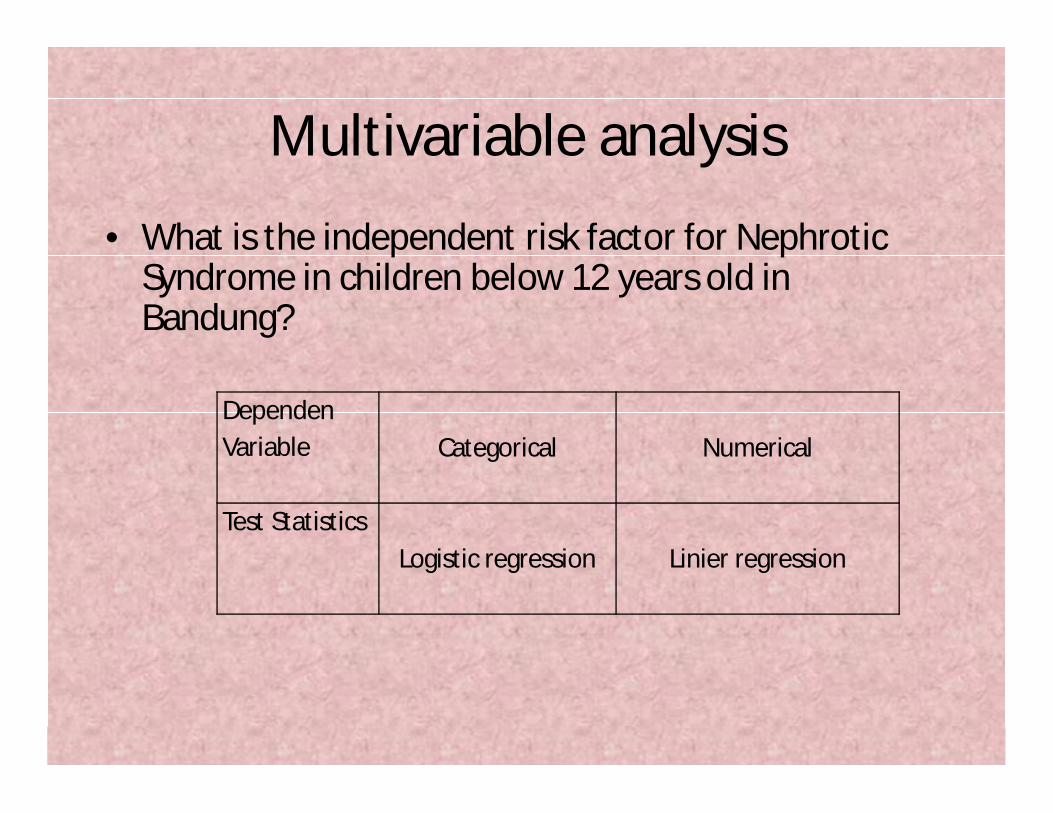
Multivariable analysis
• What is the independent risk factor for Nephrotic Syndrome in children below 12 years old in Bandung?
Dependen Variable Categorical Numerical
Test StatisticsLogistic regression Linier regression

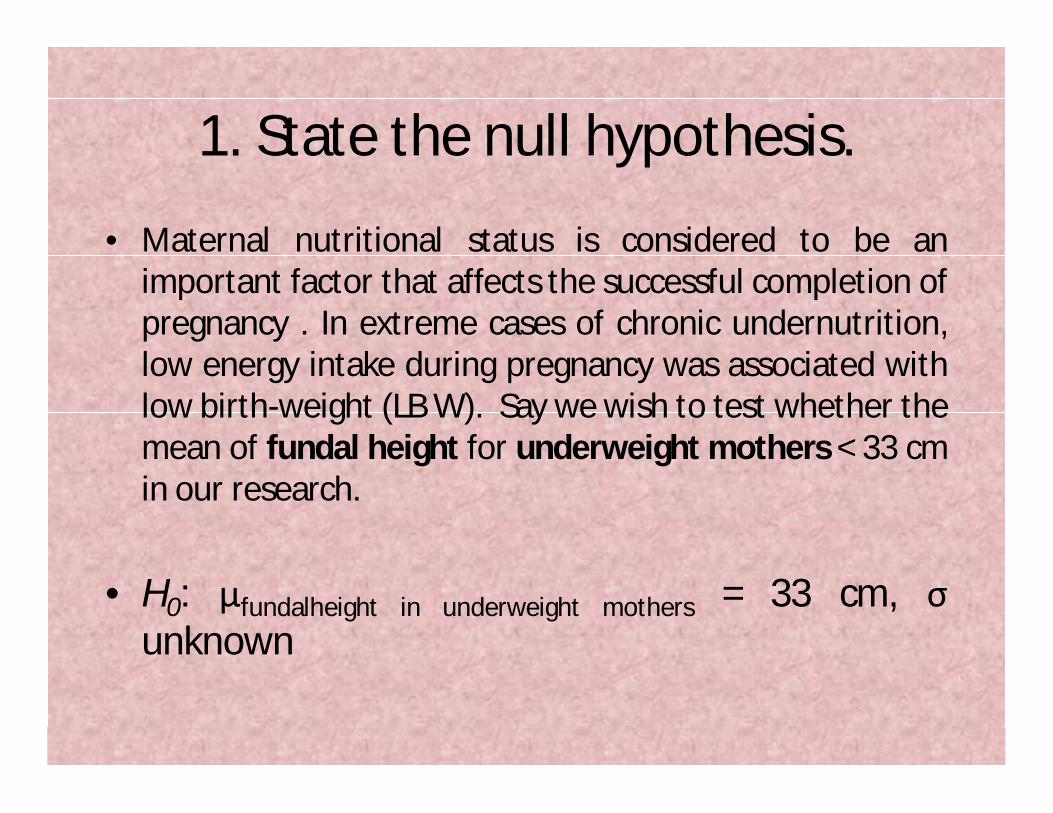
1. State the null hypothesis.
• Maternal nutritional status is considered to be animportant factor that affects the successful completion ofpregnancy . In extreme cases of chronic undernutrition,low energy intake during pregnancy was associated withlow birth-weight (LB W). Say we wish to test whether themean of fundal height for underweight mothers < 33 cmin our research.
• H0: μfundalheight in underweight mothers = 33 cm, σunknown

2. State the alternative hypothesis.
• H1: μfundalheight in underweight mothers < 33 cm, σ unknown
3. Set the level of significance (α)• For α = .05 (our decision)• Alpha is probability of committing a Type I error that
we will allow and still decide to reject the null hypothesis.
• Set stating a level of significance for controlling type I error

Four outcomes for making a decision

4. Select the appropriate test statistic.
5. Compute the test statistic value.
• One-Samples t test
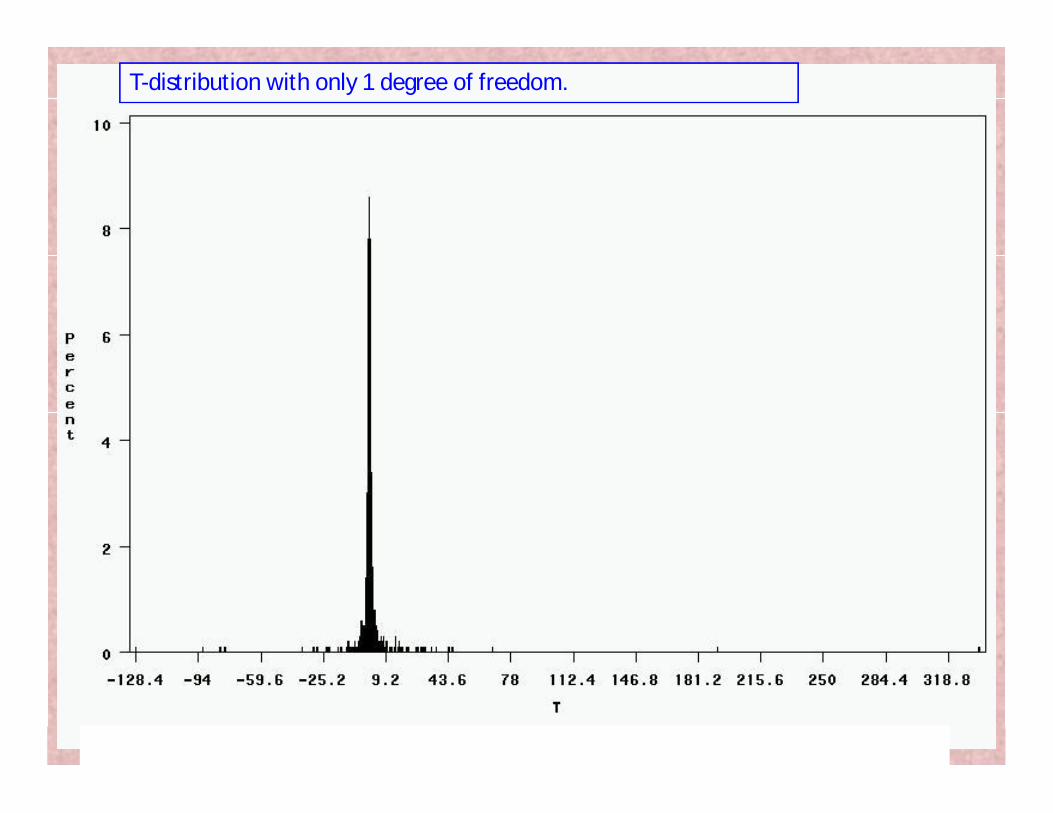
T-distribution with only 1 degree of freedom.

T-distribution with 4 degrees of freedom.
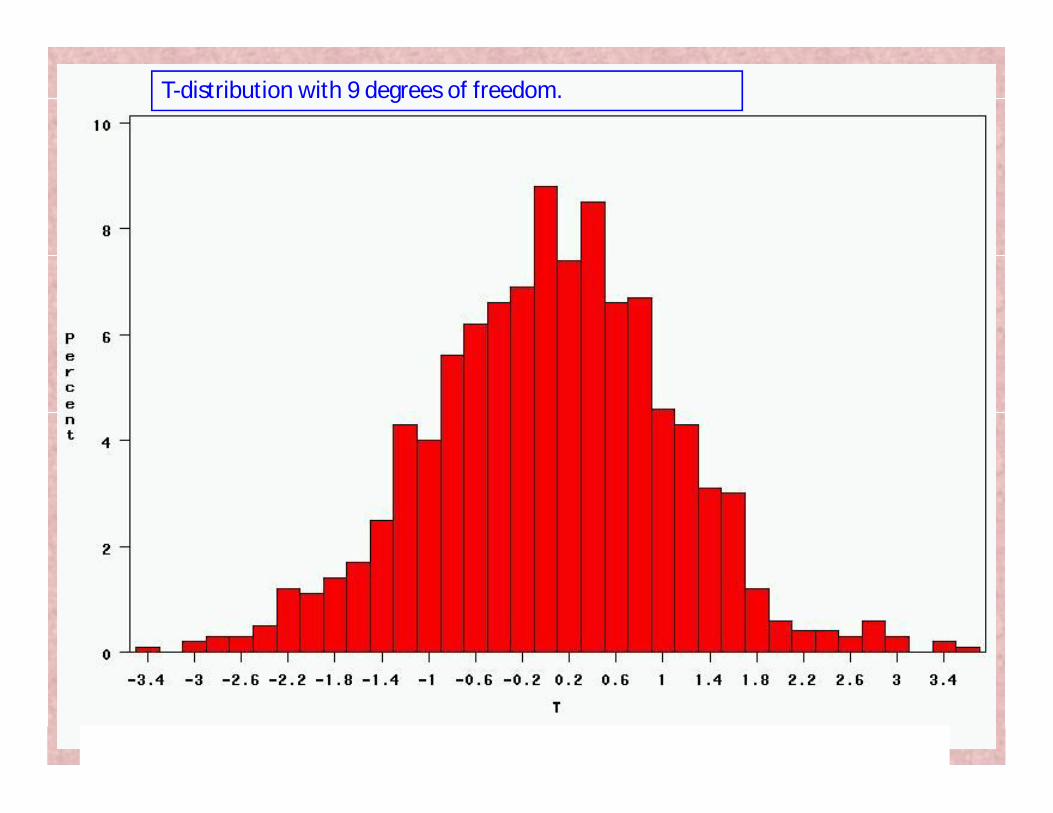
T-distribution with 9 degrees of freedom.
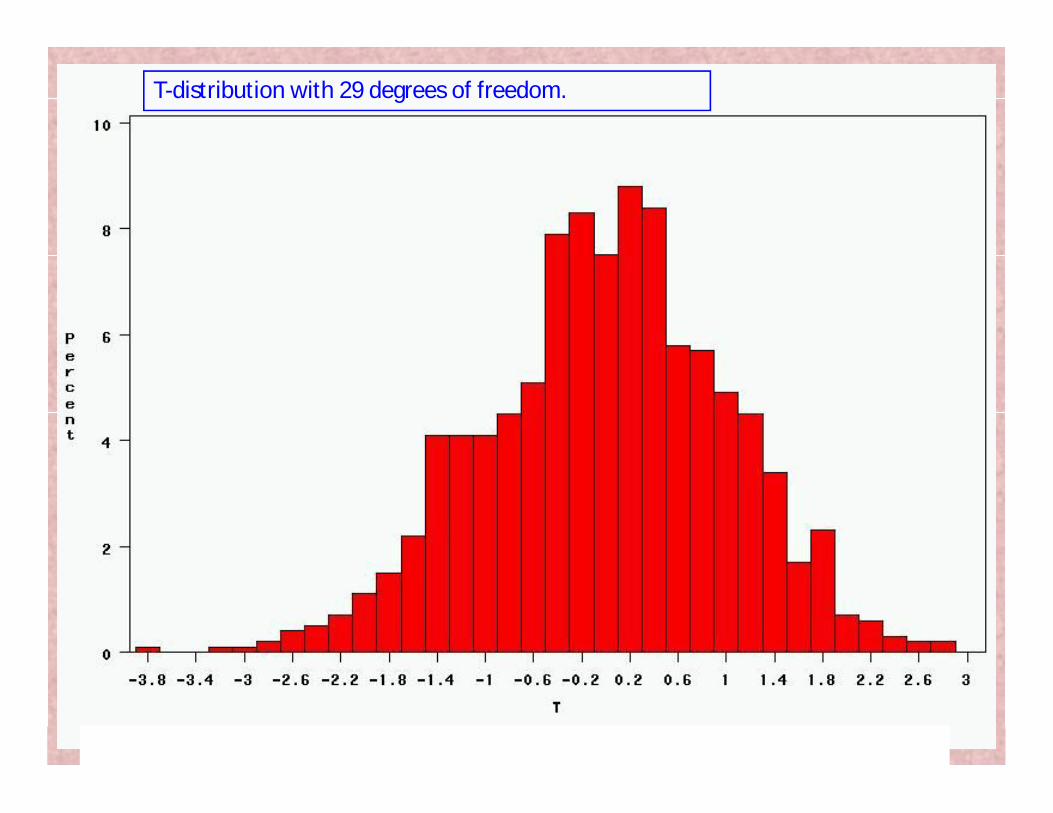
T-distribution with 29 degrees of freedom.
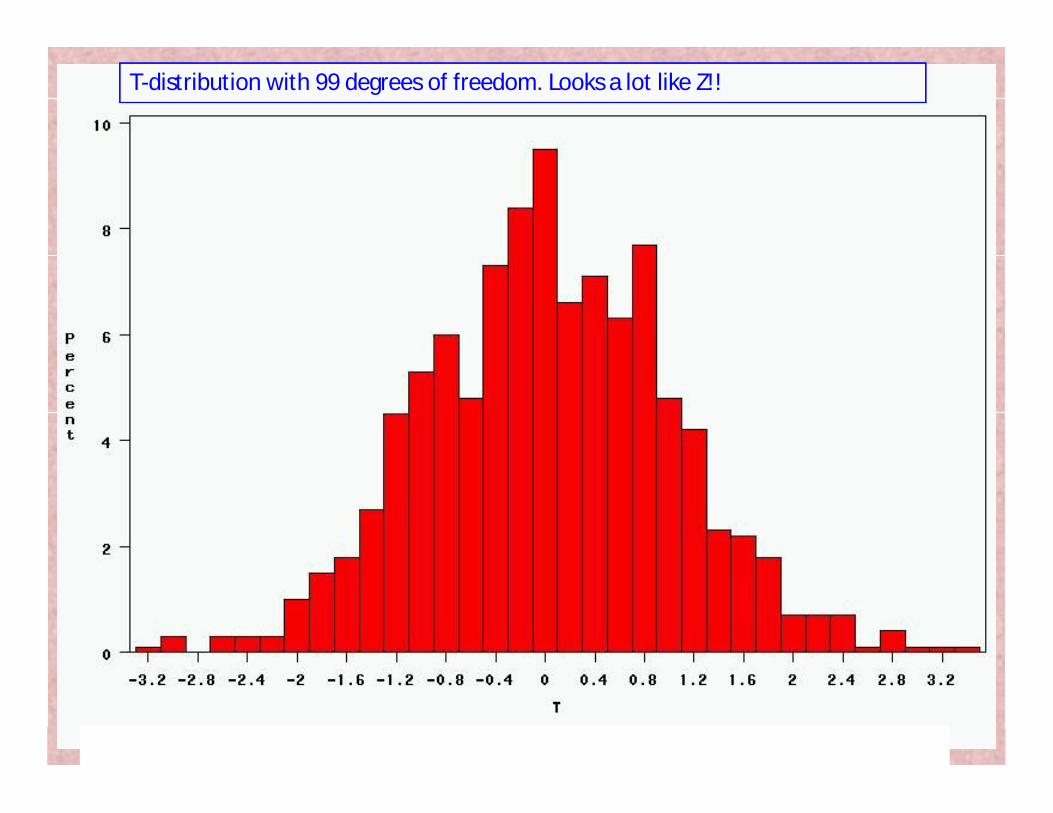
T-distribution with 99 degrees of freedom. Looks a lot like Z!!

Student’s t Distribution
t0
t (df = 5)
t (df = 13)t-distributions are bell-shaped and symmetric, but have ‘fatter’ tails than the normal
Standard Normal
(t with df = )
Note: t Z as n increases
from “Statistics for Managers” Using Microsoft® Excel 4th Edition, Prentice-Hall 2004

6. Determine the critical value needed for rejection of the null hypothesis for
the particular statistic..
• If t < tn – 1,α, then H0 is rejected. If t tn – 1,α, then H0 is not rejected
• The p-value is given by: p = Pr(tn – 1 t)
Two Decision Rules lead to the same decision.1. If the test statistic lies in the rejection region,
reject Ho. (critical value method)2. If the p‐value < α, reject Ho. (p‐value method)
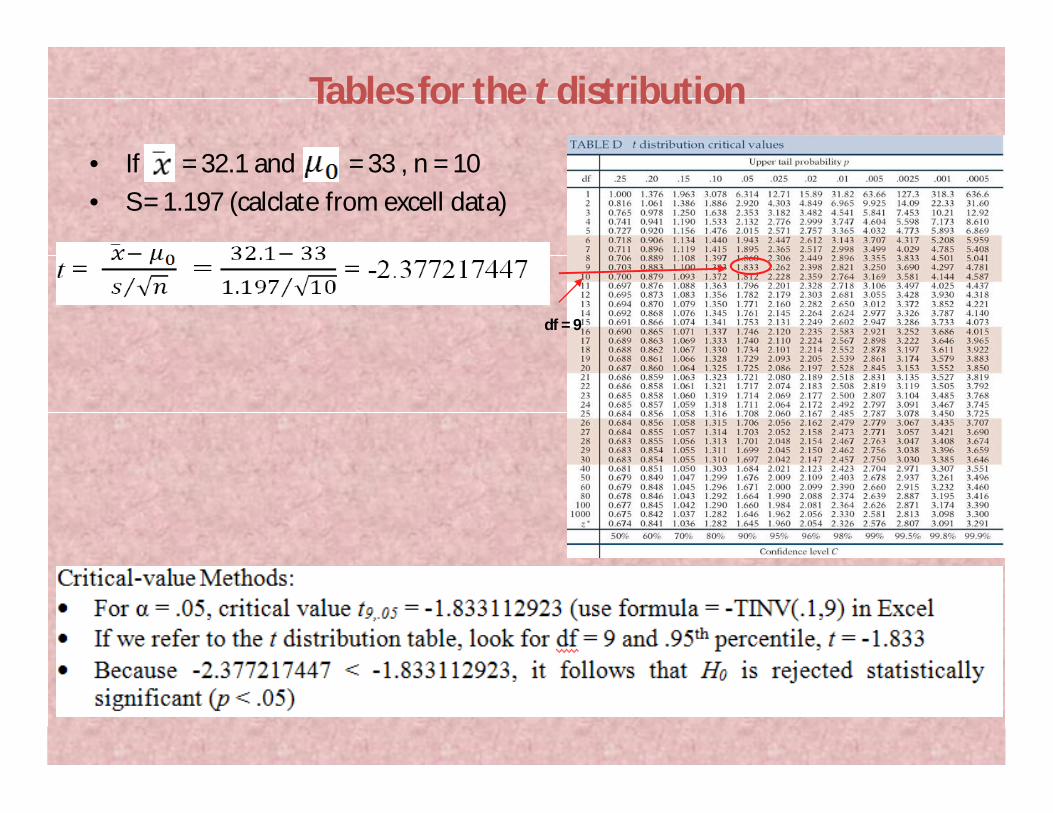
Tables for the t distribution
• If = 32.1 and = 33 , n = 10• S = 1.197 (calclate from excell data)
df = 9

7. Compare the obtained value to the critical value.

8. Make a decision: Accept or reject the null hypothesis.

The Power of a Test• Power of a Test: the probability that one will
reject H0 when it is a false statement. The power of a statistical analysis is represented as 1 – β.– Reminder: β = the probability of making a Type II Error
• It is influenced by:– μX - μ0
– n– σ– α

Effect Size Statistics
• Due to the role of N (sample size) in the formulae for parametric statistics, a large sample size can make a negligible difference between groups appear significant.
• Because of this, current APA guidelines recommend computing effect size statistics in addition to parametric comparisons.

Uses of the Effect Size Statistic• The effect size statistic can be used to:
– Estimate the true effect of the IV– Compare the results of one
research project to the results of other projects
– Estimate the power of the statistic
– Estimate the number of subjects one needs in a research project to maximize the chance of rejecting a false hypothesis (power)

Is the Test Valid?
Valid or Not Valid?
Once you have determined which type of test isappropriate for your analysis, it is necessary to determine• The test will yield valid results for your particular set of
data.• Each of the following significance tests involves
calculations that are based on certain assumptions andconditions.
• If the necessary assumptions and conditions are notmet, then the results of the test will not be valid, andthe test should not be used. This can often beovercome, however, by increasing your sample size.

Statitisticlly vs Clinically• Two drugs (A and B) are compared to treat acute MI
patients, and the response is a 1-year mortality.• First Research : A study has been set-up with twice
400 patients. The results were 2% mortality for A and 10% for B, yielding a highly significant result with a chi-square test (p < 0.01).
• Second Research, the same settings, twice 100,000 patients had been treated and the results were: A:0.002% and B: 0.0010%. Again, a highly significant p-value would have been obtained with the chi-square test, but the net clinical benefit of A versus B is now 100 times lower than in the previous study.

Fact
• In first study can show that for each (small) Δ (≠0), there is a sample size such that Ho is rejected with high probability.
• A statistically significant result is not necessarily clinically relevant

Douglas Altman Definition of 95% Confidence Intervals
• "A strictly correct definition of a 95% CI is, somewhat opaquely, that 95% of such intervals will contain the true population value.
• “Little is lost by the less pure interpretation of the CI as the range of values within which we can be 95% sure that the population value lies.”

Confidence Interval
• Confidence intervals provide differentinformation from that arising from hypothesistests.
• A range of values for a variable of constructedso that this range has a specified probability ofincluding the true value of the variable inpopulation
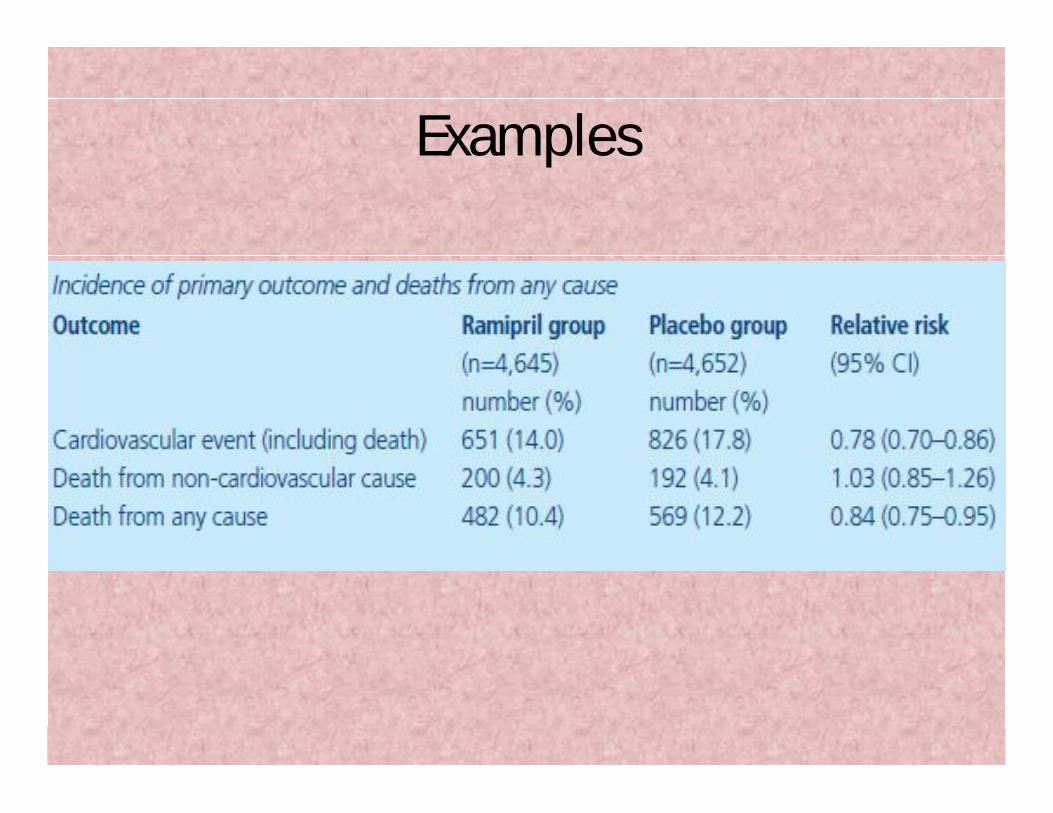
Examples
Learning CheckChoosing the correct test of significance!1. Do babies who have an infection have a longer stay
in hospital? Mann Whitney2. Do males have a larger head circumference than
females among CP babies in RSHS?3. Does the head circumference of babies increase
significantly in a 2-month growth period?