Statistical Methods Appropriate for Evaluation of Fuze Explosive ...

Choosing Appropriate
Descriptive Statistics
Graphs and Statistical Tests
Brian Yuen 15 January 2013
Slide - 2
2
Using appropriate statistics and
graphs
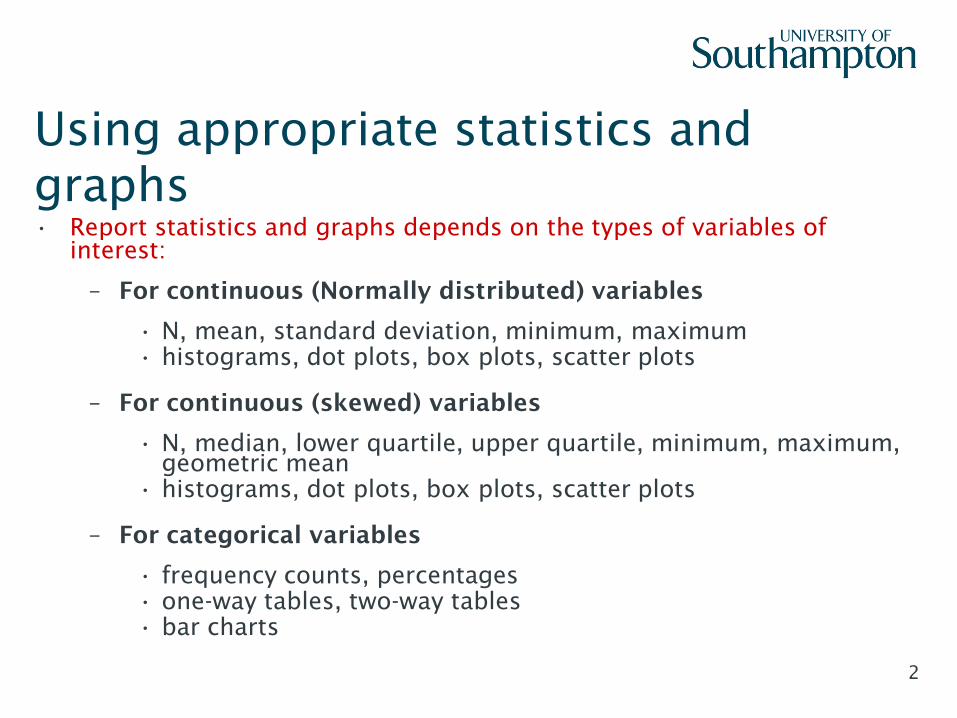
bull Report statistics and graphs depends on the types of variables of
interest
ndash For continuous (Normally distributed) variables
bull N mean standard deviation minimum maximum
bull histograms dot plots box plots scatter plots
ndash For continuous (skewed) variables
bull N median lower quartile upper quartile minimum maximum
geometric mean
bull histograms dot plots box plots scatter plots
ndash For categorical variables
bull frequency counts percentages
bull one-way tables two-way tables
bull bar charts
Bar chart
Clustered bar charts (two categorical variables)
Bar charts with error bars
Histogram (can be plotted against a
categorical variable)
Box amp Whisker plot (can be plotted against
a categorical variable)
Dot plot (can be plotted against a
categorical variable)
Scatter plot (two continuous variables)
Mean
Median
Standard deviation
Range (Min Max)
Inter-quartile range (LQ UQ)
Flow chart of commonly used
descriptive statistics and
graphical illustrations
Frequency
Percentage (Row Column or Total)
Exploring data
Descriptive statistics
Graphical illustrations
Categorical data
Continuous data Measure of location
Continuous data Measure of variation
Categorical data
Continuous data
Slide - 4
Choosing appropriate statistical test
bull Having a well-defined hypothesis helps to distinguish the
outcome variable and the exposure variable
bull Answer the following questions to decide which statistical test is
appropriate to analysis your data
ndash What is the variable type for the outcome variable
bull Continuous (Normal Skew) Binary Time dependent
bull If more than one outcomes are they paired or related
ndash What is the variable type for the main exposure variable
bull Categorical (1 group 2 groups gt2 groups) Continuous
bull For 2 or gt2 groups Independent (Unrelated) Paired
(Related)
ndash Any other covariates confounding factors
4
5
Continuous
Categorical Outcome
variable
Normal Skew
Survival
1 group
2 groups
gt2 groups
Paired
Sign test Signed rank test
Mann-Whitney U test
Wilcoxon signed rank test
Kruskal Wallis test
1 group
2 groups
gt2 groups
Paired
Chi-square test Exact test
Chi-square test Fisherrsquos exact test Logistic regression
McNemarrsquos test Kappa statistic
Chi-square test Fisherrsquos exact test Logistic regression
2 groups
gt2 groups
KM plot with Log-rank test
KM plot with Log-rank test
Continuous
Continuous
Continuous
Spearman Corr Linear Reg
Logistic regression Sensitivity amp specificity ROC
Cox regression
Two-sample t test
Paired t test
One-way ANOVA test
Pearson Corr Linear Reg
One-sample t test
Exposure
variable
Flow chart of
commonly used
statistical tests
Case Studies
Slide - 7
7
bull A simple study investigating
ndash the fitness level of our locally selected group of healthy volunteers
ndash with the published average value on fitness level which was done previously
on the national level
ndash fitness level was measured by the length of time walking on a treadmill
before stopping through tiredness
bull Objective any difference between the group average and the published value
bull Outcome amp type
bull Exposure amp type
bull If the continuous outcome is
ndash Normally distributed
ndash Not Normally distributed
CONTINUOUS amp ORDINAL DATA
Case Study 1
Slide - 8
8
bull A clinical trial investigating
ndash the effect of two physiotherapy treatments (standard and enhanced
exercise) for patients with a broken leg
ndash on their fitness level (length of time walking on a treadmill before stopping
through tiredness)
bull Objective any difference between the 2 group averages
bull Outcome amp type
bull Exposure amp type
bull If the continuous outcome is
ndash Normally distributed
ndash Not Normally distributed
CONTINUOUS amp ORDINAL DATA
Case Study 2
Slide - 9
9
bull Now each patient performs the walking test before and after
enhanced physiotherapy treatment
ndash data might be presented as two variables one as before data and
the other as after data but the values for individual patients are
paired
bull Objective any difference between the before and the after averages
bull Number of outcomes
bull Outcomes amp type
bull If the difference in outcomes (eg after - before) is
ndash Normally distributed
ndash Not Normally distributed
CONTINUOUS amp ORDINAL DATA
Case Study 3
Slide - 10
10
bull Based on Case Study 2 (standard vs enhanced exercises) but now
with a control group
ndash ie patients without a broken leg
bull Objective any difference among the 3 group averages
bull Outcome amp type
bull Exposure amp type
bull If the continuous outcome is
ndash Normally distributed
ndash Not Normally distributed
CONTINUOUS amp ORDINAL DATA
Case Study 4
Slide - 11
11
bull Before the participants started their fitness test their blood pressure (BP) was recorded
by two different machines
ndash machine 1 was the lsquogold standardrsquo
ndash machine 2 was newly made and claimed to be more accurate
ndash aim to validate the measurements recorded from machine 2 by assessing the level of
agreement with that obtained from machine 1
bull Objective any agreement between measuring tools
bull Number of outcomes
bull Outcomes amp type
bull Choice of test
ndash
ndash
bull Note ndash
Note ndash
CONTINUOUS amp ORDINAL DATA
Case Study 6
Slide - 12
12
When the continuous outcome is not
normally distributed
bull If outcome normally distributed use t-tests ANOVA
ndash easy to obtain confidence interval for differences
bull So far wersquove recommended using non-parametric tests when data not normal
ndash often less powerful
ndash non-parametric confidence intervals problematic
bull Recall another possibility ndash take logs (natural log) of the outcome
ndash check to see if outcome looks normal after logging
ndash can then use t-tests ANOVA
ndash estimate of the difference and its confidence interval on log scale easily
available
ndash back transform to get estimate of percent change between groups
ndash back transform confidence interval
ndash better to analyse on log scale if data become normally distributed than to
use non-parametric test
Slide - 13
13
bull Fitness is now assessed only as Unfit Fit
ndash could be as a result of dichotomising the previous continuous outcome (0-5
minutes = Unfit gt5 minutes = Fit)
ndash investigate whether the proportions of Unfit and Fit are equal (ie 50 each)
after the standard treatment
ndash or compare the proportions to specific values (eg 10 Fit 90 Unfit)
bull Objective any difference in proportion within the group
(or any difference from the specific proportions)
bull Outcome amp type
bull Exposure amp type
bull Choice of test
ndash
ndash
BINARY DATA
Case Study 7
Slide - 14
14
BINARY DATA
Case Study 8
bull Similar setting as Case Study 2 but with the binary outcome defined from
Case Study 7 (Unfit Fit)
ndash to find out if the enhanced treatment is better than the standard treatment
ie more patients into the Fit category
bull Objective any difference in proportion between the groups
bull Outcome amp type
bull Exposure amp type
bull Choice of test
ndash
ndash
bull Note ndash
Slide - 15
15
CONTINUOUS amp ORDINAL DATA
Case Study 12
bull Now in the physiotherapy trial we wanted to investigate
ndash if there was any relationship between the participantsrsquo fitness level and their age at
assessment
ndash we suspected that age at assessment affected their fitness level regardless of the
treatment group they were in
ndash quantify the relationship by the direction strength and magnitude
bull Objective assess and quantify the relationship between two variables
bull Outcome amp type
bull Exposure amp type
bull Choice of test
ndash If any of the variables is Normally distributed
ndash If both variables are not Normally distributed
Slide - 16
16
CONTINUOUS amp ORDINAL DATA
Case Study 13
bull We now found in Case Study 12 that age at assignment had some linear
relationship with participantsrsquo fitness level
ndash needed to quantify this relationship ie what is the average fitness level at
different age at assignment
ndash also wanted to predict fitness level for future patients given their age at
assignment
bull Objective set up a statistical model to quantify the effect of exposure variable
on the outcome variable
bull Outcome amp type
bull Exposure amp type
bull Choice of test
ndash
bull Note ndash
Slide - 17
17
References
bull Altman DG Practical Statistics for Medical Research Chapman and Hall 1991
bull Kirkwood BR amp Sterne JAC Essential Medical Statistics 2nd Edition Oxford Blackwell
Science Ltd 2003
bull Bland M An Introduction to Medical Statistics 3rd Edition Oxford Oxford Medical
Publications 2000
bull Altman DG Machin D Bryant TN amp Gardner MJ Statistics with Confidence 2nd Edition
BMJ Books 2000
bull Campbell MJ amp Machin D Medical Statistics A Commonsense Approach 3rd Edition 1999
bull Field A Discovering Statistics Using SPSS for Windows 2nd edition London Sage
Publications 2005
bull Bland JM Altman DG (1986) Statistical methods for assessing agreement between two
methods of clinical measurement Lancet i 307-310
bull Mathews JNS Altman DG Campbell MJ Royston P (1990) Analysis of serial measurements in
medical research British Medical Journal 300 230-235
Slide - 18
18
Other web and software resources
bull UCLA ndash What statistical analysis should I use
ndash httpwwwatsuclaedustatmult_pkgwhatstatdefaulthtm
bull DISCUS
ndash Discovering Important Statistical Concepts Using Spreadsheets
ndash Interactive spreadsheets designed for teaching statistics
ndash Web-sites for download and information -
httpwwwcoventryacukecresearchdiscusdiscus_homehtml
bull Choosing the correct statistical test
ndash httpbamauaedu~jleeper627choosestathtml
bull SPSS for Windows
ndash Help
ndash Statistics Coach
bull Statistics for the Terrified
Solutions to
Case Studies
Slide - 20
20
bull A simple study investigating
ndash the fitness level of our locally selected group of healthy volunteers
ndash with the published average value on fitness level which was done previously
on the national level
ndash fitness level was measured by the length of time walking on a treadmill
before stopping through tiredness
bull Objective any difference between the group average and the published value
bull Outcome amp type fitness level (length of time) ndash continuous
bull Exposure amp type one group only
bull If the continuous outcome is
ndash Normally distributed One-sample t test
ndash Not Normally distributed Sign test Signed rank test
vs
CONTINUOUS amp ORDINAL DATA
Case Study 1
Slide - 21
21
bull A clinical trial investigating
ndash the effect of two physiotherapy treatments (standard and enhanced
exercise) for patients with a broken leg
ndash on their fitness level (length of time walking on a treadmill before stopping
through tiredness)
bull Objective any difference between the 2 group averages
bull Outcome amp type fitness level ndash continuous
bull Exposure amp type treatment group ndash binary independent
(or unrelated)
bull If the continuous outcome is
ndash Normally distributed Two-sample t test
ndash Not Normally distributed Mann-Whitney U test
CONTINUOUS amp ORDINAL DATA
Case Study 2
Slide - 22
22
bull Now each patient performs the walking test before and after
enhanced physiotherapy treatment
ndash data might be presented as two variables one as before data and
the other as after data but the values for individual patients are
paired
bull Objective any difference between the before and the after averages
bull Number of outcomes 2 (before and after)
bull Outcomes amp type fitness level ndash continuous
paired (or related)
bull If the difference in outcomes (eg after - before) is
ndash Normally distributed Paired t test
ndash Not Normally distributed Wilcoxon signed rank test
CONTINUOUS amp ORDINAL DATA
Case Study 3
Slide - 23
23
bull Based on Case Study 2 (standard vs enhanced exercises) but now
with a control group
ndash ie patients without a broken leg
bull Objective any difference among the 3 group averages
bull Outcome amp type fitness level ndash continuous
bull Exposure amp type treatment group ndash categorical (more
than two levels) independent (or unrelated)
bull If the continuous outcome is
ndash Normally distributed One-way ANOVA test
ndash Not Normally distributed Kruskal-Wallis test
CONTINUOUS amp ORDINAL DATA
Case Study 4
Slide - 24
24
bull Before the participants started their fitness test their blood pressure (BP) was recorded
by two different machines
ndash machine 1 was the lsquogold standardrsquo
ndash machine 2 was newly made and claimed to be more accurate
ndash aim to validate the measurements recorded from machine 2 by assessing the level of
agreement with that obtained from machine 1
bull Objective any agreement between measuring tools
bull Number of outcomes 2 (machines)
bull Outcomes amp type blood pressure ndash continuous paired
(or related)
bull Choice of test
ndash Bland-Altman method (amp Paired t-test)
bull Note ndash the Bland-Altman method is not a statistical test
Note ndash see the Bland and Altman paper for details
CONTINUOUS amp ORDINAL DATA
Case Study 6
Slide - 25
25
bull Fitness is now assessed only as Unfit Fit
ndash could be as a result of dichotomising the previous continuous outcome (0-5
minutes = Unfit gt5 minutes = Fit)
ndash investigate whether the proportions of Unfit and Fit are equal (ie 50 each)
after the standard treatment
ndash or compare the proportions to specific values (eg 10 Fit 90 Unfit)
bull Objective any difference in proportion within the group
(or any difference from the specific proportions)
bull Outcome amp type fitness level category ndash binary
bull Exposure amp type one group only
bull Choice of test
ndash Chi-square test (large sample size)
ndash Exact test (small sample size)
Unfit Fit
Standard
BINARY DATA
Case Study 7
Slide - 26
26
Unfit Fit
Standard
Enhanced
BINARY DATA
Case Study 8
bull Similar setting as Case Study 2 but with the binary outcome defined from
Case Study 7 (Unfit Fit)
ndash to find out if the enhanced treatment is better than the standard treatment
ie more patients into the Fit category
bull Objective any difference in proportion between the groups
bull Outcome amp type fitness level category ndash binary
bull Exposure amp type treatment groups ndash binary independent (or unrelated)
bull Choice of test
ndash Chi-square test (large sample size)
ndash Fisherrsquos exact test (small sample size)
bull Note ndash same tests for more than 2 groups
Slide - 27
27
CONTINUOUS amp ORDINAL DATA
Case Study 12
bull Now in the physiotherapy trial we wanted to investigate
ndash if there was any relationship between the participantsrsquo fitness level and their age at
assessment
ndash we suspected that age at assessment affected their fitness level regardless of the
treatment group they were in
ndash quantify the relationship by the direction strength and magnitude
bull Objective assess and quantify the relationship between two variables
bull Outcome amp type fitness level ndash continuous
bull Exposure amp type age at assessment ndash continuous
bull Choice of test
ndash If any of the variables is Normally distributed
Pearson correlation
ndash If both variables are not Normally distributed
Spearmanrsquos rank correlation
Slide - 28
28
CONTINUOUS amp ORDINAL DATA
Case Study 13
bull We now found in Case Study 12 that age at assignment had some linear
relationship with participantsrsquo fitness level
ndash needed to quantify this relationship ie what is the average fitness level at
different age at assignment
ndash also wanted to predict fitness level for future patients given their age at
assignment
bull Objective set up a statistical model to quantify the effect of exposure variable
on the outcome variable
bull Outcome amp type fitness level ndash continuous
bull Exposure amp type age at assessment ndash continuous
bull Choice of test
ndash (Simple) Linear regression
bull Note ndash Linear regression is also appropriate when the exposure variable is
categorical eg exercise treatment group (standard amp enhanced) as well as
controlling for other covariates
Slide - 2
2
Using appropriate statistics and
graphs
bull Report statistics and graphs depends on the types of variables of
interest
ndash For continuous (Normally distributed) variables
bull N mean standard deviation minimum maximum
bull histograms dot plots box plots scatter plots
ndash For continuous (skewed) variables
bull N median lower quartile upper quartile minimum maximum
geometric mean
bull histograms dot plots box plots scatter plots
ndash For categorical variables
bull frequency counts percentages
bull one-way tables two-way tables
bull bar charts
Bar chart
Clustered bar charts (two categorical variables)
Bar charts with error bars
Histogram (can be plotted against a
categorical variable)
Box amp Whisker plot (can be plotted against
a categorical variable)
Dot plot (can be plotted against a
categorical variable)
Scatter plot (two continuous variables)
Mean
Median
Standard deviation
Range (Min Max)
Inter-quartile range (LQ UQ)
Flow chart of commonly used
descriptive statistics and
graphical illustrations
Frequency
Percentage (Row Column or Total)
Exploring data
Descriptive statistics
Graphical illustrations
Categorical data
Continuous data Measure of location
Continuous data Measure of variation
Categorical data
Continuous data
Slide - 4
Choosing appropriate statistical test
bull Having a well-defined hypothesis helps to distinguish the
outcome variable and the exposure variable
bull Answer the following questions to decide which statistical test is
appropriate to analysis your data
ndash What is the variable type for the outcome variable
bull Continuous (Normal Skew) Binary Time dependent
bull If more than one outcomes are they paired or related
ndash What is the variable type for the main exposure variable
bull Categorical (1 group 2 groups gt2 groups) Continuous
bull For 2 or gt2 groups Independent (Unrelated) Paired
(Related)
ndash Any other covariates confounding factors
4
5
Continuous
Categorical Outcome
variable
Normal Skew
Survival
1 group
2 groups
gt2 groups
Paired
Sign test Signed rank test
Mann-Whitney U test
Wilcoxon signed rank test
Kruskal Wallis test
1 group
2 groups
gt2 groups
Paired
Chi-square test Exact test
Chi-square test Fisherrsquos exact test Logistic regression
McNemarrsquos test Kappa statistic
Chi-square test Fisherrsquos exact test Logistic regression
2 groups
gt2 groups
KM plot with Log-rank test
KM plot with Log-rank test
Continuous
Continuous
Continuous
Spearman Corr Linear Reg
Logistic regression Sensitivity amp specificity ROC
Cox regression
Two-sample t test
Paired t test
One-way ANOVA test
Pearson Corr Linear Reg
One-sample t test
Exposure
variable
Flow chart of
commonly used
statistical tests
Case Studies
Slide - 7
7
bull A simple study investigating
ndash the fitness level of our locally selected group of healthy volunteers
ndash with the published average value on fitness level which was done previously
on the national level
ndash fitness level was measured by the length of time walking on a treadmill
before stopping through tiredness
bull Objective any difference between the group average and the published value
bull Outcome amp type
bull Exposure amp type
bull If the continuous outcome is
ndash Normally distributed
ndash Not Normally distributed
CONTINUOUS amp ORDINAL DATA
Case Study 1
Slide - 8
8
bull A clinical trial investigating
ndash the effect of two physiotherapy treatments (standard and enhanced
exercise) for patients with a broken leg
ndash on their fitness level (length of time walking on a treadmill before stopping
through tiredness)
bull Objective any difference between the 2 group averages
bull Outcome amp type
bull Exposure amp type
bull If the continuous outcome is
ndash Normally distributed
ndash Not Normally distributed
CONTINUOUS amp ORDINAL DATA
Case Study 2
Slide - 9
9
bull Now each patient performs the walking test before and after
enhanced physiotherapy treatment
ndash data might be presented as two variables one as before data and
the other as after data but the values for individual patients are
paired
bull Objective any difference between the before and the after averages
bull Number of outcomes
bull Outcomes amp type
bull If the difference in outcomes (eg after - before) is
ndash Normally distributed
ndash Not Normally distributed
CONTINUOUS amp ORDINAL DATA
Case Study 3
Slide - 10
10
bull Based on Case Study 2 (standard vs enhanced exercises) but now
with a control group
ndash ie patients without a broken leg
bull Objective any difference among the 3 group averages
bull Outcome amp type
bull Exposure amp type
bull If the continuous outcome is
ndash Normally distributed
ndash Not Normally distributed
CONTINUOUS amp ORDINAL DATA
Case Study 4
Slide - 11
11
bull Before the participants started their fitness test their blood pressure (BP) was recorded
by two different machines
ndash machine 1 was the lsquogold standardrsquo
ndash machine 2 was newly made and claimed to be more accurate
ndash aim to validate the measurements recorded from machine 2 by assessing the level of
agreement with that obtained from machine 1
bull Objective any agreement between measuring tools
bull Number of outcomes
bull Outcomes amp type
bull Choice of test
ndash
ndash
bull Note ndash
Note ndash
CONTINUOUS amp ORDINAL DATA
Case Study 6
Slide - 12
12
When the continuous outcome is not
normally distributed
bull If outcome normally distributed use t-tests ANOVA
ndash easy to obtain confidence interval for differences
bull So far wersquove recommended using non-parametric tests when data not normal
ndash often less powerful
ndash non-parametric confidence intervals problematic
bull Recall another possibility ndash take logs (natural log) of the outcome
ndash check to see if outcome looks normal after logging
ndash can then use t-tests ANOVA
ndash estimate of the difference and its confidence interval on log scale easily
available
ndash back transform to get estimate of percent change between groups
ndash back transform confidence interval
ndash better to analyse on log scale if data become normally distributed than to
use non-parametric test
Slide - 13
13
bull Fitness is now assessed only as Unfit Fit
ndash could be as a result of dichotomising the previous continuous outcome (0-5
minutes = Unfit gt5 minutes = Fit)
ndash investigate whether the proportions of Unfit and Fit are equal (ie 50 each)
after the standard treatment
ndash or compare the proportions to specific values (eg 10 Fit 90 Unfit)
bull Objective any difference in proportion within the group
(or any difference from the specific proportions)
bull Outcome amp type
bull Exposure amp type
bull Choice of test
ndash
ndash
BINARY DATA
Case Study 7
Slide - 14
14
BINARY DATA
Case Study 8
bull Similar setting as Case Study 2 but with the binary outcome defined from
Case Study 7 (Unfit Fit)
ndash to find out if the enhanced treatment is better than the standard treatment
ie more patients into the Fit category
bull Objective any difference in proportion between the groups
bull Outcome amp type
bull Exposure amp type
bull Choice of test
ndash
ndash
bull Note ndash
Slide - 15
15
CONTINUOUS amp ORDINAL DATA
Case Study 12
bull Now in the physiotherapy trial we wanted to investigate
ndash if there was any relationship between the participantsrsquo fitness level and their age at
assessment
ndash we suspected that age at assessment affected their fitness level regardless of the
treatment group they were in
ndash quantify the relationship by the direction strength and magnitude
bull Objective assess and quantify the relationship between two variables
bull Outcome amp type
bull Exposure amp type
bull Choice of test
ndash If any of the variables is Normally distributed
ndash If both variables are not Normally distributed
Slide - 16
16
CONTINUOUS amp ORDINAL DATA
Case Study 13
bull We now found in Case Study 12 that age at assignment had some linear
relationship with participantsrsquo fitness level
ndash needed to quantify this relationship ie what is the average fitness level at
different age at assignment
ndash also wanted to predict fitness level for future patients given their age at
assignment
bull Objective set up a statistical model to quantify the effect of exposure variable
on the outcome variable
bull Outcome amp type
bull Exposure amp type
bull Choice of test
ndash
bull Note ndash
Slide - 17
17
References
bull Altman DG Practical Statistics for Medical Research Chapman and Hall 1991
bull Kirkwood BR amp Sterne JAC Essential Medical Statistics 2nd Edition Oxford Blackwell
Science Ltd 2003
bull Bland M An Introduction to Medical Statistics 3rd Edition Oxford Oxford Medical
Publications 2000
bull Altman DG Machin D Bryant TN amp Gardner MJ Statistics with Confidence 2nd Edition
BMJ Books 2000
bull Campbell MJ amp Machin D Medical Statistics A Commonsense Approach 3rd Edition 1999
bull Field A Discovering Statistics Using SPSS for Windows 2nd edition London Sage
Publications 2005
bull Bland JM Altman DG (1986) Statistical methods for assessing agreement between two
methods of clinical measurement Lancet i 307-310
bull Mathews JNS Altman DG Campbell MJ Royston P (1990) Analysis of serial measurements in
medical research British Medical Journal 300 230-235
Slide - 18
18
Other web and software resources
bull UCLA ndash What statistical analysis should I use
ndash httpwwwatsuclaedustatmult_pkgwhatstatdefaulthtm
bull DISCUS
ndash Discovering Important Statistical Concepts Using Spreadsheets
ndash Interactive spreadsheets designed for teaching statistics
ndash Web-sites for download and information -
httpwwwcoventryacukecresearchdiscusdiscus_homehtml
bull Choosing the correct statistical test
ndash httpbamauaedu~jleeper627choosestathtml
bull SPSS for Windows
ndash Help
ndash Statistics Coach
bull Statistics for the Terrified
Solutions to
Case Studies
Slide - 20
20
bull A simple study investigating
ndash the fitness level of our locally selected group of healthy volunteers
ndash with the published average value on fitness level which was done previously
on the national level
ndash fitness level was measured by the length of time walking on a treadmill
before stopping through tiredness
bull Objective any difference between the group average and the published value
bull Outcome amp type fitness level (length of time) ndash continuous
bull Exposure amp type one group only
bull If the continuous outcome is
ndash Normally distributed One-sample t test
ndash Not Normally distributed Sign test Signed rank test
vs
CONTINUOUS amp ORDINAL DATA
Case Study 1
Slide - 21
21
bull A clinical trial investigating
ndash the effect of two physiotherapy treatments (standard and enhanced
exercise) for patients with a broken leg
ndash on their fitness level (length of time walking on a treadmill before stopping
through tiredness)
bull Objective any difference between the 2 group averages
bull Outcome amp type fitness level ndash continuous
bull Exposure amp type treatment group ndash binary independent
(or unrelated)
bull If the continuous outcome is
ndash Normally distributed Two-sample t test
ndash Not Normally distributed Mann-Whitney U test
CONTINUOUS amp ORDINAL DATA
Case Study 2
Slide - 22
22
bull Now each patient performs the walking test before and after
enhanced physiotherapy treatment
ndash data might be presented as two variables one as before data and
the other as after data but the values for individual patients are
paired
bull Objective any difference between the before and the after averages
bull Number of outcomes 2 (before and after)
bull Outcomes amp type fitness level ndash continuous
paired (or related)
bull If the difference in outcomes (eg after - before) is
ndash Normally distributed Paired t test
ndash Not Normally distributed Wilcoxon signed rank test
CONTINUOUS amp ORDINAL DATA
Case Study 3
Slide - 23
23
bull Based on Case Study 2 (standard vs enhanced exercises) but now
with a control group
ndash ie patients without a broken leg
bull Objective any difference among the 3 group averages
bull Outcome amp type fitness level ndash continuous
bull Exposure amp type treatment group ndash categorical (more
than two levels) independent (or unrelated)
bull If the continuous outcome is
ndash Normally distributed One-way ANOVA test
ndash Not Normally distributed Kruskal-Wallis test
CONTINUOUS amp ORDINAL DATA
Case Study 4
Slide - 24
24
bull Before the participants started their fitness test their blood pressure (BP) was recorded
by two different machines
ndash machine 1 was the lsquogold standardrsquo
ndash machine 2 was newly made and claimed to be more accurate
ndash aim to validate the measurements recorded from machine 2 by assessing the level of
agreement with that obtained from machine 1
bull Objective any agreement between measuring tools
bull Number of outcomes 2 (machines)
bull Outcomes amp type blood pressure ndash continuous paired
(or related)
bull Choice of test
ndash Bland-Altman method (amp Paired t-test)
bull Note ndash the Bland-Altman method is not a statistical test
Note ndash see the Bland and Altman paper for details
CONTINUOUS amp ORDINAL DATA
Case Study 6
Slide - 25
25
bull Fitness is now assessed only as Unfit Fit
ndash could be as a result of dichotomising the previous continuous outcome (0-5
minutes = Unfit gt5 minutes = Fit)
ndash investigate whether the proportions of Unfit and Fit are equal (ie 50 each)
after the standard treatment
ndash or compare the proportions to specific values (eg 10 Fit 90 Unfit)
bull Objective any difference in proportion within the group
(or any difference from the specific proportions)
bull Outcome amp type fitness level category ndash binary
bull Exposure amp type one group only
bull Choice of test
ndash Chi-square test (large sample size)
ndash Exact test (small sample size)
Unfit Fit
Standard
BINARY DATA
Case Study 7
Slide - 26
26
Unfit Fit
Standard
Enhanced
BINARY DATA
Case Study 8
bull Similar setting as Case Study 2 but with the binary outcome defined from
Case Study 7 (Unfit Fit)
ndash to find out if the enhanced treatment is better than the standard treatment
ie more patients into the Fit category
bull Objective any difference in proportion between the groups
bull Outcome amp type fitness level category ndash binary
bull Exposure amp type treatment groups ndash binary independent (or unrelated)
bull Choice of test
ndash Chi-square test (large sample size)
ndash Fisherrsquos exact test (small sample size)
bull Note ndash same tests for more than 2 groups
Slide - 27
27
CONTINUOUS amp ORDINAL DATA
Case Study 12
bull Now in the physiotherapy trial we wanted to investigate
ndash if there was any relationship between the participantsrsquo fitness level and their age at
assessment
ndash we suspected that age at assessment affected their fitness level regardless of the
treatment group they were in
ndash quantify the relationship by the direction strength and magnitude
bull Objective assess and quantify the relationship between two variables
bull Outcome amp type fitness level ndash continuous
bull Exposure amp type age at assessment ndash continuous
bull Choice of test
ndash If any of the variables is Normally distributed
Pearson correlation
ndash If both variables are not Normally distributed
Spearmanrsquos rank correlation
Slide - 28
28
CONTINUOUS amp ORDINAL DATA
Case Study 13
bull We now found in Case Study 12 that age at assignment had some linear
relationship with participantsrsquo fitness level
ndash needed to quantify this relationship ie what is the average fitness level at
different age at assignment
ndash also wanted to predict fitness level for future patients given their age at
assignment
bull Objective set up a statistical model to quantify the effect of exposure variable
on the outcome variable
bull Outcome amp type fitness level ndash continuous
bull Exposure amp type age at assessment ndash continuous
bull Choice of test
ndash (Simple) Linear regression
bull Note ndash Linear regression is also appropriate when the exposure variable is
categorical eg exercise treatment group (standard amp enhanced) as well as
controlling for other covariates

Case Studies
Slide - 7
7
bull A simple study investigating
ndash the fitness level of our locally selected group of healthy volunteers
ndash with the published average value on fitness level which was done previously
on the national level
ndash fitness level was measured by the length of time walking on a treadmill
before stopping through tiredness
bull Objective any difference between the group average and the published value
bull Outcome amp type
bull Exposure amp type
bull If the continuous outcome is
ndash Normally distributed
ndash Not Normally distributed
CONTINUOUS amp ORDINAL DATA
Case Study 1
Slide - 8
8
bull A clinical trial investigating
ndash the effect of two physiotherapy treatments (standard and enhanced
exercise) for patients with a broken leg
ndash on their fitness level (length of time walking on a treadmill before stopping
through tiredness)
bull Objective any difference between the 2 group averages
bull Outcome amp type
bull Exposure amp type
bull If the continuous outcome is
ndash Normally distributed
ndash Not Normally distributed
CONTINUOUS amp ORDINAL DATA
Case Study 2
Slide - 9
9
bull Now each patient performs the walking test before and after
enhanced physiotherapy treatment
ndash data might be presented as two variables one as before data and
the other as after data but the values for individual patients are
paired
bull Objective any difference between the before and the after averages
bull Number of outcomes
bull Outcomes amp type
bull If the difference in outcomes (eg after - before) is
ndash Normally distributed
ndash Not Normally distributed
CONTINUOUS amp ORDINAL DATA
Case Study 3
Slide - 10
10
bull Based on Case Study 2 (standard vs enhanced exercises) but now
with a control group
ndash ie patients without a broken leg
bull Objective any difference among the 3 group averages
bull Outcome amp type
bull Exposure amp type
bull If the continuous outcome is
ndash Normally distributed
ndash Not Normally distributed
CONTINUOUS amp ORDINAL DATA
Case Study 4
Slide - 11
11
bull Before the participants started their fitness test their blood pressure (BP) was recorded
by two different machines
ndash machine 1 was the lsquogold standardrsquo
ndash machine 2 was newly made and claimed to be more accurate
ndash aim to validate the measurements recorded from machine 2 by assessing the level of
agreement with that obtained from machine 1
bull Objective any agreement between measuring tools
bull Number of outcomes
bull Outcomes amp type
bull Choice of test
ndash
ndash
bull Note ndash
Note ndash
CONTINUOUS amp ORDINAL DATA
Case Study 6
Slide - 12
12
When the continuous outcome is not
normally distributed
bull If outcome normally distributed use t-tests ANOVA
ndash easy to obtain confidence interval for differences
bull So far wersquove recommended using non-parametric tests when data not normal
ndash often less powerful
ndash non-parametric confidence intervals problematic
bull Recall another possibility ndash take logs (natural log) of the outcome
ndash check to see if outcome looks normal after logging
ndash can then use t-tests ANOVA
ndash estimate of the difference and its confidence interval on log scale easily
available
ndash back transform to get estimate of percent change between groups
ndash back transform confidence interval
ndash better to analyse on log scale if data become normally distributed than to
use non-parametric test
Slide - 13
13
bull Fitness is now assessed only as Unfit Fit
ndash could be as a result of dichotomising the previous continuous outcome (0-5
minutes = Unfit gt5 minutes = Fit)
ndash investigate whether the proportions of Unfit and Fit are equal (ie 50 each)
after the standard treatment
ndash or compare the proportions to specific values (eg 10 Fit 90 Unfit)
bull Objective any difference in proportion within the group
(or any difference from the specific proportions)
bull Outcome amp type
bull Exposure amp type
bull Choice of test
ndash
ndash
BINARY DATA
Case Study 7
Slide - 14
14
BINARY DATA
Case Study 8
bull Similar setting as Case Study 2 but with the binary outcome defined from
Case Study 7 (Unfit Fit)
ndash to find out if the enhanced treatment is better than the standard treatment
ie more patients into the Fit category
bull Objective any difference in proportion between the groups
bull Outcome amp type
bull Exposure amp type
bull Choice of test
ndash
ndash
bull Note ndash
Slide - 15
15
CONTINUOUS amp ORDINAL DATA
Case Study 12
bull Now in the physiotherapy trial we wanted to investigate
ndash if there was any relationship between the participantsrsquo fitness level and their age at
assessment
ndash we suspected that age at assessment affected their fitness level regardless of the
treatment group they were in
ndash quantify the relationship by the direction strength and magnitude
bull Objective assess and quantify the relationship between two variables
bull Outcome amp type
bull Exposure amp type
bull Choice of test
ndash If any of the variables is Normally distributed
ndash If both variables are not Normally distributed
Slide - 16
16
CONTINUOUS amp ORDINAL DATA
Case Study 13
bull We now found in Case Study 12 that age at assignment had some linear
relationship with participantsrsquo fitness level
ndash needed to quantify this relationship ie what is the average fitness level at
different age at assignment
ndash also wanted to predict fitness level for future patients given their age at
assignment
bull Objective set up a statistical model to quantify the effect of exposure variable
on the outcome variable
bull Outcome amp type
bull Exposure amp type
bull Choice of test
ndash
bull Note ndash
Slide - 17
17
References
bull Altman DG Practical Statistics for Medical Research Chapman and Hall 1991
bull Kirkwood BR amp Sterne JAC Essential Medical Statistics 2nd Edition Oxford Blackwell
Science Ltd 2003
bull Bland M An Introduction to Medical Statistics 3rd Edition Oxford Oxford Medical
Publications 2000
bull Altman DG Machin D Bryant TN amp Gardner MJ Statistics with Confidence 2nd Edition
BMJ Books 2000
bull Campbell MJ amp Machin D Medical Statistics A Commonsense Approach 3rd Edition 1999
bull Field A Discovering Statistics Using SPSS for Windows 2nd edition London Sage
Publications 2005
bull Bland JM Altman DG (1986) Statistical methods for assessing agreement between two
methods of clinical measurement Lancet i 307-310
bull Mathews JNS Altman DG Campbell MJ Royston P (1990) Analysis of serial measurements in
medical research British Medical Journal 300 230-235
Slide - 18
18
Other web and software resources
bull UCLA ndash What statistical analysis should I use
ndash httpwwwatsuclaedustatmult_pkgwhatstatdefaulthtm
bull DISCUS
ndash Discovering Important Statistical Concepts Using Spreadsheets
ndash Interactive spreadsheets designed for teaching statistics
ndash Web-sites for download and information -
httpwwwcoventryacukecresearchdiscusdiscus_homehtml
bull Choosing the correct statistical test
ndash httpbamauaedu~jleeper627choosestathtml
bull SPSS for Windows
ndash Help
ndash Statistics Coach
bull Statistics for the Terrified
Solutions to
Case Studies
Slide - 20
20
bull A simple study investigating
ndash the fitness level of our locally selected group of healthy volunteers
ndash with the published average value on fitness level which was done previously
on the national level
ndash fitness level was measured by the length of time walking on a treadmill
before stopping through tiredness
bull Objective any difference between the group average and the published value
bull Outcome amp type fitness level (length of time) ndash continuous
bull Exposure amp type one group only
bull If the continuous outcome is
ndash Normally distributed One-sample t test
ndash Not Normally distributed Sign test Signed rank test
vs
CONTINUOUS amp ORDINAL DATA
Case Study 1
Slide - 21
21
bull A clinical trial investigating
ndash the effect of two physiotherapy treatments (standard and enhanced
exercise) for patients with a broken leg
ndash on their fitness level (length of time walking on a treadmill before stopping
through tiredness)
bull Objective any difference between the 2 group averages
bull Outcome amp type fitness level ndash continuous
bull Exposure amp type treatment group ndash binary independent
(or unrelated)
bull If the continuous outcome is
ndash Normally distributed Two-sample t test
ndash Not Normally distributed Mann-Whitney U test
CONTINUOUS amp ORDINAL DATA
Case Study 2
Slide - 22
22
bull Now each patient performs the walking test before and after
enhanced physiotherapy treatment
ndash data might be presented as two variables one as before data and
the other as after data but the values for individual patients are
paired
bull Objective any difference between the before and the after averages
bull Number of outcomes 2 (before and after)
bull Outcomes amp type fitness level ndash continuous
paired (or related)
bull If the difference in outcomes (eg after - before) is
ndash Normally distributed Paired t test
ndash Not Normally distributed Wilcoxon signed rank test
CONTINUOUS amp ORDINAL DATA
Case Study 3
Slide - 23
23
bull Based on Case Study 2 (standard vs enhanced exercises) but now
with a control group
ndash ie patients without a broken leg
bull Objective any difference among the 3 group averages
bull Outcome amp type fitness level ndash continuous
bull Exposure amp type treatment group ndash categorical (more
than two levels) independent (or unrelated)
bull If the continuous outcome is
ndash Normally distributed One-way ANOVA test
ndash Not Normally distributed Kruskal-Wallis test
CONTINUOUS amp ORDINAL DATA
Case Study 4
Slide - 24
24
bull Before the participants started their fitness test their blood pressure (BP) was recorded
by two different machines
ndash machine 1 was the lsquogold standardrsquo
ndash machine 2 was newly made and claimed to be more accurate
ndash aim to validate the measurements recorded from machine 2 by assessing the level of
agreement with that obtained from machine 1
bull Objective any agreement between measuring tools
bull Number of outcomes 2 (machines)
bull Outcomes amp type blood pressure ndash continuous paired
(or related)
bull Choice of test
ndash Bland-Altman method (amp Paired t-test)
bull Note ndash the Bland-Altman method is not a statistical test
Note ndash see the Bland and Altman paper for details
CONTINUOUS amp ORDINAL DATA
Case Study 6
Slide - 25
25
bull Fitness is now assessed only as Unfit Fit
ndash could be as a result of dichotomising the previous continuous outcome (0-5
minutes = Unfit gt5 minutes = Fit)
ndash investigate whether the proportions of Unfit and Fit are equal (ie 50 each)
after the standard treatment
ndash or compare the proportions to specific values (eg 10 Fit 90 Unfit)
bull Objective any difference in proportion within the group
(or any difference from the specific proportions)
bull Outcome amp type fitness level category ndash binary
bull Exposure amp type one group only
bull Choice of test
ndash Chi-square test (large sample size)
ndash Exact test (small sample size)
Unfit Fit
Standard
BINARY DATA
Case Study 7
Slide - 26
26
Unfit Fit
Standard
Enhanced
BINARY DATA
Case Study 8
bull Similar setting as Case Study 2 but with the binary outcome defined from
Case Study 7 (Unfit Fit)
ndash to find out if the enhanced treatment is better than the standard treatment
ie more patients into the Fit category
bull Objective any difference in proportion between the groups
bull Outcome amp type fitness level category ndash binary
bull Exposure amp type treatment groups ndash binary independent (or unrelated)
bull Choice of test
ndash Chi-square test (large sample size)
ndash Fisherrsquos exact test (small sample size)
bull Note ndash same tests for more than 2 groups
Slide - 27
27
CONTINUOUS amp ORDINAL DATA
Case Study 12
bull Now in the physiotherapy trial we wanted to investigate
ndash if there was any relationship between the participantsrsquo fitness level and their age at
assessment
ndash we suspected that age at assessment affected their fitness level regardless of the
treatment group they were in
ndash quantify the relationship by the direction strength and magnitude
bull Objective assess and quantify the relationship between two variables
bull Outcome amp type fitness level ndash continuous
bull Exposure amp type age at assessment ndash continuous
bull Choice of test
ndash If any of the variables is Normally distributed
Pearson correlation
ndash If both variables are not Normally distributed
Spearmanrsquos rank correlation
Slide - 28
28
CONTINUOUS amp ORDINAL DATA
Case Study 13
bull We now found in Case Study 12 that age at assignment had some linear
relationship with participantsrsquo fitness level
ndash needed to quantify this relationship ie what is the average fitness level at
different age at assignment
ndash also wanted to predict fitness level for future patients given their age at
assignment
bull Objective set up a statistical model to quantify the effect of exposure variable
on the outcome variable
bull Outcome amp type fitness level ndash continuous
bull Exposure amp type age at assessment ndash continuous
bull Choice of test
ndash (Simple) Linear regression
bull Note ndash Linear regression is also appropriate when the exposure variable is
categorical eg exercise treatment group (standard amp enhanced) as well as
controlling for other covariates
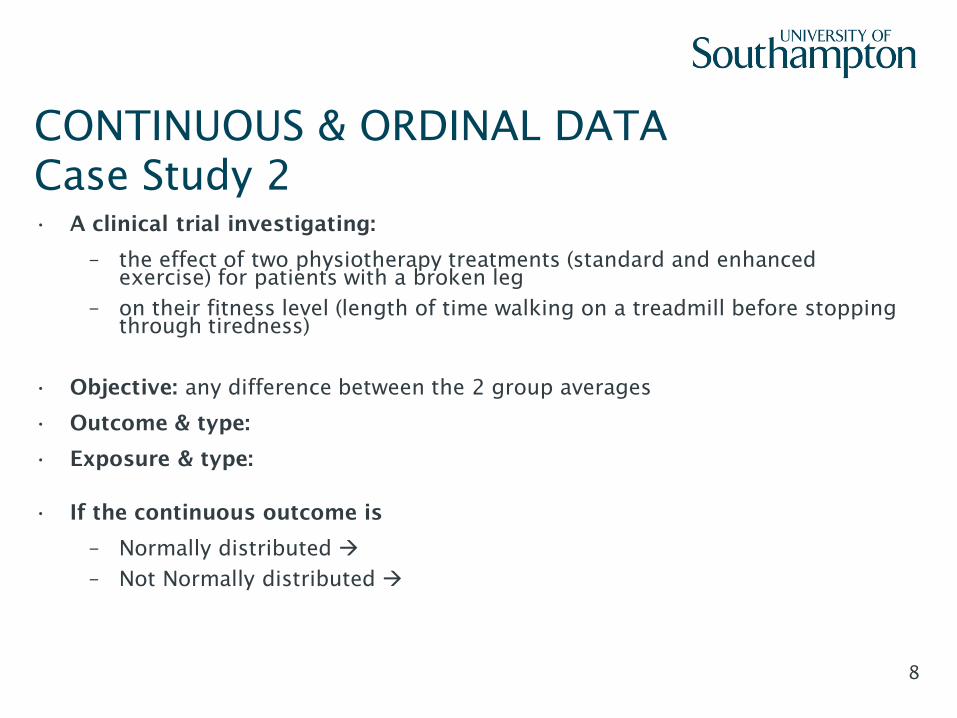
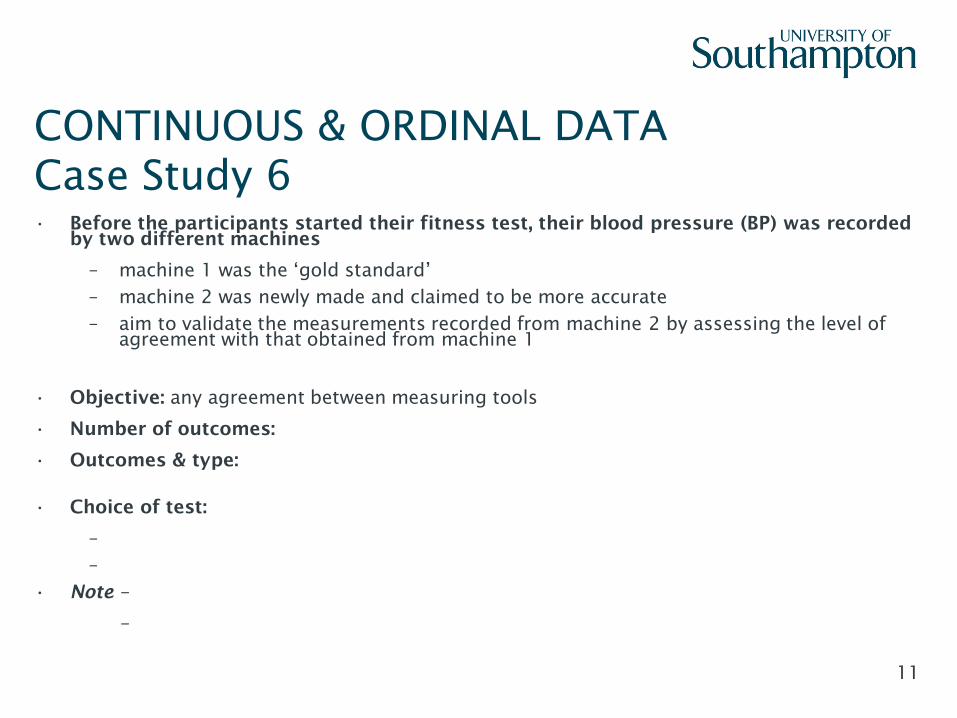
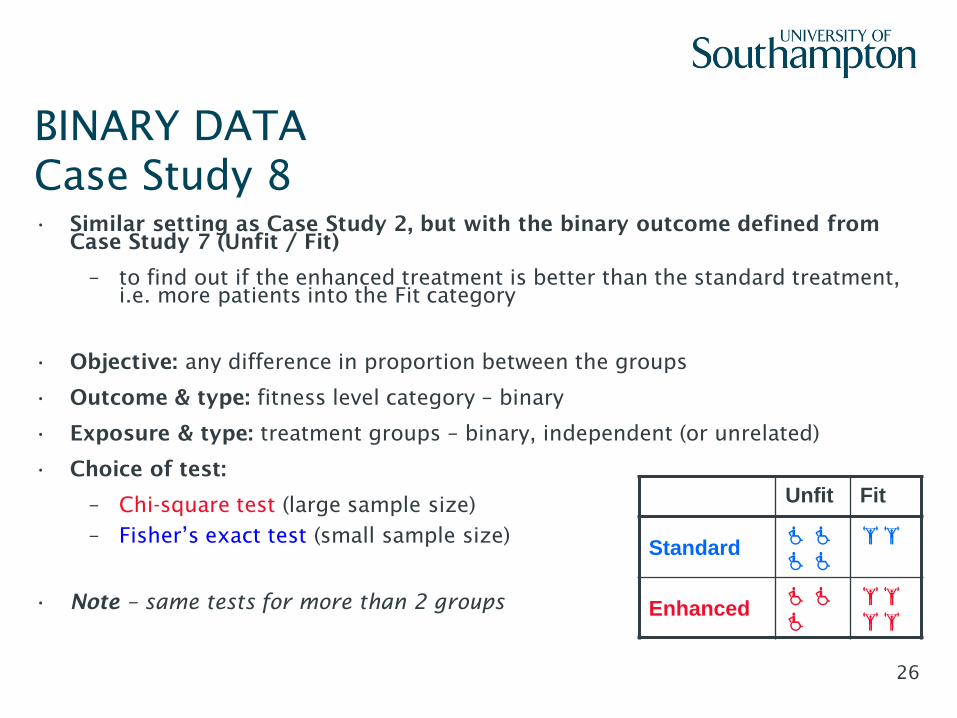