Chlor Alkali Sector - Bureau of Energy Efficiency · ministry of power government of india...
44
MINISTRY OF POWER GOVERNMENT OF INDIA NORMALIZATION DOCUMENT AND MONITORING & VERIFICATION GUIDELINES Chlor Alkali Sector
Transcript of Chlor Alkali Sector - Bureau of Energy Efficiency · ministry of power government of india...

MINISTRY OF POWERGOVERNMENT OF INDIA
NORMALIZATION DOCUMENT AND MONITORING & VERIFICATION GUIDELINES
Chlor Alkali Sector


Chlor Alkali Sector i

Chlor Alkali Sectorii
© Bureau of Energy Efficiency, Government of India, March 2015
All rights reserved. No part of this document may be reproduced in any form or by any means without prior permission of Bureau of Energy Efficiency, Government of India.
Published byBureau of Energy EfficiencyMinistry of Power,Government of India4th Floor, Sewa BhawanR K PuramNew Delhi -110 066
Developed specifically for Designated Consumers notified under Perform Achieve and Trade (PAT) Program for National Mission for Energy Efficiency (NMEEE)
DisclaimerThis document has been developed after an extensive consultation with a number of experts and stakeholders of the scheme. BEE disclaim any liability for any kind of loss whatsoever, whether special, indirect, consequential, or compensatory, directly or indirectly resulting from the publication, or reliance on this document.
Conceptualized by Media NMEEE
Processed and Printed in India by Viba Press Pvt. Ltd., C-66/3, Okhla Industrial Area, Phase-II, New Delhi-110020Tel. : 011-41611300 / 301 Email : [email protected]

Chlor Alkali Sector iii
Contents
1. Introduction 1 1.1 National Mission for Enhanced Energy Efficiency 1 1.2 Perform, Achieve and Trade (PAT) Scheme 2 1.3 Background 2 1.4 Categorization and Distribution 3
2. Overview of Indian Chlor-Alkali Industry 3 2.1 Products of Chlor-Alkali Industry 3 2.2 Growth Drivers for Caustic Soda Industry 4 2.3 Chlorine Derivatives & Their Growth In India 4 2.4 Journey towards Improved Safety, Health & Environment, Green Manufacturing and Sustainable Growth 5 2.5 Environment Management through Green Manufacturing 5 2.6 Process Diagram 6
3. Chlor-Alkali Industry under PAT Scheme. 6 3.1 Status of Designated Consumer (DCs) 7 3.2 General Rules for Establishing Baseline Values 7 3.2.1 Definitions 7
3.2.2 Data Consideration 7
3.2.2 Grouping of DCs 7
3.2.3 Estimation of Gate-to-Gate SEC in Base Year: 8
3.2.4 Battery Limit 10
3.2.5 Target Setting 10
4. Normalization and Calculation 11 4.1 Power Mix Normalization methodology 11 Power Mix Normalization Calculation 11 Documentation 13 4.2 Fuel Quality Normalization (Quality of Coal in CPP & Co-Gen) 19 Fuel Quality Normalization 20
Pre-Requisite 21
Coal Quality Normalization Methodology 21
Normalization Formula 21
Normalization Calculation 22
Documentation 22

Chlor Alkali Sectoriv
Note on Proximate and Ultimate Analysis of Coal 23
Normalization Coal Quality in Co-Gen 24
4.3 Hydrogen Mix 33 Need for Normalisation 33
Normalisation Calculation 34
4.4. Low PLF in CPP 35 Need for Normalization 35
Normalization Methodology 35
Normalization Equation 35
Normalisation calculation 36
4.5. Normalization Others 39 Environmental concern (Additional Environmental Equipment requirement due to major change in government policy on Environment) 39
Fuel replacements (Unavailability of Bio-mass/Alternate Fuel w.r.t baseline year) 40
Construction Phase or Project Activity Phase 41
Addition of New Line/Unit 41
Unforeseen Circumstances 43
Thermal Energy used in Waste heat recovery 43
Renewable Energy 43
4.5.1. Environmental concern Calculation 45
4.5.2. Biomass /Alternate Fuel Unavailability w.r.t. Baseline year
(Replacement due to external factor) 46
4.5.3. Construction Phase or Project Activities 47
4.5.4. Addition of New Unit/Line (In Process and Power generation) 48
4.5.5. Unforeseen Circumstances (External Factor) 50
4.5.6. Renewable Energy 51
5. Abbreviations 56
Chlor Alkali Sector v
Part-II
MONITORING & VERIFICATION GUIDELINES
1. Introduction 611.1. Background 611.2. Purpose 621.3. Definition of M&V 621.4. Empanelled Accredited Energy Auditor or Verifier 63
1.4.1. Qualification of Empanelled Accredited Energy Auditor (EmAEA) for Verification and Check-Verification
64
1.4.2. Obligation of Empanelled Accreditor Energy Auditor 641.5. Important Documents required for M&V process 651.6. Stakeholders 66
2. Broad Roles and Responsibilities 662.1. General 662.2. Designated Consumer 672.3. Empanelled Accredited Energy Auditor (EmAEA) 692.4. State Designated Agencies (SDA) 702.5. Adjudicator 712.6. Bureau of Energy Efficiency 712.7. Ministry of Power 722.8. Institutional Framework for PAT 72
3. Process & Timelines 733.1. Activities and Responsibilities 733.2. Process Interlinking 74
3.2.1. Process of Issuance of Escerts 753.3. Flow Chart showing verification process (Rules and Act required dates in bold
Italics)76
4. Verification requirement 774.1. Guidelines for Selection Criteria of EmAEA by Designated Consumer 774.2. Guidelines for Empanelled Accredited Energy Auditor 774.3. Guidelines for Verification process 78
4.3.1. Sector Specific Pro-forma 784.3.2. Reporting in Sector Specific Pro-forma 79

Chlor Alkali Sectorvi
4.3.3. Verification Process 804.3.4. Primary and Secondary source of Documentation 83
5. Understanding Conditions 1075.1. Specific Issues 1085.2. Fuel 1095.3. Normalization Condition and calculation 1105.4. Normalisation General Issue 112
6. Abbreviations 1147. Annexure 115
7.1. Annexure I: Thermal Power Plant 1167.2. Annexure II: Steel 1217.3. Annexure III: Cement 1267.4. Annexure IV: Fertilizer 1307.5. Annexure V: Aluminium 1477.6. Annexure VI: Pulp & Paper 1507.7. Annexure VII: Textile 1737.8. Annexure VIII: Chlor Alkali 179

Chlor Alkali Sector vii
Tables
Table 1: Activities and Responsibilities for PAT Cycle I 73Table 2: Team Details (Minimum Team Composition) 78Table 3: Production and Capacity Utilisation details 83Table 4: Major Equipment capacity and Operating SEC 85Table 5: Boiler Details (Process and Co-Generation) 86Table 6: Electricity from Grid/Others, Renewable Purchase Obligation, Notified Figures 88Table 7: Own generation through Captive Power Plants 90Table 8: Solid Fuel Consumption 94Table 9: Liquid Fuel Consumption 97Table 10: Gaseous Fuel Consumption 100Table 11: Documents for Quality Parameter 102Table 12: Documents related to Environmental Concern, Biomass/Alternate
Fuel availability, Project Activities, New Line commissioning, Unforeseen Circumstances
103
Table 13: Documents related to External Factor 107Table 14: Lump Co-Generation treatment 111Table 15: Auxiliary Power Consumption Details (a,b,c) 116Table 16: Sponge Iron Subsector- Major Product details 122Table 17: Section wise Specific Power Consumption Details 127Table 18: Mass and Energy balance 128Table 19: Clinker Factor calculation 129Table 20: Material and Energy balance of Fertilizer sector 130Table 21: Material balance of all inputs in Fertilzer sector 133Table 22: Section wise Energy Consumption details 147Table 23: Section wise Energy Consumption details 148Table 24: Voltage Distribution 149Table 25: General details required in wood based Pulp and Paper Mills 151Table 26: Documents required wood based Pulp and Paper Mills 155Table 27: General details required in Agro based Pulp and Paper Mills 159Table 28: Document required for Agro based Pulp and Paper Mills 163Table 29: General details required in RCF based Pulp and Paper Mills 167Table 30: Documents required in RCF based Pulp and Paper 170Table 31: Section wise Energy Consumption 174Table 32: Section wise Energy Consumption 176Table 33: Product Name in Fiber Sun-sector 178Table 34: Section wise Energy Consumption 178Table 35: Section wise Energy details 179

Chlor Alkali Sectorviii
Figures
Figure 1: M&V Documents 65Figure 2: Stakeholders 66Figure 3: Institutional Framework 72Figure 4: Stakeholders Interlinking 74Figure 5: Flow Chart of ESCerts issuance 75Figure 6: Time Line Flow Chart 76Figure 7: Stakeholders Output 81Figure 8: Ex-GtG Boundary for Thermal Power Plant 119Figure 9: Ex-Coal/Lignite/Oil/Gas based Thermal Power Plant Energy balance diagram 120Figure 10: Ex-CCGT Energy balance diagram 121Figure 11: Product Mix diagram 123Figure 12: Ex-GtG Boundary boundary for Sponge Iron Sub-sector 124Figure 13: Figure 14: Ex-GtG boundary for Cement Sector 128Figure 15: Fertilizer plant Battery Limit block diagram 135Figure 16: Overall Material and Energy balance 139Figure 17: Ex- GtG boundary for Aluminium (Refinery sub sector) 148Figure 18: Ex- GtG boundary for Aluminium (Smelter sub sector) 149Figure 19: Ex- GtG boundary for Aluminium (Cold Sheet sub sector) 150Figure 20: Ex- GtG boundary and metering details for Wood based Pulp and Paper Mill 154Figure 21: Ex- GtG boundary and metering details for Agro based Pulp and Paper Mill 162Figure 22: Ex- GtG boundary for Textile (Spinning sub sector) 165Figure 23: Ex- GtG boundary for Textile ( Composite/ Processing sub sector) 167Figure 24: Ex- GtG boundary for Textile (Fiber) Sub- sector 169Figure 25: Ex- GtG boundary for Chlor-Alkali sector 170

Foreword
PerformAchieveandTrade (PAT),aflagship initiativeunderNationalMission forEnhancedEnergyEfficiency(NMEEE),isaregulatoryinterventionforreductionofspecificenergyconsumption,with an associatedmarket basedmechanism throughwhich additional energy savings can bequantifiedandtradedasECSerts.
Chlor-Alkalisectorisoneofthe8notifiedenergyintensivesectorsunderwhichatotalof22plantsareparticipatinginthisprogram.TheseplantshavebeenmandatedtoreducetheirSpecificEnergyConsumption(SEC)frombaselineyearof2009-2010.Itisexpectedthattheseplantsmaysave0.054milliontonsofoilequivalentannuallybytheendofPATcycle–I.
Thepublicationof“Normalization Document and M&V Guidelines” for Chlor-Alkali isanefforttofacilitatetheDCstocomplywithnotifiedPATrulestoparticipatewiththePATschemeandcontributetowardsachievingnationaltargetofenergysavings.ThisdocumentwillalsobehelpfultoallempanelledAccreditedEnergyAuditors(EmAEAs)andStateDesignatedAgencies(SDAs)inthemonitoringandverificationprocessofPAT.
IwanttorecordmyappreciationformembersoftheSectoralExpertCommitteeonChlor-AlkaliSector,chairedbyShriS.K.Agrawal,Advisor(Ex-ExecutiveDirector),DSCL,ShriSaurabhDiddi,EnergyEconomist,BEE,ShriRaviShankarPrajapati,ProjectEngineer,BEEandShriP.N.Parikh,SectorExpert,whoworkedtirelesslytoputtogetherthebaselinedata,normalizationfactorsandM&Vmethodology for thesector. Iespeciallywant torecordmyappreciation forShriS.VikashRanjan,TechnicalExpert,GIZwhohasput together thedataandmethodologyassociatedwithnormalization.
I also compliment the efforts of all participating industrial units towards their endeavor incontributingtothenationalenergysavingtargets.
(Ajay Mathur)
ÅtkZ n{krk C;wjks¼Hkkjr ljdkj] fo|qr ea=ky;½
vt; ekFkqj] ih,p-Mhegkfuns’kd
Ajay Mathur, Ph.D.Director GeneralBUREAU OF ENERGY EFFICIENCY
(Government of India, Ministry of Power)
pkSFkk ry] lsok Hkou] vkj0 ds0 iqje] ubZ fnYyh&110 066
Lofgr ,oa jk"Vªfgr esa ÅtkZ cpk,¡ Save Energy for Benefit of Self and Nation
4th Floor, Sewa Bhawan, R.K. Puram, New Delhi - 110 066Vsyh/Tel : 26178316 (lh/kk/Direct) 26179699 (5 Lines) QSDl/Fax : 91 (11) 26178328
bZ&esy/E-mail : [email protected] osclkbZV/Web-Site : www.beeindia.in
Chlor Alkali Sectorx
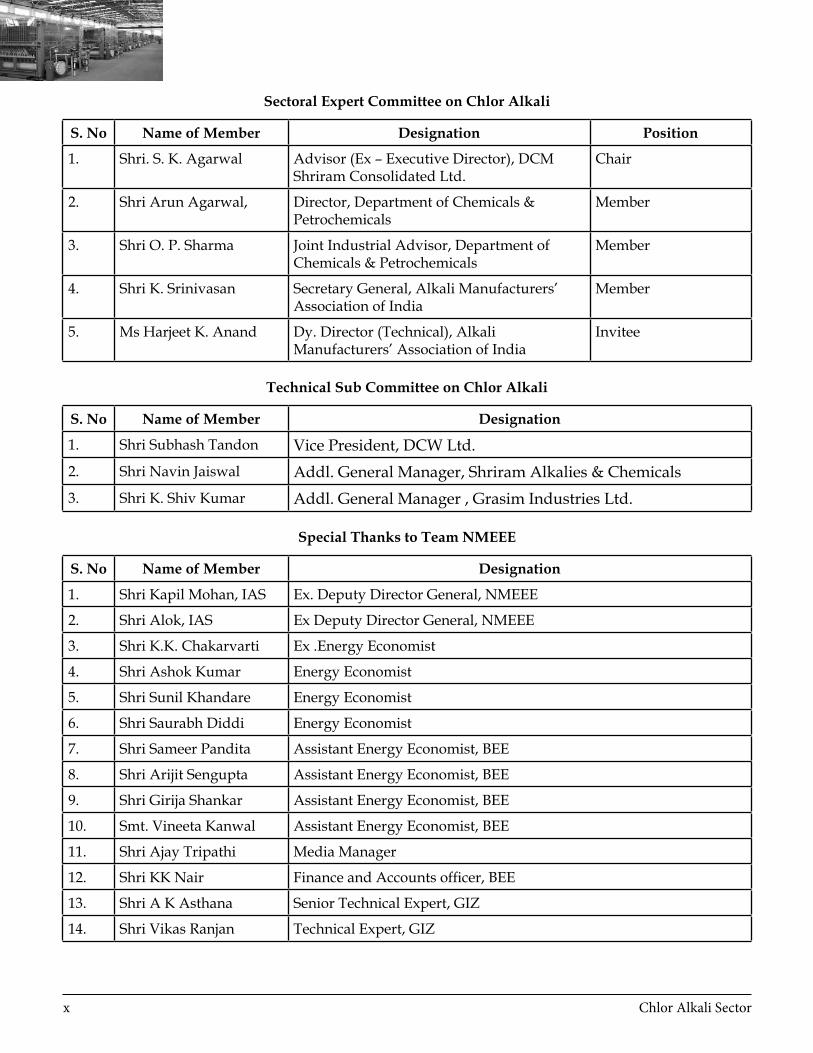
Sectoral Expert Committee on Chlor Alkali
S. No Name of Member Designation Position
1. Shri. S. K. Agarwal Advisor (Ex – Executive Director), DCM Shriram Consolidated Ltd.
Chair
2. Shri Arun Agarwal, Director, Department of Chemicals & Petrochemicals
Member
3. Shri O. P. Sharma Joint Industrial Advisor, Department of Chemicals & Petrochemicals
Member
4. Shri K. Srinivasan Secretary General, Alkali Manufacturers’ Association of India
Member
5. Ms Harjeet K. Anand Dy. Director (Technical), Alkali Manufacturers’ Association of India
Invitee
Technical Sub Committee on Chlor Alkali
S. No Name of Member Designation
1. Shri Subhash Tandon Vice President, DCW Ltd.2. Shri Navin Jaiswal Addl. General Manager, Shriram Alkalies & Chemicals 3. Shri K. Shiv Kumar Addl. General Manager , Grasim Industries Ltd.
Special Thanks to Team NMEEE
S. No Name of Member Designation
1. Shri Kapil Mohan, IAS Ex. Deputy Director General, NMEEE
2. Shri Alok, IAS Ex Deputy Director General, NMEEE
3. Shri K.K. Chakarvarti Ex .Energy Economist
4. Shri Ashok Kumar Energy Economist
5. Shri Sunil Khandare Energy Economist
6. Shri Saurabh Diddi Energy Economist
7. Shri Sameer Pandita Assistant Energy Economist, BEE
8. Shri Arijit Sengupta Assistant Energy Economist, BEE
9. Shri Girija Shankar Assistant Energy Economist, BEE
10. Smt. Vineeta Kanwal Assistant Energy Economist, BEE
11. Shri Ajay Tripathi Media Manager
12. Shri KK Nair Finance and Accounts officer, BEE
13. Shri A K Asthana Senior Technical Expert, GIZ
14. Shri Vikas Ranjan Technical Expert, GIZ

Chlor Alkali Sector 1
1. Introduction
The National Action Plan on Climate Change (NAPCC) released by the Prime Minister on 30 June, 2008, recognises the need to maintain high economic growth to raise the living standards of India’s vast majority of people and simultaneously reducing their vulnerability to the impacts of climate change.
The National Action Plan outlines eight national missions that represent multi-pronged, long-term, and integrated strategies for achieving key goals to mitigate the impact of climate change. These missions are listed below:
National Solar Mission
National Mission for Enhanced Energy Efficiency
National Mission on Sustainable Habitat
National Water Mission
National Mission for Sustaining the Himalayan Ecosystem
National Mission for a Green India
National Mission for Sustainable Agriculture
National Mission for Strategic Knowledge for Climate Change
1.1 National Mission for Enhanced Energy Efficiency
The National Mission for Enhanced Energy Efficiency (NMEEE) is one of the eight national missions with the objective of promoting innovative policy and regulatory regimes, financing mechanisms, and business models which not only create, but also sustain, markets for energy efficiency in a transparent manner with clear deliverables to be achieved in a time bound manner. It also has inbuilt provisions for monitoring and evaluation so as to ensure transparency, accountability, and responsiveness. The Ministry of Power (MoP) and Bureau of Energy Efficiency (BEE) were tasked to prepare the implementation plan for NMEEE.
NMEEE spelt out the following four new initiatives to enhance energy efficiency, in addition to the programmes on energy efficiency being pursued. These are:

Chlor Alkali Sector2
Perform, Achieve and Trade (PAT), a market based mechanism to make improvements in energy efficiency in energy-intensive large industries and to make facilities more cost – effective by certification of energy saving that can be traded.
Market Transformation for Energy Efficiency (MTEE) accelerates the shift to energy-efficient appliances in designated sectors through innovative measures that make the products more affordable.
Energy Efficiency Financing Platform (EEFP), a mechanism to finance demand side management programmes in all sectors by capturing future energy savings.
Framework for Energy Efficiency Economic Development (FEEED), for developing fiscal instruments to promote energy efficiency.
1.2 Perform, Achieve and Trade (PAT) Scheme
Under the National Mission on Enhanced Energy Efficiency (NMEEE), a market based mechanism known as Perform, Achieve and Trade (PAT) has been developed and launched to improve energy efficiency in the large energy intensive industries. It is envisaged that 6.686 million tonnes of oil equivalent will be reduced by 2014-15, which is about 4% of energy consumed by these industries. Under the PAT scheme, targets have been specified for all energy intensive industries notified as designated consumers (DCs) under the Energy Conservation Act, including thermal power stations.
1 1
27
7
12
22
48
National Energy Saving Targets under PAT (%)
Chlor-Alkali
Textile
Pulp & Paper
Aluminium
Fertilizer
Cement
Iron & Steel
Thermal Power Plants
1.3 Background
The methodology of setting targets for designated consumers is transparent, simple and easy to use. It is based on reduction of specific energy consumption (SEC) on a gate-to-gate (GtG) basis to achieve targeted savings in the first commitment period of 3 years (2012-2015); the reduction in this phase is of about 4.1%
which is estimated at 6.686 million tonnes of oil equivalent (mtoe). Of the 23 mtoe set as target from NMEEE, the PAT scheme is focussed on achieving 6.686 mtoe by 2015.
The threshold limit of 12,000 tonnes of oil equivalent (toe) has been marked as the cut-off limit criterion for any unit in the chlor-alkali sector to be identified as designated consumer
Chlor Alkali Sector 3
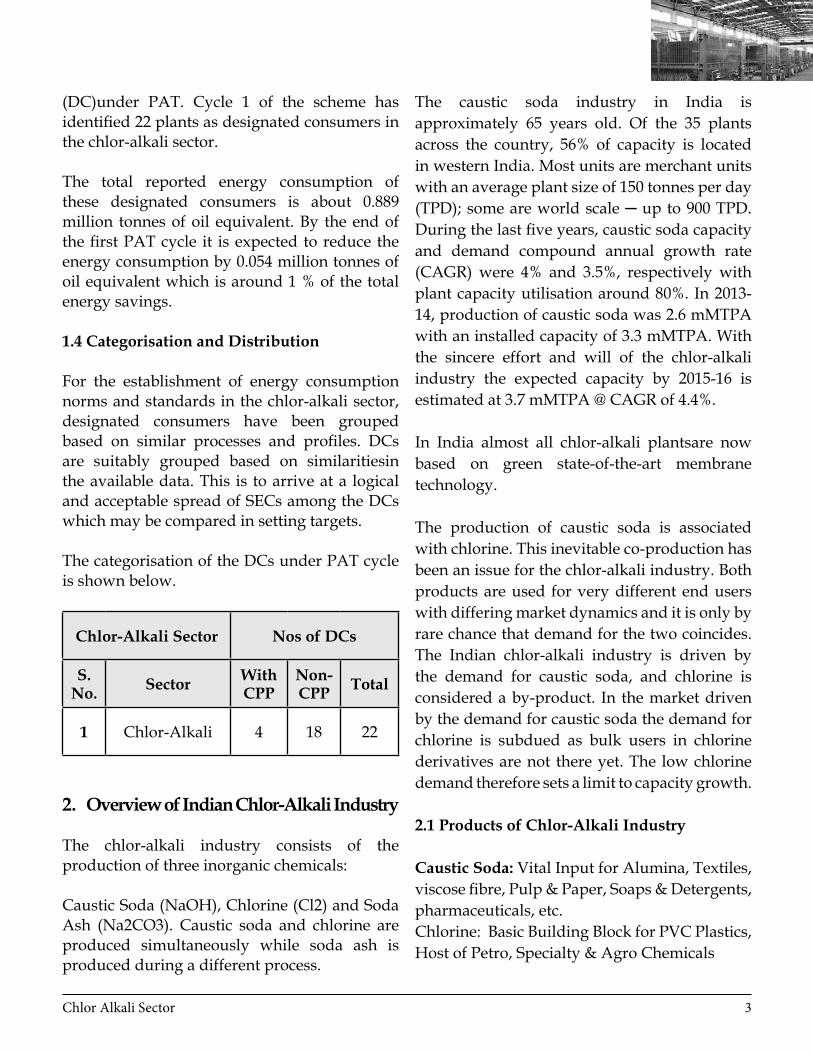
(DC)under PAT. Cycle 1 of the scheme has identified 22 plants as designated consumers in the chlor-alkali sector.
The total reported energy consumption of these designated consumers is about 0.889 million tonnes of oil equivalent. By the end of the first PAT cycle it is expected to reduce the energy consumption by 0.054 million tonnes of oil equivalent which is around 1 % of the total energy savings.
1.4 Categorisation and Distribution
For the establishment of energy consumption norms and standards in the chlor-alkali sector, designated consumers have been grouped based on similar processes and profiles. DCs are suitably grouped based on similaritiesin the available data. This is to arrive at a logical and acceptable spread of SECs among the DCs which may be compared in setting targets.
The categorisation of the DCs under PAT cycle is shown below.
Chlor-Alkali Sector Nos of DCs
S. No. Sector With
CPPNon- CPP Total
1 Chlor-Alkali 4 18 22
2. Overview of Indian Chlor-Alkali Industry
The chlor-alkali industry consists of the production of three inorganic chemicals:
Caustic Soda (NaOH), Chlorine (Cl2) and Soda Ash (Na2CO3). Caustic soda and chlorine are produced simultaneously while soda ash is produced during a different process.
The caustic soda industry in India is approximately 65 years old. Of the 35 plants across the country, 56% of capacity is located in western India. Most units are merchant units with an average plant size of 150 tonnes per day (TPD); some are world scale ─ up to 900 TPD. During the last five years, caustic soda capacity and demand compound annual growth rate (CAGR) were 4% and 3.5%, respectively with plant capacity utilisation around 80%. In 2013-14, production of caustic soda was 2.6 mMTPA with an installed capacity of 3.3 mMTPA. With the sincere effort and will of the chlor-alkali industry the expected capacity by 2015-16 is estimated at 3.7 mMTPA @ CAGR of 4.4%.
In India almost all chlor-alkali plantsare now based on green state-of-the-art membrane technology.
The production of caustic soda is associated with chlorine. This inevitable co-production has been an issue for the chlor-alkali industry. Both products are used for very different end users with differing market dynamics and it is only by rare chance that demand for the two coincides. The Indian chlor-alkali industry is driven by the demand for caustic soda, and chlorine is considered a by-product. In the market driven by the demand for caustic soda the demand for chlorine is subdued as bulk users in chlorine derivatives are not there yet. The low chlorine demand therefore sets a limit to capacity growth.
2.1 Products of Chlor-Alkali Industry
Caustic Soda: Vital Input for Alumina, Textiles, viscose fibre, Pulp & Paper, Soaps & Detergents, pharmaceuticals, etc.Chlorine: Basic Building Block for PVC Plastics, Host of Petro, Specialty & Agro Chemicals

Chlor Alkali Sector4
2.2 Growth Drivers for Caustic Soda Industry
A. ALUMINA INDUSTRY
• Alumina Industry in India is strategically well placed and ranks seventh largest in the world with discernible growth plans and prospects for future. India’s primary aluminium consumption is expected to grow by 8%.
• India’s rich bauxite mineral base of “3,076 million tonnes” renders a competitive edge to the industry as compared to its global counterparts
• Aluminium demand is rapidly growing as its use is diversified and has wide applications in various areas such as transport, building and architectural sectors, packaging, food and chemical industries, electrical sector, machinery and equipment, consumer durables and also in defence sector and wagon making by Indian Railways, automobile industry, electrification and power infrastructure projects.
B. TEXTILE SECTOR
• Domestic consumption for Man Made Fibres to grow @ CAGR 9% in next one decade.
• Textile fibre per capita consumption of 4-5kg in India as compared to 11.5kg globally indicates huge potential for textile fibres demand and thus growth of textile industry is evident.
• Demand for polyester and viscose fibre/yarns growing especially in technical and home textiles.
• Exports grew @ 15% YOY in 2013. Increasing exports are based on demand inthe US and Europe with accelerated growth in their economy besides incentives from the Indian government.
2.3 Chlorine Derivatives and Their Growth In India
• Globally, caustic chlorine industry is driven by demand-supply of chlorine; however, in India, the key demand driver is caustic soda.
• There is an urgent need to promote chlorine derivatives industry; a vibrant bulk chlorine consuming petro-chemical industry is needed to use surplus chlorine, in products like PVC, Chloro-Methanes/HCFC/PTFE, Propylene Oxide/Glycol, Epichlorohydrin, Polycarbonates, TDI/MDI, TiO2, DCP,CaCl2, etc.
• There is enormous potential to produce chlorine compounds by utilising surplus chlorine. India can be a manufacturing base to meet regional demands. A huge surge in demand is expected from the rapid shift of almost 50% of the population (over 600 million) to middle and upper middle classesand their urge to spend. India’s per capita chlorine consumption is around 1.85kgs against Germany’s 55kg, US’s 45kg, China’s 13kg and Brazil’s 7.8kg.
• The issue in India is that most plants are merchant units; integrated plants with downstream chlorine derivatives only 41% of capacity. There is a need to promote integration of units with chlorine derivatives production and also to minimise transportation risks.

Chlor Alkali Sector 5
• There is also a need to promote widespread chlorine usage for disinfection of drinking water.
2.4 Journey towards Improved Safety, Health & Environment, Green Manufacturing and Sustainable Growth
A. SAFETY COMPLIANCE
• Safety is a high priority area for Alkali Manufacturers’ Association of India (AMAI); the Safety Health and Environment (SHE) Committee formed in November 2008, to encourage adoption of best safety practices, bring in responsible care, address issues on climate change, and the like.
• The industry conducts hazard and operability (HAZOP) and hazard identification (HAZID) studies, onsite and offsite.It makes plans for emergencies, carries out periodic safety audits, safety workshops, regular training programmes on safe handling of chlorine for plant operators, transporters, drivers, consumers, support staff, etc.
• The industry is acquiring quality, environment, safety, health and energy management system certifications ─ almost 100% units have ISO 9001 & ISO 14001, 70% have OHSAS 18001, and some units also have SA 8000 & ISO 50001 certification.
• The entire industry is signatory to World Chlorine Council (WCC) safety commitment and represented at the Global Safety Team of WCC.
2.5 Environment Management through Green Manufacturing
A. USE OF CLEAN ENERGY
• Hydrogen is a by-product in the process of making caustic soda, which proves to be a boon for the industry. Promotion on gainful use of hydrogen has led to almost 90% utilisation as fuel in flakes plants, in boilers and as sale as compressed hydrogen.
B. WATER CONSERVATION AND LONG TERM VISION TO ACHIEVE ZERO EFFLUENT DISCHARGE
• The industry is working towards Zero Effluent Discharge Mission and recycle the entire liquid effluents generated within a plant
• Units have installed RO plants to recycle water recovered from liquid effluents back to the system and use reject water for toilets, gardening, hydrant systems, etc.
C. RE-USE OF FLY ASH AND BRINE SLUDGE :
• Brine sludge from membrane plants is non-hazardous— it is used to make construction bricks/blocks.
• The fly ash generated is reused in in coal based captive power plants. Over 60% of the fly ash generated today is being utilised gainfully.
Chlor Alkali Sector6
D. TECHNOLOGICAL SUSTAINABILITY
• Today almost the entire Indian chlor alkali industry is based on membrane cell technology, achieved throughCREP(Corporate Responsibility for Environmental Protection) voluntary agreement with
Government of India and proactive approach of the industry.
• Continuous adoption of advanced generation of cells and newly developed most energy efficient membranes, improved coating of electrodes, advanced materials of construction, etc., ensures a “state-of-the-art” industry.
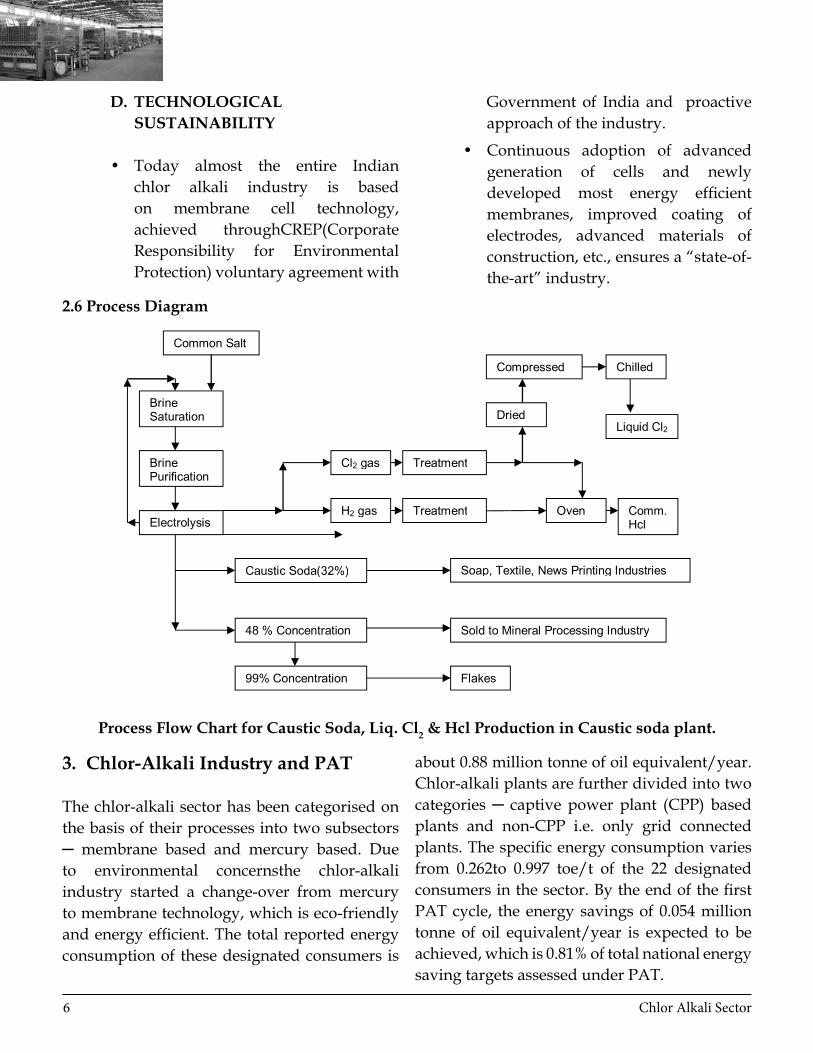
2.6 Process Diagram
Process Flow Chart for Caustic Soda, Liq. Cl2 & Hcl Production in Caustic soda plant.
3. Chlor-Alkali Industry and PAT
The chlor-alkali sector has been categorised on the basis of their processes into two subsectors ─ membrane based and mercury based. Due to environmental concernsthe chlor-alkali industry started a change-over from mercury to membrane technology, which is eco-friendly and energy efficient. The total reported energy consumption of these designated consumers is
about 0.88 million tonne of oil equivalent/year. Chlor-alkali plants are further divided into two categories ─ captive power plant (CPP) based plants and non-CPP i.e. only grid connected plants. The specific energy consumption varies from 0.262to 0.997 toe/t of the 22 designated consumers in the sector. By the end of the first PAT cycle, the energy savings of 0.054 million tonne of oil equivalent/year is expected to be achieved, which is 0.81% of total national energy saving targets assessed under PAT.

Chlor Alkali Sector 7
3.1 Status of Designated Consumers
Threshold limit for becoming a DC = 12,000 tonnes of oil equivalent (toe) per annumTotal number of identified DCs = 22 Estimated Energy Consumption = 884,949 tonne of Oil Equivalent (toe)
3.2 General Rules for Establishing Baseline Values
3.2.1 Definitions
1. Baseline Year: Baseline year is declared as 2009-10.
2. Baseline Period: Baseline period is declared as 2007-08, 2008-09 & 2009-10
3. Baseline Production (Pbase):The arithmetic average of Production figures of 2007-08, 2008-09 and 2009-10
4. Baseline Specific Energy Consumption (SECbase): The arithmetic average of SEC figures of 2007-08, 2008-09 and 2009-10
5. Baseline Capacity Utilisation in % (CUbase)
6. The arithmetic average of CU figures of 2007-08, 2008-09 and 2009-10
3.2.2. Data Consideration
1. In case of plants more than 5 years old, data for the last 3 financial years will be considered provided the CU is uniform. Data for the financial year where capacity utilisation is less that 70%,will be excluded.
2. In case of plants more than 5 years old and with less than 3 years of data, the same will be considered provided the CU is uniform. If the CU is abnormally low (less than 70%)in any of the years, the same will not be considered. However, if all the 3 years show low and uniform capacity utilisation, the data for all the years may be considered.
3. In case of plants less than 5 years old and with less than 3 years of data, the available year’s (or years’) data will be considered provided the CU is uniform. If the CU is abnormally low (less than 70%)in any of the years, the same will not be considered.
4. In case of new plants, (provided data is available minimum for one complete year) the data would be considered for the years where the CU is greater than 70%. If data is reported for only one year, the same will be considered irrespective of the CU.
3.2.2 Grouping of DCs
DCs are suitably grouped based on similar characteristics with the available data. This is to arrive at a logical and acceptable spread of SECs among the DCs which may be compared in target setting approach. For Chlor Alkali Sector, the following groupings are done:

Chlor Alkali Sector8
3.2.3 Estimation of Gate-to-Gate SEC in Base Year:
1. Gate to Gate SEC (Specific Energy Consumption) Calculation:
a To calculate total energy consumed, conversion of all forms of energy to tonne of oil equivalent (toe) has been done as follows:
i) The imported electricity from Grid (Million kCal) = Million kWh*860 kCal/kWh
ii) For Solid fuels (Indian Coal, Imported Coal, lignite etc.) = Amount used in power generation + process (tonne)*Gross Calorific Value of the fuel (kCal/kg)*1000/10^6 iii) For Liquid fuels (HSD, LDO,LSHS, FO etc.) = Amount used in power
generation + process (kL)*Average Density (kg/ltr)*Gross Calorific Value of the fuel (kCal/ kg)*1000/10^7 iv) For Gaseous fuel (CNG, LPG, Hydrogen etc.) = Amount used in power generation + process (Million SCM)*Gross Calorific Value of the fuel (kCal/SCM) v) For Steam = Amount used in process (Tonne)*Enthalpy of Steam (kCal/SCM)*1000/ 10^6 vi) Energy Input (toe) = {Adding point (i+ii+iii+iv+v) – Electricity Exported to Grid*2717 kCal / kwh} /10 Note: Hydrogen has been taken as source of energy for Calculating SEC and Enthalpy of Steam is taken as 660 kCal/kg or as reported by plant.

Chlor Alkali Sector 9
b. Calculation of Equivalent Caustic Soda:
In Chlor-Alkali Industry various products are manufactured but in PAT Cycle-1 only four major energy intensive products are considered and thus following factors have been developed to convert other product into Equivalent Caustic Soda:
Caustic Soda : 1.0 of Equivalent Caustic Soda
Liquefied Chlorine (T)
: 0.0615 of Equivalent Caustic Soda
Compressed Hydrogen (Lac NM3)(sold)
: 13.889 of Equivalent Caustic Soda
Caustic Soda Flakes (T)
: 0.219 of Equivalent Caustic Soda
Equivalent Caustic Soda (tonne) = CS on 100 % basis (tonne) + Liquefied Chlorine (tonne) *0.0615 + Compressed Hydrogen (Lac NM3)*
13.889 + Caustic Soda Flakes (tonne)* 0.219
c Correction factor for Membrane & Electrode Life: 60 kWh/tonne per year is added into Specific Energy Consumption in the baseline year for each plant. For example Let’s actual GtG SEC in Baseline Year= 0.707 toe/tonne Addition of 60 kWh per year: 60 kWh x 860 kCal x 3 years / 10^7 (Non-CPP) 60 kWh x 2717 kCal x 3 years / 10^7 (CPP)
Final Baseline SEC = Actual GtG SEC in Base line year + Correction Factor for ageing cell electrolyte (0.0155 for Non-CPP & 0.0489 for CPP)
So, Revised SEC in Baseline Year: 0.723 toe/tonne for Non-CPP 0.756 toe/tonne for CPP
d. The following conversions table is used to convert to equivalent MKcal
Parameter Multiplication Factor Remark (if otherwise not reported by plant)
Purchased Electricity (kWh) from Grid 860 kCal/kWh ---
Coal (kg) GCV as reported 3000 kCal/kg for Indian Coal5000 kCal/kg for Imported Coal
FO (kg) GCV as reported 10050 kcal/kg
HSD (kg) GCV as reported 11840 kcal/kg
LDO (kg) GCV as reported 10050 kCal/kg
FO (ltr) to FO(kg) Density as reported 0.96 kg/ltr
HSD(ltr) to HSD(kg) Density as reported 0.89 kg/ltr

Chlor Alkali Sector10
LDO(ltr) to LDO(kg) Density as reported 0.85 kg/ltr
Hydrogen GCV as reported 3050kcal/Nm3
Steam Calorific value as reported 660kcal/kg
Electricity (kwh) supplied to Grid from CPP 2717 kCal/kwh ----
3.2.4 Battery Limit
The following plant boundaries are considered in different sub-sectors of this sector as per the data reported by DCs
3.2.5 Target Setting
1. Sectoral target is allocated based on a pro-rata basis of total energy consumption in the Chlor Alkali sector among all the 8 sectors under PAT scheme.
2. Sub-Sectoral target is allocated based on a pro-rata basis of total energy consumption in the sub-sector among the total Chlor Alkali sector.
3. The DC level target is allocated based on a statistical analysis derived from ‘Relative SEC’ concept. This approach will be applicable to all the DCs of a sub-sector only.
4. Hydrogen as fuel, which would be countable in SEC calculation as addition fuel rather than waste energy.
5. Energy consumed in internal transportation was excluded.

Chlor Alkali Sector 11
Specific Energy Consumption and Targets- Chlor -Alkali
4. Normalisation and Calculation
Normalization factors for the following areas have been developed in Chlor-Alkali Sector.
1. Power Mix (Import & Export from/to the grid and self-generation from the captive power plant)
2. Fuel Quality in CPP & Cogen
3. Low PLF in CPP
4. Hydrogen Mix (consideration for reducing venting of Hydrogen)
5. Normalization Others
5.1 Environmental Concern
(Additional Environmental Equipment requirement due to major change in government policy on Environment)
5.2 Biomass / Alternate Fuel Unavailability
5.3 Construction Phase or Project Activities
5.4 Addition of New Line/Unit (In Process & Power Generation)
5.5 Unforeseen Circumstances
5.6 Renewable Energy
4.1 Power Mix Normalization methodology
• Power Sources and Import
The baseline year power mix ratio shall be maintained for the Assessment year also.
The Normalized Weighted Heat Rate calculated for the baseline year power mix ratio will be compared with the assessment year weighted heat rate and the Notional energy will be deducted from the Total energy assessed.
The Thermal Energy difference of electricity consumed in plant in baseline year and assessment year shall be subtracted from the total energy, considering the same % of power sources consumed in the baseline year.
However, any efficiency increase (i.e. reduction in Heat Rate) in Assessment year in any of the power sources will give benefit to the plant.

Chlor Alkali Sector12
• Power Sources and Export
In case of Power export, the plant will be given advantage or disadvantage by comparing the heat rate of CPP in assessment year with the baseline year and will be deducted the same
by taking the heat rate of 2717 kcal/kwh.
CPP Actual Net Heat Rate will be considered for the net increase in the export electricity from the baseline.
Power Mix Normalization Calculation
• Normalization for Power Sources
The Normalized Weighted Heat Rate of Plant for Assessment year (kcal/kwh) is given as:
Where, MU = Million kWh Mkcal = Million kcal BY = Baseline Year, AY = Assessment Year Power Source = Power from Grid, CPP, DG Set etc.
(Note: Any addition in the power source will attract the same fraction to be included in the above equation.)
The Electricity Consumption from WHR shall not be considered for Power Mix Normalization. Energy consumption from WHR in the assessment year (Mkcal) shall be subtracted from the total Energy Consumption of the Plant,

Chlor Alkali Sector 13
• Normalization for Power Export
The Net Heat Rate (NHR) of Captive Power Plant (CPP) shall be considered for the normalization of Export of Power from CPP. (Instead of 2717 kcal/kWh)
The Export Power Normalization would be
• Actual CPP heat rate would be considered for the net increase in the export of power from the baseline.
• The exported Energy will be normalized in the assessment year as following calculation:
Where, MU = Million kWh Mkcal = Million kcal AY = Assessment Year BY = Baseline Year
Documentation
a. Electricity Bills from Grid b. Energy Generation Report from CPP/DG/WHR/Co-Gen c. Power Export Bills from Grid and ABT Meter Reading d. Fuel Consumption Report [DPR, MPR, Lab Report] e. Fuel GCV Test Report- Internal and External (As received or As fired basis as per baseline methodology)
The Plant is compared with their operational efficiencies only in the Assessment year, hence keeping the energy consumption same in both the period, the performance has been assessed by changing the power source mix with change in export quantity from the baseline year

Chlor Alkali Sector14
Table: Production and Performance IndicatorsSr No Description Unit Baseline Year
[BY]Assessment Year [AY]
1 Caustic Soda Production Million Tonne 0.1 0.1
2 Thermal SEC for Equivalent Caustic Soda Production kcal/kg 5000 5000
3 Electrical SEC up to Caustic Soda kWh/Tonne 2500 2500
4 Total Thermal energy used in Process Million kcal 500000 500000
Table: Heat Rate of Power sourcesSr No Description Unit Baseline Year
[BY]Assessment Year [AY]
5 Grid heat rate kcal/kWh 860 860
6 Co-Gen heat rate kcal/kWh 2200 2200
7 DG heat rate kcal/kWh 2196 2196
8 Exported Power Heat rate kcal/kWh 2717 2717
The heat rates from all the power sources remain same in the assessment year for the purpose of developing normalization. However, the normalization calculation should be sensitive enough to accommodate any change in the heat rate w.r.t. the SEC of the Plant.
In the above table all the power sources in a plant are not considered, however for example purpose power sources like Grid import, Co-Gen and DG are considered the same has been replicated in the original normalization factors.
Table: Energy Data from Power SourcesSr No Description Unit Baseline Year
[BY]Assessment Year [AY]
9a Electricity imported from the grid Million kWh 50.00 55.00
9b Electricity generated from Co-Gen Million kWh 200.00 200.00
9c Electricity generated from DG Million kWh 5.00 10.00
10 Electricity exported to the grid Million kWh 5.00 15.00
11 Co-Gen generated Electricity Consumption within the plant Million kWh 195.00 185.00

Chlor Alkali Sector 15
The normalization calculation is to be developed to cater the change in power import and export. The above table shows the increase in exported power from 5 MU to 10 MU. The additional export power of 5MU is being generated from the Co-Gen. Hence power is generated with heat rate @ 2200 kcal/kwh, while power export is being taking place @ 2717 kcal/kwh. This difference in heat rate i.e., @ 517 kcal/kWh will be a advantageous proposition for the exporting plant. Since, the same is contributing in the plant Specific Energy Consumption. In this situation, the plant will consume less thermal energy [5MU @ (2200-2717) kcal /kWh] for same electricity consumption with in plant. Therefore the SEC of plant will decrease. This disadvantageous position to be normalized and
plant should not suffer with change in export power from the baseline year.
The electricity generated from WHR is not being considered in the total energy consumption of the plant for power mix normalization. Hence, it will be excluded from the Power Mix calculation in the Plant’s energy consumption itself. The power produced by WHR and exported has been subtracted from the total available electricity of power sources.
The generated electricity consumption in the plant from different power sources is being calculated after taking the exported electricity into account. The exported electricity is being deducted from the major generated electricity automatically.
Table: Plant Energy ConsumptionSr No Description Unit Baseline Year
[BY]Assessment Year [AY]
15 Thermal Energy Equivalent of Electricity Consumed Within Plant Million kcal 493979 509258
16 Grid Share of electricity consumption of plant Factor 0.20 0.22
17 Co-Gen Share of electricity consumption of plant Factor 0.78 0.74
18 DG Share of electricity consumption of plant Factor 0.02 0.04
19 Weighted Average heat rate of plant kcal/kWh 1932 1905
The share of energy has been taken from the plant electricity consumption excluding WHR generation and Power export. For Example- Grid share factor will be 15 MU /100 MU = 0.15 or 15% of the total electricity consumption of the plant.
The weighted heat rate is heat rate of different power sources in the baseline as well as in the assessment year. It is the summation of average of the multiplication of heat rate and generation.
Calculation for Heat Rate in the Baseline YearTotal Energy Consumed in Baseline
year = Energy consumed in process + (Grid Imported electricity X 860 kcal/kWh) + (Co-Gen generated electricity X Co-Gen heat rate) + (DG generated electricity X DG heat rate) – (Grid exported electricity X 2717 kcal/kwh) = 500000 + (50 *860) + (200*2200)+(5*2196) – (5*2717) =980394 million kcal

Chlor Alkali Sector16
Gate to Gate SEC in the baseline year = Total energy consumed in baseline year/ (Equivalent Caustic Soda production *1000) = 980394/ (0.1 *10^7) = 0.980 toe/tonne of eq. Caustic Soda
The change in assessment year in the power has been observed as
• Grid import decreased from 50 MU to 55 MU
• Grid export increased from 5 MU to 10 MU
• Plant electricity consumption from Co-Gen increased from 195 MU to 185 MU
• Co-Gen Generation remains constant at 200 MU
If plant decreases the use of electricity from Co-Gen generation (10MU @2200kcal/kWh) and increases the import power from grid (5MU @ 860 kcal/ kWh). In this condition, the plant will consume less thermal energy [5MU @ (2200-860) kcal /kWh] for same electricity consumption with in plant. Therefore the SEC of plant will decrease. Without normalization in the Assessment year, the plant will get advantage as per following calculation
Total Energy Consumed in Assessment year would have been without Normalization
= Energy consumed in process + (Grid Imported electricity X 860 kcal/kWh) + (Co-Gen generated electricity X Co-Gen heat rate) + (DG generated electricity X DG heat rate) – (Grid exported electricity
X 2717 kcal/kwh)= 500000 + (55 x 860) + (200x2200) + (10x2196) – (15x2717)= 968505 million kcal= 968505/ (0.1 x 10^7)= 0.9685 toe/tonne of eq. Caustic Soda
Gate to Gate SEC in the baseline year
= Total energy consumed in baseline year/ (Equivalent Caustic Soda production*1000)= 980395/ (0.1 x10^7)= 0.980 toe/tonne of eq. Caustic Soda
It may be concluded that the plant will be on the advantageous side and enjoy a gain of 0.980 - 0.9685 = 0.0115 toe/ton of eq. Caustic Soda only by increasing grid import and export power.
This affect will be nullified through normalization in Power source mix and Power exports as per following calculation
1. For Power Source Mix: The additional imported electricity in assessment year as compared to baseline year calculated with the Co-Gen heat rate [5MU @ (2200-860) kcal/kWh=6700 Million kcal] will also be added to total energy of the plant
2. For Power Export: The additional exported electricity in assessment year as compared to baseline year calculated with the actual Co-Gen heat rate [5MU x (2200-2717) kcal/kWh= -2585 Million kcal] will also be subtracted from total energy of the plant

Chlor Alkali Sector 17
The above effect takes place for single power source and power export. There could be multiple power sources in any plant, hence effective calculation could be evaluated through normalizing and maintaining the same share of source in the assessment year, maintained in the baseline year as per following equation
Normalized Weighted Average heat rate of plant in assessment year
= Grid Share of electricity consumption in baseline year X Grid heat rate + Co-Gen Share of electricity consumption in baseline year X Co-Gen heat rate + DG Share of electricity Consumption in baseline year X DG heat rate= 0.220 *860 + 0.740* 2200 + 0.040*2196 = 1905.03 kcal/kWh
The Normalised weighted heat rate then subtracted to the weighted heat rate of the plant for assessment year to get the net increase or decrease in combined weighted heat rate. The same would be multiplied with the plant electricity consumption for Normalisation as per following equation
Notional energy added in total energy due change in power source mix
= Total electricity consumed within plant X (Normalized Wt. Average heat rate – Wt. Average heat rate of plant in assessment year)= 250*(1931.92 – 1905.03)=6722.5 million kcal
Similarly, for power export normalization, actual heat rate of the Co-Gen for calculating the exported electricity from
the plant, since the same was calculated @2717 kcal/kwh in the baseline year, hence the equation has been derived by taking into the consideration of baseline export electricity also as per following formulae
Notional energy for exported electricity to grid subtracted from total energy = (Exported electricity in Assessment year – Exported electricity in Baseline year) X (Co-Gen heat rate in Assessment year -2717 kcal/kWh)= (15-5)* (2200-2717)= -5170 million kcal
If exported power goes down in the assessment year w.r.t. baseline year: In the baseline year; the exported power is taken as 2717 kcal/kwh, which is greater than the Co-Gen heat rate. The difference in the heat rate is then multiplied with the exported power automatically gets added in the total energy consumption of Plant in the base line year.
Now in the assessment year, if the exported power goes down in comparison to the baseline values, the same quantity of energy which was added in the baseline year shall be added in the total energy consumption of the Plant. By doing this, the SEC of Plant remains same for equal condition for all situations.
The situation in terms of SEC of the plant remains unchanged if the energy of exported power would have been subtracted in the baseline year so as in the assessment year. This situation is matched in the assessment year by Power normalizations.

Chlor Alkali Sector18
Total Energy Consumed in Assessment year
= Energy consumed in process + (Grid Imported electricity X 860 kcal/kWh) + (Co-Gen generated electricity X Co-Gen heat rate) + (DG generated electricity X DG heat rate) – (Grid exported electricity X 2717 kcal/kWh) + Notional Energy for Power mix - Notional Energy for exported electricity to grid
= 500000 + (55 *860) + (200*2200) + (10*2196) – (15*2717) + 6722.5 – (-5170)= 980395 million kcal
Gate to Gate SEC in the assessment year
= Total energy consumed in assessment year/ (Equivalent Chlor-Alkali production*1000)= 980395/ (0.1 *10^7)= 0.980 toe/tonne of eq. Caustic Soda
Table: SEC in Baseline and Assessment yearSr No Description Unit Baseline Year
[BY]Assessment Year [AY]
20 Notional Energy for Power Mix Mkcal 0.00 6722.50
21 Notional Energy for Exported Electricity to Grid Mkcal 0.00 -5170.00
22 Total Energy Consumed Mkcal 980395 980395
23 SEC Toe/Tonne 0.980 0.980
After Normalisation in assessment year with power source mix and power export, the Gate-to-Gate Energy stand at 0.980 toe/tonne of eq. Caustic Soda, which is equivalent to baseline SEC. Benefit of increasing efficiency in Co-Gen
If a plant increases its efficiency i.e., decreased its heat rate from 2200 kcal/kwh to 2100 kcal/kwh in the assessment year, the Specific Energy Consumption of the Plant will come down as per the equation discussed above.
Table: Heat Rate of Power sources- Co-Gen Heat Rate decreasedSr No Description Unit Baseline Year
[BY]Assessment Year [AY]
11 Grid heat rate kcal/kWh 860 860
12 Co-Gen heat rate kcal/kWh 2200 2100
13 DG heat rate kcal/kWh 2196 2196
14 Exported Power Heat rate kcal/kWh 2717 2717

Chlor Alkali Sector 19
Table: Plant energy ConsumptionSr No Description Unit Baseline Year
[BY]Assessment Year [AY]
15 Thermal Energy of Electricity Consumed Within Plant Million kcal 493979 489260
16 Grid Share of electricity consumption of plant Factor 0.20 0.20
17 Co-Gen Share of electricity consumption of plant Factor 0.78 0.78
18 DG Share of electricity consumption of plant Factor 0.02 0.02
19 Wt. Average heat rate of plant Kcal/kWh 1932 1854
Table: SEC Sr No Description Unit Baseline Year
[BY]Assessment Year [AY]
20 Notional Energy for Power Mix Mkcal 0.00 -5712
21 Notional Energy for Exported Electricity to Grid Mkcal 0.00 -6170
22 Total Energy Consumed Mkcal 980395 960393
23 SEC Toe/Tonne 0.980 0.960
The SEC has been decreased with the decrease in Heat Rate of Co-Gen as stated in the above table.
4.2 Fuel Quality Normalization (Quality of Coal in CPP & Co-Gen)
Coals are extremely heterogeneous, varying widely in their content and properties from country to country, mine to mine and even from seam to seam. The principle impurities are ash-forming minerals and sulphur. Some are interspersed through the coal seam; some are introduced by the mining process, and some principally organic sulphur, nitrogen and some minerals salts.
These impurities affect the properties of the coal and the combustion process, therefore the plant’s boiler efficiency & Turbine Efficiency. The generating companies have no control over the quality of coal supplied. The raw coal mainly being supplied to the power stations could have variation in coal quality. Further, imported coal is also being used and blended with Indian coal by large number of stations, which could also lead to variations in coal quality.

Chlor Alkali Sector20
Table: Fuel QualitySr No
Sub-Group
Elements Reason/ Requirement
Impact Documents
3 Coal Use of coal with different calorific value in AY and BY
Coal quality is beyond the control of plant
Boiler Efficiency, Auxiliary Power Consumption
Fuel Quality and Quantity documentation, Energy consumption of mills in AY and BY
Gas Use of Gas with different calorific value in AY and BY
Gas quality may be compromised due to limited availability
Net Heat Rate Fuel Quality and Quantity documentation
The methodology should have provisions to take care of the impact of variations in coal quality. Therefore, average “Ash, Moisture, Hydrogen and GCV” contents in the coal during the baseline period as well as for assessment year is considered for Normalization and the correction factor has been worked out based on the following boiler efficiency formula:
Boiler Efficiency = 92.5 - [50 * A + 630 (M + 9 H)] G.C.V
Where:
A = Ash percentage in coalM = Moisture percentage in coal H = Hydrogen percentage in coal G.C.V = Gross calorific value in kcal/kg
Station Unit Heat Rate (Kcal/kWh) = Turbine heat rate/Boiler efficiency
Fuel Quality Normalization
Change in coal GCV, moisture%, Ash% affect the properties of the coal and the combustion process, resulting in loss/gain in the plant’s boiler efficiency. To compensate for the change in efficiency of boiler with change in coal quality, the energy loss to be subtracted from the Total Energy consumption
The plant/generating companies have no control over the quality of coal supplied, with Coal Linkage agreements.
Further, variation in mix of imported coal with Indian coal could also lead to variations in coal quality. The normalization factor shall take care of the impact of variations in coal quality
The Coal quality have impact on Boiler Efficiency of a captive Power Plant, with decrease in coal quality the efficiency of boiler will also decrease and hence the gross heat rate of CPP will also decease as per above formulae.

Chlor Alkali Sector 21
Pre-Requisite
The Proximate and Ultimate analysis of coal for baseline should be available to compare the same with the assessment year
In case of unavailability of Ultimate analysis of coal in baseline year, the %H will be taken constant for baseline year as per assessment year data.
Coal Quality Normalization Methodology
The Boiler Efficiency will be calculated for the baseline as well as for assessment year with the help of Coal quality analysis constituents like GCV, %Ash, %Moisture, %H and Boiler Efficiency Equation provided to calculate the Boiler efficiency.
Hence, by keeping the Turbine heat rate constant for both the years, the CPP heat hate will be calculated for the respective year
Normalization Formula
a. For CPP1. Boiler efficiency in baseline year=
92.5-[{50xA+630 (M+9H)} / GCV]2. Boiler efficiency in assessment year=
92.5-[{50xA+630 (M+9H)} / GCV]3. The CPP heat rate in assessment year
due to fuel quality-----(i)4. = CPP heat rate in baseline year x
(Boiler Efficiency in baseline year / Boiler Efficiency in assessment year)(kcal/kWh)
5. Increase in the CPP heat rate of assessment year due to fuel quality =
(i) - Actual CPP heat rate in Baseline Year
Notional energy to be subtracted from total energy (Million kcal) = CPP generation in assessment year X increase in CPP heat rate
b. For Co-Gen
1. Boiler efficiency in baseline year = 92.5-[{50xA+630 (M+9H) } /GCV]
2. Boiler efficiency in assessment year = 92.5-[{50xA+630 (M+9H)} /GCV]
3. Weighted Percentage of Coal Energy Used in steam Generation (Process Boiler) in BY= {∑5
n=1 (Operating Capacity of all Boilers used for Steam generation in TPH x Percentage of Coal Energy Used in steam Generation in all the boilers for Steam generation in %) / ∑5
n=1Operating Capacity of all Boilers used for Steam generation}
4. Weighted Percentage of Coal Energy Used in steam Generation (Process Boiler) in AY
= {∑5n=1 (Operating Capacity of all
Boilers used for Steam generation in TPH x Percentage of Coal Energy Used in steam Generation in all the boilers for Steam generation in %) /∑5
n=1 Operating Capacity of all Boilers used for Steam generation}
5. Weighted Percentage of Coal Energy Used in steam Generation (Co-Gen Boiler) in BY
= {∑10n=6 (Operating Capacity of all
Boilers used for Steam generation in TPH x Percentage of Coal Energy Used in steam Generation in all the

Chlor Alkali Sector22
boilers for Steam generation in %) / ∑10
n=6 Operating Capacity of all Boilers used for Steam generation}
6. Weighted Percentage of Coal Energy Used in steam Generation (Co-Gen Boiler) in AY
= {∑10n=6 (Operating Capacity of all
Boilers used for Steam generation in TPH x Percentage of Coal Energy Used in steam Generation in all the boilers for Steam generation in %) / ∑10
n=6 Operating Capacity of all Boilers used for Steam generation}
7. Weighted Average Specific Steam Consumption in BY & AY (kcal/kg of Steam) =
∑5n=1 (Total Steam Generation at
Process Boiler x Specific Energy Consumption for Steam Generation in Process Boilers) + ∑10
n=6 (Total Steam Generation at Co-Gen Boiler x Specific Energy Consumption for Steam Generation in Co-Gen Boiler)} / ∑10
n=1 Total Steam generation at all the boilers
8. Normalized Specific Energy Consumption for Steam Generation (kcal/kg of Steam) = Weighted Average Specific Steam Consumption in BY x (Boiler efficiency at BY/Boiler Efficiency at AY) 9. Difference Specific Steam from BY to AY (kcal/kg of Steam) = Normalized Specific Energy Consumption for Steam Generation in AY - Weighted Average Specific Steam Consumption in BY 10. Energy to be subtracted w.r.t. Fuel Quality in Co-Gen (Million kcal) = Difference Specific Steam from BY to AY x {(Total Steam Generation at Process Boiler in AY x Weighted Percentage of Coal Energy Used in steam Generation (Process Boiler) in AY)+( Total Steam Generation at
Co-Gen Boiler in AY x Weighted Percentage of Coal Energy Used in steam Generation (Co-Gen Boiler) in AY)}/1000
Where: A: Ash in % M= Moisture in % H= Hydrogen in % GCV:CoalGrossCalorificValueinkcal/kwh AY = Assessment year BY = Baseline Year CPP=CaptivePowerPlant TPH=Tonne per Hour
Normalization Calculation
Therefore,
Documentation
Fuel Linkage AgreementOperating Coal Quality- Monthly
average of the lots (As Fired Basis), Test Certificate for Coal Analysis including Proximate and Ultimate analysis (Sample

Chlor Alkali Sector 23
Test from Government Lab for cross verification)
Performance Guarantee Test (PG Test) or Report from Original Equipment Manufacturer (OEM) Design /PG test Boiler Efficiency documents
Design/PG Test Turbine Heat Rate documents
Note on Proximate and Ultimate Analysis of Coal
If the ultimate analysis has not been carried out in the baseline year for getting H% result, following conversion formulae from Proximate
to Ultimate analysis of coal could be used for getting elemental chemical constituents like %H.
Relationship between Ultimate and Proximate analysis is given below:%C = 0.97C+ 0.7(VM+0.1A) – M (0.6-0.01M)%H2= 0.036C + 0.086 (VM -0.1xA) - 0.0035M2 (1-0.02M)%N2= 2.10 -0.020 VM
WhereC= % of fixed carbonA= % of ashVM= % of volatile matterM= % of moisture
Sr No. Description Units Baseline Year [BY] Assessment Year [AY]
1 CPP Generation Lakh kWh 1721 1726
2 Actual CPP Heat Rate kcal/kWh 3200 3250
3 Ash % 42 39
4 Moisture % 18 18
5 Hydrogen % 5 5
6 GCV kcal/kg 3500 3200
Boiler efficiency in baseline year=92.5-[{50xA+630 (M+9H)} /GCV]=92.5 – [{50 x 42 + 630 x (18+9x5)} / 3500]=80.56 %
Boiler efficiency in assessment year=92.5-[{50xA+630 (M+9H)} /GCV]=92.5 – [{50 x 39 + 630 x (18+9x5)} / 3200]=79.4875 %
The CPP heat rate in assessment year due to fuel quality= CPP heat rate in baseline year x (Boiler
Efficiency in baseline year / Boiler Efficiency in assessment year)=3200 x (80.56/79.4875)=3243.17 kcal/kWh
Increase in the CPP heat rate of assessment year due to fuel quality=3247.17 – 3200=43.17 kcal/kWh
Notional energy to be subtracted from total energy= (CPP generation in assessment year

Chlor Alkali Sector24
(Lakh kWh) * Increase in CPP heat rate)/10= (1726x47.17)/10 Million kcal=7452.2811 Million kcal
Note on Proximate and Ultimate Analysis of CoalIf the ultimate analysis has not been carried out in the baseline year for getting %H result, following conversion formulae from Proximate to Ultimate analysis of coal could be used for getting elemental chemical constituents like %HRelationship between Ultimate and Proximate analysis
%C = 0.97C+ 0.7(VM+0.1A) - M(0.6-0.01M) %H2= 0.036C + 0.086 (VM -0.1xA) - 0.0035M2(1-0.02M) %N2=2.10 -0.020 VM
WhereC=%offixedcarbonA=% of ash VM=% of volatile matter M=% of moisture
Normalization Coal Quality in Co-Gen
Boiler efficiency in baseline year=92.5-[{50xA+630 (M+9H)} /GCV]
=92.5 – [{50 x 42 + 630 x (18+9x5)} / 3500]
=80.56 %
Boiler efficiency in assessment year=92.5-[{50xA+630 (M+9H)} /GCV]
=92.5 – [{50 x 39 + 630 x (18+9x5)} / 3200]
=79.48 %
The steam may be generated in the plant from Co-Gen Boilers and Process Boilers sources. However, for example purpose two Co-Gen boilers and two Process Boilers are considered. The calculation was done w.r.t. the weighted value of Cogen and Process boilers separately. The same will be reflected for all the Co-Gen and Process Boilers.
Due to degradation of coal quality in the assessment year the SEC will increase which is disadvantage to plant, as the quality of coal is not in control of plant therefore the difference in the SEC due to fuel quality is considered in Normalization.
As the boilers may use multi – fuels as input for producing steam and it may be noted that the normalization is provided only for the coal used in the boiler. In this context, percentage of coal energy used is considered in the Normalization.As the boilers may use multi – fuels as input for producing steam, the provision is provided for 4 types of fuels. If the types of fuels are more than 4 the rest of the fuels should be converted to equivalent of fuel type-4. Details of Co-Gen Boiler – 1.
For Co-Gen Boiler (1)
S.no Description UnitsBase Line Year (BY)
Assessment Year (AY)
(i) Type

Chlor Alkali Sector 25
(ii) Rated Capacity TPH 50.0 50.0
(iii) Total Steam Generation Tonne 321669.0 291836.0
(iv) Running hours Hrs 8411.0 7892.0
(v) Coal Consumption Tonne 37752.0 46701.0
(vi) GCV of Coal kcal/kg 4838.0 4649.0
(vii) Type of Fuel - 2 Name : Consumption Tonne 19801.0 16861.0
(viii) GCV of any Fuel -2 kcal/kg 3200.0 3200.0
(ix) Type of Fuel - 3 Name : Consumption Tonne 18533.0 42130.0
(x) GCV of any Fuel -3 kcal/kg 2000.0 2000.0
(xi) Type of Fuel - 4 Name : Consumption Tonne 3417.0 0.0
(xii) GCV of any Fuel -4 kcal/kg 12064.0
(xiii) Operating Capacity TPH38.2 37
(xiv) Specific Energy Consumption kcal/kg of Steam1008.2 1217.6
(xv) Percentage of Coal Energy Used in steam Generation %
0.56 0.61
Specific Energy Consumption for Steam Generation Boiler (Co-Gen Boiler -1) in BY= [(Coal Consumption (Tonne) * GCV of Coal (kcal/kg)) + (Type of Fuel – 2(Tonne) * GCV of Fuel – 2(kcal/kg)) + (Type of Fuel – 3(Tonne) * GCV of Fuel – 3(kcal/kg)) + (Type of Fuel – 4(Tonne) * GCV of Fuel – 4(kcal/kg))] / [(Total Steam Generation (Tonne))]= [(37752*4838) + (19801*3200) + (18533*2000) + (3417*12064)]/321669= 1008.2 kcal/kg of Steam
Percentage of Coal Energy Used in steam Generation (Co-Gen Boiler – 1) in BY
= [(Coal Consumption (Tonne) * GCV of Coal (kcal/kg))]/ [(Coal Consumption (Tonne) * GCV of Coal) + (Type of Fuel – 2 (Tonne) * GCV of Fuel – 2 (kcal/kg)) + (Type of Fuel – 3 (Tonne) * GCV of Fuel – 3 (kcal/kg)) + (Type of Fuel – 4 (Tonne) * GCV of Fuel – 4 (kcal/kg))]= [(37752*4838)] / [(37752*4838) + (19801*3200) + (18533*2000) + (3417*12064)]= 0.56
Specific Energy Consumption for Steam Generation Boiler (Co-Gen Boiler -1) in AY= [(Coal Consumption (Tonne) * GCV of Coal (kcal/kg)) + (Type of Fuel – 2

Chlor Alkali Sector26
(Tonne) * GCV of Fuel – 2 (kcal/kg)) + (Type of Fuel – 3 (Tonne) * GCV of Fuel – 3 (kcal/kg)) + (Type of Fuel – 4 (Tonne) * GCV of Fuel – 4 (kcal/kg))] / [(Total Steam Generation (Tonne))]= [(46701*4649) + (16861*3200) + (42130*2000)]/ 291836= 1217.6 kcal/kg of Steam
Percentage of Coal Energy Used in steam Generation (Co-Gen Boiler – 1) in AY
= [(Coal Consumption (Tonne) * GCV of Coal (kcal/kg))]/ [(Coal Consumption (Tonne) * GCV of Coal (kcal/kg)) + (Type of Fuel – 2 (Tonne) * GCV of Fuel – 2 (kcal/kg)) + (Type of Fuel – 3 (Tonne) * GCV of Fuel – 3 (kcal/kg)) + (Type of Fuel – 4 (Tonne) * GCV of Fuel – 4 (kcal/kg))]= [(46701*4649)]/ [(46701*4649) + (16861*3200) + (42130*2000)]= 0.61
Details of Co-Gen Boiler – 2.
For Co-Gen Boiler (2)
S.no Description UnitsBase Line Year (BY)
Assessment Year (AY)
(i) Type
(ii) Rated Capacity TPH 60.0 60.0
(iii) Total Steam Generation Tonne 351689.0 331846.0
(iv) Running hours Hrs 8411.0 8416
(v) Coal Consumption Tonne 38752.0 38701.0
(vi) GCV of Coal kcal/kg 4838.0 4649.0
(vii) Type of Fuel - 2 Name : Consumption Tonne 18911.0 26891.0
(viii) GCV of any Fuel -2 kcal/kg 3200.0 3200.0
(ix) Type of Fuel - 3 Name : Consumption Tonne 19533.0 33130.0
(x) GCV of any Fuel -3 kcal/kg 2000.0 2000.0
(xi) Type of Fuel - 4 Name : Consumption Tonne 3417.0 936.0
(xii) GCV of any Fuel -4 kcal/kg 12064.0 12064.0
(xiii) Operating Capacity TPH 41.812 46.55
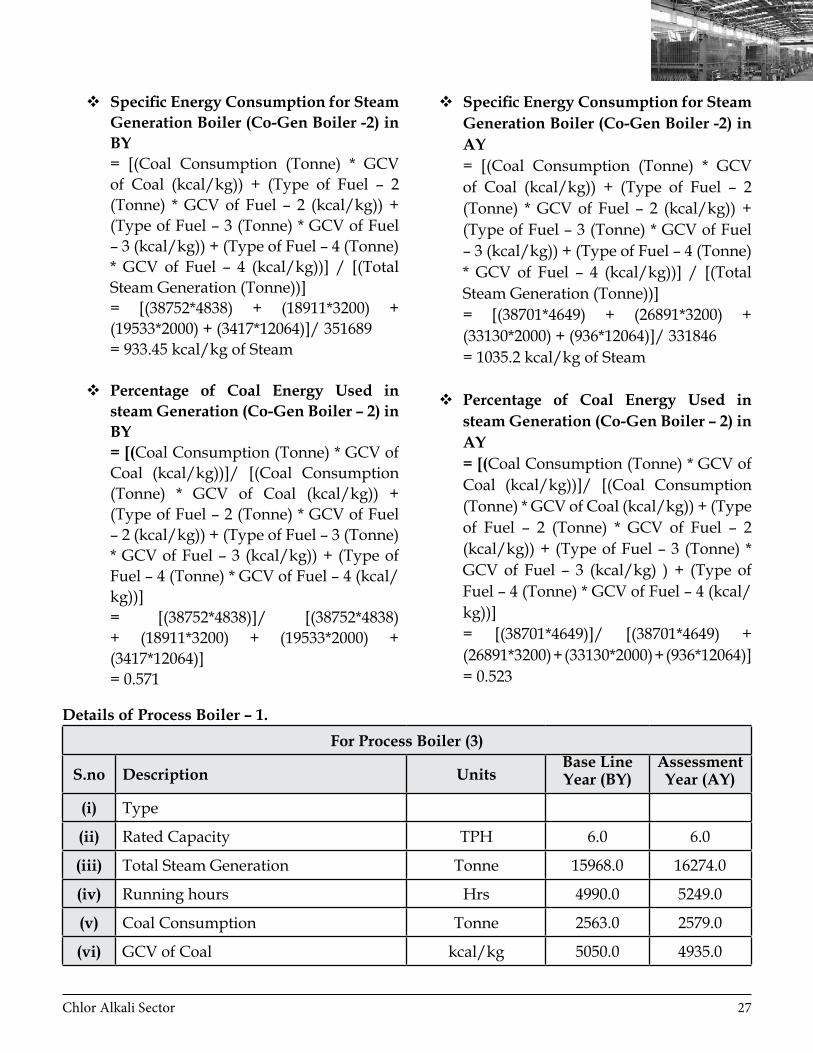
(xiv) Specific Energy Consumption kcal/kg of Steam 933.45 1035.2
(xv) Percentage of Coal Energy Used in steam Generation % 0.571 0.523
Chlor Alkali Sector 27
Specific Energy Consumption for Steam Generation Boiler (Co-Gen Boiler -2) in BY= [(Coal Consumption (Tonne) * GCV of Coal (kcal/kg)) + (Type of Fuel – 2 (Tonne) * GCV of Fuel – 2 (kcal/kg)) + (Type of Fuel – 3 (Tonne) * GCV of Fuel – 3 (kcal/kg)) + (Type of Fuel – 4 (Tonne) * GCV of Fuel – 4 (kcal/kg))] / [(Total Steam Generation (Tonne))]= [(38752*4838) + (18911*3200) + (19533*2000) + (3417*12064)]/ 351689= 933.45 kcal/kg of Steam
Percentage of Coal Energy Used in steam Generation (Co-Gen Boiler – 2) in BY= [(Coal Consumption (Tonne) * GCV of Coal (kcal/kg))]/ [(Coal Consumption (Tonne) * GCV of Coal (kcal/kg)) + (Type of Fuel – 2 (Tonne) * GCV of Fuel – 2 (kcal/kg)) + (Type of Fuel – 3 (Tonne) * GCV of Fuel – 3 (kcal/kg)) + (Type of Fuel – 4 (Tonne) * GCV of Fuel – 4 (kcal/kg))]= [(38752*4838)]/ [(38752*4838) + (18911*3200) + (19533*2000) + (3417*12064)]= 0.571
Specific Energy Consumption for Steam Generation Boiler (Co-Gen Boiler -2) in AY= [(Coal Consumption (Tonne) * GCV of Coal (kcal/kg)) + (Type of Fuel – 2 (Tonne) * GCV of Fuel – 2 (kcal/kg)) + (Type of Fuel – 3 (Tonne) * GCV of Fuel – 3 (kcal/kg)) + (Type of Fuel – 4 (Tonne) * GCV of Fuel – 4 (kcal/kg))] / [(Total Steam Generation (Tonne))]= [(38701*4649) + (26891*3200) + (33130*2000) + (936*12064)]/ 331846= 1035.2 kcal/kg of Steam
Percentage of Coal Energy Used in steam Generation (Co-Gen Boiler – 2) in AY= [(Coal Consumption (Tonne) * GCV of Coal (kcal/kg))]/ [(Coal Consumption (Tonne) * GCV of Coal (kcal/kg)) + (Type of Fuel – 2 (Tonne) * GCV of Fuel – 2 (kcal/kg)) + (Type of Fuel – 3 (Tonne) * GCV of Fuel – 3 (kcal/kg) ) + (Type of Fuel – 4 (Tonne) * GCV of Fuel – 4 (kcal/kg))]= [(38701*4649)]/ [(38701*4649) + (26891*3200) + (33130*2000) + (936*12064)]= 0.523
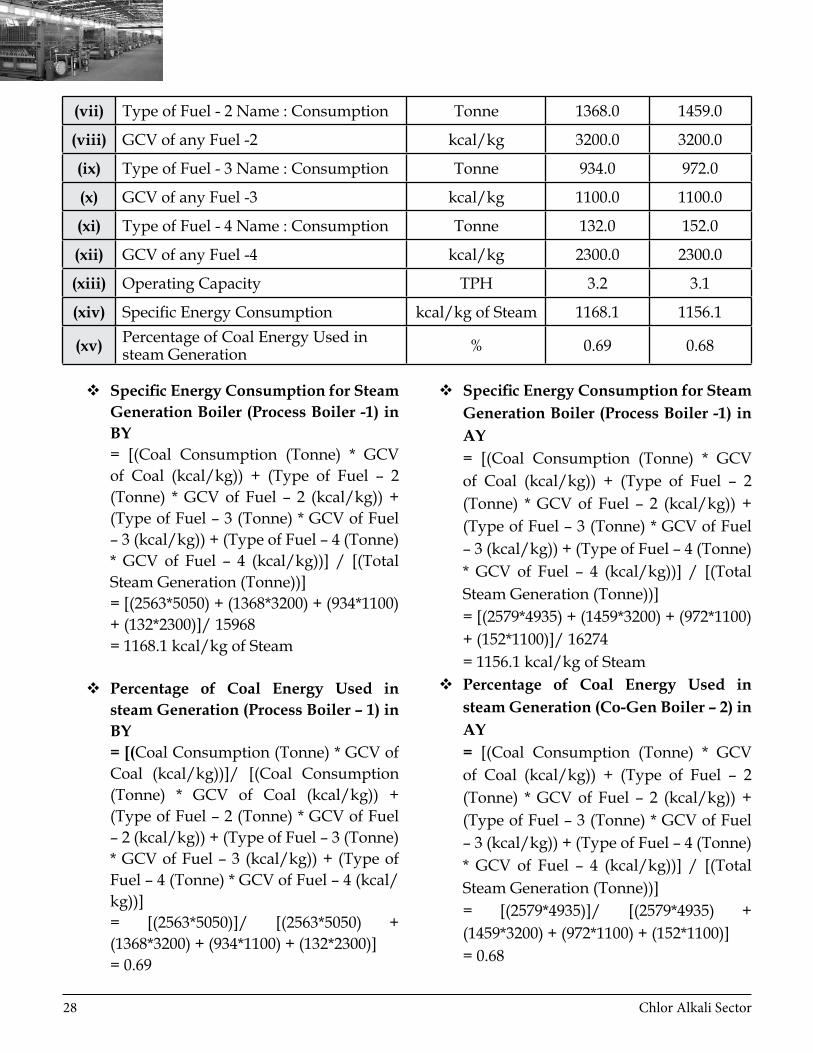
Details of Process Boiler – 1.For Process Boiler (3)
S.no Description UnitsBase Line Year (BY)
Assessment Year (AY)
(i) Type
(ii) Rated Capacity TPH 6.0 6.0
(iii) Total Steam Generation Tonne 15968.0 16274.0
(iv) Running hours Hrs 4990.0 5249.0
(v) Coal Consumption Tonne 2563.0 2579.0
(vi) GCV of Coal kcal/kg 5050.0 4935.0
Chlor Alkali Sector28
(vii) Type of Fuel - 2 Name : Consumption Tonne 1368.0 1459.0
(viii) GCV of any Fuel -2 kcal/kg 3200.0 3200.0
(ix) Type of Fuel - 3 Name : Consumption Tonne 934.0 972.0
(x) GCV of any Fuel -3 kcal/kg 1100.0 1100.0
(xi) Type of Fuel - 4 Name : Consumption Tonne 132.0 152.0
(xii) GCV of any Fuel -4 kcal/kg 2300.0 2300.0
(xiii) Operating Capacity TPH 3.2 3.1
(xiv) Specific Energy Consumption kcal/kg of Steam 1168.1 1156.1
(xv) Percentage of Coal Energy Used in steam Generation % 0.69 0.68
Specific Energy Consumption for Steam Generation Boiler (Process Boiler -1) in BY= [(Coal Consumption (Tonne) * GCV of Coal (kcal/kg)) + (Type of Fuel – 2 (Tonne) * GCV of Fuel – 2 (kcal/kg)) + (Type of Fuel – 3 (Tonne) * GCV of Fuel – 3 (kcal/kg)) + (Type of Fuel – 4 (Tonne) * GCV of Fuel – 4 (kcal/kg))] / [(Total Steam Generation (Tonne))]= [(2563*5050) + (1368*3200) + (934*1100) + (132*2300)]/ 15968= 1168.1 kcal/kg of Steam
Percentage of Coal Energy Used in steam Generation (Process Boiler – 1) in BY= [(Coal Consumption (Tonne) * GCV of Coal (kcal/kg))]/ [(Coal Consumption (Tonne) * GCV of Coal (kcal/kg)) + (Type of Fuel – 2 (Tonne) * GCV of Fuel – 2 (kcal/kg)) + (Type of Fuel – 3 (Tonne) * GCV of Fuel – 3 (kcal/kg)) + (Type of Fuel – 4 (Tonne) * GCV of Fuel – 4 (kcal/kg))]= [(2563*5050)]/ [(2563*5050) + (1368*3200) + (934*1100) + (132*2300)]= 0.69
Specific Energy Consumption for Steam Generation Boiler (Process Boiler -1) in AY= [(Coal Consumption (Tonne) * GCV of Coal (kcal/kg)) + (Type of Fuel – 2 (Tonne) * GCV of Fuel – 2 (kcal/kg)) + (Type of Fuel – 3 (Tonne) * GCV of Fuel – 3 (kcal/kg)) + (Type of Fuel – 4 (Tonne) * GCV of Fuel – 4 (kcal/kg))] / [(Total Steam Generation (Tonne))]= [(2579*4935) + (1459*3200) + (972*1100) + (152*1100)]/ 16274= 1156.1 kcal/kg of Steam
Percentage of Coal Energy Used in steam Generation (Co-Gen Boiler – 2) in AY= [(Coal Consumption (Tonne) * GCV of Coal (kcal/kg)) + (Type of Fuel – 2 (Tonne) * GCV of Fuel – 2 (kcal/kg)) + (Type of Fuel – 3 (Tonne) * GCV of Fuel – 3 (kcal/kg)) + (Type of Fuel – 4 (Tonne) * GCV of Fuel – 4 (kcal/kg))] / [(Total Steam Generation (Tonne))]= [(2579*4935)]/ [(2579*4935) + (1459*3200) + (972*1100) + (152*1100)]= 0.68

Chlor Alkali Sector 29
Details of Process Boiler - 2For Process Boiler (4)
S.no Description UnitsBase Line Year (BY)
Assessment Year (AY)
(i) Type
(ii) Rated Capacity TPH 12.0 12.0
(iii) Total Steam Generation Tonne 55655.0 57986.0
(iv) Running hours Hrs 6788.0 7343.0
(v) Coal Consumption Tonne 12707.0 13540.0
(vi) GCV of Coal kcal/kg 4520.0 4230.0
(vii) Type of Fuel - 2 Name : Consumption Tonne 435.0 487.0
(viii) GCV of any Fuel -2 kcal/kg 2500.0 3200.0
(ix) Type of Fuel - 3 Name : Consumption Tonne 0 0
(x) GCV of any Fuel -3 kcal/kg
(xi) Type of Fuel - 4 Name : Consumption Tonne 0 0
(xii) GCV of any Fuel -4 kcal/kg
(xiii) Operating Capacity TPH 8.2 7.9
(xiv) Specific Energy Consumption kcal/kg of Steam 1051.5 1014.6
(xv) Percentage of Coal Energy Used in steam Generation % 0.981 0.974
Specific Energy Consumption for Steam Generation Boiler (Process Boiler -1) in BY= [(Coal Consumption (Tonne) * GCV of Coal (kcal/kg)) + (Type of Fuel – 2 (Tonne) * GCV of Fuel – 2 (kcal/kg)) + (Type of Fuel – 3 (Tonne) * GCV of Fuel – 3 (kcal/kg)) + (Type of Fuel – 4 (Tonne) * GCV of Fuel – 4 (kcal/kg))] / [(Total Steam Generation (Tonne))]= [(12707*4520) + (435*2500)]/ 55655= 1051.5 kcal/kg of Steam
Percentage of Coal Energy Used in steam Generation (Process Boiler – 1) in BY= [(Coal Consumption (Tonne) * GCV of
Coal (kcal/kg))]/ [(Coal Consumption (Tonne) * GCV of Coal (kcal/kg)) + (Type of Fuel – 2 (Tonne) * GCV of Fuel – 2 (kcal/kg)) + (Type of Fuel – 3 (Tonne) * GCV of Fuel – 3 (kcal/kg)) + (Type of Fuel – 4 (Tonne) * GCV of Fuel – 4 (kcal/kg))]= [(12707*4520)]/ [(12707*4520) + (435*2500)]= 0.981
Specific Energy Consumption for Steam Generation Boiler (Process Boiler -1) in AY= [(Coal Consumption (Tonne) * GCV of Coal (kcal/kg)) + (Type of Fuel (Tonne) – 2 * GCV of Fuel – 2(kcal/kg)) + (Type of Fuel – 3 (Tonne) * GCV of Fuel – 3(kcal/

Chlor Alkali Sector30
kg)) + (Type of Fuel – 4 (kcal/kg) * GCV of Fuel – 4 (kcal/kg))] / [(Total Steam Generation(Tonne))]= [(13540*4230) + (487*3200)]/ 57986= 1014.6 kcal/kg of Steam
Percentage of Coal Energy Used in steam Generation (Co-Gen Boiler – 2) in AY= [(Coal Consumption (Tonne) * GCV
of Coal (kcal/kg)) + (Type of Fuel – 2 (Tonne) * GCV of Fuel – 2 (kcal/kg)) + (Type of Fuel – 3 (Tonne) * GCV of Fuel – 3 (kcal/kg)) + (Type of Fuel – 4 (Tonne) * GCV of Fuel – 4 (kcal/kg))] / [(Total Steam Generation (Tonne))]= [(13540*4230)]/ [(13540*4230) + (487*3200)]= 0.974
Sr No. Description Units Baseline
Year [BY]Assessment Year [AY]
1 Boiler Efficiency % 80.56 79.48
2 Steam Generation at Boiler 1-2 (Co-Gen Boiler)* Tonne 673358.0 623682.0
3 Steam Generation at Boiler 3-4 (Process Boiler)** Tonne 71623.0 74260.0
4 Specific Energy Consumption for Steam Generation Boiler 1-2 (Co-Gen Boiler)
Kcal/ kg of Steam 969.137 1100.17
5 Specific Energy Consumption for Steam Generation Boiler 3-4 (Process Boiler)
Kcal/ kg of Steam 1084.22 1054.47
6 Weighted Percentage of Coal Energy Used in steam Generation (Co-Gen Boiler) Factor 0.565 0.561
7 Weighted Percentage of Coal Energy Used in steam Generation (Process Boiler) Factor 0.899 0.891
*:Theaboveexamplestandsfor2CogenBoiler1-2,thecalculationcouldberepeatedfor1-5nosofboiler**:Theaboveexamplestandsfor2ProcessBoiler1-2,thecalculationcouldberepeatedfor6-10nosofboiler
Steam Generation at Boiler (1-2) in BY= Steam Generation by Co-Gen Boiler – 1 (Tonne) (BY) + Steam Generation by Co-Gen Boiler – 2 (Tonne) (BY) = 321669.0 + 351689.0= 673358.0 Tonne
Steam Generation at Boiler (1-2) in AY= Steam Generation by Co-Gen Boiler – 1 (AY) (Tonne) + Steam Generation by Co-Gen Boiler – 2 (Tonne) (AY) = 291836.0+ 331846.0= 623682.0 Tonne
Steam Generation at Boiler (3-4) in BY= Steam Generation by Co-Gen Boiler – 1
(BY) (Tonne) + Steam Generation by Co-Gen Boiler – 2 (Tonne) (BY) = 15968.0 + 55655.0= 71623 Tonne
Steam Generation at Boiler (1-2) in AY= Steam Generation by Co-Gen Boiler – 1 (Tonne) (AY) + Steam Generation by Co-Gen Boiler – 2 (Tonne) (AY)= 16274.0 + 57986.0= 74260.0 Tonne
Specific Energy Consumption for Steam Generation Boiler 1-2 (Co-Gen Boiler) in BY

Chlor Alkali Sector 31
= (Specific Energy Consumption form Steam Generation Co-Gen Boiler-1 (kcal/kg steam) (BY)* Operating TPH of Co-Gen Boiler-1 (BY)) + (Specific Energy Consumption form Steam Generation Co-Gen Boiler-2 (kcal/kg steam) (BY) * Operating TPH of Co-Gen Boiler-2 (BY)) / [(Operating TPH of Co-Gen Boiler-1(BY)) + (Operating TPH of Co-Gen Boiler-2 (BY)]= [(1008.2*38.2 + 933.45*41.812)]/[(38.2+41.812)]= 969.137 kcal/ kg of Steam
Specific Energy Consumption for Steam Generation Boiler 1-2 (Co-Gen Boiler) in AY= [(Specific Energy Consumption form Steam Generation Co-Gen Boiler-1 (kcal/kg steam) (AY) * Operating TPH of Co-Gen Boiler-1 (AY)) + (Specific Energy Consumption form Steam Generation Co-Gen Boiler-2 (kcal/kg steam) (AY) * Operating TPH of Co-Gen Boiler-2 (AY)) / [(Operating TPH of Co-Gen Boiler-1 (AY))] + (Operating TPH of Co-Gen Boiler-2 (AY)]= [(1217.6 *37 + 1035.2 *46.55)]/[(38.2+46.55)]= 1100.17 kcal/ kg of Steam
Specific Energy Consumption for Steam Generation Boiler 3-4 (Process Boiler) in BY= [(Specific Energy Consumption form Steam Generation Process Boiler-1 (BY) (kcal/kg steam) * Operating TPH of Process Boiler-1 (BY)) + (Specific Energy Consumption form Steam Generation Process Boiler-2 (kcal/kg steam) (BY) * Operating TPH of Process Boiler-2 (BY))]/ [(Operating TPH of Process Boiler-1 (BY)) + (Operating TPH of Process Boiler-2 (BY)]
= [(1168.1*3.2+8.2*1051.5)]/[(8.2+3.2)]= 1084.22 kcal/ kg of Steam
Specific Energy Consumption for Steam Generation Boiler 3-4 (Process Boiler) in AY= (Specific Energy Consumption form Steam Generation Process Boiler-1 (kcal/kg steam) (AY) * Operating TPH of Process Boiler-1 (AY)) + (Specific Energy Consumption form Steam Generation Process Boiler-2 (kcal/kg steam) (AY) * Operating TPH of Process Boiler-2 (AY))/ [(Operating TPH of Process Boiler-1 (AY)) + (Operating TPH of Process Boiler-2 (AY)]= [(1156.1*3.1 + 1014.6 *7.9)]/[(3.1+7.9)]= 1054.47 kcal/ kg of Steam
Weighted Percentage of Coal Energy Used in steam Generation (Co-Gen Boiler) BY= [(Weighted Percentage of Coal Energy Used in steam Generation (Co-Gen Boiler-1) (kcal/kg steam) (BY) * Operating TPH of Co-Gen Boiler-1 (BY)) + (Weighted Percentage of Coal Energy Used in steam Generation (Co-Gen Boiler-2) (kcal/kg steam) (BY) * Operating TPH of Co-Gen Boiler-2 (BY)] / [(Operating TPH of Co-Gen Boiler-1 (BY) + Operating TPH of Co-Gen Boiler-2 (BY)]= [(0.56*38.2) + (0.571*41.812)]/ [(38.2+41.812)]= 0.565
Weighted Percentage of Coal Energy Used in steam Generation (Co-Gen Boiler) AY= [(Weighted Percentage of Coal Energy Used in steam Generation (Co-Gen Boiler-1) (kcal/kg steam) (AY)

Chlor Alkali Sector32
* Operating TPH of Co-Gen Boiler-1 (AY)) + (Weighted Percentage of Coal Energy Used in steam Generation (Co-Gen Boiler-2) (kcal/kg steam) (AY) * Operating TPH of Co-Gen Boiler-2 (AY)] / [(Operating TPH of Co-Gen Boiler-1 (AY) + Operating TPH of Co-Gen Boiler-2 (AY)]= [(0.61*37) + (0.523*46.55)]/ [(37+46.55)]= 0.561
Weighted Percentage of Coal Energy Used in steam Generation (Process Boiler) BY= [(Weighted Percentage of Coal Energy Used in steam Generation (Process Boiler-1) (kcal/kg steam) (BY) * Operating TPH of Process Boiler-1 (BY)) + (Weighted Percentage of Coal Energy Used in steam Generation (Process Boiler-2) (kcal/kg steam) (BY) * Operating TPH of Process Boiler-2 (BY))] / [(Operating TPH of Process Boiler-1 (BY) + Operating TPH of Process Boiler-2 (BY)]= [(0.69*3.2) + (0.981*8.2)]/ [(3.2+8.2)]= 0.899
Weighted Percentage of Coal Energy Used in steam Generation (Process Boiler) AY= [(Weighted Percentage of Coal Energy Used in steam Generation (Process Boiler-1) (kcal/kg steam) (AY) * Operating TPH of Process Boiler-1 (AY)) + (Weighted Percentage of Coal Energy Used in steam Generation (Process Boiler-2) (kcal/kg steam) (AY) * Operating TPH of Process Boiler-2 (AY))] / [(Operating TPH of Process Boiler-1
(AY) + Operating TPH of Process Boiler-2 (AY)]= [(0.68*3.1) + (0.974*7.9)]/ [(3.1+7.9)]= 0.891
Weighted Specific Energy Consumption for Steam Generation (BY)= [(Steam Generation at Boiler 1-2 (Tonne) (BY) x Specific Energy Consumption for Steam Generation in Cogen Boiler 1-2 (kcal/kg steam) (BY)) + (Steam Generation at Boiler 3-4 (Tonne) (BY) x Specific Energy Consumption for Steam Generation in Process Boiler 3-4 (kcal/kg steam) (BY))]/ (Steam Generation at Boiler 1-2 (Tonne) (BY) + Steam Generation at Boiler 3-4 (Tonne) (BY))= [(673358*969.137) + (71623.0*1084.22)]/ [(673358+71623.0)]= 980.20 kcal/kg of Steam
Weighted Specific Energy Consumption for Steam Generation (AY)= [(Steam Generation at Boiler 1-2 (Tonne) (AY) x Specific Energy Consumption for Steam Generation in Cogen Boiler 1-2 (kcal/kg steam) (AY)) + (Steam Generation at Boiler 3-4 (Tonne) (AY) x Specific Energy Consumption for Steam Generation in Process Boiler 3-4 (kcal/kg) (AY))]/ [(Steam Generation at Boiler 1-2 (Tonne) (AY) + Steam Generation at Boiler 3-4 (Tonne) (AY) ]= [(623682*1100.17) + (74260*1054.47)]/[(623682+74260)]= 1095.3 kcal/kg of Steam
Normalized Specific Energy Consumption for Steam Generation (AY) (kcal/kg of Steam)