Chiral recognition and determination of enantiomeric ...
9
Chiral recognition and determination of enantiomeric excess of chiral compounds by UV- visible-shortwave near infrared diffuse reflectance spectroscopy with chemometrics Xiaomei Lu, a Jie Tang, a Xinxin Dang, a Xiaoli Jing, b Kailin Xu, a Hui Li a and Bing Liang * a A simple approach is proposed for the chiral recognition and determination of enantiomeric excess of enantiomers, based on a UV-visible-shortwave near infrared diffuse reflectance spectroscopy (UV-vis- SWNIR DRS) technique combined with chemometrics. The results of chiral recognition show that principal component analysis (PCA) combined with UV-vis-SWNIR DRS is able to discriminate chiral compounds based on different chirality. Determination of enantiomeric excess value was performed by linear regression model partial least squares (PLSR) and non-linear regression model support vector machine regression (SVR) combined with UV-vis-SWNIR diffuse reflectance spectroscopy. After wavelength selection, spectral pre-treatments and parameter optimization, both models showed good prediction ability: the determination coefficients (R 2 ) of prediction set by the PLSR model and the SVR model are 0.9921 and 0.9951, respectively, and mean standard errors (MSEs) are 0.0029 and 0.0020, respectively. The SVR model has a better prediction effect. The detection limit (LD) of this method was 0.059. The results prove that this approach can be used to discriminate chiral compounds and determine enantiomeric excess of enantiomers. 1 Introduction The increased development of single-enantiomer pharmaceu- ticals has enhanced the need for rapid and convenient methods for chiral recognition and determination of enantiomeric excess of chiral compounds. 1 There have been various methods for chiral analysis, such as circular dichroism (CD), 2–4 polarimetry, 5 NMR, 1,6 high perfor- mance liquid chromatography (HPLC), 7–9 gas chromatography (GC), 10 capillary electrophoresis (CE), 11–14 mass spectroscopy, 15 uorescence spectrometry, 16–18 ultraviolet absorption spectros- copy, 19–22 UV-visible absorption spectroscopy, 23–25 near-infrared spectroscopy, 26 resonance Rayleigh scattering spectroscopy, 27 optically active Raman spectroscopy, 28,29 vibrational circular dichroism spectroscopy, 30,31 ITC, 32,33 colorimetric probes 34–36 and so on. Most of them are effective and powerful either in chiral recognition or in determination of enantiomeric excess. The above methods have some drawbacks such as needing addition of chiral auxiliary for derivatization, 7–10,15–26 requiring tedious sample pretreatment, 34–36 using expensive and sophis- ticated instruments, 2–4,6–9,28,29,32,33 being time-consuming, 6,30,31 less sensitive, 2–4 destructive, 15 only for chiral recognition. 32,33 Additionally, they are all wet analysis and can't be used for all types of chiral compounds. These make them not the rst choice for rapid and convenient chiral analysis. So far, there are only few papers devoted to chiral analysis in solid state. They are diffuse reectance infrared Fourier trans- form spectroscopy (DRIFT), 37,38 terahertz time domain spec- troscopy (THz-TDS) 39,40 and UV-vis-SWNIR DRS proposed recently by us. 41,42 DRIFT needs to add KBr, 37,38 THz-TDS needs to add magnesium oxide 39 and is interfered with seriously by water in samples or the atmosphere. UV-vis-shortwave near infrared diffuse reectance spectros- copy (UV-vis-SWNIR DRS) has advantages containing a wealth of information regarding electron-energy level transition as well as vibrational motion of molecules, being simple, fast and non- destructive, while DRIFT has only information regarding vibrational motion of molecules. DRIFT is measured with potassium bromide. Potassium bromide is easy to absorb moisture, and the strong absorption of water interferes seri- ously with the DRIFT spectra of samples. Additionally, DRIFT instrument is more expensive than UV-vis-shortwave near infrared diffuse reectance spectrometer used in our method. And DRIFT method is destructive, because the sample cannot be recovered. Comparing to DRIFT and THz-TDS, our proposed UV-vis-SWNIR DRS needs no addition of any reagents, neither chiral nor achiral reagents. It is unique and has a potential to be a College of Chemical Engineering, Sichuan University, Chengdu 610065, P. R. China. E-mail: [email protected] b College of Medical Technology, Chengdu University of Traditional Chinese Medicine, Chengdu 611137, P. R. China Cite this: RSC Adv. , 2017, 7, 13552 Received 9th October 2016 Accepted 18th January 2017 DOI: 10.1039/c6ra24952c rsc.li/rsc-advances 13552 | RSC Adv., 2017, 7, 13552–13560 This journal is © The Royal Society of Chemistry 2017 RSC Advances PAPER Open Access Article. Published on 28 February 2017. Downloaded on 2/1/2022 4:05:34 AM. This article is licensed under a Creative Commons Attribution-NonCommercial 3.0 Unported Licence. View Article Online View Journal | View Issue
Transcript of Chiral recognition and determination of enantiomeric ...

RSC Advances
PAPER
Ope
n A
cces
s A
rtic
le. P
ublis
hed
on 2
8 Fe
brua
ry 2
017.
Dow
nloa
ded
on 2
/1/2
022
4:05
:34
AM
. T
his
artic
le is
lice
nsed
und
er a
Cre
ativ
e C
omm
ons
Attr
ibut
ion-
Non
Com
mer
cial
3.0
Unp
orte
d L
icen
ce.
View Article OnlineView Journal | View Issue
Chiral recognitio
aCollege of Chemical Engineering, Sichuan U
E-mail: [email protected] of Medical Technology, Chengdu Un
Chengdu 611137, P. R. China
Cite this: RSC Adv., 2017, 7, 13552
Received 9th October 2016Accepted 18th January 2017
DOI: 10.1039/c6ra24952c
rsc.li/rsc-advances
13552 | RSC Adv., 2017, 7, 13552–13560
n and determination ofenantiomeric excess of chiral compounds by UV-visible-shortwave near infrared diffuse reflectancespectroscopy with chemometrics
Xiaomei Lu,a Jie Tang,a Xinxin Dang,a Xiaoli Jing,b Kailin Xu,a Hui Lia and Bing Liang*a
A simple approach is proposed for the chiral recognition and determination of enantiomeric excess of
enantiomers, based on a UV-visible-shortwave near infrared diffuse reflectance spectroscopy (UV-vis-
SWNIR DRS) technique combined with chemometrics. The results of chiral recognition show that
principal component analysis (PCA) combined with UV-vis-SWNIR DRS is able to discriminate chiral
compounds based on different chirality. Determination of enantiomeric excess value was performed by
linear regression model partial least squares (PLSR) and non-linear regression model support vector
machine regression (SVR) combined with UV-vis-SWNIR diffuse reflectance spectroscopy. After
wavelength selection, spectral pre-treatments and parameter optimization, both models showed good
prediction ability: the determination coefficients (R2) of prediction set by the PLSR model and the SVR
model are 0.9921 and 0.9951, respectively, and mean standard errors (MSEs) are 0.0029 and 0.0020,
respectively. The SVR model has a better prediction effect. The detection limit (LD) of this method was
0.059. The results prove that this approach can be used to discriminate chiral compounds and
determine enantiomeric excess of enantiomers.
1 Introduction
The increased development of single-enantiomer pharmaceu-ticals has enhanced the need for rapid and convenient methodsfor chiral recognition and determination of enantiomeric excessof chiral compounds.1
There have been various methods for chiral analysis, such ascircular dichroism (CD),2–4 polarimetry,5 NMR,1,6 high perfor-mance liquid chromatography (HPLC),7–9 gas chromatography(GC),10 capillary electrophoresis (CE),11–14 mass spectroscopy,15
uorescence spectrometry,16–18 ultraviolet absorption spectros-copy,19–22 UV-visible absorption spectroscopy,23–25 near-infraredspectroscopy,26 resonance Rayleigh scattering spectroscopy,27
optically active Raman spectroscopy,28,29 vibrational circulardichroism spectroscopy,30,31 ITC,32,33 colorimetric probes34–36
and so on. Most of them are effective and powerful either inchiral recognition or in determination of enantiomeric excess.
The above methods have some drawbacks such as needingaddition of chiral auxiliary for derivatization,7–10,15–26 requiringtedious sample pretreatment,34–36 using expensive and sophis-ticated instruments,2–4,6–9,28,29,32,33 being time-consuming,6,30,31
niversity, Chengdu 610065, P. R. China.
iversity of Traditional Chinese Medicine,
less sensitive,2–4 destructive,15 only for chiral recognition.32,33
Additionally, they are all wet analysis and can't be used for alltypes of chiral compounds. These make them not the rstchoice for rapid and convenient chiral analysis.
So far, there are only few papers devoted to chiral analysis insolid state. They are diffuse reectance infrared Fourier trans-form spectroscopy (DRIFT),37,38 terahertz time domain spec-troscopy (THz-TDS)39,40 and UV-vis-SWNIR DRS proposedrecently by us.41,42 DRIFT needs to add KBr,37,38 THz-TDS needsto add magnesium oxide39 and is interfered with seriously bywater in samples or the atmosphere.
UV-vis-shortwave near infrared diffuse reectance spectros-copy (UV-vis-SWNIR DRS) has advantages containing a wealth ofinformation regarding electron-energy level transition as well asvibrational motion of molecules, being simple, fast and non-destructive, while DRIFT has only information regardingvibrational motion of molecules. DRIFT is measured withpotassium bromide. Potassium bromide is easy to absorbmoisture, and the strong absorption of water interferes seri-ously with the DRIFT spectra of samples. Additionally, DRIFTinstrument is more expensive than UV-vis-shortwave nearinfrared diffuse reectance spectrometer used in our method.And DRIFT method is destructive, because the sample cannotbe recovered. Comparing to DRIFT and THz-TDS, our proposedUV-vis-SWNIR DRS needs no addition of any reagents, neitherchiral nor achiral reagents. It is unique and has a potential to be
This journal is © The Royal Society of Chemistry 2017

Paper RSC Advances
Ope
n A
cces
s A
rtic
le. P
ublis
hed
on 2
8 Fe
brua
ry 2
017.
Dow
nloa
ded
on 2
/1/2
022
4:05
:34
AM
. T
his
artic
le is
lice
nsed
und
er a
Cre
ativ
e C
omm
ons
Attr
ibut
ion-
Non
Com
mer
cial
3.0
Unp
orte
d L
icen
ce.
View Article Online
developed as a rapid, convenient and non-destructive qualitycontrol tool for isomeric purity testing of optically activesubstances.
The principle of UV-vis-SWNIR DRS for chiral analysis isbased on the difference of diffuse reectance spectra betweenenantiomers in powder. This is likely due to their differentsteric conguration, consequently due to different crystalstructures and habits. It is not recent discovery that differentpolymorph can display different ultraviolet-visible spectra.43
The principle that different crystal structures may havedifferent UV-vis-SWNIR DRS has been applied on the qualita-tive and quantitative analysis of polymorph ofpharmaceuticals.44
The earlier study in our laboratory based on UV-vis-SWNIRDRS combined with chemometrics was investigated fordiscriminating enantiomers and their racemate based onchirality and manufacturing origins difference, using D-, L- andDL-alanine as model compounds.41 The objective of the study isto investigate the feasibility of applying UV-vis-SWNIR DRScombined with chemometrics on determination of enantio-meric excess of chiral enantiomers using tartaric acid as testsubstance and the universality of this method in chiral recog-nition, using tartaric acid, aromatic a-amino acids phenylala-nine and tryptophan as test substances.
2 Experimental2.1 Reagents
D-, L- and DL-tartaric acid (purity$ 99.5%) from Kelong chemicalreagent factory in Chengdu, D-phenylalanine (purity of 98%)and L-phenylalanine (purity of 99%), D-tryptophan (purity of99%) and L-tryptophan (purity of 98%) purchased fromShanghai Aladdin Bio-Chem Technology were grindedmanuallywith a mortar and pestle, and sied, in a sealed plastic bagcontaining desiccant silica gel to protect the samples againstmoisture absorption.
The D- and L-tartaric acid powers through 200-mesh sievewere used to measure X-ray diffraction patterns.
Tartaric acid powers through 100-mesh sieve and alanineand tryptophan powders through 160-mesh sieve were used tomeasure UV-vis-SWNIR DRS.
Racemic samples of the three chiral compounds wereprepared by evenly mixed D-enantiomer and L-enantiomerpower samples through 100- or 160-mesh sieve together in thesame ratio.
The tartaric acid powers through 100-mesh sieve wereaccurately weighed and evenly mixed together according topredetermined ratios to prepare 72 samples with differentenantiomeric excess value: �1, �0.95, �0.92, �0.9, �0.88,�0.86, �0.83, �0.8, �0.77, �0.74, �0.71, �0.68, �0.65, �0.62,�0.59, �0.56, �0.53, �0.5, �0.47, �0.44, �0.41, �0.38, �0.35,�0.32, �0.29, �0.26, �0.23, �0.2, �0.17, �0.14, �0.11, �0.08,�0.05, �0.02, 0, 0.01, 0.04, 0.07, 0.1, 0.13, 0.16, 0.19, 0.22, 0.25,0.28, 0.3, 0.32, 0.34, 0.37, 0.4, 0.43, 0.46, 0.49, 0.52, 0.55, 0.58,0.6, 0.62, 0.64, 0.67, 0.7, 0.73, 0.76, 0.79, 0.82, 0.85, 0.88, 0.9,0.92, 0.94, 0.97, 1, in which the mass fraction of L-enantiomerwas varied from 0 to 100%.
This journal is © The Royal Society of Chemistry 2017
2.2 Apparatus
S3000 Fiber Optic Spectrometer (Race-Technology Co., Ltd,Hangzhou, China) equipped with a 3648-element linear siliconCCD array detector (Toshiba TCD 1305), a Y-type optical berprobe with 100 cm in length and 0.4 mm in diameter, a lightsource (Oceans Optics Inc., USA) and a home-made sample cellmade from dark gray PVC, was used to measure UV-vis-SWNIRdiffuse reectance spectra in wavelength range of 200–1100 nm.
X'Pert PRO powder diffractometer (PANalytical Company,Holland) with a Pixcel 1D detector and Cu Ka1 radiation wereused to measure X-ray diffraction patterns of D- and L-tartaricacids in the range of 5–50� 2q.
WZZ-3 automatic polarimeter (Shen Guang Instrument Co.,Ltd, Shanghai, China) was used to measure specic rotation.
2.3 Experiment procedure
2.3.1 Specic rotation of tartaric acid, phenylalanine andtryptophan. The specic rotation of three chiral compoundswere measured to check their optical purity by WZZ-3 AutomaticPolarimeter, following the Chinese Pharmaceutical IndustryStandard, in which 0.2 g ml�1 tartaric acid enantiomersaqueous solutions, 0.02 g ml�1 phenylalanine enantiomersaqueous solutions and 0.01 g ml�1 tryptophan enantiomersaqueous solutions are used.
2.3.2 X-ray diffraction patterns of D-, L-tartaric acid. The X-ray diffraction data of D- and L-tartaric acid through 200-meshsieve were obtained by using an X'Pert PRO diffractometer withan Pixcel 1D detector and Cu Ka1 radiation (l ¼ 1.54056 A,generator setting: 40 kV, 40 mA) at room temperature. Diffrac-tion patterns were recorded in the range of 5–50� 2q, usinga step size of 0.013� 2q and a count time of 29 s per step.
2.3.3 Acquisition of UV-vis-SWNIR DRS for chiral recogni-tion. It has been recognized that the particle size of samples andthe distance between optical probe and sample surface haveinuence on UV-vis-SWNIR DRS measurement and the perfor-mance of chiral analysis model.41 Preliminary tests showed thattartaric acid of 100 mesh, tryptophan and phenylalanine acid of160mesh can give a goodmodelling effect; 0.17 g of tartaric acidof 100 mesh, 0.18 g of tryptophan of 160 mesh and 0.1 g ofphenylalanine acid of 160mesh have an appropriate and almostsame thickness aer they had been lled in the sample-cell andattened. Therefore, 0.17 g of tartaric acid of 100mesh, 0.18 g oftryptophan and 0.1 g of phenylalanine acid of 160 mesh wereused in the following experiment.
0.17 g of D- or L- or DL or racemic tartaric acid through 100-mesh, or 0.1 g of D- or L- or racemic phenylalanine acid of 160mesh, or 0.18 g of D- or L- or racemic of 160 mesh were weighedand lled in the sample cell, pressed by free fall impacts ofa round rod tomake the sample surface smooth. Then the opticalprobe was placed vertically on the upper surface of sample toacquire UV-vis-SWNIR DRS under the following conditions: thewavelength range from 200 to 1106 nm, a resolution of 3.3 nm,integral time of 250ms for tartaric acid, 356ms for phenylalanineand 373 ms for tryptophan, with a Spectralon as backgroundreference. Aer a former measurement, the sample surface wasstirred, again pressed and smoothed, to measure its next
RSC Adv., 2017, 7, 13552–13560 | 13553

RSC Advances Paper
Ope
n A
cces
s A
rtic
le. P
ublis
hed
on 2
8 Fe
brua
ry 2
017.
Dow
nloa
ded
on 2
/1/2
022
4:05
:34
AM
. T
his
artic
le is
lice
nsed
und
er a
Cre
ativ
e C
omm
ons
Attr
ibut
ion-
Non
Com
mer
cial
3.0
Unp
orte
d L
icen
ce.
View Article Online
spectrum. Stirring-pressing-smoothing steps were repeated 45times. Therefore, 45 spectra for each kind of powder sample wereobtained, total 135 spectra for each chiral compound.
2.3.4 Acquisition of UV-vis-SWNIR DRS for determinationof enantiomeric excess. UV-vis-SWNIR DRS of 72 samples withdifferent enantiomeric excess value were measured under theconditions as described above. Each sample of 0.17 g was lledin the sample cell, pressed by free fall impacts of a round roduntil the surface was smooth, then the optical probe was placedvertically on the upper surface of sample to acquire UV-vis-SWNIR spectra. Each sample was measured three times byresetting the optical probe and their average was treated as theoriginal spectrum of the sample. Total 72 spectra were obtained.
2.3.5 Chiral recognition by principal component analysis(PCA). PCA is used for chiral recognition. PCA is a projectionand dimension reduction method for transforming the originalmeasurement variables into new, uncorrelated variables calledprincipal components, to summarize the features of the data.And in traditional approach is to use the rst few principalcomponents (PCs) in data analysis since they retain much of thevariability of the original dataset.45–47 The scores of PCs werethen used as input to the multivariate analyses.46
2.3.6 Determination of enantiomeric excess2.3.6.1 Wavelength selection. Interval partial least square
method (iPLS) and correlation coefficient method were utilizedfor wavelength selection. iPLS is a new graphically oriented localmodeling procedure compared to full-spectrum partial least-squares.48 Root-mean square error of cross validation (RMSECV)is a parameter governing the variable selection. The wavelengthinterval or intervals with a RMSECV lower than the minimumRMSECV of a full-spectrum model was or were selected.
In correlation coefficient method for wavelength selection,the correlation coefficient (R) between e.e value and absorbanceat every wavelength is calculated rst, to plot R vs. wavelength.
Fig. 1 X-ray diffraction patterns of D-tartaric acid and L-tartaric acid.
13554 | RSC Adv., 2017, 7, 13552–13560
Then the wave bands with R greater than certain thresholds setfor R are tried in modelling and those giving good modellingresults can be selected as optimum wavebands.
2.3.6.2 Spectral preprocessing. To enhance the spectralfeatures and reduce or remove the inuence of noise, thespectral data were subjected to various mathematical treat-ments,49 including mean center and scale, normalization (Nor),noise, baseline, spectroscopic, smoothing (SG), multiplicativescatter correction (MSC), standard normal transformation(SNV), the rst derivative (1stD), the rst derivative combinedwith SNV (1stD + SNV), SNV combined with the rst derivative(SNV + 1stD), and so on.
2.3.6.3 Establishment of models. Partial least squaresregression (PLSR) is a widely used linear regression method dueto its simplicity to use, speed, relative good performance andeasy accessibility, while support vector machine regression(SVR) is a non-linear regression method capable of dealingefficiently with high dimensional input vectors.50 The statisticalparameters including large square correlation coefficient (R2),small root mean square error of calibration (RMSE), small meansquare error of cross-validation (MSE), small standard error (SE)were utilized to evaluate the accuracy, predictive ability, and therobustness of a model.
3 Results and discussions3.1 Characterization of three chiral compounds
Three chiral compounds were identied by automatic polar-imeter and X-ray powder diffractometer.
3.1.1 Specic rotation. The determined specic rotation ofD-tartaric acid and L-tartaric acid are �11.61� and 12.99�, D-phenylalanine and L-phenylalanine are 33.51� and �34.10�, D-tryptophan and L-tryptophan are 31.50� and �32.00�, respec-tively. By comparison with those listed in Chinese
This journal is © The Royal Society of Chemistry 2017

Fig. 2 UV-vis-SWNIR DRS of three chiral compounds.
Paper RSC Advances
Ope
n A
cces
s A
rtic
le. P
ublis
hed
on 2
8 Fe
brua
ry 2
017.
Dow
nloa
ded
on 2
/1/2
022
4:05
:34
AM
. T
his
artic
le is
lice
nsed
und
er a
Cre
ativ
e C
omm
ons
Attr
ibut
ion-
Non
Com
mer
cial
3.0
Unp
orte
d L
icen
ce.
View Article Online
Pharmaceutical Industry Standards, the optical purity of theused three chiral compounds are reliable.
3.1.2 X-ray diffraction patterns. By searching and match-ing, the obtained X-ray diffraction patterns of D- and L-tartaric
Fig. 3 Explained variance of the first three principal components.
This journal is © The Royal Society of Chemistry 2017
acid powders through 200-mesh sieve, as given in Fig. 1, areconsistent with their corresponding standard X-ray diffractionpatterns in the Powder Diffraction File (PDF) card in Interna-tional Centre for Diffraction Data (ICDD). Processing thediffraction data by Jade 6 so gave the detailed crystal
Fig. 4 Three-dimensional projection of PCA of tartaric acid.
RSC Adv., 2017, 7, 13552–13560 | 13555

Fig. 5 Three-dimensional projection of PCA of phenylalanine.
Fig. 6 Three-dimensional projection of PCA of tryptophan.
Fig. 7 Interval partial least square method. (-------) RMSECV of a full-sp
13556 | RSC Adv., 2017, 7, 13552–13560
RSC Advances Paper
Ope
n A
cces
s A
rtic
le. P
ublis
hed
on 2
8 Fe
brua
ry 2
017.
Dow
nloa
ded
on 2
/1/2
022
4:05
:34
AM
. T
his
artic
le is
lice
nsed
und
er a
Cre
ativ
e C
omm
ons
Attr
ibut
ion-
Non
Com
mer
cial
3.0
Unp
orte
d L
icen
ce.
View Article Online
information, which is consistent with the standard crystalinformation. These imply that the used D-, L-tartaric acids arereliable.
3.2 Chiral recognition
3.2.1 UV-vis-SWNIR DRS of three compounds. Fig. 2A–Cshows UV-vis-SWNIR DRS of three chiral compounds, theregion of spectra conned by blocks show clear difference andthere also have other small difference in the rest spectra region.These differences may provide the foundation of chiral analysis.
3.2.2 Chiral recognition by principal component analysis(PCA). The spectra of the three chiral compounds were pro-cessed and classied by principal component analysis (PCA).Experiments showed that the spectra data in the region of 980–1106 nm are easy inuenced by instrument uctuation and PCAis not a chemometrics algorithm with an ability of denoising, inorder to eliminate the inuence, we choose the original spectrain the region of 220–980 nm instead of the whole spectra forchiral recognition.
There are some common rules to choose how many the rstfew PCs to retain in order to account for most variation of thedata.46 The most obvious criterion for choosing the number ofPCs, is to select a (cumulative) percentage of total variancewhich once desires that the selected PCs contribute, say 80% or90%. Although the cumulative variance contribution can behigher or lower depending on the practical details of a partic-ular data set.47 In this case, the rst three principal components(PCs) of PCA are used in data analysis since they retain much ofthe variability of the original dataset. The explained varianceand the cumulative variance contribution rates of the rst-threePCs of the three chiral compounds are shown in Fig. 3. Thecumulative variance contribution rates of rst-three PCs are allover 95%, which means that they present the most informationrelated to the hardness of samples and were key to discriminatechirality.
The PCA scores of the rst-three PCs are used to plot three-dimensional projection by using Matlab's graphics function.
ectrum model.
This journal is © The Royal Society of Chemistry 2017

Fig. 8 Correlation coefficient method.
Table 1 Effect of data preprocessing on PLSR modelling
Data preprocessing
Calibration Validation Prediction
MSEC R2 MSEV R2 MSEP R2
Raw spectra 0.0027 0.9917 0.0038 0.9889 0.00358 0.99051stD 0.0057 0.9826 0.0001 0.9778 0.0064 0.9830SG 0.0027 0.9917 0.0038 0.9892 0.0035 0.9905SNV 0.0048 0.9852 0.0058 0.9840 0.0053 0.9858MSC 0.0048 0.9853 0.0058 0.9821 0.0044 0.98831stD + SNV 0.0080 0.9755 0.0099 0.9709 0.0097 0.9743Baseline 0.0027 0.9917 0.0038 0.9881 0.0035 0.9905Spectroscopic 0.0027 0.9918 0.0043 0.9866 0.0029 0.9921
Paper RSC Advances
Ope
n A
cces
s A
rtic
le. P
ublis
hed
on 2
8 Fe
brua
ry 2
017.
Dow
nloa
ded
on 2
/1/2
022
4:05
:34
AM
. T
his
artic
le is
lice
nsed
und
er a
Cre
ativ
e C
omm
ons
Attr
ibut
ion-
Non
Com
mer
cial
3.0
Unp
orte
d L
icen
ce.
View Article Online
Fig. 4–6 are three-dimensional projection of PCA of the threechiral compounds, respectively. They show that the foursamples of tartaric acid and three samples of phenylalanine andtryptophan all have clear boundaries in three-dimensionalprojection and were split denitely into groups based ondifferent chirality. In summary, UV-vis-SWNIR DRS combinedwith PCA can be used to discriminate chiral compounds.
Table 2 Result of modeling SVR with data preprocessing methods
Data preprocessingUsed parameters of thekernel function
Ca
M
Raw spectra Default Parameters 0.0MSC 0.0Smoothing-SG 0.0Normalize 0.3Spectroscopic 0.0Baseline 0.0Noise 0.0Center and scale 0.01stD 0.2SNV 0.0SNV + 1stD 0.01stD + SNV 0.01stD + SNV Optimal parameters 0.0
This journal is © The Royal Society of Chemistry 2017
3.3 Determination of enantiomeric excess value
Determination of enantiomeric excess value was carried out byprocessing UV-vis-SWNIR DRS of the samples with differentenantiomeric excess value using linear regression model partialleast squares (PLSR) and non-liner regression model supportvector machine regression (SVR). The 72 samples were dividedinto a calibration set with 53 samples and a prediction set with19 samples by randomly for modeling.
3.3.1 Wavelength selection. Fig. 7 and 8 are the results ofwavelength selection by iPLSmethod and correlation coefficientmethod. From Fig. 7 we can see that RMSECV of the eighthinterval, i.e. the wavelength band of 1002–1106 nm is lower thanthe minimum RMSECV of a full-spectrum model, so the eighthinterval was selected as the optimal wavelength band. Fig. 8shows the variation of correlation coefficient (R) with wave-length, and the wavelength bands which have a correlationcoefficient (R) larger than 0.6, 0.7 and 0.8, respectively, weretried and compared in SVR modelling.
3.3.2 Partial least squares regression (PLSR) modelling. Aseries of PLSRmodels were built by different data-processing ondifferent wavelength bands. Their predictive results werecompared in order to optimize model. As a result, PLSRmodeling using the wavelength band of 1002–1106 nm gavebetter predictive results, as shown in Table 1.
Table 1 shows the result of PLSR modelling by different datapreprocessing on the wavelength band of 1002–1106 nm, it canbe seen that spectroscopic preprocess resulted in the optimalpredicted result with a determination coefficient (R2) of 0.9921and a mean standard error (MSE) of 0.0029 for the predictionset.
3.3.3 Support vector machine regression (SVR) modeling.The radial basis function (RBF) was used as the kernel functionfor SVR modelling. SVR model was established aer data pre-processing on the wavelength bands with correlation coefficientR larger than 0.7 selected by correlation coefficient method. Theresults are shown in Table 2 under the conditions using defaultparameters (the kernel parameter g ¼ 0.01, the regularizationparameter c ¼ 100, the insensitive coefficient p ¼ 0.01),
libration Prediction
SE R2 MSE R2
017 0.9950 0.0041 0.9895069 0.9800 0.0344 0.9124017 0.9949 0.0042 0.9894293 0.8334 0.3783 0.8055006 0.9981 0.0018 0.9952030 0.9915 0.0030 0.9922001 0.9997 0.0093 0.9762017 0.9950 0.0041 0.9895998 0.9514 0.3452 0.9608001 0.9996 0.0019 0.9544153 0.9610 0.0184 0.95640009 0.9997 0.0054 0.989400001 0.999996 0.0020 0.9951
RSC Adv., 2017, 7, 13552–13560 | 13557
RSC Advances Paper
Ope
n A
cces
s A
rtic
le. P
ublis
hed
on 2
8 Fe
brua
ry 2
017.
Dow
nloa
ded
on 2
/1/2
022
4:05
:34
AM
. T
his
artic
le is
lice
nsed
und
er a
Cre
ativ
e C
omm
ons
Attr
ibut
ion-
Non
Com
mer
cial
3.0
Unp
orte
d L
icen
ce.
View Article Online
comprehensive considering the determination coefficient (R2)and mean square error (MSE) of calibration set and predictionset, the combination of 1stD with SNV gave the optimalmodeling prediction with R2 of 0.9997 and 0.9894, and MSE of0.00009 and 0.0054 for the calibration set and prediction set,respectively.
By comparison of the results of 1stD + SNV and SNV + 1d 1stD,it was known that the effect of a combination of two spectralpretreatments differs with the order of combination.
Parameters (g, c, p) of SVR modeling are key to obtain goodprediction results. They were optimized in the ranges g [0–0.1], c[0.001–500] and p [0.001–0.1], and the effects of optimization onmodeling were evaluated by 10-fold cross-validation. The lastrow of Table 2 shows the prediction by SVR model aerparameter optimization, it can be seen that R2 of calibrationand prediction is 0.999996 and 0.9951, and MSEP is 0.000001and 0.0020, respectively, when the parameters g, c and pwere setat 0.002, 100 and 0.001, respectively. The predicted result wasobviously improved.
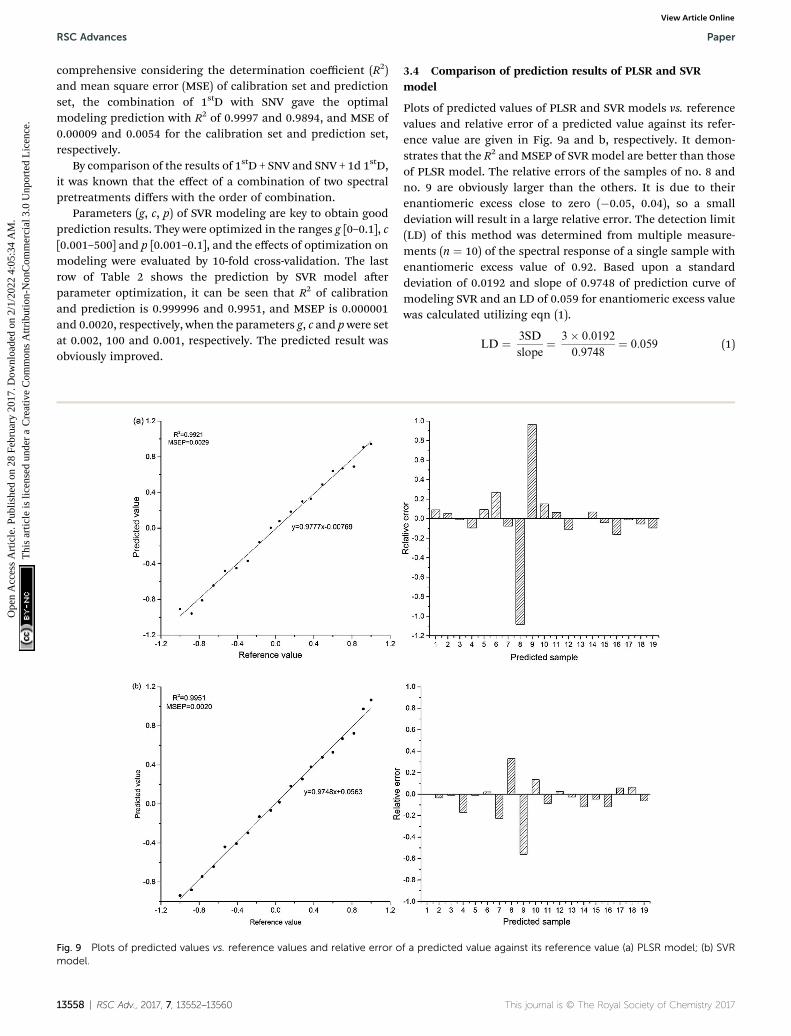
Fig. 9 Plots of predicted values vs. reference values and relative error omodel.
13558 | RSC Adv., 2017, 7, 13552–13560
3.4 Comparison of prediction results of PLSR and SVRmodel
Plots of predicted values of PLSR and SVR models vs. referencevalues and relative error of a predicted value against its refer-ence value are given in Fig. 9a and b, respectively. It demon-strates that the R2 and MSEP of SVR model are better than thoseof PLSR model. The relative errors of the samples of no. 8 andno. 9 are obviously larger than the others. It is due to theirenantiomeric excess close to zero (�0.05, 0.04), so a smalldeviation will result in a large relative error. The detection limit(LD) of this method was determined from multiple measure-ments (n ¼ 10) of the spectral response of a single sample withenantiomeric excess value of 0.92. Based upon a standarddeviation of 0.0192 and slope of 0.9748 of prediction curve ofmodeling SVR and an LD of 0.059 for enantiomeric excess valuewas calculated utilizing eqn (1).
LD ¼ 3SD
slope¼ 3� 0:0192
0:9748¼ 0:059 (1)
f a predicted value against its reference value (a) PLSR model; (b) SVR
This journal is © The Royal Society of Chemistry 2017

Paper RSC Advances
Ope
n A
cces
s A
rtic
le. P
ublis
hed
on 2
8 Fe
brua
ry 2
017.
Dow
nloa
ded
on 2
/1/2
022
4:05
:34
AM
. T
his
artic
le is
lice
nsed
und
er a
Cre
ativ
e C
omm
ons
Attr
ibut
ion-
Non
Com
mer
cial
3.0
Unp
orte
d L
icen
ce.
View Article Online
4 Conclusions
In this study, chiral recognition of three chiral compounds anddetermination of the enantiomeric excess value of tartaric acidsamples based on UV-vis-SWNIR DRS combined with chemo-metric is proposed.
PCA was used for chiral recognition. The cumulative vari-ance contribution of the rst three components of three chiralcompounds were all over 95%. Projections of PCA show thatdifferent samples of each chiral compounds are classied anddiscriminated clearly by UV-vis-SWIR DRS combined with PCA.
Modeling PLSR and modeling SVR are applied to calibratespectra. The determination coefficient (R2) of prediction set byPLSR model and SVR model are 0.9921, 0.9951, and meanstandard error (MSE) of are 0.0029 and 0.0020, respectively.These prove that UV-vis-SWNIR DRS combined with regressionmodels can be used as a simply sample-preprocessing, rapid,convenient and inexpensive method to determine the enantio-meric excess of chiral enantiomers.
Acknowledgements
This work was supported by the Science and Technology specialfund of Sichuan Provincial Administration of TraditionalChinese Medicine, China (No. 2016Q058) and the ScienticResearch Foundation of the Education Department of SichuanProvince, China (No. 16ZB0122).
References
1 J. Thomas and J. D. Wilcox, Chirality, 2003, 15, 256.2 T. Hattori, Y. Minato, S. L. Yao, M. G. Finn and S. Miyano,Tetrahedron Lett., 2001, 42, 8015.
3 M. T. Reetz, K. M. Kuhling, H. Hinrichs and A. Deege,Chirality, 2000, 12, 479–482.
4 L. Kott, W. B. Holzheuer, M. M. Wong and G. K. Webster, J.Pharm. Biomed. Anal., 2007, 43, 57–65.
5 H. G. Brittain, J. Pharm. Biomed. Anal., 1998, 17, 933.6 W. H. Pirkle and D. L. Sikkenga, Chem. Informationsdienst,1977, 42, 1370.
7 A. Peter, G. Torok and D.W. Armstrog, J. Chromatogr. A, 1998,793, 283.
8 K. Monde, N. Harada, M. Takasugi, P. Kutschy, M. Suchy andM. Dzurilla, J. Nat. Prod., 2000, 63, 1312.
9 J. Chen and W. Shum, Tetrahedron Lett., 1993, 34, 7663.10 V. Schurig, D. Schmalzing and M. Schleimer, Angew. Chem.,
Int. Ed., 1991, 30, 987–989.11 G. Gubitz andM. G. Schmid, J. Chromatogr. A, 1997, 792, 179.12 A. W. I. Wan, D. Hermawan and M. M. Sanagi, J. Chromatogr.
A, 2007, 1170, 107.13 H. Y. Cheng, B. K. He, Q. L. Zhang and Y. Tu, Anal. Sci., 2010,
26, 1087.14 D. Wistuba and V. Schurig, Enantiomer separation of chiral
pharmaceuticals by capillary electrochromatography, J.Chromatogr. A, 2000, 875, 255.
This journal is © The Royal Society of Chemistry 2017
15 L. M. Wu, E. C. Meurer and R. G. Cooks, Chiral morphingand enantiomeric quantication in mixtures by massspectrometry, Anal. Chem., 2004, 76, 663.
16 C. D. Tran and D. Oliveira, Anal. Biochem., 2006, 356, 51.17 S. O. Fakayode, M. A. Busch, D. J. Bellert and K. W. Busch,
Analyst, 2005, 130, 233.18 Y. F. Xu and M. Mccarroll, J. Photochem. Photobiol., A, 2006,
178, 50.19 C. D. Tran and S. F. Yu, J. Phys. Chem., 2005, 109, 12627.20 S. O. Fakayode, M. A. Busch and K. W. Busch, Talanta, 2006,
8, 1574.21 S. O. Fakayode, I. M. Swamidoss, M. A. Busch and
K. W. Busch, Talanta, 2005, 65, 838.22 K. W. Busch, I. M. Swamidoss, S. O. Fakayode and
M. A. Busch, Anal. Chim. Acta, 2004, 525, 53.23 Q. Q. Li, J. Duan, L. J. Wu, Y. Huang, G. Tang and S. G. Min,
Chin. Chem. Lett., 2012, 23, 1055.24 Q. Q. Li, Y. Huang, J. Duan, L. J. Wu, G. Tang, Y. W. Zhu and
S. G. Min, Spectrochim. Acta, Part A, 2013, 101, 349.25 J. R. Ingle, K. W. Busch and M. A. Busch, Talanta, 2008, 75,
72–84.26 M. J. Politi, C. D. Tran and G. H. Ga, J. Phys. Chem., 1995, 99,
14137–14141.27 J. D. Yang, Fenxi Kexue Xuebao, 2006, 22, 454.28 K. M. Spencer, R. B. Edmonds, R. D. Rauh and
M. M. Carrabba, Anal. Chem., 1994, 66, 1269.29 L. Hecht, A. L. Phillips and L. D. Barron, J. Raman Spectrosc.,
1995, 26, 727.30 K. M. Spencer, S. J. Cianciosi, J. E. Baldwin, T. B. Freedman
and L. A. Nae, Appl. Spectrosc., 1990, 44, 235.31 L. A. Nae, F. J. Long, T. B. Freedman, H. Buijs, A. Rilling,
J. R. Roy and R. K. Dukor, The eleventh internationalconference on Fourier transform spectroscopy, 1998, vol. 430,p. 432.
32 Z. Guo, X. G. Hu, G. Y. Fang, S. Shao, A. Guo and H. Y. Liang,Thermochim. Acta, 2012, 534, 51.
33 Z. Guo, X. G. Hu, G. Y. Fang, S. Shao, A. Guo and H. J. Zhang,J. Chem. Eng. Data, 2011, 56, 2489.
34 G. X. Song, F. L. Zhou, C. L. Xu and B. X. Li, Analyst, 2016,141, 1257.
35 G. X. Song, F. L. Zhou and B. X. Li, Sens. Actuators, B, 2015,215, 504.
36 C. W. Liu, J. W. Lian, Q. Liu, C. L. Xu and B. X. Li, Anal.Methods, 2016, 8, 5794.
37 S. Agatonovic-Kustrin, R. Beresford and M. Razzak, Anal.Chim. Acta, 2000, 417, 31.
38 S. Agatonovic-Kustrin and R. Alany, Anal. Chim. Acta, 2001,449, 157.
39 M. Yamaguchi, F. Miyamaru, K. Yamamoto, M. Tani andM. Hangyo, Phys. Lett., 2005, 86, 822.
40 R. Nishikiori, M. Yamaguchi, K. Takano, T. Enatsu, M. Tani,N. Kawashita, T. Takagi, S. Morimoto, M. Hangyo andM. Kawase, Chem. Pharm. Bull., 2008, 56, 305.
41 X. L. Li, K. L. Xu, H. Li, S. Yao, Y. F. Li and B. Liang, RSC Adv.,2016, 6, 8395.
42 B. Liang, X. L. Li, X. L Jing, T. Li and S. Yao, J. Sichuan Univ.,Eng. Sci. Ed., 2016, 48, 191.
RSC Adv., 2017, 7, 13552–13560 | 13559

RSC Advances Paper
Ope
n A
cces
s A
rtic
le. P
ublis
hed
on 2
8 Fe
brua
ry 2
017.
Dow
nloa
ded
on 2
/1/2
022
4:05
:34
AM
. T
his
artic
le is
lice
nsed
und
er a
Cre
ativ
e C
omm
ons
Attr
ibut
ion-
Non
Com
mer
cial
3.0
Unp
orte
d L
icen
ce.
View Article Online
43 S. Datta and D. J. Grant, Nat. Rev. Drug Discovery, 2004, 3, 42.44 Y. Y. Feng, X. L. Li, K. L. Xu, H. Y. Zou, H. Li and B. Liang, J.
Pharm. Biomed. Anal., 2015, 104, 112.45 P. Esseiva, F. Anglada, L. Dujourdy, F. Taroni, P. Margot,
E. D. Pasquier, M. Dawson, C. Roux and P. Doble, Talanta,2005, 67, 360.
46 S. Rezzi, D. E. Axelson, K. Heberger, F. Reniero, C. Marianiand C. Guillou, Anal. Chim. Acta, 2005, 552, 13.
13560 | RSC Adv., 2017, 7, 13552–13560
47 I. T. Jolliffe, Principal Component Analysis, Springer, Berlin,New York, 2nd edn, 1986.
48 L. Norgaard, A. Saudland, J. Wagner, J. P. Nielsen, L. Munckand S. B. Engels, Appl. Spectrosc., 2000, 54, 413.
49 W. Luo, J. Wu, X. Wang, X. Lin and H. Li, Anal. Methods,2013, 5, 1337.
50 U. Thissen, M. Pepers, B. Ustun, W. J. Melssen andL. M. C. Buydens, Chemom. Intell. Lab. Syst., 2004, 73, 169.
This journal is © The Royal Society of Chemistry 2017


![The Biomimetic Synthesis and Final Structure Determination ... · 3) Although clarifying the absolute configuration was intended in [11], the stereodescriptors in the enantiomeric](https://static.fdocuments.in/doc/165x107/60de76adf03d7759ff7dd5b3/the-biomimetic-synthesis-and-final-structure-determination-3-although-clarifying.jpg)