Modernization of the Chinese Navy: Implications for Southeast Asia

Chinese Investment in Southeast Asia, 2005-2019: Patterns and Significance
Policy Briefing – SEARBO
By Evelyn Goh and Nan Liu, Strategic & Defence Studies Centre,Coral Bell School of Asia Pacific Affairs
The AuthorsProfessor Evelyn Goh is the Shedden Professor of Strategic Policy Studies at the Australian National University, where she is also Research Director at the Strategic & Defence Studies Centre. She has published widely on U.S.-China relations and diplomatic history, regional security order in East Asia, Southeast Asian strategies towards great powers, and environmental security. These include The Struggle for Order: Hegemony, Hierarchy and Transition in Post-Cold War East Asia (Oxford University Press, 2013); ‘Great Powers and Hierarchical Order in Southeast Asia: Analyzing Regional Security Strategies’, International Security 32:3 (Winter 2007/8):113-57; and Constructing the US Rapprochement with China, 1961-1974 (Cambridge University Press, 2004). Her most recent edited volume is Rising China’s Influence in Developing Asia (Oxford University Press, 2016), and her latest book (co-authored with Barry Buzan) is Re-thinking Sino-Japanese Alienation: History Problems and Historical Opportunities (Oxford University Press, 2020).
Nan Liu is a research officer of the SEARBO project. She received her Master of Business Information Systems from the Australian National University’s College of Business and Economics, and her Bachelor of Economics and Finance from the University of Hong Kong. She is experienced in conducting both quantitative and qualitative research in the fields of economics and strategic studies.
Front cover image: Dam construction for energy supply in the lower reaches of the Nam Ou (CC BY-SA 3.0) Image by Tbachner on Wikimedia Commons.
Co-sponsored by
Published by

1
Policy Briefing – SEARBO August 2021
About the BriefThis Brief provides an overview and analysis of the Quantitative Report, the first of two reports prepared for the research package on ‘Chinese investment and domestic regime legitimacy in Southeast Asia’, part of the ANU Project on Supporting the Rules-Based Order in Southeast Asia (SEARBO) Phase II, 2020-Sept 2021, supported by DFAT. Please contact the authors for the full Quantitative Report.
Recommended citation:
Evelyn Goh and Nan Liu, ‘Chinese Investment in Southeast Asia, 2005-19: Patterns and Significance,’ SEARBO Policy Briefing, New Mandala, August 2021.
DISCLAIMERThis article is part of a New Mandala series related to the Supporting the Rules-Based Order in Southeast Asia (SEARBO) project. This project is run by the Department of Political and Social Change at the Australian National University and funded by the Australian Department of Foreign Affairs and Trade. The opinions expressed here are the authors’ own and are not meant to represent those of the ANU or DFAT.

2
Chinese Investment in Southeast Asia
Introduction Southeast Asia’s growing economic linkages with and dependence on China for investment have generated political opportunities and strategic concerns in equal measure. However, recent discussions have tended to focus on infrastructure projects, especially those associated with the Belt and Road Initiative (BRI). This narrow focus can be misleading, and an understanding of the fuller picture of Chinese investments in Southeast Asia is necessary for those seeking to understand its significance and impacts. The People’s Republic of China (PRC) is not a new player in this game, having had a longer history of providing investment and aid in this region, particularly in support of independence struggles and civil and regional conflicts during the Cold War1. After 1990 and reflecting Beijing’s economic reform and internationalisation strategy, Chinese investment in Southeast Asia picked up gradually across varied sectors. Prior to President Xi Jinping’s unveiling in 2013 of what has come to be called BRI, Southeast Asia had already seen a turning point in the growing significance of Chinese investments during the global financial crisis in 2008/9.
This report is part of a research project that analyses China’s contemporary influence in Southeast Asia by investigating the impacts of Chinese investment on domestic regime security and legitimacy. That larger project provides an important region-wide, multi-sectoral analysis that allows comparisons and facilitates policy calibration and focus. In this first of two reports, we present the baseline quantitative survey and analysis of key changes in Chinese investments in Southeast Asian economies over the most recent 15 years, from 2005 to 2019, for which comparable data is available.2
1 See Shu Guang Zhang, Beijing’s Economic Statecraft during the Cold War, 1949-1991 (Baltimore: Johns Hopkins University Press, 2014).
2 We used the final version of the China Global Investment Tracker 2019 fall dataset (accessed in January 2020) and ASEAN Statistical Yearbooks to construct the dataset for this quantitative survey and analysis. The second, qualitative report analyses key connections between the level and character of Chinese investment, and regime security in Southeast Asian countries.

3
Policy Briefing – SEARBO August 2021
Region-wide trends Foreign investments in Southeast Asia (SEA) originating from China grew twentyfold during this 15-year period. This trend is more marked when we define foreign investments as including both ownership acquisition of specific enterprises, and service provision (such as construction contracts). As Figure 1 shows, the first phase of rapidly expanding Chinese investments in SEA occurred around 2009-12, when temporary declines in other sources of foreign direct investment (FDI) following the global financial crisis coincided with Beijing’s ‘going out’ strategy encouraging international investment by domestic enterprises. The second phase of rapid increase took place between 2013 and 2017, following the official announcement of BRI, which further enabled log-rolling outward investment from multiple Chinese enterprises. Indeed, the vast majority of very large (at least US$1 billion) Chinese investments came after the advent of the BRI in 2013 for all SEA countries except Vietnam and Myanmar (as indicated in red and pink on Figure 2).
Figure 1: Chinese investments (in US$mn) in SEA, 2005-19
Data Source: China Global Investment Tracker 2019 Fall Dataset (accessed in Jan 2020) and ASEAN Statistical Yearbooks

4
Chinese Investment in Southeast Asia
Figure 2: Number of Chinese investments worth at least US$1bn in SEA countries, 2005-19
Even so, at a region-wide level, China is not yet a dominant investor. Between 2005 and 2018 China featured in the top three (non-ASEAN) foreign investors list in SEA only twice (in 2012 and 2018, both in third place – see Table 1). In each instance, China’s share of SEA’s total annual FDI was only half that of the second largest investor, Japan. The EU, Japan, and the United States remained the three largest sources of FDI for SEA across this period.
Table 1: Top three (non-ASEAN) foreign investors in SEA, 2005-18 Chinese FDI to SEA
(in USD millions)Year Total
Largest investor Second largest investor Third largest investor
Investor Amount Share Investor Amount Share Investor Amount Share Amount Share
2005 39,629 EU 10,016 25% Japan 6,655 17% US 3,946 10% 538 1%
2006 54,967 EU 10,672 19% Japan 10,223 19% US 3,406 6% 1,016 2%
2007 69,482 EU 18,384 26% Japan 8,382 12% US 6,346 9% 1,227 2%
2008 60,596 EU 12,445 21% Japan 7,654 13% US 3,393 6% 1,497 2%
2009 43,365 EU 5,660 13% US 5,181 12% Japan 3,451 8% 2,069 5%
2010 108,174 EU 21,145 20% US 13,682 13% Japan 12,987 12% 3,489 3%
2011 87,563 EU 24,419 28% US 8,197 9% Japan 7,798 9% 7,194 8%
2012 116,774 US 18,911 16% Japan 14,853 13% China 7,975 7% 7,975 7%
2013 120,966 Japan 24,609 20% EU 15,719 13% US 11,458 9% 6,165 5%
2014 130,115 EU 28,943 22% US 21,141 16% Japan 13,436 10% 6,812 5%
2015 118,667 US 22,913 19% EU 20,373 17% Japan 12,962 11% 6,572 6%
2016 118,960 EU 34,015 29% US 21,663 18% Japan 14,242 12% 9,610 8%
2017 147,085 US 24,891 17% Japan 16,149 11% EU 14,916 10% 13,701 9%
2018 152,755 EU 21,614 14% Japan 20,955 14% China 9,940 7% 99,40 7%
Data Source: ASEAN Statistical Yearbooks
Data Source: China Global Investment Tracker 2019 Fall Dataset (accessed in Jan 2020)

5
Policy Briefing – SEARBO August 2021
Within these limitations, however, China has diversified its SEA investments across industrial sectors as well as host countries, laying a broader-based foundation for the potential impacts and influence of Chinese investment in the region. As Figure 3 demonstrates, from an earlier investment profile resting heavily on the energy sector in 2005-10, Chinese investments significantly diversified in scope in 2011-19, doubling in infrastructure, metals and other sectors. In particular, the infrastructure sector’s average share of total Chinese investments in the latter period rose to 31%, slightly lower than the leading energy sector’s 37% share. The domain of Chinese investments also expanded: in 2005-7, they barely covered half the SEA countries and were concentrated significantly in Indonesia; but from 2008 these were spread across all ten SEA countries, with at least 70% receiving large Chinese investments every year. China’s growing SEA investment footprint results from greatly increased mobilizable Chinese capital as well as the proliferation of investment opportunities as the diverse SEA economies have undergone different stages of transition and development.
Figure 3: Distribution of Chinese investments in SEA by industrial sector, 2005-19
Distribution of Chinese investments in SEAIt would be a mistake to regard all Chinese investments to be of one type. SEA is a large and varied political-economic landscape, and Chinese state-owned and private investors have pursued different purposes – commercial, political, strategic – when making large investments in this neighbouring region. At the same time, SEA states and political and business actors have courted Chinese investments to fulfil combinations of goals related to power and profit, to different extents and with varying results.
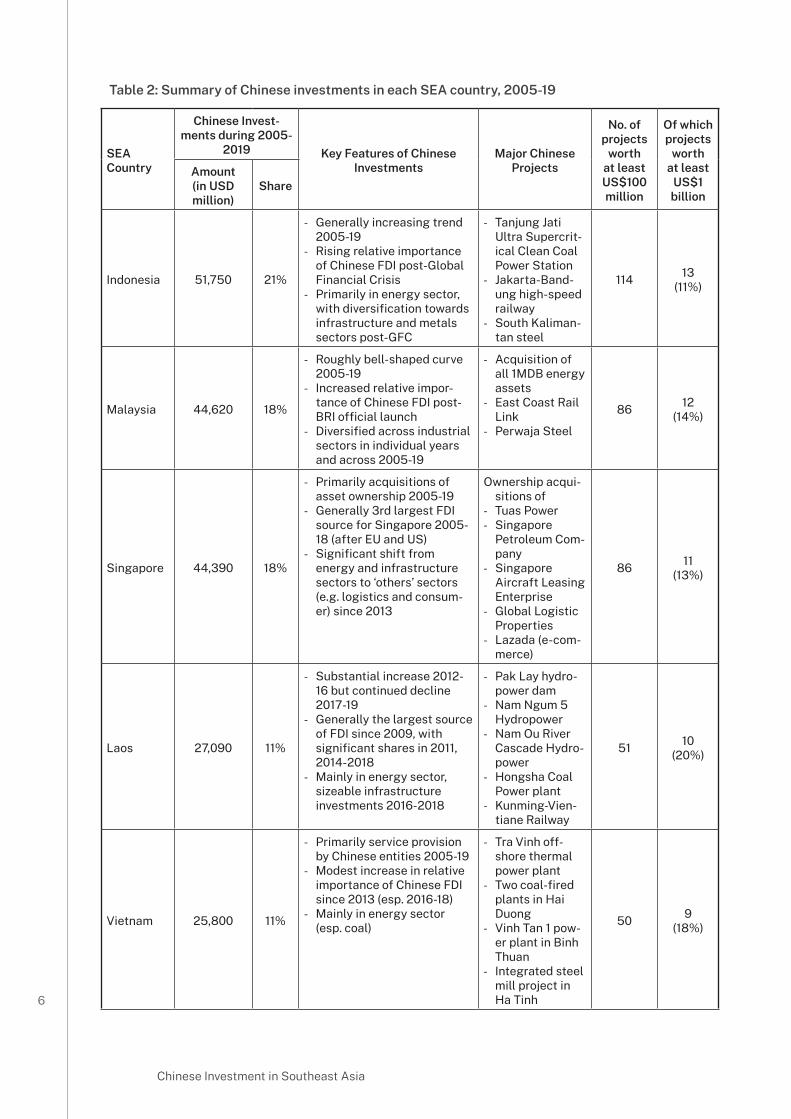
Table 2 presents a summary outlining the relative distribution of Chinese investments across the ten SEA countries in 2005-19, and highlights key features and examples of these investments in each country.3
3 For details about Chinese investment volumes, distribution, and projects in each country, see the full Quantitative Report.
Data Source: China Global Investment Tracker 2019 Fall Dataset (accessed in Jan 2020)
6
Chinese Investment in Southeast Asia
SEA Country
Chinese Invest-ments during 2005-
2019 Key Features of Chinese Investments
Major Chinese Projects
No. of projects
worth at least US$100 million
Of which projects
worth at least
US$1 billion
Amount (in USD million)
Share
Indonesia 51,750 21%
- Generally increasing trend 2005-19
- Rising relative importance of Chinese FDI post-Global Financial Crisis
- Primarily in energy sector, with diversification towards infrastructure and metals sectors post-GFC
- Tanjung Jati Ultra Supercrit-ical Clean Coal Power Station
- Jakarta-Band-ung high-speed railway
- South Kaliman-tan steel
114 13(11%)
Malaysia 44,620 18%
- Roughly bell-shaped curve 2005-19
- Increased relative impor-tance of Chinese FDI post-BRI official launch
- Diversified across industrial sectors in individual years and across 2005-19
- Acquisition of all 1MDB energy assets
- East Coast Rail Link
- Perwaja Steel
86 12(14%)
Singapore 44,390 18%
- Primarily acquisitions of asset ownership 2005-19
- Generally 3rd largest FDI source for Singapore 2005-18 (after EU and US)
- Significant shift from energy and infrastructure sectors to ‘others’ sectors (e.g. logistics and consum-er) since 2013
Ownership acqui-sitions of
- Tuas Power- Singapore
Petroleum Com-pany
- Singapore Aircraft Leasing Enterprise
- Global Logistic Properties
- Lazada (e-com-merce)
86 11(13%)
Laos 27,090 11%
- Substantial increase 2012-16 but continued decline 2017-19
- Generally the largest source of FDI since 2009, with significant shares in 2011, 2014-2018
- Mainly in energy sector, sizeable infrastructure investments 2016-2018
- Pak Lay hydro-power dam
- Nam Ngum 5 Hydropower
- Nam Ou River Cascade Hydro-power
- Hongsha Coal Power plant
- Kunming-Vien-tiane Railway
51 10(20%)
Vietnam 25,800 11%
- Primarily service provision by Chinese entities 2005-19
- Modest increase in relative importance of Chinese FDI since 2013 (esp. 2016-18)
- Mainly in energy sector (esp. coal)
- Tra Vinh off-shore thermal power plant
- Two coal-fired plants in Hai Duong
- Vinh Tan 1 pow-er plant in Binh Thuan
- Integrated steel mill project in Ha Tinh
50 9(18%)
Table 2: Summary of Chinese investments in each SEA country, 2005-19

7
Policy Briefing – SEARBO August 2021
Cambodia 14,580 6% - Substantial increase since 2016
- Largest source of FDI in Cambodia 2005-18 (except in 2008 and 2009), with considerable shares
- Shift from energy sector mainly to infrastructure since 2015
- Phnom Penh-Si-hanoukville Expressway
- Two coal-fired power units in Sihanoukville
- Steel plant and industrial zone in Preah Vihear
39 3(8%)
Philippines 12,400 5% - Generally increasing trend since 2016, primarily service provision by Chinese enti-ties during 2005-19
- Insignificant source of over-all FDI 2005-18
- Predominantly in energy sector, with increasing in-vestments in infrastructure since 2016
- Acquisition of National Grid Corporation of the Philippines
- Thermal facility in Kauswagan
- Coal-fired power plant in Dinginin
- Investment in Mislatel (telecommuni-cations)
26 3(12%)
Thailand 10,700 4% - Relatively stable trend 2005-19 (apart from a spike in 2018)
- Generally low relative importance of Chinese FDI 2005-18
- Shift from the ‘others’ sector (e.g. property and consumer) to infrastructure since 2012
- Thailand-China railway
- Acquisition of True Corp (telecommuni-cations)
- High-Speed Rail Linking Three Airports
- Highly auto-mated solar module and cell manufacturing facilities in Rayong
30 1(3%)
Myanmar 9,480 4% - Primarily ownership acquisi-tion of assets in late 2000s and late 2010s
- Among top 3 sources of FDI 2005-18, significant shares 2008-13
- Relatively diversified across industrial sectors across time, but substantially con-centrated in single sector in each year
- Kyaukphyu oil-gas pipeline
- Dawei oil refin-ery
- Kyaukphyu deep-sea port
- Tagaung Taung Nickel Mine
- Letpadaung Copper Mine
21 3(14%)
Brunei 4,110 2% - Sporadic pattern 2005-19 (concentrated mainly in 2014)
- Insignificant source of FDI 2005-18
- Predominantly in energy sector
- Pulau Muara Besar oil refinery and petrochemical complex
- Sultan Haji Omar Ali Saifuddien Bridge
4 1(25%)
Data Source: China Global Investment Tracker 2019 Fall Dataset (accessed in Jan 2020)

8
Chinese Investment in Southeast Asia
Figure 4: Distribution of Chinese investments in SEA by country, 2005-19
Using the volume-based distribution of Chinese investments, SEA countries can be categorised into three groups (Figure 4).
(1) Indonesia, Malaysia, Singapore:
These three key maritime SEA economies were the top three destinations, together accounting for 57% of total Chinese investments in SEA.
Over the whole period, Indonesia retained its position as the top SEA destination for Chinese investments even though its share fell from 60% in 2005-7 to 20% in 2008-19. With the global financial crises, the Chinese investment profile in Indonesia switched from an initial concentration in service provision to include ownership acquisitions, coinciding with the relative decline of FDI from traditional external investors like the US and EU, in 2009-2013. After the official launch of Beijing’s BRI, Chinese investments in Indonesia more than quadrupled from roughly US$2 billion in 2013 to US$8.5 billion in 2015, and from 2014, China ranked consistently among the top three external investors in Indonesia. Chinese investments also diversified across the energy, infrastructure and metals sectors. Much political attention has been paid to large infrastructure projects like the $2.4 billion Jakarta-Bandung Highspeed Rail4 and indeed this sector attracted a fifth of total Chinese investments. However, the energy sector accounted for the bulk—around 55% —of Chinese investments, mainly in coal and hydropower projects.
4 The second most valuable Chinese infrastructure investment recorded in SEA in a single year, after the Thailand-China railway project, also agreed in 2018.
Data Source: China Global Investment Tracker 2019 Fall Dataset (accessed in Jan 2020)
9
Policy Briefing – SEARBO August 2021
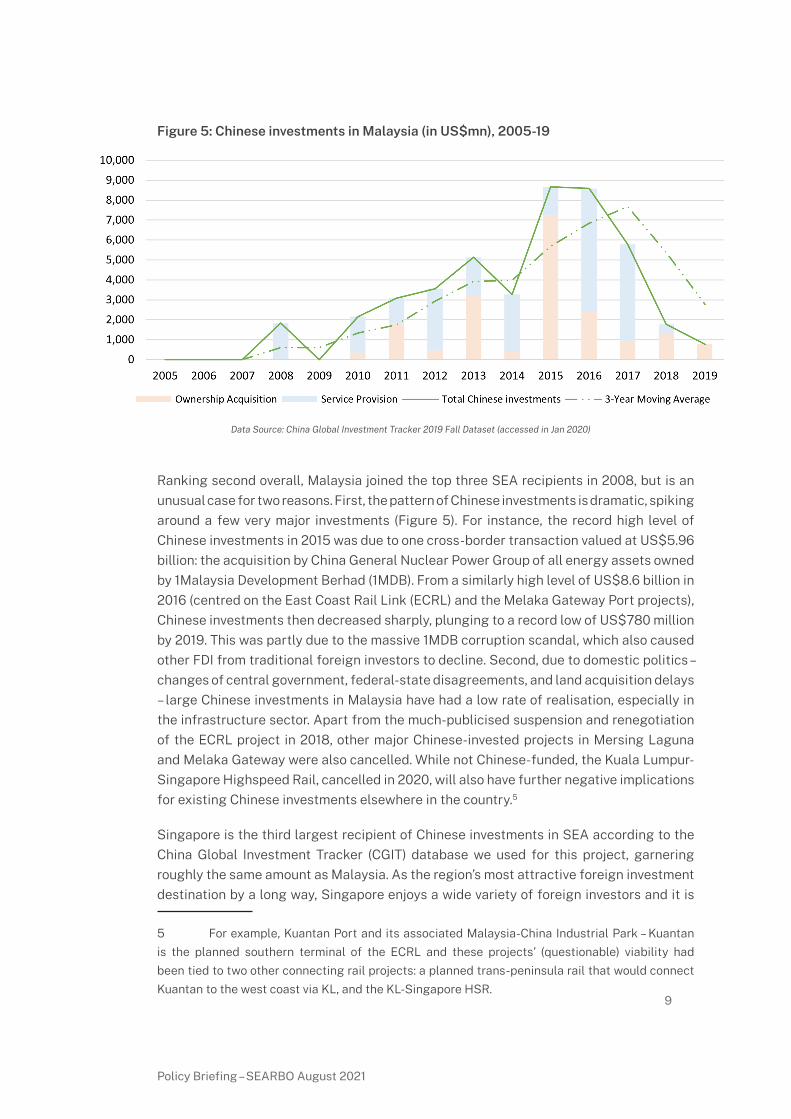
Figure 5: Chinese investments in Malaysia (in US$mn), 2005-19
Ranking second overall, Malaysia joined the top three SEA recipients in 2008, but is an unusual case for two reasons. First, the pattern of Chinese investments is dramatic, spiking around a few very major investments (Figure 5). For instance, the record high level of Chinese investments in 2015 was due to one cross-border transaction valued at US$5.96 billion: the acquisition by China General Nuclear Power Group of all energy assets owned by 1Malaysia Development Berhad (1MDB). From a similarly high level of US$8.6 billion in 2016 (centred on the East Coast Rail Link (ECRL) and the Melaka Gateway Port projects), Chinese investments then decreased sharply, plunging to a record low of US$780 million by 2019. This was partly due to the massive 1MDB corruption scandal, which also caused other FDI from traditional foreign investors to decline. Second, due to domestic politics – changes of central government, federal-state disagreements, and land acquisition delays – large Chinese investments in Malaysia have had a low rate of realisation, especially in the infrastructure sector. Apart from the much-publicised suspension and renegotiation of the ECRL project in 2018, other major Chinese-invested projects in Mersing Laguna and Melaka Gateway were also cancelled. While not Chinese-funded, the Kuala Lumpur-Singapore Highspeed Rail, cancelled in 2020, will also have further negative implications for existing Chinese investments elsewhere in the country.5
Singapore is the third largest recipient of Chinese investments in SEA according to the China Global Investment Tracker (CGIT) database we used for this project, garnering roughly the same amount as Malaysia. As the region’s most attractive foreign investment destination by a long way, Singapore enjoys a wide variety of foreign investors and it is
5 For example, Kuantan Port and its associated Malaysia-China Industrial Park – Kuantan is the planned southern terminal of the ECRL and these projects’ (questionable) viability had been tied to two other connecting rail projects: a planned trans-peninsula rail that would connect Kuantan to the west coast via KL, and the KL-Singapore HSR.
Data Source: China Global Investment Tracker 2019 Fall Dataset (accessed in Jan 2020)

10
Chinese Investment in Southeast Asia
possible that Singapore’s share of Chinese investments is higher than this, especially if all forms of indirectly-routed Chinese investments could be taken into account. Within the SEA context, the city-state is a singular case because of its economic profile, which leans towards specialist heavy industries, finance and services. Chinese investment patterns were punctuated by major acquisitions reflecting Chinese corporate interest in acquiring several strategic service providers. For example, in 2008-9, Chinese consortiums spent over $5 billion on one of the island’s three electricity generation companies (Tuas Power) and the Singapore Petroleum Company when the sector was privatised. But the lion’s share of Chinese investments from 2013 went into services: Alibaba’s acquisition and investment in Lazada, a Singaporean e-commerce company, pumped US$4 billion into the island’s economy in 2016-18; while in 2017, Chinese investments hit a record high when a Chinese consortium paid US$10 billion for Singapore-listed Global Logistic Properties, the largest warehouse operator in Asia.
(2) Laos and Vietnam:
These two SEA economies each attracted around 11% -- together accounting for just over a fifth -- of all Chinese investments in SEA.
As might be expected, these two mainland neighbours received significant portions of Chinese investment in 2005-19, notably in the energy sector – mainly hydropower in Laos, and coal in Vietnam. Laos also received sizeable Chinese infrastructure investment in 2016-18 for the railway connecting Kunming and Vientiane, part of the larger north-south regional network supported by ASEAN and BRI connectivity initiatives (Figure 6). Both Vietnam and Laos saw larger than regional average proportions of high-value (> US$1 billion) Chinese projects —18% and 20% respectively—with patterns of Chinese investment driven by a few clearly identifiable high-value acquisitions or contracts. For example, the two clear peaks in Chinese investments in Vietnam (see Figure 7) were tied to one thermal power plant in 2010, and two coal plant-related investments in 2015. Such large investments similarly marked the energy sector in Laos, where major Chinese-backed hydropower projects include Pak Lay (US$1.7bn), Nam Ngum 5 (US$1bn), and the Nam Ou cascade (US$2bn) – projects that have generated civil society opposition and controversy. Moreover, contracts for the Kunming-Vientiane railway accounted for a quarter of Chinese investments in Laos in 2016, and two-thirds in 2017.

11
Policy Briefing – SEARBO August 2021
Figure 6: Chinese investments in Laos (in US$mn) by industrial sector, 2005-19
Figure 7: Chinese investments in Vietnam (in US$mn), 2005-19
Data Source: China Global Investment Tracker 2019 Fall Dataset (accessed in Jan 2020)
Data Source: China Global Investment Tracker 2019 Fall Dataset (accessed in Jan 2020)

12
Chinese Investment in Southeast Asia
Laos experienced a sharp increase in Chinese investments between 2013 and 2017, coinciding in part with BRI, but Chinese investment in Vietnam has been on a declining trajectory since the peak in 2010. This is related to their bilateral political tensions over conflicting territorial claims in the South China Sea, with key episodes in 2011, 2012, 2014 and 2016 coinciding with troughs in received Chinese investments. Vietnam’s top foreign investments originate in South Korea, Japan and the EU, but it consistently receives over 40% of its FDI from other countries. By ASEAN records, the largest share of FDI in Vietnam China achieved was 11% in 2013, compared to 79% in Laos (2018). Because both these countries receive significant proportions of Chinese investments in the form of service provision, they may be more dependent on Chinese investment than we are able to show here by comparing top FDI sources based on relative ownership acquisition investments alone.6 Nevertheless, even based just on ownership investment, since 2009, Laos is one of the two SEA economies most dependent on Chinese investments (the other being Cambodia).
(3) Cambodia, Philippines, Thailand, Myanmar, and Brunei
Each of these countries received 6% or less, together accounting for 21%, of total Chinese investments in SEA.
Within this group, Cambodia and Myanmar stand out for the high significance of Chinese investment in their economies, despite the smaller amounts involved relative to the two groups above. Of all the SEA countries, Cambodia alone has consistently logged China as its top non-ASEAN FDI source in 2005-18 (excepting 2008 and 2009, when it was topped by South Korea). Unlike Laos, however, Cambodia attracts a wider range of FDI and thus is less reliant on Chinese investment—for example, within the 2014-18 BRI period, China provided an average of 27% of FDI in Cambodia, compared to 70% in Laos (see Tables 3 and 4). Myanmar’s reliance on Chinese FDI correlated with the periods of international isolation under military rule—between 2008 and 2013 especially, an average of 40% of Myanmar’s FDI came from China, with a peak of 68% in 2010 (the year before the SPDP regime decided to undertake some political-economic reforms, partly to reduce dependence on China). That peak amount was due to a US$1.02bn investment in the Kyaukphyu oil and gas pipeline, one of three very large Chinese investments in Myanmar, alongside the US$2.1bn project to build Myanmar’s first oil refinery in Dawei (2016), and the controversial US$1.48bn Letpadaung open-cast copper mine (2010).
6 See the full Quantitative Report for an explanation of the data constraints preventing us from systematically comparing foreign investments that include both ownership acquisition and service provision.

Table 3: Top three (non-ASEAN) foreign investors in Cambodia, 2005-18 Chinese FDI to Cambodia
(in USD millions)Year Total
Largest investor Second largest investor Third largest investor
Investor Amount Share Investor Amount Share Investor Amount Share Amount Share
2005 381 China 103 27% S. Korea 72 19% Australia 24 6% 103 27%
2006 483 China 130 27% US 51 10% S. Korea 27 6% 130 27%
2007 867 China 165 19% S. Korea 119 14% EU 80 9% 165 19%
2008 815 S. Korea 203 25% China 77 9% EU 77 9% 77 9%
2009 539 S. Korea 98 18% China 97 18% India 28 5% 97 18%
2010 783 China 127 16% S. Korea 47 6% EU 43 6% 127 16%
2011 892 China 180 20% S. Korea 139 16% EU 54 6% 180 20%
2012 1,557 China 368 24% S. Korea 162 10% EU 126 8% 368 24%
2013 1,275 China 287 22% S. Korea 178 14% EU 116 9% 287 22%
2014 1,727 China 554 32% EU 139 8% S. Korea 106 6% 554 32%
2015 1,701 China 538 32% EU 180 11% S. Korea 72 4% 538 32%
2016 2,280 China 502 22% Japan 199 9% EU 194 9% 502 22%
2017 2,732 China 618 23% Japan 227 8% EU 214 8% 618 23%
2018 3,103 China 798 26% S. Korea 250 8% Japan 199 6% 798 26%
Data Source: ASEAN Statistical Yearbooks
Table 4: Top three (non-ASEAN) foreign investors in Laos, 2005-18 Chinese FDI to Laos
(in USD millions)Year Total
Largest investor Second largest investor Third largest investor
Investor Amount Share Investor Amount Share Investor Amount Share Amount Share
2005 28 EU 8 28% China 5 16% Australia 4 15% 5 16%
2006 187 EU 158 84% China 5 3% US 1 1% 5 3%
2007 324 Japan 18 6% EU 15 5% S. Korea 15 5% 2 1%
2008 228 S. Korea 47 21% China 43 19% EU 10 4% 43 19%
2009 319 China 36 11% Japan 14 4% EU 11 3% 36 11%
2010 333 China 46 14% EU 28 8% Japan 8 2% 46 14%
2011 467 China 278 60% Japan 12 3% Russia 5 1% 278 60%
2012 294 N/A N/A N/A
2013 427 N/A N/A N/A
2014 913 China 614 67% EU 51 6% Australia 16 2% 614 67%
2015 1,079 China 665 62% Japan 76 7% S. Korea 46 4% 665 62%
2016 1,076 China 710 66% S. Korea 77 7% Japan 44 4% 710 66%
2017 1,695 China 1,314 77% S. Korea 102 6% Japan 70 4% 1,314 77%
2018 1,320 China 1,045 79% Japan 48 4% S. Korea 25 2% 1,045 79%
Data Source: ASEAN Statistical Yearbooks

14
Chinese Investment in Southeast Asia
In contrast, the Philippines, Thailand and Brunei attract small proportions of Chinese investment in SEA, and also do not count China among their most significant FDI sources. The reasons vary. By a large margin, the Philippines’ top foreign investor is the US (followed by Japan, the EU, and South Korea), while Chinese investment is also constrained by corruption scandals and nationalist sentiment due to the South China Sea territorial disputes. Certain potentially significant Chinese investment efforts in telecommunications and electricity are discussed below. Despite its perceived economic closeness to China, Thailand’s most important FDI source has been Japan (followed at some distance by the US and EU), with Chinese investment making a mark only in 2018 due to the US$2.7bn invested for the highspeed railway connecting Thailand to China via Laos. As a major oil producer, Brunei does not have significant FDI inflows, and the few large Chinese investments in recent years related to early efforts to diversify the Sultanate’s economic base.
Looking ahead, analysts should pay attention to the first group of top three SEA recipients of Chinese investments (Indonesia, Malaysia and Singapore), because of their large existing profile and the potential for further growth in these dynamic economies attractive to Chinese capital. We should also pay heed to the third group, because of the potential to grow from the relatively low base of current Chinese investment. Myanmar and Thailand may also try to attract further Chinese investments due to constrained options arising from their relative international isolation or investor reticence due to their military regimes.
Political and strategic significanceIn SEA, the largest volumes and shares of Chinese investments go to the most diversified and advanced economies, while in some of the smaller developing economies, even smaller absolute amounts of investment can bring China top investor status. SEA countries with fewer options—those that are less attractive to other major international investors due to economic or political reasons—are also likely to be more dependent on Chinese investment. In assessing the political and strategic implications of Chinese investment for SEA, the findings of this report suggest a broader perspective beyond the current focus on ‘debt traps’ surrounding a handful of controversial infrastructure loans. In particular, Chinese investments in SEA since 2005 generate dilemmas about (i) dependency and vulnerability, and (ii) strategic integration.
Dependency and vulnerabilityConcerns about over-dependence arise particularly in contexts where one external source of investment is of disproportionate importance for a national economy. China is the most important source of FDI for two SEA countries, Cambodia (every year except 2008 and 2009 when it was ranked second) and Laos (since 2009).
15
Policy Briefing – SEARBO August 2021
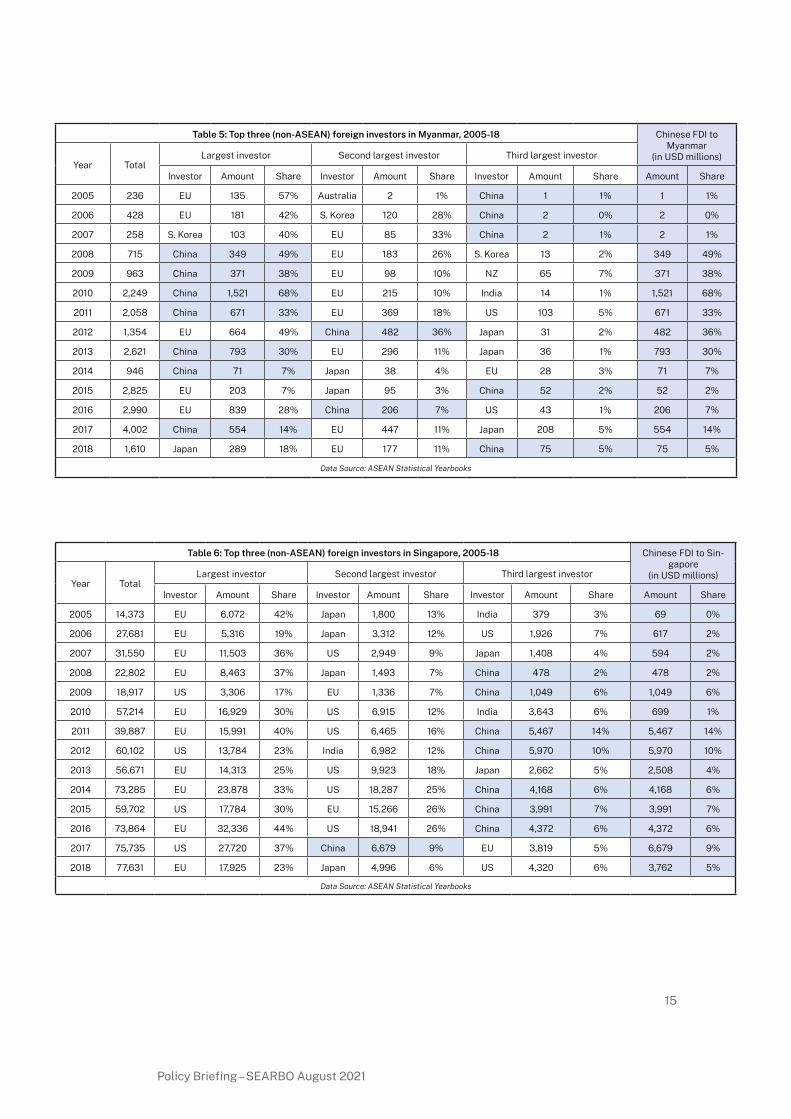
Table 6: Top three (non-ASEAN) foreign investors in Singapore, 2005-18 Chinese FDI to Sin-gapore
(in USD millions)Year Total
Largest investor Second largest investor Third largest investor
Investor Amount Share Investor Amount Share Investor Amount Share Amount Share
2005 14,373 EU 6,072 42% Japan 1,800 13% India 379 3% 69 0%
2006 27,681 EU 5,316 19% Japan 3,312 12% US 1,926 7% 617 2%
2007 31,550 EU 11,503 36% US 2,949 9% Japan 1,408 4% 594 2%
2008 22,802 EU 8,463 37% Japan 1,493 7% China 478 2% 478 2%
2009 18,917 US 3,306 17% EU 1,336 7% China 1,049 6% 1,049 6%
2010 57,214 EU 16,929 30% US 6,915 12% India 3,643 6% 699 1%
2011 39,887 EU 15,991 40% US 6,465 16% China 5,467 14% 5,467 14%
2012 60,102 US 13,784 23% India 6,982 12% China 5,970 10% 5,970 10%
2013 56,671 EU 14,313 25% US 9,923 18% Japan 2,662 5% 2,508 4%
2014 73,285 EU 23,878 33% US 18,287 25% China 4,168 6% 4,168 6%
2015 59,702 US 17,784 30% EU 15,266 26% China 3,991 7% 3,991 7%
2016 73,864 EU 32,336 44% US 18,941 26% China 4,372 6% 4,372 6%
2017 75,735 US 27,720 37% China 6,679 9% EU 3,819 5% 6,679 9%
2018 77,631 EU 17,925 23% Japan 4,996 6% US 4,320 6% 3,762 5%
Data Source: ASEAN Statistical Yearbooks
Table 5: Top three (non-ASEAN) foreign investors in Myanmar, 2005-18 Chinese FDI to Myanmar
(in USD millions)Year Total
Largest investor Second largest investor Third largest investor
Investor Amount Share Investor Amount Share Investor Amount Share Amount Share
2005 236 EU 135 57% Australia 2 1% China 1 1% 1 1%
2006 428 EU 181 42% S. Korea 120 28% China 2 0% 2 0%
2007 258 S. Korea 103 40% EU 85 33% China 2 1% 2 1%
2008 715 China 349 49% EU 183 26% S. Korea 13 2% 349 49%
2009 963 China 371 38% EU 98 10% NZ 65 7% 371 38%
2010 2,249 China 1,521 68% EU 215 10% India 14 1% 1,521 68%
2011 2,058 China 671 33% EU 369 18% US 103 5% 671 33%
2012 1,354 EU 664 49% China 482 36% Japan 31 2% 482 36%
2013 2,621 China 793 30% EU 296 11% Japan 36 1% 793 30%
2014 946 China 71 7% Japan 38 4% EU 28 3% 71 7%
2015 2,825 EU 203 7% Japan 95 3% China 52 2% 52 2%
2016 2,990 EU 839 28% China 206 7% US 43 1% 206 7%
2017 4,002 China 554 14% EU 447 11% Japan 208 5% 554 14%
2018 1,610 Japan 289 18% EU 177 11% China 75 5% 75 5%
Data Source: ASEAN Statistical Yearbooks

16
Chinese Investment in Southeast Asia
As seen in Tables 3 and 4, Laos’ relative dependence on Chinese sources is higher, reaching a peak of 79% in 2018 compared to a peak of 32% in Cambodia (2014 and 2015).7 China is consistently among the top three sources of FDI for only two other SEA countries: Myanmar and Singapore. At its height, China provided 40% of Myanmar’s FDI in 2008-13 (Table 5). But China is a distant third in Singapore, contributing 6% to its FDI in 2005-18, compared to nearly 20% from the US and 25% from the EU (Table 6).
Measured against their overall FDI, China has not been a leading source for the other six SEA countries, not even for Malaysia, which ranks second in terms of volume of Chinese investments received. First-ranked Indonesia has recorded China among its top three non-ASEAN FDI sources only since 2014. Even with Vietnam—which maintains close Party-to-Party ties with the PRC and is generally one of the most popular FDI destinations in SEA alongside Singapore and Indonesia—bilateral tensions over territorial disputes meant that China only consistently retained its top three position from 2016. On this basis, Laos, Myanmar and—to a lesser extent—Cambodia are the three SEA economies most likely to be over-exposed and potentially dependent on Chinese investments. Indeed, another recent study calculating 200 countries’ vulnerability in terms of both investment and trade also found these three countries to be the most vulnerable in SEA to potential disruptions in their economic ties with China.8
Structural vulnerability may accompany dependence on Chinese investment, regardless of whether it involves asset ownership or service provision (a broad category in which Chinese contractors undertake activities like installation and maintenance of equipment, technical evaluation, and construction supervision). Our report shows that Chinese investments in Singapore and Myanmar largely involved ownership acquisition whereas those in Vietnam, the Philippines and Laos were mainly service provision, while Indonesia experienced a change from service provision to a combination of service provision and ownership acquisition between 2005 and 2019. In general, strategists have strong sovereignty concerns about foreign ownership of critical national assets—but economists also worry if rapidly-depreciating assets like hydropower dams are transferred back into state ownership after the initial, most profitable operational period has passed. At the same time, foreign control of service provision in critical sectors can also generate vulnerabilities.
7 Between 2006 and 2018, over half of Cambodia’s annual FDI came from sources outside of the top three investors, including other SEA countries.
8 Jikon Lai and Amalina Anuar, ‘Measures of Economic Vulnerability and Inter-Dependency in the Global Economy,’ RSIS Working Paper No. 333, 20 January 2021. Based on trade and investment flows in 2015-17, Laos, Myanmar and Cambodia were ranked 13th, 15th and 22nd respectively among the 200 countries for vulnerability to China. Other SEA economies in the top 50 were Vietnam (33rd), Malaysia (39th), Thailand (46th) and Singapore (48th).

In SEA, Chinese investments related to service provision in two areas of critical national infrastructure stand out: electricity and telecommunications.9 Chinese companies first entered SEA electricity markets in a significant way with two major acquisitions in 2008. In Singapore, Huaneng bought Tuas Power—the smallest of three electricity generating companies privatised by the government, supplying a quarter of the national market10—for US$3.04 billion, the largest ever acquisition overseas by a Chinese power company at the time.11 That same year, the State Grid Corporation of China bought a 40% stake (US$1.58bn) in the National Grid Corporation of the Philippines, with a 25-year franchise to operate and manage the country’s power transmission facilities. Domestic political opposition to the NGCP being “infected by a national security virus” and China controlling Manila’s power supply caused the Benigno Aquino administration to suspend Chinese technical involvement in Grid operations in 2015.12 Most recently—in March 2021 and therefore not covered in this report’s dataset—the state-owned energy provider Electricité du Laos divested 90% of its national transmission business to China Southern Power Grid to complete the much-delayed construction of Laos’ national electricity grid for both domestic consumption and export to the region.13
Chinese investment has also picked up in the rapidly expanding and highly profitable telecommunications sector in SEA. Two large investments feature in our dataset: China Mobile’s US$880mn acquisition of an 18% stake in True Corp in Thailand in June 2014, a few weeks after the military coup when other foreign investments slumped; and China Telecom’s US$860mn investment in Mislatel (shortly thereafter renamed Dito), set up in 2019 to break the longstanding telecommunications service duopoly in the Philippines. China Telecom holds a 40% stake in Dito, the maximum allowed for a foreign company in the Philippines’ telecom sector; while local partners Udenna and Chelsea Logistics hold 35% and 25% respectively in a deal reportedly worth US$5.4bn overall.14 The consortium has promised to bring highspeed internet to 84% of the nation’s population in five
9 Note that the coding used in this report places investments in electric companies within the energy sector, and investments in telecommunications under the infrastructure sector.
10 The two larger companies were sold to a Japanese-led consortium Lion Power and Malaysian YTL Power respectively. https://www.wsj.com/articles/SB122061029167803541https://www.thestar.com.my/business/business-news/2008/12/03/ytl-power-acquires-powerseraya-from-temasek
11 https://www.reuters.com/article/us-temasek-huaneng-idUSSP10284220080314
12 https://www.rappler.com/nation/ph-chinese-experts-ngcp
13 On this controversial move, which some see as a debt-for-equity swap intensifying Laos’ debt-trap danger, see Keith Barney and Kanya Sousakoun (2021) ‘Credit Crunch: Chinese Infrastructure Lending and Lao Sovereign Debt,’ Asia-Pacific Policy Studies, https://doi-org.virtual.anu.edu.au/10.1002/app5.318
14 https://cnnphilippines.com/business/2019/4/29/Mislatel-China-Telecom.html

18
Chinese Investment in Southeast Asia
years.15 These providers, like many others in SEA, use equipment and collaborate in 5G development with Chinese firms, especially Huawei and ZTE. A recent survey found that Chinese firms are viewed as popular partners for building 5G infrastructure across SEA, and are most popular in Cambodia, Laos, and Malaysia. Vietnam alone is unreceptive towards Huawei technology. Since mid-2020 though, many major SEA providers have tried to diversify away from Huawei, towards European firms Ericsson and Nokia.16
As is evident in the unfolding Huawei case, others’ vulnerability could also arise from very large Chinese investments in sectors or industries which are strategically important for China. Two of the most obvious instances in our dataset relate to Beijing’s quest for greater energy security. In 2009, state-owned PetroChina bought Singapore Petroleum Company for US$2.18 billion, gaining a foothold in Asia’s largest oil trading centre and increasing its refining capacity just as the Chinese government introduced a market-based fuel pricing system and prices were expected to rise in China. By that point, PetroChina was already Asia’s largest oil and gas producer, and the acquisition increased its flexibility in international oil pricing and trading. Strategically, acquiring such downstream fuel production complemented efforts by China’s oil sector to buy upstream oil exploration assets around the world to secure energy supplies.17 In 2014, privately-owned Zhejiang Hengyi invested US$3.44bn in 70% stakes for a new oil refinery and petrochemical complex (Pulau Muara Besar) in oil-rich Brunei. In 2020, the consortium announced additional investment of over US$13bn into Phase II of the project, aiming to produce an additional 14mn tons of refined oil on top of the current production capacity of 8mn tons per year.18
In Myanmar in 2016, Zhuhai Zhenrong, one of the four licensed state importers of crude oil in China, won a contract to build an oil refinery in Dawei with a capacity of 8mn tons per year. At US$2.1bn, this was the most valuable Chinese investment in Myanmar recorded in our dataset. This first large-scale refinery for Myanmar will refine oil imported from the Middle East, and from eventual domestic production from Myanmar’s offshore oil blocks in the Andaman Sea.
15 https://business.inquirer.net/260809/dennis-uy-china-telecom-venture-confirmed-as-third-telco#ixzz6nSUdJIUB
16 Melinda Martinus (2020) ‘The Intricacies of 5G Development in Southeast Asia,’ ISEAS Perspective 130, https://www.iseas.edu.sg/wp-content/uploads/2020/11/ISEAS_Perspective_2020_130.pdf. As of October 2020, Huawei had 40% share of the SEA 5G equipment market, compared to Ericsson’s 20% and Nokia’s 15%.
17 https://www.reuters.com/article/us-keppel-petrochina-idUSTRE54N13F20090525
18 http://www.xinhuanet.com/english/2020-09/17/c_139373645.htm

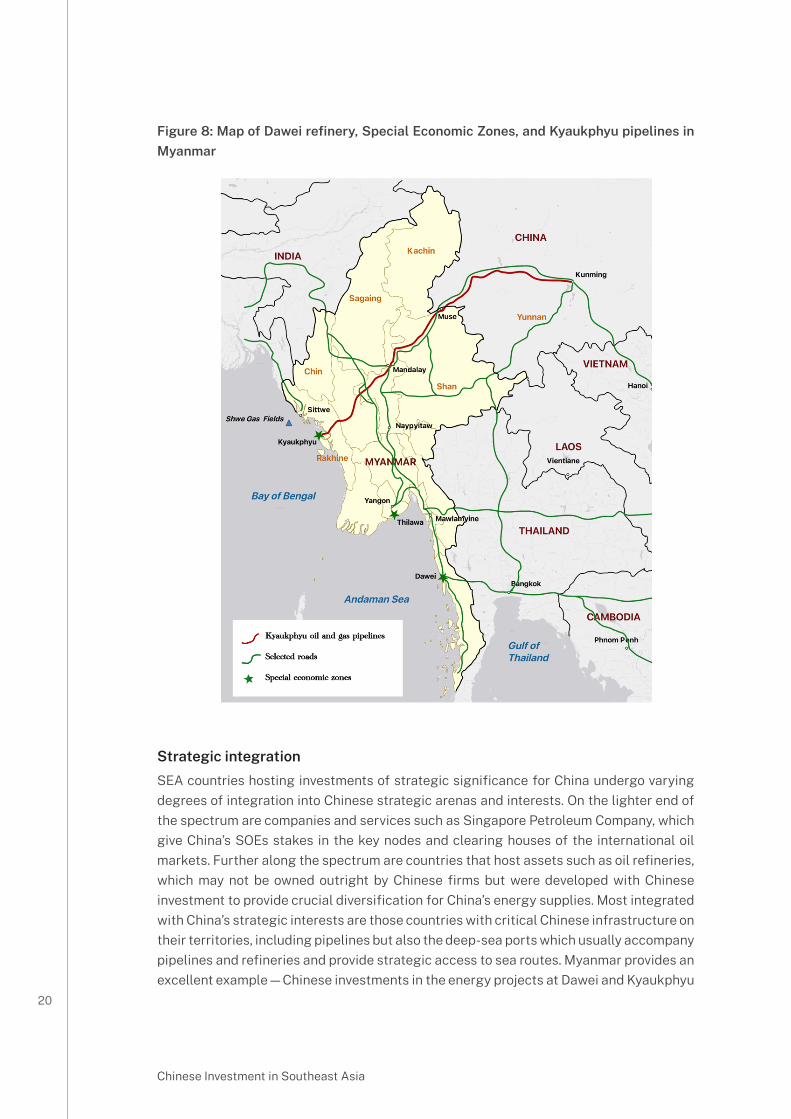
The refinery project was perceived to fit in China’s Maritime Silk Road initiative and compete with Japanese and Thai investments in the Dawei Special Economic Zone.19 Figure 8 maps these projects, as well as the other, more strategically significant Chinese energy investment in Myanmar, China National Petroleum Company’s earlier (2009) US$1.02bn investment to build pipelines further north on Myanmar’s coast at Kyaukphyu. The gas pipeline carries natural gas from Myanmar’s Shwe gasfields off Rakhine state in the west, cross-country and into Yunnan, the Chinese province bordering Myanmar. The parallel oil pipeline, which opened in 2015, is China’s first overland access to shipments of crude oil from the Middle East, and thus a signature project to help mediate China’s Malacca Straits dilemma. Its official carrying capacity is equivalent to the total capacity of the phase I and II Pulau Muara Besar oil refineries in Brunei.20 Our calculations using 2017-2020 figures suggest that, at full capacity, the Kyaukphyu gas pipeline could carry between 8.5% and 12.7% of China’s annual gas imports, while the oil pipeline could carry between 4.1% and 5.5% of its yearly oil imports.21
19 https://asia.nikkei.com/Business/Chinese-company-to-build-oil-refinery-near-Dawei-SEZ-in-Myanmar. Project implementation has been delayed, most recently due to the Covid-19 pandemic.
20 22mn tons -- https://www.globaltimes.cn/content/1146125.shtml
21 Our calculations here are based on the stated design capacity of the gas pipeline (12 billion cubic metres per year) and the oil pipeline (22 million tons of crude oil per year); and the best data available publicly on China’s total annual natural gas and crude oil imports. Note that these figures are estimates only, and liable to year-on-year changes in actual imports and in projections of China’s national energy consumption. Data on China’s annual natural gas and crude oil import from the Kyaukphyu pipelines is patchy and not currently verifiable.
20
Chinese Investment in Southeast Asia
Figure 8: Map of Dawei refinery, Special Economic Zones, and Kyaukphyu pipelines in Myanmar
Strategic integrationSEA countries hosting investments of strategic significance for China undergo varying degrees of integration into Chinese strategic arenas and interests. On the lighter end of the spectrum are companies and services such as Singapore Petroleum Company, which give China’s SOEs stakes in the key nodes and clearing houses of the international oil markets. Further along the spectrum are countries that host assets such as oil refineries, which may not be owned outright by Chinese firms but were developed with Chinese investment to provide crucial diversification for China’s energy supplies. Most integrated with China’s strategic interests are those countries with critical Chinese infrastructure on their territories, including pipelines but also the deep-sea ports which usually accompany pipelines and refineries and provide strategic access to sea routes. Myanmar provides an excellent example—Chinese investments in the energy projects at Dawei and Kyaukphyu
entail building port facilities where large oil tankers can dock, and potentially creating conditions for hosting other deep-sea vessels accessing the Bay of Bengal and Indian Ocean.22 Myanmar’s strategic integration dilemma is encapsulated in China now having concrete stakes in its domestic political stability, including the management of ethnic insurgencies both on their shared border in eastern Myanmar as well as in Rakhine state in west Myanmar where all this infrastructure is being built (see Figure 8).
Other strategically-located port projects that have seen Chinese investments might give access to key maritime domains in the South China Sea and Malacca Straits, but to date, many are neither large enough nor have they yet proven sustainable. Apart from Pulau Muara Besar in Brunei, smaller Chinese investments (not recorded in our dataset due to size) helped create container port facilities in Kuala Tanjung in Sumatra, Indonesia and in Kuantan on the east coast of peninsular Malaysia (both in 2018). Both projects have strong local commercial dynamics and are associated with major special economic zones/industrial parks in collaboration with Chinese investors, and listed among the official BRI projects. On the west coast of the Malay peninsula, the recently-cancelled Melaka deep-sea port would have given Chinese investors stakes in an important new facility on the Malacca Straits.
Various transport infrastructure projects are also meant to help mainland SEA integrate physically with southwestern China. However, these mainly rail projects have been slow to take off, partly due to logjams created by two changes of government in Thailand since the plan was first agreed in 2008. Thailand contains the crucial transitional segment of the planned north-south line from Kunming to Bangkok, to link up with existing railways running south. The bulk of Chinese investments realised to date centre on building the rail link northwards connecting Vientiane-Boten-Kunming. The Thai section linking Bangkok to Nong Khai at the Thai-Lao border has been mired by disagreement over design, financing, technical assistance, and as of March 2021, only a 3.5km segment just outside of Bangkok had been built. The Thai government is self-financing the building and has announced it would be issuing contracts only for the first part of the link from Bangkok to Nakhon Ratchasima.23 Other large Chinese investments in SEA transport connectivity mostly promote domestic road and rail links—in our dataset every SEA country, except for Myanmar, recorded such investments.
22 Note that construction has not begun on the Dawei port, which is subject to a competing project funded by international consortium in the SEZ; and that the Kyaukphyu port was downsized from ten to two berths after worries about a potential debt trap caused Naypyidaw to renegotiate with the Chinese-led consortium to reduce the project cost from US$7.2bn to US$1.3bn in 2017/8.
23 https://thediplomat.com/2020/09/sino-thai-railway-inches-toward-resumption/; https://www.railway-technology.com/news/thailand-thai-sino-high-speed/; https://www.geopoliticalmonitor.com/fact-sheet-kunming-singapore-high-speed-rail-network/

22
Chinese Investment in Southeast Asia
ConclusionOver the 2005-19 period, Chinese investments in SEA grew significantly. While China is not yet a dominant investor in the region, we can expect its significance to grow, especially given the broad scope and domain of its large investments in SEA. This report presents detailed country-by-country analysis of the patterns of large Chinese investments in the key sectors. As this overview outlines, Chinese investments play increasingly important roles for every SEA country, but the variations in distribution and in political and strategic significance suggest that China’s importance and influence can take quite different forms. Thus far, Chinese investments create the most obvious vulnerabilities in the three mainland countries, Cambodia, Laos, and Myanmar. But the developing patterns of dependence and vulnerability are dynamic and hard to predict in many of the other SEA countries because of fairly specific reasons for their relative exposure to Chinese investments to date. Certainly, countries like Myanmar, Brunei—and to a lesser extent—Indonesia and Malaysia, which host Chinese-funded strategic infrastructure projects may be taking risks. So far, however, we have no instances with which to assess their prospects of being held hostage on the basis of these exposures. Others—like the Philippines and pre-2018 Malaysia—have overall low levels of, or dependency on, Chinese investment, but a handful of large investments with strategic significance.
In sum, this analysis and the detailed Quantitative Report24 create a baseline for comparing Chinese investment across SEA, and provides the wider context of large, multi-sectoral Chinese investments in the region to facilitate informed analysis of the significance of specific sectors or projects. In the second, Qualitative Report from our project, we offer a political analysis of the domestic context within individual SEA countries, which can help explain the variation in levels, patterns, and effects of large Chinese investments.
24 Available from the authors upon request.
CRICOS Provider #00120C
Contact us
SEARBO ProjectDepartment of Political and Social ChangeCoral Bell School of Asia Pacific Affairs ANUCollege of Asia and the PacificHedley Bull Building130 Garran RoadCanberra ACT 2600 AustraliaOverall Chief Investigator:
E [email protected] psc.bellschool.anu.edu.au/searbo-supporting-
rules-based-order-southeast-asia
How to cite:
Evelyn Goh and Nan Liu, ‘Chinese Investment in Southeast Asia, 2005-19: Patterns and Significance,’ SEARBO Policy Briefing, New Mandala, August 2021.