China’s Integration in East Asia: Production Sharing, FDI ... · No 2005 – 09 June China’s...
64
No 2005 – 09 June China’s Integration in East Asia: Production Sharing, FDI & High-Tech Trade _____________ Guillaume Gaulier, Françoise Lemoine, Deniz Ünal-Kesenci
Transcript of China’s Integration in East Asia: Production Sharing, FDI ... · No 2005 – 09 June China’s...

No 2005 – 09June
China’s Integration in East Asia:Production Sharing, FDI & High-Tech Trade
_____________
Guillaume Gaulier, Françoise Lemoine, Deniz Ünal-Kesenci

China’s Integration in East Asia:Production Sharing, FDI & High-Tech Trade
_____________
Guillaume Gaulier, Françoise Lemoine, Deniz Ünal-Kesenci
No 2005 – 09June

China’s Integration in East Asia:Production Sharing, FDI & High-Tech Trade
3
TABLE OF CONTENTS
SUMMARY ..............................................................................................................................4
ABSTRACT..............................................................................................................................5
RÉSUMÉ .................................................................................................................................6
RÉSUMÉ COURT .....................................................................................................................7
INTRODUCTION......................................................................................................................8
1. ASIAN PRODUCTION NETWORKS ....................................................................................9
1.1. Production Sharing in East Asia ..............................................................................91.2. The Emergence of China .......................................................................................12
2. CHINA IN THE INTERNATIONAL DIVISION OF LABOUR IN EAST ASIA .........................14
2.1. China’s Selective Trade Policy..............................................................................142.2. China’s Specialisation in Assembly Operations....................................................152.3. The Reorganisation of Production in Asia.............................................................172.4. Commodity Changes in Processing Trade.............................................................202.5. Foreign Affiliates: the Engine of China Trade Expansion.....................................21
3. VERTICAL SPECIALISATION, TECHNOLOGY TRANSFER AND REGIONALINTEGRATION.................................................................................................................24
3.1. China’s Trade by Stage of Production...................................................................243.2. Production Sharing and Technological Catch-up ..................................................263.3. China’s High-tech Trade and Regional Integration ...............................................293.4. The Dependence of China’s High-tech Trade on Foreign Affiliates .....................30
4. THE IMPACT OF CHINA’S EMERGENCE ON ASIAN TRADE ...........................................33
4.1. The Rise of East Asia in World Trade...................................................................334.2. The Rise of Intra-Regional Trade ..........................................................................354.3. Substitution and Competition in World Markets ...................................................364.4. Triangular Trade....................................................................................................394.5. China’s Technological Catch-up? .........................................................................40
4. CONCLUSION..................................................................................................................43
APPENDIX 1 – SECTOR CLASSIFICATION............................................................................46
APPENDIX 2 – PRODUCTION STAGES ACCORDING TO THE BEC CLASSIFICATION..........48
APPENDIX 3 – THE DEFINITION OF HIGH-TECH PRODUCTS .............................................49

CEPII, Working Paper No 2005-09
APPENDIX 4 – INDICATOR OF CONTRIBUTION TO TRADE BALANCE................................51
APPENDIX 5 – HIGH-TECH TRADE BY REGION, FIRM CATEGORY & PRODUCTIONSTAGES...........................................................................................................................52
REFERENCES........................................................................................................................54
LIST OF WORKING PAPERS RELEASED BY CEPII ...............................................................59


CEPII, Working Paper No 2005-09
4
CHINA’S INTEGRATION IN EAST ASIA:PRODUCTION SHARING, FDI & HIGH-TECH TRADE
SUMMARY
The paper analyses China’s involvement in the international division of labour and itsconsequences on the process of regional economic integration in East Asia.
The in-depth analysis of trade flows, based on China’s customs statistics, shows that theengine of China’s trade expansion has been international processing activities, based oninputs imported from Asian countries. Production sharing with advanced Asianeconomies has allowed for a rapid diversification of China’s manufacturing exportcapacities. Firms in Asia have moved production facilities to China, enhancing China’sintegration in the regional economy and leading to the reorganisation of industry in EastAsia. Foreign affiliates are responsible for a major and ever-growing part of China’strade, especially with Asian countries. China’s imports of intermediate products fromAsian industrialised countries have been an important channel of technology transfer andhave helped China to rapidly improve the high-tech content of its foreign trade.However, up to now the technological upgrading of China’s trade has remained quitecircumscribed to foreign firm production and export bases. The question now is whetherChina will remain durably dependent on foreign technology or will be able to develop itsown technological capacity in the coming years.
As a result of the reorganisation of production in Asia, a triangular trade pattern hasemerged. In many sectors, China is used as an export base by the firms located inadvanced Asian economies, which instead of exporting finished goods to the Americanand European markets, now export intermediate goods to their affiliates in China.China’s exports to the EU and the US have skyrocketed and have displaced Japan’s andNIEs’ exports at accelerated pace.
The paper is organised as follows. A first section points out how globalisation providesnew opportunities for latecomers to enter international trade through production sharing, aphenomena which has been especially widespread in East Asia. A second sectioninvestigates how China has taken advantage of this globalisation process and shows that ithas become an assembly country for firms located in Asia which have reorganised theirindustrial capacities and extended to China their production and trade networks. A thirdsection analyses how China’s position in the segmentation of the production processeshas fostered technology transfer, while inhibiting its diffusion to the rest of China’seconomy. A fourth section examines the impact of China’s emergence on East Asia’sintra-regional trade and trade with the rest of the world. The structural factors underlyingthe triangular trade pattern will remain strong in the coming years.

China’s Integration in East Asia:Production Sharing, FDI & High-Tech Trade
5
ABSTRACT
China has taken advantage of the globalisation process and has become a assemblycountry for firms in Asia which have extended to China their production and tradenetworks. China’s position in the segmentation of the production processes has fosteredits trade in high-technology products. However the rapid technological upgrading ofChina’s trade is associated with an increasing dependence on foreign capital andtechnology. The emergence of China has led to the reorganisation of production in Asiaand to a triangular trade pattern: firms in advanced Asian economies use China as anexport base and instead of exporting finished goods to the US and Europe, now exportintermediate goods to their affiliates in China.
Classification JEL: F13, F14, F15, O53.Keywords: China, East Asia, Technology Transfer, Trade, Specialisation, FDI,
International Production Sharing.

CEPII, Working Paper No 2005-09
6
L’INTÉGRATION DE LA CHINE EN ASIE DE L’EST :DIVISION DU TRAVAIL, IDE ET ÉCHANGES DE HAUTE TECHNOLOGIE
RÉSUMÉ
Cette étude analyse l’insertion de la Chine dans la division internationale du travail et sesconséquences sur le processus d’intégration régionale en Asie de l’est.
L’analyse approfondie des statistiques douanières de la Chine montre que les activitésd’assemblage basées sur des produits intermédiaires importés d’Asie ont été le moteur del’expansion de ses échanges extérieurs. Le fractionnement des processus productifs entrela Chine et les économies avancées d’Asie a permis à la Chine de diversifier rapidementses capacités d’exportation manufacturières. En Asie, les entreprises ont transféré enChine leurs sites de production, ce qui a renforcé l’intégration de la Chine dansl’économie de la région et abouti à une réorganisation régionale des productionsindustrielles. Les filiales d’entreprises étrangères ont pris un rôle majeur et toujourscroissant dans le commerce extérieur de la Chine, particulièrement avec les pays d’Asie.Les importations de produits intermédiaires en provenance d’Asie ont été un canalimportant de transferts de technologie et ont aidé la Chine à améliorer rapidement leniveau technologique de ses échanges extérieurs. Cependant, l’améliorationtechnologique des échanges est restée jusqu’ici étroitement circonscrite aux bases deproduction et d’exportation des entreprises étrangères. « La Chine restera-t-elledurablement dépendante des technologies étrangères ou sera-t-elle capable de développerses propres capacités d’innovation dans les années qui viennent ? » est maintenant laquestion qui se pose.
La réorganisation des productions industrielles en Asie a fait émerger un réseaud’échanges triangulaire. Dans nombre de secteurs, la Chine sert de base d’exportation auxéconomies avancées d’Asie qui, au lieu d’exporter des produits finis sur les marchésaméricains et européens, exportent maintenant des produits intermédiaires à leurs filialesen Chine. Les exportations de la Chine vers les États-Unis et l’Europe sont montées enflèche et ont rapidement évincé les exportations du Japon et des nouvelles économiesindustrialisées.
L’étude est organisée ainsi : une première partie souligne comment la globalisation offreaux nouveaux venus l’opportunité de s’insérer dans le commerce international en prenantpart à la segmentation internationale des processus productifs, un phénomène qui a étéparticulièrement répandu en Asie de l’Est. Une deuxième partie montre comment la Chinea participé à ce processus de globalisation et est devenue un pays d’assemblage pour lesfirmes situées en Asie, qui ont réorganisé leurs capacités industrielles en intégrant laChine dans leurs réseaux de production et d’échanges. Une troisième partie montrecomment la position de la Chine dans la chaîne de valeur ajoutée a stimulé les transfertsde technologie, mais a inhibé leur diffusion à l’ensemble du tissu industriel chinois. Une

China’s Integration in East Asia:Production Sharing, FDI & High-Tech Trade
7
quatrième partie examine les conséquences de l’émergence de la Chine sur le commercedes pays d’Asie entre eux et avec le reste du monde et conclut que les facteurs structurelsqui sous-tendent les échanges triangulaires resteront fortement présents dans les années àvenir.
RÉSUMÉ COURT
La Chine a tiré parti de la globalisation et est devenue un pays d’assemblage pour lesentreprises d’Asie qui ont étendu en Chine leurs réseaux de production et d’échanges. Laposition de la Chine dans la segmentation des processus productifs a stimulé ses échangesde produits de haute technologie. Cependant, l’amélioration du niveau technologique ducommerce extérieur chinois est associée à une dépendance accrue à l’égard destechnologies et des capitaux étrangers. L’émergence de la Chine a conduit à uneréorganisation des productions en Asie et à un réseau d’échanges triangulaire : lesentreprises des économies avancées d’Asie ont en Chine des bases de production et aulieu d’exporter des produits finis vers les États-Unis et l’Europe, exportent maintenant desproduits intermédiaires vers la Chine.
Classement JEL : F13, F14, F15, O53.Mots Clés : Chine, Asie de l’Est, transfert de technologies, specialisation,
commerce, IDE, division internationale du travail.

CEPII, Working Paper No 2005-09
8
CHINA’S INTEGRATION IN EAST ASIA:PRODUCTION SHARING, FDI & HIGH-TECH TRADE
Guillaume GAULIER, Françoise LEMOINE, Deniz ÜNAL-KESENCI 1
INTRODUCTION2
Since 1980, China’s economy has grown at the rate of 9% a year and its foreign trade hasexpanded at the pace of almost 15% a year. Its share in world trade rose from less than1% to about 5% in 20023. The emergence of China as a great economic and trade poweris bringing far reaching changes in the world economy and in international economicrelations. China’s now holds large world market shares in traditional industries(accounting for about one third of world exports in leather and shoes, one fifth inclothing), but is also rapidly enlarging its shares in electrical and electronic exports, thefastest growing segments of world trade. In 2002 China recorded one fifth of worldexports of consumer electronics and of domestic appliance. For East Asian countries,China has become a major partner, their first partner in the region. In 2003, for Japan,China was the second export market, behind the US, and its first supplier. For South-Korea, China was the first export market and its second supplier behind the US. In 2003and 2004, the accelerated increase of China’s import demand (+40% and 37%respectively) has been the engine of economic growth in East Asia. The aim of the paperis to help understand how China has achieved such outstanding trade performance and tobring to the fore the factors underlying China’s competitiveness in world markets. Itshows China’s involvement in the international segmentation of production processes andits integration in Asian production networks are at the core of its rapid trade expansion.
The first section of the paper points out how globalisation provides new opportunities forlatecomers to enter international trade through production sharing, a phenomena whichhas been especially widespread in East Asia. A second section provides an in depthanalysis of China’s trade flows. Based on the detailed data available from China’s 1 Guillaume Gaulier is economist, Françoise Lemoine is senior economist and Deniz Ünal-Kesenci is
economist at CEPII (see www.cepii.fr).2 This study has benefited from the support of the International Trade Center (Geneva) which provided
the databases of China customs statistics. The authors thank Friedrich Von Kirchbach and ChristianDelachenal for their help. Previous versions of this paper were presented at the Conference “ResolvingNew Global and Regional Imbalances in an Era of Asian Integration”, organised by the Research Instituteof Economy, Trade and Industry (RIETI) in Tokyo – 17-18 June 2004 and at the International Workshopon “East Asia de facto Economic Integration”, organised by the Institute for Developing Economies(IDE) in Tokyo, 19 January 2005. The authors express their thanks to the RIETI and the IDE for theirsupport. The authors are very much indebted to Kyoji Fukao, Kazuhiko Yokota and Daisuke Hiratsukafor their careful comments and useful suggestions. However the authors are solely responsible for allremaining errors and shortcomings.3 Average of exports and imports (source, CEPII-CHELEM).

China’s Integration in East Asia:Production Sharing, FDI & High-Tech Trade
9
customs statistics, it assesses the role of international processing activities and of foreignaffiliates4 in China’s foreign trade, the impact of production sharing with Asian countrieson China’s geographic and commodity trade patterns. A third section examines howassembly operations have been an important channel for technology transfers but have notfavoured the diffusion of technology in the domestic industries. A fourth section focuseson the changes which have occurred over the last twenty years in East Asia countries’trade patterns both within the region and with rest of the world, as a result of China’semergence as a major trading partner.
1. ASIAN PRODUCTION NETWORKS
1.1. Production Sharing in East Asia
International production sharing is an especially widespread phenomenon in East Asiaand has become an important factor determining trade patterns in the region (seeHummels, Rapoport and Yi, 1998). It has been driven by firms located in East Asia(Asian firms as well as affiliates of US or European Multinational companies), whichhave shifted from exports to international production and reorganised their businessactivities across different countries in order to reduce costs and improve their capacities toreact to technological changes and market requirements. They have built-up cross-borderproduction and trade networks which have underlain the progress of economic integrationin East Asia. International production network can be defined as “the organisation, acrossnational borders, of the relationships (intra and increasingly inter-firm) through whichfirms conduct research, development, product definition and design, procurement,manufacturing, distribution and support services” (Borrus, 1996).
Cross-border production and trade networks explain the rapid increase of both trade andFDI flows between Asian countries, and the far-reaching changes in countries’commodity trade pattern and specialisation. Empirical studies have shown thatinternational production networks account for a significant share of trade flows of mostcountries of the region, are spread over a large number of countries and involve bothintra-firm and arm’s-length trade (Ando and Kimura, 2003).
Several factors have contributed to the expansion of Asian production networks: besidesgeographic proximity, the heterogeneity of the Asian economies has stimulated theinternational segmentation of production processes since the different countries haddifferent comparative advantages (Zysman et alii, 1996). In the latter half of the 1980s,currency re-evaluations, which have affected the competitiveness of manufacturingindustries in the most developed countries of the region, have played a catalytic role inaccelerating the relocation of their labour intensive production in the low-wage countriesof the region (Naughton, 1997). Finally the changes in the development strategies and 4 Foreign affiliates include joint ventures and wholly-foreign-owned firms.

CEPII, Working Paper No 2005-09
10
trade policies implemented from the mid-1980s in countries such as Thailand, Malaysia,Indonesia and the Philippines, have also decisively contributed to the expansion ofinternational production networks, as these countries have facilitated inward FDI inexport-oriented business (Ando and Kimura, 2003).
There is no comprehensive relevant statistics which allow for precisely measuring the roleof international production and trade networks, however, indirect evidence can be drawnfrom the analysis of trade flows and of the strategies of firms.
Empirical studies of international trade flows have put forward the increasing verticalspecialisation (the splitting up of the value added chain) and shown the growingimportance of intermediate goods, and especially of “parts and components” in intra-Asian trade flows. As the possibility (and costs) of splitting up production processes intotwo or more steps depends on the technique of production, the forces driving to verticalspecialisation have been stronger in some industries, such as machinery and electricalmachinery (Ando and Kimura, 2003; Ng and Yeats, 2003; Masuyama, 2004; Fukao etalii, 2003).
Foreign direct investment (FDI) has been an important component in the development ofinternational production networks in Asia (Ando and Kimura, 2003; Masuyama, 2004;Fukao et alii, 2003). Investigating the different motivations that drive foreign directinvestment, i.e. market orientation versus export orientation, the studies generally findthat Asian FDI in the region is more efficiency-seeking and export oriented than AsianFDI in other parts of the world. For instance, in China, Japanese FDI has been lessmarket-seeking than American or European FDI.
Recent analysis of Japanese firms' strategies confirms that they follow a specific strategyin East Asia, compared both to the strategies of US firms in the region and to thestrategies of Japanese firms in other parts of the world. Japanese investment is moreoriented towards East Asia (and relatively more on ASEAN than on China) thanAmerican investment (Ando and Kimura, 2003; Masuyama, 2004). Japanese affiliates inEast Asia are concentrated in manufacturing industries, and hence differ from Japaneseaffiliates in North America or Europe. Compared to Japanese firms investing in NorthAmerica or in Europe, those investing in East Asia include a relatively large number ofsmall and medium enterprises (SMEs), have less capital-intensive technology and lessR&D expenditure. The analysis of the local content of sales by Japanese affiliates in theregion indicates that those firms have shifted their source of supply as the local contenthas increased compared to Japanese inputs.
According to Ando and Kimura (2003), sales by Japanese affiliates located in East Asiaare more export-oriented than those located in other parts of the world and concentratetheir exports in the region (Japan and other Asian countries), while their sales to NorthAmerica are small. This confirms the existence of strong intra-regional productionnetworks, but contradicts the popular view that Japanese firms use export platforms in theregion to export to the US.

China’s Integration in East Asia:Production Sharing, FDI & High-Tech Trade
11
The development of production networks has contributed to the rise of successive wavesof “new industrialised economies” in East Asia and especially the emergence of the latestwave of new industrialised economies (Thailand, Malaysia, Philippines, then China andVietnam). Since the mid eighties, firms in the most industrialised economies in theregion (Japan, South Korea, Taiwan, Singapore, Hong-Kong) have gradually moved theirproduction capacity in low-tech, labour intensive sectors to overseas export platformslocated in low-wage countries, through foreign direct investment and out-processingoperations. These relocations have helped South-East Asian countries and then China, todevelop their comparative advantages in manufacturing industries and to progressivelyupgrade their industrial capacities and exports. Asian production networks have thuscontributed to the “recycling comparative advantages” which has thus been at the core ofEast Asian industrialisation.
The evolution of the specialisation patterns of East Asian countries confirm the « flyinggeese model » developed by Akamatsu (1961). However, the changes in the globaleconomy, together with the development in technology and production techniques haveprecluded homogeneous trajectories. Although late-comers may export similar productsas the leaders did in earlier stages, their structures of production are quite different(ESCAP, 1991; Bernard and Ravenhill, 1995; OECD, 1999; Guerrieri, 2000; UNCTAD,1996). In fact, while Japan has developed a strong indigenous innovative base, prior tothe increase of its global economic presence in the 1950s, Taiwan and Korea haveremained dependent on imported technology, components and equipment fromindustrialised economies (mainly Japan). The late-comers, South-East Asian countries,exhibit industrial structures which are characterised by the lack of a domesticmanufacturing tradition, their high dependence on foreign controlled firms, a high importcontent of exports and limited backward linkages with local component suppliers.
The benefits that low-wage countries derive from their participation in internationalproduction sharing may be smaller than suggested by trade figures. The gains may beunequally spread between the firms involved in the value-added chain. Also, taking partin the labour-intensive stages of production does not automatically lead to thetechnological spillovers needed to move up the production chain and to ensure asustainable trajectory of economic development (UNCTAD, 1999 and 2002; Kaplinsky etalii, 2002; OECD, 1999).
East Asian production networks have given rise to a “triangular trade pattern”: Japan andNIEs export capital goods and sophisticated intermediate goods (especially parts andcomponents) to the less developed countries of the region (ASEAN* and China) whichprocess them for exports destined to the US and Europe5.
5
NIEs: Hong Kong, Singapore, South Korea and Taiwan.ASEAN* = ASEAN countries excluding Singapore.

CEPII, Working Paper No 2005-09
12
1.2. The Emergence of China
China appears as a latecomer in the international division of labour in Asia. China’s casefurther illustrates how the splitting-up of the value-added chain between differentlocations (countries) and the development of firms’ cross-border production networks aredriving the process of industrial growth and integration in Asia (UNCTAD, 1996 and2002; Borrus et alii, 2000). China’s case also highlights how a latecomer can enterglobalisation and carve out its place in the international division of labour. Since the mideighties, China has been involved in international production sharing with Asianeconomies, as firms from Hong-Kong, Taiwan, Japan, South Korea, and other Asiancountries have relocated their labour intensive industries in the mainland (Naughton, 1996and 1997). Firms from the US and Europe operating in Asian NIEs have also movedtheir facilities in China. However, FDI flows to China show that the US and Europe havedirected a relatively small part of their investment abroad to China, compared to Japanand Asian NIEs6. The rapid expansion of China’s foreign trade has been closelyassociated with an on-going reorganisation of production in East Asia driven by export-oriented investment in the mainland (Lemoine and Ünal-Kesenci, 2002a and 2004;Masuyama, 2004; Fukao et alii, 2003).
FDI investment in China, which has reached huge amounts, is concentrated inmanufacturing industries, as the service sectors were not opened to FDI up to China’sentry into WTO. From 1990 to 2004, the cumulated amount of FDI in China reachedalmost US$ 500bn, according to China’s statistics. In 2002, China received 8% of worldFDI, that is more than the other Asian developing countries taken together (6%)(Figure 1). Indeed the figures computed by the Chinese authorities seem to overstate thereal amount of FDI to China since the figures given by investing countries (mirrorstatistics) are much lower (Table 1). Several factors explain the difference: first,“roundtripping”, i.e. capital flows coming from the Mainland and transiting through HongKong and other tax-haven to be invested in China with benefit of the preferentialtreatment applied to FDI; second, the different methods of computation (cumulated flowsvs. stocks). However, in any set of data, most FDI is coming from East Asia, with HongKong and Taiwan accounting for an overwhelming share.
Recent studies indicate that market access and proximity to suppliers are the main factorsexplaining inward FDI flows in Chinese provinces (Fontagné and Mayer, 2005).However the motivations for investment in China differ according to the country of originof parent firms (Zhang, 1995; Tso, 1998; Masuyama, 2004). Surveys have shown thatAsian firms are motivated by cost considerations and tend to invest more than others inexport-oriented activities. American and European investment is driven by marketexpansion strategies rather than by cost considerations. Their investment in China ismore directed in capital-intensive sectors producing for the domestic market (Wei andLiu, 2001). 6 According to OECD statistics on international investment flows, China accounted for less than one
percent in the stock of investment abroad of the US and of most European countries; 5% in the case ofJapan and 15% in the case of South Korea.

China’s Integration in East Asia:Production Sharing, FDI & High-Tech Trade
13
Figure 1 – FDI Inflows: China Compared to Other Developing Countries1980-2002 (billion US$)
(8%)(6%)
(10%)
0
20
40
60
80
100
120
140
80 82 84 86 88 90 92 94 96 98 00 02
ChinaOther developing Asian countriesOther developing countries
in brackets: % World in 2002
Source: UNCTAD FDI/TNC database, www.unctad.org/fdistatistics.
Table 1 – FDI in China According to Chinese and Partners’ Declarations(billion of US$)
Declarations
of China (A) of partners (B)USA 32 11Japan 30 11South Korea 13 4Germany 7 5France 5 2United Kingdom 9 2Hong Kong 177 122Taiwan 34 29Notes : (A) Cumulated flows in the period 1990-2002; (B) Stocks.Sources: OECD, International Direct Investment Statistics Yearbook, 2002;China Statistical Yearbook, 2002; Hong Kong Annual Digest of Statistics, 2002;Banque de France: Balance des paiements, 2002.

CEPII, Working Paper No 2005-09
14
Japanese FDI in China (like in ASEAN* countries) is cost reduction (Fung et alii, 2003;Masuyama, 2004). Japanese foreign affiliates in China export more than half of theirproduction. The strategy of Japanese firms has evolved as their affiliates havestrengthened their links with local firms and increased local procurements (vs. imports).However, Japanese firms tend to lag behind other foreign investors and to face strongcompetition both from other foreign affiliates and from the local producers in thedomestic market.
For South Korean firms, China has overtaken the US as the first host country for FDI in2001. In a first stage, South Korean investment in China has been driven by costconsiderations and has been mostly export-oriented. However in the late nineties, a newwave of FDI has been driven by large corporations (Chaebols) aimed at China’s domesticmarket. The recent rise of South Korean FDI in relatively capital and technology-intensive industries and in capital goods has raised the fear that the South Koreanmanufacturing industry may be facing the risk of hollowing out, as it has happened inTaiwan (Lee and Kim, 2004).
Taiwanese investment in China has been export oriented, concentrated in labour-intensiveindustries, and led by small and medium sized enterprises (SMEs). However recenttrends show an evolution towards larger and more technology and capital intensiveprojects. In electronic industries, Taiwanese firms have extensively relocated theirproduction in China. In 2002, almost half of Taiwan’s information technology productsare produced in the mainland (Fung et alii, 2003).
The benefits that China has derived from becoming a production base for the East Asianindustrial firms include large capital inflows and a rapid rise of exports which havecontributed to its outstanding economic growth, the modernisation of its industrialcapacities and the building up of new industries (electrical and electronic industries)(Lardy, 2002; Lemoine, 2000; Wu, 1999; Naughton, 1997; Huchet, 1997).
As other latecomers such as Malaysia, Philippines, Thailand, China has developed aspecialisation in low value-added production, based on its almost unlimited supply oflow-cost labour. Its rise in international trade is heavily dependant on foreign affiliateswhich have developed limited backward and forward linkages (Zhang, 1999; Sung, 2000;Wu, 1999; Lemoine and Ünal-Kesenci, 2004).
2. CHINA IN THE INTERNATIONAL DIVISION OF LABOUR IN EAST ASIA
2.1. China’s Selective Trade Policy
Trade policy is an important factor determining a country’s involvement in theinternational splitting-up of the value-added chain. Tariff structure may affect the degreeof effective protection of the different sectors as tariff exemptions and reductions on

China’s Integration in East Asia:Production Sharing, FDI & High-Tech Trade
15
imported inputs increase the effective protection enjoyed by the assembly activities usingthese inputs, as it reduces their costs of production (Grubel and Johnson, 1971).
Most East Asian economies have followed a “dual track” trade policy, which combinedprotection of the domestic industries through relatively high customs tariffs, and exportpromotion, through tariff exemptions on imported inputs for export production (Ando andKimura, 2003).
China provides an outstanding case of such policy. Since the mid-eighties, the Chineseauthorities have used different instruments to promote exports (Lardy, 2002; Lemoine andÜnal-Kesenci, 2002a; Ianchovichina et alii, 2000; Naughton, 1996). Duty exemptionshave been granted to selected categories of imports in order to promote export-orientedindustries and to stimulate inflows of capital and technology through foreign directinvestment. Intermediate products imported to be used in production of exports(processing activities) have been the most important category benefiting from tariffexemptions. Concessionnal import duties have also been granted to equipment importedby foreign firms as a contribution to initial investment in affiliates in China.
Although China reduced its average customs tariff from 41% in 1992 to 16.8% in 1998-2001, the advantage derived from tariff exemptions has remained significant and thisselective trade policy has proved very successful in creating export-oriented industriesbased on imported inputs. The large gap between nominal tariff rates and collected tariffrates provides evidence of the extensive use of tariff exemptions (Lemoine and Ünal-Kesenci, 2004).
The following analysis shows that China’s selective trade liberalisation has led to anaccelerated expansion of international processing activities, which have been the engineof the rapid diversification of its manufactured exports. The effective protection enjoyedby processing activities has favoured strong productive links between China and its EastAsian partners. China’s integration in the production and trade networks of Asian firmshas been at the core of its foreign trade expansion. China’s selective trade policy has thusstrongly determined the commodity and geographic pattern of China’s trade in thenineties.
2.2. China’s Specialisation in Assembly Operations
China’s dual track policy has resulted in a highly fragmented trade sector. Four broadsegments can be distinguished in China’s foreign trade:
1) Ordinary trade encompasses imports which are subjected to general tariff rates, i.e.imports aimed at the domestic market (for investment or consumption) and exportsmainly based on local inputs.
2) Processing trade encompasses imports of goods to be assembled or transformed inChina and re-exported. This corresponds to the international practice of “inward

CEPII, Working Paper No 2005-09
16
processing” which is defined by the World Customs Organisation as “the customsprocedure under which certain goods can be brought into a customs territory conditionallyrelieved from payment of import duties and taxes, on the basis that such goods areintended for manufacturing, processing or repair and subsequent exportation”7. China’sCustoms statistics distinguish two types of inward processing: a) “Processing andassembling” refers to the type of inward processing in which foreign suppliers provideraw materials, parts or components under a contractual arrangement for the subsequent re-export of the processed products. Under this type of transaction the imported inputs andthe finished outputs remain property of the foreign supplier. b) “Processing withimported materials” refers to the type of inward processing in which raw materials orcomponents are imported from other firm than the foreign supplier for the manufacture ofthe export-oriented products. In both cases the imported inputs (raw materials, semi-finished goods, parts and components) are exempted from customs tariffs. Neither theseimported inputs, nor the output normally enter China’s domestic market.
3) Imports of goods by foreign investors as part of their initial investment in China.These imports are exempted from customs duties and concern mainly equipment andmachinery.
4) Other exports and imports, which are not subject to the general tariff regime(compensation trade, international aid, warehousing and entrepot trade).
Trade figures corresponding to these different trade segments are available since 1992.Within each category it is possible to identify the respective contributions of domestic(wholly Chinese) firms and of foreign firm affiliates since 1994.
China’s foreign trade expansion has relied mainly on processing operations. As early as1992, processed exports made up 46% of China’s total exports. This share rose to 55% in1996 and has represented more than half of China’s exports since then (Figure 2).During the Asian crisis (1997-1998), exports of processed goods performed better thanother categories of exports, and this resilience can be explained by their high importcontent which makes them less vulnerable to the effects of a real appreciation of theexchange rate (Dées and Lemoine, 1999).
Correspondingly, imports for processing have increased rapidly since 1992 and theirshare in total imports rose from less than 40% to almost 50% in 1997-1998 (Figure 2).Since 1998 they have lagged behind ordinary imports which registered a strong rise partlydue to the anti-smuggling measures implemented by the government but also, moresubstantially, to a rapid decline in the level of tariff rates in the late nineties. Imports forprocessing accounted for about 40% of total imports in 2003. Ordinary imports stillaccounted for less than half of total imports.
7 http://www.wcoomd.org

China’s Integration in East Asia:Production Sharing, FDI & High-Tech Trade
17
Figure 2 – Breakdown of China's Trade by Customs Regimes, 1992-2004
Exports in % of total Imports in % of total
0
10
20
30
40
50
60
92 93 94 95 96 97 98 99 00 01 02 03 04
Processed
Ordinary
Other
0
10
20
30
40
50
60
92 93 94 95 96 97 98 99 00 01 02 03 04
For processing
Ordinary
Other
For equity investment in JV
Source: China's Customs Statistics, authors' calculations.
2.3. The Reorganisation of Production in Asia
The pattern of China’s trade by partners and by customs regimes reveals China’s positionin the international segmentation of production processes and the ongoing reorganisationof industrial capacities in Asia (Table 2).
Assembly trade plays a dominant part in China’s trade with Asia. The weight of Asiancountries in China’s total imports results from their strong involvement in processingtrade. In 2002, almost 60% of China’s imports from the Dragons (Hong Kong, SouthKorea, Taiwan and Singapore) and 40% of its imports from Japan (against 35% in 1993)were aimed at supplying inputs for processing industries. The strong intensity of Asianexports to China can thus be explained by the international splitting-up of the value-addedchain within the region. As a result, Japan and the Dragons were by far the major sourceof inputs for China’s processing activities, providing almost 60% of these imports: 40%of China’s imports for processing came from the Dragons, and one-fifth from Japan.
By contrast Europe and the US contributed only marginally to the supply of goods forprocessing: taken together, they accounted for less than 10% of imports for processing in2002. Their weak presence in this segment of China’s imports partly explains their

CEPII, Working Paper No 2005-09
18
relatively low export intensity to China compared to Asian countries (Lemoine and Ünal-Kesenci, 2002a). Supplies of inputs for processing accounted for a relatively smallfraction of their exports: respectively 15% and 22% of China’s imports from the EU andthe US in 2002. Comparison with 1993 does not show major changes.
Table 2 – Breakdown of China's Trade by Main Partnersand Customs Regimes
Imports (% total)World Dragons* Japan EU 15 USA ROW
1993Imports by all custom regimes 100 28 22 15 10 25Ordinary imports 37 3 8 8 5 13Imports for processing 35 18 8 2 2 6Other custom regimes 28 7 7 6 3 62002Imports by all custom regimes 100 29 18 13 9 31Ordinary imports 44 8 6 8 5 16Imports for processing 41 17 8 2 2 11Other custom regimes 15 3 3 3 2 4
Exports (% total)World Dragons Japan EU 15 USA ROW
1993Exports by all custom regimes 100 29 17 13 18 22Ordinary exports 47 12 10 7 6 13Processed exports 48 16 7 7 13 6Other custom regimes 5 0 0 0 0 42002Exports by all custom regimes 100 27 15 15 21 22Ordinary exports 42 8 6 7 7 14Processed exports 55 18 9 8 14 7Other custom regimes 3 1 0 0 1 1
Trade Balance (billion of US$)World Dragons Japan EU 15 USA ROW
1993All custom regimes -12.2 -2.4 -7.5 -3.5 6.3 -5.1Ordinary trade 5.2 8.0 0.7 -2. -0.0 -1.5Processing trade 7.9 -3.8 -1.3 4.2 9.7 -1.0Other custom regimes -25.2 -6.6 -6.9 -5.8 -3.4 -2.62002All custom regimes 30.4 3.2 -5.0 9.7 42.7 20.1Ordinary trade 7.1 3.2 1.1 -3.1 6.7 -0.8Processing trade 57.7 7.2 3.1 19.6 39.9 -12.1Other custom regimes -34.4 -7.2 -9.3 -6.8 -4.0 -7.2* 2002 - 4 Dragons: Hong Kong, South Korea, Taiwan, Singapore.1993 - 3 Dragons: Hong Kong, South Korea, Taiwan.Source: China's Customs Statistics, authors' calculations.

China’s Integration in East Asia:Production Sharing, FDI & High-Tech Trade
19
Processed exports also account for a large share of Chinese exports to Asian countries (upto 60% in 2002, against 50% in 1993). Asian firms re-import a growing part of theproduction they relocated in the mainland. However, China’s processed exports are muchless concentrated on Asia than corresponding imports. Less than half of exports afterprocessing is directed to the Dragons and Japan in 2002 (as in 1993), a share which is stilloverstated since the largest part of processed exports recorded as going to Hong Kong isin fact aimed at the US and the European markets (EC, 1997). The US and the EUaccount for a much larger share in China’s processed exports (40% in 2002) than in itsimports for processing (10%). Moreover, their importance as export markets would beeven larger if exports transiting through Hong Kong were reallocated to their finaldestination. China’s processing trade has thus a built-in geographical asymmetry, asexports and imports follow different geographical patterns. East Asia is the main sourceof imports for processing as East Asian firms have expanded production and export basesin China to improve their competitiveness, and as firms from other regions (the US,Europe, etc) operating in Asia have followed the same strategy and have also moved theirproduction to China.
As a result, Chinese processed exports have a high content of imported Asian goods: tendollars of processed exports incorporate four dollars of intermediate goods supplied byJapan and the Three Dragons.
Processing activities are responsible for almost all China’s trade surplus. China records itslargest processing trade surplus with its “Western” partners. Excluding processing trade,China’s trade with the EU records a deficit, its trade with the US is almost balanced. Dueto China’s integration in Asian production networks, there is a built-in asymmetry inChina’s trade with the EU and the US. The US conflict with China about the bilateraldeficit may be largely misplaced. This deficit has much do to with the activity ofmultinational firms, which derive large profits and strong competitiveness from lowproduction costs in China.
Processing trade with Japan and the Dragons, which was a source of deficit in 1993, andstill in 1997, has also become an important source of China’s trade surplus in 2002. Thisindicates that since the end of the nineties firms in East Asia have more and moreextensively used China as a production base not only to sell in world markets but also forsupplying their own domestic markets.
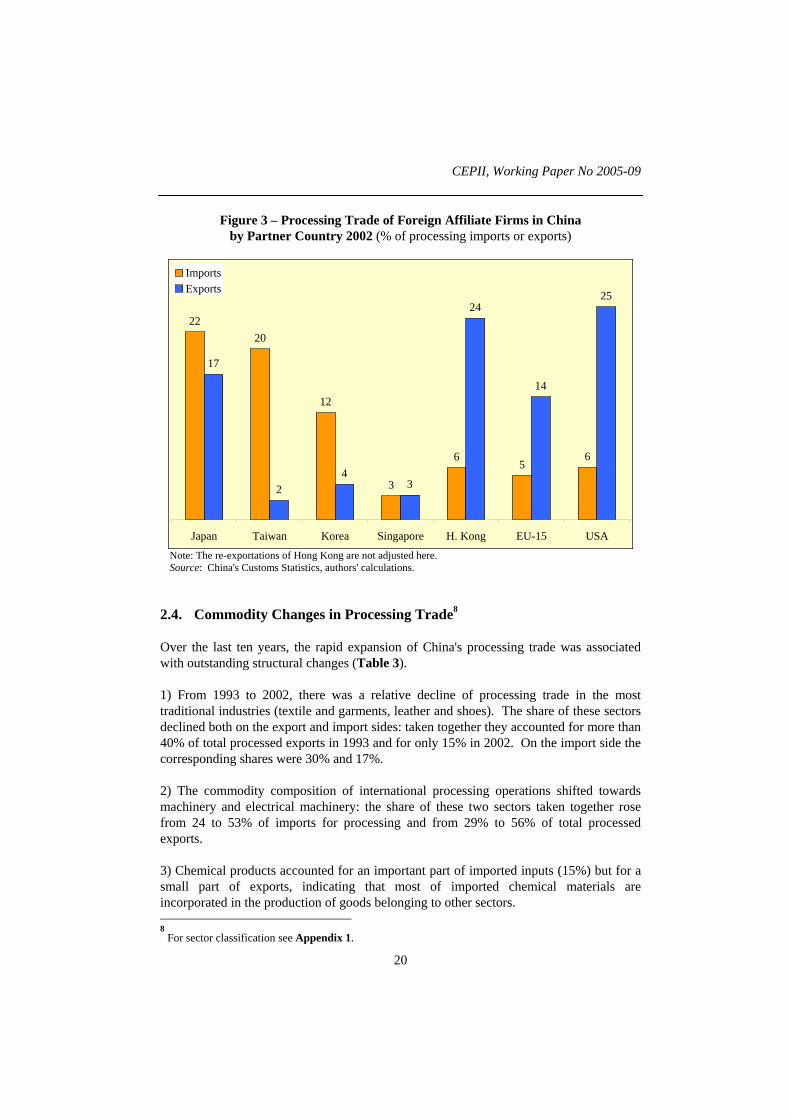
However the bulk of China’s processing activities is based on inputs coming fromindustrialised East Asian economies, and on re-exports of processed goods to Hong Kong,the US and the EU (Figure 3).
CEPII, Working Paper No 2005-09
20
Figure 3 – Processing Trade of Foreign Affiliate Firms in Chinaby Partner Country 2002 (% of processing imports or exports)
2220
12
3
65
6
17
24
3
24
14
25
Japan Taiwan Korea Singapore H. Kong EU-15 USA
ImportsExports
Note: The re-exportations of Hong Kong are not adjusted here.Source: China's Customs Statistics, authors' calculations.
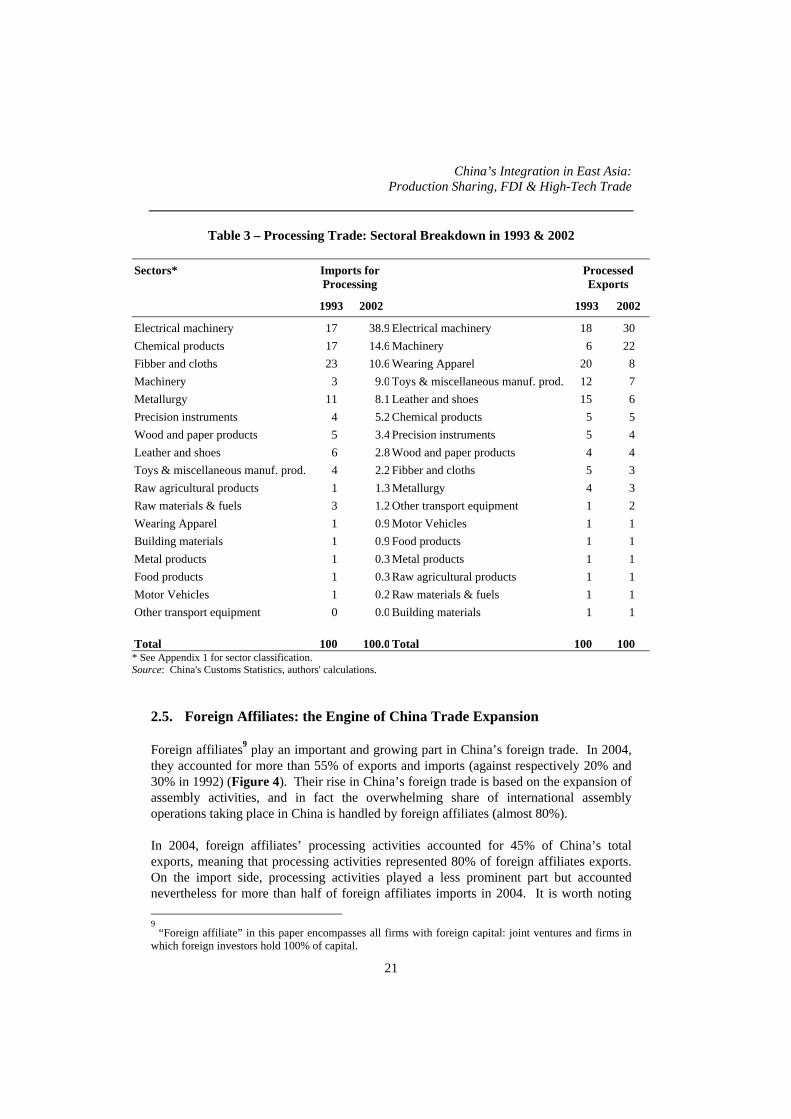
2.4. Commodity Changes in Processing Trade8
Over the last ten years, the rapid expansion of China's processing trade was associatedwith outstanding structural changes (Table 3).
1) From 1993 to 2002, there was a relative decline of processing trade in the mosttraditional industries (textile and garments, leather and shoes). The share of these sectorsdeclined both on the export and import sides: taken together they accounted for more than40% of total processed exports in 1993 and for only 15% in 2002. On the import side thecorresponding shares were 30% and 17%.
2) The commodity composition of international processing operations shifted towardsmachinery and electrical machinery: the share of these two sectors taken together rosefrom 24 to 53% of imports for processing and from 29% to 56% of total processedexports.
3) Chemical products accounted for an important part of imported inputs (15%) but for asmall part of exports, indicating that most of imported chemical materials areincorporated in the production of goods belonging to other sectors. 8 For sector classification see Appendix 1.
China’s Integration in East Asia:Production Sharing, FDI & High-Tech Trade
21
Table 3 – Processing Trade: Sectoral Breakdown in 1993 & 2002
Sectors* Imports forProcessing
ProcessedExports
1993 2002 1993 2002
Electrical machinery 17 38.9 Electrical machinery 18 30Chemical products 17 14.6 Machinery 6 22Fibber and cloths 23 10.6 Wearing Apparel 20 8Machinery 3 9.0 Toys & miscellaneous manuf. prod. 12 7Metallurgy 11 8.1 Leather and shoes 15 6Precision instruments 4 5.2 Chemical products 5 5Wood and paper products 5 3.4 Precision instruments 5 4Leather and shoes 6 2.8 Wood and paper products 4 4Toys & miscellaneous manuf. prod. 4 2.2 Fibber and cloths 5 3Raw agricultural products 1 1.3 Metallurgy 4 3Raw materials & fuels 3 1.2 Other transport equipment 1 2Wearing Apparel 1 0.9 Motor Vehicles 1 1Building materials 1 0.9 Food products 1 1Metal products 1 0.3 Metal products 1 1Food products 1 0.3 Raw agricultural products 1 1Motor Vehicles 1 0.2 Raw materials & fuels 1 1Other transport equipment 0 0.0 Building materials 1 1
Total 100 100.0 Total 100 100* See Appendix 1 for sector classification.Source: China's Customs Statistics, authors' calculations.
2.5. Foreign Affiliates: the Engine of China Trade Expansion
Foreign affiliates9 play an important and growing part in China’s foreign trade. In 2004,they accounted for more than 55% of exports and imports (against respectively 20% and30% in 1992) (Figure 4). Their rise in China’s foreign trade is based on the expansion ofassembly activities, and in fact the overwhelming share of international assemblyoperations taking place in China is handled by foreign affiliates (almost 80%).
In 2004, foreign affiliates’ processing activities accounted for 45% of China’s totalexports, meaning that processing activities represented 80% of foreign affiliates exports.On the import side, processing activities played a less prominent part but accountednevertheless for more than half of foreign affiliates imports in 2004. It is worth noting 9 “Foreign affiliate” in this paper encompasses all firms with foreign capital: joint ventures and firms in
which foreign investors hold 100% of capital.

CEPII, Working Paper No 2005-09
22
that between 1992 and 2004, foreign affiliates also rapidly increased their imports notaimed at processing activities: in 2004 imports for domestic use (i.e. excluding forprocessing) represented 45% of their total imports. This means that foreign affiliateswere responsible for about one fourth of China’s total imports for the domestic market.
Figure 4 – Share of Foreign Affiliates (FA) in Total China’s Trade, 1992-2004
In % of total imports In % of total exports
0
10
20
30
40
50
60
92 93 94 95 96 97 98 99 00 01 02 03 04
FA total imports
FA imports for processing
0
10
20
30
40
50
60
92 93 94 95 96 97 98 99 00 01 02 03 04
FA total exports
FA processed exports
Source: China's Customs Statistics, authors' calculations.
Foreign affiliates play an especially important part in China’s trade with East Asiancountries (Table 4). In 2002 they accounted for between 60% and 67% of China’simports from Japan, and from NIEs, and for more than 60% of China’s exports to Japan,Hong Kong and Singapore. Interestingly, the rise of foreign affiliates in China’s tradewith Asian countries between 1993 and 2002 is due to wholly-foreign firms which, in2002, carried out more trade activities than joint-ventures. The importance taken byforeign affiliates suggests that China’s bilateral trade with these countries is likely toinclude a significant amount of intra-firm trade.
By contrast foreign affiliates represent less than half of Chinese imports from Europe andthe US. However, their share considerably increased in China’s exports to Europe andthe US, reflecting both the increased competitiveness of production bases in China andthe outsourcing strategies of Western firms.

China’s Integration in East Asia:Production Sharing, FDI & High-Tech Trade
23
Table 4 – Foreign Affiliates in China’s Trade with Major Partners, 1997 & 2002
1997 World EU-15 USA Japan Hong Kong Singapore Korea Taiwan
All Export Flows (% total flows) 100 100 100 100 100 100 100 100FA Total Exports 41 38 52 50 42 45 34 47
JV 24 21 25 31 28 25 17 22WFOF 17 18 27 20 13 20 17 25
FA Processed exports 35 33 47 40 37 40 28 39JV 19 16 21 24 24 21 12 17
WFOF 16 17 26 17 12 18 16 22All Import Flows (% total flows) 100 100 100 100 100 100 100 100FA Total Imports 55 55 47 67 63 63 64 69
JV 35 45 33 41 38 40 36 30WFOF 20 10 14 27 25 23 28 39
FA Imports for Processing 33 12 21 44 52 37 48 53JV 19 8 12 25 30 20 24 23
WFOF 15 4 9 19 22 17 24 30Overall Trade Balance (bn US$) 40.4 4.6 16.4 2.8 36.8 -0.1 -5.8 -13.0FA Total Trade Balance -2.8 -1.5 9.3 -3.5 13.9 -0.9 -6.4 -9.7
JV -5.7 -3.8 2.7 -2.0 9.8 -0.7 -3.8 -4.2WFOF 2.9 2.3 6.6 -1.5 4.1 -0.2 -2.6 -5.6
FA Processing Trade Balance 16.2 5.5 11.9 0.2 12.5 0.1 -4.6 -7.4JV 8.4 2.3 4.9 0.4 8.5 0.1 -2.5 -3.2
WFOF 7.8 3.2 7.1 -0.2 4.0 0.0 -2.1 -4.2
2002 World EU-15 USA Japan Hong Kong Singapore Korea Taiwan
All Export Flows (% total flows) 100 100 100 100 100 100 100 100FA Total Exports 52 50 58 62 63 65 49 57
JV 23 21 21 30 27 34 21 15WFOF 30 28 37 32 36 31 27 42
FA Processed exports 41 40 48 47 54 54 35 45JV 16 15 15 21 21 28 14 10
WFOF 25 25 33 26 33 26 21 35All Import Flows (% total flows) 100 100 100 100 100 100 100 100FA Total Imports 54 49 48 67 63 61 63 67
JV 23 31 21 30 28 20 28 16WFOF 31 18 27 37 36 41 36 52
FA Imports for Processing 32 12 21 39 53 36 41 49JV 11 6 6 16 23 11 15 11
WFOF 21 7 15 23 30 25 26 39Overall Trade Balance (bn US$) 30.4 9.7 42.7 -5.0 47.7 -0.1 -13.0 -31.5FA Total Trade Balance 9.7 5.0 27.4 -6.0 30.2 0.2 -10.5 -21.9
JV 4.6 -1.8 8.8 -1.5 12.7 0.9 -4.6 -5.0WFOF 5.2 6.8 18.5 -4.5 17.5 -0.7 -5.9 -16.9
FA Processing Trade Balance 40.5 14.5 27.8 2.2 26.0 1.2 -6.2 -15.8JV 19.0 4.9 8.7 1.8 10.1 1.2 -2.1 -3.4
WFOF 21.5 9.6 19.1 0.4 15.9 0.1 -4.1 -12.4FA: foreign affiliates; JV: joint venture; FFOF: wholly foreign owned firm.Source: China's Customs Statistics, authors' calculations.

CEPII, Working Paper No 2005-09
24
In 2002, foreign affiliates were responsible for about one third of China’s trade surplus.They record the bulk of their surpluses on “Western” markets (the US and to a lesserextent Europe) while they record large deficits with most East Asian partners. In fact,their surplus with Hong Kong should be eventually attributed to their trade with Europeand the US.
3. VERTICAL SPECIALISATION, TECHNOLOGY TRANSFER AND REGIONALINTEGRATION
3.1. China’s Trade by Stage of Production10
China’s imports are heavily dominated by intermediate products which amounted toalmost two-thirds of its total imports in 2002 (Table 5). Within this category, parts andcomponents constitute by far the most dynamic imports (19% in 1997, 27% in 2002),although imports of semi-finished products are still more important (36%).
Table 5 – China's Trade Pattern and Comparative Advantage*by Stage of Production, 1997-2002
Breakdownof imports
Breakdownof exports
Contribution totrade balance*
1997 2002 1997 2002 1997 2002Primary goods 10.6 10.3 5.1 2.9 -27 -37Intermediate goods 65.9 63.3 33.4 37.1 -160 -131
Semi-finished goods 47.0 35.9 25.3 21.6 -107 -71Parts & components 18.9 27.5 8.2 15.5 -53 -60
Final goods 23.5 26.3 61.5 60.0 187 168Consumption goods 4.4 5.1 48.9 40.3 219 176
Capital goods 19.1 21.2 12.6 19.7 -32 -8Total 100.0 100.0 100.0 100.0 0 0* See Appendix 4 for the indicator of contribution to trade balance.Source: China's Customs Statistics, authors' calculations.
On the export side, final goods are by far the most important category (60% in 2002),within which consumer goods take an overwhelming share (40%), but capital goods arerising more rapidly (from 12% in 1997 to 20% in 2002). In final good exports, a shiftoccurred away from consumption goods towards capital goods, indicating that China isupgrading its export capacities towards more technology-intensive products. Moreoverparts and components made up an increasing share of exports (16% in 2002). 10
For the definition of the stages of production used in this section see Appendix 2.

China’s Integration in East Asia:Production Sharing, FDI & High-Tech Trade
25
The rapid increase in exports and imports of parts and components indicates a deepeninginternational division of production processes. This finding is in line with the conclusionsof studies on production sharing in East Asia (Ng and Yeats, 1999 and 2003), showingthat trade in components has been the most dynamic part of East Asian trade in thenineties. Following the distinction proposed by the authors between the producers ofcomponents (countries having a positive trade balance in components) and the assemblycountries (countries having a negative trade balance in components), China clearly standsas an assembly country, a position similar to that of other low-wage Asian countries(Indonesia, Thailand, Malaysia).
The indicator of contribution to trade balance confirms that China’s position in theinternational division of labour is characterised by strong comparative advantage(structural surpluses) in consumption goods, associated with large disadvantages(structural deficits) in intermediate goods, and small structural deficits in capital goodsand in primary goods.
A previous study has shown that in industries which represent the most dynamic exportsand which are also the technologically advanced sectors, (machinery and equipment,office machinery and computers, electrical machinery, radio and TV equipment,instruments), China shows a vertical specialisation, i.e. there is a reversal of itscomparative advantages along the production processes: it switches from a relative deficitin parts and components to a surplus in consumption, and in some cases in capital goods.This vertical specialization highlights the crucial role of international production sharingin explaining China’s export performance in these sectors (Lemoine and Ünal-Kesenci,2004).
China’s trade in intermediate goods is heavily concentrated on Asia, confirming thatproduction sharing is above all a regional process (Table 6). More than 80% ofintermediate imports (semi-finished products and parts and components) come from Asiaand more than 60% of exports of parts and components are directed to Asia. With Asia,China records its largest structural deficit11 in intermediate goods, a smaller deficit incapital goods, and a large surplus in consumption goods. With the rest of the world,China’s trade surpluses stem from consumption goods, and also from capital goods in itstrade with North America, due to a rapid rise of exports of computer equipment.
11
Structural deficit (surplus) is measured by the indicator of contribution to trade balance, seeAppendix 4.

CEPII, Working Paper No 2005-09
26
Table 6 – China's Trade Pattern by Region and Stage of Production, 2002
PrimaryGoods
Semi-finishedGoods
Parts &components
CapitalGoods
ConsumptionGoods
Total
Contribution to Trade Balance* (in thousands of total trade)World -37 -71 -60 -8 176 0Asia-Oceania -5 -62 -53 -16 72 -64Western Europe -2 -2 -9 -6 25 6America -9 -1 1 11 60 62Others -21 -6 1 4 18 -4Export Breakdown (% of World Total)World 3 22 16 20 40 100Asia-Oceania 2 12 10 9 17 51Western Europe 0 3 2 4 6 15America 0 4 3 6 13 26Others 0 2 1 1 4 9Import Breakdown (% of World Total)World 10 36 27 21 5 100Asia-Oceania 3 25 20 12 3 63Western Europe 1 3 4 5 1 14America 2 4 3 3 1 13Others 4 3 1 0 0 9Notes: * See Appendix 4. Asia-Oceania includes all countries located in Asia and in Pacific area (including Australia,and New Zealand). Western Europe includes EU-15 and EFTA; America includes all American countries.Source: China's Customs Statistics, authors' calculations.
3.2. Production Sharing and Technological Catch-up
How has production sharing with Asian countries enhanced China’s technological catchup? Looking at the technological content of China’s exports and imports it stands out thatChina has succeeded in rapidly upgrading the technological content of its foreign trade.A recent OECD study (2004) shows that the share of high-tech goods in China’smanufactured exports rose from 10% in 1992 to 24% in 2001. Calculations based on thedata provided by the World Bank (WDI) show that China’s share of world exports inhigh-tech goods rose from zero to almost 5% in 2002 (Figure 5).
The present analysis uses the CEPII’s high-tech product classification based on OECDand Eurostat studies which corresponds to a narrower definition of high-tech products12.Figure 6 confirms that the high-technology content of China’s trade rapidly increased inrecent years. High-tech exports increased more rapidly than high-tech imports andChina’s trade deficit in this category of products narrowed significantly. In 2002, importsof high-technology products accounted for 15% of China’s imports and for 12% of itsexports (against respectively 11% and 7% in 1997). High-tech products hold an
12
For the classification of high-tech products, see Appendix 3.
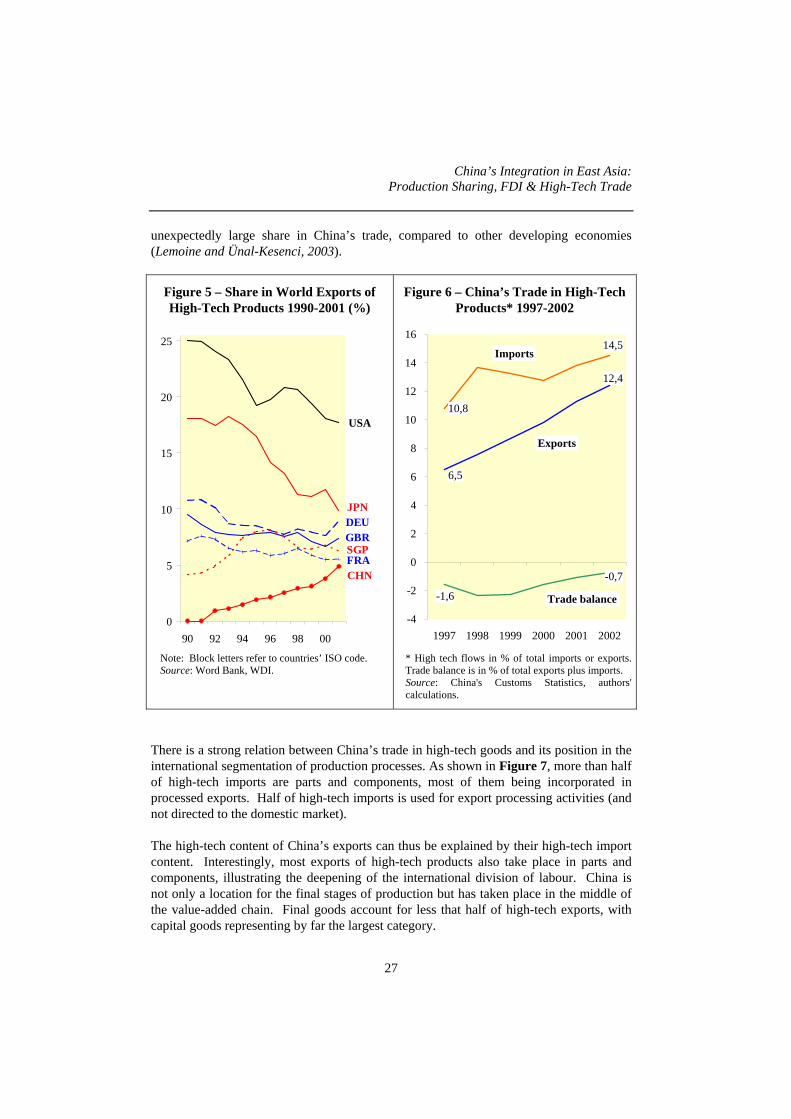
China’s Integration in East Asia:Production Sharing, FDI & High-Tech Trade
27
unexpectedly large share in China’s trade, compared to other developing economies(Lemoine and Ünal-Kesenci, 2003).
Figure 5 – Share in World Exports ofHigh-Tech Products 1990-2001 (%)
Figure 6 – China’s Trade in High-TechProducts* 1997-2002
USA
JPNDEUGBRSGPFRACHN
0
5
10
15
20
25
90 92 94 96 98 00
6,5
12,4
10,8
14,5
-1,6
-0,7
-4
-2
0
2
4
6
8
10
12
14
16
1997 1998 1999 2000 2001 2002
Imports
Exports
Trade balance
Note: Block letters refer to countries’ ISO code.Source: Word Bank, WDI.
* High tech flows in % of total imports or exports.Trade balance is in % of total exports plus imports.Source: China's Customs Statistics, authors'calculations.
There is a strong relation between China’s trade in high-tech goods and its position in theinternational segmentation of production processes. As shown in Figure 7, more than halfof high-tech imports are parts and components, most of them being incorporated inprocessed exports. Half of high-tech imports is used for export processing activities (andnot directed to the domestic market).
The high-tech content of China’s exports can thus be explained by their high-tech importcontent. Interestingly, most exports of high-tech products also take place in parts andcomponents, illustrating the deepening of the international division of labour. China isnot only a location for the final stages of production but has taken place in the middle ofthe value-added chain. Final goods account for less that half of high-tech exports, withcapital goods representing by far the largest category.

CEPII, Working Paper No 2005-09
28
Figure 7 – China’s High-Tech Trade by Custom Regimeand Production Stage in 2002 (%)
52
35
120
47
43
3
42
18
10
41
36
896
14
0
10
20
30
40
50
60
70
80
90
100
Allregimes
Processing Ordinary Others Allregimes
Processing Ordinary Others
Semi-Finished Components Capital Consumption
Imports Exports
Source: China's Customs Statistics, authors' calculations.
China’s high-tech trade is heavily concentrated in a limited number of products(Figure 8). Three branches account for 80% of China’s high-tech imports: radio and TV;office machinery; precision instruments. The two top export products (radio and TV;office machinery) account for 85% of high-tech imports.
Figure 8 – Breakdown of China’s High-Tech Trade by Branch*(in % of high-tech products flows)
38
22
4
19
4 48
50
36
96
2 1 0
Radio, TV &com. equip.
Officemachinery
Chemicals Precisioninstruments
Electricalmachinery
Machinery Other transportequipment
ImportsExports
* ISIC classification, 2 digit level.Source: China's Customs Statistics, authors' calculations.

China’s Integration in East Asia:Production Sharing, FDI & High-Tech Trade
29
3.3. China’s High-tech Trade and Regional Integration
The overwhelming share of China’s high tech imports originates from Asia (Table 7).This share reached 70% in 2002, against 56% in 1997. Since 1997, the US and Europehave lost ground in the supply of high-tech products to China. The pattern of China’shigh-tech exports is stable: more than half is going to Asia, one fourth to America and onesixth to Europe.
High-technology trade between China and Asia is concentrated in parts and components,which account for almost 60% of both China’s high-tech exports and imports to and fromthe region.
Production sharing with Asian countries has thus been an important factor stimulatingtechnological transfer to China and favouring the upgrading of its export capacity.However, looking more in depth into the channels of technology transfer raises questionsabout its broad impact on the diffusion and assimilation of foreign technology by Chineseindustry. Two observations cast some doubt on the progress of indigenous technologicallevel: first, four-fifth of high-tech exports in 2002 come from processing activities, asmentioned above; second China’s high-tech trade is more and more heavily dominated byforeign affiliates, as shown in the following section.
Table 7 – Breakdown of China’s Trade in High Technology Productsby Production Stage and Major Zone, 2002 (in %)
IMPORTSAsia-Oceania Western Europe America Others World
Semi-Finished Products 3 1 1 0 5Parts & Components 40 5 6 1 52Capital Goods 27 5 8 1 42Consumption Goods 0 0 0 0 1Total 70 11 15 3 100EXPORTS
Asia-Oceania Western Europe America Others WorldSemi-Finished Products 5 2 2 1 9Parts & Components 33 5 8 1 47Capital Goods 17 8 14 2 41Consumption Goods 1 1 1 0 3Total 56 15 25 5 100Notes: Asia-Oceania includes all countries located in Asia and in Pacific area (including Australia, and NewZealand). Western Europe includes EU-15 and EFTA; America includes all American countries.Source: China's Customs Statistics, authors' calculations.

CEPII, Working Paper No 2005-09
30
3.4. The Dependence of China’s High-tech Trade on Foreign Affiliates
Foreign affiliates are at the core of China’s foreign trade in high-tech products (Table 8).They are responsible for an ever-growing share of China’s high-tech trade and played adominant part both in exports and imports in 2002. They accounted for more than two-thirds of China’s high-tech imports in 2002, against 58% in 1997. Foreign affiliates heldan even more dominant position in high-tech exports as they carried out three-quarter ofChina’s high-tech exports. The rising role of foreign affiliates in China’s high-tech tradewas entirely due to wholly foreign firms, which accounted for almost half of China’s hightech exports and imports in 2002. Chinese firms are clearly loosing ground in high-techtrade, and held only one third of high-tech imports and one fourth of high-tech exports in2002 (against more than 40% in both exports and imports in 1997).
Table 8 – Breakdown of China’s High-Tech Trade by Category of Firms
1997 2002 1997 2002 1997 2002
Chinese firms 42 33 42 24 -13 -18
Joint Venture 33 22 28 29 -20 10
Fully foreign owned firms 25 45 30 47 -4 -1 All firms 100 100 100 100 -37 -9
(% X+M)Trade BalanceM X
% %
Source: China's Customs Statistics, authors' calculations.
China’s high-tech trade with Asia shows an especially high dependence on foreignaffiliates (Figure 9). Almost 80% of China’s high-tech exports to and imports from Asiarely on foreign affiliates, with more than half on wholly foreign firms.
The distribution of high tech imports from the US and Europe is much less biased infavour of foreign affiliates. Chinese firms realise more than half of these imports, and therest is more or less evenly distributed between joint-ventures and wholly-foreign firms(see appendix 5). Technology transfer from Europe and America follows a moretraditional pattern, based on arm’s length exports of capital goods, which contrasts withthe Asian pattern based on sales of parts and components. However in China’s high-techexports to the US and Europe, foreign affiliates play a dominant part.
Production sharing with Asian partners has hence undoubtedly raised the technologicallevel of China’s exports and imports. But this upgrading seems to have remained quitecircumscribed to the production and export bases created in the mainland by Asian firms.

China’s Integration in East Asia:Production Sharing, FDI & High-Tech Trade
31
Figure 9 – Breakdown of China’s High-Tech Trade by Region Partnerand Category of Firms
Source: China's Customs Statistics, authors' calculations.
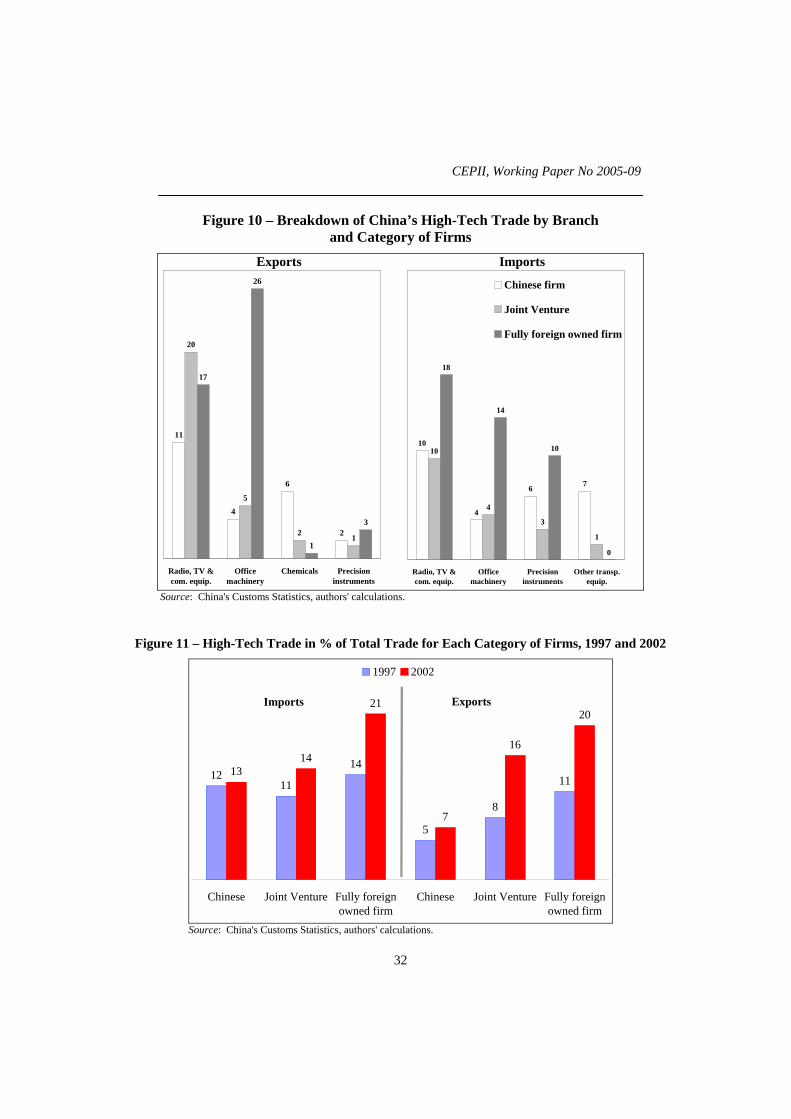
Looking at the product composition of high-tech trade, the following observations standout: wholly foreign firms appear to concentrate their high-tech exports in officemachinery (computers), which are products likely to require the most advancedtechnology; joint ventures’ exports are concentrated on more Radio, TV andtelecommunication equipment, while high-tech exports of Chinese firms are morediversified (Figure 10). On the import side, the product distribution is less concentrated;it is worth noting that wholly foreign firms dominate imports of all major categories ofproducts.
The “high-tech intensity” of trade flows by category of firms was defined as the share ofhigh-tech products in the exports (imports) of each category of firms. It stands out thatforeign affiliates’ trade have a higher high-tech intensity than Chinese firms’, i.e. high-tech products represent a much larger share of their exports (and imports) that in Chinesefirms exports (imports) (Figure 11). The gap between the different categories of firmsincreased from 1997 to 2002, both on the export and import sides. In 1997 the high-techintensity of imports was quite similar across the different categories of firms, but itremained almost stable up to 2002 in the case of the Chinese firms while it rose fast in thecase of wholly foreign firms. In 2002, the high-tech content stands at 13% in the Chinesefirms imports, 14% in JV imports and 21% in wholly foreign firm imports. On the exportside, the diverging trends are even more remarkable, and in 2002, the high-tech exportintensity is almost three times higher in the case of wholly foreign firms (20%) than in thecase of Chinese firms (7%).
CEPII, Working Paper No 2005-09
32
Figure 10 – Breakdown of China’s High-Tech Trade by Branchand Category of Firms
Exports Imports
11
4
6
2
20
5
2 1
17
26
1
3
Radio, TV &com. equip.
Officemachinery
Chemicals Precisioninstruments
10
4
6 7
10
4
3
1
18
14
10
0
Radio, TV &com. equip.
Officemachinery
Precisioninstruments
Other transp.equip.
Chinese firm
Joint Venture
Fully foreign owned firm
Source: China's Customs Statistics, authors' calculations.
Figure 11 – High-Tech Trade in % of Total Trade for Each Category of Firms, 1997 and 2002
1211
14
5
8
1113
14
21
7
16
20
Chinese Joint Venture Fully foreignowned firm
Chinese Joint Venture Fully foreignowned firm
1997 2002
Imports Exports
Source: China's Customs Statistics, authors' calculations.

China’s Integration in East Asia:Production Sharing, FDI & High-Tech Trade
33
The intensity of high-tech trade by industry and category of firms helps understanding therelatively low performance of Chinese firm’s high-tech exports: the high-tech intensity oftheir exports by product is relatively similar to that of foreign affiliates; the low level oftheir overall high-tech exports thus comes from their product specialisation: in contrast toforeign affiliates, their exports are not concentrated in industries incorporating hightechnology (Table 9).
Table 9 – High-Tech Intensity of China’s Trade Flows by Category of Firmsand Branch* (high-tech flows in % of total trade by firm type in the branch)
Chinese firms
Joint Venture
Fully foreign owned firms
All firms
Chinese firms
Joint Venture
Fully foreign owned firms
All firms
Chemicals 3 6 3 4 24 23 11 22Metal products 29 0 0 12 0 0 0 0Machinery 5 4 6 5 1 1 1 1Office machinery 30 74 64 54 34 32 41 39Electrical machinery 15 14 9 12 3 6 6 5Radio, TV & com. equip. 31 28 30 29 46 51 40 45Precision instruments 51 53 67 58 22 30 43 31Other transport equip. 64 65 1 62 2 4 0 2
TOTAL 13 14 21 16 7 16 20 13
IMPORTS EXPORTS
* ISIC classification, 2 digit level.Source: China's Customs Statistics, authors' calculations.
4. THE IMPACT OF CHINA’S EMERGENCE ON ASIAN TRADE
China’s integration in Asian production networks, described in the above section, hasconsiderably affected both the distribution of intra-regional trade and the positions of EastAsian countries in their trade with the rest of the world.
4.1. The Rise of East Asia in World Trade
From 1980 to 2002, the contribution of East Asia13 to world trade increased considerably.The share of East Asia in world exports rose from 13% to 23% and in world imports from13% to 19% (Table 10). Except Japan and Hong Kong, all East Asian economiescontributed to this rise but China alone accounted for half of the registered increase.
13
Japan, NIEs (HK, Taiwan, Korea, Singapore), ASEAN* (Indonesia, Malaysia, Philippines, Thailand,Vietnam, Lao, Cambodia, Brunei).

CEPII, Working Paper No 2005-09
34
Table 10 – Share in World Trade (%)
Exports Imports1980 1990 2002 1980 1990 2002
Japan 6.6 8.6 6.7 6.3 6.2 5.0China 0.9 1.7 6.0 1.1 1.3 4.1Asian NIEs 3.2 5.9 6.1 3.8 6.1 6.4South Korea 0.9 1.9 2.6 0.8 1.2 1.1Taiwan 1.0 2.0 2.1 1.1 1.5 1.3Singapore 0.7 1.1 1.1 1.1 1.9 2.3Hong Kong 0.7 0.9 0.3 0.8 1.5 1.7ASEAN (without Singapore) 2.8 2.7 4.7 2.0 2.6 3.5Malaysia 0.7 0.9 1.6 0.5 0.7 1.1Thailand 0.3 0.6 1.1 0.4 0.9 0.9Indonesia 1.2 0.8 1.0 0.6 0.6 0.6Philippines 0.3 0.3 0.6 0.4 0.4 0.6Vietnam, Cambodia, Laos 0.1 0.1 0.3 0.1 0.0 0.3Brunei Darussalam 0.2 0.1 0.1 0.0 0.0 0.0East Asia 13.4 18.8 23.4 13.2 16.2 18.9Source: CEPII-CHELEM database, authors' calculations.
The pattern of regional trade has thus dramatically changed since the beginning of theeighties (Figure 12). From 1980 to 2002, the rise of China in East Asian exports (from6% to 25% of the region’s exports) almost completely compensated the relative fall ofJapan (from 50% to 30%). The weight of NIEs remained almost stable, at about onefourth of regional exports. ASEAN* exports recorded a relative decline during theeighties and a revival in the nineties which puts its share of regional exports in 2002 at thesame level as in 1980 (20%).
On the import side, the major change in East Asian trade also came from the contractionof Japan’s share (from 48% to 27% of the regional total), which was compensated by therise of China, whose share rose from 8% to 21%. The weight of NIEs also increased.The gain recorded by ASEAN* occurred in the nineties (form 16% to 18% of regionalimports).
Over the last two decades, there was thus a convergence in the positions of the differentcountries/groups of countries in the region’s trade. On the export side, China with onefourth of the region’s trade in 2002, is catching up with Japan (29%), and with the NIEs(26%). ASEAN* is also on a catching up process (20% of the regions’ exports in 2002),although at a slower pace than China.
On the import side, a similar convergence of intra-regional trade powers is taking place.Since the beginning of the nineties, the NIEs (34% of regional imports in 2002), haveovertaken Japan (27%). In 2002, China (21%) overtook ASEAN* (18%).

China’s Integration in East Asia:Production Sharing, FDI & High-Tech Trade
35
Figure 12 – Share of East-Asian Countries in Regional Trade(% of total East-Asian trade)
Exports Imports
0
10
20
30
40
50
80 82 84 86 88 90 92 94 96 98 00 02
Japan
NIEs
ASEAN*China
0
10
20
30
40
50
80 82 84 86 88 90 92 94 96 98 00 02
Japan
NIEs
ASEAN*
China
Note: NIEs: Hong Kong, Singapore, South Korea, Taiwan; ASEAN*: ASEAN countries excludingSingapore.Source: CEPII-CHELEM database, authors' calculations.
4.2. The Rise of Intra-Regional Trade
The segmentation of production processes between China and Asian countries has led toan increased concentration of Asian countries’ trade within the region. In 2002 EastAsian countries directed 42% of their exports to the region (against 36% in 1990) and had50% of their imports coming from the region (against 42% in 1990). The increasedconcentration on intra-regional trade is to a large extent due to China’s enlarged role inregional trade. China’s share in intra-regional trade almost doubled, from 10% to 20%(Table 11).

CEPII, Working Paper No 2005-09
36
Table 11 – East Asia: Distribution of Intra-Regional Trade in 1990 and 2002 (%)
2002 ImporterExporter Japan NIEs* China Asean** East AsiaJapan 12 9 7 28NIEs* 5 7 10 8 30China 10 6 3 19Asean** 7 9 3 4 23East Asia 23 35 22 21 1001990 ImporterExporter Japan NIEs* China Asean** East AsiaJapan 23 4 10 37NIEs* 11 9 5 8 32China 5 4 1 10Asean** 11 8 1 2 21East Asia 27 43 10 21 100
* New industrialised economies: South Korea, Hong Kong, Singapore, Taiwan** Without SingaporeSource: CEPII-CHELEM data base, authors' calculations.
4.3. Substitution and Competition in World Markets
As a result of the reorganisation of production in Asia, a triangular trade pattern hasemerged. China is used as an export base by the firms located in advanced Asianeconomies, which instead of exporting finished goods to the American and Europeanmarkets, now export intermediate goods to their affiliates in China. China’s exports tothe EU and the US have skyrocketed and have displaced Japan’s and NIEs’ exports ataccelerated pace.
The cases of Asian exports of electrical and electronic goods to the US and Europeprovide a clear evidence of this substitution.
The tremendous rise of China’s exports of electrical goods to the US since the mid-eighties has been accompanied by a relative stagnation of exports by Japan and the NIEs(Figure 13). As a result Chinese exports overtook NIEs and Japanese exports in the latenineties; ASEAN* exports continued to rise up to the end of the nineties and havedeclined since. In electronic goods, the differences in market shares of the differentexporters to the US were much wider up to the early nineties. NIEs and Japanese exportshave stagnated since the mid-nineties while China’s and ASEAN* exports continued theiraccelerated growth. Since 2001, following the drop of other Asian exporters, China hascaught up the NIEs as the largest exporter of electronic goods to the US.
Similar trends are observed in Asian exports to the EU (Figure 14). In electronic andelectrical goods, the steady rise of China’s exports was accompanied by the drop or thelevelling of Japan and NIEs exports in the late nineties. As a result of this substitutioneffect, China’s has become the major Asian supplier of electrical goods to the EU, andhas almost caught up Japan. ASEAN* exports in both sectors continued to increaserapidly up to 2000 and have fallen since.

China’s Integration in East Asia:Production Sharing, FDI & High-Tech Trade
37
Figure 13 – US Imports from East-Asia, 1980-2002(thousand US$)
Electrical Goods (Appliance & Machinery)
JapanNIEs
China
ASEAN*0
5 000
10 000
15 000
20 000
25 000
30 000
35 000
40 000
45 000
50 000
80 82 84 86 88 90 92 94 96 98 00 02
Electronics
Japan
NIEsChina
ASEAN*
0
5 000
10 000
15 000
20 000
25 000
30 000
35 000
40 000
45 000
50 000
80 82 84 86 88 90 92 94 96 98 00 02Note: NIEs: Hong Kong, Singapore, South Korea, Taiwan; ASEAN*: ASEAN countriesexcluding Singapore.Source: CEPII-CHELEM data base, authors' calculations.

CEPII, Working Paper No 2005-09
38
Figure 14 – EU-15 Imports from East-Asia, 1980—2002(thousand US$)
Electrical Goods (Appliance & Machinery)
JapanNIEs
China
ASEAN*0
5 000
10 000
15 000
20 000
25 000
30 000
35 000
80 82 84 86 88 90 92 94 96 98 00 02
Electronics
Japan
NIEs
ChinaASEAN*
0
5 000
10 000
15 000
20 000
25 000
30 000
35 000
80 82 84 86 88 90 92 94 96 98 00 02Note: NIEs: Hong Kong, Singapore, South Korea, Taiwan; ASEAN*: ASEAN countriesexcluding Singapore.Source: CEPII-CHELEM data base, authors' calculations.

China’s Integration in East Asia:Production Sharing, FDI & High-Tech Trade
39
The contribution of the different Asian countries or group of countries to US trade deficitreflects the substitution of China’s exports for Japan and NIEs ones. In the nineties, theshare of Japan and NIEs in US trade deficit declined significantly, while China wasresponsible for an increasing share of this deficit (Figure 15).
Figure 15 – The Share of East Asia in Total US Trade Deficit(% of US Total Trade Balance)
Japan
NIEs
China
ASEAN*
-30
-20
-10
0
10
20
30
40
50
60
70
80
80 82 84 86 88 90 92 94 96 98 00 02Note: NIEs: Hong Kong, Singapore, South Korea, Taiwan; ASEAN*: ASEAN countries excludingSingapore.Source: CEPII-CHELEM data base, authors' calculations.
4.4. Triangular Trade
China’s emergence has considerably accentuated the “triangular” trade pattern, byspeeding up the withdrawal of the most advanced Asian economies from the productionand exports of labour intensive products (consumption goods) and enlarging trade ofsophisticated intermediate goods within Asia. The structural factors underlying thetriangular trade pattern will remain strong in the coming years.
China is likely to maintain a long-lasting specialisation in labour-intensive products. Itshuge labour supply, and the expected migration of its labour force from agriculture toindustry in the coming years will maintain the country’s comparative advantage in thisfield. China’s gains in market share, which have come primarily at the expense of theadvanced economies of the region, will continue to be an incentive for the latter to moveup the value-added chain. China will displace the NIEs in labour intensive industries that

CEPII, Working Paper No 2005-09
40
they relinquish, just as in an earlier period the NIEs displaced Japan in these industries(Ahearne et alii, 2003). The main threat is to the less advanced Asian economies whichface China's competition in labour intensive products. It is not clear whether they canmove up the quality and technology ladder to keep a competitive edge over China (Lalland Albaladejo, 2004).
The analysis of trade in high-technology products suggests rather complementarity thancompetition between China and the East Asian advanced economies (Lall and Albaladejo,2004). The present study has shown that most China's trade in high-tech products isrelated to processing activities and is handled by foreign affiliates. The technologicalupgrading of China's exports will remain dependent on FDI. The distribution of FDIbetween China and ASEAN* countries will be an important determinant of the evolutionof their respective specialisation in the future.
However, several factors are likely to play in favour of a reduction of trade imbalancesassociated with triangular trade. Recent trends in China’s foreign trade indicate that thecountry is not only an export base but more and more a market for foreign firms. Chinahas considerably cut its tariff rates since the late 1990s and this has led to a acceleratedgrowth of imports for the domestic market (ordinary imports). The further reductions intariff rates which have been scheduled in China’s agreement with WTO, combined withthe economic growth which has accelerated since 2002, resulted in an outstanding growthof imports for domestic use. The opening of its potentially huge market has tended tolimit China’s global trade surplus around 2% of GDP. As European and US firms haverelatively strong position on this “domestic segment” of China’s imports, and as theireconomies show strong complementarity with China’s economy, they should benefit fromthe enlarged access to this market. Most studies on the consequences of China’s accessionto WTO conclude that developed countries will benefit from most of the gains linked withChina’s opening up (Ianchovichina and alii, 2000; Fan and Zheng, 2000; Lejour, 2000;Lemoine and Ünal-Kesenci, 2002b; Wang, 1999). However as barriers to entry into thismarket are lowered, the competition also increases, as more and more countries will beable to bear the costs of entry. Moreover, as advanced Asian economies are increasingtheir imports from China, this will reduce the dependence of China’s exports on Westernmarkets. The positive balance that China has recently recorded in its processing tradewith these economies indicates that production bases in China are more and more orientedtowards supplying their Asian domestic markets.
4.5. China’s Technological Catch-up?
Up to now the rapid technological upgrading of China’s trade has been associated with anincreased dependence on foreign capital and technology. The question is whether thisdependence is due to be a long-lasting tendency or whether China will develop its owntechnological capacity in the coming years.
Up to the end of the nineties, China has heavily relied on FDI for its technologicalmodernisation and there is evidence that FDI have not had all the positive effects thatwere expected by the Chinese authorities (Sigurdson, 2002). On the one hand, the

China’s Integration in East Asia:Production Sharing, FDI & High-Tech Trade
41
acquisition of technology through imports of products incorporating high-technology isusually less favourable to its dissemination than other channels such as patents orlicences. The fact that the bulk of China’s high tech imports is handled by foreignaffiliates and especially by wholly foreign firms, is likely to have increased the obstaclesto the dissemination of high technology. On the other hand, there is evidence that high-tech imports have been used as a substitute for local expenses in R&D. During thenineties, the value of high-tech imports exceeded the local expenses devoted to R&D.Moreover in sectors of new technology, which benefited from large high-tech imports andsubstantial FDI, the increase in R&D expenses has been slower that in other industries.Surveys of industrial firms in China in the nineties tend to confirm that high-tech importshave had a rather limited effect on the domestic innovative capacity (Hu et alii, 2003).Foreign firms remained relatively isolated from the local technology market. Theperformance of the Chinese firms in terms of productivity and innovation have beendetermined by their own efforts and the acquisition of foreign technology has had apositive effect only when associated with in-house R&D expenses.
The shortcomings of this reliance on imported technology have thus become evident andat the end of the nineties the authorities began to implement a new policy which putemphasis on the development of domestic innovative capacities. As a result R&Dexpenditures have increased, and their share in GDP rose from 0.7% in 1997 to 1.3% in2002 and was expected to reach 1.5% in 2005. A key element of this new policy is theeffort made by the authorities to define new Chinese standards, and to impose theminstead of the existing technical standards to companies (multinational or local firms)operating in China. China is thus trying to impose its own standard for the thirdgeneration of mobile phone, for a new generation of DVD player, for internetcommunications. This is aimed at reducing the cost of dependence. China now producesmost of the DVD players sold in the world, but the royalties paid to multinationalcompanies (Philips, Sony or Pioneer) represent one third of the export price. Thisstrategy also aims at promoting national industries in the new context created by Chineseentry into WTO, which limits the instruments available to protect domestic producers.China thus tries to take advantage of the attractiveness of its huge market to overcome itspresent technological weakness. But this strategy implies some risks, as it can end infailures or imply opportunity costs to some domestic enterprises (Suttmeier and Yao,2004; Cao, 2004).
FDI may also help China to catch up. Foreign firms investing in China tend to increasetheir involvement in R&D activities. This is not only the result of a political pressure bythe Chinese government to intensify technology transfer but is also part of multinationalfirms’ strategy in order to consolidate their presence in the Chinese market and strengthentheir position in inter-firm rivalry (Walsh, 2003). All multinational companies in Chinahave built one or several R&D centres in China. Although their programmes may includemainly expenses for the development of products and their adaptation to the domesticmarket, they indicate a clear change in the strategy of the foreign firms investing inChina.

CEPII, Working Paper No 2005-09
42
Finally, despite the fact that the vast majority of Chinese firms have still a low scientificand technical level, a small number of them has emerged as important actors in thesectors of new technology. Their partnership with multinational firms have helped themto build up their capacity to develop new technical standards. They are now both partnersand competitors of world giants in strategic alliances. Although these firms are still morethe exception than the rule, they raises the question of whether China can shift from itspresent position of rapid follower to a position of leader (Gilboy, 2004).
Indicators of technological development show that the gap with industrialised countriesremained huge but that China has made impressive progress in the field of scientific andtechnical innovation (Tables 12 and 13). The share of R&D expenditures in GDP is stilllow compared to that reached in advanced East Asian economies, but China’sperformance has improved significantly in the area of patent applications and grants,especially for innovation patents (as opposed to design patents of utility models): in 1994foreign firms accounted for the majority of innovation patent applications and grants inChina; in 2000, there are almost as many patents of Chinese origin as of foreign origin.However, in the number of patents applications at world level, China still play a verymarginal part, accounting for 0.2-0.3% of the total, and stands well behind Taiwan andSouth Korea.
Table 12 – Science & Technology Indicators
Researchersper 1000persons
employed
R&Dexpendituresin % of GDP
Number ofpatent
applications inChina
Number ofpatent
applications tothe EuropeanPatent office
Number ofpatent
applications tothe US Patent
office2001 2001-2002 1999 2000 1999
US 6,6* 2.7 7 334 28 140 92 349EU-15 5.9 1.9 8 376 49 353 27 220Japan 10.2 3.1 9 813 20 676 35 443Korea 6.3 2.9 1 707 1 218 3 752Singapore 8.2 2.2 45 137 395Taiwan 6.4 2.2 243 5 530Hongkong 114 45 234China 1.0 1.3 15 943 301 282* 1999Source: OECD, An Emerging knowledge-based Economy in China? Indicators from OECD database, STI Working Paper2004/4.

China’s Integration in East Asia:Production Sharing, FDI & High-Tech Trade
43
Table 13 – Patent Applications and Grants by Type and Nationality
Patent applicationsInvention patents Other patents
Chinese Foreign Chinese Foreign1994 11 191 7 876 56 616 2 0521999 15 596 21 098 94 362 3 1832000 25 346 26 401 114 993 3 942
Patent grantsInvention patents Other patents
Chinese Foreign Chinese Foreign1994 1 659 2 224 38 218 1 2961999 3 097 4 540 89 004 3 5152000 6 177 6 506 89 059 3 603
Source: Bhattasali, Deepak, Shantong Li, Will Martin (2004).
4. CONCLUSION
The emergence of China has had far-reaching implications on the East Asian economies.It has accelerated the reorganisation of production in East Asia and the expansion of EastAsian trade both within the region and with the rest of the world. The internationaldivision of labour within the region has expanded and intensified, as firms havedeveloped production and export bases on the mainland. Production of labour intensivegoods has moved to China, which has expanded its share in Western markets at theexpense of the advanced Asian countries. The latter have accelerated their exports ofsophisticated intermediate goods to China. In this triangular trade pattern, the US and theEU trade deficits with China have widened, while their deficits with Japan and the NIEshave narrowed.
China has become a major partner in the development of East Asian production networks,and hence its trade performance has also become highly dependent on the investment ofEast Asian firms. Trade data show that East Asian firms (together with other foreignfirms located in East Asia) have decisively contributed both to the accelerated increase ofChina’s exports and to their rapid technological upgrading over the last ten years.Foreign firms handle the bulk of China’s trade in high-tech products, which raises thequestion of their dynamic impact on the upgrading of the domestic industrial capacities.The prospects of China’s technological catch-up will depend on its ability to disseminateforeign technology into the local industrial sector and to develop its own innovativecapacities.

CEPII, Working Paper No 2005-09
44
The opening up of China’s domestic market, since its WTO accession, combined with itssustained economic growth rate, should lead to a reduction of trade imbalances, as strongdomestic demand will boost imports of capital goods, and to a lesser extent ofsophisticated consumption goods from industrialised countries. It will also raise importsof raw materials and agricultural commodities, including commodities coming fromdeveloping or emerging countries. The related pressure on prices of raw materials (andenergy) is likely to remain an important issue in the future.

China’s Integration in East Asia:Production Sharing, FDI & High-Tech Trade
45
Appendices
APPENDIX 1 – SECTOR CLASSIFICATION
SECTORS HS2 HS2 TITLERaw agricultural products 01 Live animals.
02 Meat and edible meat offal.03 Fish & crustacean, mollusc & other aquatic invertebrate05 Products of animal origin, nes or included.06 Live tree & other plant; bulb, root; cut flowers etc07 Edible vegetables and certain roots and tubers.08 Edible fruit and nuts; peel of citrus fruit or melons.10 Cereals.12 Oil seed, oleagi fruits; miscell grain, seed, fruit etc13 Lac; gums, resins & other vegetable saps & extracts.14 Vegetable plaiting materials; vegetable products nes
Food products 04 Dairy prod; birds' eggs; natural honey; edible prod nes09 Coffee, tea, mat– and spices.11 Prod mill indust; malt; starches; inulin; wheat gluten15 Animal/veg fats & oils & their cleavage products; etc16 Prep of meat, fish or crustaceans, molluscs etc17 Sugars and sugar confectionery.18 Cocoa and cocoa preparations.19 Prep of cereal, flour, starch/milk; pastrycooks' prod20 Prep of vegetable, fruit, nuts or other parts of plants21 Miscellaneous edible preparations.22 Beverages, spirits and vinegar.23 Residues & waste from the food indust; prepr ani fodder24 Tobacco and manufactured tobacco substitutes.
Raw materials & fuels 25 Salt; sulphur; earth & ston; plastering mat; lime & cem26 Ores, slag and ash.27 Mineral fuels, oils & product of their distillation;etc
Chemical products 28 Inorgn chem; compds of prec met, radioact elements etc29 Organic chemicals.30 Pharmaceutical products.31 Fertilisers.32 Tanning/dyeing extract; tannins & derivs; pigm etc33 Essential oils & resinoids; perf, cosmetic/toilet prep34 Soap, organic surface-active agents, washing prep, etc35 Albuminoidal subs; modified starches; glues; enzymes.36 Explosives; pyrotechnic prod; matches; pyrop alloy; etc37 Photographic or cinematographic goods.38 Miscellaneous chemical products.39 Plastics and articles thereof.40 Rubber and articles thereof.
Wood and paper products 44 Wood and articles of wood; wood charcoal.45 Cork and articles of cork.46 Manufactures of straw, esparto/other plaiting mat; etc47 Pulp of wood/of other fibrous cellulosic mat; waste etc48 Paper & paperboard; art of paper pulp, paper/paperboard49 Printed books, newspapers, pictures & other product etc94 Furniture; bedding, mattress, matt support, cushion etc

CEPII, Working Paper No 2005-09
46
SECTORS HS2 HS2 TITLELeather and shoes 41 Raw hides and skins (other than furskins) and leather.
42 Articles of leather; saddlery/harness; travel goods etc43 Furskins and artificial fur; manufactures thereof.64 Footwear, gaiters and the like; parts of such articles.
Fibber and cloths 50 Silk.51 Wool, fine/coarse animal hair, horsehair yarn & fabric52 Cotton.53 Other vegetable textile fibres; paper yarn & woven fab54 Man-made filaments.55 Man-made staple fibres.56 Wadding, felt & non woven; yarns; twine, cordage, etc57 Carpets and other textile floor coverings.58 Special woven fab.; tufted tex fab; lace; tapestries etc59 Impregnated, coated, cover/laminated textile fabric etc60 Knitted or crocheted fabrics.
Wearing Apparel 61 Art of apparel & clothing access, knitted or crocheted.62 Art of apparel & clothing access, not knitted/crocheted63 Other made up textile articles; sets; worn clothing etc
Building materials 68 Art of stone, plaster, cement, asbestos, mica/sim mat69 Ceramic products.70 Glass and glassware.
Metallurgy 72 Iron and steel.73 Articles of iron or steel.74 Copper and articles thereof.75 Nickel and articles thereof.76 Aluminium and articles thereof.78 Lead and articles thereof.79 Zinc and articles thereof.80 Tin and articles thereof.81 Other base metals; cermets; articles thereof.
Metal products 82 Tool, implement, cutlery, spoon & fork, of base met etc83 Miscellaneous articles of base metal.
Machinery 84 Nuclear reactors, boilers, mchy & mech appliance; parts93 Arms and ammunition; parts and accessories thereof.
Electrical machinery 85 Electrical mchy equip parts thereof; sound recorder etcMotor Vehicles 87 Vehicles other than railw/tramw roll-stock, pts & accessoriesOther transport equipment 86 Railw/tramw locom, rolling-stock & parts thereof; etc
88 Aircraft, spacecraft, and parts thereof.89 Ships, boats and floating structures.
Precision instruments 90 Optical, photo, cine, meas, checking, precision, etc91 Clocks and watches and parts thereof.92 Musical instruments; parts and access of such articles
Toys & miscellaneous manuf. prod. 65 Headgear and parts thereof.66 Umbrellas, walking-sticks, seat-sticks, whips, etc67 Prepr feathers & down; arti flower; articles human hair71 Natural/cultured pearls, prec stones & metals, coin etc95 Toys, games & sports requisites; parts & access thereof96 Miscellaneous manufactured articles.97 Works of art, collectors' pieces and antiques.98 Special Classification Provisions

China’s Integration in East Asia:Production Sharing, FDI & High-Tech Trade
47
APPENDIX 2 – PRODUCTION STAGES ACCORDING TO THE BECCLASSIFICATION
In this study, the data from China’s Customs statistics available at 6 digits of HarmonisedSystem were aggregated according to the BEC classification (Broad Economic Categoriesof the United Nations of production stages). The BEC reclassifies the StandardInternational Trade Classification (SITC, Rev. 3) headings on the basis of the principaluse of the products. It converts foreign trade data into categories of final or intermediateuse, such us capital goods, intermediate goods or consumer goods, following the usage inthe System of National Accounts (SNA). We grouped BEC items into five stages ofproduction as following:
3 stages 5 stages CodeBEC
TitleBEC
Primary goods 111 Food and beverages mainly for industry21 Industrial supplies, n.e.s., primary31 Fuels and lubricants, primary
Intermediate goods Semi-finished goods 121 Food and beverages, processed, mainly for industry22 Industrial supplies, n.e.s., processed322 Fuels and lubricants, processed
Parts&components 42 Of capital goods, except transport equipment53 Parts and accessories of transport equipment
Final goods Capital goods 41 Capital goods except transport equipment521 Other industrial transport equipment
Consumption goods 112 Food & bev., primary, mainly for household consumption122 Food & bev., primary, processed, for house. consumption51 Passenger motor cars522 Other non-industrial transport equipment61 Durable consumer goods n.e.s.62 Semi-durable consumer goods n.e.s.63 Non-durable consumer goods n.e.s.

CEPII, Working Paper No 2005-09
48
APPENDIX 3 – THE DEFINITION OF HIGH-TECH PRODUCTS
The definition of high-technology products is based on indicators of technologicalintensity in OECD countries, such as R&D expenditures divided by value added, R&Dexpenditures divided by production.
On the basis of this definition two types of classification can be made of high-technologyproducts:
− at a broad category level: the indicators of high-tech content are calculated at thebranch level and all the products within an high-tech branch are considered asselected “high-tech” products;
− at a detailed product level within a broad category.
The first methodology is the most widely used. For instance, the latest OECDclassification (2004) based on technology indicators groups manufacturing branches(ISIC rev.3, at 2 or 3 digit level) into 4 technological levels: high-technology, medium-high-technology; medium-low-technology; and low technology. In this classificationhigh-technology industries includes all products belonging to the following branches:
− aircraft and spacecraft (ISIC 353);− pharmaceuticals (ISIC 2423);− office, accounting, and computing machinery (ISIC 30);− radio, TV and communication equipment (ISIC 32);− medical, precision and optical instrument (ISIC 33).
In the same way, according to World Development Indicators of United Nations (WDIdatabase), high-technology exports include all the exports of the following branches:aerospace, computers, pharmaceuticals, scientific instruments, and electrical machinery.Figure 5 in present study refers to this definition.
It has to be noted that this methodology introduces a serious selection bias, since not allproduct in a “high-technology industry” necessarily have a high technology content.Likewise, some products in industries with low technology intensity may well incorporatea high degree of technological sophistication.
The second methodology first defines large high-tech sectors (as described above) andthen selects,within this high-tech branches and a detailed level of the products having ahigh content in R&D. The definition of high-tech products used in CEPII studies refers tothis second way (Fontagné et alii, 1999). The nine high-tech industries that were selectedin the first step were the following:
− aerospace;− computers, office machinery;− electronics-communications;

China’s Integration in East Asia:Production Sharing, FDI & High-Tech Trade
49
− pharmaceuticals;− scientific instruments;− electrical machinery;− chemicals;− other transport equipment;− non-electrical machinery;− weapons.
In the second step, within these broad categories, a list of 252 products (at the 6 digitslevel of the Harmonised System) were identified as high-tech. It has to be noted that thismethodology introduces another selection bias, since it examines whether products are ofa high-technology nature or not, only in branches that are considered high-technology: thehigh-technology products belonging to non technological branches are thus implicitlyconsidered as non-technological.
252 high-tech products (HS, 6 digits) of the present study (except Figure 5) are presentedbelow:
280450 293710 300410 840140 846231 852691 854330 900921 902140 903040280461 293721 300420 841111 846241 852692 854390 900922 902150 903089280469 293722 300431 841112 846693 852790 854470 901110 902230 903090280470 293729 300432 841121 846694 853110 871000 901120 902300 903210280480 293791 300439 841122 847110 853120 880211 901180 902410 903220280490 293792 320411 841181 847330 853180 880212 901190 902480 903281280521 293799 320412 841182 851521 853221 880220 901210 902490 903289280522 293810 320413 841191 851531 853222 880230 901290 902511 903290280530 293890 320414 841199 851730 853223 880240 901320 902519 903300282520 294110 320415 841210 851790 853224 880310 901380 902580 930100282530 294120 320416 845610 851810 853400 880320 901410 902590 930200282540 294130 320417 845620 851821 853710 900110 901420 902610 930310282550 294140 320419 845630 851822 854081 900120 901480 902620 930320282560 294150 320420 845710 851829 854089 900130 901490 902680 930330282570 294190 320490 845811 851830 854110 900190 901510 902690 930390282580 300110 320500 845891 851840 854121 900510 901520 902710 930400284410 300120 380810 845921 851850 854129 900580 901530 902720 930510284420 300190 380820 845931 851890 854130 900610 901540 902730 930521284430 300210 380830 845951 851999 854140 900620 901580 902740 930529284440 300220 380840 845961 852110 854150 900630 901590 902750 930590284450 300290 380890 846011 852190 854160 900640 901600 902780 930610284510 300310 390760 846021 852510 854190 900711 901841 902790 930621284590 300320 840110 846031 852520 854219 900719 902111 903010 930629284610 300331 840120 846040 852530 854290 900911 902119 903020 930630284690 300339 840130 846221 852610 854320 900912 902130 903031 930690
903039 930700

CEPII, Working Paper No 2005-09
50
APPENDIX 4 – INDICATOR OF CONTRIBUTION TO TRADE BALANCE
To measure China’s revealed comparative advantages, we used the indicator of“contribution to the trade balance” (Lafay, 1994). The idea is to measure comparativeadvantages (largo sensu) under an assumption of balanced trade.
( ) ( ) ( ) ⎥⎥⎥
⎦
⎤
⎢⎢⎢
⎣
⎡
⎟⎟⎟
⎠
⎞
⎜⎜⎜
⎝
⎛
+
+=
∑∑∑∑j
kij
kij
k
kij
kij
j
kij
kij
kij
kij
kijCTB
MXMX
M-X-M-X *1000k
with i for the declaring country (China), j for its partner and k for the products.
If there were no comparative advantage or disadvantage for any product k, then thecountry’s total trade balance (surplus or deficit) should be distributed across all industriesaccording to their share in total trade. The “contribution to the trade balance” is thedifference between the observed and this theoretical balance. Here, these “contributions”are weighted by total trade of the China.
A positive contribution is interpreted as a “revealed comparative advantage” for thatindustry. By definition, the sum over all industries and partners is zero. The indicator isadditive: thus the values for products or industries can be aggregated to any desired level.
Contribution to the trade balance is a structural indicator which tries to eliminate businesscycle variations -by comparing an industry's performance to the overall one- and, unlikemany other indicators, a symmetrical indicator in the sense that it focuses not only onexports, but also on imports.
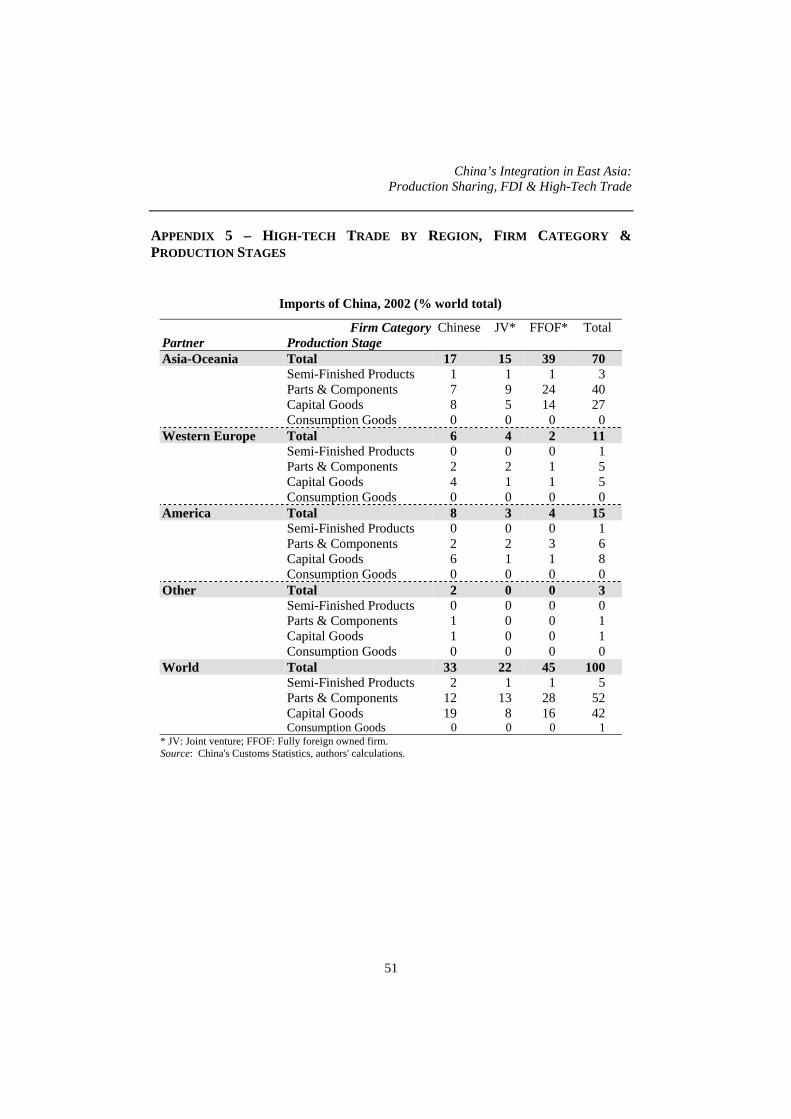
China’s Integration in East Asia:Production Sharing, FDI & High-Tech Trade
51
APPENDIX 5 – HIGH-TECH TRADE BY REGION, FIRM CATEGORY &PRODUCTION STAGES
Imports of China, 2002 (% world total)
Firm Category Chinese JV* FFOF* TotalPartner Production StageAsia-Oceania Total 17 15 39 70
Semi-Finished Products 1 1 1 3Parts & Components 7 9 24 40Capital Goods 8 5 14 27Consumption Goods 0 0 0 0
Western Europe Total 6 4 2 11Semi-Finished Products 0 0 0 1Parts & Components 2 2 1 5Capital Goods 4 1 1 5Consumption Goods 0 0 0 0
America Total 8 3 4 15Semi-Finished Products 0 0 0 1Parts & Components 2 2 3 6Capital Goods 6 1 1 8Consumption Goods 0 0 0 0
Other Total 2 0 0 3Semi-Finished Products 0 0 0 0Parts & Components 1 0 0 1Capital Goods 1 0 0 1Consumption Goods 0 0 0 0
World Total 33 22 45 100Semi-Finished Products 2 1 1 5Parts & Components 12 13 28 52Capital Goods 19 8 16 42Consumption Goods 0 0 0 1
* JV: Joint venture; FFOF: Fully foreign owned firm.Source: China's Customs Statistics, authors' calculations.

CEPII, Working Paper No 2005-09
52
Exports of China, 2002 (% world total)
Firm Type Chinese JV FFOF TotalPartner StageAsia-Oceania Total 11 16 28 56
Semi-Finished Products 3 1 0 5Parts & Components 4 7 22 33Capital Goods 4 8 5 17Consumption Goods 0 0 0 1
Western Europe Total 4 5 6 15Semi-Finished Products 1 1 0 2Parts & Components 1 1 3 5Capital Goods 2 4 2 8Consumption Goods 0 0 0 1
America Total 8 5 12 25Semi-Finished Products 2 0 0 2Parts & Components 1 1 6 8Capital Goods 4 4 5 14Consumption Goods 0 0 0 1
Other Total 2 2 1 5Semi-Finished Products 1 0 0 1Parts & Components 0 0 1 1Capital Goods 1 1 0 2Consumption Goods 0 0 0 0
World Total 24 29 47 100Semi-Finished Products 7 2 1 9Parts & Components 6 9 32 47Capital Goods 11 17 13 41Consumption Goods 1 1 1 3
* JV: Joint venture; FFOF: Fully foreign owned firm.Source: China's Customs Statistics, authors' calculations.

China’s Integration in East Asia:Production Sharing, FDI & High-Tech Trade
53
REFERENCES
AHEARNE, A, J. FERNALD, P LOUNGANI & J SCHINDLER (2003), “Comrades orCompetitors?”, Federal Reserve Bank of Chicago, Working Paper, WP-03-27.March.
AKAMATSU K. (1961), “A Theory of Unbalanced Growth in the World Economy”,Weltwirtschafliches Archiv, Vol.86: 196-215.
ANDO A. & F. KIMURA (2003), “The Formation of International Production andDistribution Networks in East Asia”, NBER Working Paper, n° 10167, December.
BERNARD M. & J. RAVENHIL (1995), “Beyond Product Cycles and Flying Geese.Regionalization, Hierarchy, and the Industrialization of East Asia”, World Politics,47(2): 171-179.
BORRUS M. (1996), “Left for Dead: Asian Production Networks and the Revival of USElectronics”. Berkeley Roundtable on the International Economy, University ofCalifornia, Berkeley. http://www.ap.harvard.edu/mainsite/papers/recoop/borrus/borrus.html
BORRUS M., D. ERNST & S. HAGGARD (2000). International production networks inAsia: rivalry or riches?, London and New York, Routledge.
CAO C. (2004), “L’industrie chinoise face au défi technologique”, Perspectives Chinoises,n°83, mai-juin.
DÉES S. & F. LEMOINE (1999), “The Devaluation of the Yuan: ‘A Little Impatience MayRuin a Great Project’ ” (Confucious), La Lettre du CEPII, n°178, avril.
EC (1997), European Commission and CESD, The Customs General Administration ofthe PRC and the International Trade Center UNCTAD/WTO: Comparison ofBilateral Trade Statistics of China and the European Union: Discrepancies andUnderlying Factors, Geneva, 4 November.
ESCAP UN (1991), Industrial restructuring in Asia and the Pacific, March, Bangkok,United Nations.
FAN M. & Y. ZHENG (2000), “The Impact of China’s Trade Liberalisation for WTOAccession: A Computable General Equilibrium Analysis”, paper presented at theAnnual Conference of Global Economic Analysis, Melbourne, Australia,June 20-30.

CEPII, Working Paper No 2005-09
54
FONTAGNÉ L., M. FREUDENBERG & D. ÜNAL-KESENCI (1999), “Trade in Technology andQuality Ladders: Where do EU Countries Stand?”, International Journal ofDevelopment Planning Literature, 14(4): 561-582.
FONTAGNÉ L. & T. MAYER (2005), “Determinants of Location Choices by MultinationalFirms: a Review of the Current State of Knowledge”, Economie internationale,forthcoming.
FUKAO K., H. ISHIDO & K. ITO (2003), “Vertical Intra-Industry Trade and Foreign DirectInvestment in East Asia”, Journal of the Japanese and International Economies,17(4): 468-506.
FUNG K.C., H. IIZAKA, H.-K. KIM & K.F. SIU (2003), “Korean, Japanese and TaiwaneseDirect Investment in China”, Proceedings on Rising China and the East AsianEconomy, Korean Institute of International Economic Policy, Korea, March 20th.
GILBOY G.J. (2004),”The Myth Behind China’s Miracle”, Foreign Affairs, July-August:33-44.
GRUBEL H.G. & H. JOHNSON (1971), “The Welfare Implications of Effective Protection”,In Effective Tariff Protection, eds. H.G. Grubel and H.G. Johnson, Geneva:Graduate Institute of International Studies and General Agreement on Tariffs andTrade.
GUERRIERI P. (2000), “International Competitiveness, Regional Integration, andCorporate Strategies in the East Asian Electronic Industry”, In InternationalProduction Networks in Asia: Rivalry or Riches? eds. M. Borrus, D. Ernst &S Haggard, London and New York: Routledge.
HU A.G.Z., G.H. JEFFERSON, G. XIAOJING and Q. JINCHANG (2003), “R&D andTechnology Transfer: Firm-Level Evidence from Chinese Industry” The WilliamDavidson Institute, Working Paper number 582, June.
HUCHET J.-F. (1997), “The China Circle and Technological Development in the ChineseElectronic Industry”, In The China Circle: Economic and Technology in the PRC,Taiwan and Hong Kong, ed. B. Naughton, Washington, D.C.: Brookings InstitutionPress.
HUMMELS D., RAPOPORT D. & YI K.-M. (1998), “Vertical specialization and the changingnature of world trade”, Economic Policy Review, Federal Reserve Bank of NewYork, issue Jun), pages 79-99.
IANCHOVICHINA E., MARTIN W. & FUKASE E. (2000), “Comparative Study of TradeLiberalization Regimes: the Case of China’s Accession to the WTO”, paperprepared for the Annual Conference of Global Economic Analysis, Melbourne,Australia, June 20-30.

China’s Integration in East Asia:Production Sharing, FDI & High-Tech Trade
55
KAPLINSKY R., D MORRIS & J. READMAN (2002), “Globalization of Product Markets andImmisering Growth: Lessons from the South-African Furniture Industry”, WorldDevelopment, 30(7): 1159-1177.
LAFAY G. (1994), “The Measurement of Revealed Comparative Advantages”, InInternational Trade Modelling, Eds. M.G. Dagenais & P.A. Muet, London:Chapman & Hall.
LALL S. & M. ALBALADEJO (2004), “China’s Competitive Performance: a Threat to EastAsian Manufactured Exports?”, World Development, 32(9): 1441-1466.
LARDY N. (2002), Integration China into the Global Economy, Washington, D.C.:Brookings Institution Press.
LEE K. & M. KIM (2004), “The Rise of china and the Korean Firms Looking for a NewDivision of Labour”, Proceedings on Rising China and the East Asian Economy,Korean Institute of International Economic Policy, Korea, March 20th.
LEJOUR A. (2000), “China and the WTO: the Impact on China and the World Economy”,paper prepared for the Annual Conference of Global Economic Analysis,Melbourne, Australia, June 20-30.
LEMOINE F. (2000), “FDI and the Opening Up of China’s Economy”, CEPII WorkingPaper 2000-11, June, www.cepii.fr.
LEMOINE F. & D. ÜNAL-KESENCI (2002a), “China in the International segmentation ofProduction Processes”, CEPII Working Paper, n°2002-02, March, www.cepii.fr.
LEMOINE F. & D. ÜNAL-KESENCI (2002b), “The Impact of China’s WTO Accession onEU Trade”, In China's Accession to the World Trade Organization. National andInternational Perspectives, Eds. H. Holbig & R. Ash, English-language Series ofthe Institute of Asian Affairs (IFA) Hamburg, RoutledgeCurzon.
LEMOINE F. & D. ÜNAL-KESENCI, “Trade and Technology Transfers: a ComparativeStudy of Turkey, India and China”, CEPII Working Paper, n° 2003-16, Novemberwww.cepii.fr.
LEMOINE F. & ÜNAL-KESENCI D. (2004), “Assembly Trade and Technology Transfer:The Case of China”, World Development, Vol. 32, n° 5, May.
MASUYAMA S. (2004), “The Asian Strategy of Japanese Multinationals: Focus on China”,Tokyo Club Research Meetings, February 9.
NAUGHTON B. (1996), “China’s Emergence and Prospects as a Trading Nation”,Brookings Paper on Economic Activity, Vol.2: 273-344.

CEPII, Working Paper No 2005-09
56
NAUGHTON B. (1997), The China Circle: Economic and Technology in the PRC, Taiwanand Hong Kong, Brookings Institution Press, Washington D.C.
NG F. & YEATS A. (1999), “Production Sharing in East Asia: Who Does What, for Whomand Why?”, World Bank Policy Research Paper Working Paper Series, 2197.
NG, F. & YEATS A. (2003), “Major Trade Trends in East Asia. What are theirImplications for Regional Cooperation and Growth”, World Bank Policy ResearchPaper Working Paper Series, 3084, June.
OECD (1999), Foreign Direct Investment and Recovery in South-East Asia, Paris: OECDProceedings.
OECD (2004), “An emerging knowledge-based economy in China? Indicators fromOECD databases, OECD Science, Technology and Industry Department WorkingPapers, no.(2004)4.
SIGURDSON J., (2002), “Le nouveau paysage des technologies en Chine”, Perspectiveschinoises, n°71 – mai-juin, 37-54.
SUNG Y.W. (2000), “Costs and Benefits of Exports-Oriented Foreign Investment: theCase of China”, Asian Economic Journal, 14(1), 55-70.
SUTTMEIER R.P. & X. YAO (2004), “China’s Post-WTO Technology Policy: Standards,Software, and the Changing Nature of Techno-Nationalism”, NBER Special Report,n°7, May.
TSO A. (1998), “Foreign Direct Investment and China’s Economic Development”, Issuesand Studies, 34(2): 1-34.
UNCTAD (1996), Trade and Development Report, New York and Geneva, UnitedNations.
UNCTAD (1999), World Investment Report, New York and Geneva, United Nations.
UNCTAD 2001, Trade and Development Report, New York and Geneva, United Nations.
UNCTAD (2002), Trade and Development Report, New York and Geneva, UnitedNations.
WALSH K. (2003), “Foreign High-Tech R&D in China. Risks, Rewards and Implicationsfor US-China Relations”, Report of the Stimson Center.
WANG Z. (1999), “The Impact of China’s WTO Entry on the World Labour-IntensiveExport Market: A Recursive Dynamic CGE Analysis”, The World Economy, 22(3):379-406.

China’s Integration in East Asia:Production Sharing, FDI & High-Tech Trade
57
WU Y. (1999), “The performance of FDI”, In Foreign Direct Investment and EconomicGrowth in China, ed. Y. Wu, Cheltenham, UK-Northampton, MA, USA: EdwardElgar.
WEI Y. & X. LIU (2001), Foreign Direct Investment in China: Determinants and Impact.Cheltenham, UK-Northampton, MA, USA: Edward Elgar.
ZHANG X. (1999), “Foreign Investment Policy”, Contribution and Performance InForeign Direct Investment and Economic Growth in China, ed. Y. Wu, Cheltenham,UK-Northampton, MA, USA: Edward Elgar.
ZHANG Z. (1995), “International Trade and Foreign Direct Investment: Further Evidencefrom China”, Asian Economic Journal, 9(21): 153-167.
ZYSMAN J., E. DOHERTY & A. SCHWARTZ (1996), “Tales from the Global Economy:Cross-National Production Networks and the Reorganisation of the EuropeanEconomy”, Berkeley Rountable on the International Economy Working Paper, WP-83, June.

CEPII, Working Paper No 2005-09
58
LIST OF WORKING PAPERS RELEASED BY CEPII14
No Title Authors
2005-08 Tax Competition and Public Input A. Bénassy-Quéré,N. Gobalraja &
A. Trannoy
2005-07 Trade Liberalisation, Growth and Poverty in Senegal:A Dynamic Microsimulation CGE Model Analysis
N. Annabi, F. Cissé,J. Cockburn &
B. Decaluwé
2005-06 Migration, Trade and Wages A. Hijzen & P. Wright
2005-05 Institutional Determinants of Foreign Investment A. Bénassy-Quéré,M. Coupet & T. Mayer
2005-04 L’économie indienne : changements structurels etperspectives à long terme
S. Chauvin &F. Lemoine
2005-03 Programme de travail du CEPII pour 2005
2005-02 Market Access in Global and Regional Trade T. Mayer& S. Zignago
2005-01 Real Equilibrium Exchange Rate in China V. Coudert &C. Couharde
2004-22 A Consistent, ad-valorem Equivalent Measure ofApplied Protection Across the World: The MAcMap-HS6 Database
A. Bouët, Y. Decreux,L. Fontagné, S. Jean
& D. Laborde
2004-21 IMF in Theory: Sovereign Debts, Judicialisation andMultilateralism
J. Sgard
2004-20 The Impact of Multilateral Liberalisation on EuropeanRegions: a CGE Assessment
S. Jean & D. Laborde
2004-19 La compétitivité de l'agriculture et des industriesagroalimentaires dans le Mercosur et l'Unioneuropéenne dans une perspective de libéralisationcommerciale
N. Mulder, A. Vialou,B. David,
M. Rodriguez &M. Castilho
2004-18 Multilateral Agricultural Trade Liberalization: TheContrasting Fortunes of Developinc Countries in theDoha Round
A. Bouët, J.C. Bureau,Y. Decreux & S. Jean
2004-17 UK in or UK out? A Common Cycle Analysis J. Garnier
14
Working papers are circulated free of charge as far as stocks are available; thank you to send yourrequest to CEPII, Sylvie Hurion, 9, rue Georges-Pitard, 75015 Paris, or by fax : (33) 01 53 68 55 04 or bye-mail [email protected]. Also available on: \\www.cepii.fr. Working papers with * are out of print.They can nevertheless be consulted and downloaded from this website.

China’s Integration in East Asia:Production Sharing, FDI & High-Tech Trade
59
between the UK and the Euro Zone
2004-16 Regionalism and the Regionalisation of InternationalTrade
G. Gaulier, S. Jean &D. Ünal-Kesenci
2004-15 The Stock-Flow Approach to the Real Exchange Rateof CEE Transition Economies
B. Egert,A. Lahrècche-Révil &
K. Lommatzsch
2004-14 Vieillissement démographique, épargne et retraite :une analyse à l’aide d’un modèle d’équilibre général àagents hétérogènes
C. Bac & J. Chateau
2004-13 Burden Sharing and Exchange-Rate Misalignmentswithin the Group of Twenty
A. Bénassy-Quéré,P. Duran-Vigneron,
A. Lahrèche-Révil &V. Mignon
2004-12 Regulation and Wage Premia S. Jean & G. Nicoletti
2004-11 The Efficiency of Fiscal Policies: a Survey of theLiterature
S. Capet
2004-10 La réforme du marché du travail en Allemagne : lesenseignements d’une maquette
S. Capet
2004-09 Typologie et équivalence des systèmes de retraites P. Villa
2004-08 South – South Trade: Geography Matters S. Coulibaly &L. Fontagné
2004-07 Current Accounts Dynamics in New EU Members:Sustainability and Policy Issues
P. Zanghieri
2004-06 Incertitude radicale et choix du modèle P. Villa
2004-05 Does Exchange Rate Regime Explain Differences inEconomic Results for Asian Countries?
V. Coudert & M. Dubert
2004-04 Trade in the Triad: How Easy is the Access to LargeMarkets?
L. Fontagné, T. Mayer& S. Zignago
2004-03 Programme de travail du CEPII pour 2004
2004-02 Technology Differences, Institutions and EconomicGrowth: a Conditional Conditional Convergence
H. Boulhol
2004-01 Croissance et régimes d’investissement P. Villa
2003-22 A New Look at the Feldstein-Horioka Puzzle using aIntegrated Panel
A. BanerjeeP. Zanghieri

CEPII, Working Paper No 2005-09
60
2003-21 Trade Linkages and Exchange Rates in Asia :The Roleof China
A. Bénassy-Quéré &A. Lahrèche-Révil
2003-20 Economic Implications of Trade LiberalizationUnder the Doha Round
J. Francois,H. van Meijl &
F. van Tongeren
2003-19 Methodological Tools for SIA - Report of the CEPIIWorshop held on 7-8 November 2002 in Brussels
2003-18 Order Flows, Delta Hedging and Exchange RateDynamics
B. Rzepkowski
2003-17 Tax Competition and Foreign Direct Investment A. Bénassy-Quéré,L. Fontagné &
A. Lahrèche-Révil
2003-16 Commerce et transfert de technologies : les cascomparés de la Turquie, de l’Inde et de la Chine
F. Lemoine &D. Ünal-Kesenci
2003-15 The Empirics of Agglomeration and Trade K. Head & T. Mayer
2003-14 Notional Defined Contribution: A Comparison of theFrench and German Point Systems
F. Legros
2003-13 How Different is Eastern Europe? Structure andDeterminants of Location Choices by French Firms inEastern and Western Europe
A.C. Disdier &T. Mayer
2003-12 Market Access Liberalisation in the Doha Round:Scenarios and Assessment
L. Fontagné,J.L. Guérin & S. Jean
2003-11 On the Adequacy of Monetary Arrangements in Sub-Saharian Africa
A. Bénassy-Quéré &M. Coupet
2003-10 The Impact of EU Enlargement on Member States:a CGE Approach
H. Bchir, L. Fontagné& P. Zanghieri
2003-09 India in the World Economy: TraditionalSpecialisations and Technology Niches
S. Chauvin &F. Lemoine
2003-08 Imitation Amongst Exchange-Rate Forecasters:Evidence from Survey Data
M. Beine,A. Bénassy-Quéré &
H. Colas
2003-07 Le Currency Board à travers l’expérience del’Argentine
S. Chauvin & P. Villa
2003-06 Trade and Convergence: Revisiting Ben-Davil G. Gaulier
2003-05 Estimating the Fundamental Equilibrium ExchangeRate of Central and Eastern European Countries theEMU Enlargement Perspective
B. Egert &A. Lahrèche-Révil

China’s Integration in East Asia:Production Sharing, FDI & High-Tech Trade
61
2003-04 Skills, Technology and Growth is ICT the Key toSuccess?
J. Melka, L. Nayman,S. Zignago &
N. Mulder
2003-03 L’investissement en TIC aux Etats-Unis et dansquelques pays européens
G. Cette & P.A. Noual
2003-02 Can Business and Social Networks Explain the BorderEffect Puzzle?
P.P. Combes,M. Lafourcade &
T. Mayer

CEPIIDOCUMENTS DE TRAVAIL / WORKING PAPERS
Si vous souhaitez recevoir des Documents de travail,merci de remplir le coupon-réponse ci-joint et de le retourner à :
Should you wish to receive copies of the CEPII’s Working papers,just fill the reply card and return it to:
Sylvie HURION – PublicationsCEPII – 9, rue Georges-Pitard – 75740 Paris – Fax : (33) 1.53.68.55.04
M./Mme / Mr./Mrs ..................................................................................................................
Nom-Prénom / Name-First name .............................................................................................
Titre / Title ...............................................................................................................................
Service / Department................................................................................................................
Organisme / Organisation ........................................................................................................
Adresse / Address.....................................................................................................................
Ville & CP / City & post code..................................................................................................Pays / Country.............................................................. Tél......................................................
Désire recevoir les Document de travail du CEPII n° :
Wish to receive the CEPII’s Working Papers No:..................................................................
..................................................................................................................................................
..................................................................................................................................................
..................................................................................................................................................
..................................................................................................................................................
..................................................................................................................................................
..................................................................................................................................................
..................................................................................................................................................
..................................................................................................................................................
Souhaite être placé sur la liste de diffusion permanente (pour les bibliothèques)Wish to be placed on the standing mailing list (for Libraries).