China's emergence and the reorganisation of trade flows in ...
35
China's emergence and the reorganisation of trade flows in Asia ☆ Guillaume GAULIER, Françoise LEMOINE ⁎ , Deniz ÜNAL-KESENCI Centre d'Etudes Prospectives et d'Informations Internationales (CEPII) 9, rue Georges-Pitard, 75015 Paris, France Abstract The emergence of China has intensified the international segmentation of production processes within Asia, but has not created an autonomous engine for the region's trade, as Asia still depends on outside markets for its final goods exports. The reorganisation of production has weakened the position of the advanced economies in Asia's trade, but up to now has not severely affected the position of the emerging Asian economies. However, the deterioration of China's terms of trade raises the question of the sus- tainability of its recent growth strategy. © 2007 Elsevier Inc. All rights reserved. JEL classification: F14; F15; F2; 053 Keywords: China; Asia; Trade; Regional integration; Specialisation 1. Introduction For the last two decades, China's rise in international trade has been outstanding. China's share in international trade more than trebled, jumping from less than 2% in 1985 to about 7% in 2005. China has become the third largest exporter in the world in 2004 and is expected to become the first largest by the beginning of the next decade (OECD, 2005). China has achieved such performance thanks to a strong involvement in the international division of labour. Production sharing between China and its neighbours has led to a reorganisation of industrial production in Asia and has propelled China at the top of world exporters. The present study aims at investigating how the surge China Economic Review 18 (2007) 209 – 243 ☆ We thank the anonymous referee and participants in the Conference on “Law, Finance and Economic Development in China”, University of Fudan, Shanghai, 10–11 September 2005 and in the 5th International Conference on the Chinese Economy “China in the World Economy: Internal Challenges and international Challenges”, CERDI-IDREC, Faculté de Sciences Economiques et de Gestion, Université d'Auvergne, 20–21 October 2005, for helpful comments. ⁎ Corresponding author. Tel.: +33 1 53 68 55 32; fax: +33 1 53 68 55 03. E-mail address: [email protected] (F. Lemoine). 1043-951X/$ - see front matter © 2007 Elsevier Inc. All rights reserved. doi:10.1016/j.chieco.2007.02.008
Transcript of China's emergence and the reorganisation of trade flows in ...

China Economic Review 18 (2007) 209–243
China's emergence and the reorganisationof trade flows in Asia☆
Guillaume GAULIER, Françoise LEMOINE ⁎, Deniz ÜNAL-KESENCI
Centre d'Etudes Prospectives et d'Informations Internationales (CEPII) 9, rue Georges-Pitard, 75015 Paris, France
Abstract
The emergence of China has intensified the international segmentation of production processes withinAsia, but has not created an autonomous engine for the region's trade, as Asia still depends on outsidemarkets for its final goods exports. The reorganisation of production has weakened the position of theadvanced economies in Asia's trade, but up to now has not severely affected the position of the emergingAsian economies. However, the deterioration of China's terms of trade raises the question of the sus-tainability of its recent growth strategy.© 2007 Elsevier Inc. All rights reserved.
JEL classification: F14; F15; F2; 053Keywords: China; Asia; Trade; Regional integration; Specialisation
1. Introduction
For the last two decades, China's rise in international trade has been outstanding. China's sharein international trade more than trebled, jumping from less than 2% in 1985 to about 7% in 2005.China has become the third largest exporter in the world in 2004 and is expected to become the firstlargest by the beginning of the next decade (OECD, 2005). China has achieved such performancethanks to a strong involvement in the international division of labour. Production sharing betweenChina and its neighbours has led to a reorganisation of industrial production in Asia and haspropelled China at the top of world exporters. The present study aims at investigating how the surge
☆ We thank the anonymous referee and participants in the Conference on “Law, Finance and Economic Development inChina”, University of Fudan, Shanghai, 10–11 September 2005 and in the 5th International Conference on the ChineseEconomy “China in the World Economy: Internal Challenges and international Challenges”, CERDI-IDREC, Faculté deSciences Economiques et de Gestion, Université d'Auvergne, 20–21 October 2005, for helpful comments.⁎ Corresponding author. Tel.: +33 1 53 68 55 32; fax: +33 1 53 68 55 03.E-mail address: [email protected] (F. Lemoine).
1043-951X/$ - see front matter © 2007 Elsevier Inc. All rights reserved.doi:10.1016/j.chieco.2007.02.008

210 G. Gaulier et al. / China Economic Review 18 (2007) 209–243
of China has led to changes in other Asian country specialisation and in regional integration duringthe period 1993–2003.
This paper tries to provide answers to the following questions:
What has been the effect of China's rise on regional integration in Asia? Has China become anengine of international trade in the region?What changes have occured in the position of advanced Asian economies i.e. Japan and theDragons (Hongkong, Singapore, South Korea and Taiwan) in the division of labour in Asiasince China has become a global manufacturing base?Has China's trade expansion been achieved at the expense of other emerging economies inSouth-East Asia (the Tigers, i.e. Malaysia, Philippines, Thailand)?
The paper is organised in four sections. The first section sets the aims and the method. Thesecond section presents an overview of Asian trade.1 The third section focuses on changes thattook place in the trade pattern of Asian advanced economies (Japan and the Dragons) as a result ofthe international reorganisation of production. The fourth section focuses on the trade position ofAsian emerging economies (the Tigers) and addresses the question of China's price competition.
2. Aims and methodology
2.1. The starting point: China as a global production base
China's emergence in world trade is inseparable of changes in the way industrial production isorganised internationally. In the 1990s, firms have expanded their cross border production andtrade networks, especially in East Asia, and have integrated China in their global networking(Ernst, 2004; Steinfeld, 2004; Yusuf, Altaf, & Nabeshima, 2004). International production hasbecome a major determinant of trade pattern and China has become a global manufacturing basefor multinational firms, as evidenced by the analysis of China's trade statistics.
The detailed data coming from China's Customs Statistics made it possible to analyse China'sforeign trade flows depending on the ownership of exporting and importing firms (Chinese firms,firms with foreign capital, wholly-foreign firms), and depending on the customs regime (as-sembly trade or “ordinary trade”). Using these data, the CEPII research work has shown that thelargest and most dynamic part of China's foreign trade results from the outsourcing strategies offoreign firms which have heavily invested in the mainland. This work has provided a quite preciseimage of China as a global production base (Gaulier, Lemoine, & Ünal-Kesenci, 2005; Gaulier,Lemoine, & Ünal, 2006; Lemoine & Ünal-Kesenci, 2004). The following findings stand out:
Assembly and processing of imported inputs for re-export account for about half of China'sforeign trade. These activities have been the most dynamic part of China's exports since the early1990s and have allowed for their rapid diversification from textile to electronics. Assembly andprocessing is responsible for China's entire trade surplus with the US and Europe.
Foreign firm affiliates account for more than half of China's total trade and they carry out theoverwhelming share of processing trade (80%). This reflects the outsourcing strategy of firmswhich have transferred to the mainland the labour intensive stages of production processes(Table 1).
1 In the text, the term Asia encompasses Oceania (see tables and Appendix A for the definition of geographic areas).

Table 1Firms with Foreign Capital (FFC) in China's Trade with Selected Partners 2002 (% Total Flows)
World EU-15 USA Japan Hongkong Singapore Korea Taiwan
China's total exports 100 100 100 100 100 100 100 100FFC total exports 52 50 58 62 63 65 49 57FFC processed exports 41 40 48 47 54 54 35 45
China's total imports 100 100 100 100 100 100 100 100FFC total imports 54 49 48 67 63 61 63 67FFC imports for processing 32 12 21 39 53 36 41 49
Source: China's Customs Statistics, authors' calculations.
211G. Gaulier et al. / China Economic Review 18 (2007) 209–243
The bulk of inputs that China imports for re-export comes from East Asia, as productionmoved mainly from East Asian advanced economies to the mainland. The supply of intermediategoods to processing facilities in China has driven the expansion of East Asian trade with China.This trade involves East Asian firms but also US and European firms operating in East Asia.
China's trade in high-tech goods has increased rapidly, but the overwhelming share (80%) ishandled by foreign affiliates and takes place mainly with Asian partners. China's high-tech tradethus reflects the country's position in the international segmentation of production process morethan the actual upgrading of its domestic capabilities.
2.2. Analysing the impact on Asian trade patterns
The present paper examines how this emergence of China as a global manufacturing base inAsia has affected the position of other Asian countries in the international division of labour.Recent research has already provided well documented insights into this issue (Fernald, 2004;Lall & Abaladejo, 2004; Shafaeddin, 2004; Weiss, 2004). The present paper contributes toexisting literature in two ways. First, the analysis puts forwards that China's export performanceis heavily dependent on imports, due to the country's integration in Asian production networks.This helps understanding that complementarity and competition are closely related in China'srelations with its neighbours. Second, the data base used makes it possible to analyse precisely theposition of China in the international value-added chain, to assess its specialisation in terms ofboth quality–price ranges and technological level, to points out its price competitiveness.
The CEPII data base on international trade BACI,2 has made it possible an original analysis oftrade flows over the period 1993–2003,3 using different criteria). A first classification gives thecomposition of trade by stage of production, using the United Nations ‘Broad Economic Cate-gories (BEC, see Appendix D) which distinguishes five categories of products: 1) Primaryproducts, 2) Semi-finished goods, 3) Parts and Components (P and C), 4) Capital goods, 5)Consumption goods. The structure of trade by stage of production is helpful to show how theinternational division of labour between the different Asian partners has evolved. A secondcriteria is the unit value of traded goods, which is used to assess the specialisation of Asianexporters according to price/quality range as well as the evolution of their terms of trade
2 “Analytical Database on International Trade. For a description of the data base BACI, see Appendix B and the CEPIIwebsite: http://www.cepii.fr/anglaisgraph/bdd/baci.htm.3 Despite the treatment made in the construction of the data base, the quality of the data for the period prior to 1993
may be affected by the lack of export and import declaration for a number of countries. Therefore, the present analysiswill focus on 1993–2003.

212 G. Gaulier et al. / China Economic Review 18 (2007) 209–243
(Appendix C). A third criteria of classification relies on the technological content of trade goodsand measures the technological upgrading of the different countries' exports (Appendix E).Combining these different criteria, the analysis provides useful insights into the conditions ofcompetition and the existing complementarity between the countries in the region.
The paper focuses on Japan and two groups of countries aggregated according to their level ofeconomic development: the Dragons which encompass the first tier of New industrialisedeconomies (Hongkong, Singapore, South-Korea, Taiwan), and the Tigers which encompass thesecond tier of New industrialised economies (Malaysia, Philippines and Thailand). The evolutionof their geographic trade pattern is analysed, focusing on their trade with selected groups ofcountries in Asia and in the rest of the world (NAFTA and Western Europe).
3. Asian trade pattern and regional integration
The pattern of Asia's trade on the period observed (1993–2003) shows that the emergence ofChina has fostered the regionalisation as well as the globalisation processes. The following trendscharacterise the region's trade:
⋅ China is overtaking Japan as the major trading power in the region⋅ The segmentation of production processes is the main force driving regional trade⋅ Asian exports of final goods are still heavily dependant of markets outside the region⋅ China has boosted intra-regional trade but is itself more and more integrated in a world-widedivision of labour.
3.1. Asian trade: more and more centered on China
The share of Asia4 in world trade of manufactured products has not changed much between1993 and 2003. Asia's share declined slightly in world exports (from 31.7% to 31.3%), but moremarkedly in world imports (from 25.2% to 24%). The gap between export and import shares thusenlarged indicating that Asian trade surplus with the rest of the world tended to increase over thisperiod (Table 2).
Intra-Asian trade as a share of world trade of manufactured products increased only slightly,from less than 14.8% in 1993 to 15.4% in 2003. In fact, the relative importance of intra-regionaltrade increased much more in Asian imports (from 58% to 64%) than in Asian exports (from47.5% to 50%). The dependence on outside markets has thus remained more pronounced than thedependence on outside suppliers, a point that will be analysed below.
Large shifts occurred in the respective contributions of the different Asian countries or groupsof countries to world trade. Japan's share in world exports declined sharply, dropping from 12.5%to 7.5%, and more moderately in world imports, from 5.1% to 4%. China's share rose from 3.8%to 7.7% of world exports, thus making up for most of Japan's decline; it rose from 3.2% to 5% ofworld imports, thus more than offsetting Japan's decline. The diverging trends of Japanese andChinese foreign trade correspond to their contrasted macroeconomic performance. While Japan'seconomy stagnated, China posted a record economic growth accompanied by a rapid opening up.China's economy is more open to trade and FDI than the Japanese economy has ever been. It isworth noting that during this period, the Tigers succeeded in improving their positions in worldexports (it rose from 3% to 3.8%), but stepped back in world imports, and so did the Dragons. In
4 Cf. note 2.

Table 2Share of Asian countries in World Trade of manufactured products
Exports Imports
1993 2003 Change 1993 2003 Change
Japan 12.5 7.5 −5.0 5.1 4.0 −1.1Dragons 8.9 8.7 −0.2 10.3 8.6 −1.7Tigers 3.0 3.8 0.7 3.1 2.6 −0.5China 3.8 7.7 3.9 3.0 5.2 2.2India 0.7 0.9 0.2 0.5 0.8 0.3Other Asia 1.4 1.6 0.2 1.6 1.3 −0.3Oceania 1.3 1.0 −0.3 1.7 1.6 −0.1Asia–Oceania 31.7 31.3 −0.4 25.2 24.0 −1.2World 100.0 100.0 0.0 100.0 100.0 0.0
Source: CEPII-BACI data base, authors' calculations.
213G. Gaulier et al. / China Economic Review 18 (2007) 209–243
fact, China and India were the only Asian countries which strengthened their positions in worldimports during this period.
Similar shifts in the respective weights of the different countries occurred in intra-Asian tradeof manufactured products, which has become more and more centred on China (Table 3). China'sshare increased from around 12–14% of intra-regional trade in 1993 to more than 20% in 2003.China had almost caught up with Japan as the major exporter of manufactured products to theregion and has overtaken Japan as the major importer of Asian manufactured goods. China's tradeincreased at an accelerated pace with all Asian countries/groups of countries and the mostimportant increase took place between China and the Dragons. In 2003 China received one third
Table 3Distribution of intra-Asian trade by major partners manufactured products (in %)
Exporters Importers
Japan Dragons Tigers China India Other Asia Oceania Asia–Oceania
2003Japan 10.8 3.7 6.1 0.3 1.1 1.3 23.3Dragons 3.6 8.6 4.3 11.5 0.8 2.0 1.1 31.9Tigers 2.6 5.6 1.4 2.0 0.3 1.0 0.6 13.4China 6.3 11.8 1.4 0.3 1.1 1.0 21.9India 0.2 0.6 0.2 0.3 0.4 0.1 1.7Other Asia 1.1 1.2 0.6 0.5 0.2 0.2 0.3 4.1Oceania 0.7 0.8 0.4 0.4 0.2 0.2 1.0 3.7Asia–Oceania 14.3 39.5 12.0 20.8 2.0 6.1 5.4 100.0
1993Japan 18.6 6.5 4.3 0.3 2.3 2.4 34.5Dragons 5.6 9.3 4.8 6.5 0.6 2.6 1.2 30.6Tigers 2.5 5.3 0.7 0.4 0.0 0.6 0.4 10.0China 3.4 8.9 0.4 0.1 0.7 0.5 13.9India 0.4 0.6 0.2 0.1 0.3 0.1 1.5Other Asia 1.4 1.6 0.4 0.3 0.0 0.2 0.2 4.1Oceania 1.4 1.6 0.6 0.2 0.0 0.3 1.2 5.4Asia–Oceania 14.6 45.9 13.6 11.8 1.2 7.0 5.9 100.0
Source: CEPII-BACI data base, authors' calculations.

Fig. 1. Composition of Asia–Oceania's International Trade by production stages.
214 G. Gaulier et al. / China Economic Review 18 (2007) 209–243
of the Dragons' exports to the region, one fourth of Japan's exports, and one sixth of Tigers'exports. China supplied 40% of Japanese imports from Asia; 30% of Dragons' imports from Asia.
3.2. Vertical division of labour is driving intra-Asian trade
There are several ways to assess the extent of vertical division of labour, i.e. the splitting up ofthe value added chain between different countries (Lall, Abaladejo, & Zhang, 2004). The methodused in present study is to measure the share of parts and components (P and C) in total trade. Itprovides clear evidence that the segmentation of production processes has been the engine ofAsian trade.
Since the early 1990s, P and C have been the fastest growing product category in Asian trade.P and C accounted for 24% of Asian exports and 25% of Asian imports in 2003, while thecorresponding figures were 18% and 16% ten years earlier. P and C have almost caught upconsumption goods as the most important export category and have by far overtaken capitalgoods and consumption goods in the region's imports (Fig. 1).
Compared with other parts of the world, Asia appears to be relatively specialised in P and Cand this specialisation has increased since early 1990s. Asia's share in world exports of P and C(38% in 2003) is significantly higher than its share in overall world exports (29%, Fig. 2). Thisreflects the fact that East Asia has become a manufacturing hub, especially in electronic industry,a sector in which production sharing has been an especially widespread phenomena (Ernst, 2004;Sturgeon & Lesteir, 2004).
In fact Asian trade in P and C has been more and more concentrated within the region, as theinternational fragmentation of production processes has intensified within Asia. Between 1993and 2003, the share of intra-regional trade in Asian exports of P and C increased from less 50% tomore than 60%. On the import side this share rose from 61% to 69% (Table 4). In 1993, theoverwhelming share of intra-Asian trade in P and C took place between Japan and the New
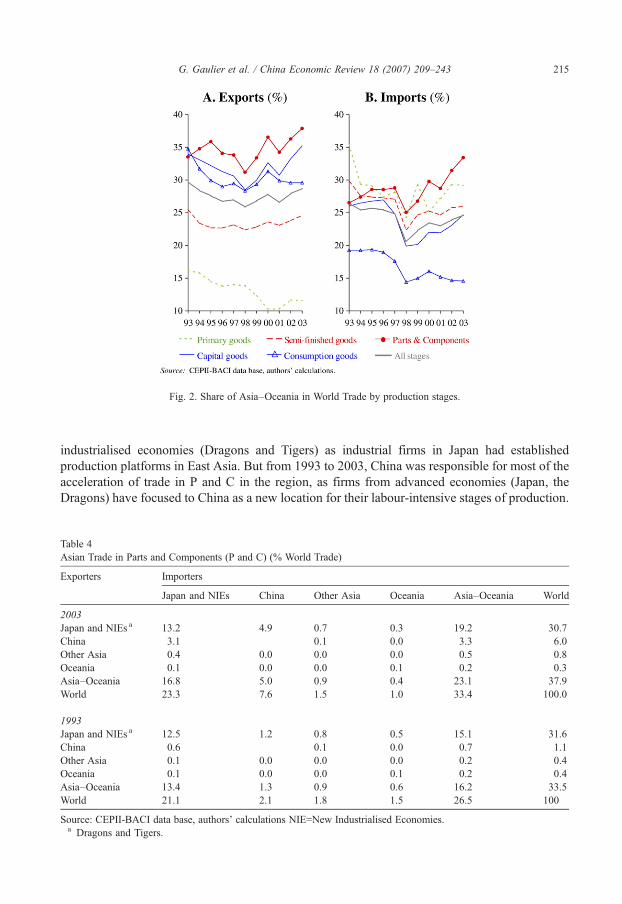
Fig. 2. Share of Asia–Oceania in World Trade by production stages.
215G. Gaulier et al. / China Economic Review 18 (2007) 209–243
industrialised economies (Dragons and Tigers) as industrial firms in Japan had establishedproduction platforms in East Asia. But from 1993 to 2003, China was responsible for most of theacceleration of trade in P and C in the region, as firms from advanced economies (Japan, theDragons) have focused to China as a new location for their labour-intensive stages of production.
Table 4Asian Trade in Parts and Components (P and C) (% World Trade)
Exporters Importers
Japan and NIEs China Other Asia Oceania Asia–Oceania World
2003Japan and NIEs a 13.2 4.9 0.7 0.3 19.2 30.7China 3.1 0.1 0.0 3.3 6.0Other Asia 0.4 0.0 0.0 0.0 0.5 0.8Oceania 0.1 0.0 0.0 0.1 0.2 0.3Asia–Oceania 16.8 5.0 0.9 0.4 23.1 37.9World 23.3 7.6 1.5 1.0 33.4 100.0
1993Japan and NIEs a 12.5 1.2 0.8 0.5 15.1 31.6China 0.6 0.1 0.0 0.7 1.1Other Asia 0.1 0.0 0.0 0.0 0.2 0.4Oceania 0.1 0.0 0.0 0.1 0.2 0.4Asia–Oceania 13.4 1.3 0.9 0.6 16.2 33.5World 21.1 2.1 1.8 1.5 26.5 100
Source: CEPII-BACI data base, authors' calculations NIE=New Industrialised Economies.a Dragons and Tigers.

216 G. Gaulier et al. / China Economic Review 18 (2007) 209–243
To a large extent, China's involvement in the division of labour thus explained the rise of intra-regional trade in P and C over this period.
3.3. Asian trade still dependent on Western markets for final goods exports
The intensified segmentation of production processes within the region has tended toaccentuate the structural asymmetry of Asia's trade with the rest of the world.
Since 1993, Asian trade surplus with the rest of the world has skyrocketed and has stemmedmainly from trade in final goods. Trade balance by stage of production shows that Asian countriestaken together hold by far their largest comparative advantage (structural trade surplus) with therest of the world in consumption goods, and to a lesser extent in capital goods. While thesegmentation of production processes has boosted intra-Asian trade in P and C, Asia taken as awhole increasingly depends on the rest of the world for its exports of final goods: its ballooningtrade surplus in final goods indicates that the final demand, which eventually drives theinternational segmentation of production processes within the region, is still located outside theregion (Fig. 1C).
From 1993 to 2003, Europe's and America's trade displayed opposite trends: the formerstrengthened its position in international trade while the latter lagged behind; but both expandedtheir trade with China at an accelerated pace (Table 5). The share of European imports in worldtrade enlarged (by 2.6 percentage points) and two major flows accounted for this acceleration :intra-European trade (+2.3 percentage points) and imports from China (+1.1). The rise of Chinain European imports more than compensated the relative decline of other Asian economiesresulting from the move of production from East Asian advanced economies to China. America'sshare in global imports contracted (−1.8 percentage point) and this affected imports from allregions, excepted those from China (which recorded a gain of 1.2 percentage point in world trade)and from Europe (+0.3). The share of advanced Asian economies in American imports fell backabruptly, and their loss was bigger than China's gain. While the share of Asia remained
Table 5Changes in intra- and inter-regional trade in manufactured products from 1993 to 2003 (in percent points of World trade)
Exporters Importers
Japan andNIEs
China OtherAsia
Oceania World Asia–Oceania
Rest of theWorld
Europe America
Japan andNIEs a
−1.6 1.4 −0.1 −0.1 −4.4 −0.5 −4.0 −0.7 −2.8
China 1.1 0.0 0.1 0.1 3.9 1.3 2.6 1.1 1.2Other Asia −0.1 0.1 0.1 0.0 0.4 0.1 0.3 0.1 0.1Oceania −0.2 0.0 0.0 −0.0 −0.3 −0.2 −0.1 0.0 −0.0World −3.3 2.2 −0.0 −0.1 0.0 −1.2 1.2 2.6 −1.8Asia–
Oceania−0.8 1.5 0.0 −0.0 −0.4 0.7 −1.1 0.5 −1.5
Rest of theworld
−2.5 0.7 −0.1 −0.1 0.4 −1.9 2.3 2.1 −0.3
Europe b −0.8 0.2 −0.1 0.0 2.0 −0.6 2.7 2.3 0.3America −1.6 0.2 −0.1 −0.1 −3.7 −1.6 −2.1 −0.9 −0.8
Source: CEPII-BACI data base, authors' calculations NIE=New Industrialised Economies.a Dragons and Tigers.b EU-25, EFTA and Other Eastern European countries.

217G. Gaulier et al. / China Economic Review 18 (2007) 209–243
unchanged in European imports (6%), it contracted slightly in American imports (from 9% to8%), remaining however relatively large.
As on the import side, the rise of European exports in world trade (+2.0 percentage point) wasmainly due to intra-regional trade (+2.3) and to a much lesser extent to China (+0.2) and America(+0.3). The rise of China in Europe's exports did not compensate for the slowdown of exports toadvanced Asian economies, and the overall share of Asia contracted. American exports lostground in global trade (−3.7 percentage point), and only exports to China grew faster thanaverage. In America's exports, the share of Asia fell abruptly. The trade deficit of Europe andAmerica with Asia enlarged. Asian trade imbalances reflect the pattern of economic growth inmost Asian economies, in which domestic consumption still remained a relatively weakcomponent of demand (ADB, 2005).
3.4. China in Asia: Between regionalisation and globalisation
Regionalisation, i.e. the geographic concentration of trade between neighbour countries, is awidespread characteristic of international trade. Geographic proximity is naturally an importantdeterminant of trade patterns. Recent studies have observed that regional polarisation increased inthe nineties in America and in Asia–Oceania (Gaulier, Jean, & Ünal-Kesenci, 2004). This trendtowards regionalisation results both from institutional factors, as evidenced by the multiplicationof regional trade agreements in the 1990s, and from the strategies of firms. Multinational firmshave moved high volume production in low-cost sites within blocs and this regional organisationhas corresponded to a growing need for rapid response, build-to-order, etc. Trade agreementshave strengthened these regional production networks (Sturgeon, & Leister, 2004).
Splitting up the world into three large areas, Europe–Africa, Asia–Oceania and Americaclearly shows that intra-regional trade accounts for the most important part of international tradeof manufactured products (Table 6). The concentration has reached its highest level in Europe–Africa, where 78% of exports and 76% of imports are carried out within the region, a ratio whichhas tended to increase since 1993. In America, trade concentration within the region remained
Table 6World Manufacturing Trade Matrix by Major Area (in Percent of World Manufacturing Trade)
Exporter Importer
Asia–Oceania Europe–Africa America Total Intra-area share
2003Asia–Oceania 16 8 8 32 49Europe–Africa 5 39 6 50 78America 3 4 11 18 58Total 24 51 25 100Intra-area share 65 76 43
1993Asia–Oceania 15 8 10 32 47Europe–Africa 6 35 5 46 76America 5 6 11 22 52Total 26 48 26 100Intra-area share 59 72 43
Source: CEPII-BACI data base, authors' calculations.

218 G. Gaulier et al. / China Economic Review 18 (2007) 209–243
relatively low and stable on the import side (43% in 2003), but increased fast on the export sidesince the mid nineties, rising from 52% in 1993 to 58% in 2003. The US market plays a centralrole in the evolution of intra-regional trade.
In Asia, imports became more concentrated within the region (intra-regional imports rose from59% in 1993 to 65% of total imports in 2003) while the share of intra-regional trade in exportsincreased more moderately (from 47% to 49%) and remained at a much lower level. Again, theAsian trade pattern reflects the absence of a large market with a dynamic domestic demand whichwould drive trade and economic growth in the region. Indeed China's emergence has boostedintra-regional trade as China's imports from Asia have increased at an accelerated pace. However,less than half of these imports are aimed at China's domestic market while more than half is forprocessing and export. Although imports for the domestic market have increased faster than forprocessing since 1997, China's imports from its Asian partners still heavily depends on theevolution of world markets and especially on the US market (Gaulier et al., 2005).
While China's emergence has favoured intra-regional trade, its trade is relatively lessconcentrated on Asia than that of other Asian countries on average. Large-sized economiesusually display less regional polarisation, as their market is large enough to attract distantsuppliers. From 1993 to 2003, the share of Asia fell from 56% to 45% in China's exports while itincreased in the case of Japan's, the Dragons and Tigers, reaching respectively 48%, 58% and57% of their exports. On the import side, the concentration on Asia of China's trade rose slightlyfrom 59% to 63%, but less rapidly than in the cases of Japan, Dragons and Tigers.
The low cost of labour, as well as other advantages such as economies of scales, spatialconcentration and the size of the potential and actual market, clearly make China a target for theinvestment and outsourcing strategies of firms all over the world. China is in fact engaged in aworld-wide division of labour, as shown by the geographic pattern of trade in P and C, which isrelatively less dependent on Asia than other East Asian country trade. In 2003 China directed toAsia 55% of its P and C exports and sourced from Asia 66% of its P and C imports, while for EastAsia the respective share was 62% and 72%. This may suggest that the emergence of China as aglobal production base may reverse the trend towards regionalisation of world trade as it threatensthe advantages that have been associated with geographic proximity.
4. Advanced Asian economies: The shock of the international reorganisation of production
This second part of the paper turns to the changes that have taken place in the trade pattern ofadvanced Asian economies, Japan and the Dragons, following China's emergence as a globalmanufacturing base. The reorganisation of industrial production has strongly affected their tradewith their most important partners in Asia and in the rest of the world and has led to far-reachingchanges in the composition of their trade by stage of production.
4.1. Japan: From bilateral trade to triangular trade
4.1.1. The decline of trade with NAFTAAs noted above, Japan's weight in world trade as well as in Asian trade, has dropped abruptly
since the end of the early 1990s, as the Japanese economy has entered a period of protractedstagnation. In this context, the changes that have marked Japan's trade appear to be driven by twointricate factors: the regionalisation process on both sides of the Pacific rim and the move ofproduction to low-cost countries. The major shifts in the geographic pattern of Japan's trade werethe decline of NAFTA and the emergence of China as a major partner. Underlying these changes,

Fig. 3. International trade of Japan by selected partners (%). All products.
219G. Gaulier et al. / China Economic Review 18 (2007) 209–243
the segmentation of production processes with Asian partners intensified as evidenced by therapid expansion of Japan's trade in P and C.
The decline of NAFTA in Japan's imports was sharp (Fig. 3B). Up to the end of the 1990s,NAFTAwas by far Japan's major supplier but by 2003 it had lost this position to China: NAFTA
Fig. 4. International trade of Japan by production stages.

220 G. Gaulier et al. / China Economic Review 18 (2007) 209–243
share in Japan's imports fell from 26% to 18% from 1993 to 2003, while that China rose from 9%to almost 20%. It is worth noting that during this period, there was a symmetric decline ofJapan's weight in NAFTA exports (from 9% to 5%). The agreement on the North American FreeTrade Area came into force in 1995 and strengthened regional integration: exports became moreconcentrated within the region as the US and Mexican markets have absorbed an increased shareof NAFTA exports. The importance of East Asian markets (Japan, Dragons and Tigers)diminished abruptly. This shift in favour of intra-regional trade was mainly driven by USimports: whereas in 1993, US imports from East Asia were bigger than its imports from theNAFTA (respectively 34% and 27%), since 1996 the reverse has been true as imports fromNAFTA have overtaken imports from East Asia (they accounted respectively for 30% and 28%in 2003).
Fig. 5. Exports of Japan by selected partners and production stages (in % of production stage exports).
221G. Gaulier et al. / China Economic Review 18 (2007) 209–243
The geographic pattern of Japan's exports underwent more limited changes than its imports,although the rise of the Chinese market was remarkable (rising from 5% to 12% of Japan'sexports, Fig. 3A).
4.1.2. Production sharing intensified with Asian partnersProduction sharing between Japan and other Asian economies intensified, as evidenced by the
accelerated growth of trade in P and C (Fig. 4). P and C have become the most important exportcategory, overtaking capital goods and accounting for 31% of Japan's total exports in 2003.Imports of P and C also increased at an accelerated pace (doubling its share to 15% of totalimports) but Japan has remained a net supplier of P and C, thus keeping its leading position in theinternational division of labour, while late-comers, like China, are specialised in assembly.Japan's trade in P and C has been increasingly concentrated within Asia which accounts for 51%of its exports and 58% of its imports in 2003 (against respectively 38% and 34% in 1993). Thistrend is mainly due to trade with China which has considerably enhanced its importance and hasjut overtaken the Tigers in Japan's exports and imports. Nevertheless, the Dragons have remainedthe most important partners (which may be partially due to the trade flows transiting throughHongkong). All Asian partners have considerably strengthened their positions as suppliers of Pand C for Japan's industry (Figs. 5 and 6). The role of “western” partners (NAFTA and Europe)plummeted. In fact, NAFTA lost the dominant position it had in early 1990s as a market andsupplier of Japanese industry. Europe also lost ground as a supplier of P and C, but kept a stableshare as a market. A similar story underlies Japan's exports of semi-finished goods, which gomainly to the Dragons and more and more to China. Production sharing with Asian partners hasthus been the engine of changes in Japan's trade.
The supplies of Japanese P and C to China are mainly directed to foreign export platforms set-up in the mainland. Processing activities play a dominant part in bilateral trade: in 2002,according to China's customs statistics, 60% of China's imports from Japan's was for processing(Gaulier et al., 2005). This move of the final stage of production to China has had majorconsequences.
The first consequence is that Japan's imports of final goods shifted from advanced economiesto China (Fig. 6). China has become by far Japan's first largest supplier of consumption goods,accounting for 1/3 of its global imports in 2003 (against 17% ten years earlier). This switchoccurred mainly at the expense of the Dragons which lost most of their market share. Japan'simports of capital goods have also shifted to China, which increased its share from 4% to 26%, atthe expense of NAFTA and Europe (the cumulated share of these two regions fell from 75% inearly nineties to 45% in 2003). Most of capital goods exported from China consist of electronicproducts (telecommunication equipment and computer). Japan has thus shifted from a situation inwhich it imported final goods mainly from the US, Europe and the Dragons, to a situation inwhich its imports mainly come from China.
The second consequence of China's emergence as export plate-form is that Japan's exports ofcapital goods slowed down (falling from 31% of total exports to 25% between 1993 and 2003).One of the reason for that is that China has become a major exporter of final goods to the US,having recently overtaken Japan as its supplier of capital goods and consumption goods.
The changes that have taken place in Japan's trade pattern as a result of China's emergence canbe viewed as a switch from bilateral to triangular trade. Japan's trade which used to be dominatedby the exports of final goods to North America and Europe has been driven by exports of P and Cand semi-finished goods to China where they are processed and assembled and then re-exportedto Western markets and also to Japan.

Fig. 6. Imports of Japan by selected partners and production stages (in % of production stage imports).
222 G. Gaulier et al. / China Economic Review 18 (2007) 209–243
The changes observed in Japan's trade stem from the strategies of firms which have movedhigh volume of production to low-cost sites within blocs (Sturgeon & Leister, 2004). As aconsequence, Japan's trade with China has rapidly increased, while its imports from advancedeconomies, and mainly from the US (which accounts for the bulk of NAFTA trade with Japan),have slowed-down. A symmetric trend happened in North America: US imports shifted in favourof low-cost suppliers in the region (Mexico) and in China, and away from Japan and theDragons. Thus, contrary to expectations, China's rise has not taken place at the expense of Asianemerging economies (the Tigers) but has induced a slow-down of trade between advancedeconomies.
4.1.3. The international reorganisation of production in electronicsElectronic industry plays a crucial part in Asian industry and trade as it is the sector in which
the international segmentation of production processes is the most advanced (Ernst, 2004). In

Fig. 7. Distribution by selected partners of Japan's trade in electronics (in %).
223G. Gaulier et al. / China Economic Review 18 (2007) 209–243
2003, electronics was the first most important branch in Japan's foreign trade, accounting foraround 30% of its exports and 20% of imports.
The direction of Japan's electronic exports underwent dramatic changes as it switched fromtraditional markets in the US and the EU (each representing still 20% of Japan's electronic exportsin 2003) to new dynamic markets in Asia: the Dragons (28%) and China (almost 15%, (Fig. 7A).During the decade, the value of Japan's electronic exports to the US fell and it lost most of itsmarket share. This rapid changes reflected both the reorganisation of production in Asia whichboosted emerging countries' exports (Tigers and China) and the integration process withinNAFTA which favoured US imports from Mexico.
The reorganisation of production implied far-reaching changes in the commoditycomposition of Japanese exports, which switched from capital goods to P and C. From early1990s to 2003, P and C share rose from 35% to 50% of total electronic exports, while capital

224 G. Gaulier et al. / China Economic Review 18 (2007) 209–243
good exports dropped correspondingly (from 50% to 32%). Production sharing has led to arapid rise of Japan's P and C exports to the Dragons and China which have become the twomajor export destinations, the former receiving 35% of Japanese electronic P and C in 2003, andthe latter 17% (Fig. 7B).
For Japan's capital good exports, Europe and NAFTA have remained by far the major marketsbut not the most dynamic. In fact Japanese capital goods have lost ground at an accelerated pacein the US market and have been overtaken since early 2000 by Mexico and China which hasbecome the first largest supplier of the US in this category of products in 2003.
In Japans' imports of electronic goods, Asian countries strengthened their positions as the USabruptly fell back (from 50% in 1989 to less than 20% in 2003). Dragons have become the majorsupplier (more than 20% of imports), almost caught up by China (Fig. 7C). The switch in favour ofChina was especially outstanding in capital goods and China has become its first largest supplieraccounting for more than 25% of Japan's electronic capital goods imports in 2003 (Fig. 7D).
The emergence of China as a global manufacturing base has thus led to tremendous changes inthe trade specialisation of electronic industry in Japan.
4.2. The Dragons: Trade switched away from advanced economies to China
The factors which have determined the evolution of Japan's trade pattern have led to similarchanges in the Dragons' trade. Trade in P and C has increased at an accelerated pace and Chinahas enlarged its position at the expense of developed economies. It must be mentioned that tradeflows of the Dragons are blurred with transit trade taking place through Hongkong.
4.2.1. The redirection of tradeThe major changes in the geographic trade pattern of the Dragons were the following (Fig. 8):The role of Japan as a trade partner of the Dragons, and especially as a supplier declined
abruptly. The decline was the result of two factors: first, the relative slow growth of Japanese
Fig. 8. Internation trade of Dragons by selected partners all products.
225G. Gaulier et al. / China Economic Review 18 (2007) 209–243
overall trade, since the share of the Dragons in Japan's trade was almost stable, as noted above;second, the development of export capacities in China which reduced the role of Japan as anexporter of final goods to the Dragons' (and reciprocally).
The importance of NAFTA also fell and in 2003, it has ceased to be the Dragons' majormarket. This trend is mirrored by the decline of the Dragons in NAFTA trade. Like Japan's, theDragons' trade has been affected by the move of production to low cost suppliers both in Asia andin America.
The symmetric change was the intensification of trade with China. Since the mid 1990s,Dragons' trade with China has skyrocketed, and in early 2000s, China has become their firstlargest market and first largest supplier.
As in the case of Japan, the sourcing strategy of multinational firms is at the core of tradeexpansion between the Dragons and China: according to China's Customs statistics, two-thirds ofChina's exports to the Dragons and 60% of its imports correspond to processing activities; foreignaffiliates play a dominant part as they handle more than 60% of trade between the Dragons andChina (Gaulier et al., 2005).
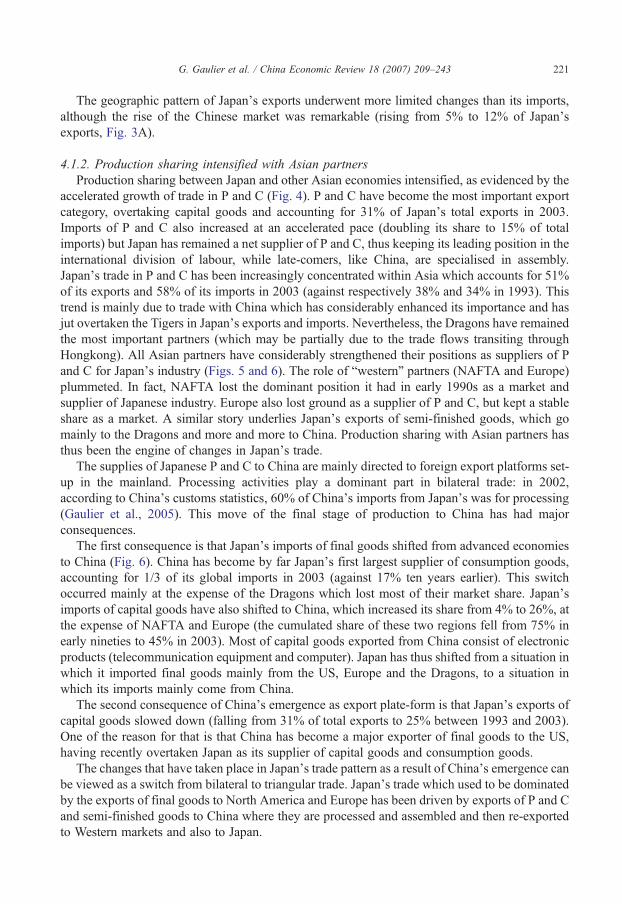
4.2.2. Dragons export P and C to China and final goods to NAFTA and EuropeDragons' exports of consumption goods fell abruptly from 28% of the total in 1993 to 16% in
2003 while exports of PPC expanded rapidly (from 20% to 30%) (Fig. 9A). Their exports ofconsumption goods hardly increased in dollar terms as the production has moved to China. Asmentioned above, Japan has turned to China for its imports of consumption goods and that is oneof the reason why Dragons' exports to Japan plummeted. Moreover, emerging Asian economies(China and the Tigers) have remained relatively small markets for consumption goods sinceprivate consumption has been a relatively weak component of the demand in these economies, asunderlined in the recent report by the Asian Development Bank (ADB, 2005). As a result Americaand Europe have remained major and growing markets accounting for more than 60% of theDragons' exports of consumption goods (Fig. 10D).
Fig. 9. International trade of Dragons by production stages.

Fig. 10. Exports of Dragons by selected partners and production stages (in % of production stage exports).
226 G. Gaulier et al. / China Economic Review 18 (2007) 209–243
Exports of P and C shifted away from Japan to the Dragons themselves and China which arenow their most important markets.
4.2.3. Imports switched from Japan to ChinaDragons' imports recorded two important and interconnected changes: a switch from Japan to
China and a rapid rise of P and C. P and C became the Dragons' most important import categoryin 2003, accounting for 33% of imports (against 20% in 1993), while all other categories ofproducts recorded slight relative decline (Fig. 9B). For P and C, the dramatic decline of Japan as asupplier (from 35% to 19% of the Dragons' imports) is explained by two combined factors: first,Japan's exports of P and C has tended to switch to China; second, an increasing share of theDragons' supplies have come from other countries, among which the Dragons themselves, theTigers and China (Fig. 11B).
In capital goods also, the share of Japan as a supplier fell dramatically (from 36% to 23%) asJapanese exports of this type of goods almost stagnated from 1993 to 2003 (Fig. 11C). Dragons'
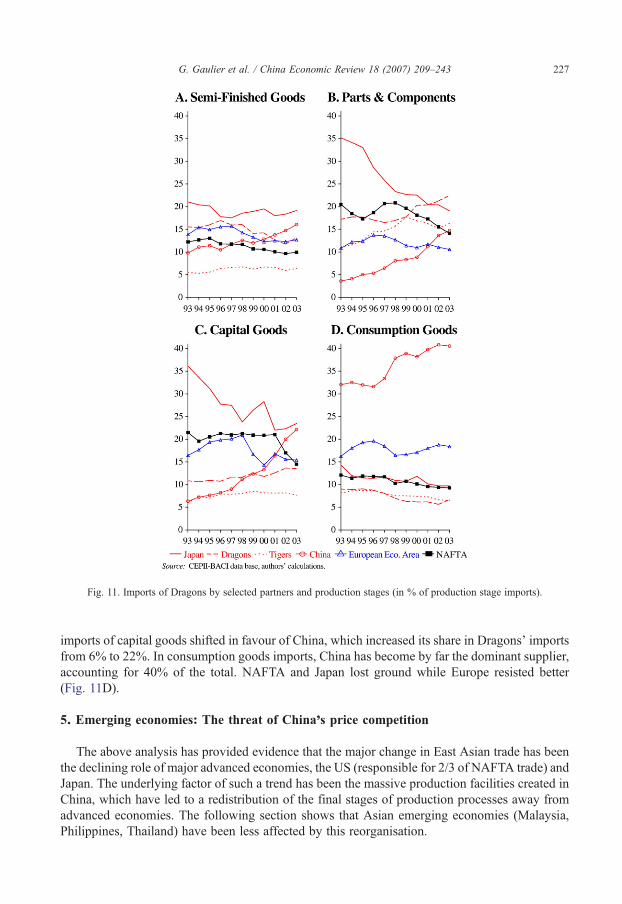
Fig. 11. Imports of Dragons by selected partners and production stages (in % of production stage imports).
227G. Gaulier et al. / China Economic Review 18 (2007) 209–243
imports of capital goods shifted in favour of China, which increased its share in Dragons' importsfrom 6% to 22%. In consumption goods imports, China has become by far the dominant supplier,accounting for 40% of the total. NAFTA and Japan lost ground while Europe resisted better(Fig. 11D).
5. Emerging economies: The threat of China's price competition
The above analysis has provided evidence that the major change in East Asian trade has beenthe declining role of major advanced economies, the US (responsible for 2/3 of NAFTA trade) andJapan. The underlying factor of such a trend has been the massive production facilities created inChina, which have led to a redistribution of the final stages of production processes away fromadvanced economies. The following section shows that Asian emerging economies (Malaysia,Philippines, Thailand) have been less affected by this reorganisation.

Fig. 12. International trade of Tigers by production stages.
228 G. Gaulier et al. / China Economic Review 18 (2007) 209–243
5.1. The Tigers have resisted to China's competition in up-market products
The Tigers, like other Asian economies have accentuated their vertical specialisation. Theirtrade is more and more driven by their involvement in the regional segmentation of productionprocesses, as shown by the surge of trade in P and C which accounted for more than 35% of theirexports and imports in 2003 (against respectively 20% and 28% in 1989, (Fig. 12). They nowcarry out most of their trade in P and C with the Dragons.
Fig. 13. International trade of Tigers by selected partners all products.

Fig. 14. Exports of Tigers by selected partners and production stages (in % of production stage exports).
229G. Gaulier et al. / China Economic Review 18 (2007) 209–243
In Tigers' overall exports, the share of NAFTA has remained stable and large at about 25%(Fig. 13) and it is still by far their largest market for final good exports, both for consumption andcapital goods (Fig. 14). Europe is their second export market for final goods, receiving with morethan 20% of these exports. The role of Japan which was their major supplier in 1993 (28% of theirimports) declined abruptly to 20% in 2003. Japan lost ground in these markets for P and C, capitalgoods and consumption goods, while the other Asian suppliers have strengthened their positions.In the Tigers' trade, China plays an increasing part which remained however below 10%, muchsmaller than in the trade of Japan and the Dragons (Figs. 13–15).
With their production and exports of manufactured goods depending heavily on FDI andcontract manufacturing with foreign firms, the Tigers are in potential competition with China bothfor markets and for foreign capital. Up to now, they have withstood this competition and althoughtheir progress in regional and world markets may have been slowed down by China's emergence,

Fig. 15. Imports of Tigers by selected partners and production stages (in % of production stage imports).
230 G. Gaulier et al. / China Economic Review 18 (2007) 209–243
they have not been crowded out, neither from Western markets nor from Asian markets. Whileadvanced Asian economies have strong complementarities with China which have boostedinvestment and trade flows, this is not the case of the Tigers. They have been less attracted byChina with which they share similar comparative advantages in labour intensive stages ofproduction. Malaysia, the Philippines and Thailand belong to the second wave of “Newindustrialised economies”, which have built up industrial capacities largely integrated in global orregional production networks.
From 1993 to 2003, the Tigers succeeded in increasing slightly their share in world exports ofmanufactured products (from 3.0% to 3.5%), despite the surge of China's exports in this period(Table 7). Moreover, they have maintained their export share in dynamic and high-quality/priceproducts. When looking at their position in world exports of the most dynamic products, that iselectronic goods, it stands out that they have not lost market share to China up to 2003. The Tigers
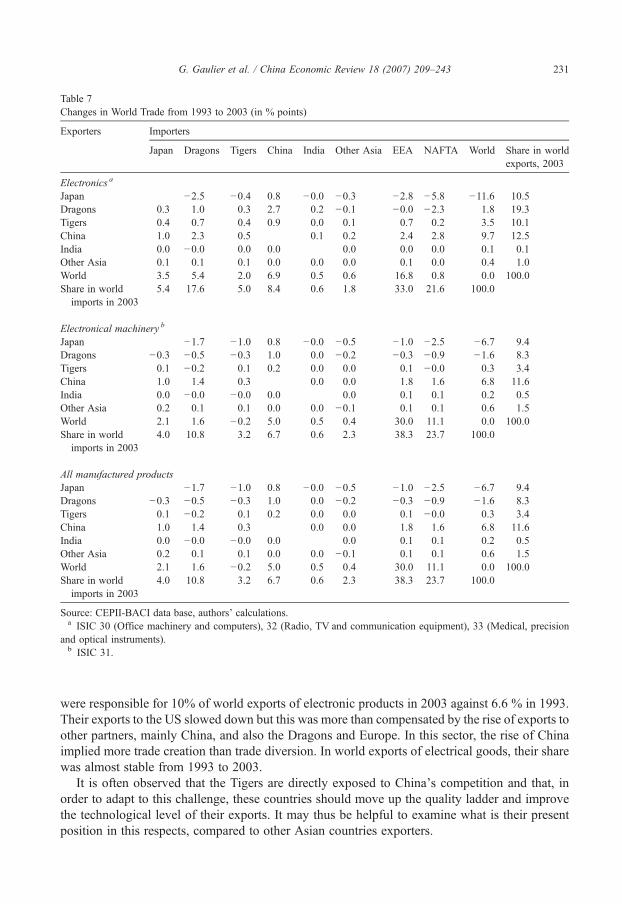
Table 7Changes in World Trade from 1993 to 2003 (in % points)
Exporters Importers
Japan Dragons Tigers China India Other Asia EEA NAFTA World Share in worldexports, 2003
Electronics a
Japan −2.5 −0.4 0.8 −0.0 −0.3 −2.8 −5.8 −11.6 10.5Dragons 0.3 1.0 0.3 2.7 0.2 −0.1 −0.0 −2.3 1.8 19.3Tigers 0.4 0.7 0.4 0.9 0.0 0.1 0.7 0.2 3.5 10.1China 1.0 2.3 0.5 0.1 0.2 2.4 2.8 9.7 12.5India 0.0 −0.0 0.0 0.0 0.0 0.0 0.0 0.1 0.1Other Asia 0.1 0.1 0.1 0.0 0.0 0.0 0.1 0.0 0.4 1.0World 3.5 5.4 2.0 6.9 0.5 0.6 16.8 0.8 0.0 100.0Share in world
imports in 20035.4 17.6 5.0 8.4 0.6 1.8 33.0 21.6 100.0
Electronical machinery b
Japan −1.7 −1.0 0.8 −0.0 −0.5 −1.0 −2.5 −6.7 9.4Dragons −0.3 −0.5 −0.3 1.0 0.0 −0.2 −0.3 −0.9 −1.6 8.3Tigers 0.1 −0.2 0.1 0.2 0.0 0.0 0.1 −0.0 0.3 3.4China 1.0 1.4 0.3 0.0 0.0 1.8 1.6 6.8 11.6India 0.0 −0.0 −0.0 0.0 0.0 0.1 0.1 0.2 0.5Other Asia 0.2 0.1 0.1 0.0 0.0 −0.1 0.1 0.1 0.6 1.5World 2.1 1.6 −0.2 5.0 0.5 0.4 30.0 11.1 0.0 100.0Share in world
imports in 20034.0 10.8 3.2 6.7 0.6 2.3 38.3 23.7 100.0
All manufactured productsJapan −1.7 −1.0 0.8 −0.0 −0.5 −1.0 −2.5 −6.7 9.4Dragons −0.3 −0.5 −0.3 1.0 0.0 −0.2 −0.3 −0.9 −1.6 8.3Tigers 0.1 −0.2 0.1 0.2 0.0 0.0 0.1 −0.0 0.3 3.4China 1.0 1.4 0.3 0.0 0.0 1.8 1.6 6.8 11.6India 0.0 −0.0 −0.0 0.0 0.0 0.1 0.1 0.2 0.5Other Asia 0.2 0.1 0.1 0.0 0.0 −0.1 0.1 0.1 0.6 1.5World 2.1 1.6 −0.2 5.0 0.5 0.4 30.0 11.1 0.0 100.0Share in world
imports in 20034.0 10.8 3.2 6.7 0.6 2.3 38.3 23.7 100.0
Source: CEPII-BACI data base, authors' calculations.a ISIC 30 (Office machinery and computers), 32 (Radio, TV and communication equipment), 33 (Medical, precision
and optical instruments).b ISIC 31.
231G. Gaulier et al. / China Economic Review 18 (2007) 209–243
were responsible for 10% of world exports of electronic products in 2003 against 6.6 % in 1993.Their exports to the US slowed down but this was more than compensated by the rise of exports toother partners, mainly China, and also the Dragons and Europe. In this sector, the rise of Chinaimplied more trade creation than trade diversion. In world exports of electrical goods, their sharewas almost stable from 1993 to 2003.
It is often observed that the Tigers are directly exposed to China's competition and that, inorder to adapt to this challenge, these countries should move up the quality ladder and improvethe technological level of their exports. It may thus be helpful to examine what is their presentposition in this respects, compared to other Asian countries exporters.

Fig. 16. Asian Country share in World exports by “quality/price” range (% world exports in the respective range).
232 G. Gaulier et al. / China Economic Review 18 (2007) 209–243
Looking at their position by market segments, it appears that from 1995 to 2003, the Tigersgained share in the upper-market segment of world trade5 (Fig. 16). In this segment, the Tigersincreased their market share from 5.6% to 6.6% and stand above China (2.5%) which has maderelatively slow progress. By contrast, in down-market products, the Tigers have slightly lostground while China's exports have skyrocketed. This tends to confirm that upgrading the qualityof their exports is indeed crucial for these emerging countries to face the challenge of China'scompetition. However, the strong presence of China in world exports of low-quality/priceproducts raises many questions.
5.2. The threat of China's price competition
5.2.1. Technological content and quality/price rangeA closer look at the positions of exporters in terms of technological content (according to
OECD-Eurostat classification, see Appendix C) and quality/price range may be helpful to clarifythe conditions of competition. The analysis has been conducted in the case of electronic goods6
and brings out some interesting findings (Fig. 17).Not surprisingly, Japan's exports display the largest high-tech content, with high-tech goods
making half of its exports. The difference in the technological levels of other Asian exports doesnot reflect the gap in their levels of economic development, as the Tigers, China and the Dragonsshow relatively similar HT content of exports (between 40% and 50%). This homogeneity reflectsthe importance of international production networks in electronic industry: the less developedpartners (China and the Tigers) have set up export capacities in electronics thanks to foreign directinvestment and their trade in electronic goods is carried out by foreign affiliates or by local firmsworking under contract manufacturing with multinational firms. However, since 1995, a processof differentiation took place: the HTcontent of Dragons exports has improved rapidly (possibly as
5 For the classification by quality/price segments, see Appendix C.6 The analysis was conducted for the period 1995 to 2002 (data for 2003 may be less reliable).

Fig. 17. Asian exports of electronic products, by “quality/price” range and technological content (% country's exports inelectronics).
233G. Gaulier et al. / China Economic Review 18 (2007) 209–243
a result of the transfer of low-tech production in China) and has tended to catch up with that ofJapan. The HT content of the Tigers' exports increased at a relatively slow pace and in the early2000s it stood below that of China. China had benefited from the building up of large productioncapacities by foreign firms which accounted for 80% of the country's HT exports (see Gaulieret al., 2005).
The positions by quality/price range show a more contrasted picture. Japan's exports areconcentrated in the high-quality/price range which makes up about half of its exports in the early2000s. Dragons' and Tigers' exports have a similar share of high-quality/price products, (1/3 in2002) but the Tigers' exports are still much more dependent on low-quality/price range while themedium-quality/price range is more important in the Dragons' exports. China is in a very specificposition: although the share of high-quality/price products increased, they represented only 8–10% of its electronic exports in 2003, while low-quality/price products still account for anoverwhelming share of its exports (75%). According to their unit-value, electronic products

234 G. Gaulier et al. / China Economic Review 18 (2007) 209–243
exported by China are still concentrated in the low-quality/price range. Even in high-techelectronic goods, 70% of China's exports belong to the low-quality/price range.
Several reasons can be put forwards and combined to explain the importance of the low-quality/price products in China's exports. The first one is that the low price of Chinese exportsactually corresponds to a low quality level. Although this may be the case for some products, it isnot likely to be the case for most Chinese exports, especially electronic goods, since they are, fortheir largest share, produced and exported by foreign affiliates. Another explanation lies in thestrong price competitiveness of Chinese exports: thanks to low production costs (and possiblyindirect subsidies), producers are able to set price below that of other competitors for the sameproduct. However, the most convincing explanation is that even though the unit value iscalculated at the most detailed level of classification (HS6), it does not capture productdifferentiation and China's exported products are likely to include less sophisticated variety withrelatively low unit-value. A last reason that cannot be excluded is that the recorded unit-value ofthe products exported by China corresponds to artificially low prices: this may be the case in intra-firm trade, when the product sold by a foreign affiliate in China to its parent firm is under-priced(transfer prices), in order to diminish the profit recorded in China for fiscal or other reason. Thismay also be the case when Chinese firms under-invoice their exports in order to circumvent thecontrols on capital outflows (the difference between the actual and invoiced value of exports ispaid outside China), a practice which took some importance at the end of the nineties, in theaftermath of the Asian financial crisis.
Table 8Evolution of world prices and of China's export prices by ISIC manufacturing branches, 1997–2003 (annual average in %)
China's export price index a World price index a
Publishing, printing and reproduction of recorded media −7.2 1.3Chemicals and chemical products −4.9 0.4Non-metallic mineral products −4.5 −0.2Textiles −4.4 −1.6Wood and of products −4.2 −2.8Basic metals −4.0 −0.5Electrical machinery −3.9 −1.8Tobacco products −3.7 5.1Machinery −3.6 −0.2Rubber and plastic −3.6 −1.2Wearing apparel −3.5 −1.3Food products and beverages −3.4 −0.7Other transport equipment −2.9 1.2Leather −2.7 −0.6Medical, precision and optical instruments −2.2 1.3Motor vehicles, trailers and semi-trailers −2.2 1.6Metal products −2.1 0.0Pulp, paper and paper products −2.0 0.6Radio, TV and communication equipment −1.9 0.2Furniture; manufacturing n.e.c. −1.3 −0.7Office machinery and computers −0.2 −2.7Coke, refined petroleum products and nuclear fuel 8.3 7.0
Source: CEPII-BACI data base, authors' calculation. n.e.c.=non elsewhere classified.a Price indices are calculated by unit values of products at the 6 digit level of HS classification (national currency for
China and US$ for the World).

Fig. 18. China: ex-factory prices of manufactured products 1997–2004 (1997=1).
235G. Gaulier et al. / China Economic Review 18 (2007) 209–243
5.2.2. The risk of a downward spiral of cost-competitionWhatever the relative quality/price level of China's exports compared to other exporters,
China's export price declined by more than 2% a year on average from 1995 to 2003, and by 4% ayear from 1998 to 2003. Decrease in export prices affected all stages of production and allcategories of exports (textile and clothing, electronics, electrical machinery, Table 8). The declineof export prices corresponded to a decline of domestic prices of industrial manufactured productswhich has started 1997 and stemmed from rapid productivity gains, strong competition and alsofrom over-capacity in many industrial sectors. As mentioned by Steinfeld (2004), China'sproducers find themselves locked in a downward spiral of intense cost-based competition,primarily with one another (Fig. 18).
Fig. 19. Evolution of terms of trade⁎ 1995–2003 (index 1995=1).

236 G. Gaulier et al. / China Economic Review 18 (2007) 209–243
It is generally recognised that China's exports have helped to keep down the inflationarypressures in world markets of manufactured products. China is a large exporter in a severalcategories of products (textiles, electrical products, electronics), and has exerted a downwardpressure on the international price of these products. This means that countries having the sameexport specialisation as China have become exposed to the decline of world prices. Indeed,according to data not reported here, since 1995, Thailand, Malaysia, Philippines and Indiarecorded a decline of their export prices of consumption goods even steeper than China. Thistrend coupled with the rise of oil prices since 2000 has led to a deterioration of terms of trade formany Asian emerging economies (Fig. 19B). In 2003, China's strong demand of oil, rawmaterials and commodities has contributed to the rise of world prices of these products and hasthus had a negative impact of the terms of trade of most Asian countries, excepted those wellendowed with natural resources (Malaysia). China's emergence may have thus an indirect adverseeffect on emerging economies which have followed an export-led growth based on theircompetitiveness in labour intensive industries. However, China's terms of trade have worsenedeven more than that of other countries, which may cast some doubts about the sustainability ofChina's specialisation strategy (Fig. 19A).
5.2.3. Is China's recent growth strategy sustainable?From 1995 to 2003, China's terms of trade fell by 18%, under the combined effects of falling
export prices (−15%) and rising import prices (+3%). Interestingly, the upward trend in importprices has not come mainly from primary goods but from Parts and Components, which was itsfastest import category over this period (28% of total exports in 2003). This suggests that Chinamay be trapped in a adverse position in the international segmentation of production processes: itfaces a rise in the import prices of intermediate goods necessary to supply its outward-orientedindustries, and a fall in the export price of finished goods (Fig. 20).
Fig. 20. China: exports and import prices by production stages⁎ 1995–2003 (index 1995=1).

237G. Gaulier et al. / China Economic Review 18 (2007) 209–243
It has to be mentioned that the recent rise in import prices may be exaggerated: in 2003 importsmay have been over-invoiced in order to allow speculative inflows of foreign capital into China,since the markets anticipated a re-evaluation of the yuan. However, the rise in import prices of Pand C has been sustained since 1996 and may well reflect a pricing strategy of foreign firms whichaims at minimising the profits recorded by their affiliates in China.
More generally China's economic growth since a decade has been mainly driven byinvestment. In its 2005 Development Outlook, the Asian Development Bank underlined that from1993 to 2003, a shift occurred in the composition of China's demand, compared with the previousdecade: the contribution of household consumption fell, while investment became more importantand net exports turned positive. This evolution has been even more accentuated during the recentsurge in economic growth since 2003. As noted by the report, most other Asian economies havealso failed to implement a growth strategy led by household consumption, which thus appears asthe weak link of these economies, India being an exception. China, however, was an extremecase, with private consumption accounting for only 40% of GDP in 2004. This assessment stillholds true despite the fact that revised figures of China's GDP, published in December 2005, haveoffered a more balanced picture of the economy (with an investment rate down from 44% to 39%,and an export ratio down from 35% to 30% in 2004).
The question is whether China can durably sustain this unbalanced growth. In 2003 and 2004,high growth has been accompanied by rapidly rising industrial profits (OECD, 2005), but this trendslowed markedly in 2005, as reported by Chinese official statistics and by US affiliate companiesin the mainland (Studwell, 2005). This is especially the case in downstream sectors, where firmsface strong competition, and have been forced to lower their selling prices, while the recent pricerise of energy and raw materials has increased their production costs. Despite the productivitygains and the flexibility of wages, there are indications that the diverging trends in the costs ofinputs and the prices of output are squeezing profit margins of manufacturing firms in individualsectors in which the high level of investment (both domestic and foreign) has led to a situation ofover-capacity. In 2005, in the car industry, profits fell by 29%, in electronic industry by 3.3%.
It is unlikely that Chinese exports can go on expanding at the rate shown over the last threeyears (+35% a year from 2003 to 2005, according to China's Customs Statistics) withoutprovoking new trade disputes with other actors of the world economy. Moreover, China's rapidtrade expansion makes its economy more vulnerable to fluctuations in the global business cycle(and especially to a US demand overturn) and to international trade disputes. To ensure asustainable and high economic growth, China has little choice but to return to a more balancedgrowth in favour of domestic consumption. Increase in wages and employment together with theextension of the social security system should support household consumption (Blanchard &Giavazzi, 2005).
6. Conclusion
The study has brought to the fore important changes in Asian trade. The following findingsdeserve to be emphasised:
Asian trade is increasingly driven by the international segmentation of production processeswithin the region, a trend which has been accelerated by the rise of China as a major partner inproduction networks.
Asian trade is more and more centred on China but the region records growing trade surplusesin final goods with the rest of the world. The emergence of China has not (yet?) created anautonomous engine for regional economic growth.

238 G. Gaulier et al. / China Economic Review 18 (2007) 209–243
The positions of advanced economies, mainly the US and Japan, in Asian trade have beenconsiderably weakened. This results from several intricate factors. One is the regionalisationprocess which has accelerated trade within NAFTA and within Asia. Another one is the move oflarge volumes of production to low cost sites (Mexico, China).
As China has become an export plate-form for multinational firms, the driving force of Japan'strade shifted from exporting final goods to North America and Europe towards exportingcomponents to China, and from importing final goods from America, Europe and the Dragonstowards importing these goods from China. The Dragons' trade also switched away from Japanand NAFTA and towards China.
The sourcing strategies of multinational firms have led to a reorganisation of production whichhas weakened trade between the advanced economies but up to now has not severely affected theposition of Asian emerging economies (Malaysia, Philippines, Thailand) in international trade.
However, the surge of China's exports since 2003, associated with the continuous decline inexport prices, suggests the risk of a downward spiral of cost-competition, as China's prices exert adownward pressure on international prices of manufactured products.
The question is raised of the sustainability of China's growth strategy during the last decade, asit has led to a deterioration of China's terms of trade and to the multiplication of trade disputes.China's capacity to switch to a more balanced growth, led by domestic consumption, is a crucialfactor for the future of the Asian and world economy.
Appendix A
Geographical classification
Asia–Oceania
Japan Dragons Hongkong, Singapore, South Korea, Taiwan Tigers Malaysia, Philippines, Thailand China India Asia NES OceaniaEurope–Africa
European Economic Area EU-25 + EFTA EU Periphery Other Eastern Europe, Mediterranean Countries, CIS Sub Saharan Africa and GulfAmerica
NAFTA USA, Canada, Mexico Mercosur Brazil, Argentina, Uruguay, Paraguay Other America NESAppendix B. BACI: an analytical database on international trade
International trade statistics can only used to carry out detailed studies related to recentdevelopments in economic theory, at the cost of extensive, fastidious work on treating data fromnumerous, heterogeneous sources. To meet these difficulties, the CEPII has constructed adatabase on international trade which brings together and renders consistent various levels ofanalyses and classifications, drawing on the most detailed information available. The particulargoal is to put forward a characterisation of trade flows in terms of trade types (one-way trade,cross-trade in similar products, cross-trade in vertically differentiated products), product ranges,technological levels and stages of production.

239G. Gaulier et al. / China Economic Review 18 (2007) 209–243
BACI draws on the UN's trade database COMTRADE and renders consistent trade flow byreconciling information reported by the exporter and the importer (when both are available). Thisharmonisation of mirror flows is done for value and quantities. The latter statistics beingconverted before into tons when necessary, making possible the computation of homogeneousunit values.
A detailed description is available in pdf format in the CEPII website: http://www.cepii.fr/anglaisgraph/bdd/baci.htm.
Appendix C. Classification by “quality–price” range
To test the hypothesis that holds that regional integration is followed by a specialisation alonga quality range, we need to measure the quality of traded goods. We use unit value7 as a proxy forquality, and define three ranges: low, medium and high quality. For each HS-6 product and foreach year, we compute the world unit value average (noted ¯UV). We then classify each flow:
– Flows with unit values verifying UV−25%, UV+25% belong to the medium range, alongwith the last decile of [min, UV−25%] and the first decile of [ UVþ 25%, max].
– The first nine deciles of [min, UV−25%] are considered low range.– The last nine deciles of [ UVþ 25%, max] are considered high range.
This method permits to take into account the high variability of unit values, and to have asignificant share of trade in the medium range.
It is theoretically possible to classify any flow using this procedure, as long as the unit value isavailable. However, it appears wise to avoid associating flows with ranges when it was notpossible to ascertain the validity of such a classification. Thus, when the variance of the unit valuewas too high for a product, flows were not classified.
Such a classification entails necessarily a certain amount of arbitrary since one could think of acontinuum of qualities. The parameters of our classification methodology are chosen according totwo main characteristics:
(i) So as not to wrongly ascribe price differences to quality differences. The threshold must besufficient to take into account “pure” price differences and measurement error (recall thatprices are proxied by unit values).
(ii) So as about one third of trade flows fall in each category. Given the conventional aspect ofsuch a classification, it is convenient to have approximately the same trade value in eachquality/price range.The results are robust to moderate changes in the procedure.
This kind of methodology is common in the vertical specialization literature (see for instanceGreenaway, Hine, & Milner, 1994; Greenaway, Hine, & Milner, 1995), the usual threshold being15% instead of 25%. This figure appeared too low here given our focus on a panel of developedand developing countries rather than industrialized countries as it is usual.
C.1. Trade price index
Values (V ) and quantities (Q) are taken from BACI (see above).
7 Unit values in the BACI database are corrected so as not to take into account transportation costs.

240 G. Gaulier et al. / China Economic Review 18 (2007) 209–243
Unit value ratios, UVR=V(USD) /Q (tons), are computed for each trade flow : from exporter(i) to importer ( j) in 6-digit product Harmonised System (k) at time t.
Changes in UVR (dlnUVR=lnUVRt− lnUVRt−1) are aggregated by means of weightedmedian in order to computed price indexes for countries or sectors (possibly country⁎ sector).
dln;Pt ¼ weighted median of dlnUVRt
weight : wi; j; k; t ¼ 0:5Vi; j; k; t−1
Vt−1þ Vi; j; k; t
Vt
� �
where Vt ¼Xi; j; k
Vi; j; k; t
d ln Pt are chained to compute P time-series. Pt=Pt−1⁎exp(dln Pt).
Example. For a country i at time t, dln Pit is the weighted median of dln UVRijkt acrossdimensions j and k.
Notes. Before computing weighted medians the 5% lowest and 5% highest UVR changes areremoved (for each country and year is the price index is computed for a country as in the example).The idea is to get rid of extreme observations, numerous given the low quality of UVR data. Onlytrade flows with a value superior to USD10,000 and a quantity superior to 2 tons are used.
C.2. Weighting scheme
Weight are those used in the Tornqvist index, making our index a geometric median indexrather than a geometric mean index, with weights taking into account year t and t−1 and thusaccounting for structural changes. Diewert (1976) shows that the Tornqvist price index measuresthe change in a cost or expenditure function that has the translog functional form, and that theTornqvist quantity index measures the change in a translog utility or production function. In thatcases the Tornqvist index is an ideal index (superlative index).
Each index, computed from weighted median price change, is based to 1 at year 2000. Indexare reported in USD, domestic currency or SDR.
C.3. Limits
Only flows with available value and quantity (weight) for two consecutive years can be used.Notice that this is a less severe limitation when data are harmonised (one partner declaringquantities is enough). The method is only valid when there is a large number of elementary UVRavailable. Therefore, results are not reliable for small countries and/or sectors.
Quantities in tons may not be an adequate measure of volume for various products (electronics,etc.).
Change in quality are attributed to prices.New as well as disappearing trade flows are not taken into account (which can be problematic
for some emerging countries). In the words of Broda and Weinstein (2004), our price indexes areconventional price indexes rather than exact price indexes, they do not take into account changesin variety.

241G. Gaulier et al. / China Economic Review 18 (2007) 209–243
Appendix D. Classification by production stage according to the BEC
In this study, the data from China's Customs statistics available at 6 digits of HarmonisedSystem were aggregated according to the BEC classification (Broad Economic Categories of theUnited Nations of production stages). The BEC reclassifies the Standard International TradeClassification (SITC, Rev. 3) headings on the basis of the principal use of the products. It convertsforeign trade data into categories of final or intermediate use, such us capital goods, intermediategoods or consumer goods, following the usage in the System of National Accounts (SNA). Wegrouped BEC items into five stages of production as following:
3 stages
5 stages Code BEC Title BEC Primary goods 111 Food and beverages mainly for industry21
Industrial supplies, NES, primary 31 Fuels and lubricants, primaryIntermediate goods
Semi-finished goods 121 Food and beverages, processed, mainly for industry 22 Industrial supplies, NES, processed 322 Fuels and lubricants, processedParts and components
42 Of capital goods, except transport equipment 53 Parts and accessories of transport equipmentFinal goods
Capital goods 41 Capital goods except transport equipment 521 Other industrial transport equipmentConsumption goods
112 Food and beverages, primary, mainly forhousehold consumption122
Food and beverages, primary, processed, forhouse. consumption51
Passenger motor cars 522 Other non-industrial transport equipment 61 Durable consumer goods NES 62 Semi-durable consumer goods NES 63 Non-durable consumer goods NESAppendix E. The definition of high-tech products
The definition of high-technology products is based on indicators of technological intensity inOECD countries, such as R&D expenditures divided by value added, R&D expenditures dividedby production.
On the basis of this definition two types of classification can bemade of high-technology products:
– at a broad category level: the indicators of high-tech content are calculated at the branch leveland all the products within an high-tech branch are considered as selected “high- tech” products;
– at a detailed product level within a broad category.
The first methodology is the most widely used. For instance, the latest OECD classification(2004) based on technology indicators groups manufacturing branches (ISIC rev. 3, at 2 or 3 digitlevel) into 4 technological levels: high-technology, medium-high-technology; medium-low-technology; and low technology. In this classification high-technology industries includes allproducts belonging to the following branches:
– aircraft and spacecraft (ISIC 353);– pharmaceuticals (ISIC 2423);

242 G. Gaulier et al. / China Economic Review 18 (2007) 209–243
– office, accounting, and computing machinery (ISIC 30);– radio, TV and communication equipment (ISIC 32);– medical, precision and optical instrument (ISIC 33).
In the same way, according to World Development Indicators of United Nations (WDIdatabase), high-technology exports include all the exports of the following branches: aerospace,computers, pharmaceuticals, scientific instruments, and electrical machinery. Fig. 5 in presentstudy refers to this definition.
It has to be noted that this methodology introduces a serious selection bias, since not all productin a “high-technology industry” necessarily have a high technology content. Likewise, someproducts in industries with low technology intensity may well incorporate a high degree oftechnological sophistication.
The second methodology first defines large high-tech sectors (as described above) and thenselects, within this high-tech branches and a detailed level of the products having a high content inR&D. The definition of high-tech products used in CEPII studies refers to this second way(Fontagné, Freudenberg, & Ünal-Kesenci, 1999). The nine high-tech industries that were selectedin the first step were the following:
– aerospace;– computers, office machinery;– electronics-communications;– pharmaceuticals;– scientific instruments;– electrical machinery;– chemicals;– other transport equipment;– non-electrical machinery;– weapons.
In the second step, within these broad categories, a list of 252 products (at the 6 digits level ofthe Harmonised System) were identified as high-tech. It has to be noted that this methodologyintroduces another selection bias, since it examines whether products are of a high-technologynature or not, only in branches that are considered high-technology: the high-technology productsbelonging to non technological branches are thus implicitly considered as non-technological.
References
ADB (Asian Development Bank). (2005). Asian Development Outlook.Blanchard, O., & Giavazzi, F. (2005, November). Rebalancing growth in China: A three-handed approach.Working paper,
vol. 05-32. Massachusetts Institute of Technology, Department of Economics.Broda, C., & Weinstein, D. E. (2004). Globalization and the gains from variety. NBER working paper, vol. 10314.Diewert, W. E. (1976). Exact and superlative index numbers. Journal of Econometrics, 4, 114−145 (Reprinted in W.E.
Diewert & A.O. Nakamura (Eds.) (1993), Essays in Index Number Theory, Vol.1. Amsterdam: Elsevier SciencePublishers).
Ernst, D. (2004). Global production networks in East Asia electronic industry and upgrading perspective in Malaysia. In S.Yusuf (Ed.), Global production networking and technological change in East Asia.Washington DC: The World Bank.
Fernald, J. (2004, March). Comrades or competitors? On trade relationships between China and emerging Asia. Essayson Issues : The Federal Reserve bank of Chicago.

243G. Gaulier et al. / China Economic Review 18 (2007) 209–243
Fontagné, L., Freudenberg, M., & Ünal-Kesenci, D. (1999). Trade in technology and quality ladders: Where do EUcountries stand? International Journal of Development Planning Literature, 14(4), 561−582.
Gaulier, G., Jean, S., & Ünal-Kesenci, D. (2004, November). Regionalism and the regionalisation of international trade.CEPII working paper (pp. 20042016).
Gaulier, G., Lemoine, F., & Ünal-Kesenci, D. (2005, June). China's integration in East Asia: Production sharing, FDI andhigh-tech trade. CEPII working paper (pp. 20052009).
Gaulier, G., Lemoine, F., & Ünal-Kesenci, D. (2006, May). China's emergence and the reoganisation of trade flows inAsia. CEPII working paper (pp. 20052006).
Greenaway, D., Hine, R. C., & Milner, C. (1994). Country-specific factors and the pattern of horizontal and vertical intra-industry trade in the United Kingdom. Weltwirtschaftliches Archiv, 130(1), 77−100.
Greenaway, D., Hine, R. C., & Milner, C. (1995, November). Vertical and horizontal intra-industry trade: A cross industryanalysis for the United Kingdom. The Economic Journal, 105, 1505−1518.
Lall, S., & Abaladejo, M. (2004). China's competitive performance: A threat to East Asian manufactured exports? WorldDevelopment, 32(9), 1441−1446.
Lall, S., Abaladejo, M., & Zhang, J. (2004, February). Mapping fragmentation: Electronics and automobiles in East Asiaand Latin America. QEH working paper series, vol. 115.
Lemoine, F., & Ünal-Kesenci, D. (2004). Assembly trade and technology transfer: The case of China.World Development,32(5), 829−850.
OECD (2005, September). China. Economic Surveys, 2005/13.Shafaeddin, S. M. (2004). Is China accession to WTO threatening exports of developing countries? China Economic
Review, 15(2), 109−144.Steinfeld, E. D. (2004). Chinese enterprise development and the challenge of global integration. In S. Yusuf (Ed.), Global
production networking and technological change in East Asia. Washington DC: The World Bank.Studwell, J. (2005). Multinational profits: Let me down slow. China Economic Quartely, 9(Q4), 52−60.Sturgeon, T. J., & Leister, R. K. (2004). The new global supply base: New challenges for local suppliers in East Asia. In S.
Yusuf (Ed.), Global production networking and technological change in East Asia.Washington DC: The World Bank.Weiss, J. (2004, August). Peoples' Republic of China and its neighbours: Partners or competitors for trade and
investment? ADBI research paper series, vol. 59.Yusuf, S., Altaf, M. A., & Nabeshima, K. (Eds.). (2004). Global production networking and technological change in
East Asia. Washington, DC: The World Bank.


![THE PUNJAB REORGANISATION ACT, 1966 ......5 THE PUNJAB REORGANISATION ACT, 1966 ACT NO. 31 OF 1966 [18th September, 1966.] An Act to provide for the reorganisation of the existing](https://static.fdocuments.in/doc/165x107/6108d66d9c3ce0590d229f6d/the-punjab-reorganisation-act-1966-5-the-punjab-reorganisation-act-1966.jpg)