China’s Evolving Managed Float - Serving the Second ... · China’s Evolving Managed Float: An...
30
This paper presents preliminary findings and is being distributed to economists and other interested readers solely to stimulate discussion and elicit comments. The views expressed in this paper are those of the author and do not necessarily reflect the position of the Federal Reserve Bank of New York or the Federal Reserve System. Any errors or omissions are the responsibility of the author. Federal Reserve Bank of New York Staff Reports China’s Evolving Managed Float: An Exploration of the Roles of the Fix and Broad Dollar Movements in Explaining Daily Exchange Rate Changes John Clark Staff Report No. 828 November 2017
Transcript of China’s Evolving Managed Float - Serving the Second ... · China’s Evolving Managed Float: An...

This paper presents preliminary findings and is being distributed to economists
and other interested readers solely to stimulate discussion and elicit comments.
The views expressed in this paper are those of the author and do not necessarily
reflect the position of the Federal Reserve Bank of New York or the Federal
Reserve System. Any errors or omissions are the responsibility of the author.
Federal Reserve Bank of New York
Staff Reports
China’s Evolving Managed Float:
An Exploration of the Roles of the Fix and
Broad Dollar Movements in Explaining Daily
Exchange Rate Changes
John Clark
Staff Report No. 828
November 2017
China’s Evolving Managed Float: An Exploration of the Roles of the Fix and Broad Dollar
Movements in Explaining Daily Exchange Rate Changes
John Clark
Federal Reserve Bank of New York Staff Reports, no.828
November 2017
JEL classification: F3, F31, F33, G15, O16
Abstract
We investigate the drivers of daily changes in the exchange value of the Chinese currency (CNY)
since early 2016, when a new regime was introduced for setting the fix—the midpoint of the
CNY’s daily trading range against the U.S. dollar. Daily changes in the fix, which is announced
just prior to the onset of onshore trading, are shown to be highly predictable and very responsive
to the change in the CNY/USD rate during the previous day’s onshore trading session and to
changes in dollar cross rates. While highly predictable, the fix is shown to have uneven predictive
power for the subsequent evolution of the currency’s exchange value. Daily changes in the
closing value of the exchange rate have centered on the changes implied by the fix to a much
greater extent in months with higher intervention intensity, but less over the course of 2017, as
intervention has waned. We document ways in which the short-run behavior of the CNY/USD
exchange rate has evolved to more closely resemble behavior generally observed in freely
floating currencies, even as the CNY continues to exhibit unusually low daily volatility. On days
of broad dollar strengthening, the CNY is found to depreciate against the dollar but appreciate
against the CFETS index, the authorities’ main reference basket; the CNY now typically
appreciates less than half as much as previously, when the currency was being managed primarily
against the dollar.
Key words: Chinese currency, Chinese yuan, CNY, exchange rate regime, currency policy,
flexible exchange rate, intervention, financial development
_________________
Clark: Federal Reserve Bank of New York (email: [email protected]). This paper presents preliminary findings and is being distributed to interested readers solely to stimulate discussion and elicit comments. The views expressed in this paper are those of the author and do not necessarily reflect the position of the Federal Reserve Bank of New York or the Federal Reserve System.

1
I. Introduction and overview
Market concerns about Chinese currency policy have declined substantially since roiling global markets
in August 2015 and early 2016, notwithstanding further notable depreciation of the Chinese yuan (CNY)
over the course of 2016. Many market participants have traced the reduced unease in part to the
authorities’ shift to a more predictable framework for setting the daily fixing rate; the fixing rate serves
as the mid-point of the currency’s daily trading range and is announced just prior to the start of the
onshore trading session. But suggestions that the fix has played a key stabilizing role appear
incomplete, given that they presume that the fix itself dampens volatility and guides where the CNY
trades subsequently.
Surprisingly, the recent trading day behavior of the CNY has been little studied, notwithstanding clear
signs both of active management by the authorities, and an important role for market forces. We help
fill this gap by investigating the performance of the CNY since February 2016, focusing on the role of the
daily fix, dollar cross-rates, overnight trading in the offshore market, and intervention in influencing the
evolution of the bilateral and multilateral exchange value of the currency.
Regarding the fix, we show that about 95 percent of its daily variation can be predicted from a simple
empirical model using changes in an index of dollar cross rates (e.g. EUR/USD, JPY/USD, etc, with
weights taken from the authorities’ main reference index), and changes in the CNY/USD exchange rate
during the previous official trading day. We also document several shifts over the past year in the
degree of passthrough of prior-day CNY/USD changes, including since mid-May 2017, when a so-called
“countercyclical” element was introduced, and the passthrough declined notably. Our estimated
parameters suggest that, by design, the fix plays at best a modest role in stabilizing the CNY’s value
against the dollar and the authorities’ reference currency basket. This is because the fix passes through
most, if not all, of the changes in the bilateral CNY/USD exchange rate during the prior trading day, and
introduces only partial offsets for the impact of changes in dollar cross rates on the currency’s
multilateral value.
We then turn to investigating the degree to which daily changes in the fix appear to guide changes in the
value of the CNY during the ensuing trading day. We propose a specific measure of “centering” and find
that daily changes in the CNY closing price do not fully center on the changes implied by the fix, though
they do take directional cues. In contrast, we find that the daily change in the CNY close does fully
center on the change between the previous day’s closing price and the onshore market’s open. We also
2
find that the daily changes in the CNY center more closely around the fix during months with high
intervention. Our results suggest that waning intervention over the course of 2017 may help explain
why the fix has had much less predictive power in the latter part of our sample period.
To shed light on the CNY’s incomplete centering on the fix, we explore the sensitivity of daily changes in
the closing prices of CNY/USD exchange rate to the variables that predict changes in the fix, as well as to
contemporaneous changes in dollar cross rates during official trading hours and overnight developments
in the offshore CNH market. We find that daily changes in the CNY/USD closing price are generally much
less sensitive than the fix to the variables that explain changes in the fix, with the notable exception of
overnight changes in dollar cross rates. Of note, we find little evidence that the May 2017 introduction
of a “countercyclical element” to the daily fix, apparently calibrated to lean against or partially reverse
prior day CNY changes, has translated into similar changes in the behavior of the exchange rate. We
also find that surprise deviations of the fix from our empirical model have limited predictive power for
changes in the CNY during the ensuing trading day. This latter result appears inconsistent with the view
often expressed by market commentators that surprises in the fix provide important signals that
influence subsequent exchange rate changes.
We find that the CNY now responds systematically to short-term broad dollar movements, an important
goal of the new fixing regime. Our estimated coefficients suggest that, on days when the dollar broadly
strengthens, the currency now typically weakens against the dollar, but appreciates vis-à-vis the
authorities’ main reference basket (the CFETS index), though by less than half as much as when the
currency was being managed bilaterally against the dollar.
Our results also document several ways in which daily changes in the CNY have evolved to more closely
resemble the near random walk behavior typically seen in floating rate currencies. More recently, daily
CNY changes do not appear to be correlated with lagged changes in dollar cross rates or the CNY/USD
rate; daily changes in the CNY persist over time; and official intervention diminished substantially over
the course of 2017. But the CNY’s daily volatility against the dollar remains unusually low, compared to
the currencies of most advanced economies and other large emerging market economies.
We interpret our results as pointing more to the authorities’ active dampening of volatility in the
exchange rate during the trading day, rather than the fix, as the key factor in calming markets since early
2016. By avoiding sudden moves that could upset markets, the authorities found space to allow more

3
substantial market-driven and/or policy-driven adjustment over longer horizons, both against the dollar
and the authorities’ reference basket.
II. Recent evolution of China’s currency regime
Over the past two years, China’s approach to exchange rate management has evolved significantly,
moving from a de facto crawling peg against the dollar with gradually widening bands, to a managed
float referencing a currency basket. Key steps in the recent evolution have not always been well
explained. As a result, some developments triggered surges in global market volatility in mid-2015 and
early-2016, reflecting concerns about China’s outlook, and its potentially significant impact on global
trade and output. However, communication has improved since February 2016, and market participants
have often cited the predictability of the post-February fix regime as a contributor to the reduction in
volatility in Chinese and global markets since early 2016.
For context, between mid-2005 and mid-2015, the Chinese authorities alternated between periods of
gradual, but not entirely steady appreciation of the daily fixing rate against the US dollar, and periods of
holding the fixing rate relatively stable (Chart 1). Under this approach, the currency could at times
persistently trade near the strong or weak side of a gradually widening trading band, requiring the
central bank to engage in large scale intervention to maintain the currency within the target range.
On August 11, 2015, the Chinese authorities took a notable step toward making the currency regime
more flexible: they announced that going forward the daily fixing rate would be set with reference to

4
the previous day’s closing level. In principle, the new rules implied that the CNY could depreciate as
much as 10 percent against the dollar in a week. But in practice, the authorities intervened heavily in
response to an upsurge in volatility and accelerating capital outflows following the August policy change
announcement. As a result, after an initial adjustment, the exchange value of the CNY against the dollar
traded in relatively narrow range from mid-August into October.
Another important step was taken in December 2015, when the authorities announced and began to
regularly publish a new official effective exchange rate index (the CFETS Index), which they said “should
help bring about a shift” in how market participants viewed the exchange rate. The announcement was
generally interpreted by market participants as signaling the authorities’ intention to manage the
exchange rate more actively against this new index going forward.1 But the operational implications
were not explained nor understood at the time. When the CNY subsequently began to depreciate at an
accelerating pace in December 2015 and early 2016, against a backdrop of broad dollar strength,
Chinese and global market volatility spiked. Market participants feared that the Chinese authorities
were countenancing or perhaps even pursuing a substantial weakening of the currency.
In an effort to calm markets, the Chinese authorities again resorted to heavy intervention in January and
early February 2016 to stabilize the dollar-yuan exchange rate. In addition, they took steps, most
notably in mid-February 2016, to explain more fully how they expected the new exchange rate regime to
function, and to reassure local and foreign investors that they were neither targeting, nor expecting
further substantial depreciation. Subsequently, the authorities provided detailed guidance to market
participants regarding how the fixing rate should evolve in relation to developments in the CNY/USD
exchange rate and dollar cross-rates during the prior trading day and overnight, enhancing the
predictability of the process. As it became clear that the new approach to setting the fix was being
implemented in line with the authorities’ guidance, market participants began to cite the predictable
approach as an important stabilizing factor in Chinese and global markets.
1 It had already been announced, on August 11, 2015, when the new fixing regime was introduced, that the fixing rates would also “take into account” exchange rate movements among the major currencies. However, before December 2015, it was not clear that any material adjustments for cross rate developments were in fact being made. Of note, over the previous decade, the authorities had characterized the de facto crawling peg regime as a “managed floating exchange rate based on market supply and demand with reference to a basket of currencies,” though the basket was never specified and there was no significant relationship between short-term cross-rate movements and changes in the dollar exchange rate.
5
III. The mechanics and role of the daily USD/CNY fix
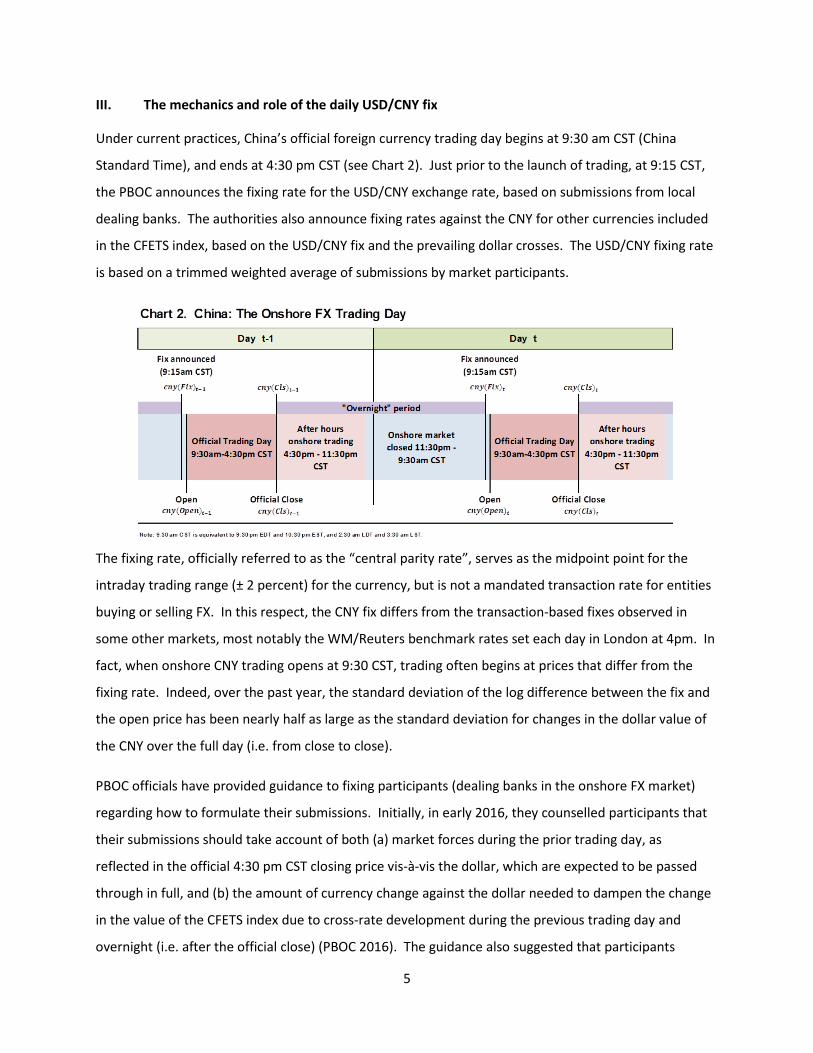
Under current practices, China’s official foreign currency trading day begins at 9:30 am CST (China
Standard Time), and ends at 4:30 pm CST (see Chart 2). Just prior to the launch of trading, at 9:15 CST,
the PBOC announces the fixing rate for the USD/CNY exchange rate, based on submissions from local
dealing banks. The authorities also announce fixing rates against the CNY for other currencies included
in the CFETS index, based on the USD/CNY fix and the prevailing dollar crosses. The USD/CNY fixing rate
is based on a trimmed weighted average of submissions by market participants.
The fixing rate, officially referred to as the “central parity rate”, serves as the midpoint point for the
intraday trading range (± 2 percent) for the currency, but is not a mandated transaction rate for entities
buying or selling FX. In this respect, the CNY fix differs from the transaction-based fixes observed in
some other markets, most notably the WM/Reuters benchmark rates set each day in London at 4pm. In
fact, when onshore CNY trading opens at 9:30 CST, trading often begins at prices that differ from the
fixing rate. Indeed, over the past year, the standard deviation of the log difference between the fix and
the open price has been nearly half as large as the standard deviation for changes in the dollar value of
the CNY over the full day (i.e. from close to close).
PBOC officials have provided guidance to fixing participants (dealing banks in the onshore FX market)
regarding how to formulate their submissions. Initially, in early 2016, they counselled participants that
their submissions should take account of both (a) market forces during the prior trading day, as
reflected in the official 4:30 pm CST closing price vis-à-vis the dollar, which are expected to be passed
through in full, and (b) the amount of currency change against the dollar needed to dampen the change
in the value of the CFETS index due to cross-rate development during the previous trading day and
overnight (i.e. after the official close) (PBOC 2016). The guidance also suggested that participants

6
consider changes in other reference indices (such as the SDR basket and the BIS’ effective exchange rate
index), but didn’t suggest specific weights.
Of note, while the onshore market officially closes at 4:30 pm CST, the onshore trading system remains
open until 11:30 pm CST. However, onshore liquidity declines markedly after the official close and the
authorities have instructed market participants to only take into account onshore developments up to
the official close of the prior day in setting their submissions for a given day’s fix.
The authorities announced a modification to their guidance about one year later, over the weekend of
February 18-19, 2017, counseling fix participants to only seek to offset cross-rate developments (i.e.
between the dollar and other currencies, excluding the CNY), that take place overnight, between the
official close of the previous trading day and 7:30 am CST. Most recently, on May 26, the authorities
indicated publicly that they were “considering” changing the fixing mechanism yet again, to include an
undefined “countercyclical mechanism”. The addition of a countercyclical mechanism was confirmed in
the PBOC’s Q2 2017 Monetary Policy Report (PBOC 2017). Many market participants perceive that the
introduction of countercyclical adjustments may have slightly preceded the May 26 announcement,
based on the behavior of the fix earlier in the month (Peng and Wang, 2017). While the countercyclical
mechanism has not been explicitly explained, the general view among market commentators has been
that it has entailed both increased discretion and a systematic effort to lean against changes in the
CNY/USD exchange rate during the prior trading day.
IV. The CFETS Index and the “CFETS-weighted Dollar-Cross Index”
The authorities’ main reference index, the CFETS index, was first announced in December 2015. It is a
geometrically weighted index of the foreign currency cost of the CNY. Initially, 13 currencies were
included in the index, comprised of all the currencies included in the CFETS automated system at that
time; the basket was expanded to 24 currencies at the end of 2016, incorporating additional currencies
that had been added to the CFETS system over the course of 2016.
As shown algebraically in Annex 1, the CFETS index equivalently can be calculated as the product of the
USD cost of the CNY (𝐶𝐶𝐶𝐶𝐶𝐶/𝑈𝑈𝑈𝑈𝑈𝑈), relative to the base period, and a weighted dollar-cross index
(DolCross) of the cost of the dollar in the other currencies in the CFETS basket (using the CFETS index
weights). Representing the CFETS as the product of the bilateral CNY/USD rate and CFETS-weighted
dollar-cross index is useful for examining the contribution of these two factors to changes in the nominal
7
effective exchange rate, as measured by the CFETS index. Putting things in terms of log changes we
have that over any window:
∆ ln(𝐶𝐶𝐶𝐶𝐶𝐶𝐶𝐶𝑈𝑈) = ∆ ln(𝑈𝑈𝐷𝐷𝐷𝐷𝐶𝐶𝐷𝐷𝐷𝐷𝐷𝐷𝐷𝐷) + ∆ ln(𝐶𝐶𝐶𝐶𝐶𝐶𝑈𝑈𝑈𝑈𝑈𝑈)
This equation implies that to keep the CFETS index unchanged over any window, the CNY would need to
depreciate against the dollar by the same magnitude that the dollar appreciates against the weighted
dollar-cross index, and vice versa.2
V. An empirical model of the CNY fix
The Chinese authorities’ published guidance on how the daily fix is set makes reference to incorporating
changes in CNY/USD rate during the preceding trading day, and setting the fix to offset changes in the
dollar cross rates that would change the level of the CFETS index. Accordingly, in our empirical model,
we regress the daily log change in the fix (from fix-to-fix) on the daily log change in the CFETS-weighted
dollar-cross index (from fix-to-fix), and the daily log change in the CNY/USD exchange rate (from close-
to-close). In both cases we distinguish between the “overnight” period, changes from one day’s official
close to the next day’s fix, and the “onshore trading day” period, from the fix to that day’s close:
ln � 𝑐𝑐𝑐𝑐𝑐𝑐(𝐹𝐹𝐹𝐹𝐹𝐹)𝑡𝑡𝑐𝑐𝑐𝑐𝑐𝑐(𝐹𝐹𝐹𝐹𝐹𝐹)𝑡𝑡−1
� = 𝐶𝐶+ 𝛽𝛽1 ∙ 𝐷𝐷𝑙𝑙 �𝐷𝐷𝐷𝐷𝐷𝐷𝐷𝐷𝐷𝐷𝐷𝐷𝐷𝐷𝐷𝐷(𝐹𝐹𝐹𝐹𝐹𝐹)𝑡𝑡𝐷𝐷𝐷𝐷𝐷𝐷𝐷𝐷𝐷𝐷𝐷𝐷𝐷𝐷𝐷𝐷(𝐷𝐷𝐷𝐷𝐷𝐷)𝑡𝑡−1
� + 𝛽𝛽2 ∙ 𝐷𝐷𝑙𝑙 �𝐷𝐷𝐷𝐷𝐷𝐷𝐷𝐷𝐷𝐷𝐷𝐷𝐷𝐷𝐷𝐷(𝐷𝐷𝐷𝐷𝐷𝐷)𝑡𝑡−1𝐷𝐷𝐷𝐷𝐷𝐷𝐷𝐷𝐷𝐷𝐷𝐷𝐷𝐷𝐷𝐷(𝐹𝐹𝐹𝐹𝐹𝐹)𝑡𝑡−1
�
+ 𝛽𝛽3 ∙ 𝐷𝐷𝑙𝑙 �𝑐𝑐𝑐𝑐𝑐𝑐(𝐷𝐷𝐷𝐷𝐷𝐷)𝑡𝑡−1𝑐𝑐𝑐𝑐𝑐𝑐(𝐹𝐹𝐹𝐹𝐹𝐹)𝑡𝑡−1
� + 𝛽𝛽4 ∙ ln �𝑐𝑐𝑐𝑐𝑐𝑐(𝐹𝐹𝐹𝐹𝐹𝐹)𝑡𝑡−1𝑐𝑐𝑐𝑐𝑐𝑐(𝐷𝐷𝐷𝐷𝐷𝐷)𝑡𝑡−2
� + 𝜀𝜀𝑡𝑡 (1)
where 𝑐𝑐𝑙𝑙𝑐𝑐(𝐶𝐶𝐹𝐹𝐹𝐹)𝑡𝑡 is the fixing price of the Chinese yuan (CNY) in US dollars on trading day t, 𝑐𝑐𝑙𝑙𝑐𝑐(𝐶𝐶𝐷𝐷𝐷𝐷)𝑡𝑡 is
the 4:30 closing price of the CNY in US dollars on trading day t, and 𝑈𝑈𝐷𝐷𝐷𝐷𝐶𝐶𝐷𝐷𝐷𝐷𝐷𝐷𝐷𝐷(𝐶𝐶𝐹𝐹𝐹𝐹)𝑡𝑡 and
𝑈𝑈𝐷𝐷𝐷𝐷𝐶𝐶𝐷𝐷𝐷𝐷𝐷𝐷𝐷𝐷(𝐶𝐶𝐷𝐷𝐷𝐷)𝑡𝑡 are the values of the CFETS-weighted dollar-cross indexes measured using dollar
crosses at the fix (9:15 am CST) and close (4:30 pm CST) respectively, on trading day t.3 For
2 The weights in the CFETS-weighted dollar-cross index do not sum to one. This reflects the fact that CFETS weights sum to one, but the dollar is not included in the dollar-cross index. An implication is that the CFETS-weighted dollar cross index, by construction, will have less volatility than an index where the weights for the included series are scaled up to sum to one. For example, if all the dollar crosses were to rise by an equivalent x percent, the CFETS-weighted dollar-cross index would rise by the product of the aggregate weights (i.e. one minus the dollar’s weight in the CFETS basket) and x percent. 3 Note that we get almost identical results if instead we place the fix-vs-prior close differential on the left hand
side. Subtracting 𝐷𝐷𝑙𝑙 �𝑐𝑐𝑐𝑐𝑐𝑐(𝐷𝐷𝐷𝐷𝐷𝐷)𝑡𝑡−1𝑐𝑐𝑐𝑐𝑐𝑐(𝐹𝐹𝐹𝐹𝐹𝐹)𝑡𝑡−1
� from both sides of equation (1), and rearranging we get:
8
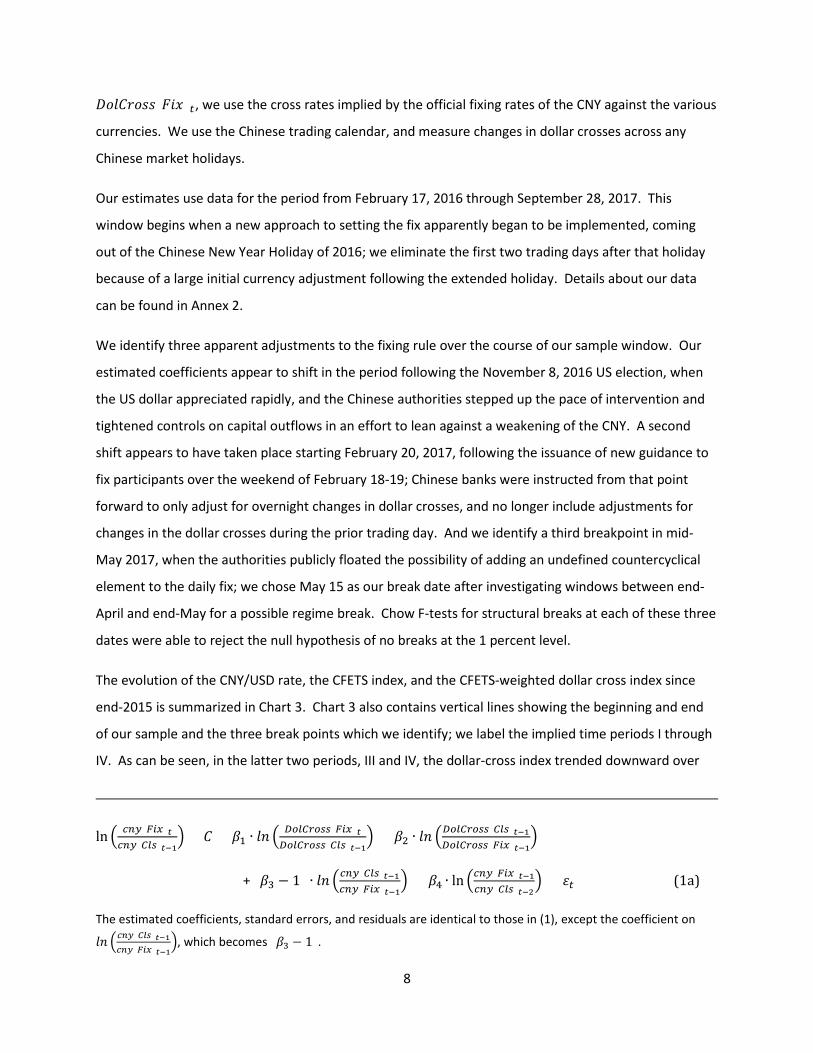
𝑈𝑈𝐷𝐷𝐷𝐷𝐶𝐶𝐷𝐷𝐷𝐷𝐷𝐷𝐷𝐷(𝐶𝐶𝐹𝐹𝐹𝐹)𝑡𝑡, we use the cross rates implied by the official fixing rates of the CNY against the various
currencies. We use the Chinese trading calendar, and measure changes in dollar crosses across any
Chinese market holidays.
Our estimates use data for the period from February 17, 2016 through September 28, 2017. This
window begins when a new approach to setting the fix apparently began to be implemented, coming
out of the Chinese New Year Holiday of 2016; we eliminate the first two trading days after that holiday
because of a large initial currency adjustment following the extended holiday. Details about our data
can be found in Annex 2.
We identify three apparent adjustments to the fixing rule over the course of our sample window. Our
estimated coefficients appear to shift in the period following the November 8, 2016 US election, when
the US dollar appreciated rapidly, and the Chinese authorities stepped up the pace of intervention and
tightened controls on capital outflows in an effort to lean against a weakening of the CNY. A second
shift appears to have taken place starting February 20, 2017, following the issuance of new guidance to
fix participants over the weekend of February 18-19; Chinese banks were instructed from that point
forward to only adjust for overnight changes in dollar crosses, and no longer include adjustments for
changes in the dollar crosses during the prior trading day. And we identify a third breakpoint in mid-
May 2017, when the authorities publicly floated the possibility of adding an undefined countercyclical
element to the daily fix; we chose May 15 as our break date after investigating windows between end-
April and end-May for a possible regime break. Chow F-tests for structural breaks at each of these three
dates were able to reject the null hypothesis of no breaks at the 1 percent level.
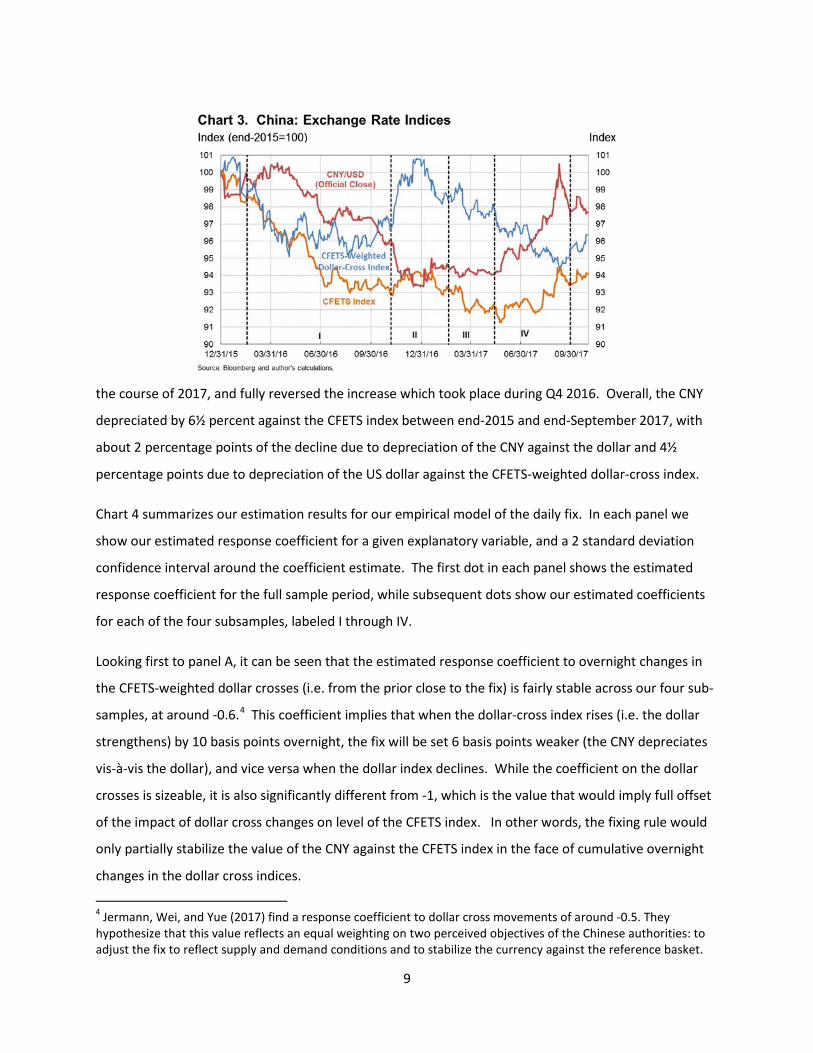
The evolution of the CNY/USD rate, the CFETS index, and the CFETS-weighted dollar cross index since
end-2015 is summarized in Chart 3. Chart 3 also contains vertical lines showing the beginning and end
of our sample and the three break points which we identify; we label the implied time periods I through
IV. As can be seen, in the latter two periods, III and IV, the dollar-cross index trended downward over
ln � 𝑐𝑐𝑐𝑐𝑐𝑐(𝐹𝐹𝐹𝐹𝐹𝐹)𝑡𝑡𝑐𝑐𝑐𝑐𝑐𝑐(𝐷𝐷𝐷𝐷𝐷𝐷)𝑡𝑡−1
� = 𝐶𝐶+ 𝛽𝛽1 ∙ 𝐷𝐷𝑙𝑙 �𝐷𝐷𝐷𝐷𝐷𝐷𝐷𝐷𝐷𝐷𝐷𝐷𝐷𝐷𝐷𝐷(𝐹𝐹𝐹𝐹𝐹𝐹)𝑡𝑡𝐷𝐷𝐷𝐷𝐷𝐷𝐷𝐷𝐷𝐷𝐷𝐷𝐷𝐷𝐷𝐷(𝐷𝐷𝐷𝐷𝐷𝐷)𝑡𝑡−1
� + 𝛽𝛽2 ∙ 𝐷𝐷𝑙𝑙 �𝐷𝐷𝐷𝐷𝐷𝐷𝐷𝐷𝐷𝐷𝐷𝐷𝐷𝐷𝐷𝐷(𝐷𝐷𝐷𝐷𝐷𝐷)𝑡𝑡−1𝐷𝐷𝐷𝐷𝐷𝐷𝐷𝐷𝐷𝐷𝐷𝐷𝐷𝐷𝐷𝐷(𝐹𝐹𝐹𝐹𝐹𝐹)𝑡𝑡−1
�
+ (𝛽𝛽3 − 1) ∙ 𝐷𝐷𝑙𝑙 �𝑐𝑐𝑐𝑐𝑐𝑐(𝐷𝐷𝐷𝐷𝐷𝐷)𝑡𝑡−1𝑐𝑐𝑐𝑐𝑐𝑐(𝐹𝐹𝐹𝐹𝐹𝐹)𝑡𝑡−1
� + 𝛽𝛽4 ∙ ln �𝑐𝑐𝑐𝑐𝑐𝑐(𝐹𝐹𝐹𝐹𝐹𝐹)𝑡𝑡−1𝑐𝑐𝑐𝑐𝑐𝑐(𝐷𝐷𝐷𝐷𝐷𝐷)𝑡𝑡−2
� + 𝜀𝜀𝑡𝑡 (1a)
The estimated coefficients, standard errors, and residuals are identical to those in (1), except the coefficient on
𝐷𝐷𝑙𝑙 �𝑐𝑐𝑐𝑐𝑐𝑐(𝐷𝐷𝐷𝐷𝐷𝐷)𝑡𝑡−1𝑐𝑐𝑐𝑐𝑐𝑐(𝐹𝐹𝐹𝐹𝐹𝐹)𝑡𝑡−1
�, which becomes (𝛽𝛽3 − 1).
9
the course of 2017, and fully reversed the increase which took place during Q4 2016. Overall, the CNY
depreciated by 6½ percent against the CFETS index between end-2015 and end-September 2017, with
about 2 percentage points of the decline due to depreciation of the CNY against the dollar and 4½
percentage points due to depreciation of the US dollar against the CFETS-weighted dollar-cross index.
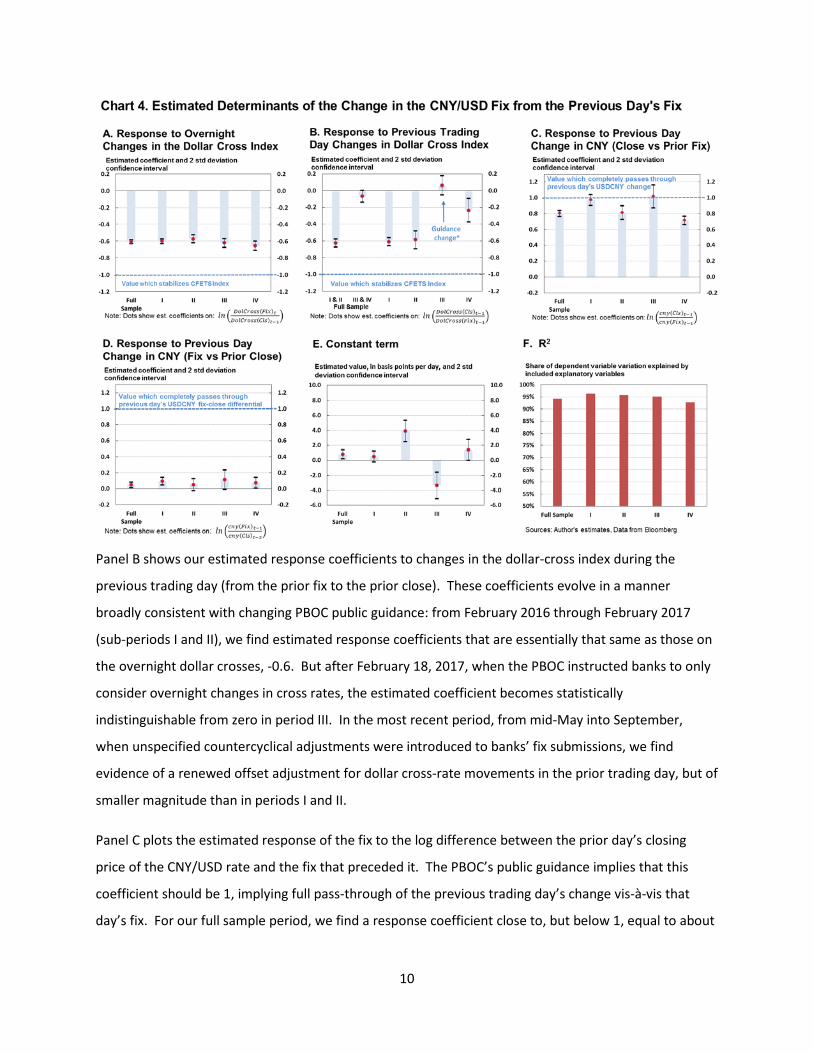
Chart 4 summarizes our estimation results for our empirical model of the daily fix. In each panel we
show our estimated response coefficient for a given explanatory variable, and a 2 standard deviation
confidence interval around the coefficient estimate. The first dot in each panel shows the estimated
response coefficient for the full sample period, while subsequent dots show our estimated coefficients
for each of the four subsamples, labeled I through IV.
Looking first to panel A, it can be seen that the estimated response coefficient to overnight changes in
the CFETS-weighted dollar crosses (i.e. from the prior close to the fix) is fairly stable across our four sub-
samples, at around -0.6.4 This coefficient implies that when the dollar-cross index rises (i.e. the dollar
strengthens) by 10 basis points overnight, the fix will be set 6 basis points weaker (the CNY depreciates
vis-à-vis the dollar), and vice versa when the dollar index declines. While the coefficient on the dollar
crosses is sizeable, it is also significantly different from -1, which is the value that would imply full offset
of the impact of dollar cross changes on level of the CFETS index. In other words, the fixing rule would
only partially stabilize the value of the CNY against the CFETS index in the face of cumulative overnight
changes in the dollar cross indices.
4 Jermann, Wei, and Yue (2017) find a response coefficient to dollar cross movements of around -0.5. They hypothesize that this value reflects an equal weighting on two perceived objectives of the Chinese authorities: to adjust the fix to reflect supply and demand conditions and to stabilize the currency against the reference basket.
10
Panel B shows our estimated response coefficients to changes in the dollar-cross index during the
previous trading day (from the prior fix to the prior close). These coefficients evolve in a manner
broadly consistent with changing PBOC public guidance: from February 2016 through February 2017
(sub-periods I and II), we find estimated response coefficients that are essentially that same as those on
the overnight dollar crosses, -0.6. But after February 18, 2017, when the PBOC instructed banks to only
consider overnight changes in cross rates, the estimated coefficient becomes statistically
indistinguishable from zero in period III. In the most recent period, from mid-May into September,
when unspecified countercyclical adjustments were introduced to banks’ fix submissions, we find
evidence of a renewed offset adjustment for dollar cross-rate movements in the prior trading day, but of
smaller magnitude than in periods I and II.
Panel C plots the estimated response of the fix to the log difference between the prior day’s closing
price of the CNY/USD rate and the fix that preceded it. The PBOC’s public guidance implies that this
coefficient should be 1, implying full pass-through of the previous trading day’s change vis-à-vis that
day’s fix. For our full sample period, we find a response coefficient close to, but below 1, equal to about

11
seven-eighths. This coefficient implies that almost all of a given trading day’s change in the level of the
CNY/USD rate vis-à-vis the previous day’s fix is carried through to the next day’s fix.
Of note, the estimated pass-through coefficient is statistically indistinguishable from 1 in the first and
third subsample periods. However, in the second and fourth subsamples, the pass-through declines to
about 0.8 and 0.7, respectively. The lower pass-through from November to February may have reflected
an effort to dampen currency volatility in the window following the US election, when the dollar was
strengthening broadly, and the CNY tending to depreciate. And the more recent lowering of the pass-
through, since May 15, 2017, likely reflects the impact of the discretionary “countercyclical element”
that was added to the fixing rule around that time.
Panel D plots the response of the fix to the prior day’s deviation of the fix from the previous close. This
element does not feature in the official guidance, but for the sample period as a whole, and several of
the sub-periods, we find a statistically significant response coefficient of around 0.1. This indicates that
in practice there is some small positive serial correlation between changes between the close and the
subsequent fixes on successive days.
Regarding the goodness of fit, as shown in panel F, we find very high R2s for our first three sub-periods:
our simple model accounts for about 95 percent of the daily variation in the fix in each of these periods.
In the last sub-period, since mid-May 2017, the explanatory power of our model of the fix declines to a
still high 92 percent, suggesting a greater role for discretion and/or that we have not fully captured the
contours of the rumored “counter-cyclical element” in the current fixing rule. It is notable however that
we do not find evidence of parameter instability within the window May 15 to September 28, 2017. For
the sample as a whole, when we allow the coefficient on the previous day’s dollar crosses to differ
before and after February 18, 2017, in accordance with the published guidance, our R2 exceeds 94
percent.
It is important to recognize that while we have shown that the fix became very predictable (given
information about the prior trading session and overnight cross rates), our estimated coefficients imply
that this post-February 2016 approach to setting the fix would by itself do little to dampen volatility in
the currency. This is because the fixing rule is calibrated to pass through most to all of the previous
day’s changes in the CNY’s dollar value. Hence, large trading day changes lead immediately to large
changes in the subsequent fix. And as we have shown, while the fix did introduce some offsets for dollar
cross changes, these were only partial (60 percent for overnight changes), and therefore sufficient to

12
only dampen, but not prevent multilateral appreciation if the dollar strengthened broadly and on a
sustained basis. Indeed, the CNY depreciated significantly against both the dollar and the CFETS index
over the course of 2016, as shown in Chart 3. Moreover, there is also the question of the extent to
which the fix actually guides behavior of the exchange rate, a question we turn to next.
VI. Do daily changes in the CNY center around the fix?
As noted earlier in Section III, the CNY need not, and in fact does not always open at the same level as
the fix. Moreover, the CNY can trade as much as 2 percent stronger or weaker than the fix in the
ensuing trading session. So this naturally begs the question of whether the fix provides much of a guide
to the exchange rate’s behavior during the subsequent trading session. This is especially important for
the multi-day trajectory of the exchange rate, because, as shown above, the fix largely passes through
movements in the CNY/USD exchange rate during the trading day to the next day’s fix.
Whether changes in the CNY during the ensuing trading day center on the fix depends on:
(a) the degree to which the fix approximates an equilibrium starting point for the day’s trading, and/or
(b) the degree to which the fix signals an actual or perceived target around which the authorities guide
the exchange rate through intervention or other means. On the latter point, China’s authorities have
engaged in sizeable intervention in 2016 and early 2017 to guide and dampen movements in the
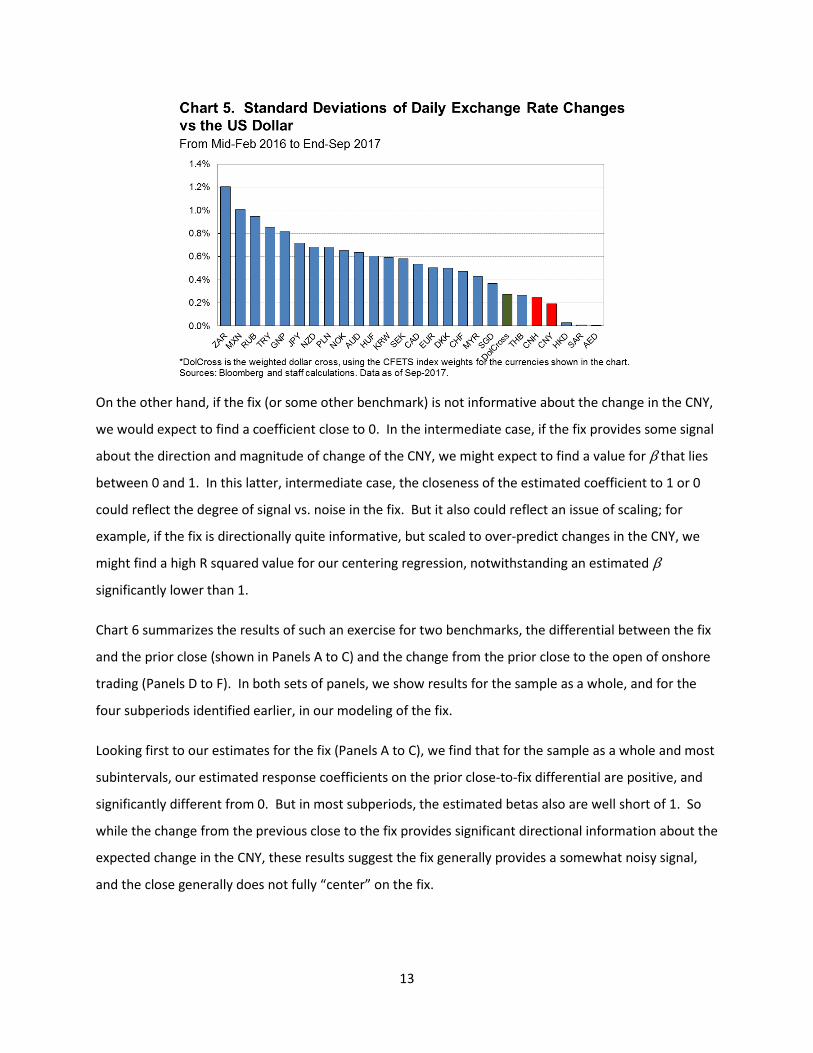
exchange rate, for example, by selling some $440 billion in reserves in 2016.5 Indeed, as shown in Chart
5, the CNY has been much less volatile than the more freely floating currencies included in its reference
basket.
For our purposes, we say that the daily change in the CNY/USD exchange rate “centers” on the CNY/USD
fix (or some other benchmark, such as the opening price) if, when we regress the change in the value of
the CNY between 4:30 pm closes on the differential between the previous close and the 9:15 am fix (or
the alternative benchmark), we find an estimated coefficient (β ) that is close to 1, such that we cannot
reject the hypothesis that it is equal to 1.6
ln � 𝑐𝑐𝑐𝑐𝑐𝑐(𝐷𝐷𝐷𝐷𝐷𝐷)𝑡𝑡𝑐𝑐𝑐𝑐𝑐𝑐(𝐷𝐷𝐷𝐷𝐷𝐷)𝑡𝑡−1
� = 𝐶𝐶+ 𝛽𝛽 ∙ 𝐷𝐷𝑙𝑙 � 𝑐𝑐𝑐𝑐𝑐𝑐(𝐹𝐹𝐹𝐹𝐹𝐹)𝑡𝑡𝑐𝑐𝑐𝑐𝑐𝑐(𝐷𝐷𝐷𝐷𝐷𝐷)𝑡𝑡−1
� + 𝜀𝜀𝑡𝑡 (2)
5 Based on the reported annual change in reserves in the official balance of payments statistics. 6 For a variable which follows a random walk, it can be shown that its change over any interval is centered on its change from the start of the interval to any point in time within the interval.
13
On the other hand, if the fix (or some other benchmark) is not informative about the change in the CNY,
we would expect to find a coefficient close to 0. In the intermediate case, if the fix provides some signal
about the direction and magnitude of change of the CNY, we might expect to find a value for β that lies
between 0 and 1. In this latter, intermediate case, the closeness of the estimated coefficient to 1 or 0
could reflect the degree of signal vs. noise in the fix. But it also could reflect an issue of scaling; for
example, if the fix is directionally quite informative, but scaled to over-predict changes in the CNY, we
might find a high R squared value for our centering regression, notwithstanding an estimated β
significantly lower than 1.
Chart 6 summarizes the results of such an exercise for two benchmarks, the differential between the fix
and the prior close (shown in Panels A to C) and the change from the prior close to the open of onshore
trading (Panels D to F). In both sets of panels, we show results for the sample as a whole, and for the
four subperiods identified earlier, in our modeling of the fix.
Looking first to our estimates for the fix (Panels A to C), we find that for the sample as a whole and most
subintervals, our estimated response coefficients on the prior close-to-fix differential are positive, and
significantly different from 0. But in most subperiods, the estimated betas also are well short of 1. So
while the change from the previous close to the fix provides significant directional information about the
expected change in the CNY, these results suggest the fix generally provides a somewhat noisy signal,
and the close generally does not fully “center” on the fix.

14
In contrast, as shown in panels D to F, we find that the daily close has more consistently centered on the
open, or more precisely that the one day change in the close centers on the change from the previous
close to the open for that day. For the sample period as a whole, and for all but fourth subperiod, the
estimated coefficients on the prior close-to-open change lies within a two standard deviation confidence
interval that includes the value of 1; hence, expect in subperiod IV, we are unable to reject the
hypothesis that our estimated betas are equal to 1. Moreover, comparing panels C and F, the
proportion of the daily variation in the CNY explained by the open vs prior close differential (i.e. the R
squared from these regressions) is notably higher, by some 20 percentage points for the full sample,
than the proportion explained by the differential between the fix and prior close and the fix.
VII. Does intervention intensity explain the degree of CNY centering around the fix?
Turning back to Panels A to C in Chart 6, it is notable that in the second subperiod, from early November
through the first half of February, we find a greater degree of centering on the fix, with a point estimate
for β close to, but slightly below 1. Also, as we noted, the explanatory value of the fix (R2) declines
markedly in the fourth subperiod, the period from May 12 to September 28, 2017.
15
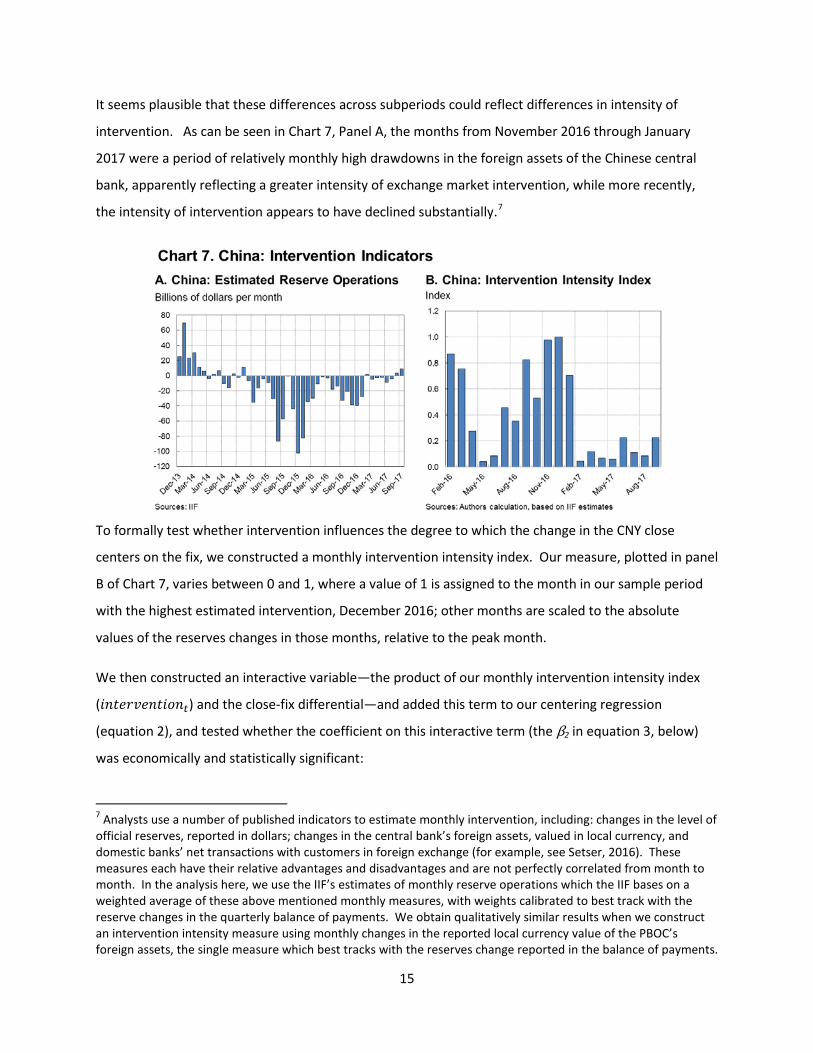
It seems plausible that these differences across subperiods could reflect differences in intensity of
intervention. As can be seen in Chart 7, Panel A, the months from November 2016 through January
2017 were a period of relatively monthly high drawdowns in the foreign assets of the Chinese central
bank, apparently reflecting a greater intensity of exchange market intervention, while more recently,
the intensity of intervention appears to have declined substantially.7
To formally test whether intervention influences the degree to which the change in the CNY close
centers on the fix, we constructed a monthly intervention intensity index. Our measure, plotted in panel
B of Chart 7, varies between 0 and 1, where a value of 1 is assigned to the month in our sample period
with the highest estimated intervention, December 2016; other months are scaled to the absolute
values of the reserves changes in those months, relative to the peak month.
We then constructed an interactive variable—the product of our monthly intervention intensity index
(𝐹𝐹𝑙𝑙𝑖𝑖𝑖𝑖𝐷𝐷𝑖𝑖𝑖𝑖𝑙𝑙𝑖𝑖𝐹𝐹𝐷𝐷𝑙𝑙𝑡𝑡) and the close-fix differential—and added this term to our centering regression
(equation 2), and tested whether the coefficient on this interactive term (the β2 in equation 3, below)
was economically and statistically significant:
7 Analysts use a number of published indicators to estimate monthly intervention, including: changes in the level of official reserves, reported in dollars; changes in the central bank’s foreign assets, valued in local currency, and domestic banks’ net transactions with customers in foreign exchange (for example, see Setser, 2016). These measures each have their relative advantages and disadvantages and are not perfectly correlated from month to month. In the analysis here, we use the IIF’s estimates of monthly reserve operations which the IIF bases on a weighted average of these above mentioned monthly measures, with weights calibrated to best track with the reserve changes in the quarterly balance of payments. We obtain qualitatively similar results when we construct an intervention intensity measure using monthly changes in the reported local currency value of the PBOC’s foreign assets, the single measure which best tracks with the reserves change reported in the balance of payments.

16
ln � 𝑐𝑐𝑐𝑐𝑐𝑐(𝐷𝐷𝐷𝐷𝐷𝐷)𝑡𝑡𝑐𝑐𝑐𝑐𝑐𝑐(𝐷𝐷𝐷𝐷𝐷𝐷)𝑡𝑡−1
� = 𝐶𝐶+ 𝛽𝛽1 ∙ 𝐷𝐷𝑙𝑙 �𝑐𝑐𝑐𝑐𝑐𝑐(𝐹𝐹𝐹𝐹𝐹𝐹)𝑡𝑡𝑐𝑐𝑐𝑐𝑐𝑐(𝐷𝐷𝐷𝐷𝐷𝐷)𝑡𝑡−1
�+ 𝛽𝛽2 ∙ 𝐹𝐹𝑙𝑙𝑖𝑖𝑖𝑖𝐷𝐷𝑖𝑖𝑖𝑖𝑙𝑙𝑖𝑖𝐹𝐹𝐷𝐷𝑙𝑙𝑡𝑡 ∙ 𝐷𝐷𝑙𝑙 �𝑐𝑐𝑐𝑐𝑐𝑐(𝐹𝐹𝐹𝐹𝐹𝐹)𝑡𝑡𝑐𝑐𝑐𝑐𝑐𝑐(𝐷𝐷𝐷𝐷𝐷𝐷)𝑡𝑡−1
� + 𝜀𝜀𝑡𝑡 (3)
As can be seen in Chart 8, we indeed find an economically and statistically significant coefficient (β2) on
our interactive intervention term. In panel B, we plot the implied total response coefficient each month,
reflecting the sum of our estimated β1 and our intervention intensity measure multiplied by β2. These
results suggest that the CNY nearly centered on the fix in months with high intervention intensity, such
as December 2016; but the fix did not fully center on the close in months with low intervention
intensity, as has been the case for much of 2017.
We also considered the possibility that daily changes in the CNY/USD rate (from close to close) might
center on more on overnight changes in the offshore CNH market, rather than the fix vs prior close,
especially during periods of relatively low intervention. Offshore trading in CNH continues throughout
the day, in Hong Kong and other financial centers, even while the onshore CNY market is closed. While
capital controls impede full arbitrage, the CNH/USD and CNY/USD exchange rates demonstrate
considerable co-movement when both markets are open, and the differential between the CNY and CNH
exchange rates has typically traded in a narrow range, reflecting opportunities to arbitrage over time
any persistent differentials through permitted trade and capital account transactions. As a result, it
seems reasonable to hypothesize that overnight trading in the CNH market might anticipate how
overnight developments are expected to influence the CNY during the subsequent onshore trading day.
In Chart 9, we explore the degree to which the close-to-close change in the CNY centers on overnight
changes in the CNH market, that is the change in the CNH from 4:30 pm CST the prior day to 9:00 am
CST (i.e. before the announcement of that day’s fix), as an alternative to the fix vs previous close
differential. In the first row, Panels A to C, we show that that in practice the CNY centers more on a

17
linear combination of the overnight CNH change and the fix-close differential than on one variable or
the other. However, it can also be seen that the relative weights on the CNH change and fix-close
differential vary significantly across subperiods, with the estimated coefficient on the fix-close
differential (Panel A) highest during the subperiod with the highest intervention intensity (subperiod II),
and lowest in subperiod IV, when intervention was apparently low. In contrast, in subperiod IV, we
cannot reject the hypothesis that changes in the CNY fully center on overnight changes in the CNH, and
shown in Panel B.
In Panels D to F, we show the results of adding interactive terms to test whether intervention intensity
could be influencing the shifts, visible in panels A and B, in the relative centering on the close-fix
differential vs. the overnight CNH change. Specifically, we estimate the following equation:
ln � 𝑐𝑐𝑐𝑐𝑐𝑐(𝐷𝐷𝐷𝐷𝐷𝐷)𝑡𝑡𝑐𝑐𝑐𝑐𝑐𝑐(𝐷𝐷𝐷𝐷𝐷𝐷)𝑡𝑡−1
� = 𝐶𝐶+ 𝛽𝛽1 ∙ 𝐷𝐷𝑙𝑙 �𝑐𝑐𝑐𝑐𝑐𝑐(𝐹𝐹𝐹𝐹𝐹𝐹)𝑡𝑡𝑐𝑐𝑐𝑐𝑐𝑐(𝐷𝐷𝐷𝐷𝐷𝐷)𝑡𝑡−1
�+ 𝛽𝛽2 ∙ 𝐹𝐹𝑙𝑙𝑖𝑖𝑖𝑖𝐷𝐷𝑖𝑖𝑖𝑖𝑙𝑙𝑖𝑖𝐹𝐹𝐷𝐷𝑙𝑙𝑡𝑡 ∙ 𝐷𝐷𝑙𝑙 �𝑐𝑐𝑐𝑐𝑐𝑐(𝐹𝐹𝐹𝐹𝐹𝐹)𝑡𝑡𝑐𝑐𝑐𝑐𝑐𝑐(𝐷𝐷𝐷𝐷𝐷𝐷)𝑡𝑡−1
� +
𝛽𝛽3 ∙ 𝐷𝐷𝑙𝑙 �𝑐𝑐𝑐𝑐ℎ(9𝑎𝑎𝑎𝑎)𝑡𝑡𝑐𝑐𝑐𝑐ℎ(𝐷𝐷𝐷𝐷𝐷𝐷)𝑡𝑡−1
� + 𝛽𝛽4 ∙ 𝐹𝐹𝑙𝑙𝑖𝑖𝑖𝑖𝐷𝐷𝑖𝑖𝑖𝑖𝑙𝑙𝑖𝑖𝐹𝐹𝐷𝐷𝑙𝑙𝑡𝑡 ∙ ln � 𝑐𝑐𝑐𝑐ℎ(9𝑎𝑎𝑎𝑎)𝑡𝑡𝑐𝑐𝑐𝑐ℎ(𝐷𝐷𝐷𝐷𝐷𝐷)𝑡𝑡−1
� + 𝜀𝜀𝑡𝑡 (4)
18
where 𝑐𝑐𝑙𝑙ℎ(9𝑎𝑎𝑎𝑎)𝑡𝑡 and 𝑐𝑐𝑙𝑙ℎ(𝐶𝐶𝐷𝐷𝐷𝐷)𝑡𝑡 are the values for the CNH/USD exchange rate at 9:00 am CST and
4:30 pm CST (the official close for the onshore market. and 𝜀𝜀𝑡𝑡 is an error term, reflecting other factors
that determine the change in CNY closing prices.
Our estimation results suggest that the intensity of intervention indeed has played an important role in
determining the extent to which close-to-close CNY changes have centered on the fix vs on overnight
CNH changes. As shown in the bars in panel D, we find a large and statistically significant positive
coefficient on the interactive term between intervention intensity and the differential between the fix
and the previous CNY close. In contrast, we find a economically and statistically significant negative
coefficient on the interactive term between intervention intensity and overnight CNH changes.
As is illustrated in panel E, the coefficients in panel D imply that the responsiveness to the fix vs prior
close differential peaked near the middle of our sample period, but was near zero in recent months,
during the period of “countercyclical” adjustments to the daily fix. In contrast, the combined response
coefficient to overnight changes in the CNH has been quite high in recent months, with point estimates
approaching 0.8.
VIII. Unpacking the differences between the fixing rule and the drivers of the CNY
The results of the previous section begs the question of why the fix doesn’t provide more of a guide to
changes in the CNY center in periods with less intervention. To gain insight, we regressed the log change
in the CNY, from close-to-close, on the various components of our estimated model of the fix.
Specifically, we included as right hand side variables, all of the variables equation (1), including our
empirical estimates of the fix forecast error term. This approach allows us to see whether the variables
that determine the fix, have similar importance and coefficient values for a model of the changes in CNY
closing prices.
Of note, our inclusion of the estimated error terms, that is, our estimates of 𝜀𝜀𝑡𝑡 from equation (1), allows
us to concretely explore whether “surprises” in the fix are consequential for subsequent performance of
the currency. Some market observers have suggested that “surprise” deviations from the fixing rule are
important, as they can be taken as signals of the authorities’ preferences and can have outsized impacts
on subsequent trading.
In addition, we included among our explanatory variables the contemporaneous change in the dollar-
cross index, from the fix to close. Recall that in February 2017, the guidance for fix submissions was
19
changed such that changes in dollar crosses during the previous trading day should no longer be taken
into account in setting the fix. This change likely reflected a view that such adjustments would be
unnecessary because the CNY can respond contemporaneously to changes in the dollar crosses during
the same onshore trading day.
To control for endogeneity, that is, for the possibility that the changes in the CNY/USD exchange rate
cause some of the contemporaneous changes in dollar crosses rather than vice versa, we used an
instrumental variables approach for our estimation. We instrumented the contemporaneous dollar
cross index with a CFETS-weighted index of the USD/EUR, USD/YEN and USD/GBP exchange rates. This
approach presumes that while endogeneity might be an issue for some currencies (such as EM Asian
currencies, which might plausibly be sensitive to contemporaneous changes in the CNY/USD rate), these
three intra-advanced economy exchange rates are independent of contemporaneous changes in the
CNY/USD rate.
Finally, to gauge the impact of possible price discovery in the overnight CNH market, we included a
variable which we call CNH-Resid. CNH-Resid is constructed as the residual from a regression of the
overnight log change in the CNH on the overnight log change in the dollar-cross index. We follow this
approach to facilitate interpretation of the coefficient on the dollar cross index.8
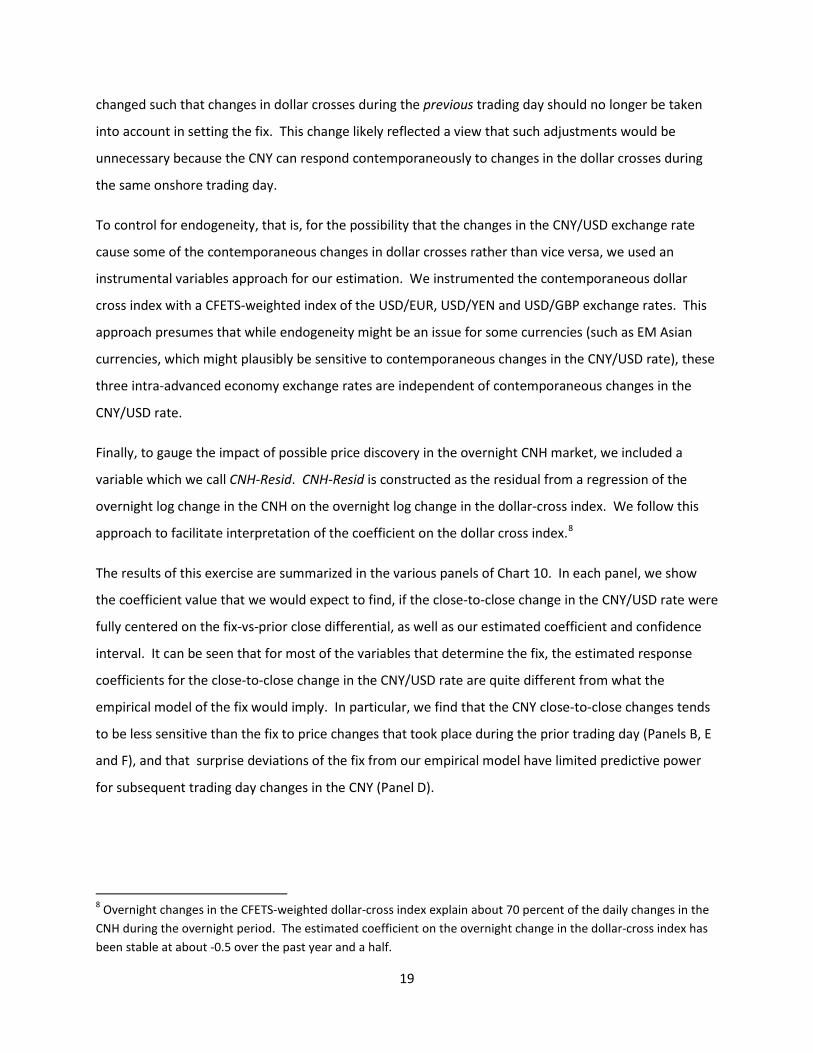
The results of this exercise are summarized in the various panels of Chart 10. In each panel, we show
the coefficient value that we would expect to find, if the close-to-close change in the CNY/USD rate were
fully centered on the fix-vs-prior close differential, as well as our estimated coefficient and confidence
interval. It can be seen that for most of the variables that determine the fix, the estimated response
coefficients for the close-to-close change in the CNY/USD rate are quite different from what the
empirical model of the fix would imply. In particular, we find that the CNY close-to-close changes tends
to be less sensitive than the fix to price changes that took place during the prior trading day (Panels B, E
and F), and that surprise deviations of the fix from our empirical model have limited predictive power
for subsequent trading day changes in the CNY (Panel D).
8 Overnight changes in the CFETS-weighted dollar-cross index explain about 70 percent of the daily changes in the CNH during the overnight period. The estimated coefficient on the overnight change in the dollar-cross index has been stable at about -0.5 over the past year and a half.
20
We find the closest correspondence between the behavior across trading closes and the response
implied by the fix model with regard to overnight changes in the dollar-cross index. As seen in Panel A,
in all four subperiods, we find that overnight changes in the dollar crosses lead to economically and
statistically significant changes in the value of the CNY/USD exchange rate across trading closes. The
estimated impact (our estimated coefficients range between -0.3 and -0.6) is generally somewhat

21
smaller in magnitude than the coefficient in the fixing rule would imply. But our full sample estimate of
-0.47 appears reasonably similar to the -0.6 response coefficient in the estimated fixing rule.
As shown in panel B, the sensitivity of the CNY during the current trading day to changes in dollar
crosses during the prior trading day is well below the coefficient implied by the fixing rule (-0.6) during
periods I and II. This differential largely disappears in subperiod III, when the fixing rule itself no longer
incorporated an adjustment for cross-rate changes during the previous onshore trading day, but then
widens somewhat in subperiod IV, when the countercyclical mechanism appears to have brought back
some sensitivity in the fix to dollar cross change during the previous trading day.
Panel C shows that the sensitivity of the CNY to contemporaneous changes in the dollar crosses (that is,
dollar cross changes during the onshore trading session) increases in magnitude over our sample period,
reaching -0.6 in period IV; in contrast, Panel B shows that the estimated sensitivity of the CNY/USD
change to previous trading day dollar crosses becomes indistinguishable from 0 in periods III and IV.
This shift toward contemporaneous responses could reflect a shift in how the authorities are managing
the currency, to more actively guide it against the current day’s dollar crosses. But given the apparently
modest pace of intervention since February 2017, it seems more plausible that this pattern reflects a
greater willingness to let market forces push the currency weaker (or stronger) on days of broad dollar
strength (or weakness).
Overall, our estimated response coefficients to overnight and contemporaneous changes in the dollar
crosses (-0.5 and -0.6, respectively in period IV) suggest that the CNY would still tend to appreciate vis-à-
vis the authorities’ reference basket (the CFETS index) on days when the dollar strengthens, but by less
than half as much as when the currency was being managed mostly against the dollar, and there was
very little response to changes in dollar crosses.
Panel D shows the estimated response coefficient to the fix forecast error. The results here suggest that
the “surprises” in the fix generally have little explanatory power for explaining or predicting subsequent
changes in the CNY across trading day closes.9 Only during the first sub-period can we reject the
hypothesis that the response to forecast errors is equal to zero, and even then, the coefficient is not
9 The results shown here use the residuals from the fix models estimated for each subperiod. This latter approach assumes that participants know the relevant rule during each period and when the rule changes. This seems reasonable given that fix is said to represent the trimmed weighted average of submissions by domestic dealer banks. When we repeated the exercise with estimated the fix surprises from a single fix model estimated for the entire sample period, we obtained qualitatively similar results.

22
very significant economically, given the small variance of the forecast error (recall that the model
residual accounts for only 5 percent of the daily variance of the fix). This result casts doubt on the
notion that surprises in the fix send a market-moving signal regarding the authorities’ preferences.
The estimated coefficients in panel E and F suggest that the previous day’s differential between the
CNY/USD fix and close generally has little impact on the change in CNY during the current trading day.
This is consistent with the official guidance that the fix should be set with reference to the previous
day’s close, but is not consistent with our estimated models of the fix during periods II and IV. In both of
those two periods, we found that the fix appeared to be set somewhat counter-cyclically, in that the fix
would not fully pass through (i.e., would be set to partially reverse) previous day changes between the
fix and the close, as shown by the orange lines in panel E. In Period II, we do find some evidence that
the CNY closes varied inversely with the previous day’s fix-to-close differential, in line with the estimated
fixing behavior; our estimated response coefficient to the prior day differential is negative, at -0.2,
broadly in line with what would be suggested by the fixing rule. However, we cannot reject at the 10
percent level the null hypothesis that the true response coefficient is zero in this period.
In contrast, in Period IV (since mid-May 2017), we estimate a small positive coefficient on the prior day’s
fix-to- close differential, though again, this estimate is not significantly different from zero at a 10
percent level. This slight evidence of positive serial correlation in daily CNY changes suggests if anything
a degree of procyclicality in the most recent period, which stands in sharp contrast with the
incorporation of a countercyclical element into the fix during this period, shown by the orange line. This
divergence is an important contributor to the weak centering of the daily close-to-close CNY change on
the fix during subperiod IV.
Finally, our estimated coefficients in Panels G and H suggest that overnight changes in the CNH have
useful incremental predictive power for changes in the onshore market, particulary in recent months.
These panels show the response of the change in CNY closes to the constructed variable CNH-Resid, the
overnight change in the USDCNH exchange rate not explained by the overnight change in the dollar-
cross index. Our estimates also suggest that the CNH residuals have provided a less noisy signal more
recently, with the response coefficient rising from an average of around 0.45 in periods II and III, to 0.9,
almost full pass-through, in period IV. Interestingly, in the first two sub-periods, the estimated
coefficients on the previous day’s CNH-Resid have negative coefficients, suggesting that the impact of
surprise overnight CNH changes tended to be partially reversed the next day. In contrast, in the last two
23
subperiods, the coefficient on prior day innovations in the overnight CNH market are not statistically
different from zero at any conventional confidence level.
IX. Summary and interpretation
In this note we have explored how the mechanics of the PBOC’s daily fixing for the CNY/USD exchange
rate have evolved in recent years, focusing in particular on the period since mid-February 2016, when
the authorities introduced a new framework for setting the daily fix, which serves as the midpoint for FX
trading. We have also investigated how the CNY/USD exchange rate responds to changes in the fix, as
well as the influence of other factors, including contemporaneous changes in the broad value of the
dollar and overnight developments in the offshore CNH market.
Our results confirm that daily changes in the fix have become both quite predictable and quite
responsive to market forces. However, the ability of the fix itself to predict or guide changes in the
bilateral exchange rate during the ensuing trading day is uneven. Daily changes in the exchange rate
appear to have centered reasonably strongly on the differential between the fix and the previous close
during periods of heightened intervention, but the fix at best appears to only provide directional cues in
months with low intervention intensity, such as in recent months.
The fix’s weak predictive power appears to reflect the fact that the fix is often influenced by lagged
information, from the prior trading session. In contrast, the trading day change in the CNY (from close-
to-close) responds mostly to developments during the same time window (between closes), especially in
more recent subperiods. As a result, it is difficult to see much of an imprint on the behavior of the
CNY/USD exchange rate from the introduction, in May 2017, of a countercyclical, backward-looking
element to the fixing rule. Whereas our estimated fixing rule for the period since mid-May 2017
suggests that the fix more recently has been calibrated to reverse nearly 1/3 of the previous day’s
change in the CNY vs the previous day’s fix, we find that if anything, the tendency during the ensuing
trading day is to slightly extend the previous day’s change, although this slight procyclical behavior is not
statistically significant.
Our analysis can be interpreted as pointing to a number of ways in which the Chinese currency’s
behavior has come to more closely resemble the short horizon random walk behavior typically found in
freely floating currencies (Sarno and Taylor 2001), as well as ways in which it still differs. As noted
above, we have found that in more recent periods the exchange rate has responded mostly to

24
developments within the trading day, particularly overnight and contemporaneous changes in dollar
cross rates. And changes to the exchange rate level during the trading day tend to persist over time—
we do not find evidence of positive or negative serial correlation in daily price changes in the more
recent periods. Also, reliance on sustained intervention appears to have subsided considerably since the
turn of the year.
That said, daily volatility in the CNY remains quite low compared to freely floating currencies. It is also
worth pointing out that some commentators have suggested that, while recent months have seen less
reserve sales, there have been signs of intervention through other means. For instance, on several
occasions, discrete currency moves during the onshore trading day have been viewed by some
observers as reflecting indirect intervention, through publicly owned entities. And an unexplained
temporary surge in offshore CNH interest rates in late May 2017, which led to a strengthening of the
CNH and the CNY against the dollar, was also viewed by some market participants as reflecting indirect
intervention.
Overall, we would argue that the evolving behavior of the CNY during the trading day merits more
analytical attention going forward. Rather than just focus on the fix, as much commentary to date has
done, it seems fruitful to also examine the evolving sensitivity of the CNY to variables such as
movements in onshore and offshore markets, including dollar crosses and short and longer-term rates,
economic news, and signs (or their absence) of active management through discrete intervention.
Finally, monitoring realized volatility of the onshore currency market could provide clues as to the
authorities’ evolving tolerance for allowing market forces to have a freer hand.
The importance of understanding the CNY’s trading day behavior is underscored by the authorities’
stated intention to transition to a freer float over time, and their ongoing efforts to liberalize foreign
investors’ access to China’s local markets, including by offering foreign investors greater access to local
currency hedging instruments.
X. Concluding thoughts
In some important respects, China’s recent approach to managing the fix, and the exchange rate more
broadly, appears to have been a success. Having the fix visibly and predictably react to short-term dollar
cross movements may have helped desensitize global markets to fluctuations in the value of the Chinese
currency driven by broad dollar movements. And by avoiding large sudden moves, and dampening daily
volatility, the authorities afforded themselves room to allow or guide a material adjustment in the
25
multilateral and bilateral exchange rate over the course of 2016 without sparking volatility in global
markets. Moreover, since late 2016, the currency has held broadly stable against the authorities’
preferred reference basket, fluctuating within a 2 percent range, even as the authorities appear to have
sharply scaled back currency market intervention, and have recently relaxed some controls on short
forward positions.
However, the analysis above suggests that the stabilizing properties of the fixing regime itself should not
be overstated, given that the fix passes through prior changes in the bilateral exchange rate. And as we
have shown, the fix does not appear to obviously guide daily currency changes in periods when the
authorities are not intervening.
Moreover, while foreign investors may now be less inclined to infer intent from short run dollar-driven
CNY weakness, the future behavior of Chinese residents remains an open question. The pattern of
recent years has been for Chinese residents to accumulate dollar assets and repay dollar debt whenever
the bilateral exchange rate weakens, or appears at risk of doing so. Broad dollar depreciation during
much of 2017 and associated upward pressure on the CNY, as well as tightened controls on resident
outflows starting in late 2016, appear to have played an important role in the ebbing of Chinese capital
outflows this year. It remains to be seen how domestic flows will respond to future periods of market-
driven CNY weakness.

26
References
Bloomberg, Bloomberg fixings—BFIX Methodology, May 2016 (https://data.bloomberglp.com/notices/sites/3/2016/04/bfix_methodology.pdf)
Frankel, Jeffrey and Shang-Jin Wei, “Assessing China’s Currency Regime”, NBER Working Paper 13100, May 2007 http://www.nber.org/papers/w13100.pdf
Garcia Herrero, Alicia and Jianwei Xu, “China’s Exchange Rate Policy: Adding a ‘Countercyclical Factor’ to Gain Control” August 2017, Natixis Economic Research
Jermann, Urban, Bin Wei, and Vivian Yue, “The Two-Pillar Policy for the RMB” May 2017 (https://www.frbatlanta.org/-/media/documents/news/conferences/2017/0518-second-research-workshop-chinas-economy/presentations/bin-wei.pdf)
Meese, Richard and Kenneth Rogoff, “Empirical Exchange Rate Models of the Seventies: Do They Fit Out of Sample?” Journal of International Economics 14 (1983)
Peng Quin and Wang Yuquian “China Tweaks Yuan’s Fix to Keep Currency Stable”, Caixin Global Limited, May 27, 2015 (https://www.caixinglobal.com/2017-05-27/101095772.html)
Peoples Bank of China “Improving the RMB/USD Central Parity Formation Mechanism” Monetary Policy Report, Q1 2016, pp 52-53. (http://www.pbc.gov.cn/english/130727/130879/3007494/index.html)
Peoples Bank of China “Improving the RMB/USD Central Parity Formation Mechanism” Monetary Policy Report, Q2 2017. (http://www.pbc.gov.cn/english/130727/130879/3322165/index.html)
Sarno, Lucio and Mark P. Taylor, The Economics of Exchange Rates Cambridge U.K.: Cambridge University Press, 2002
Setser, Brad, "China’s November Reserve Drain", Council on Foreign Relations, December 19, 2016 (https://www.cfr.org/blog/chinas-november-reserve-drain)
27
Annex 1. The CFETS Index and the CFETS-weighted Dollar Cross Index—Further Discussion
The CFETS index (named for the China Foreign Exchange Trade System, run by the Peoples Bank of
China) is a geometrically weighted index of the foreign currency value of the CNY:
𝐶𝐶𝐶𝐶𝐶𝐶𝐶𝐶𝑈𝑈(𝑖𝑖) = ∏ [𝐶𝐶𝐶𝐶𝐶𝐶𝐶𝐶𝐶𝐶𝑘𝑘(𝑖𝑖) ]𝛼𝛼𝑘𝑘𝑐𝑐
𝑘𝑘=1∏ [𝐶𝐶𝐶𝐶𝐶𝐶𝐶𝐶𝐶𝐶𝑘𝑘(𝑖𝑖0) ]𝛼𝛼𝑘𝑘𝑐𝑐𝑘𝑘=1
∙ 100
where 𝐶𝐶𝐶𝐶𝐶𝐶𝐶𝐶𝐶𝐶𝑘𝑘(𝑖𝑖) is the foreign currency value/cost of a Chinese yuan (CNY) in the kth foreign currency
(e.g. euros or yen per yuan) at time t, and t0 is the base period for the index, 𝛼𝛼𝑘𝑘 is the weight of the kth
currency, and the sum of the n weights totals to one.
Given that the foreign currency value of the CNY in kth currency can be expressed as the product of the
foreign currency value of the dollar of the kth currency, and the US dollar value of the yuan:
𝐶𝐶𝐶𝐶𝐶𝐶𝐶𝐶𝐶𝐶𝑘𝑘(𝑖𝑖) = 𝑈𝑈𝑈𝑈𝑈𝑈𝐶𝐶𝐶𝐶𝑘𝑘(𝑖𝑖) ∙ 𝐶𝐶𝐶𝐶𝐶𝐶𝑈𝑈𝑈𝑈𝑈𝑈(𝑖𝑖)
we can re-write the CFETS index as the
𝐶𝐶𝐶𝐶𝐶𝐶𝐶𝐶𝑈𝑈(𝑖𝑖) = ∏ [𝑈𝑈𝑈𝑈𝑈𝑈𝐶𝐶𝐶𝐶𝑘𝑘(𝑖𝑖)]𝛼𝛼𝑘𝑘𝑐𝑐
𝑘𝑘=1∏ [𝑈𝑈𝑈𝑈𝑈𝑈𝐶𝐶𝐶𝐶𝑘𝑘(𝑖𝑖0)]𝛼𝛼𝑘𝑘𝑐𝑐𝑘𝑘=1
∙ 𝐶𝐶𝐶𝐶𝐶𝐶𝑈𝑈𝑈𝑈𝑈𝑈(𝑖𝑖)𝐶𝐶𝐶𝐶𝐶𝐶𝑈𝑈𝑈𝑈𝑈𝑈(𝑖𝑖0)
∙ 100
We can define DolCross as a CFETS-weighted index of dollar cross rates for the n-1 non-dollar currencies
included in the n currency CFTS basket:
𝑈𝑈𝐷𝐷𝐷𝐷𝐶𝐶𝐷𝐷𝐷𝐷𝐷𝐷𝐷𝐷(𝑖𝑖) = ∏ 𝑈𝑈𝑈𝑈𝑈𝑈𝐶𝐶𝐶𝐶𝑘𝑘(𝑖𝑖)𝛼𝛼𝑘𝑘𝑐𝑐
𝑘𝑘=2∏ 𝑈𝑈𝑈𝑈𝑈𝑈𝐶𝐶𝐶𝐶𝑘𝑘(𝑖𝑖0)𝛼𝛼𝑘𝑘𝑐𝑐𝑘𝑘=2
∙ 100
Since the value of the dollar in dollars is always one, we have that:
𝐶𝐶𝐶𝐶𝐶𝐶𝐶𝐶𝑈𝑈(𝑖𝑖) = 𝑈𝑈𝐷𝐷𝐷𝐷𝐶𝐶𝐷𝐷𝐷𝐷𝐷𝐷𝐷𝐷(𝑖𝑖) ∙ 𝐶𝐶𝐶𝐶𝐶𝐶𝑈𝑈𝑈𝑈𝑈𝑈(𝑖𝑖)𝐶𝐶𝐶𝐶𝐶𝐶𝑈𝑈𝑈𝑈𝑈𝑈(𝑖𝑖0)
∙ 100
Putting things in terms of log changes, it can be seen that over any window:
∆ ln(𝐶𝐶𝐶𝐶𝐶𝐶𝐶𝐶𝑈𝑈) = ∆ ln(𝑈𝑈𝐷𝐷𝐷𝐷𝐶𝐶𝐷𝐷𝐷𝐷𝐷𝐷𝐷𝐷) + ∆ln(𝐶𝐶𝐶𝐶𝐶𝐶𝑈𝑈𝑈𝑈𝑈𝑈)
.

28
Annex 2. Data
Our empirical analysis uses exchange rate data from Bloomberg and estimates of intervention activity
from the Institute of International Finance (IIF). Daily observations for the fix of the CNY against the USD
dollar (Bloomberg code: CNYMUSD) and the constituent currencies of the CFETS Index (e.g. CNYMEUR),
are from the Peoples Bank of China’s China Foreign Exchange Trading System, via Bloomberg. We
construct the dollar cross index at the time of the fix using the methodology detailed in Annex 1, where
the dollar cross for each currency is (e.g. EUR/USD) is taken as the ratio of the CNY/USD fix and the CNY
fix for that currency. For example, for the euro, our dollar cross is calculated as CNYMEUR/ CNYMUSD.
Note that for advanced economy currencies (e.g. Bloomberg code: CNYMEUR), the CNY fixes are
typically expressed in CNY per unit of foreign currency, and for emerging market currencies
(e.g. Bloomberg code: CNYMTHB) the fixes are typically expressed in units of local currency per CNY; for
these currencies the dollar cross is calculated as 1/(CNYMTHB*CNYMUSD).
For our closing CNY/USD prices, dollar cross rates at the Chinese close, and overnight changes in the
CNH/USD exchange rates, we use the Bloomberg BFIX data. As detailed in Bloomberg (2016), the BFIX
data provide snapshots of BGN prices (Bloomberg generic prices) observed at 30-minute intervals
through the trading day. For our prices at the 4:30 pm official close, we use the CNY/USD exchange rate,
the CNH/USD rate, and the dollar crosses for the currencies included in the CFETS index at 5:30 pm
Tokyo Standard Time, equivalent to 4:30 pm China Standard Time (CST). Our opening price for the CNY,
used for the analysis in Chart 6, is the BGN open price for the given trading day, and is equivalent to the
BFIX price as of 9:30 am CST.


![__gloabl__ proc(float *arr,float *brr){ float v; __shared__ float shared[L]; shared[threadIdx.x] = brr[threadIdx.x]; __syncthreads(); if(threadIdx.x!=0){](https://static.fdocuments.in/doc/165x107/56649eeb5503460f94bfc7bd/gloabl-procfloat-arrfloat-brr-float-v-shared-float-sharedl.jpg)