CHINA VS INDIA: COMPETITIVE EDGE SEPARATING REALITY FROM … · China’s changing manufacturing...
20
-
Upload
doankhuong -
Category
Documents
-
view
217 -
download
0
Transcript of CHINA VS INDIA: COMPETITIVE EDGE SEPARATING REALITY FROM … · China’s changing manufacturing...

Neeraj.Arya
Text Box
CHINA VS INDIA: COMPETITIVE EDGE SEPARATING REALITY FROM HYPE

........................................................................................................................
Neeraj.Arya
Text Box
1. INDIA AND CHINA - A BACKGROUND
Neeraj.Arya
Text Box
.................................................................................... 3
Neeraj.Arya
Text Box
3. ECONOMIC ATTRIBUTES
Neeraj.Arya
Text Box
............................................................................................................ 10
Neeraj.Arya
Text Box
CONTENTS
Neeraj.Arya
Text Box
1.1 Over the years
Neeraj.Arya
Text Box
........................................................................................................................ 3
Neeraj.Arya
Text Box
2. GLOBAL BENCHMARKING
Neeraj.Arya
Text Box
....................................................................................................... 7
Neeraj.Arya
Text Box
2.1 China and India's global competitiveness
Neeraj.Arya
Text Box
.......................................................................... 7
Neeraj.Arya
Text Box
2.2 Playing host to the world - Foreign investments in manufacturing
Neeraj.Arya
Text Box
................................ 9
Neeraj.Arya
Text Box
4. DEMOGRAPHIC ATTRIBUTES
Neeraj.Arya
Text Box
................................................................................................... 12
Neeraj.Arya
Text Box
5. COMPETITIVE EDGES
Neeraj.Arya
Text Box
................................................................................................................. 14
Neeraj.Arya
Text Box
6. CONCLUSION
Neeraj.Arya
Text Box
........................................................................................................................ 19
Neeraj.Arya
Text Box
1.2 Manufacturing sector - China's growth engine
Neeraj.Arya
Text Box
................................................................. 4
Neeraj.Arya
Text Box
1.3 Indian Manufacturing - Gathering steam
Neeraj.Arya
Text Box
........................................................................... 6
Neeraj.Arya
Text Box
3.1 FDI Flow - China outpaces India
Neeraj.Arya
Text Box
........................................................................................... 10
Neeraj.Arya
Text Box
3.2 Quality of Exports - India outshines China
Neeraj.Arya
Text Box
........................................................................... 11
Neeraj.Arya
Text Box
4.1 Average age of populations - Scales tilt in India's favour
Neeraj.Arya
Text Box
4.2 Per capita income - India approaching USD1,500 mark
Neeraj.Arya
Text Box
.................................................. 12
Neeraj.Arya
Text Box
.................................................... 13
Neeraj.Arya
Text Box
4.3 Literacy rates and income levels - India needs some catching up
Neeraj.Arya
Text Box
................................... 13
Neeraj.Arya
Text Box
5.1 Infrastructure - India ups the ante
Neeraj.Arya
Text Box
....................................................................................... 14
Neeraj.Arya
Text Box
5.2 R&D and Innovation
Neeraj.Arya
Text Box
................................................................................................................ 15
Neeraj.Arya
Text Box
5.3 Labour costs - Chinese labour to get costly
Neeraj.Arya
Text Box
........................................................................ 17

China vs. India: Competitive Edge Separating Reality from Hype 3
………………………………………………………………………………………………………………………….........
1. INDIA AND CHINA - A BACKGROUND
1.1 Over the years
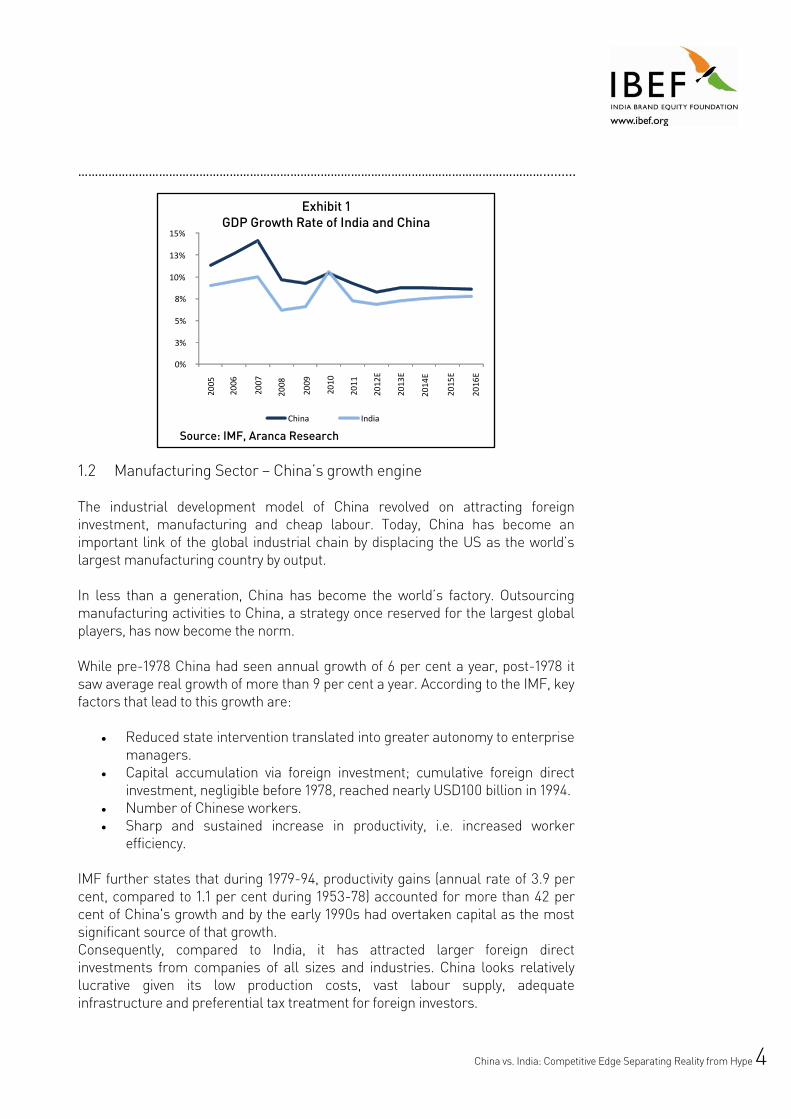
India and China experienced decisive events during the middle of the 20th century – India achieved independence from the British in 1947, while China had a proletarian revolution in 1949 led by Mao Zedong. Both democratic India and communist China embarked upon ambitious science, technology, and economic development programmes through centralised planning. Both focussed on self-reliance through local initiatives, restricting the flow of foreign capital and technology for nearly three decades. Following the revolution, the Chinese economy remained a closed economy, with the only source of foreign capital being the Soviet Union. On the other hand India, although it did not maintain such high capital controls, the country allowed only partial and highly restricted entry of foreign capital and technology. The Chinese economy finally opened up with a massive shift of public policy brought about by Deng Xiaoping in 1979. Things began to change rapidly in the next decade, with the Chinese economy registering a growth of 9-10 per cent. Today, China ranks second, after the US, in terms of GDP. As for India, the economic reforms in 1991 helped in leaving behind the sluggish growth rate of 3 per cent to reach an annual growth rate of 8 per cent. Today India has one of the world’s strongest technological capabilities and therefore it is the most preferred destination of IT outsourcing. Incidentally, China has now become India's largest trading partner with more than USD60 billion worth goods traded in 2010. Indian and Chinese companies are setting up operations in each others' countries and in some cases, to serve the global markets. As far as bilateral trade goes, India is a net importer of Chinese goods.
China vs. India: Competitive Edge Separating Reality from Hype 4
………………………………………………………………………………………………………………………….........
Exhibit 1 GDP Growth Rate of India and China
Source: IMF, Aranca Research
1.2 Manufacturing Sector – China’s growth engine The industrial development model of China revolved on attracting foreign investment, manufacturing and cheap labour. Today, China has become an important link of the global industrial chain by displacing the US as the world’s largest manufacturing country by output. In less than a generation, China has become the world’s factory. Outsourcing manufacturing activities to China, a strategy once reserved for the largest global players, has now become the norm. While pre-1978 China had seen annual growth of 6 per cent a year, post-1978 it saw average real growth of more than 9 per cent a year. According to the IMF, key factors that lead to this growth are:
Reduced state intervention translated into greater autonomy to enterprise managers.
Capital accumulation via foreign investment; cumulative foreign direct investment, negligible before 1978, reached nearly USD100 billion in 1994.
Number of Chinese workers. Sharp and sustained increase in productivity, i.e. increased worker
efficiency.
IMF further states that during 1979-94, productivity gains (annual rate of 3.9 per cent, compared to 1.1 per cent during 1953-78) accounted for more than 42 per cent of China's growth and by the early 1990s had overtaken capital as the most significant source of that growth. Consequently, compared to India, it has attracted larger foreign direct investments from companies of all sizes and industries. China looks relatively lucrative given its low production costs, vast labour supply, adequate infrastructure and preferential tax treatment for foreign investors.
0%
3%
5%
8%
10%
13%
15%
20
05
China India
200
6
20
07
20
08
20
09
20
10
20
11
20
12
E
20
13
E
20
14
E
20
15
E 2
01
6E

China vs. India: Competitive Edge Separating Reality from Hype 5
………………………………………………………………………………………………………………………….........
Export-oriented FDI (particularly from Hong Kong and Taiwan) jump-started China’s manufacturing sector providing the early export push. In 2010, 59 per cent of its manufacturing exports and 85 per cent of all high-tech exports were FDI driven. World-class infrastructure drove export-oriented FDI, which in turn pushed the development of infrastructure. This cycle explains a significant portion of China’s growth over the past two decades. China’s changing manufacturing landscape: However, China’s manufacturing landscape has changed over the years. Production costs (land and labour costs) have risen steadily, particularly in the highly concentrated manufacturing centres in China’s coastal regions. And in an effort to spread the manufacturing wealth to more of the country and broadly extend the economic evolution enjoyed by its highly developed coastal cities, China has eliminated or dramatically reduced preferential treatment for the majority of new manufacturing activities near the coast. Also, increasing income levels along the coastal region has created a focus on higher technologies, new industries, and other corporate functions. China’s focus on higher and more strategic technologies is forcing the initial waves of lower-technology manufacturers to adapt, move inward and, in some cases, move out. Under its 12th Five Year Plan, the Government of China has signalled a move away from its three decade old policy of export oriented growth towards higher domestic consumption. This focus will get particularly reinforced as the advanced economies, key markets for Chinese products, remain bogged down in sluggish growth.
Exhibit 2 Industrial Production Growth Rate
Source: IMF, Aranca Research
0.00%
7.00%
14.00%
21.00%
28.00%
35.00%
19
99
20
00
20
01
20
02
20
03
20
04
20
05
20
06
20
07
20
08
20
09
20
10
20
11
E
China India

China vs. India: Competitive Edge Separating Reality from Hype 6
………………………………………………………………………………………………………………………….........
Exhibit 3 Determinants of China’s changing manufacturing landscape
Source: Deloitte Consulting LLP, Aranca Research
1.3 Indian Manufacturing – Gathering steam
Manufacturing holds a key position in the Indian economy, accounting for nearly 15.4 per cent of real GDP in FY12 and employing about 12 per cent of India’s labour force. Growth in the sector has been strong, outpacing overall GDP growth over the past few years. For example, while real GDP expanded at a CAGR of 8.4 per cent over FY05-FY12, growth in the manufacturing sector was higher at around 8.5 per cent over the same period. Consequently, its share in the economy has increased during this time – to 15.4 per cent from 15.3 per cent. Growth however has remained below that of services, an issue that has not escaped the attention of policy makers in the country. According to the International Yearbook of Industrial Statistics 2011, published by the United Nations Industrial Development Organisation (UNIDO), India was one of the top ten manufacturers in the world in 2010.
Focus on higher technology
Rising land and labour costs
Focus on domestic comsumption
Changing manufacturing
landscape
China vs. India: Competitive Edge Separating Reality from Hype 7
………………………………………………………………………………………………………………………….........
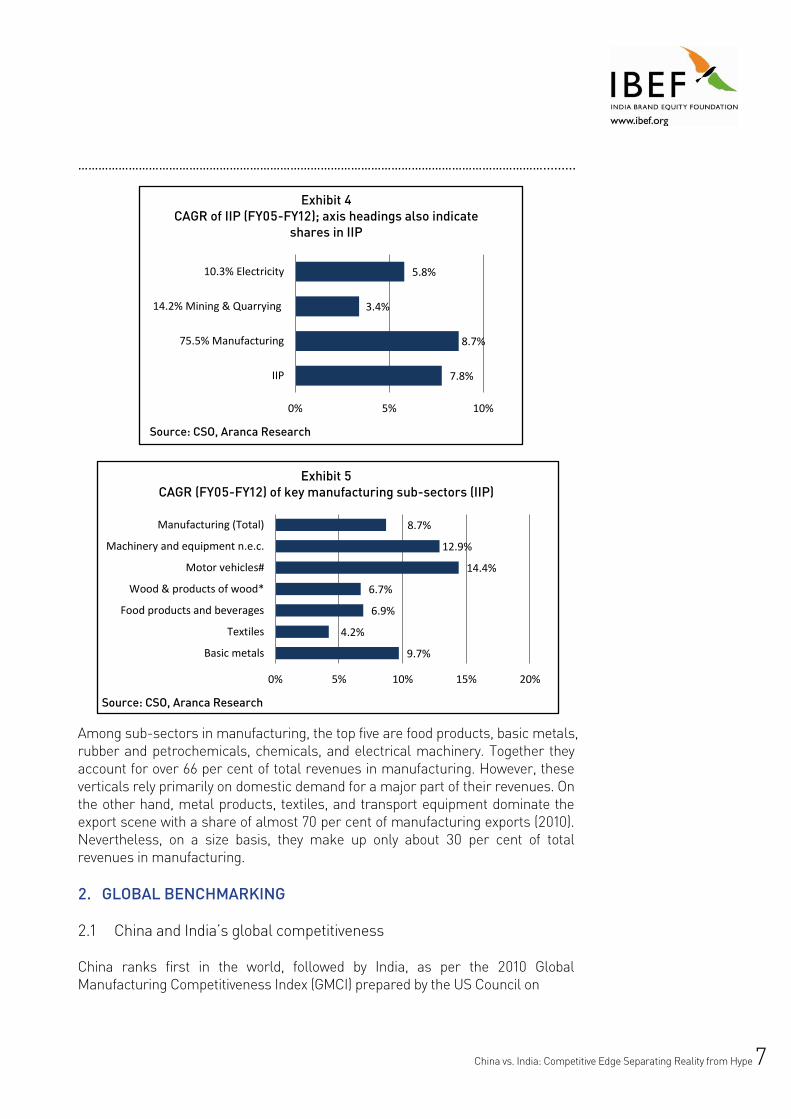
Exhibit 4 CAGR of IIP (FY05-FY12); axis headings also indicate
shares in IIP
Source: CSO, Aranca Research
Exhibit 5 CAGR (FY05-FY12) of key manufacturing sub-sectors (IIP)
Source: CSO, Aranca Research
Among sub-sectors in manufacturing, the top five are food products, basic metals, rubber and petrochemicals, chemicals, and electrical machinery. Together they account for over 66 per cent of total revenues in manufacturing. However, these verticals rely primarily on domestic demand for a major part of their revenues. On the other hand, metal products, textiles, and transport equipment dominate the export scene with a share of almost 70 per cent of manufacturing exports (2010). Nevertheless, on a size basis, they make up only about 30 per cent of total revenues in manufacturing. 2. GLOBAL BENCHMARKING
2.1 China and India’s global competitiveness
China ranks first in the world, followed by India, as per the 2010 Global Manufacturing Competitiveness Index (GMCI) prepared by the US Council on
7.8%
8.7%
3.4%
5.8%
0% 5% 10%
IIP
75.5% Manufacturing
14.2% Mining & Quarrying
10.3% Electricity
9.7%
4.2%
6.9%
6.7%
14.4%
12.9%
8.7%
0% 5% 10% 15% 20%
Basic metals
Textiles
Food products and beverages
Wood & products of wood*
Motor vehicles#
Machinery and equipment n.e.c.
Manufacturing (Total)

China vs. India: Competitive Edge Separating Reality from Hype 8
…………………………………………………………………………………………………………………………......... Competitiveness and Deloitte. The index factors in market dynamics as well as policy issues influencing the sector. China and India are ahead of major developed and emerging economies like the US, South Korea, Brazil and Japan. Looking ahead, India’s competitiveness will increase further with its index score set to improve to 9.01 (out of 10) in the next five years from the 2010 figure of 8.15. In terms of rank, the country is expected to trail China over the same period. Given below are the segments of the GMCI and the ranks assigned to nations in 2010.
Exhibit 6 Drivers of the GMCI in descending order of weight
Talent-driven innovation
Cost of labour and materials
Energy cost of policies
Economic, trade, financial and tax systems
Quality of physical infrastructure
Government investments in manufacturing and innovation
Legal and regulatory system
Supplier network
Local business dynamics
Quality and availability of healthcare Source: Deloitte and US Council on Competitiveness, Aranca Research
Exhibit 7
2010 GMCI – India compared with others Current
RankCountry Index Score
Rank after 5 Years
1 China 10.00 1
2 India 8.15 2
3Rep of Korea
6.79 3
4 USA 5.84 5
5 Brazil 5.41 4
6 Japan 5.11 7
7 Mexico 4.84 6
8 Germany 4.80 8
9 Singapore 4.69 11
10 Poland 4.49 9
New add* Thailand - 10 Source: Deloitte and US Council on Competitiveness, Aranca Research *New addition among the top 10 countries. Currently Thailand is ranked 12th with an index score of 4.17

China vs. India: Competitive Edge Separating Reality from Hype 9
…………………………………………………………………………………………………………………………......... 2.2 Playing host to the world – Foreign investments in manufacturing
Over the years, the increasing attractiveness of the Chinese and Indian market has lured investors from across the world. Consequently, both the countries are among the top five preferred destinations for Foreign Direct Investment (FDI) from Asian, European and North American investors.
Exhibit 8 2012 FDI Confidence Index - top 10 countries
Rank Country1 China
2 United States of America (USA)
3 India
4 Brazil
5 Germany
6 Poland
7 Australia
8 Mexico
9 Canada
10 United Kingdom Source: A.T. Kearney, Aranca Research
Exhibit 9 Top 10 regional preference of investors
RankAsian
investorsEuropean investors
North American investors
1 China China USA
2 Vietnam USA China
3 USA India India
4 India Germany Brazil
5 Hong Kong Brazil Mexico
6 Indonesia Romania Poland
7 Brazil Italy UK
8 Australia France Canada
9 Thailand Poland Australia
10 UAE Russia Germany Source: A.T. Kearney, Aranca Research

China vs. India: Competitive Edge Separating Reality from Hype 10
………………………………………………………………………………………………………………………….........
3. ECONOMIC ATTRIBUTES
3.1 FDI Flow – China outpaces India
According to “World Investment and Political Risk-2011” report published by the World Bank, India trails China in terms of attracting FDI inflows, in spite of having high-tech industries and adept workforce. India’s lack of skill to adopt the technological change at a fast pace is the main reason for lower FDI compared to China. While FDI inflows in 2010 as a proportion of India’s GDP stand at a miniscule 1.4 per cent, the same stands at 3.5 per cent for China. As a result, India's high-tech industries claim for 2.3 per cent of GDP whereas the high-tech industries in China contribute to around 7.9 per cent in the GDP of the country. Advantages of India and China in terms of FDI Inflows China is preferred to India by the international investor community given its bigger market than India, easy accessibility to export market, government incentives, developed infrastructure, cost-effectiveness, and macro-economic climate. However, India scores on skilled and efficient manpower, talented management system, rule of law, transparent system of work, cultural affinity and regulatory environment.
Exhibit 10 FDI Inflow as a % of GDP
Source: World Bank, Aranca Research
0.0%
1.0%
2.0%
3.0%
4.0%
5.0%
20
01
20
02
20
03
20
04
20
05
20
06
20
07
20
08
20
09
20
10
World China India

China vs. India: Competitive Edge Separating Reality from Hype 11
………………………………………………………………………………………………………………………….........
Exhibit 11 FDI Outflow as a % of GDP
Source: World Bank, Aranca Research
3.2 Quality of Exports – India outshines China
Although, in terms of size, Chinese exports outsize India's exports, but Indian exports have remained buoyant in the face of competition from Chinese goods and a slowing world economy, thanks to higher quality of products compared to the Chinese products. This enabled Indian manufacturers in moving higher up the value chain. India's share in merchandise world trade rose from 0.7 per cent in 2000 to 1.4 per cent in 2010, making it the 20th largest exporter in the world, according to the WTO's 'World Trade Report 2011'. India’s rising share in world trade can be attributed to a shift towards better quality and high-value products - a strategy that has helped it in keeping pace with China.
Exhibit 12 Total merchandise exports (USD billion)-India and China
Source: World Bank, Aranca Research
-1.0%
0.0%
1.0%
2.0%
3.0%
4.0%
5.0%2
00
1
20
02
20
03
20
04
20
05
20
06
20
07
20
08
20
09
20
10
World China India
250 500 750 1,000 1,250
2001
2003
2005
2007
2009
2011
India China

China vs. India: Competitive Edge Separating Reality from Hype 12
………………………………………………………………………………………………………………………….........
Exhibit 13 Share in global merchandise exports-India and China
Source: World Bank, Aranca Research
4. DEMOGRAPHIC ATTRIBUTES
4.1 Average age of populations – Scales tilt in India’s favour
According to Morgan Stanley and the Global Times, China’s rapidly aging population is set to dramatically shrink its workforce and effectively create an opportunity for India to become the world’s manufacturing hub. The World Bank concurs, predicting that China’s GDP growth will fall to 7.7 per cent in 2015 and to 6.7 per cent by 2020. Morgan Stanley expects India’s growth to head in the opposite direction and to surpass China’s in the near future. China's policy of one child for the last 30 years has changed the demographic composition. Today the working age population has peaked with an average age of 31 years. China may become older before it becomes richer and there is talk of a change in the one child policy. China's growth is expected to be impacted as wages could climb and its savings increasingly consumed by the need for health care and care of the elderly.
Exhibit 14 Population Growth Rate
Source: US Census Bureau, Aranca Research
0.0% 2.0% 4.0% 6.0% 8.0% 10.0% 12.0%
2001
2003
2005
2007
2009
2011
India China
0.0%
0.4%
0.8%
1.2%
1.6%
2.0%
20
01
20
02
20
03
20
04
20
05
20
06
20
07
20
08
20
09
20
10
20
11
World China India

China vs. India: Competitive Edge Separating Reality from Hype 13
………………………………………………………………………………………………………………………….........
Exhibit 15 Working population (% of total population)
Source: World Bank, Aranca Research
4.2 Per capita income – India approaching USD1,500 mark
India's per capita income at USD1,389 in 2011, is expected to cross the USD1,500-mark soon. India crossed per capita income USD1,000 mark back in 2007. According to the Boston Consulting Group (BCG), the USD1,000 marks signifies the take-off of a nation. Morgan Stanley concurs that around the USD1,000 mark a nation gets out of subsistence spending and moves more and more into higher quality branded products. China’s per capita income in 2011 stood at USD5,414 and it reached the USD1,000 threshold in 2001. Since then, it has experienced a local consumption boom. Ahead of the global curve: India’s per capita income at these levels has huge implications for what Indians will consume in the coming years to come and at what rate. Thanks to innovations in technology and business models, what consumers in the West, or even in China, started to consume at the per capita income level of USD2,000 or USD3,000, Indians would begin to consume much earlier. This will in turn provide a huge boost to the domestic manufacturing industry given India’s strong domestic consumption. 4.3 Literacy rates and income levels – India needs some catching up
Despite the hype about both China and India, they are comparatively poorer countries with large income disparities across each country. In China more than half of the country's population remains in rural areas, while the fraction stands at an even higher 70 per cent in India. Also, despite all the talk about Indian software engineers and Nobel laureates and Chinese engineering achievements, India has the largest number of illiterate people in the world and China also is burdened with a large poorly educated rural populace who will present continued challenges for economic development. As per the latest economic survey 2011-12, India’s illiteracy rate is nearly 26 per cent where as illiteracy in China is less than 6 per cent as reported by UNESCO. Of the total of 2.6 billion people in these two
0%
15%
30%
45%
60%
75%2
001
20
02
20
03
20
04
20
05
20
06
20
07
20
08
20
09
China India

China vs. India: Competitive Edge Separating Reality from Hype 14
…………………………………………………………………………………………………………………………......... countries, nearly 1.5 billion earn less than USD2 a day, according to World Bank estimates.
5. COMPETITIVE EDGES
5.1 Infrastructure- India ups the ante
The positive impact on physical infrastructure on the growth and overall development of an economy is clearly visible in the case of China’s economic growth boosted by its strong manufacturing sector. On the other hand, the growth spurt in the Indian economy in recent years has placed increasing stress on physical infrastructure such as electricity, railways, roads, ports, airports, irrigation, and urban and rural water supply and sanitation, many of which suffer from a substantial underdevelopment. The goals of inclusive growth and 9 per cent GDP growth can be achieved only if this infrastructure deficit is overcome. Infrastructure development would help in creating a better investment climate in India. The Indian government is well aware of these problems and the recent suggestion for independent regulatory bodies in core infrastructure sectors such as the transport sector comprising highways, railways, ports and airports is a welcome suggestion for future reforms. Against this backdrop, Budget 2012-13 highlights that investment in infrastructure to go up to USD 1.11 trillion during the twelfth plan period with half of this expected from private sector. For infrastructure up gradation in both rural and urban areas first Infrastructure debt fund with an initial size of USD1.7 billion was launched in February 2012. The Finance Minister also announced an increase in the allocation towards:
Allocation to Road transport and highway ministry increased by 14 per cent to USD5.3 billion.
The allocation under the Rural Infrastructure Development Fund (RIDF) has been enhanced to USD4.2 billion out of which USD1 billion has been earmarked for warehousing facility.
Tax free bonds of USD12.5 billion was allowed for financing infrastructure projects in 2012-13.
Infrastructure development had also been accorded key priority in the 11th Five-Year Plan for the years 2007-2012 and the 12th plan period of 2012-2017, with projected investment requirement of USD500 billion and USD1.5 trillion, respectively, by the Prime Minister’s Committee on Infrastructure. 1 USD1=INR48.1 is used as standard conversion factor

China vs. India: Competitive Edge Separating Reality from Hype 15
………………………………………………………………………………………………………………………….........
Exhibit 16 Infrastructure spending relative to GDP (2010)
Source: World Bank, Aranca Research
5.2 R&D and Innovation
High productivity is a function of innovations and technology. This relates to inventions as well as improvement in products and processes. India’s R&D spending as a share of GDP is very low (0.9 per cent in 2010) compared to 3.3 per cent for Japan, 2.7 per cent for the US, 1.6 per cent for Europe, and 1.4 per cent for China. At the same time, India’s share in global R&D spending was much lower at 2.9 per cent (in 2010) as compared to China’s 12.9 per cent. India also lags behind other countries in the Global Innovation Index (62nd in 2011), while China ranks 29th.
Exhibit 17 2011 Share of global R&D spending
2009 2010 2011E
U.S. 34.7% 34.4% 34.0%
Japan 12.6% 12.3% 12.1%
China 11.2% 12.3% 12.9%
India 2.5% 2.9% 3.0%
Europe 24.1% 23.3% 23.2%
Rest of World 3.1% 3.0% 3.0% Source: Battelle, Aranca Research
Exhibit 18 2011 Share of R&D as % of GDP
2009 2010 2011E
U.S. 2.7% 2.7% 2.7%
Japan 3.4% 3.3% 3.3%
China 1.4% 1.4% 1.4%
India 0.8% 0.8% 0.9%
Europe 1.7% 1.6% 1.7%
Rest of World 1.2% 1.2% 1.2% Source: Battelle, Aranca Research
China, 573.2 India, 86.1
0%
3%
6%
9%
12%
15%
0% 2% 4% 6% 8% 10% 12% 14%
size of bubble denotes spend on infrastructure in USD
GD
P G
row
th R
ate
Spend on Infrastructure (% of GDP)

China vs. India: Competitive Edge Separating Reality from Hype 16
………………………………………………………………………………………………………………………….........
R&D investment by multi-national corporations: China may outshine India According to the consulting firm Zinnov, at about USD105 billion, China received almost four times as much FDI as India in 2010. But for years India has been ahead of China on FDI focussed into R&D. In the fiscal year ended March 31, total R&D investment into India stood at USD11.6 billion, which includes research for both proprietary and third-party use, compared to USD9 billion for China. However, investment into China to fuel new products and innovations is growing at a much faster rate of 16 per cent a year compared to India’s 11 per cent. Therefore, China is fast catching up with India as a destination for foreign investment in proprietary research and development, and could challenge India. Innovation – Driven by Indian entrepreneurship Right from the onset, Chinese and Indian innovation patterns have been fundamentally difference in the sense that innovation in China is concentrated primarily in manufacturing and capital goods, while in India it is primarily focused on services and skilled manufacturing sectors. Drivers of China’s innovation efforts are:
Enormous infrastructure spending. Government policies towards manufacturing of capital goods Availability of cheaper financing. Government’s focus on manufacturing.
Traditionally, China has been eager to get technology transfer in its FDI and joint-ventures. However, a lack of intellectual protection, government interference and a lack of education reform (a possible result of the Communist legacy) still linger on in China in stifling innovation. China’s advance up the technological innovation curve has thus been limited to sectors where foreign capital and technology has been able to seep through; e.g. in its export-oriented manufacturing sectors. While, factors acting in India’s favour are:
Large educated pool of labour. Talent and local resources are drivers for its own technological
innovations in healthcare to high precision manufacturing to software and IT.
Large English speaking population with technical knowledge. Government initiatives such as Software Technology Parks of India (STPI)
Innovation in India happens at the grassroots driven by entrepreneurship and not by state sponsorship. For example, Indians have done remarkably well in generic pharmaceuticals, where critical drivers were high chemistry skills and quality manufacturing at low cost. Similarly, Indian companies have been primary

China vs. India: Competitive Edge Separating Reality from Hype 17
…………………………………………………………………………………………………………………………......... beneficiaries in innovation in IT, software and services driven by access to talented labour and a more entrepreneurial environment.
Exhibit 19 Country wise patent filing (2010)
Source: World Intellectual Property Organization, Aranca Research
5.3 Labour costs – Chinese labour to get costly
Between 2003 and 2007, as depicted by the charts below, hourly compensation costs in China were slightly below that of India. However, these costs in China have risen at a higher CAGR (+14.3 per cent) as compared to India (CAGR of +9.6 per cent) during the same period.
Exhibit 20
Hourly compensation costs in manufacturing-China
Source: US Department of Labour, Aranca Research
-10.0%
-5.0%
0.0%
5.0%
10.0%
15.0%
20.0%
25.0%
-
100,000
200,000
300,000
400,000
500,000
600,000
Swed
en
Au
stri
a
Ne
the
rlan
ds
Spai
n
Isra
el
Ital
y
Fran
ce UK
Bra
zil
Au
stra
lia
Ind
ia
Can
ada
Ge
rman
y
Ge
rman
y
Ko
rea
Jap
an
Ch
ina
USA
diamonds represent average annual growth rate: 2000-2010
0.6
0.7
0.7
0.8
1.1
1.4
0.0 0.3 0.6 0.9 1.2 1.5
2003
2004
2005
2006
2007
2008

China vs. India: Competitive Edge Separating Reality from Hype 18
………………………………………………………………………………………………………………………….........
Exhibit 21 Hourly compensation costs in manufacturing-India
Source: US Department of Labour, Aranca Research
Reasons for rising manufacturing labour compensation costs in China are:
Rising literacy of unskilled and semi-skilled employees Higher salaries demanded by skilled workers and high-talent employees New contract law that prescribes:
Right to have a signed labour contract Protects the working conditions and timely payment of wages to employees Limits overtime work Requires payments to compulsory social insurance schemes for employees Makes it much more difficult to fire workers
Moving beyond 2008, according to IHS Global Insight Study, total labour costs in India’s formal manufacturing sector have risen by 20 per cent in 2010 and average approximately USD2.68 per hour in 2010 compared to China’s USD2.51, a rise of 10 per cent. Following the spate of strikes in factories in South China in June 2010, over low salaries, the study by IHS Global expects
Total Chinese manufacturing labour costs to exceed Indian salaries by 2013 and to be 20 per cent higher than in India by 2020.
Over the next ten years, wages in China are expected to rise steadily, as compared to India.
China’s rising wages will not only reflect higher productivity, but also a step up in the value chain as a result of extensive investment in industrial infrastructure.
However, China’s manufacturing sector depends heavily on exports to the west, which have suffered in the wake of the global recession. India’s economy, on the
0.8
0.9
0.9
1.0
1.2
0.0 0.3 0.6 0.9 1.2 1.5
2003
2004
2005
2006
2007
2008 NA

China vs. India: Competitive Edge Separating Reality from Hype 19
…………………………………………………………………………………………………………………………......... other hand, benefits from robust domestic demand, allowing the rising wages to push total costs ahead of China.
6. CONCLUSION
Both India and China had modest beginnings with common problems such as a huge population and low income. Both the countries underwent decisive events during the middle of the 20th century. However, since then and particularly since the last decade of the 20th century the economic development of both countries picked up pace that has been sustained till now. Although, the major reason behind the growth in both countries was their low cost bases, the paths charted out by the two were starkly different. While the Chinese economy thrived on manufacturing, the Indian economy was boosted by the strong growth in services. Given this difference, China has a huge head start over India in the manufacturing sector which is evident from its substantially higher share of global manufacturing exports compared to India. Also, FDI inflows into China comprehensively outpace FDI inflows into India, both in terms of value as well as a share of their respective GDPs. However, India scores on skilled and efficient manpower, talented management system, transparent system of work, cultural affinity and regulatory environment. Also Indian exports have remained buoyant in the face of competition from Chinese goods and a slowing world economy, thanks to exporters differentiating products and moving higher up the value chain. India, being aware of the importance of manufacturing in economic development and job creation, has taken steps to promote manufacturing, such as setting up of SEZs and encouraging foreign collaborations with the aim of technology transfer. Therefore, growth in the sector has been strong, outpacing overall GDP growth over the past few years. Today, both India and China are among the world’s ten largest manufacturers. They are expected to rise up the ranks because they are among the most competitive countries in the world. Although China is expected to maintain its lead over India in the manufacturing sector in the near future, India is expected to close in with its larger working age population over the longer term.

China vs. India: Competitive Edge Separating Reality from Hype 20
………………………………………………………………………………………………………………………….........
DISCLAIMER India Brand Equity Foundation (IBEF) engaged Aranca to prepare this report and the same has been prepared by Aranca in consultation with IBEF. All rights reserved. All copyright in this report and related works is solely and exclusively owned by IBEF. The same may not be reproduced, wholly or in part in any material form (including photocopying or storing it in any medium by electronic means and whether or not transiently or incidentally to some other use of this presentation), modified or in any manner communicated to any third party except with the written approval of IBEF. This report is for information purposes only. While due care has been taken during the compilation of this report to ensure that the information is accurate to the best of Aranca and IBEF’s knowledge and belief, the content is not to be construed in any manner whatsoever as a substitute for professional advice. Aranca and IBEF neither recommend nor endorse any specific products or services that may have been mentioned in this report and nor do they assume any liability or responsibility for the outcome of decisions taken as a result of any reliance placed on this presentation. Neither Aranca nor IBEF shall be liable for any direct or indirect damages that may arise due to any act or omission on the part of the user due to any reliance placed or guidance taken from any portion of this report.