China-U.S. Trade Issues - University of Utah
87
China-U.S. Trade Issues Wayne M. Morrison Specialist in Asian Trade and Finance July 6, 2018 Congressional Research Service 7-5700 www.crs.gov RL33536
Transcript of China-U.S. Trade Issues - University of Utah
China-U.S. Trade Issues
Wayne M. Morrison
Specialist in Asian Trade and Finance
July 6, 2018
Congressional Research Service
7-5700
www.crs.gov
RL33536
China-U.S. Trade Issues
Congressional Research Service
Summary U.S.-China economic ties have expanded substantially since China began reforming its economy
and liberalizing its trade regime in the late 1970s. Total U.S.-China merchandise trade rose from
$2 billion in 1979 (when China’s economic reforms began) to $636 billion in 2017. China is
currently the United States’ largest merchandise trading partner, its third-largest export market,
and its biggest source of imports. In 2015, sales by U.S. foreign affiliates in China totaled $482
billion. Many U.S. firms view participation in China’s market as critical to their global
competitiveness. U.S. imports of lower-cost goods from China greatly benefit U.S. consumers.
U.S. firms that use China as the final point of assembly for their products, or use Chinese-made
inputs for production in the United States, are able to lower costs. China is also the largest foreign
holder of U.S. Treasury securities (at $1.2 trillion as of April 2018). China’s purchases of U.S.
debt securities help keep U.S. interest rates low.
Despite growing commercial ties, the bilateral economic relationship has become increasingly
complex and often fraught with tension. From the U.S. perspective, many trade tensions stem
from China’s incomplete transition to a free market economy. While China has significantly
liberalized its economic and trade regimes over the past three decades, it continues to maintain (or
has recently imposed) a number of state-directed policies that appear to distort trade and
investment flows. Major areas of concern expressed by U.S. policymakers and stakeholders
include China’s alleged widespread cyber economic espionage against U.S. firms; relatively
ineffective record of enforcing intellectual property rights (IPR); discriminatory innovation
policies; mixed record on implementing its World Trade Organization (WTO) obligations;
extensive use of industrial policies (such as subsidies and trade and investment barriers) to
promote and protect industries favored by the government; and interventionist policies to
influence the value of its currency. Many U.S. policymakers argue that such policies adversely
impact U.S. economic interests and have contributed to U.S. job losses in some sectors.
The Trump Administration has pledged to take a more aggressive stance to reduce U.S. bilateral
trade deficits, enforce U.S. trade laws and agreements, and promote “free and fair trade,”
including in regard to China. On March 8, 2018, President Trump announced a proclamation
imposing additional tariffs on steel (25%) and aluminum (10%), based on Section 232 national
security justifications (China is the world’s largest producer of both of these commodities). On
April 1, China announced that it had retaliated against the U.S. action by raising tariffs (from
15% to 25%) on various U.S. products, which together totaled $3 billion in 2017. On March 22,
President Trump announced that action would be taken against China under Section 301 over its
IPR policies deemed harmful to U.S. stakeholders. In addition, he stated that he would seek
commitments from China to reduce the bilateral trade imbalance and to achieve “reciprocity” on
tariff levels. On June 15, the USTR announced a two-stage plan to impose 25% ad valorem tariffs
on $50 billion worth of Chinese imports. Under the first stage, U.S. tariffs would be increased on
$34 billion worth of Chinese products and effective July 6. For the second stage, the USTR
proposed increasing tariffs on $16 billion worth of Chinese imports, mainly targeting China’s
industrial policies. China released its own two-stage list of counter-retaliation of equal magnitude.
President Trump then threatened 10% ad valorem tariffs on another $400 billion worth of Chinese
products. On July 6, the Trump Administration implemented the first round of tariff increases and
China said it would implement countermeasures. These actions could sharply reduce U.S.-China
commercial ties, disrupt global supply chains, raise import prices for U.S. consumers and
importers of Chinese inputs, and diminish economic growth in the United States and abroad.
This report provides background and analysis of U.S.-China commercial ties, including history,
major trends, issues, and outlook. It will be updated as events warrant.

China-U.S. Trade Issues
Congressional Research Service
Contents
Introduction ..................................................................................................................................... 1
Most Recent Developments: Section 301 ........................................................................................ 1
Section 301 Actions Chronology .............................................................................................. 1
U.S. Trade with China ..................................................................................................................... 4
U.S. Merchandise Exports to China .......................................................................................... 5 Major U.S. Merchandise Imports from China ........................................................................... 8 Trade in Services ...................................................................................................................... 11 The U.S. Merchandise Trade Deficit with China ..................................................................... 11 The Transfer of Pacific Rim Production to China by Multinational Firms ............................. 12 China as a Major Center for Global Supply Chains ................................................................ 14 China Trade and U.S. Jobs ...................................................................................................... 17
U.S.-China Investment Ties: Overview ......................................................................................... 19
China’s Holdings of U.S. Public and Private Securities.......................................................... 20 U.S. Residential Real Estate .................................................................................................... 22 Bilateral Foreign Direct Investment Flows ............................................................................. 23
Alternative Measurements of Bilateral FDI Flows ........................................................... 24 Chinese Restrictions on U.S. FDI in China ...................................................................... 27 Negotiations for a Bilateral Investment Treaty (BIT) ....................................................... 28
Concerns About Chinese FDI in the United States ................................................................. 30
Major U.S.-China Trade Issues ..................................................................................................... 31
Chinese “State Capitalism” ..................................................................................................... 32 China’s Plan to Modernize the Economy and Promote Indigenous Innovation ............... 35
New Restrictions on Information and Communications Technology ..................................... 39 Intellectual Property Rights (IPR) Issues ................................................................................ 41
Technology Transfer Issues ............................................................................................... 46 Cyber-security Issues ........................................................................................................ 47
China’s Obligations in the World Trade Organization ............................................................ 51 WTO Implementation Issues ............................................................................................ 52
China’s Currency Policy ......................................................................................................... 56
The Trump Administration’s Approach to Commercial Relations with China .............................. 58
The Administration’s Section 301 Case on China’s IPR Policies ........................................... 60 Chinese and U.S. Commodities that could be Subject to Increased Tariffs ...................... 63 Economic Effects of Section 301 Tariff Increases ............................................................ 67
Section 232 Tariffs on Steel and Aluminum ............................................................................ 70
Implications of Recent Trade Action against China ...................................................................... 71
Figures
Figure 1. Top 5 U.S. Merchandise Export Markets in 2017 ............................................................ 5
Figure 2. Top 5 Sources of U.S. Merchandise Imports: 2017 ......................................................... 9
Figure 3. Major U.S. Services Trading Partners in 2017 ................................................................ 11
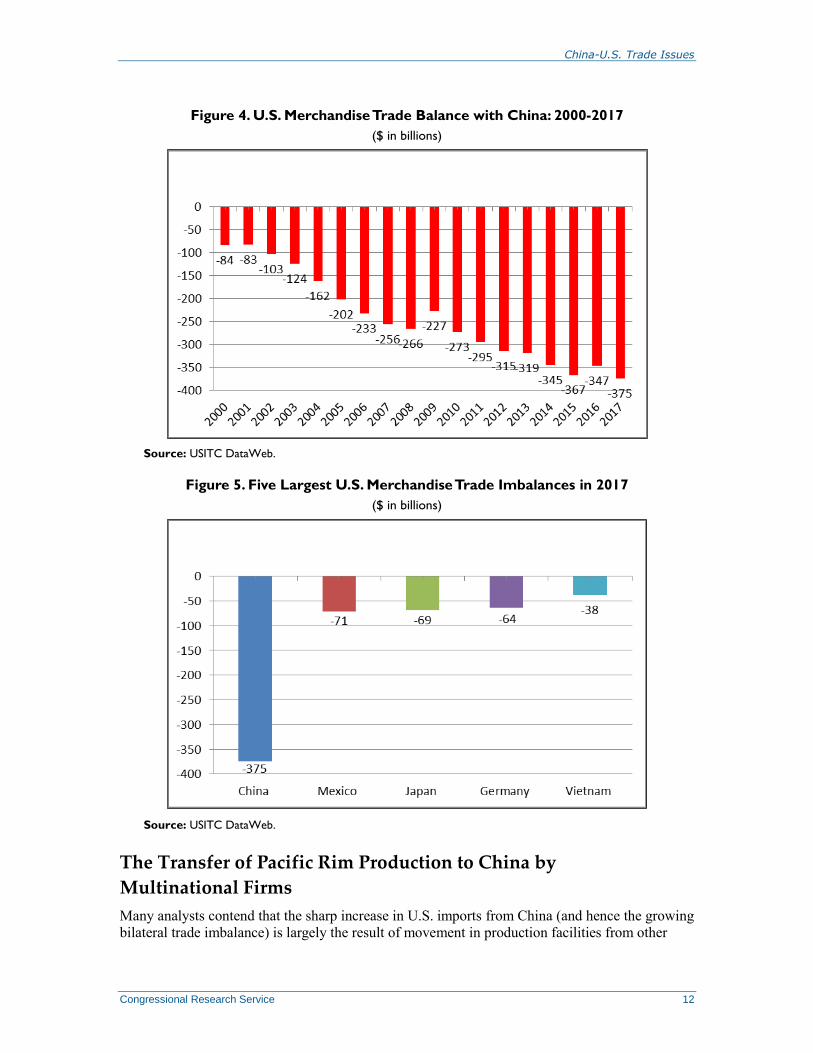
Figure 4. U.S. Merchandise Trade Balance with China: 2000-2017 ............................................. 12
Figure 5. Five Largest U.S. Merchandise Trade Imbalances in 2017 ............................................ 12

China-U.S. Trade Issues
Congressional Research Service
Figure 6. U.S. Manufactured Imports from Pacific Rim Countries as a Percentage of Total
U.S. Manufactured Imports: 1990 and 2017 .............................................................................. 13
Figure 7. U.S. Manufactured Imports from China and Japan as a Percentage of U.S. Total
Imports: 1990-2017 (%) ............................................................................................................. 14
Figure 8. Estimated Percentage Foreign Value-Added to China’s Exports in 2011 ...................... 15
Figure 9. Two Measurements of U.S. Trade in Goods and Services: 2011 ................................... 15
Figure 10. Top Five Country Locations of Facilities that Supplied
Apple Corporation in 2017 ......................................................................................................... 17
Figure 11. China’s Holdings of U.S. Treasury Securities: 2002-2017 .......................................... 22
Figure 12. Sales by Foreign Affiliates of U.S. Firms by Country in 2015 .................................... 24
Figure 13. BEA and RG Estimates of the Stock of U.S.-China FDI through 2016 ....................... 25
Figure 14. BEA and RG Data on Annual U.S. FDI Flows to China: 2005-2016 .......................... 26
Figure 15. BEA and RG Data on Chinese FDI Flows to the United States: 2005-2016 ............... 26
Figure 16. China and U.S. Simple Average MFN Tariff Rates ...................................................... 52
Figure 17. RMB-Dollar Exchange Rates: January 2015 to June 2018 .......................................... 57
Figure 18. Estimated Sector Effect on U.S. Employment if Both U.S. and China
Increased Tariffs by 25% on $150 Billion Worth of Imports from Each Other.......................... 69
Figure 19. Estimate of the Top 10 States that Could be Impact by Lost Exports if China
Retaliated Against U.S. Section 301-Related Tariffs.................................................................. 70
Tables
Table 1. U.S. Merchandise Trade with China: 1980-2017 .............................................................. 4
Table 2. Major U.S. Exports to China in 2017 ................................................................................ 5
Table 3. Major U.S. Merchandise Export Markets .......................................................................... 6
Table 4. Major U.S. Merchandise Imports From China in 2017 ..................................................... 9
Table 5. U.S Imports of ATP Products from China by Major Category in 2017 ........................... 10
Table 6. China’s Holdings of U.S. Treasury Securities: 2002-2017 .............................................. 21
Table 7. Summary of BEA Data on U.S.-China FDI Flows: 2016 ................................................ 23
Table 8. Top 10 Chinese Investments in the United States: 2005-2017 ........................................ 27
Table 9. Top 20 Chinese Companies on Fortune’s Global 500 in 2017 ........................................ 34
Table 10. Summaries of WTO U.S. Dispute Settlement Cases Against China ............................. 54
Table 11. U.S. Section 301 First Round 25% Tariffs Against China ............................................. 64
Table 12. U.S. Section 301 Second (Proposed) List of 25% Tariffs Against China ...................... 65
Table 13. China’s First Round of Retaliatory 25% Tariffs Against the United States: .................. 66
Table 14. China’s Second Proposed Retaliatory Tariffs on Section 301 Action: ........................... 67
Table 15. China’s Retaliatory Tariffs Against the U.S. for Steel and Aluminum .......................... 71
Appendixes
Appendix. Chinese Policies to Boost Innovation .......................................................................... 74

China-U.S. Trade Issues
Congressional Research Service
Contacts
Author Contact Information .......................................................................................................... 82
Acknowledgments ......................................................................................................................... 82

China-U.S. Trade Issues
Congressional Research Service 1
Introduction Economic and trade reforms begun in 1979 have helped transform China into one of the world’s
biggest and fastest-growing economies. China’s economic growth and trade liberalization,
including comprehensive trade commitments made upon its entry to the World Trade
Organization (WTO) in 2001, have led to a sharp expansion in U.S.-China commercial ties. Yet,
bilateral trade relations have become increasingly strained in recent years over a number of
issues, including China’s mixed record on implementing its WTO obligations; infringement of
U.S. intellectual property (such as through cyber-theft of U.S. trade secrets and forced technology
requirements placed on foreign firms); increased use of industrial policies to promote and protect
domestic Chinese firms; extensive trade and foreign investment restrictions; lack of transparency
in trade rules and regulations; distortionary economic policies that have led to overcapacity in
several industries; and its large merchandise trade surplus with the United States. China’s
economic and trade conditions, policies, and acts have a significant impact on the U.S. economy
as whole as well as specific U.S. sectors and thus are of concern to Congress. This report provides
an overview of U.S.-China commercial ties, identifies major issues of contention, describes the
Trump Administration’s trade policies toward China, and reviews possible outcomes.
Most Recent Developments: Section 301 U.S.-China commercial ties are complex and have become increasingly contentious, due largely
to China’s incomplete transition to a free market economy. The Trump Administration has
indicated its intent to take a harder line on trade policy towards China (and other countries). The
most significant action it has taken to date has been the initiation of a Section 301 case against
China’s policies on intellectual property rights, which could result in several rounds of tit-for-tat
trade sanctions and retaliation (these issues are discussed in more detail later in the report).1
Section 301 Actions Chronology
On August 14, 2017, President Trump directed the U.S. Trade Representative
(USTR) to determine whether it should launch a Section 301 investigation into
any of China’s laws, policies, practices, or actions that may be unreasonable or
discriminatory and that may be harming American intellectual property rights
(IPR), innovation, or technology development.2
On August 18, 2017, the USTR announced that it would proceed with Section
301 case against China’s IPR policies.3
On March 22, 2018, the USTR released a report detailing findings of its
investigation into China’s IPR policies.4 On the same day, President Trump
signed a Memorandum on Actions by the United States Related to the Section
301 Investigation. Described by the White House as a targeting of China’s
1 For additional information on what Section 301 is and how it works, see CRS In Focus IF10708, Enforcing U.S.
Trade Laws: Section 301 and China, by Wayne M. Morrison. 2 See announcement at https://www.whitehouse.gov/presidential-actions/presidential-memorandum-united-states-trade-
representative/. 3 Shttps://ustr.gov/sites/default/files/Section%20301%20FINAL.PDFee https://ustr.gov/about-us/policy-offices/press-
office/press-releases/2017/august/ustr-announces-initiation-section. 4 See https://ustr.gov/sites/default/files/Section%20301%20FINAL.PDF.

China-U.S. Trade Issues
Congressional Research Service 2
“economic aggression,” the memorandum identified four broad IPR-related
policies that justified U.S. action under Section 301. The Administration
proposed to (1) implement a 25% ad valorem tariffs on certain Chinese imports
(which in sum are comparable to U.S. trade losses), including aerospace,
information and communications technology, and machinery; (2) initiate a WTO
dispute settlement case against China’s “discriminatory” technology licensing
(which it did on March 23); and (3) propose new investment restrictions on
Chinese efforts to acquire sensitive U.S. technology.5 During his remarks about
the Section 301 Memorandum, President Trump said he had asked China to
immediately reduce the bilateral trade imbalance by $100 billion and indicated
that he wanted trade “reciprocity.”6
On April 3, the USTR release a list of proposed ad valorem tariffs (25%) on
1,300 tariff lines covering about $50 billion worth of imports from China.7 On
April 4, China responded by releasing a list of U.S. products that would be
subject to 25% tariff increases (including soybeans, aircraft, and motor vehicles)
and initiated a WTO dispute settlement case against the United States.8 In
response, Trump, on April 5, asked the USTR to consider proposing additional
tariff hikes on an additional $100 billion worth of Chinese goods.9
On May 3-4, the two sides held high-level talks in Beijing. The U.S. side released
a draft Framework for Discussion. It included calls for China to reduce the
bilateral trade imbalance by $200 billion over two years; address each of the four
IPR practices identified in the Section 301 findings; halt subsidies for the Made
in China 2025 initiative; remove foreign investment restrictions, make China’s
tariff levels comparable to U.S. tariff rates and remove certain nontariff barriers;
improve market access for U.S. service providers and agricultural products; and
agree not to oppose, challenge, or take any other action against the United States’
action, including in the WTO, if China failed to live up to a framework
agreement.10
On May 19, the United States and China released a joint statement outlining
progress on a number of trade issues. China agreed that it would “significantly
increase purchases of United States goods and services,” including U.S.
agricultural and energy products. China also said it would strengthen its IPR laws
and regulations, including on patents.11
5 See https://www.whitehouse.gov/presidential-actions/presidential-memorandum-actions-united-states-related-section-
301-investigation/ 6 https://www.whitehouse.gov/briefings-statements/remarks-president-trump-signing-presidential-memorandum-
targeting-chinas-economic-aggression/. 7 See https://ustr.gov/about-us/policy-offices/press-office/press-releases/2018/april/under-section-301-action-ustr 8 See China’s tariff list at https://translate.google.com/translate?sl=zh-CN&tl=en&js=y&prev=_t&hl=en&ie=UTF-8&
u=
http%3A%2F%2Fwww.scio.gov.cn%2Fxwfbh%2Fxwbfbh%2Fwqfbh%2F37601%2F38181%2Fxgzc38187%2FDocu
ment%2F1626839%2F1626839.htm&edit-text=. 9 See https://www.whitehouse.gov/briefings-statements/statement-president-donald-j-trump-additional-proposed-
section-301-remedies/. 10 For a copy of the Framework for Discussion, see https://xqdoc.imedao.com/16329fa0c8b2da913fc9058b.pdf, 11See https://www.whitehouse.gov/briefings-statements/joint-statement-united-states-china-regarding-trade-
consultations/.

China-U.S. Trade Issues
Congressional Research Service 3
On May 21, U.S. Secretary of the Treasury Steven Mnuchin stated that both sides
had suspended threatened trade sanctions.12
On May 29, the White House announced that it planned to move ahead with the
proposed Section 301 sanctions against China by imposing 25% ad valorem
tariffs on $50 billion worth of imports from China, including those related to the
Made in China 2025 initiative (final list of imports to be issued by June 15); (2)
implementing new investment restrictions and enhanced export controls on
Chinese entities and persons in regards to the acquisition of “industrially
significant technology” for national security purposes (details to be released by
June 30); and (3) continuing to pursue the WTO case against China’s licensing
policies (initiated on March 23).13
A statement by the Chinese government said
that the White House actions were “clearly contrary to the recent agreement
between the two sides.”14
On June 15, the USTR announced a two-stage plan to impose 25% ad valorem
tariffs on $50 billion worth of Chinese imports. Under the first stage, U.S. tariffs
would be increased on 818 tariff lines on roughly $34 billion worth of Chinese
products that would be implemented on July 6. For the second stage, the USTR
proposed increasing tariffs on 228 tariff lines on $16 billion worth of Chinese
imports, mainly targeting China’s industrial policies.15
On June 16, China released a two-stage retaliation list of proposed tariff increases
against the United States comparable in value to those announced by the United
States on June 15.16
In response to China’s June 16th announcement, President Trump on June 18
requested the USTR to propose a list of Chinese products valued at $200 billion
that would be subject to increased tariffs if China retaliated against the United
States. He stated further that if China raised its tariffs yet again, the United States
would pursue tariffs on another $200 billion worth of Chinese products.17
On June 27, President Trump announced that he would not issue new investment
restrictions or export controls (as part of Section 301 action against China
announcement on May 29) in lieu of legislation before Congress, the Foreign
Investment Risk Review Modernization Act (FIRRMA), which, he said, would
(if enacted) “provide additional tools to combat the predatory investment
practices that threaten our critical technology leadership, national security, and
future economic prosperity.”18
12 See http://www.foxnews.com/politics/2018/05/20/mnuchin-says-us-has-deal-with-china-to-cut-trade-deficit-will-
hold-off-on-tariffs.html. 13 See https://www.whitehouse.gov/briefings-statements/president-donald-j-trump-confronting-chinas-unfair-trade-
policies/. 14 See http://english.mofcom.gov.cn/article/newsrelease/significantnews/201805/20180502750321.shtml. 15 See https://ustr.gov/about-us/policy-offices/press-office/press-releases/2018/june/ustr-issues-tariffs-chinese-products. 16 For a translated copy of China’s tariff announcement, see https://translate.google.com/translate?sl=zh-CN&tl=en&
js=y&prev=_t&hl=en&ie=UTF-8&u=
http%3A%2F%2Fgss.mof.gov.cn%2Fzhengwuxinxi%2Fzhengcefabu%2F201806%2Ft20180616_2930325.html&edit-
text. 17 See https://www.whitehouse.gov/briefings-statements/statement-president-regarding-trade-china-2/. 18 See https://www.whitehouse.gov/briefings-statements/statement-president-regarding-investment-restrictions/.
China-U.S. Trade Issues
Congressional Research Service 4
On July 6, the Trump Administration implemented the first round of tariff
increases on $34 billion worth of Chinese products.19
China said it had taken
countermeasures to increase tariffs on U.S. imports20
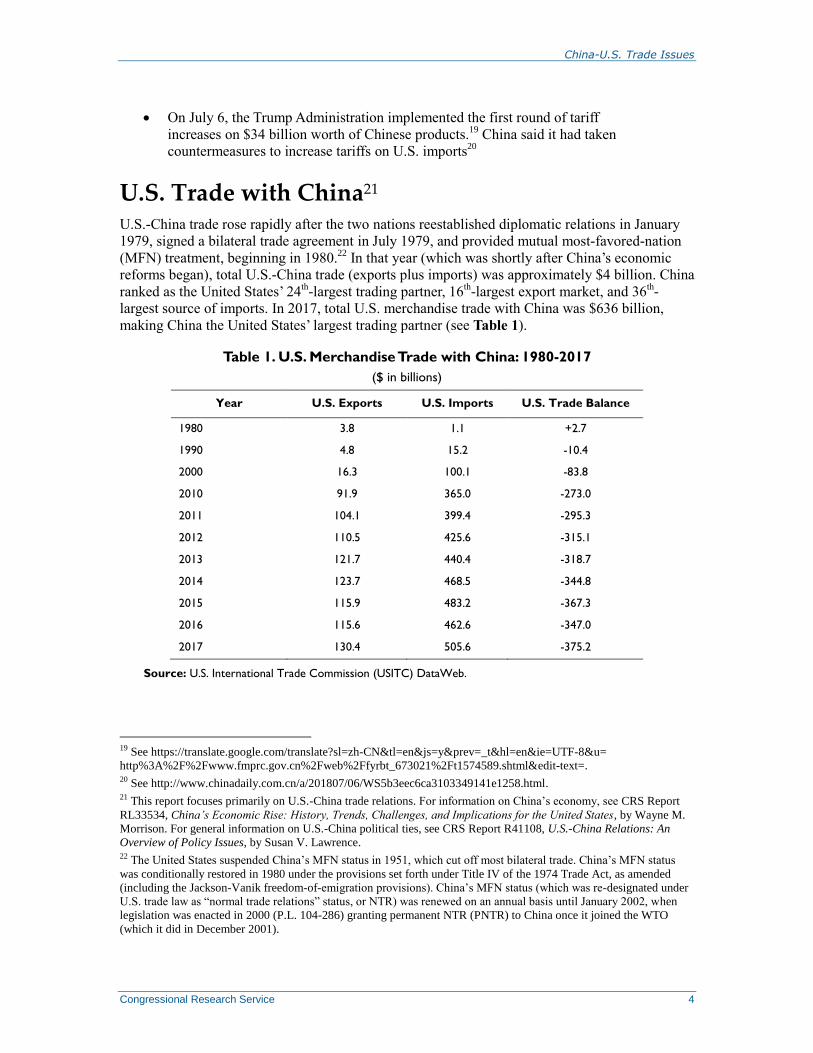
U.S. Trade with China21 U.S.-China trade rose rapidly after the two nations reestablished diplomatic relations in January
1979, signed a bilateral trade agreement in July 1979, and provided mutual most-favored-nation
(MFN) treatment, beginning in 1980.22
In that year (which was shortly after China’s economic
reforms began), total U.S.-China trade (exports plus imports) was approximately $4 billion. China
ranked as the United States’ 24th-largest trading partner, 16
th-largest export market, and 36
th-
largest source of imports. In 2017, total U.S. merchandise trade with China was $636 billion,
making China the United States’ largest trading partner (see Table 1).
Table 1. U.S. Merchandise Trade with China: 1980-2017
($ in billions)
Year U.S. Exports U.S. Imports U.S. Trade Balance
1980 3.8 1.1 +2.7
1990 4.8 15.2 -10.4
2000 16.3 100.1 -83.8
2010 91.9 365.0 -273.0
2011 104.1 399.4 -295.3
2012 110.5 425.6 -315.1
2013 121.7 440.4 -318.7
2014 123.7 468.5 -344.8
2015 115.9 483.2 -367.3
2016 115.6 462.6 -347.0
2017 130.4 505.6 -375.2
Source: U.S. International Trade Commission (USITC) DataWeb.
19 See https://translate.google.com/translate?sl=zh-CN&tl=en&js=y&prev=_t&hl=en&ie=UTF-8&u=
http%3A%2F%2Fwww.fmprc.gov.cn%2Fweb%2Ffyrbt_673021%2Ft1574589.shtml&edit-text=. 20 See http://www.chinadaily.com.cn/a/201807/06/WS5b3eec6ca3103349141e1258.html. 21 This report focuses primarily on U.S.-China trade relations. For information on China’s economy, see CRS Report
RL33534, China’s Economic Rise: History, Trends, Challenges, and Implications for the United States, by Wayne M.
Morrison. For general information on U.S.-China political ties, see CRS Report R41108, U.S.-China Relations: An
Overview of Policy Issues, by Susan V. Lawrence. 22 The United States suspended China’s MFN status in 1951, which cut off most bilateral trade. China’s MFN status
was conditionally restored in 1980 under the provisions set forth under Title IV of the 1974 Trade Act, as amended
(including the Jackson-Vanik freedom-of-emigration provisions). China’s MFN status (which was re-designated under
U.S. trade law as “normal trade relations” status, or NTR) was renewed on an annual basis until January 2002, when
legislation was enacted in 2000 (P.L. 104-286) granting permanent NTR (PNTR) to China once it joined the WTO
(which it did in December 2001).
China-U.S. Trade Issues
Congressional Research Service 5
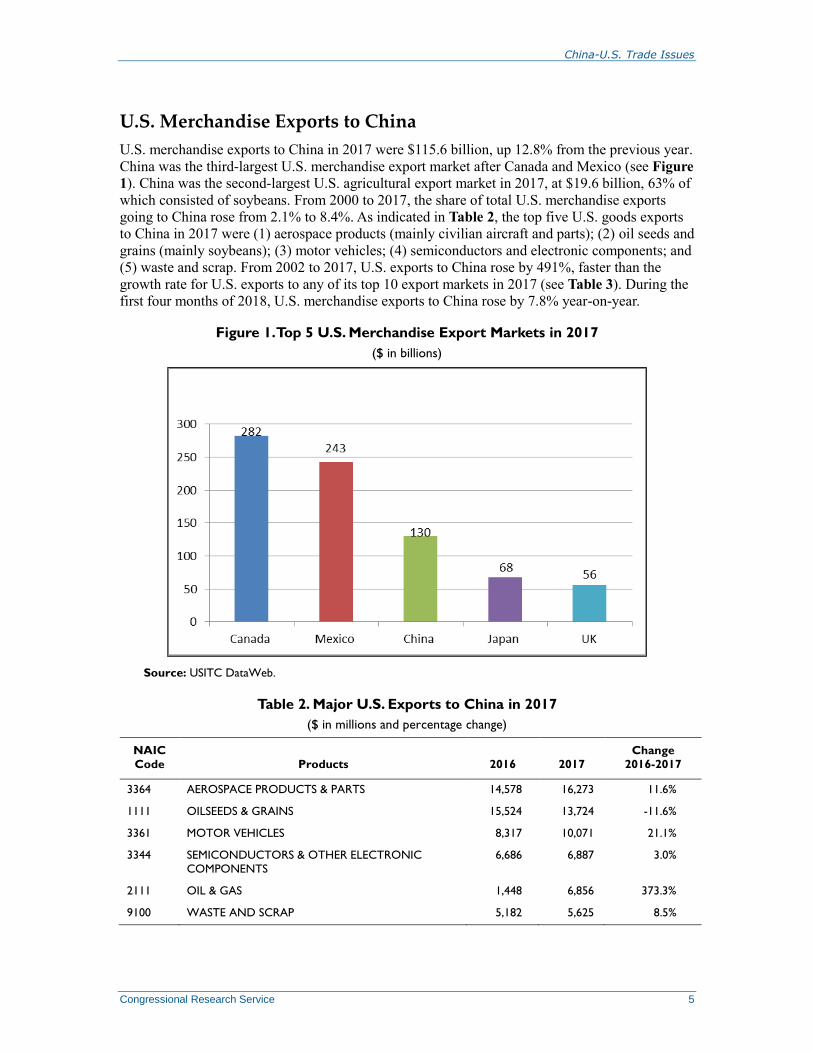
U.S. Merchandise Exports to China
U.S. merchandise exports to China in 2017 were $115.6 billion, up 12.8% from the previous year.
China was the third-largest U.S. merchandise export market after Canada and Mexico (see Figure
1). China was the second-largest U.S. agricultural export market in 2017, at $19.6 billion, 63% of
which consisted of soybeans. From 2000 to 2017, the share of total U.S. merchandise exports
going to China rose from 2.1% to 8.4%. As indicated in Table 2, the top five U.S. goods exports
to China in 2017 were (1) aerospace products (mainly civilian aircraft and parts); (2) oil seeds and
grains (mainly soybeans); (3) motor vehicles; (4) semiconductors and electronic components; and
(5) waste and scrap. From 2002 to 2017, U.S. exports to China rose by 491%, faster than the
growth rate for U.S. exports to any of its top 10 export markets in 2017 (see Table 3). During the
first four months of 2018, U.S. merchandise exports to China rose by 7.8% year-on-year.
Figure 1. Top 5 U.S. Merchandise Export Markets in 2017
($ in billions)
Source: USITC DataWeb.
Table 2. Major U.S. Exports to China in 2017
($ in millions and percentage change)
NAIC
Code Products 2016 2017
Change
2016-2017
3364 AEROSPACE PRODUCTS & PARTS 14,578 16,273 11.6%
1111 OILSEEDS & GRAINS 15,524 13,724 -11.6%
3361 MOTOR VEHICLES 8,317 10,071 21.1%
3344 SEMICONDUCTORS & OTHER ELECTRONIC
COMPONENTS
6,686 6,887 3.0%
2111 OIL & GAS 1,448 6,856 373.3%
9100 WASTE AND SCRAP 5,182 5,625 8.5%
China-U.S. Trade Issues
Congressional Research Service 6
NAIC
Code Products 2016 2017
Change
2016-2017
3345 NAVIGATIONAL/MEASURING/MEDICAL/CONTROL
INSTRUMENTS
5,466 5,582 2.1%
3251 BASIC CHEMICALS 4,595 4,897 6.6%
3252 RESIN, SYN RUBBER, ARTF & SYN FIBERS/FIL 3,577 4,123 15.3%
3254 PHARMACEUTICALS & MEDICINES 2,818 3,401 20.7%
Total 115,602 130,370 12.8%
Source: USITC DataWeb.
Note: NAIC is the North American Industrial Classification system.
Table 3. Major U.S. Merchandise Export Markets
($ in billions and percentage change)
Country 2002 2017
Percent Change
2002-2017
Canada 161 282 75.7%
Mexico 98 243 149.1%
China 22 130 491.2%
Japan 51 68 31.6%
United Kingdom 33 56 69.4%
Germany 27 53 100.9%
Korea 23 48 113.7%
Netherlands 18 42 130.3%
Hong Kong 13 40 217.4%
Brazil 12 37 198.8%
Global Total 693 1,547 123.1%
Source: USITC DataWeb and Global Trade Atlas.
Note: Ranked according to the top 10 U.S. merchandise export markets in 2017.
Many trade analysts argue that China could prove to be a much more significant market for U.S.
exports in the future. China is one of the world’s fastest-growing economies, and healthy
economic growth is projected to continue in the years ahead, provided that it implements new
comprehensive economic reforms. China’s goals of modernizing its infrastructure, rebalancing
the economy, upgrading industries, boosting the services sector, and enhancing the social safety
net could generate substantial new demand for foreign goods and services. Economic growth has
improved the purchasing power of Chinese citizens considerably, especially those living in urban
areas along the east coast of China. In addition, China’s large foreign exchange reserves (at $3.1
trillion as of May 2018) and its huge population (at 1.39 billion) make it a potentially enormous
market. To illustrate
A January 2017 study prepared by Oxford Economics for the U.S.-China
Business Council estimated that in 2015 U.S. exports of goods and services to
China plus bilateral FDI flows directly and indirectly supported 2.6 million U.S.
jobs and contributed $216 billion to U.S GDP. The study further predicted that

China-U.S. Trade Issues
Congressional Research Service 7
U.S. exports of goods and services to China would grow from $165 billion in
2015 to over $520 billion by 2030.23
In 2016, Chinese visitors to the United States totaled 3.0 million (up 15.4% over
the previous year), ranking China as the fifth-largest source of foreign visitors to
the United States.24
Chinese visitors spent $33 billion in the United States in
2016 (including on education), which was the largest source of visitor spending
in the United States.25
The U.S. Department of Commerce projects that by 2021,
Chinese visitors to the United States will total 5.7 million.26
China has the world’s largest mobile phone network with 1.48 billion mobile
phone subscribers as of April 2018,27
and the largest number of internet users at
753 million,28
as of December June 2017.
China’s online sales in 2016 totaled $752 billion (more than double the U.S. level
at $369 billion).29
Boeing Corporation delivered 202 planes to China in 2017 (26% of total global
deliveries), making it Boeing’s largest market outside the United States.30
Boeing
predicts that over the next 20 years (2017-2036), China will need 7,240 new
airplanes valued at nearly $1.1 trillion and will be Boeing’s largest commercial
airplane customer outside the United States.31
General Motors (GM) reported that it sold more cars and trucks in China than in
the United States each year from 2010 to 2017.32
GM’s China sales in 2017 were
3.9 million vehicles, compared to 3.0 million in the United States. Equity income
from GM’s joint venture operations in China was $2.0 billion in 2016. GM
vehicle unit sales to China accounted for 38.7% of its global total.33
GM expects
23 The U.S.-China Business Council, Understanding the US-China Trade Relationship, January 2017, available at
https://www.uschina.org/sites/default/files/
Oxford%20Economics%20US%20Jobs%20and%20China%20Trade%20Report.pdf. 24 China reported that it had 122 million outbound tourists in 2016 and estimated that they spent $110 billion. 25 U.S. Department of Commerce, International Trade Administration, Travel & Tourism Office, News, available at
http://tinet.ita.doc.gov/outreachpages/download_data_table/Fast_Facts_2016.pdf. 26 U.S. Department of Commerce, International Trade Administration, Travel & Tourism Office, News, available at
http://travel.trade.gov/view/f-2000-99-001/forecast/Forecast_Summary.pdf. 27 Medium, “China Has World’s Largest Online Population With 1.32 Bln Mobile Internet Subscribers< May 22, 2018,
available at https://medium.com/@yicaichina/china-has-worlds-largest-online-population-with-1-32-bln-mobile-
internet-subscribers-e665e890302. 28 Xinhua, “China’s mobile phone shipments resume growth in May,” June 10, 2018, available athttp://en.people.cn/n3/
2018/0610/c90000-9469677.html. 29 Data for China from Digital Commerce 360 at https://www.digitalcommerce360.com/2017/02/06/online-shopping-
china-grows-262-2016/ and U.S. data from the U.S. Census Bureau at https://www2.census.gov/retail/releases/
historical/ecomm/16q4.pdf. 30 Xinhuanet, “Boeing delivers record high of 202 aircraft to China in 2017,” January 25, 2018, at
http://www.xinhuanet.com/english/2018-01/25/c_136924563.htm. 31 Boeing Corporation, Current Market Outlook, 2017-2036, September 2017, p. 32, at http://www.boeing.com/
resources/boeingdotcom/commercial/market/current-market-outlook-2017/assets/downloads/2017-cmo-
compressed_091917.pdf. 32 A large share of these vehicles was produced by GM and its joint-venture partners in China. GM’s website states that
it currently has 11 joint ventures and two wholly owned foreign enterprises (employing 58,000 workers) in China. 33 General Motors, 2016 Full-Year and Fourth-Quarter Earnings, February 2017, available at http://media.gm.com/
content/dam/Media/gmcom/investor/2017/feb/earnings/GeneralMotors-q4-2016-Earnings.pdf.

China-U.S. Trade Issues
Congressional Research Service 8
China’s vehicle market to increase by 5 million units or more by 2020.34
In
addition, U.S. motor vehicle exports to China were $8.3 billion in 2016, making
it the second-largest U.S. motor vehicle export market after Canada.35
According to estimates by Credit Suisse (a global financial services company),
China overtook the United States in 2015 to become the country with the largest
middle class at 109 million adults (with wealth between $50,000 and $500,000);
the U.S. level was estimated at 92 million.36
A study by the Brookings Institute
predicts that spending by China’s middle class (using 2011 purchasing power
parity measurements) will rise from $4.2 trillion in 2015 (12% of global total) to
$14.3 trillion (22% of global total) in 2030. China’s 2030 middle class
consumption levels are predicted to be more than three times U.S. levels.37
From 2007 to 2016, China’s private consumption grew at an average annual rate
of 8.9%, compared to 1.6% growth in the United States.38
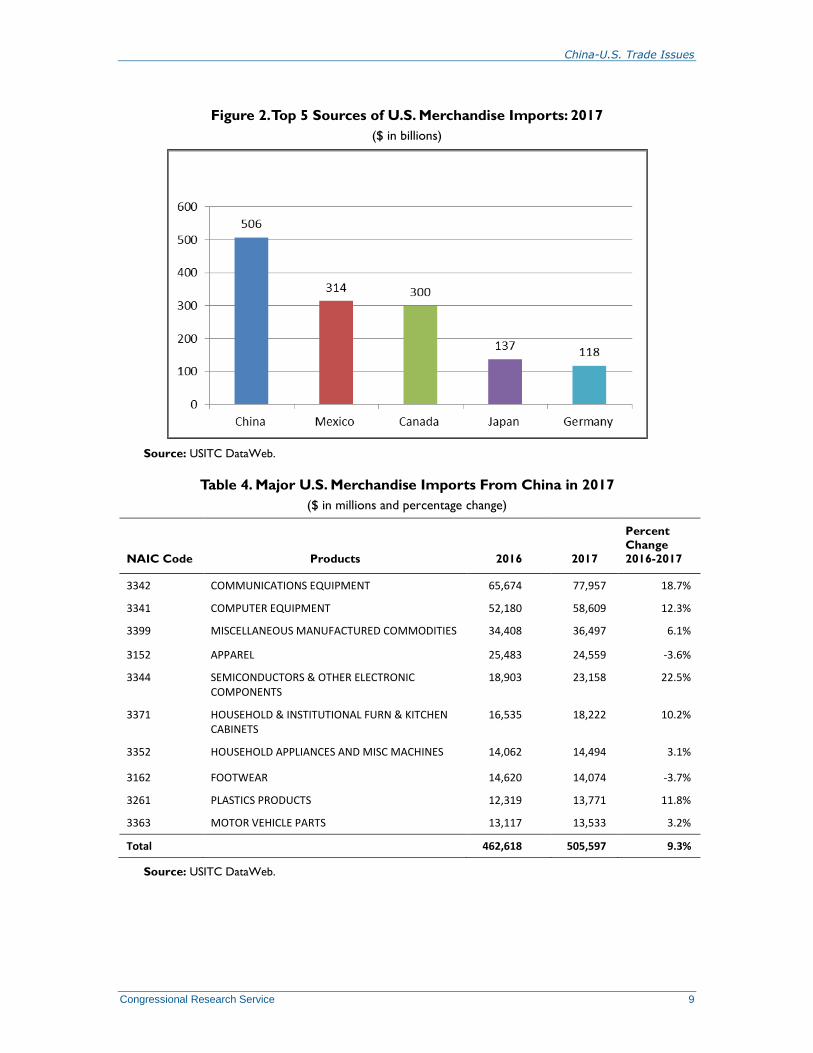
Major U.S. Merchandise Imports from China
China was the largest source of U.S. merchandise imports in 2017, at $506 billion, up 9.3% over
the previous year. China’s share of total U.S. merchandise imports rose from 8.2% in 2000 to
21.6% in 2017. The importance (ranking) of China as a source of U.S. imports has risen sharply,
from eighth largest in 1990, to fourth in 2000, to second in 2004-2006, and to first in 2007-
present (see Figure 2). The top five U.S. imports from China in 2017 were (1) communications
equipment; (2) computer equipment; (3) miscellaneous manufactured commodities (such as toys
and games); (4) apparel; and (5) semiconductors and other electronic components (see Table 4).
China was also the fourth-largest source of U.S. agricultural imports in 2017 at $4.5 billion.
34 General Motors, Media, China, General Motors Announces Growth Strategy for China, March 21, 2016, available at
http://media.gm.com/media/cn/en/gm/news.detail.html/content/Pages/news/cn/en/2016/Mar/0321_annoucement.html. 35 Source: USITC DataWeb. From January to October 2017 U.S. auto exports to China rose 24.3% year-on-year. 36 Credit Suisse, Global Wealth in 2015: Underlying Trends Remain Positive, October 3, 2015, available at
https://www.credit-suisse.com/us/en/about-us/research/research-institute/news-and-videos/articles/news-and-expertise/
2015/10/en/global-wealth-in-2015-underlying-trends-remain-positive.html. 37 The Brookings Institution, The Unprecedented Expansion of the Global Middle Class: An Update, February 2017, p.
16, at https://www.brookings.edu/wp-content/uploads/2017/02/global_20170228_global-middle-class.pdf. 38 Source: Economist Intelligence Unit, Country Data.
China-U.S. Trade Issues
Congressional Research Service 9
Figure 2. Top 5 Sources of U.S. Merchandise Imports: 2017
($ in billions)
Source: USITC DataWeb.
Table 4. Major U.S. Merchandise Imports From China in 2017
($ in millions and percentage change)
NAIC Code Products 2016 2017
Percent
Change
2016-2017
3342 COMMUNICATIONS EQUIPMENT 65,674 77,957 18.7%
3341 COMPUTER EQUIPMENT 52,180 58,609 12.3%
3399 MISCELLANEOUS MANUFACTURED COMMODITIES 34,408 36,497 6.1%
3152 APPAREL 25,483 24,559 -3.6%
3344 SEMICONDUCTORS & OTHER ELECTRONIC COMPONENTS
18,903 23,158 22.5%
3371 HOUSEHOLD & INSTITUTIONAL FURN & KITCHEN CABINETS
16,535 18,222 10.2%
3352 HOUSEHOLD APPLIANCES AND MISC MACHINES 14,062 14,494 3.1%
3162 FOOTWEAR 14,620 14,074 -3.7%
3261 PLASTICS PRODUCTS 12,319 13,771 11.8%
3363 MOTOR VEHICLE PARTS 13,117 13,533 3.2%
Total 462,618 505,597 9.3%
Source: USITC DataWeb.

China-U.S. Trade Issues
Congressional Research Service 10
Throughout the 1980s and 1990s, nearly all U.S. imports from China were low-value, labor-
intensive products, such as toys and games, consumer electronic products, footwear, and textiles
and apparel. However, over the past few years, an increasing proportion of U.S. imports from
China are more technologically advanced products (see text box below).
U.S.-China Trade in Advanced Technology Products
According to the U.S. Census Bureau, U.S. imports of “advanced technology products” (ATP) from China in 2017
totaled $171.1 billion. Information and communications products were by far the largest U.S. ATP import from China,
accounting for 91% of U.S. ATP imports from China and 60% of U.S. global imports of this category (see Table 5).
ATP products accounted for 33.8% of total U.S. merchandise imports from China. In addition, 36.8% of total U.S. ATP
imports were from China (compared with 14.1% in 2003). U.S. ATP exports to China in 2017 were $35.7 billion;
these accounted for 27.4% of total U.S. exports to China and 10.1% of U.S. global ATP exports. In comparison, U.S.
ATP exports to China in 2003 were $8.3 billion, which accounted for 29.2% of U.S. exports to China and 4.6% of
total U.S. ATP exports.39
The United States ran a $135.3 billion deficit in its ATP trade with China in 2017, up from a $21.0 billion deficit in
2003. Some see the large and growing U.S. trade deficit in ATP with China as a source of concern, contending that it
signifies the growing international competitiveness of China in high technology. Others dispute this, noting that a large
share of the ATP imports from China are in fact relatively low-end technology products and parts, such as notebook
computers, or are products that are assembled in China using imported high technology parts that are largely
developed and/or made elsewhere. Some Members of Congress have raised concerns over possible national security
implications of China’s significant role in global supply chains for various ATP products, especially those that may be
procured by U.S. government agencies.40
Table 5. U.S Imports of ATP Products from China by Major Category in 2017
Advanced Technology Products
(ATP) Category
U.S. Imports from China
($ millions)
Total U.S. Imports
($ millions)
Imports from China
as percentage of global
ATP total (%)
Biotechnology 194 26,127 0.7
Life Sciences 2,594 45,705 5.7
Opto-Electronics 5,132 23,036 22.3
Information & communications 155,535 259,392 60.0
Electronics 4,482 41,426 10.8
Flexible Manufacturing 1,347 13,726 9.8
Advanced Materials 413 2,844 14.5
Aerospace 1,027 48,592 2.1
Weapons 138 902 15.3
Nuclear Technology 25 1,698 1.5
Total U.S. ATP imports 171,067 464,258 36.8
Source: U.S. Census Bureau.
39 U.S. Census Bureau, Foreign Trade, at available at https://www.census.gov/foreign-trade/statistics/product/atp/2017/
12/ctryatp/index.html#C. 40 See for example, U.S.-China Economic and Security Review Commission, Supply Chain Vulnerabilities from China
in U.S. Federal Information and Communications Technology, April 2018, available at https://www.uscc.gov/sites/
default/files/Research/
Interos_Supply%20Chain%20Vulnerabilities%20from%20China%20in%20U.S.%20Federal%20ICT_final.pdf.

China-U.S. Trade Issues
Congressional Research Service 11
Trade in Services
China is a major U.S. trading partner in services. In 2017, China was the 4th-largest services
trading partner at $75 billion, the 3rd
-largest services export market at $57.6 billion, and the 8th-
largest source of services imports at $17.4 billion (see Figure 3). The United States ran a $40.2
billion services trade surplus with China, which was the largest services surplus of any U.S.
trading partner.
Figure 3. Major U.S. Services Trading Partners in 2017
($ in billions)
Source: BEA.
Note: Top five U.S. trading partners in total services trade (exports plus imports) in 2017.
The U.S. Merchandise Trade Deficit with China
A major concern among some U.S. policymakers is the size of the U.S. merchandise trade deficit
with China, which rose from $10 billion in 1990 to $367 billion in 2015 (see Figure 4). The
deficit fell to $347 billion in 2016, but rose to $375 billion in 2017.41
For the past several years,
the U.S. merchandise trade deficit with China has been significantly larger than with any other
U.S. trading partner (see Figure 5). Some analysts contend that the large U.S. merchandise trade
deficits with China indicate that the trade relationship is somehow unbalanced, unfair, and
damaging to the U.S. economy. Others argue that such deficits are largely a reflection of shifts in
global production and the emergence of extensive and complex supply chains, where China is
often the final point of assembly for export-oriented multinational firms that source goods from
multiple countries.
41 During the first four months of 2018, the U.S. merchandise trade deficit with China was 11.8% higher than during
the comparable period in 2017. If this trend continues, the total U.S. merchandise deficit with China could reach $420
billion in 2018.
China-U.S. Trade Issues
Congressional Research Service 12
Figure 4. U.S. Merchandise Trade Balance with China: 2000-2017
($ in billions)
Source: USITC DataWeb.
Figure 5. Five Largest U.S. Merchandise Trade Imbalances in 2017
($ in billions)
Source: USITC DataWeb.
The Transfer of Pacific Rim Production to China by
Multinational Firms
Many analysts contend that the sharp increase in U.S. imports from China (and hence the growing
bilateral trade imbalance) is largely the result of movement in production facilities from other

China-U.S. Trade Issues
Congressional Research Service 13
(primarily Asian) countries to China. That is, various products that used to be made in such places
as Japan, Taiwan, Hong Kong, etc., and then exported to the United States, are now made in
China (in many cases, by foreign firms). To illustrate, in 1990, the share of U.S. manufactured
imports from Pacific Rim countries (including China) was 47.1%, and in 2017, that share
remained relatively constant at 47.1% (see Figure 6).42
What changed was the country source of
those imports. In 1990, China accounted for 7.6% of the share of U.S. manufactured imports from
the Pacific Rim, but by 2017, that share increased to 55.4%. In other words, between 1990 and
2016, the role of China as a supplier of U.S. manufactured products among Pacific Rim countries
increased sharply, while the relative importance of the rest of the Pacific Rim (excluding China)
for these products sharply decreased. This was partly due to many multinational firms shifting
their export-oriented manufacturing facilities from other countries to China.
Figure 6. U.S. Manufactured Imports from Pacific Rim Countries as a Percentage of
Total U.S. Manufactured Imports: 1990 and 2017
Source: USITC DataWeb.
Note: Standard International Trade Classification (SITC) definition of manufactured imports.
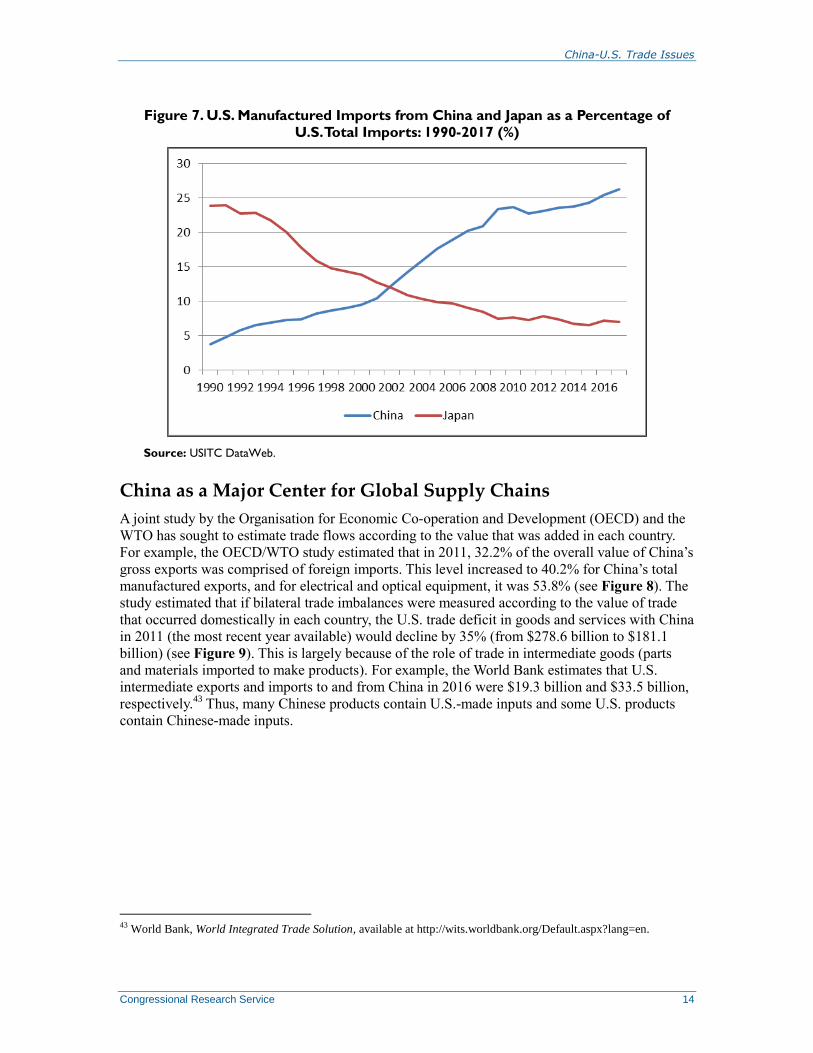
A significant amount of the shift in production appears to have involved Japan. In 1990, Japan
was the source of 23.8% of U.S. manufactured imports, but by 2017 this level had dropped to
7.0%. Conversely, China’s share of U.S. manufactured imports rose from 3.8% to 26.2% (see
Figure 7). Japan accounted for the single largest U.S. bilateral merchandise trade deficit for many
years until it was overtaken by China in 2000.
42 Pacific Rim countries include Australia, Brunei, Cambodia, China, Hong Kong, Indonesia, Japan, South Korea, Laos,
Macao, Malaysia, New Zealand, North Korea, Papua New Guinea, the Philippines, Singapore, Taiwan, Thailand,
Vietnam, and several small island nations.
China-U.S. Trade Issues
Congressional Research Service 14
Figure 7. U.S. Manufactured Imports from China and Japan as a Percentage of
U.S. Total Imports: 1990-2017 (%)
Source: USITC DataWeb.
China as a Major Center for Global Supply Chains
A joint study by the Organisation for Economic Co-operation and Development (OECD) and the
WTO has sought to estimate trade flows according to the value that was added in each country.
For example, the OECD/WTO study estimated that in 2011, 32.2% of the overall value of China’s
gross exports was comprised of foreign imports. This level increased to 40.2% for China’s total
manufactured exports, and for electrical and optical equipment, it was 53.8% (see Figure 8). The
study estimated that if bilateral trade imbalances were measured according to the value of trade
that occurred domestically in each country, the U.S. trade deficit in goods and services with China
in 2011 (the most recent year available) would decline by 35% (from $278.6 billion to $181.1
billion) (see Figure 9). This is largely because of the role of trade in intermediate goods (parts
and materials imported to make products). For example, the World Bank estimates that U.S.
intermediate exports and imports to and from China in 2016 were $19.3 billion and $33.5 billion,
respectively.43
Thus, many Chinese products contain U.S.-made inputs and some U.S. products
contain Chinese-made inputs.
43 World Bank, World Integrated Trade Solution, available at http://wits.worldbank.org/Default.aspx?lang=en.

China-U.S. Trade Issues
Congressional Research Service 15
Figure 8. Estimated Percentage Foreign Value-Added to China’s Exports in 2011
Source: OECD/WTO Trade in Value-Added, October 2015.
Figure 9. Two Measurements of U.S. Trade in Goods and Services: 2011
($ in billions)
Source: OECD/WTO Trade in Value-Added, October 2015.
Note: Gross trade balances are U.S. reported data, while OECD data are estimated balances based on
measurements of the value added that occurred in each country,
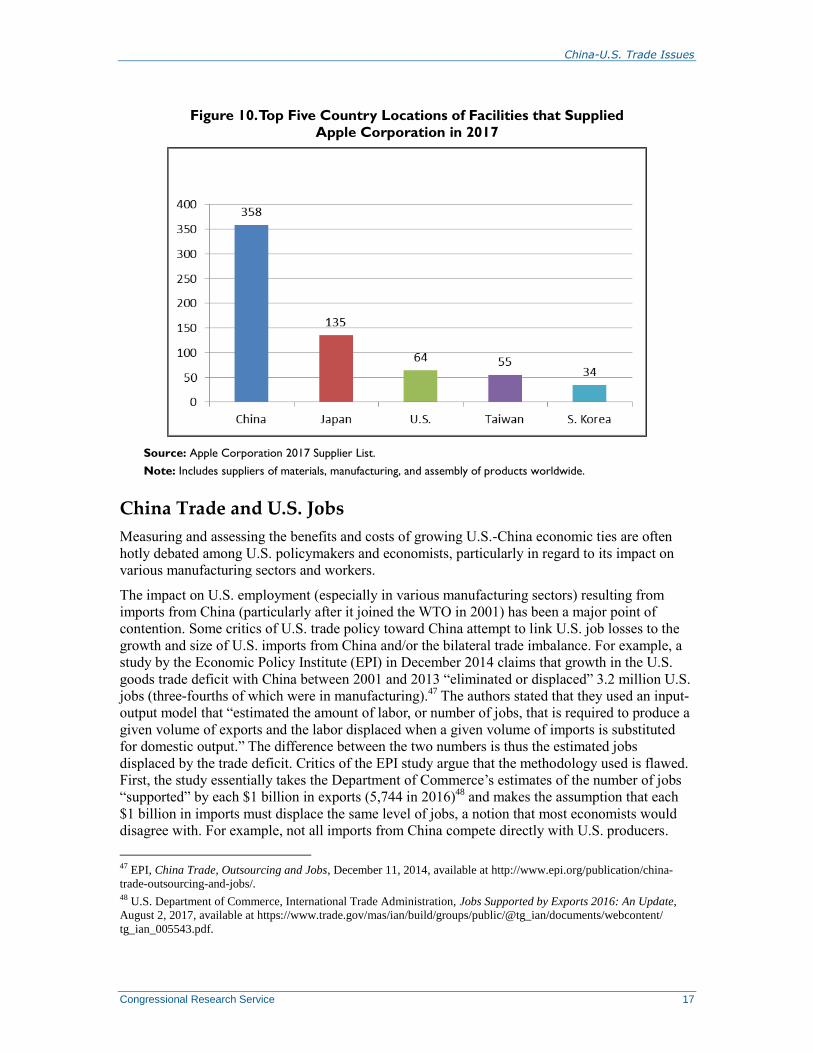
According to Apple Corporation, it used over 200 corporate suppliers with nearly 900 facilities
located around the world. The top five largest country sources of these facilities in 2017 were
China (358), Japan (137), the United States (64), Taiwan (55), and South Korea (34) (see Figure
10). Some U.S. corporate suppliers to Apple have facilities located in many countries. For
example, Intel Corporation has 10 facilities that supply products to Apple, three of which are
located in the United States, two in China, two in Malaysia, and one each in Ireland, Israel,

China-U.S. Trade Issues
Congressional Research Service 16
Malaysia, and Vietnam.44
Apple iPhones are mainly assembled in China by Taiwanese companies
(Foxconn and Pegatron) using a number of intermediate goods imported from abroad (or in many
cases, intermediates made by foreign firms in China). Many analysts have estimated that the
value-added that occurs in China in the production of the iPhone is small relative to the total
value of the product because it mainly involves assembling foreign-made or foreign-owned
components. Apple Corporation, on the other hand, is thought to be the single largest beneficiary
(in terms of gross profit) on the sale of the iPhone. However, conventional trade data does not
accurately attribute the value-added that occurs in each stage of making the iPhone. Rather, when
the United States imports iPhones from China, U.S. trade data attributes nearly the full value of
the product as originating in China, which some argue artificially inflates the size of the U.S.
trade deficit with China.
One 2010 study estimated that in 2009, China exported 11.3 million iPhones to the United States,
with a shipping price of $179 per unit and total export value at $2.0 billion. The study estimated
that 96.4% of the value of the iPhone was attributed to foreign suppliers and producers of
components and parts, including the United States (at $122 million). Standard trade data would
put China’s trade surplus in iPhone trade with the United States at $1.9 billion, but that level
would fall to $73.5 million if that trade was measured according to the value-added that occurred
in each country.45
Several analysts have concluded that Apple’s innovation in developing and
engineering its products, along with its ability to source most of its production in low-cost
countries, such as China, has helped enable the company to become a highly competitive and
profitable firm (as well as a source for high-paying jobs in the United States).46
Apple products
illustrate that the rapidly changing nature of global supply chains has made it increasingly
difficult to interpret the implications of U.S. trade data because, while they may show where
products are being imported from, they often fail to reflect who benefits from that trade.
44 Apple Corporation, 2017 Supplier List, February 2018, available at https://images.apple.com/supplier-responsibility/
pdf/Apple-Supplier-List.pdf. 45 ADB Institute, How the iPhone Widens the United States Trade Deficit with the People’s Republic of China,
December 2010, available at http://www.adb.org/publications/how-iphone-widens-united-states-trade-deficit-peoples-
republic-china. Note, given the changing nature of Apple’s supply chains, it is unclear if the estimates of value-added
still hold true today. 46 Communications of the ACM, Who Captures Value in a Global Innovation Network? The Case of Apple’s iPod,
March 2009.
China-U.S. Trade Issues
Congressional Research Service 17
Figure 10. Top Five Country Locations of Facilities that Supplied
Apple Corporation in 2017
Source: Apple Corporation 2017 Supplier List.
Note: Includes suppliers of materials, manufacturing, and assembly of products worldwide.
China Trade and U.S. Jobs
Measuring and assessing the benefits and costs of growing U.S.-China economic ties are often
hotly debated among U.S. policymakers and economists, particularly in regard to its impact on
various manufacturing sectors and workers.
The impact on U.S. employment (especially in various manufacturing sectors) resulting from
imports from China (particularly after it joined the WTO in 2001) has been a major point of
contention. Some critics of U.S. trade policy toward China attempt to link U.S. job losses to the
growth and size of U.S. imports from China and/or the bilateral trade imbalance. For example, a
study by the Economic Policy Institute (EPI) in December 2014 claims that growth in the U.S.
goods trade deficit with China between 2001 and 2013 “eliminated or displaced” 3.2 million U.S.
jobs (three-fourths of which were in manufacturing).47
The authors stated that they used an input-
output model that “estimated the amount of labor, or number of jobs, that is required to produce a
given volume of exports and the labor displaced when a given volume of imports is substituted
for domestic output.” The difference between the two numbers is thus the estimated jobs
displaced by the trade deficit. Critics of the EPI study argue that the methodology used is flawed.
First, the study essentially takes the Department of Commerce’s estimates of the number of jobs
“supported” by each $1 billion in exports (5,744 in 2016)48
and makes the assumption that each
$1 billion in imports must displace the same level of jobs, a notion that most economists would
disagree with. For example, not all imports from China compete directly with U.S. producers.
47 EPI, China Trade, Outsourcing and Jobs, December 11, 2014, available at http://www.epi.org/publication/china-
trade-outsourcing-and-jobs/. 48 U.S. Department of Commerce, International Trade Administration, Jobs Supported by Exports 2016: An Update,
August 2, 2017, available at https://www.trade.gov/mas/ian/build/groups/public/@tg_ian/documents/webcontent/
tg_ian_005543.pdf.

China-U.S. Trade Issues
Congressional Research Service 18
Many are products that used to be made in other countries, and thus an increase in imports from
China alone did not necessarily displace U.S. domestic producers. In addition, some imports from
China contain U.S.-made intermediate parts (such as semiconductors) made in the United States.
Many imports from China are final assembled products (such as Apple iPhones) with a relatively
small share of value-added from China, and the jobs generated or supported by innovating the
products are not accounted for in the trade data. Finally, factors other than trade, such as
technological innovation, may also affect job levels in some sectors.
Similarly, while China is the largest source of U.S. merchandise imports, the overall impact on
the U.S. economy is relatively small. A Federal Reserve Bank of San Francisco study examined
U.S. consumer spending and estimated that, in 2010, U.S. personal consumption expenditures
(PCE) of domestically sourced goods and services goods was 88.5% of total U.S. PCE (total
imports accounted for 11.5%). Imports from China accounted for 2.7% of U.S. PCE, but less than
half of this amount was attributed to the actual cost (price) of Chinese imports—the rest went to
U.S. businesses and workers transporting, selling, and marketing the Chinese-made products,
which, the study estimated, would reduce China’s share of U.S. PCE to 1.9%.49
Economists generally argue that trade has an overall positive impact on the economy. Low-cost
imports boost consumer welfare, increase consumer choices, and help lower inflation. However,
some economists contend that the benefits of trade are not equally spread. Some sectors can be
negatively impacted, affecting employment and wages, and such negative effects can be
concentrated in certain regions or industries, and adjusting to such shocks can be challenging. A
2014 study by the National Bureau of Economic Research (NBER) concluded that increased
import penetration from China from 1999 to 2011 directly and indirectly resulted in net U.S. job
losses of 2.0 million to 2.4 million U.S. jobs, and accounted for 10% of the decline in U.S.
manufacturing jobs during this period.50
Another NBER study asserted that China’s rise as an economic power has “induced an epochal
shift in patterns of world trade” and has “challenged much of the received empirical wisdom
about how labor markets adjust to trade shocks.” The study said that for workers in import-
competing firms, “adjustment in local labor markets is remarkably slow, with wages and labor-
force participation rates remaining depressed and unemployment rates remaining elevated for at
least a full decade after the China trade shock commences. Exposed workers experience greater
job churning and reduced lifetime income,” in part because workers that may lose their jobs due
to imports often remain in highly exposed industries or regions, which are subject to further trade
shocks.51
The study claimed that there is little evidence for substantial off-setting employment
gains in local industries not exposed to the trade shock.
Critics of the two NBER studies contend that while trade may impact the composition of jobs in
the U.S. economy, it has little long-term effect on the number of jobs, which they argue is largely
a function of aggregate demand. They also point out that between 2010 and 2015, the number of
U.S. manufacturing jobs rose by 6.8% even though U.S. imports from China increased by 32.4%.
In addition, U.S. manufacturing output during this period rose by 15.3%. Some economists
contend that U.S. productivity has been a major cause of job losses in manufacturing. A study by
49 Federal Reserve Bank of San Francisco, FRBSF Economic Letter, August 11, 2016, available at
http://www.frbsf.org/economic-research/publications/economic-letter/2011/august/us-made-in-china/. 50 NBER, Import Competition and the Great U.S. Employment Sag of the 2000s, August 2014, available at
http://www.nber.org/papers/w20395.pdf. 51 NBER, The China Shock: Learning from Labor Market Adjustment to Large Changes in Trade, January 2016,
available at http://nber.org/papers/w21906.
China-U.S. Trade Issues
Congressional Research Service 19
Ball State University attributed 88% of U.S. manufacturing job losses from 2000 to 2010 to
productivity gains, noting that had the United States “kept 2000-levels of productivity and applied
them to 2010-levels of production, we would have required 20.9 million manufacturing workers.
Instead, we employed only 12.1 million.”52
Similarly, while China is the largest source of U.S. merchandise imports, the overall impact on
the U.S. economy is relatively small. A Federal Reserve Bank of San Francisco study examined
U.S. consumer spending and estimated that, in 2010, U.S. personal consumption expenditures
(PCE) of domestically sourced goods and services goods was 88.5% of total U.S. PCE (total
imports accounted for 11.5%). Imports from China accounted for 2.7% of U.S. PCE, but less than
half of this amount was attributed to the actual cost (price) of Chinese imports—the rest went to
U.S. businesses and workers transporting, selling, and marketing the Chinese-made products,
which, the study estimated, would reduce China’s share of U.S. PCE to 1.9%.53
U.S.-China Investment Ties: Overview Investment plays a large and growing role in U.S.-China commercial ties.
54 China’s investment in
U.S. assets can be broken down into several categories, including holdings of U.S. securities,
foreign direct investment (FDI), and other nonbond investments. The Department of the Treasury
defines foreign holdings of U.S. securities as “U.S. securities owned by foreign residents
(including banks and other institutions), except where the owner has a direct investment
relationship with the U.S. issuer of the securities.”55
U.S. statutes define FDI as “the ownership or
control, directly or indirectly, by one foreign resident of 10% or more of the voting securities of
an incorporated U.S. business enterprise or the equivalent interest in an unincorporated U.S.
business enterprise, including a branch.”56
The Bureau of Economic Analysis (BEA) is the main
U.S. government agency that collects and reports data on FDI flows to and from the United
States, which is done on a balance of payment basis.57
China has also invested in a number of
U.S. companies, projects, and various ventures that do not meet the U.S. definition of FDI, and
thus, are not reflected in BEA’s data.
For many years, the accumulation of foreign exchange reserves (FERs) has been a major driver of
China’s overseas investment. China’s FERs result from: (1) large annual trade surpluses and FDI
52 Ball State University, The Myth and the Reality of Manufacturing in America, June 2015, available at
http://conexus.cberdata.org/files/MfgReality.pdf. 53 Federal Reserve Bank of San Francisco, FRBSF Economic Letter, August 11, 2016, available at
http://www.frbsf.org/economic-research/publications/economic-letter/2011/august/us-made-in-china/. 54 Investment is often a major factor behind trade flows. Firms that invest overseas often import machinery, parts, and
other inputs from the parent company abroad to manufacture products for export or sale locally. Other such invested
overseas firms may produce inputs and ship them to their parent company for final production. 55 U.S. Department of the Treasury, Federal Reserve Bank of New York, and Board of Governors of the Federal
Reserve System, Foreign Portfolio Holdings of U.S. Securities as of June 30, 2016, April 2017, available at
http://ticdata.treasury.gov/Publish/shla2016r.pdf. 56 15 CFRS 806.15(a)(1). The 10% ownership share is the threshold considered to represent an effective voice or
lasting influence in the management of an enterprise. See BEA, International Economic Accounts, BEA Series
Definitions, available at http://www.bea.gov/international. 57 BEA also reports FDI data according to broad industrial sections, including mining; utilities; wholesale trade;
information; depository institutions; finance (excluding depository institutions); professional, scientific, and technical
services; nonbank holding companies; manufacturing (including food, chemicals, primary and fabricated metals,
machinery, computers and electronic products, electrical equipment, appliances and components, transportation
equipment, and other manufacturing); and other industries.

China-U.S. Trade Issues
Congressional Research Service 20
inflows; (2) intervention by the Chinese government to halt or slow the value of its currency, the
renminbi (RMB); and (3) restrictions on capital outflows by private Chinese citizens. Rather than
holding foreign currencies, such as U.S. dollars which would earn no interest, the Chinese
government has invested much of those reserves abroad. For many years, much of that investment
has gone into U.S. Treasury securities. Although they generate low returns, such securities are
generally viewed globally as a relatively safe investment because they are backed by the full faith
and credit of the U.S. government and are liquid (e.g., easily sold), albeit generating relatively
small rates of returns. More recently, the Chinese government has diversified its investments in
order to obtain higher returns, such as by encouraging its firms (especially SOEs) to invest
overseas to become more globally competitive, as well as to help China gain access to raw
materials (such as oil), food, and technology. As a result, Chinese annual FDI outflows have
grown significantly in recent years, rising from $21 billion in 2006 to $183 billion in 2016,
making China the second-largest source of annual global FDI outflows.58
U.S. investment in China has largely been in the form of FDI flows (due in part to Chinese
restrictions on portfolio investment).59
Initially, most U.S. FDI flows (especially after China
began to open up its economy in 1979) likely went toward export-oriented manufacturing to take
advantage of China’s relatively low wages. In more recent years, as China’s economy has rapidly
grown, a larger share of U.S. FDI in China has gone to tap into the country’s booming domestic
demand for goods and services. However, many U.S. firms raise concerns that Chinese
investment restrictions and requirements (such as technology sharing) often hamper their efforts.
China’s Holdings of U.S. Public and Private Securities60
China’s holdings of U.S. public and private securities are significant and by far constitute the
largest category of Chinese investment in the United States.61
These securities include U.S.
Treasury securities, U.S. government agency (such as Freddie Mac and Fannie Mae) securities,
corporate securities, and equities (such as stocks). China’s investment in public and private U.S.
securities totaled $1.54 trillion as of June 2017, making it the fourth-largest holder after Japan,
the Cayman Islands, and the United Kingdom.62
U.S. Treasury securities, which help the federal
government finance its budget deficits, are the largest category of U.S. securities held by China.63
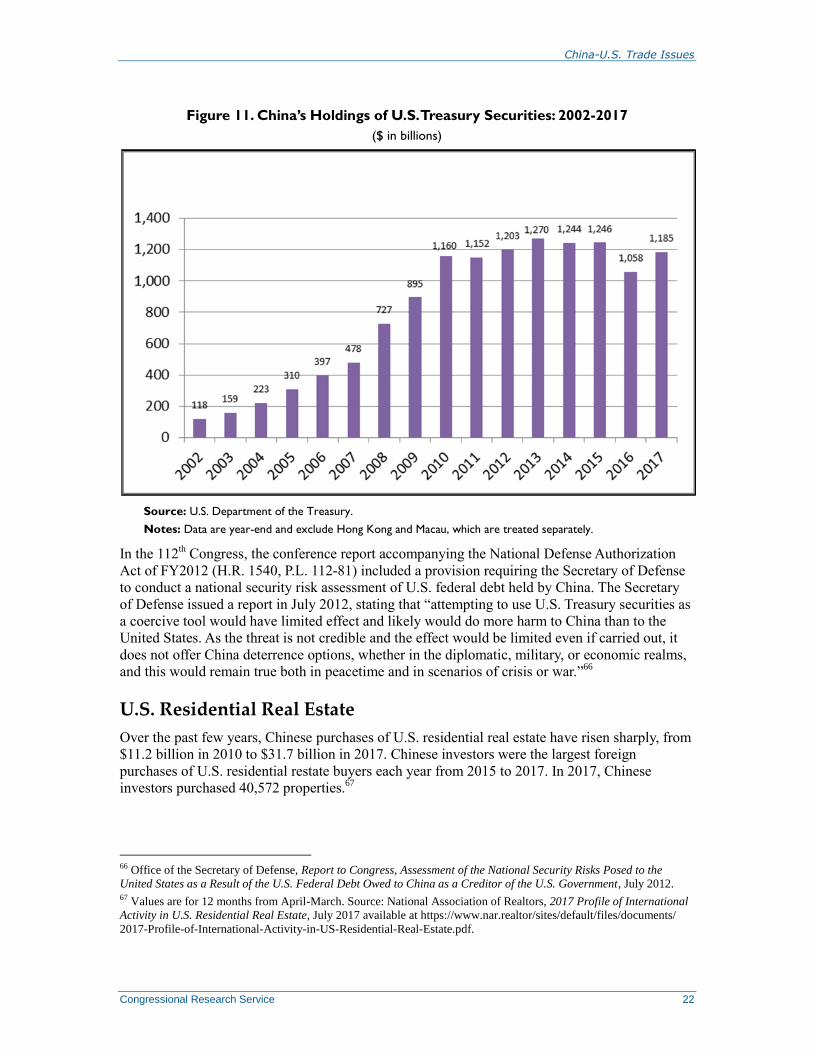
As indicated in Table 6 and Figure 11 (which show end-year data), China’s holdings of U.S.
Treasury securities increased from $118 billion in 2002 to $1.24 trillion in 2014, but fell to $1.06
trillion in 2016. They rose to nearly $1.19 trillion in 2017, making China the largest foreign
holder of U.S. Treasury securities.64
China’s holdings of U.S. Treasury securities as a share of
total foreign holdings rose from 9.6% in 2002 to a historical high of 26.1% in 2010. That level
58 United Nations Conference on Trade and Development, World Investment Report 2016, June 22, 2016, available at
http://unctad.org/en/PublicationsLibrary/wir2016_Overview_en.pdf. 59 U.S. portfolio investment in China through 2016 was $101.4 billion, mostly in equities. Source: U.S. Department of
Treasury, Federal Reserve Bank of New York, and Board of Governors of the Federal Reserve System, U.S. Portfolio
Holdings of Foreign Securities as of December 31, 2016, October 2017. 60 For additional information on this issue, see CRS Report RL34314, China’s Holdings of U.S. Securities: Implications
for the U.S. Economy, by Wayne M. Morrison and Marc Labonte. 61 About 70% of China’s total holdings of U.S. government and private securities are in U.S. Treasury securities. 62 U.S. Department of the Treasury, Preliminary Report on Foreign Portfolio Holdings of U.S. Securities as of June
2017, February 2018, available at https://home.treasury.gov/news/press-releases/sm0301. 63 Some describe foreign holdings of U.S. Treasury securities as “foreign ownership of U.S. government debt.” 64 China’s holdings of U.S. Treasuries could be higher as Department of the Treasury data may not always capture
Chinese purchases of U.S. Treasury securities that may occur in global financial centers.

China-U.S. Trade Issues
Congressional Research Service 21
fell to 17.6% in 2016, but rose to 18.8% in 2017.65
China’s holdings of U.S. Treasury securities as
of April 2018 were $1.18 trillion and constituted 19.2% of total foreign holdings.
Table 6. China’s Holdings of U.S. Treasury Securities: 2002-2017
2002 2004 2006 2008 2010 2012 2014 2016 2017
China’s
holdings
($ billions)
118 223 397 727 1,160 1,203 1,244 1,058 1,185
China’s
holdings as a
percentage
of total
foreign holdings
9.6% 12.1% 18.9% 23.6% 26.1% 23.0% 21.7% 17.6% 18.7%
Source: U.S. Department of the Treasury.
Note: Annual data are year-end. Data excludes Hong Kong and Macau which are treated separately.
Some analysts and Members of Congress have sometimes raised concerns that China’s large
holdings of U.S. debt securities could give it leverage over U.S. foreign policy, including trade
policy. They argue, for example, that China might attempt to sell (or threaten to sell) a large share
of its U.S. debt securities over a policy dispute, which could damage the U.S. economy. Others
counter that China’s holdings of U.S. debt give it very little practical leverage over the United
States. They argue that, given China’s economic dependency on a stable and growing U.S.
economy, and its substantial holdings of U.S. securities, any attempt to try to sell a large share of
those holdings would likely damage both the U.S. and Chinese economies. It could also cause the
U.S. dollar to sharply depreciate against global currencies, which could reduce the value of
China’s remaining holdings of U.S. dollar assets.
65 In addition to China’s FDI in the United States and its holdings in U.S. Treasury securities, China (as of June 2016)
held $178 billion in U.S. equities (such as stocks), up from $3 billion in June 2005. It also held $196 billion in U.S.
agency securities and $15 billion in corporate debt.
China-U.S. Trade Issues
Congressional Research Service 22
Figure 11. China’s Holdings of U.S. Treasury Securities: 2002-2017
($ in billions)
Source: U.S. Department of the Treasury.
Notes: Data are year-end and exclude Hong Kong and Macau, which are treated separately.
In the 112th Congress, the conference report accompanying the National Defense Authorization
Act of FY2012 (H.R. 1540, P.L. 112-81) included a provision requiring the Secretary of Defense
to conduct a national security risk assessment of U.S. federal debt held by China. The Secretary
of Defense issued a report in July 2012, stating that “attempting to use U.S. Treasury securities as
a coercive tool would have limited effect and likely would do more harm to China than to the
United States. As the threat is not credible and the effect would be limited even if carried out, it
does not offer China deterrence options, whether in the diplomatic, military, or economic realms,
and this would remain true both in peacetime and in scenarios of crisis or war.”66
U.S. Residential Real Estate
Over the past few years, Chinese purchases of U.S. residential real estate have risen sharply, from
$11.2 billion in 2010 to $31.7 billion in 2017. Chinese investors were the largest foreign
purchases of U.S. residential restate buyers each year from 2015 to 2017. In 2017, Chinese
investors purchased 40,572 properties.67
66 Office of the Secretary of Defense, Report to Congress, Assessment of the National Security Risks Posed to the
United States as a Result of the U.S. Federal Debt Owed to China as a Creditor of the U.S. Government, July 2012. 67 Values are for 12 months from April-March. Source: National Association of Realtors, 2017 Profile of International
Activity in U.S. Residential Real Estate, July 2017 available at https://www.nar.realtor/sites/default/files/documents/
2017-Profile-of-International-Activity-in-US-Residential-Real-Estate.pdf.

China-U.S. Trade Issues
Congressional Research Service 23
Bilateral Foreign Direct Investment Flows68
The level of foreign direct investment (FDI) flows between China and the United States is
relatively small given the large volume of trade between the two countries. Many analysts
contend that an expansion of bilateral FDI flows could greatly expand commercial ties.69
BEA
data on U.S.-China FDI (see Table 7) indicate that in 2016
U.S. FDI flows to China were $9.5 billion (up 28.2% over 2015 flows), making
China the ninth-largest destination of U.S. FDI outflows.
The stock of U.S. FDI in China on a historical-cost basis (i.e., the book value)
was $92.5 billion (up 9.4% over the previous year), making China the 12th-largest
overall destination of U.S. FDI through 2016.
Chinese FDI flows to the United States were $10.3 billion (up 74.7% over 2015
levels), making China the 11th-largest source of U.S. FDI inflows in 2016.
At the end of 2016, the stock of Chinese FDI in the United States on a historical-cost basis, was
$27.5 billion (up 63.7% over the previous year), making China the 16th-largest overall source of
U.S. FDI through 2016.70
Table 7. Summary of BEA Data on U.S.-China FDI Flows: 2016
FDI Data Quantity ($ millions) Ranking of FDI Flows
U.S. FDI flows to China in 2016 9,474 9th
China FDI flows to U.S. in 2016 10,337 11th
Stock of U.S. FDI in China through 2016 92,481 12th
Stock of Chinese FDI in U.S. through 2016 58,154 16th
Source: Bureau of Economic Analysis.
Notes: FDI stock data are on a historical-cost basis. Rankings were made using only countries and exclude
broad groupings of territories or islands. Data for China exclude Hong Kong and Macau which are counted
separately.
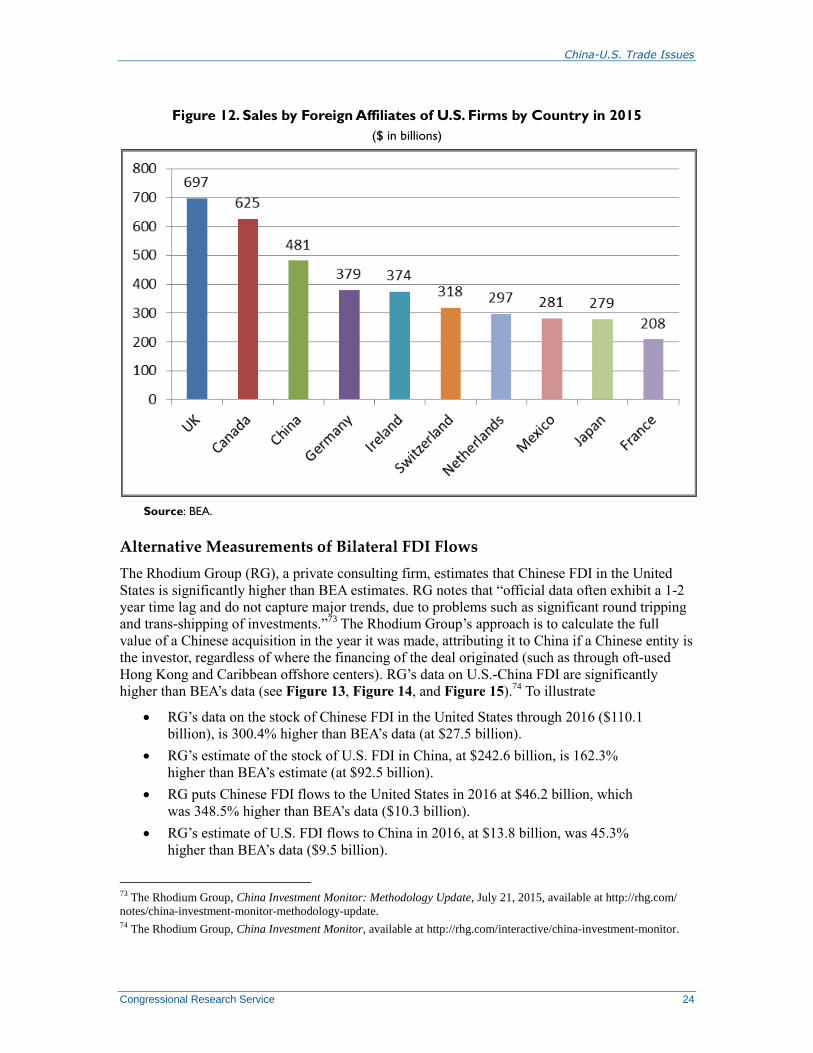
BEA also collects various financial data of foreign-invested multilateral firms. Data for 2015 (the
most recent year available) indicate that sales by foreign affiliates of U.S. firms in China totaled
$481 billion,71
which was the third-largest market for U.S.-affiliated firms overseas, after the
United Kingdom ($697 billion) and Canada ($625 billion) (see Figure 12). In addition, U.S.
affiliates in China employed 2.1 million workers, paid $35 billion in employment compensation,
and spent $3.4 billion on R&D.72
68 For a general discussion of U.S. FDI data and issues, see CRS In Focus IF10636, Foreign Direct Investment:
Overview and Issues, by James K. Jackson and Shayerah Ilias Akhtar. 69 According to the BEA, direct investment implies that a person in one country has a lasting interest in, and a degree of
influence over, the management of, a business enterprise in another country. As such, it defines FDI as ownership or
control of 10% or more of an enterprise’s voting securities, or the equivalent, is considered evidence of such a lasting
interest or degree of influence over management. 70 Data on country sources of U.S. FDI inflows should be interpreted with caution as they may not fully reflect the
ultimate beneficiary of that investment owner (UBO). For example, a foreign company located in one country that
invests in the United States may be owned by a multinational corporation headquartered in another country. 71 That level rises to $630 billion when sales by U.S. affiliates in Hong Kong are included. 72 BEA, at https://www.bea.gov/international/direct_investment_multinational_companies_comprehensive_data.htm.
China-U.S. Trade Issues
Congressional Research Service 24
Figure 12. Sales by Foreign Affiliates of U.S. Firms by Country in 2015
($ in billions)
Source: BEA.
Alternative Measurements of Bilateral FDI Flows
The Rhodium Group (RG), a private consulting firm, estimates that Chinese FDI in the United
States is significantly higher than BEA estimates. RG notes that “official data often exhibit a 1-2
year time lag and do not capture major trends, due to problems such as significant round tripping
and trans-shipping of investments.”73
The Rhodium Group’s approach is to calculate the full
value of a Chinese acquisition in the year it was made, attributing it to China if a Chinese entity is
the investor, regardless of where the financing of the deal originated (such as through oft-used
Hong Kong and Caribbean offshore centers). RG’s data on U.S.-China FDI are significantly
higher than BEA’s data (see Figure 13, Figure 14, and Figure 15).74
To illustrate
RG’s data on the stock of Chinese FDI in the United States through 2016 ($110.1
billion), is 300.4% higher than BEA’s data (at $27.5 billion).
RG’s estimate of the stock of U.S. FDI in China, at $242.6 billion, is 162.3%
higher than BEA’s estimate (at $92.5 billion).
RG puts Chinese FDI flows to the United States in 2016 at $46.2 billion, which
was 348.5% higher than BEA’s data ($10.3 billion).
RG’s estimate of U.S. FDI flows to China in 2016, at $13.8 billion, was 45.3%
higher than BEA’s data ($9.5 billion).
73 The Rhodium Group, China Investment Monitor: Methodology Update, July 21, 2015, available at http://rhg.com/
notes/china-investment-monitor-methodology-update. 74 The Rhodium Group, China Investment Monitor, available at http://rhg.com/interactive/china-investment-monitor.

China-U.S. Trade Issues
Congressional Research Service 25
Both BEA and RG data indicate a sharp increase in Chinese FDI flows to the United States in
2016 over the previous year. BEA’s data show a 28.2% rise while RG’s data indicate a 201.9%
surge.
The Chinese government reports in 2017 that its global overseas nonfinancial FDI dropped by
29.4% over the same period in 2016.75
The RG’s data of 2017 indicate that Chinese FDI flows to
the United States in 2017 were $29.4 billion, a 36.4% decline over the previous year, RG
estimates that during the first half of 2018, Chinese FDI in the United States totaled $1.8 billion, a
90% drop over the first half of 2017 and the lowest level in seven years.76
Some of the decline in
China’s overseas FDI appears to be largely driven by new Chinese policies to seek to increase
scrutiny of proposed overseas investments to ensure that they are not “irrational or illegal.” In
February 2018, the Chinese government announced that it would take over Anbang Insurance
Company (which owns the Waldorf Astoria in New York City and other U.S. properties) for a
year because of illegal business practices that allegedly threatened the solvency of the company.77
Falling Chinese FDI in the United States may also be the result of closer scrutiny to proposed
Chinese acquisitions of U.S. assets by U.S. officials.
Figure 13. BEA and RG Estimates of the Stock of U.S.-China FDI through 2016
($ in billions)
Source: Bureau of Economic Analysis and the Rhodium Group.
Note: BEA and the Rhodium Group use different methodologies to measure China’s FDI in the United States.
75 China Daily, “China outbound investment drops 29.4% in 2017,” January 16, 2018, at
http://www.chinadaily.com.cn/a/201801/16/WS5a5dab1ea3102c394518f95c.html. 76 Rhodium Group, Arrested Development: Chinese FDI in the US in 1H 2018, June 19, 2018, available at
https://rhg.com/research/arrested-development-chinese-fdi-in-the-us-in-1h-2018/, 77 Xinhuanet, “Chinese insurance regulator takes control of Anbang Insurance Group,” February 23, 2018, available at
http://www.xinhuanet.com/english/2018-02/23/c_136993912.htm.
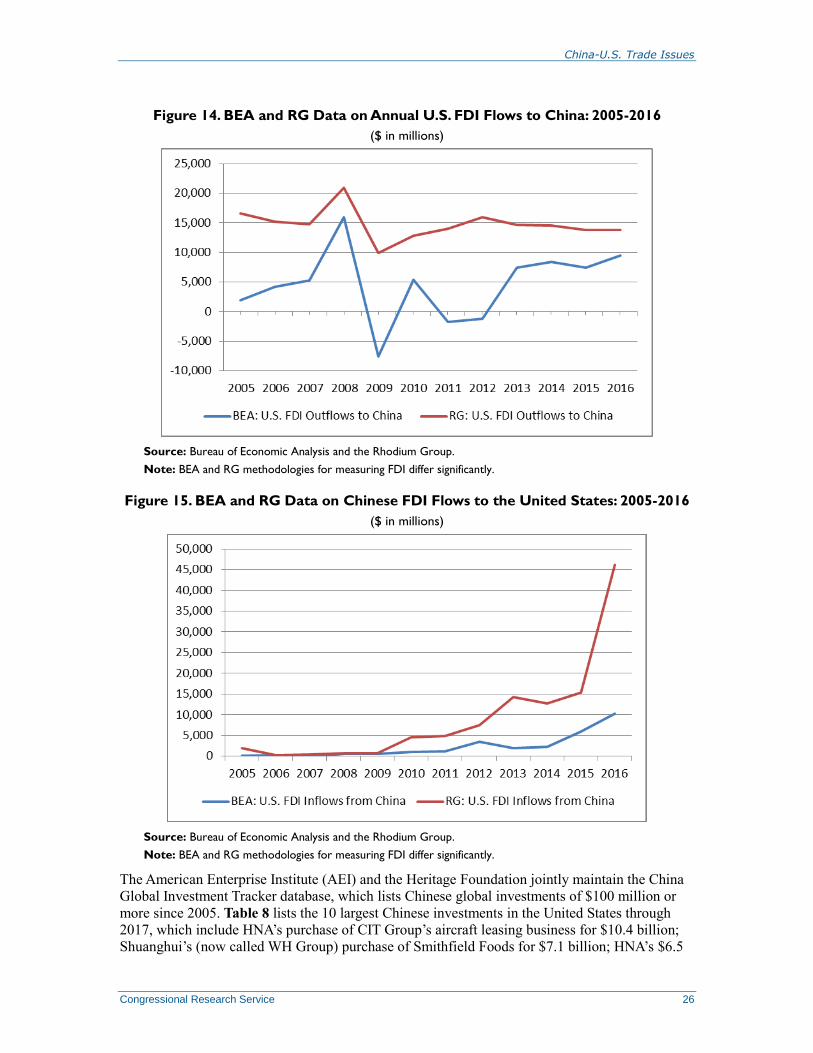
China-U.S. Trade Issues
Congressional Research Service 26
Figure 14. BEA and RG Data on Annual U.S. FDI Flows to China: 2005-2016
($ in millions)
Source: Bureau of Economic Analysis and the Rhodium Group.
Note: BEA and RG methodologies for measuring FDI differ significantly.
Figure 15. BEA and RG Data on Chinese FDI Flows to the United States: 2005-2016
($ in millions)
Source: Bureau of Economic Analysis and the Rhodium Group.
Note: BEA and RG methodologies for measuring FDI differ significantly.
The American Enterprise Institute (AEI) and the Heritage Foundation jointly maintain the China
Global Investment Tracker database, which lists Chinese global investments of $100 million or
more since 2005. Table 8 lists the 10 largest Chinese investments in the United States through
2017, which include HNA’s purchase of CIT Group’s aircraft leasing business for $10.4 billion;
Shuanghui’s (now called WH Group) purchase of Smithfield Foods for $7.1 billion; HNA’s $6.5

China-U.S. Trade Issues
Congressional Research Service 27
billion investment in Hilton from Blackstone; HNA’s purchase of Ingram Micro for $6 billion;
and Anbang’s $5.7 billion acquisition of hotel properties from Blackstone.
Table 8. Top 10 Chinese Investments in the United States: 2005-2017
Year Investor
Transaction
Value ($Millions)
Share
Size Transaction Party Sector
2017 HNA 10,380
CIT Group Transport
2013 Shuanghui 7,100 100% Smithfield Foods Agriculture
2016 HNA 6,500 25% Blackstone Tourism
2016 HNA 6,000 100% Ingram Micro Technology
2016 Anbang 5,720 Blackstone Tourism
2016 Haier 5,400 General Electric Other
2007 CIC 5,000 10% Morgan Stanley Finance
2016 Dalian Wanda 3,500 100% Legendary
Entertainment
Entertainment
2016 Zhuhai Seine
Technology and Legend
3,400 Lexmark Technology
2007 CIC 3,030 9% Blackstone Finance
Source: American Enterprise Institute and Heritage Foundation, China Global Investment Tracker.
Chinese Restrictions on U.S. FDI in China
U.S. trade officials have urged China to liberalize its FDI regime in order to boost U.S. business
opportunities in, and expand U.S. exports to, China. Although China is one of the world’s top
recipients of FDI, the Chinese central government imposes numerous restrictions on the level and
types of FDI allowed in China. According to the U.S.-China Business Council (USCBC), China
imposes ownership barriers on nearly 100 industries.78
The OECD’s 2016 FDI Regulatory
Restrictiveness Index, which measures statutory restrictions on FDI in 62 countries, ranked
China’s FDI regime as the fourth most restrictive.79
Some recent surveys by U.S. and European business groups suggest that foreign firms in China
may be less optimistic about the Chinese market than in the past, due in part to perceived growing
protectionism. To illustrate:
A 2017 American Chamber of Commerce in China (AmCham China) business
climate survey of 500 member companies found that while a majority of
respondents felt optimistic about their investments in China, 81% said that
foreign businesses in China were less welcome in China than before, compared
to 41% who asserted that in 2013. The survey found that 55% of respondents said
that foreign firms are treated less favorably treated by the Chinese government
than domestic Chinese firms.80
78 U.S.-China Business Council, China’s WTO Compliance, September 20, 2013. 79 OECD, FDI Regulatory Restrictiveness Index, at http://www.oecd.org/investment/fdiindex.htm. 80 AmCham China, 2017 China Business Climate Survey Report, January 2017.

China-U.S. Trade Issues
Congressional Research Service 28
A 2016 European Union Chamber of Commerce in China business confidence
survey stated that the business environment in China was becoming “increasingly
hostile” and “perpetually tilted in favor of domestic enterprises.” For example,
among respondents, 56% said doing business in China was becoming more
difficult and 57% claimed foreign companies tend to receive unfavorable
treatment in China compared to domestic Chinese firms.81
Negotiations for a Bilateral Investment Treaty (BIT)82
The United States and China initiated negotiations on reaching a bilateral investment treaty (BIT)
in 2008, with the goal of expanding bilateral investment opportunities. U.S. negotiators hoped
such a treaty, if implemented, would improve the investment climate for U.S. firms in China by
enhancing legal protections and dispute resolution procedures, and by obtaining a commitment
from the Chinese government that it would treat U.S. investors no less favorably than Chinese
investors.
In April 2012, the Obama Administration released a “Model Bilateral Investment Treaty” that was
developed to enhance U.S. objectives in the negotiation of new BITs.83
The new model BIT
addressed six core principles or issues for investors, including national treatment and most-
favored nation (MFN) treatment at all stages of investment, rules on expropriations and
compensation if this occurs, ability to transfer funds in and out of the country, limits on
performance requirements (such as domestic content targets or mandated technology transfer),
neutral arbitration of disputes, and freedom by investors to appoint their own senior officials.84
During the July 10-11, 2013 session of the U.S.-China Strategic and Economic Dialogue (S&ED),
China indicated its intention to negotiate a high-standard BIT with the United States that would
include all stages of investment and all sectors, a commitment a U.S. official described as “a
significant breakthrough, and the first time China has agreed to do so with another country.”85
A
press release by the Chinese Ministry of Commerce stated that China was willing to negotiate a
BIT on the basis of nondiscrimination and a negative list, meaning the agreement would identify
only those sectors not open to foreign investment on a nondiscriminatory basis (as opposed to a
BIT with a positive list which would only list sectors open to foreign investment).
During the July 9-10, 2014 S&ED session, the two sides agreed to a broad timetable for reaching
agreement on core issues and major articles of the treaty text, and committed to initiate the
“negative list” negotiation early in 2015.86
During BIT negotiations held in June 2015, each side
submitted their first negative list proposals, and later agreed to submit a revised list in September
2015 right before President Xi’s summit visit to the United States, which they did, but a
81 European Chamber, European Business in China, Business Confidence Survey, 2016, available at
http://www.europeanchamber.com.cn/en/publications-business-confidence-survey. 82 For additional information, see CRS In Focus IF10307, A U.S.-China Bilateral Investment Treaty (BIT): Issues and
Implications, by Wayne M. Morrison. 83 The Administration began efforts to review and revise the U.S. BIT model in 2009. The previous model BIT dated to
2004. The Administration’s review process likely meant that negotiations with China for a BIT were limited. Model
BIT can be found at https://ustr.gov/sites/default/files/BIT%20text%20for%20ACIEP%20Meeting.pdf. 84 See, CRS In Focus IF10052, U.S. International Investment Agreements (IIAs), by Martin A. Weiss and Shayerah
Ilias Akhtar. 85 U.S. Department of the Treasury, Remarks of Treasury Secretary Jacob J. Lew at the Close of the Fifth U.S.-China
Strategic and Economic Dialogue, July 13, 2013. 86 U.S. Department of the Treasury, U.S.-China Joint Fact Sheet Sixth Meeting of the Strategic and Economic
Dialogue, July 11, 2014.
China-U.S. Trade Issues
Congressional Research Service 29
breakthrough was not achieved. New negative lists were submitted in June 2016 and August
2016,87
and the BIT was discussed at the September 2016 G-20 Summit held in Hangzhou, China,
but no breakthrough was announced.
Many analysts contend that a U.S.-China BIT could have significant implications for bilateral
commercial relations and the Chinese economy. According to then-USTR Michael Froman, such
an agreement “offers a major opportunity to engage on China’s domestic economic reforms and
to pursue greater market access, a more level playing field, and a substantially improved
investment environment for U.S. firms in China.”88
For China, a high-standard BIT could help
facilitate greater competition in China and result in a more efficient use of resources, factors
which economists contend could boost economic growth. Some observers contend that China’s
pursuit of a BIT with the United States represents a strategy that is being used by reformers in
China to jumpstart widespread economic reforms (which appear to have stalled in recent years).
This strategy, it is argued, is similar to that used by Chinese reformers in their efforts to get China
into the WTO in 2001. Such international agreements may give political cover to economic
reformers because they can argue that the agreements build on China’s efforts to become a leader
in global affairs. This may make it harder for vested interests in China who benefit from the status
quo to resist change. Some critics raise concerns that even if a high standard BIT is reached,
ensuring China’s full compliance may prove difficult, given China’s extensive use of industrial
policies. Others have raised questions as to the effect of such an agreement in boosting FDI flows
and how that might impact U.S. jobs in affected industries.89
A BIT would have to be approved in
the U.S. Senate by a two-thirds majority.
The BIT was not concluded by the end of the Obama Administration’s term (the original goal of
completion). While the Chinese government has indicated that it supports continuing BIT
negotiations, the Trump Administration has been less clear on its position. U.S. Secretary of
Treasury Steven Mnuchin was quoted by Inside Trade in June 2017 as saying:
It’s on our agenda; I wouldn't say it’s at the very top of our agenda. I think what we're
looking for is, opposed to just negotiating a large agreement, we're looking to negotiate
very specific issues that deal with market issues today, deal with market fairness today,
deal with opening their markets to the same extent that our markets are open, and that’s
really our focus.... Once we can make progress in that we can turn to the bilateral
investment treaty.90
The U.S.-China Economic and Security Review Commission’s (USCC’s) November 2015 annual
report recommended that the Administration provide a comprehensive, publicly available
assessment of Chinese FDI in the United States prior to completion of BIT negotiations that
includes an identification of the nature of investments, whether investments received support of
any kind from the Chinese government and at any level, and the sector in which the investment
was made.91
The USCC’s 2016 annual report recommended that Congress should “amend the
87 The White House, Fact Sheet: U.S.-China Economic Relations, September 4, 2016, available at
https://www.whitehouse.gov/the-press-office/2016/09/04/fact-sheet-us-china-economic-relations. 88 USTR, Remarks by Ambassador Michael Froman to AmCham China and the U.S. Chamber of Commerce, April 27,
2015, available at https://ustr.gov/about-us/policy-offices/press-office/speechestranscripts/2015/april/remarks-
ambassador-michael. 89 See, for example, the U.S.-China Economic and Security Commission, Policy Considerations for Negotiating a U.S.-
China Bilateral Investment Treaty, August 1, 2016, available at http://www.uscc.gov/Research/policy-considerations-
negotiating-us-china-bilateral-investment-treaty. 90 https://insidetrade.com/daily-news/mnuchin-china-bit-agenda-only-if-quicker-specific-deals-can-be-reached. 91 U.S.-China Economic and Security Review Commission, 2015 Report to Congress, November 2015, p. 33.

China-U.S. Trade Issues
Congressional Research Service 30
statute authorizing the Committee on Foreign Investment in the United States to bar Chinese
state-owned enterprises from acquiring or otherwise gaining effective control of U.S.
companies.”92
Concerns About Chinese FDI in the United States
Chinese FDI in the United States has come under increasing scrutiny by U.S. policymakers. Some
have expressed concerns over Chinese investments (especially by SOEs or government-backed
entities) that appear to target industries and technologies that the Chinese government has
identified as critical to China’s future economic development. Some have called for reforms to
the process in which the Federal government evaluates certain FDI, such as the Committee on
Foreign Investment in the United States (CFIUS), an interagency committee that reviews the
national security aspects of certain foreign acquisitions, seek to modify the terms of the proposed
acquisition, and makes recommendations to the President, who can block the transaction.93
The USCC’s 2017 Annual Report identified three trends that may impact the ability of CFIUS to
review Chinese investment in the United States, including China’s targeting investments in
industries it deems as strategic, the use of private entities as fronts by the Chinese government
SOEs to obtain assets in strategic sectors; and attempting to bypass U.S. regulatory procedures
(such as investing through shell companies outside China) and using cyber-espionage to
financially undermine the targeted firm before acquiring it.94
The commission made a number of
recommendations to Congress on Chinese investment in the United States, including a ban on
acquisition of U.S. assets by Chinese state-owned or state-controlled entities, including sovereign
wealth funds.
In September 2017, President Trump, citing national security concerns, blocked the acquisition of
the U.S. firm Lattice Semiconductor by China Venture Capital Fund Corporation Limited95
for
$1.3 billion.96
In March 2018, national security concerns were also used by President Trump
when he blocked a bid to purchase Qualcomm Incorporated (a U.S. high-technology firm) to
Broadcom Limited (a semiconductor firm headquartered in Singapore). The decision to block the
sale appears to have been motivated in part by concerns it would weaken Qualcomm’s position
and enable China to, according to CFIIUS, dominate 5G technology and the standards setting
process.97
Some Members of Congress argue that the structure and scope of CFIUS needs to modernized
and strengthened in order to close loopholes that may exist in the current system for certain types
of foreign investments. Several CFIUS bills have been introduced in Congress, many of which be
appear to be largely aimed at Chinese FDI activities. For example, a press release by
92 Ibid., p. 126. 93 For additional information on CFIUS, see CRS Report RL33388, The Committee on Foreign Investment in the
United States (CFIUS), by James K. Jackson. 94 U.S.-China Economic and Security Review Commission, 2017 Annual Review, November 15, 2017, pp. 2-3, at
https://www.uscc.gov/Annual_Reports/2017-annual-report. 95 Bloomberg describes the Chinese firm as “a private-equity firm backed by a Chinese state-owned asset manager.”
See https://www.bloomberg.com/news/articles/2017-09-13/trump-blocks-china-backed-bid-for-chipmaker-over-
security-risk. 96 The White House, Press Release, September 13, 2017, at https://www.whitehouse.gov/the-press-office/2017/09/13/
order-regarding-proposed-acquisition-lattice-semiconductor-corporation. 97 The letter can be found at https://www.wsj.com/articles/a-deal-with-broadcom-may-weaken-qualcomms-innovation-
cfius-says-1520353879.
China-U.S. Trade Issues
Congressional Research Service 31
Representative Pittenger for his introduction of H.R. 4311 (the Foreign Investment Risk Review
Modernization Act of 2017) stated
China is buying American companies at a breathtaking pace. While some are legitimate
business investments, many others are part of a backdoor effort to compromise U.S.
national security.... For example, China recently attempted to purchase a U.S. missile
defense supplier using a shell company to evade detection. The global economy presents
new security risks, and so our bipartisan legislation provides Washington the necessary
tools to better track and evaluate Chinese investment.98
Some CFIUS reform bills have been taken up by Congress, including H.R. 5841 (the Foreign
Investment Risk Review Modernization Act of 2018, introduced by Representative Pittenger),
which passed the House on June 26, 2018); and S. 2098 (the Foreign Investment Risk Review
Modernization Act of 2018, introduced by Senator Cornyn), which was added as an amendment
by the Senate to H.R. 5515 (the National Defense Authorization Act for Fiscal Year 2019) and
passed by the Senate on June 18.99
There is also support by some in Congress to modernize and
reform U.S. export control laws, such as H.R. 5040 (the Export Control Reform Act of 2018).100
The Trump Administration had indicated under its Section 301 investigation of China’s IPR
policies that it would to impose new FDI restrictions and tighter export controls against China.
However, on June 27, President Trump announced that legislation currently under consideration
in Congress to reform CFIUS and export control laws would, if enacted, meet the
Administration’s goals on these issues.101
Major U.S.-China Trade Issues China’s economic reforms and rapid economic growth, along with the effects of globalization,
have caused the economies of the United States and China to become increasingly integrated.102
Although growing U.S.-China economic ties are considered by most analysts to be mutually
beneficial overall, tensions have risen over a number of Chinese economic and trade policies that
many U.S. critics charge are protectionist, economically distortive, and damaging to U.S.
economic interests. According to the USTR, most U.S. trade disputes with China stem from the
consequences of its incomplete transition to a free market economy. Major areas of concern for
U.S. stakeholders include China’s
Extensive network of industrial policies (including widespread use of trade and
investment barriers, financial support, and indigenous innovation policies) that
98 Representative Robert Pittenger, Press Release, November 7, 2017, at https://pittenger.house.gov/media-center/
press-releases/pittenger-takes-aim-at-china. 99 For more information on CFIUS legislation, see CRS Insight IN10924, Foreign Investment Risk Review
Modernization Act (FIRRMA), by James K. Jackson and Cathleen D. Cimino-Isaacs. 100 See CRS Report R41916, The U.S. Export Control System and the Export Control Reform Initiative, by Ian F.
Fergusson and Paul K. Kerr. 101 See https://www.whitehouse.gov/briefings-statements/statement-president-regarding-investment-restrictions/. 102 The impact of globalization has been a somewhat controversial topic in the United States. Some argue that it has
made it easier for U.S. firms to shift production overseas, resulting in lost jobs in the United States (especially in
manufacturing) and lower wages for U.S. workers. Others contend that globalization has induced U.S. firms to become
more efficient and to focus a greater share of their domestic manufacturing on higher-end or more technologically
advanced production (while sourcing lower-end production abroad), making such firms more globally competitive. The
result has been that the United States continues to be a major global manufacturer in terms of value-added, but there are
fewer U.S. workers in manufacturing.

China-U.S. Trade Issues
Congressional Research Service 32
seek to promote and protect domestic sectors and firms, especially SOEs, deemed
by the government to be critical to the country’s future economic growth;
Failure to provide adequate protection of U.S. intellectual property rights (IPR)
and (alleged) widespread government-directed cyber-theft of U.S. trade secrets
security to help Chinese firms;
Mixed record on implementing its WTO obligations; and
Government-directed financial policies that promote high savings (but reduce
private consumption), encourage high fixed investment levels (but may
contribute to overcapacity in many industries), and a managed exchange rate
policy that may distort trade flows.
Chinese “State Capitalism”
Currently, a significant share of China’s economy is thought to be driven by market forces. A
2010 WTO report estimated that the private sector now accounted for more than 60% of China’s
gross domestic product (GDP).103
A 2016 WTO study estimated that the private sector accounted
for 41.8% of China’s exports.104
However, the Chinese government continues to play a major role in economic decision-making.
For example, at the macroeconomic level, the Chinese government maintains policies that induce
households to save a high level of their income, much of which is deposited in state-controlled
Chinese banks. This enables the government to provide low-cost financing to Chinese firms,
especially SOEs. At the microeconomic level, the Chinese government (at the central and local
government level) seeks to promote the development of industries deemed critical to the
country’s future economic development by using various policies, such as subsidies, tax breaks,
preferential loans, trade barriers, FDI restrictions, discriminatory regulations and standards,
export restrictions on raw materials (including rare earths), technology transfer requirements
imposed on foreign firms, public procurement rules that give preferences to domestic firms, and
weak enforcement of IPR laws.
Many analysts argue that the Chinese government’s intervention in various sectors through
industrial policies has intensified in recent years. The December 2013 USTR report on China’s
WTO trade compliance stated
During most of the past decade, the Chinese government emphasized the state’s role in
the economy, diverging from the path of economic reform that had driven China’s
accession to the WTO. With the state leading China’s economic development, the
Chinese government pursued new and more expansive industrial policies, often designed
to limit market access for imported goods, foreign manufacturers and foreign service
suppliers, while offering substantial government guidance, resources and regulatory
support to Chinese industries, particularly ones dominated by state-owned enterprises.
This heavy state role in the economy, reinforced by unchecked discretionary actions of
Chinese government regulators, generated serious trade frictions with China’s many trade
partners, including the United States.105
103 World Trade Organization, Trade Policy Review Body, Trade Policy Review, Report by the Secretariat, China,
Revision, 2010, Part 2, p. 1. 104 WTO, Trade Policy Review, China, June 15, 2016, p. 20, available at https://www.wto.org/english/tratop_e/tpr_e/
s342_e.pdf. 105 U.S. Trade Representative, 2013 USTR Report to Congress on China’s WTO Compliance, December 2013, p. 2.
China-U.S. Trade Issues
Congressional Research Service 33
The extent of SOE involvement in the Chinese economy is difficult to measure, due to the opaque
nature of the corporate sector in China and the relative lack of transparency regarding the
relationship between state actors (including those at the central and non-central government
levels) and Chinese firms. According to one study by the USCC
The state sector in China consists of three main components. First, there are enterprises
fully owned by the state through the State-owned Assets and Supervision and
Administration Commission (SASAC) of the State Council and by SASACs of
provincial, municipal, and county governments. Second, there are SOEs that are majority
owners of enterprises that are not officially considered SOEs but are effectively
controlled by their SOE owners. Finally, there is a group of entities, owned and
controlled indirectly through SOE subsidiaries based inside and outside of China. The
actual size of this third group is unknown. Urban collective enterprises and Government-
owned Township and village enterprises (TVEs) also belong to the state sector but are not
considered SOEs. The state-owned and controlled portion of the Chinese economy is
large. Based on reasonable assumptions, it appears that the visible state sector—SOEs
and entities directly controlled by SOEs, accounted for more than 40 percent of China’s
nonagricultural GDP. If the contributions of indirectly controlled entities, urban
collectives, and public TVEs are considered, the share of GDP owned and controlled by
the state is approximately 50 percent.106
According to the Chinese government, there are 150,000 state-owned or state-controlled
enterprises at the central and local government excluding financial institutions, with total assets
worth $15.2 trillion, and 30 million workers.107
Chinese SOEs have undergone significant
restructuring over the years. The government contends that 68% of all SOE-funded firms in 2016
were mixed-ownership. The Chinese government has identified a number of industries where the
state should have full control or where the state should dominate. These include autos, aviation,
banking, coal, construction, environmental technology, information technology, insurance, media,
metals (such as steel), oil and gas, power, railways, shipping, telecommunications, and tobacco.108
Many SOEs are owned or controlled by local governments. According to one analyst
The typical large industrial Chinese company is ...wholly or majority-owned by a local
government which appoints senior management and provides free or low-cost land and
utilities, tax breaks, and where possible, guarantees that locally made products will be
favored by local governments, consumers, and other businesses. In return, the enterprise
provides the local state with a source of jobs for local workers, tax revenues, and
dividends.109
China’s banking system is largely dominated by state-owned or state-controlled banks. In 2011,
the top five largest banks in China, all of which were shareholding companies with significant
state ownership, accounted for 57.5% of Chinese banking assets. The Chinese government also
has four banks that are 100% state-owned and holds shares in a number of joint stock commercial
banks.110
SOEs are believed to receive preferential credit treatment by government banks, while
106 U.S.-China Economic and Security Review Commission, An Analysis of State‐owned Enterprises and State
Capitalism in China, by Andrew Szamosszegi and Cole Kyle, October 26, 2011, p. 1. 107 China Daily, “China eyes breakthroughs in SOE reform,” December 23, 2016, at http://www.chinadaily.com.cn/
business/2016-12/23/content_27753459.htm. 108 Testimony for the U.S.–China Economic and Security Review Commission by Derek Scissors, Ph.D, Chinese State
Owned Enterprises and the US Policy on China, February 12, 2012. 109 Anderson, G.E., PhD, Designated Drivers, How China Plans to Dominate the Global Auto Industry, 2012, p. 2. 110 Lund University, Lending for Growth? An Analysis of State-Owned Banks in China, by Fredrik N.G. Anderson,
Katarzyna Burzynska, and Sonja Opper, June 2013, p. 41.

China-U.S. Trade Issues
Congressional Research Service 34
private firms must often pay higher interest rates or obtain credit elsewhere. According to one
estimate, SOEs accounted for 85% ($1.4 trillion) of all bank loans in 2009.111
Not only are SOEs dominant players in China’s economy, many are quite large by global
standards. Fortune’s 2017 list of the world’s 500 largest companies includes 109 Chinese firms
(compared to 29 listed firms in 2007), the top 20 of which are listed in Table 9.112
Table 9. Top 20 Chinese Companies on Fortune’s Global 500 in 2017
Company
Global
500
Rank
State or
Non-state Industry
Revenue
($billions)
State Grid 2 State Utility 315
Sinopec Group 3 State Energy 268
China National Petroleum 4 State Energy 263
Industrial & Commercial Bank of China 22 State Banking 148
China State Construction Engineering 24 State Engineering &
Construction
144
China Construction Bank 24 State Banking 145
Agricultural Bank of China 38 State Banking 117
Ping An Insurance 39 Nonstate Insurance 117
SAIC Motor 41 State Motor Vehicles &
Parts
114
Bank of China 42 State Banking 114
China Mobile Communications 47 State Telecommunications 107
China Life Insurance 51 State Insurance 104
China Railway Engineering 55 State Engineering &
Construction
97
China Railway Construction 58 State Engineering &
Construction
95
Dongfeng Motor Group 68 State Motor Vehicles &
Parts
86
Huawei Investment & Holding 83 Nonstate Telecommunications 79
China Resources National 86 State General
Merchandisers
76
Pacific Construction Group 89 Nonstate Engineering &
Construction
75
China Southern Power Grid 100 State Utilities 71
China South Industries Group 101 State Aerospace & Defense
71
Source: Fortune 2017 Global 500.
111 The Economist, “State Capitalism’s Global Reach, New Masters of the Universe, How State Enterprise is
Spreading,” January 21, 2012. 112 The listing can be found at http://beta.fortune.com/global500/.
China-U.S. Trade Issues
Congressional Research Service 35
Out of the top 20 Chinese firms listed in the Fortune Global 500, 17 (85%) are majority-owned
(50% or more) by Chinese government. Some of the 109 Chinese firms on the Fortune 500 list,
while not majority-owned by the government, may be partially state-controlled or favored by the
government. For example
Several of the listed firms are banks where the Chinese government owns a large
or controlling share, including 26.5% of the Bank of Communications, 15.7% of
China Minsheng Banking Corp., 21% of China Industrial Bank, 17.9% of China
Merchant Bank, and 20% of Shanghai Pudong Development Bank.113
Lenovo, a major global computer producer, was started by the Chinese National
Academy of Social Sciences, which started Legend Holdings in 1984. Lenovo
was spun off from Legend in 2001, but Legend still owns 31% of Lenovo’s
shares.114
Huawei (a major telecommunications company) describes itself as an employee-
owned firm. However, many U.S. analysts contend that Huawei has strong links
with the Chinese government, including the Chinese People’s Liberation Army
(PLA), and has not published a full breakdown of its ownership structure. In
addition, in the past, the Chinese government reportedly ordered state banks to
extend loans to the company early in its development so that it could compete
against foreign firms in the domestic telecommunications market.115
Ping An Insurance is the largest nonstate company on the 2017 Global 500 list. In
2012, The New York Times published an article that reported that in 2004 a
network of family and friends of then-Chinese Premier Wen Jiabao owned 135
million shares of Ping An Insurance through a series of investment companies.116
A March 2016 Times article described Ping An as a “labyrinthine shareholding
structure made up of 37 interlocking holding companies.”117
China’s Plan to Modernize the Economy and Promote Indigenous Innovation
Many of the industrial policies China has implemented or formulated since 2006 appear to stem
largely from a comprehensive document issued by China’s State Council (the highest executive
organ of state power) in 2006 titled the National Medium-and Long-Term Program for Science
and Technology Development (2006-2020), often referred to as the MLP.118
The MLP appears to
represent an ambitious plan to modernize the structure of China’s economy by transforming it
from a global center of low-tech manufacturing to a major center of innovation (by the year 2020)
and a global innovation leader by 2050.119
It also seeks to sharply reduce the country’s
dependence on foreign technology. The MLP includes the stated goals of “indigenous innovation,
113 Lund University, Lending for Growth? An Analysis of State-Owned Banks in China, by Fredrik N.G. Anderson,
Katarzyna Burzynska, and Sonja Opper, June 2013, p. 41. 114 Lenovo, Investor Relations, Stock Information, Shareholding. 115 McGregor, Richard, The Party, the Secret World of China’s Communist Rulers, 2010, p. 204. 116 The New York Times, Ping An’s Hidden Shareholders: Friends and Family of Wen Jiabao, November 23, 2012. 117 The New York Times, Starwood Bidder Is a Reclusive Chinese Insurer With Opaque Backing, March 29, 2016. 118 An English translation of the MLP can be found at http://sydney.edu.au/global-health/international-networks/
National_Outline_for_Medium_and_Long_Term_ST_Development1.doc. 119 As some observers describe it, China wants to go from a model of “made in China” to “innovated in China.”

China-U.S. Trade Issues
Congressional Research Service 36
leapfrogging in priority fields, enabling development, and leading the future.”120
Some of the
broad goals of the MLP state that by 2020
The progress of science and technology will contribute 60% or above to China’s
development.
The country’s reliance on foreign technology will decline to 30% or below (from
an estimated current level of 50%).
Gross expenditures for research and development (R&D) would rise to 2.5% of
gross domestic product (from 1.3% in 2005). Priority areas for increased R&D
include space programs, aerospace development and manufacturing, renewable
energy, computer science, and life sciences.121
The document states that “China must place the strengthening of indigenous innovative capability
at the core of economic restructuring, growth model change, and national competitiveness
enhancement. Building an innovation-oriented country is therefore a major strategic choice for
China’s future development.” This goal, according to the document, is to be achieved by
formulating and implementing regulations in the country’s government procurement law to
“encourage and protect indigenous innovation,” establishing a coordination mechanism for
government procurement of indigenous innovative products, requiring a first-buy policy for major
domestically made high-tech equipment and products that possess proprietary intellectual
property rights, providing policy support to enterprises in procuring domestic high-tech
equipment, and developing “relevant technology standards” through government procurement.
Reaction by U.S. Stakeholders
Beginning in 2009, several U.S. companies began to raise concerns over a number of Chinese
government circulars that would establish an “Indigenous Innovation Product Accreditation”
system. For example, in November 2009, the Chinese government released a “Circular on
Launching the 2009 National Indigenous Innovation Product Accreditation Work,” requiring
companies to file applications by December 2009 for their products to be considered for
accreditation as “indigenous innovation products.” Similar proposed circulars were issued at the
provincial and local government levels. U.S. business representatives expressed deep concern
over the circulars, arguing that they were protectionist in nature because they extended
preferential treatment for Chinese government procurement to domestic Chinese firms that
developed and owned intellectual property (IP), and thus, largely excluded foreign firms.122
AmCham China described China’s attempt to link IP ownership with market access as
“unprecedented worldwide.”123
A letter written by the U.S. Chamber of Commerce and 33
business associations to the Chinese government on December 10, 2009, stated that the
indigenous innovations circulars would “make it virtually impossible for any non-Chinese
company to participate in China’s government procurement market—even those that have made
120 The MLP identifies main areas and priority topics, including energy, water and mineral resources, the environment,
agriculture, manufacturing, communications and transport, information industry and modern service industries,
population and health, urbanization and urban development, public security, and national defense. The report also
identifies 16 major special projects and 8 “pioneer technologies.” 121 R&D Magazine, December 22, 2009. 122 U.S. business representatives also claim that the Chinese government is using tax incentives, standards setting and
requirements, security regulations, subsidies, technology transfer requirements, and other measures to promote the
goals of indigenous innovation. 123 AmCham China,2011 White Paper, April 26, 2011, p. 66.
China-U.S. Trade Issues
Congressional Research Service 37
substantial and long-term investments in China, employ Chinese citizens, and pay taxes to the
Chinese government.” Such groups contend that a large share of their technology is developed
globally, and thus, it would be difficult to attribute the share of technology developed in China
needed to obtain accreditation.124
A 2011 AmCham China survey found that 40% of respondents believed that China’s indigenous
innovation policies would hurt their businesses and 26% said their businesses were already being
hurt by such policies. At a November 2011 WTO review of China’s IPR policies, the U.S. WTO
representative stated that China’s policies of adopting indigenous innovation had “created a
troubling trend toward increased discriminatory policies which were aimed at coercing
technology transfer.” He stated that “Chinese regulations, rules and other regulatory measures
frequently called for technology transfer, and in certain cases, conditioned, or proposed to
condition, the eligibility for government benefits or preferences on intellectual property being
owned or developed in China, or being licensed, in some cases exclusively, to a Chinese party.”125
China’s Response to U.S. Concerns
The Chinese government responded to U.S. concerns over its indigenous innovation policies by
arguing that they did not discriminate against foreign firms or violate global trade rules.126
However, during the visit of (then) Chinese President Hu Jintao to the United States in January
2011, the Chinese government stated that it would not link its innovation policies to the provision
of government procurement preferences.127
During the May 2011 session of the U.S.-China
Strategic and Economic Dialogue (S&ED), China pledged that it would eliminate all of its
indigenous innovation products catalogs.128
During the November 2011 talks held under the U.S.-
China Joint Commission on Commerce and Trade (JCCT), the Chinese government announced
that the State Council had issued a measure requiring governments of provinces, municipalities,
and autonomous regions to eliminate by December 1, 2011, any catalogues or other measures
linking innovation policies to government procurement preferences.129
This occurred after foreign
business groups raised concerns that discriminatory indigenous innovation policies might
continue to be implemented at the local level even after Hu Jintao’s commitment. For example,
the USCBC reported in February 2011 that it had identified 22 municipal and provincial
governments that had issued at least 61 indigenous innovation catalogues. U.S. business
representatives sought to ensure that Beijing’s pledge on indigenous innovation would apply at all
levels of government in China.
124 Some U.S. business representatives argue that one of the main goals of China’s indigenous innovation regulations is
to induce foreign firms to boost their R&D activities in China in order to qualify for government contracts. 125 WTO, Transitional Review Under Section 18 of the Protocol on the Accession of the People’s Republic of China,
Report to the General Council by the Chair, November 17, 2011, p. 4. 126 Wall Street Journal, China Defends Rule on ‘Indigenous’ Tech, December 15, 2009. 127 The White House, U.S.-China Joint Statement, January 19, 2011. 128 According to a U.S. fact sheet on the meeting “China pledged to eliminate all of its government procurement
indigenous innovation products catalogues and revise Article 9 of the draft Government Procurement Law
Implementing Regulations (which have preferences in government procurement to national indigenous innovation
products), in fulfillment of President Hu’s January 2011 commitment not to link Chinese innovation policies to
government procurement preferences. See U.S. Department of the Treasury, The 2011 U.S.-China Strategic and
Economic Dialogue U.S. Fact Sheet – Economic Track, May 10, 2011. 129 U.S. Department of Commerce, 22nd U.S.-China Joint Commission on Commerce and Trade Fact Sheet, November
21, 2011.

China-U.S. Trade Issues
Congressional Research Service 38
In May 2013, the USCBC reported that, although the central government had largely been
successful in ensuring that sub-national governments complied with Hu Jintao’s January 2011
commitments, 13 provinces had not yet issued any measures to comply.130
In addition, an October
2012 USCBC survey found that 85% of respondents said they had seen little impact on their
businesses resulting from China’s commitments delinking indigenous innovation with
government procurement.131
Remaining U.S. Concerns
While many U.S. business leaders have applauded China’s pledge to delink indigenous
innovation from government procurement, some remain wary that China will implement new
policies that attempt to provide preferences to local Chinese firms over foreign firms. According
to Adam Segal with the Council on Foreign Relations: “Even if China reverses certain policies
under U.S. pressure, it will remain dedicated to those goals. U.S. policy is likely to become a
game of Whac-a-Mole, beating down one Chinese initiative on indigenous innovation only to see
another pop up.”132
U.S. business groups are also concerned with how the MLP blueprint will
affect China’s commitment to enforcing foreign IPR. They note, for example, that the MLP states:
“Indigenous innovation refers to enhancing original innovation, integrated innovation, and re-
innovation based on assimilation and absorption of imported technology, in order to improve our
national innovation capability.” To some, this seems to indicate that China intends to take existing
technology, make some changes and improvements on it, and then claim it as its own without
acknowledging or compensating the original IPR holders. A 2011 report by the U.S. Chamber of
Commerce stated that China’s indigenous innovation policies led many international technology
companies to conclude that the MLP is a “blueprint for technology theft on a scale the world has
never seen before.”133
U.S. officials have attempted to convince Beijing that, while its desire to increase innovation in
China is a commendable goal, its efforts to limit the participation of foreign firms in such efforts,
or attempting to condition market access in China to the development of IPR by foreign firms in
China will hinder, not promote, the advancement of innovation in China. The direction China
takes on this issue could have a significant impact on U.S. economic interests, as noted by
USITC:
To the extent that China’s policies succeed in accelerating technological progress,
productivity, and innovation in the Chinese economy, they could provide spillover
benefits for other countries. But if indigenous innovation policies act as a form of
technological import substitution, systematically favoring Chinese domestic firms over
foreign firms in relevant industries, they would be expected to have a negative effect on
foreign firms and economies roughly analogous to what would occur if China simply
130 U.S.-China Business Council, Status Report: China’s Innovation and Government Procurement Policies, May 1,
2013, at https://www.uschina.org/sites/default/files/innovation-status-report.pdf. 131 U.S.-China Business Council, USCBC 2012 China Business Environment Survey Results: Continued Growth and
Profitability; Tempered Optimism Due to Rising Costs, Competition, and Market Barriers, October 2012, p. 6,
available at https://www.uschina.org/advocacy/press/uscbc-2012-china-business-environment-survey-results-us-
companies-report-continued. 132 Foreign Affairs, China’s Innovation Wall: Beijing’s Push for Homegrown Technology, September 28, 2010. 133 U.S. Chamber of Commerce, China’s Drive for ‘Indigenous Innovation’ - A Web of Industrial Policies, February
2011, p. 4.

China-U.S. Trade Issues
Congressional Research Service 39
imposed a protective tariff on imports of goods in the relevant sectors or levied a
discriminatory excise tax on the sales of FIEs in the Chinese market.134
New Restrictions on Information and Communications Technology
According to the USTR’s 2015 report on China’s WTO accession, while progress has been made
to delink China’s efforts to link indigenous innovation goals with procurement at the central and
local efforts, such policies have continued in other areas. Many foreign business groups have
expressed increasing concerns over a number of recently proposed or enacted laws and
regulations on information and communications technology (ICT) products and services that
could limit foreign access to ICT markets in China on so-called national security grounds. Several
proposals include language stating that critical information infrastructure should be “secure and
controllable,” an ambiguous term that has not been precisely defined by Chinese authorities.
Other proposals lay out policies to promote indigenous ICT industries or would require foreign
firms to hand over proprietary information. According to the U.S. Department of Commerce
The policies set forth in these measures could cause long-term damage to U.S. businesses
trying to sell ICT products into China, a market estimated to be worth about $465 billion
this year. They also could add significant costs to foreign ICT companies operating in
China and could prevent them from supplying the China market with the most
technologically advanced and reliable products.
Such restrictions could have a significant impact on U.S. ICT firms. According to BEA, U.S.
exports of ICT services and potentially ICT-enabled services (i.e., services that are delivered
remotely over ICT networks) to China totaled $12.8 billion in 2015.135
Examples of recently
passed or proposed measures of concern to foreign ICT firms include the following:
In 2014, the China Banking Regulatory Commission issued guidelines for IT
security equipment used in banks (such as cash machines and smartcard chips),
which included provisions on encryption and the disclosure of source code. It
emphasized the importance of developing local technology and stated that the
need for “secure and controllable technologies” in the banking sector, with the
goal of 15% in 2015, growing to no less than 75% in 2019. China suspended
some of the guidelines in April 2015. At the June 2015 S&ED session, China
agreed to ensure that bank ICT regulations “will be nondiscriminatory, are not to
impose nationality-based requirements, and are to be developed in a transparent
manner.”136
China’s national security law (enacted in July 2015) includes a provision (Article
24) that says “the State strengthens the establishment of capacity for independent
innovation, accelerating the development of autonomously controlled strategic
advanced technologies and key technologies in core fields, strengthens the use of
intellectual property rights, protects capacity building in protection of
134 USITC, China: Intellectual Property Infringement, Indigenous Innovation Policies, and Frameworks for Measuring
the Effects on the U.S. Economy (Investigation No. 332-514, USITC Publication 4199, November 2010, pp. 6-7. 135 China was the fourth-largest U.S. export market for such services for countries where data is available. See, BEA,
International Trade Data, U.S. Trade in Services, available at http://www.bea.gov/iTable/iTable.cfm?ReqID=62&
step=1#reqid=62&step=1&isuri=1&6210=4. 136 U.S. Department of Commerce, U.S. Fact Sheet: 26th U.S.-China Joint Commission on Commerce and Trade,
November 23, 2016, available at https://www.commerce.gov/news/fact-sheets/2015/11/us-fact-sheet-26th-us-china-
joint-commission-commerce-and-trade.

China-U.S. Trade Issues
Congressional Research Service 40
technological secrets, and ensures security in technology and engineering.”137
Article 59 says that “the State establishes national security review and oversight
management systems and mechanisms, conducting national security review of
foreign commercial investment, special items and technologies, internet
information technology products and services, projects involving national
security matters, as well as other major matters and activities, that impact or
might impact national security.”
In October 2015, the China Insurance Regulatory Commission issued new draft
rules on cyber-security in the insurance industry. The draft rules called for the
adoption of “secure and controllable” technology by insurance companies, data
localization requirements, and the use of products and systems employing
domestic encryption methods. On June 1, 2016, 28 business groups sent a letter
to the chairman of the China Insurance Regulatory Commission, arguing that the
draft rules “would create unnecessary obstacles to international trade and likely
to constitute a means of arbitrary or unjustifiable discrimination against providers
in countries where the same conditions prevail.”138
On June 2, 2016, the United
States raised concerns about the draft regulations with the WTO Committee on
Trade-Related Measures, arguing that such language appears to require that
Chinese insurance firms give preferences to Chinese domestic providers of
hardware equipment and software over foreign firms.139
In December 2015, China enacted a new counterterrorism law.140
It requires
telecommunications operators and internet service providers to “provide
technical interfaces, decryption and other technical support assistance to public
security organs and state security organs conducting prevention and investigation
of terrorist activities.”141
Originally, the Chinese government sought to require
providers to provide it encryption codes (i.e., security back-door access) and to
store local user data on servers within China, but these provisions were later
dropped from the final draft of the law, in part because of sharp criticism by
President Obama, who contended that such rules “would essentially force all
foreign companies, including U.S. companies, to turn over to the Chinese
government mechanisms where they can snoop and keep track of all the users of
those services.”
China passed a new cyber-security law on November 7, 2016,142
which appears
to promote the development of indigenous technologies and impose restrictions
on foreign firms. Article 15 directs government entities to “support key network
security technology industries and programs; support network security
technology research and development, application and popularization; spread
137 Translation from the Council on Foreign Relations, National Security Law of the People’s Republic of China, July 1,
2015, available at http://www.cfr.org/homeland-security/national-security-law-peoples-republic-china/p36775. 138 The letter can be found at https://www.uschina.org/sites/default/files/
Industry%20letter%20on%20TBT%20notification%20of%20CIRC%20Tech%20Regulations%20(ENG).pdf. 139 Inside U.S. Trade’s, China Trade Extra, “U.S. Signals It Wants China To Slow Implementation Of Draft Insurance
Regs,” June 3, 2016. 140 A translated copy of the law can be found at the China Law Translate at http://chinalawtranslate.com/?lang=en. 141 Translation from China Law Translate, available at http://chinalawtranslate.com/?lang=en. 142 The law follows China’s assertion of its right to “cyber-sovereignty, which it describes as “an individual country’s
right to choose its own Internet regulation model.” See Xinhuanet, “China Voice: Why does cyber-sovereignty
matter?,” December 12, 2016, available at http://news.xinhuanet.com/english/2015-12/16/c_134923687.htm.
China-U.S. Trade Issues
Congressional Research Service 41
safe and trustworthy network products and services; protect the intellectual
property rights for network technologies; and support research and development
institutions, schools of higher learning, and so forth to participate in State
network security technology innovation programs.” Article 23 states that
“Critical network equipment and specialized network security products shall
follow the national standards and mandatory requirements, and be safety certified
by a qualified establishment or meet the requirements of a safety inspection,
before being sold or provided. The state network information departments,
together with the relevant departments of the State Council, formulate and release
a catalog of critical network equipment and specialized network security
products, and promote reciprocal recognition of safety certifications and security
inspection results to avoid duplicative certifications and inspections.”143
Article
37 states that personal information and other important data gathered or produced
by critical information infrastructure operators during operations within China
must store it in China.144
A statement issued by Amcham on November 7 said the
new law would not “do much to improve security,” but rather would “create
barriers to trade and investment.” Other critics contend that provisions of the law
are too broad or vague as to the level of cooperation internet firms are required to
give to government authorities and would impose new internet restrictions.145
China’s 13th five-year plans and other government policy pronouncements have
laid out a number of plans to boost innovation and promote the development of
indigenous ICT and other high tech sectors, including semiconductors (see
Appendix).
A U.S. Chamber of Commerce report estimated that a decision by China to “purge foreign ICTs”
would reduce China’s annual GDP by 1.77% up to 3.44%, or at least $200 billion (based on 2015
GDP), and would cost the Chinese economy at a minimum nearly $3 trillion overall by 2025.146
Intellectual Property Rights (IPR) Issues147
U.S. business and government representatives voice growing concern over economic losses
suffered by U.S. firms as a result of IPR infringement in China (and elsewhere), including those
from cyber-attacks. U.S. innovation and the intellectual property (IP) that it generates have been
cited by various economists as a critical source of U.S. economic growth and global
competitiveness.148
For example, according to the Department of Commerce, in 2014, U.S. IP-
intensive industries, either directly or indirectly, supported 45.5 million jobs and contributed $6.6
trillion in value added to the economy (up 30% from 2010), equal to 48.2% of U.S. GDP. In
addition, total merchandise exports of IP-intensive industries totaled $842 billion.149
According to
143 See translation of the law at http://chinalawtranslate.com/cybersecuritylaw/?lang=en#LBQMwbmaWhGozeMj.99. 144 For additional information on digital trade issues, see CRS Report R44565, Digital Trade and U.S. Trade Policy,
coordinated by Rachel F. Fefer. 145 Lawfare, Understanding China’s Cybersecurity Law, November 8, 2016, available at https://www.lawfareblog.com/
understanding-chinas-cybersecurity-law. 146 U.S. Chamber of Commerce, Preventing Deglobalization, March 17, 2016, p. 8, available at
https://www.uschamber.com/sites/default/files/documents/files/preventing_deglobalization_1.pdf. 147 China’s IPR policies subject to the Section 301 investigation are discussed later in the report. 148 See CRS Report RL34292, Intellectual Property Rights and International Trade, by Shayerah Ilias Akhtar and Ian
F. Fergusson. 149 U.S. Department of Commerce, Intellectual Property and the U.S. Economy: 2016 Update, March 2012, available at
(continued...)

China-U.S. Trade Issues
Congressional Research Service 42
the U.S. Bureau of Economic Analysis, in 2017, foreign entities paid U.S. IP holders $128.4
billion ($8.8 billion was paid by Chinese entities) for use of their IPR and $42.2 billion for
telecommunications, computer, and information services.150
A study by NDP Consulting estimated that in 2008, U.S. workers in IP-intensive production
earned 60% more than workers at similar levels in non-IP industries.151
A study on the Apple iPod
concluded that Apple’s innovation in developing and engineering the iPod and its ability to source
most of its production to low-cost countries, such as China, have enabled it to become a highly
competitive and profitable firm, as well as a creator of high-paying jobs (such as engineers
engaged in the design of Apple products) in the United States.152
IPR piracy and infringement is a significant global problem. Lack of effective and consistent
protection of IPR has been cited by U.S. firms as one of the most significant problems they face
in doing business in China. Other U.S. firms have expressed concern over pressures they often
face from Chinese government entities to share technology and IPR with a Chinese partner.
Although China has significantly improved its IPR protection regime over the past few years,
U.S. IP industries complain that piracy rates in China remain unacceptably high and economic
losses are significant, as illustrated by studies and estimates made by several stakeholders.
An April 3, 2018 USTR press release estimated annual U.S. economic losses
from China’s “unfair” IPR policies at $50 billion.153
A May 2013 study by the Commission on the Theft of American Intellectual
Property estimated that global IPR theft costs the U.S. economy $300 billion, of
which China accounted for 50% ($150 billion) to 80% ($240 billion) of those
losses.154
The U.S. Department of Homeland Security reported that in FY2017, goods from
China and Hong Kong together accounted for 78% of seized counterfeit goods
with a total value of $941 million (based on their estimated manufacturer’s retail
price).155
Business surveys reveal mixed reactions to China’s IPR enforcement efforts. For
example, a majority of respondents in a 2016 AmCham China survey said IPR
enforcement was effective for patents (54%) and trademarks or brand protection
(51%), but less than a majority found copyrights (48%) and trade secrets (40%)
enforcement to be effective. At the same time, 91% of respondents agreed that
IPR enforcement over the last five years had improved.156
The European
(...continued)
https://www.uspto.gov/sites/default/files/documents/IPandtheUSEconomySept2016.pdf. 150 U.S. Bureau of Economic Affairs, International Data, International Services, at http://www.bea.gov/index.htm. 151 Nam Pham, The Impact of Innovation and the Role of Intellectual Property Rights on U.S. Productivity,
Competitiveness, Jobs, Wages and Exports, 2010, NDP Consulting. 152 Communications of the ACM, Who Captures Value in a Global Innovation Network? The Case of Apple’s iPod,
March 2009. 153 USTR, Press Release, April 3, 2018, available at https://ustr.gov/about-us/policy-offices/press-office/press-releases/
2018/april/under-section-301-action-ustr. 154 The Commission on the Theft of American Intellectual Property, the Report of the Commission on the Theft of
Intellectual Property, May 2013. 155 U.S. Department of Homeland Security, Intellectual Property Rights Seizure Statistics Fiscal Year 2017, April
2018, available at https://www.cbp.gov/sites/default/files/assets/documents/2018-Apr/ipr-seizure-stats-fy2017.pdf. 156 AmCham China, China Business Climate Survey Report, 2016, January 2016, available at
(continued...)
China-U.S. Trade Issues
Congressional Research Service 43
Chamber’s 2016 China business survey found that although 59% of its members
said China’s IPR enforcement was “inadequate,” this was an improvement from
the 95% rate reported for 2009.157
The USCBC’s 2017 member survey found that IPR enforcement and cyber-
security ranked as the fifth and sixth, respectively, biggest challenges among its
member firms. Among respondents, 94% stated they concerned about IPR
enforcement in China and 82% expressed concerns about data flow restrictions
and cyber-security. Major cyber-related areas of greatest concern include
restrictions on cross-border data flows in Chinese regulations (cited by 65% of
respondents), inability to use global IT solutions or non-Chinese cloud-based
applications in China (55%), consumer or company data theft (53%), Internet
access and performance issues (53%), and IPR theft (51%).158
The USTR’s 2016 report on foreign trade barriers stated that over the past
decade, China’s internet restrictions have “posed a significant burden to foreign
suppliers,” and that 8 out of the top 25 most globally visited sites (such as Yahoo,
Facebook, YouTube, eBay, Twitter, and Amazon) are blocked in China.159
Freedom House’s 2015 Freedom on the Net report ranked China’s internet
regime as the most restrictive out of 65 countries surveyed.160
The U.S. International Trade Commission (USITC) in 2001 estimated that U.S.
intellectual property-intensive firms that conducted business in China lost $48.2
billion in sales, royalties, and license fees in 2009 because of IPR violations. It
also estimated that an effective IPR enforcement regime in China that was
comparable to U.S. levels could increase employment by IP-intensive firms in
the United States by 923,000 jobs.161
The Business Software Alliance (BSA) estimated the commercial value of
illegally used software in China at $8.7 billion in 2015 (up from $7.6 billion in
2009), and that the software piracy rate in China was 70% (down from 79% in
2007).162
BSA further estimated that legitimate software sales in China were only
$3.7 billion, compared to legal sales of $41.0 billion in the United States.
(...continued)
http://www.amchamchina.org/about/press-center/amcham-statement/amcham-china-releases-2016-business-climate-
survey. 157 European Chamber, European Business in China, Business Confidence Survey: 2016, July 7, 2016, available at
http://www.europeanchamber.com.cn/en/publications-business-confidence-survey. 158 USCBC, 2017 Membership Survey, available at https://www.uschina.org/sites/default/files/
2017_uscbc_member_survey.pdf. 159 USTR, the 2016 National Trade Estimate Report, March 23, 2016, p. 91, available at https://ustr.gov/sites/default/
files/2016-NTE-Report-FINAL.pdf. 160 Freedom House, Freedom on the Net 2015, available at https://freedomhouse.org/sites/default/files/
FH_FOTN_2015Report.pdf. 161 The United States International Trade Commission, China: Effects of Intellectual Property Infringement and
Indigenous Innovation Policies on the U.S. Economy, USITC Publication 4226, May 2011, p. xiv. 162 BSA, Shadow Market, 2011 BSA Global Software Piracy Study, Ninth Edition, May 2012, at http://portal.bsa.org/
globalpiracy2011/downloads/study_pdf/2011_BSA_Piracy_Study-Standard.pdf.
China-U.S. Trade Issues
Congressional Research Service 44
The Organization for Economic Development and Cooperation (OECD)
estimates that counterfeit products accounted for 2.5% of global trade in 2013 (or
$461 billion).163
Chinese officials contend that they have significantly improved their IPR protection regime, but
argue that the country lacks the resources and a sophisticated legal system to effectively deal with
IPR violations. They also contend that IPR infringement is a serious problem for domestic
Chinese firms as well. A survey by the Chinese State Administration for Industry and Commerce
found that 58.7% of products sold online in China were genuine in 2014.164
Many analysts
contend that China’s goals of becoming a global leader in innovation will induce the government
to strengthen IPR laws and enforcement. However, some analysts contend that China’s relatively
poor record on IPR enforcement can be partially explained by the fact that Chinese leaders want
to make China a major producer of capital-intensive and high-technology products, and thus, they
are tolerant of IPR piracy if it helps Chinese firms become more technologically advanced.
According to an official at the U.S. Chamber of Commerce
The newer and emerging challenge to U.S. IPR is not a function of China’s lack of
political will to crackdown on infringers. Rather, it is a manifestation of a coherent, and
government-directed, or at least government-motivated, strategy to lessen China’s
perceived reliance on foreign innovations and IP. China is actively working to create a
legal environment that enables it to intervene in the market for IP, help its own
companies to “re-innovate” competing IPR as a substitute to American and other foreign
technologies, and potentially misappropriate U.S. and other foreign IP as components of
its industrial policies and internal market regulation.... The common themes throughout
these policies are: 1) undermine and displace foreign IP; 2) leverage China’s large
domestic market to develop national champions and promote its own IP, displacing
foreign competitors in China; and 3) building on China’s domestic successes by
displacing competitors in foreign markets.165
An illustration of alleged IPR theft in China involves American Superconductor Corporation
(AMSC). On September 14, 2011, AMSC announced that it was filing criminal and civil
complaints in China against Sinovel Wind Group Co., Ltd. (Sinovel), China’s largest wind turbine
producer, and other parties, alleging the illegal use of AMSC’s intellectual property. According to
AMSC, Sinovel illegally (by bribing an AMSC employee) obtained and used AMSC’s wind
turbine control software code to upgrade its 1.5 megawatt wind turbines in the field to meet
proposed Chinese grid codes and to potentially allow for the use of core electrical components
from other manufacturers.166
In addition, AMSC claimed that Sinovel refused to pay for past
shipments from AMSC as well as honoring for future shipments of components and spare parts as
well.167
AMSC has brought several civil cases against Sinovel, seeking to recover more than $1.2
billion for contracted shipments and damages caused by Sinovel’s contract breaches.168
In 2013,
163 OECD, Trade in Counterfeit and Pirated Goods, Mapping the Economic Impact, 2016, p. 5. 164 Quartz, “Chinese government study based on shoddy data claims 40% of China’s online products are shoddy,”
November 3, 2015, available at http://qz.com/539824/chinese-government-study-based-on-shoddy-data-claims-40-of-
chinas-online-products-are-shoddy/. 165 Testimony of Jeremie Waterman, Senior Director, Greater China, U.S. Chamber of Commerce, before the U.S.
International Trade Commission, Hearing on China: Intellectual Property Infringement, Indigenous Innovation
Policies, and Frameworks for Measuring the Effects on the U.S. Economy, June 15, 2010. 166 AMSC claims Sinovel had obtained the intellectual property from a former AMSC employee who was then under
arrest in Austria for economic espionage and fraudulent manipulation of data. 167 AMSC Press Release, “AMSC Filing Criminal and Civil Complaints Against Sinovel,” September 14, 2011. 168 AMSC, Press Release, April 10, 2012, at http://files.shareholder.com/downloads/AMSC/2346100399x0x558743/
(continued...)

China-U.S. Trade Issues
Congressional Research Service 45
the U.S. Justice Department issued indictments against Sinovel and two of its employees, along
with a former AMSC employee, with trade secrets theft, describing the action as “nothing short of
attempted corporate homicide.”169
According to AMSC, it lost about half of its market
capitalization after Sinovel refused to honor its contracts, and that as of 2017 AMSC’s stock
valued had dropped by 96% and its workforce by 70%. One AMSC official said that it possessed
emails that “include the actual transfer and Skype messages indicating that senior level Sinovel
officials ordered the theft of AMSC IP and understood the devastating impact it would have on
AMSC,” and it estimated that 8,000 windmills in China (20% of the country’s total) were
operating on AMSC’s stolen technology.170
According to a specialist in intellectual property at Tufts University, “Chinese companies, once
they acquire the needed technology, will often abandon their Western partners on the pretext that
the technology or product failed to meet Chinese governmental regulations. This is yet another
example of a Chinese industrial policy aimed at procuring, by virtually any means, technology in
order to provide Chinese domestic industries with a competitive advantage.”171
to pursue trade
secret and copyright infringement litigation in China and the United States.172
Market access in
China remains a significant problem for many U.S. IP industries (such as music and films), and is
considered a significant cause of high IPR piracy rates. For example, China’s growing middle
class has resulted in a surge in movie box office sales in recent years, which hit $6.8 billion in
2015 (up 49% over the previous year), making China the largest market outside the United States
and Canada.173
When China joined the WTO in 2001 it agreed to allow 20 imported foreign films
per year.174
During the visit to the United States by then-Chinese Vice President Xi Jinping in
February 2012, China agreed that it would allow in more American exports of 3D, IMAX, and
similarly enhanced format movies on favorable commercial terms; strengthen the opportunities to
distribute films through private enterprises rather than the state film monopoly; and ensure fairer
compensation levels for U.S. blockbuster films distributed by Chinese SOEs.175
This extended
China’s foreign movie quota to 34, based on a revenue-sharing agreement (foreign studios receive
25% of the box office receipts) with a Chinese SOE.176
Some business groups complain that
China has failed to allow competition in the distribution of movies, noting that no private firms
have been given a license to distribute movies nationally. Two Chinese government entities
determine which foreign films will enter the market, set opening dates, and determine the number
(...continued)
f01e0c5a-a526-4102-a818-f61f2d71ef79/AMSC_News_2012_4_10_Commercial.pdf. 169 Department of Justice, Press Release, June 27, 2013, at https://www.justice.gov/opa/pr/sinovel-corporation-and-
three-individuals-charged-wisconsin-theft-amsc-trade-secrets. 170 USTR, Section 301 Investigation: China’s Acts, Policies, and Practices Related to Technology Transfer, Intellectual
Property, and Innovation, October 10. 2017, at https://ustr.gov/sites/default/files/
03142013%20Update%20Org%20Chart.pdf. 171 “Data Theft Case May Test U.S. China Ties,” Boston Globe, September 19, 2011. 172 AMSC, Press Release, April 23, 2015, available at http://ir.amsc.com/releasedetail.cfm?ReleaseID=908308. 173 Motion Picture Association of America, 2015 Theatrical Statistics, April 2016, available at http://www.mpaa.org/
wp-content/uploads/2016/04/MPAA-Theatrical-Market-Statistics-2015_Final.pdf. 174 Such restrictions are mainly imposed to protect China’s domestic film industry from foreign competition. 175 The White House, Press Release, February 17, 2012, at http://www.whitehouse.gov/the-press-office/2012/02/17/
united-states-achieves-breakthrough-movies-dis,pute-china. 176 China also allows 30-40 imported foreign movies into the country on a flat fee basis and foreign firms can co-
produce movies in China or provide films for TV or online viewing. See, China Briefing, Navigating Restrictions in
China’s Film Industry, December 2015, available at http://www.hollywoodreporter.com/news/china-box-office-grows-
astonishing-851629.

China-U.S. Trade Issues
Congressional Research Service 46
of screens on which films can be shown, which some argue, is mainly based on the goal of
protecting and promoting Chinese films.177
The share of Hollywood movies in box office sales in
China dropped from 45.5% in 2014 to 38.4% in 2015.178
Technology Transfer Issues
When China entered the WTO in 2001, it agreed that foreign firms would not be pressured by
government entities to transfer technology to a Chinese partner as part of the cost of doing
business in China. However, many U.S. firms argue that this is a common Chinese practice,
although this is difficult to quantify because, oftentimes, U.S. business representatives appear to
try to avoid negative publicity regarding the difficulties they encounter doing business in China
out of concern over retaliation by the Chinese government.179
In addition, Chinese officials
reportedly pressure foreign firms through oral communications to transfer technology (for
example as a condition to invest in China), so as to avoid putting such requirements in writing in
order to evade accusations of violating WTO rules.
A 2010 study by the U.S. Chamber of Commerce stated that growing pressure on foreign firms to
share technology in exchange for market access in China was forcing such firms to “anguish over
balancing today’s profits with tomorrow’s survival.”180
In 2011, then-U.S. Treasury Secretary
Timothy Geithner charged that “we’re seeing China continue to be very, very aggressive in a
strategy they started several decades ago, which goes like this: you want to sell to our country, we
want you to come produce here. If you want to come produce here, you need to transfer your
technology to us.” A 2012 AmCham China survey reported that 33% of its respondents stated that
technology transfer requirements were negatively affecting their businesses.181
U.S. officials continue to press China on this issue. A U.S. Commerce Department fact sheet from
the December 2014 U.S.-China Joint Commission on Commerce and Trade (JCCT) meeting
stated
China clarified and underscored that it will treat IPR owned or developed in other
countries the same as domestically owned or developed IPR, and it further agreed that
enterprises are free to base technology transfer decisions on business and market
considerations, and are free to independently negotiate and decide whether and under
what circumstances to assign or license intellectual property rights to affiliated or
unaffiliated enterprises.182
Following President Obama’s meeting with President Xi in September 2016, the White House
issued a fact sheet that said that the two sides committed “not to advance generally applicable
policies or practices that require the transfer of intellectual property rights or technology as a
177 Bloomberg, China Could Beat Hollywood by 2017, February 25, 2016. 178 The Hollywood Reporter, China Box Office Grows Astonishing 48.7 Percent in 2015, Hits $6.78 Billion, December
31, 2015, available at http://www.hollywoodreporter.com/news/china-box-office-grows-astonishing-851629. 179 China denies that public officials exert such pressure and that any technology transfers that do occur in China are the
result of commercial agreements between companies. 180 U.S. Chamber of Commerce, China’s Drive for ‘Indigenous Innovation’ - A Web of Industrial Policies, July 29,
2010. 181 AmCham China, 2012 China Business Climate Survey Report, March 2012, available at
http://www.amchamchina.org/businessclimate2012. 182 U.S. Department of Commerce, U.S.-China Joint Fact Sheet on 25th Joint Commission on Commerce and Trade,
December 29, 2014, available at https://www.commerce.gov/news/fact-sheets/2014/12/us-china-joint-fact-sheet-25th-
joint-commission-commerce-and-trade.

China-U.S. Trade Issues
Congressional Research Service 47
condition of doing business in their respective markets.”183
Technology transfer issues have also
been raised over a number of new Chinese laws and regulations that advance “secure and
controllable technology” (discussed below).
Cyber-security Issues
Cyber-attacks against U.S. firms have raised concerns over the potential large-scale theft of U.S.
IPR and its economic implications for the United States. A 2011 report by McAfee (a U.S. global
security technology company) stated that its investigation had identified targeted intrusions into
more than 70 global companies and warned that “every conceivable industry with significant size
and valuable intellectual property has been compromised (or will be shortly), with the great
majority of the victims rarely discovering the intrusion or its impact.”184
Many U.S. analysts and
policymakers contend that the Chinese government is a major source of cyber economic
espionage against U.S. firms. For example, Representative Mike Rogers, chairman of the House
Permanent Select Committee on Intelligence, stated at an October 4, 2011, hearing that
Attributing this espionage isn’t easy, but talk to any private sector cyber analyst, and they
will tell you there is little doubt that this is a massive campaign being conducted by the
Chinese government. I don’t believe that there is a precedent in history for such a
massive and sustained intelligence effort by a government to blatantly steal commercial
data and intellectual property. China’s economic espionage has reached an intolerable
level and I believe that the United States and our allies in Europe and Asia have an
obligation to confront Beijing and demand that they put a stop to this piracy.185
A 2011 report by the U.S. Office of the Director of National Intelligence (DNI) stated, “Chinese
actors are the world’s most active and persistent perpetrators of economic espionage. U.S. private
sector firms and cyber-security specialists have reported an onslaught of computer network
intrusions that have originated in China, but the IC (Intelligence Community) cannot confirm who
was responsible.” The report goes on to warn that
China will continue to be driven by its longstanding policy of “catching up fast and
surpassing” Western powers. The growing interrelationships between Chinese and U.S.
companies—such as the employment of Chinese-national technical experts at U.S.
facilities and the off-shoring of U.S. production and R&D to facilities in China—will
offer Chinese government agencies and businesses increasing opportunities to collect
sensitive US economic information.186
On February 19, 2013, Mandiant, a U.S. information security company, issued a report
documenting extensive economic cyber-espionage by a Chinese unit (which it designated as
APT1) with alleged links to the Chinese People’s Liberation Army (PLA) against 141 firms,
covering 20 industries, since 2006. The report stated
Our analysis has led us to conclude that APT1 is likely government-sponsored and one of
the most persistent of China’s cyber threat actors. We believe that APT1 is able to wage
183 The White House, Fact Sheet: U.S.-China Economic Relations, September 4, 2016, available at
https://www.whitehouse.gov/the-press-office/2016/09/04/fact-sheet-us-china-economic-relations. 184 The report did not identify China (or any country) as the source of the intrusions. McAfee, Revealed: Operation
Shady Rat, An Investigation of Targeted Intrusions Into More Than 70 Global Companies, Governments, and Nonprofit
Organizations During the Last Five Years, 2011. 185 House Permanent Select Committee on Intelligence, Chairman Mike Rogers Opening Statement at the Hearing on
Cyber Threats and Ongoing Efforts to Protect the Nation, October 4, 2011. 186 DNI, Office of the National Counterintelligence Executive, Foreign Spies Stealing U.S. Economic Secrets in
Cyberspace, Report to Congress on Foreign Economic Collection and Industrial Espionage: 2009-2011, October 2011.

China-U.S. Trade Issues
Congressional Research Service 48
such a long-running and extensive cyber espionage campaign in large part because it
receives direct government support. In seeking to identify the organization behind this
activity, our research found that People’s Liberation Army (PLA’s) Unit 61398 is similar
to APT1 in its mission, capabilities, and resources. PLA Unit 61398 is also located in
precisely the same area from which APT1 activity appears to originate.187
On March 11, 2013, Tom Donilon, then-National Security Advisor to President Obama, stated in
a speech that the United States and China should engage in a constructive dialogue to establish
acceptable norms of behavior in cyberspace; that China should recognize the urgency and scope
of the problem and the risks it poses to U.S. trade relations and the reputation to Chinese industry;
and that China should take serious steps to investigate and stop cyber-espionage.188
Following a
meeting with Chinese President Xi Jinping in June 2013, President Obama warned that if cyber-
security issues are not addressed, and if there continues to be direct theft of United States
property, then “this was going to be a very difficult problem in the economic relationship and was
going to be an inhibitor to the relationship really reaching its full potential.”189
On May 19, 2014, the U.S. Department of Justice issued a 31-count indictment against five
members of the Chinese People’s Liberation Army (PLA) for cyber-espionage and other offenses
that allegedly targeted five U.S. firms and a labor union for commercial advantage, the first time
the Federal government has initiated such action against state actors. The named U.S. victims
were Westinghouse Electric Co. (Westinghouse); U.S. subsidiaries of SolarWorld AG
(SolarWorld); United States Steel Corp. (U.S. Steel); Allegheny Technologies Inc. (ATI); the
United Steel, Paper and Forestry, Rubber, Manufacturing, Energy, Allied Industrial and Service
Workers International Union (USW); and Alcoa Inc. The indictment appears to indicate a high
level of U.S. government concern about the extent of Chinese state-sponsored cyber commercial
theft against U.S. firms.190
China strongly condemned the U.S. indictment and announced that it would suspend its
participation in the U.S.-China Cyber Working Group, established in 2013. Some Members of
Congress have called on the USTR to initiate a case against China in the World Trade
Organization (WTO). Others have called for new measures to identify foreign governments that
engage in cyber-espionage and to impose sanctions against entities that benefit from that theft.
For example, in the 114th Congress H.R. 3039 would have authorized the President to impose
certain penalties on state-sponsors of cyber-attacks. Some analysts warn that growing U.S.-China
disputes over cyber-theft could significantly impact commercial ties. The Obama Administration
sought ways to enhance U.S. commercial cyber-security at home, develop bilateral and global
rules governing cyber-theft of commercial trade secrets, strengthen U.S. trade policy tools, and
promote greater cooperation with trading partners that share U.S. concerns.
On April 1, 2015, President Obama issued Executive Order 13964, authorizing certain sanctions
against “persons engaging in significant malicious cyber-enabled activities.”191
Shortly before
Chinese President Xi’s state visit to the United States in September 2015, some press reports
indicated that the Obama Administration was considering the imposition of sanctions against
187 Mandiant, APT1: Exposing One of China’s Cyber, Espionage Units, February 19, 2013, p. 2. 188 U.S. Asia Society, Complete Transcript: Thomas Donilon at Asia Society, New York March 11, 2013. 189 National Public Radio, Chinese Cyber-Hacking Discussed At Obama-Xi Summit, June 9, 2013, available at
http://www.npr.org/sections/thetwo-way/2013/06/09/190058558/chinese-cyber-hacking-discussed-at-obama-xi-
summit. 190 U.S. Department of Justice, at http://www.justice.gov/iso/opa/resources/5122014519132358461949.pdf. 191 A copy can be found at http://www.treasury.gov/resource-center/sanctions/Programs/Documents/cyber_eo.pdf. The
EO was extended for an additional year by President Obama on March 29, 2016.
China-U.S. Trade Issues
Congressional Research Service 49
Chinese entities over cyber-theft, even possibly before the arrival of President Xi, which some
analysts speculated might have caused Xi to cancel his visit. This appears to have prompted
China to send a high-level delegation (headed by Meng Jianzhu, Secretary of the Central Political
and Legal Affairs Commission of the Chinese Communist Party) to Washington, DC, to hold four
days of talks (September 9-12) with U.S. officials over cyber issues.192
On September 25, 2015, Chinese President Xi and President Obama announced that they had
reached an agreement on cyber-security. The agreement stated that neither country’s government
will conduct or knowingly support cyber-enabled theft of intellectual property, including trade
secrets or other confidential business information, with the intent of providing competitive
advantages to companies or commercial sectors.193
They also agreed to set up a high-level
dialogue mechanism (which would meet twice a year) to address cybercrime and to improve two-
way communication when cyber-related concerns arise (including the creation of a hotline). The
first meeting of the U.S.-China High-Level Joint Dialogue on Cybercrime and Related Issues was
held in December 2015 in Washington, DC. The two sides reached agreement on a document
establishing guidelines for requesting assistance on cybercrime or other malicious cyber-activities
and for responding to such requests. They decided to conduct a tabletop exercise in the spring of
2016 (held in April 2016) on agreed-upon cybercrime, malicious cyber-activity and network
protection scenarios; pledged to develop the scope, goals, and procedures for use of the hotline
for the next dialogue; and agreed to further develop case cooperation on combatting cyber-
enabled crimes (including child exploitation, theft of trade secrets, fraud and misuse of
technology, and communications for terrorist activities).194
The second Cyber Dialogue was held
in Beijing in June 2016. The two sides agreed to begin implementation of a cyber-hotline
mechanism (which reportedly became operational in August 2016);195
continue to strengthen
cooperation in network protection; enhance case investigations and information exchanges;
prioritize cooperation on combatting cyber-enabled IP theft for commercial gain and cooperate in
law enforcement operations; and agreed to create an action plan to address the threat posed from
business email compromise scams.196
The first session of the U.S.-China Law Enforcement and Cybersecurity Dialogue (established by
President Trump and President Xi in April 2017 as part of the U.S.-China Comprehensive
Economic Dialogue) was held in October 2017. On cyber issues, the two sides pledged to
continue cooperation based on the 2015 agreement, including based on five main commitments to
give timely responses should be provided to requests for information and
assistance concerning malicious cyber activities;
192 The White House, Press Release, September 12, 2015, available https://www.whitehouse.gov/the-press-office/2015/
09/12/readout-senior-administration-officials-meeting-secretary-central. 193 The November 2015 meeting of the G-20 countries (which includes China) included language in its communiqué:
“In the ICT environment, just as elsewhere, states have a special responsibility to promote security, stability, and
economic ties with other nations. In support of that objective, we affirm that no country should conduct or support ICT-
enabled theft of intellectual property, including trade secrets or other confidential business information, with the intent
of providing competitive advantages to companies or commercial sectors.” 194 U.S. Department of Justice, First U.S.-China High-Level Joint Dialogue on Cybercrime and Related Issues
Summary of Outcomes, December 2, 2015, available at https://www.justice.gov/opa/pr/first-us-china-high-level-joint-
dialogue-cybercrime-and-related-issues-summary-outcomes-0. 195 Cyber Administration of China, Sino-US High-level Joint Dialogue Hotline on Combating Cybercrime and Related
Matters, August 28, 2016, available (in Chinese) at http://www.cac.gov.cn/2016-08/28/c_1119466923.htm. 196 U.S. Department of Justice, Second U.S.-China Cybercrime and Related Issues High Level Joint Dialogue, June 14,
2016, available at https://www.justice.gov/opa/pr/second-us-china-cybercrime-and-related-issues-high-level-joint-
dialogue.

China-U.S. Trade Issues
Congressional Research Service 50
ensure that neither country’s government will conduct or knowingly support
cyber-enabled theft of intellectual property, including trade secrets or other
confidential business information, with the intent of providing competitive
advantages to companies or commercial sectors;
make efforts to further identify and promote appropriate norms of state behavior
in cyberspace within the international community;
maintain a high-level joint dialogue mechanism on fighting cybercrime and
related issues; and
enhance law enforcement communication on cyber security incidents and to
mutually provide timely responses.197
Agreement on Cyber-security Issues at the September 2015 U.S-China Summit
Neither country’s government will conduct or knowingly support cyber-enabled theft of IP, including trade
secrets or other confidential business information, with the intent of providing competitive advantages to
companies or commercial sectors.
They will establish a high-level joint dialogue mechanism on fighting cybercrime and related issues.
They will seek to work together to identify and promote appropriate norms of state behavior in cyberspace
internationally; and
Each side will provide timely responses to requests for information and assistance concerning malicious cyber-
activities.
Source: The White House.
On April 27, 2016, the United States Steel Corporation (USS) filed a Section 337198
case with the
USITC against several major Chinese steel producers and their distributors in regard to certain
carbon and alloy steel products.199
USS contends that in January 2011, the Chinese government
hacked U.S. Steel’s research computers and equipment, stealing proprietary methods for
manufacturing these products, and that soon thereafter, Baosteel (a Chinese SOE and largest
Chinese steel firm), and possibly other Chinese steel firms, began producing and exporting “the
very highest grades of advanced high-strength steel, even though they had previously been unable
to do so.” USS charged that imports of such products into the United States using USS’s stolen
trade secrets competed against and undercut USS’s own products. This is the first Section 337
case that has involved alleged cyber-theft of U.S. trade secrets.
Analysts differ on how the U.S.-China cyber agreement will address bilateral cyber-theft issues.
Some have called it a good first start to developing rules governing cyber-theft of commercial
IPR. Others are more skeptical; noting that the Chinese government denies engaging in cyber-
theft of trade secrets for gaining a competitive advantage, and instead, claims China is the
“biggest victim” of such activity. In addition, critics contend, it is often extremely difficult to
identify hackers, let alone trace it back to a government entity. According to CrowdStrike (a U.S.
cyber-security firm), cyber-attacks against U.S. firms continued shortly after the agreement was
197 U.S. Department of Justice, First U.S.-China Law Enforcement and Cybersecurity Dialogue, Summary of Outcomes,
October 4, 2017, available at https://www.justice.gov/opa/pr/first-us-china-law-enforcement-and-cybersecurity-
dialogue. 198 Section 337 of the Tariff Act of 1930 tasks the USITC to investigate certain unfair practices in import trade. 199 Section 337 of the Tariff Act of 1930 (19 U.S.C. §1337) enables U.S. firms to seek relief from imports that infringe
on U.S. IPR (such as patent or registered trademark infringement and misappropriation of trade secrets), and other
forms of unfair competition (such as violations of U.S. antitrust laws). Relief under Section 337 cases can result in a
U.S. ban on certain products from entering the United States.

China-U.S. Trade Issues
Congressional Research Service 51
reached. It detected 11 breaches of its customers from September 26, 2015 to October 16, 2016.200
A report by cyber-security firm Fireeye stated that while Chinese cyber-attacks against U.S.,
European, and Japanese firms continued after the U.S.-China cyber agreement was reached, the
overall level of cyber-intrusions have declined since mid-2014. Fireeye attributed the decline to
military reforms in China, widespread exposure of Chinese cyber-activity, and actions by the U.S.
government.201
However, CrowdStrike contends that the economic slowdown in China and the
innovation goals of the 13th Five-Year Plan would likely continue to drive China’s state-sponsored
cyber-espionage activities.202
China’s Obligations in the World Trade Organization
Negotiations for China’s accession to the General Agreement on Tariffs and Trade (GATT) and its
successor organization, the WTO, began in 1986 and took over 15 years to complete. During the
WTO negotiations, Chinese officials insisted that China was a developing country and should be
allowed to enter under fairly lenient terms. The United States insisted that China could enter the
WTO only if it substantially liberalized its trade regime. In the end, a compromise was reached
that required China to make immediate and extensive reductions in various trade and investment
barriers, while allowing it to maintain some level of protection (or a transitional period of
protection) for certain sensitive sectors. China’s WTO membership was formally approved at the
WTO Ministerial Conference in Doha, Qatar, on November 10, 2001. On November 11, 2001,
China notified the WTO that it had formally ratified the WTO agreements, and on December 11,
2001, it formally joined the WTO.203
Under the WTO accession agreement, China agreed to do
the following:
Reduce the average tariff for industrial goods from 17% to 8.9%, and average
tariffs on U.S. priority agricultural products from 31% to 14%.
Limit subsidies for agricultural production to 8.5% of the value of farm output,
eliminate export subsidies on agricultural exports, and notify the WTO of all
government subsidies on a regular basis.
Within three years of accession, grant full trade and distribution rights to foreign
enterprises (with some exceptions, such as for certain agricultural products,
minerals, and fuels).
Provide nondiscriminatory treatment to all WTO members, such as treating
foreign firms in China no less favorably than Chinese firms for trade purposes.
End discriminatory trade policies against foreign invested firms in China, such as
domestic content rules and technology transfer requirements.
Implement the WTO’s Trade-Related Aspects of Intellectual Property Rights
(TRIPS) Agreement (which sets basic standards on IPR protection and rules for
enforcement) upon accession.
200 CrowdStrike Blog, The Latest on Chinese-affiliated Intrusions into Commercial Companies, October 19, 2015,
available at https://www.crowdstrike.com/blog/the-latest-on-chinese-affiliated-intrusions-into-commercial-companies/. 201 Fireeye, Redline Drawn, China Recalculates its Use of Cyber Espionage, June 2016, p. 3, available at
https://www.fireeye.com/content/dam/fireeye-www/current-threats/pdfs/rpt-china-espionage.pdf. 202 CrowdStrike, 2015 Global Threat Report, September 5, 2015, available at https://www.crowdstrike.com/global-
threat-report-2015/. 203 Following China’s WTO accession, the United States, in January 2002, granted China permanent normal trade
relations (PNTR) status (prior to that time, that status was on a conditional basis) to ensure that the United States and
China had a formal trade relationship under the rules of the WTO.

China-U.S. Trade Issues
Congressional Research Service 52
Fully open the banking system to foreign financial institutions within five years
(by the end of 2006).
Allow joint ventures in insurance and telecommunication (with various degrees
of foreign ownership allowed).
China’s implementation of its tariff concessions was largely on time. Its simple average tariff fell
from 15.9% in 2001 to its current average level of 9.9%.204
Some tariff cuts were significant.
China’s 2001 tariff rates of 80-100% on autos were reduced to 25% by 2006. Despite these cuts,
China’s simple average tariff rate is three times the U.S. level (see Figure 16). China’s tariff on
autos is 10 times the U.S. level of 2.5%. China also levies a value-added tax on most imports.
Figure 16. China and U.S. Simple Average MFN Tariff Rates
(percentage)
Source: World Trade Organization.
Note: Simple average MFN rates reflect the average of all rates listed in the tariff schedule, and exclude tariff
rates under bilateral or plurilateral FTAs. Data exclude China’s consumption taxes on imports.
WTO Implementation Issues
Getting China into the WTO under a comprehensive trade liberalization agreement was a major
U.S. trade objective during the late 1990s. Many U.S. policymakers at the time maintained that
China’s WTO membership would encourage the Chinese government to deepen market reforms,
promote the rule of law, reduce the government’s role in the economy, further integrate China into
the world economy, and enable the United States to use the WTO’s dispute resolution mechanism
to address major trade issues. As a result, it was hoped, China would become a more reliable and
stable U.S. trading partner. U.S. trade officials contend that in the first few years after it joined the
WTO, China made noteworthy progress in adopting economic reforms that facilitated its
204 Another way to compare tariff burdens is to calculate the trade weighted average tariff, which is the sum of duties
collected over the sum of import values. China’s average tariff under this measurement is 4.5% (down from 14.1% in
2001) while the U.S. level is 2.4%. For agricultural and nonagricultural products, China’s trade weighted tariffs were
9.7% and 4%, respectively.

China-U.S. Trade Issues
Congressional Research Service 53
transition toward a market economy and increased its openness to trade and FDI. However,
beginning in 2006, progress toward further market liberalization appeared to slow. By 2008, U.S.
government and business officials noted evidence of trends toward a more restrictive trade
regime.205
The USTR’s 2015 report on China’s WTO compliance summarized U.S. concerns over
China’s trade regime as follows:
Many of the problems that arise in the U.S.-China trade and investment relationship can
be traced to the Chinese government’s interventionist policies and practices and the large
role of state-owned enterprises and other national champions in China’s economy, which
continue to generate significant trade distortions that inevitably give rise to trade
frictions.206
The 2016 report identified several priority areas of U.S. concern:
Intellectual property rights and market access, including trade secrets,
pharmaceutical patents, software piracy, online piracy, and counterfeit goods;
Industrial policies, including “secure and controllable” ICT policies, indigenous
innovation policies, technology transfer requirements, export restraints on raw
materials, export subsidies, excess capacity in certain industries (e.g., steel and
aluminum), value-added taxes on exports, support of “strategic emerging
industries,207
import bans on remanufactured products, discriminatory standards
and technology policies, failure to join the WTO’s GPA, investment restrictions,
and use of trade remedy measures for retaliatory purposes;
Restrictions on services, including electronic payments, theatrical films and
audio-visual services, banking telecommunications, insurance, commercial
internet activities, express delivery, and legal services;
Restriction on agricultural products, including sanitary and phytosanitary
(SPS) measures on beef, pork and poultry, biotechnology approvals, and
domestic support subsidies;
Inadequate transparency, including in regard to publication of trade-related
laws, regulations, notice and comment procedures (e.g., publishing draft laws for
comment), and translation of all trade-related laws, regulations and other
measures at all levels of government in one or more of the WTO languages; and
Restrictive aspects of the legal framework, especially in regard to
administrative licenses and China’s competition policy.
The United States has used the WTO dispute settlement mechanism on a number of occasions to
address China’s alleged noncompliance with its WTO commitments. To date, it has brought 22
dispute settlement cases against China (or 55% of the total number of cases brought by all WTO
members against China through March June 2018).208
These are summarized in Table 10.209
China in turn has brought 13 dispute settlement cases against the United States, three of which
205 China generally implemented its tariff reductions on schedule. 206 USTR, 2016 Report to Congress on China’s WTO Compliance, January 2017, available at https://ustr.gov/sites/
default/files/2016-China-Report-to-Congress.pdf. 207 These industries include energy and environmental protection, new generation information technology,
biotechnology, high-end equipment manufacturing, new energy, new materials, and new-energy vehicles. 208 The United States has been the largest target of China’s dispute settlement cases in the WTO as well. 209 These cases can be found on the WTO’s Dispute Settlement website at https://www.wto.org/english/tratop_e/
dispu_e/dispu_by_country_e.htm.
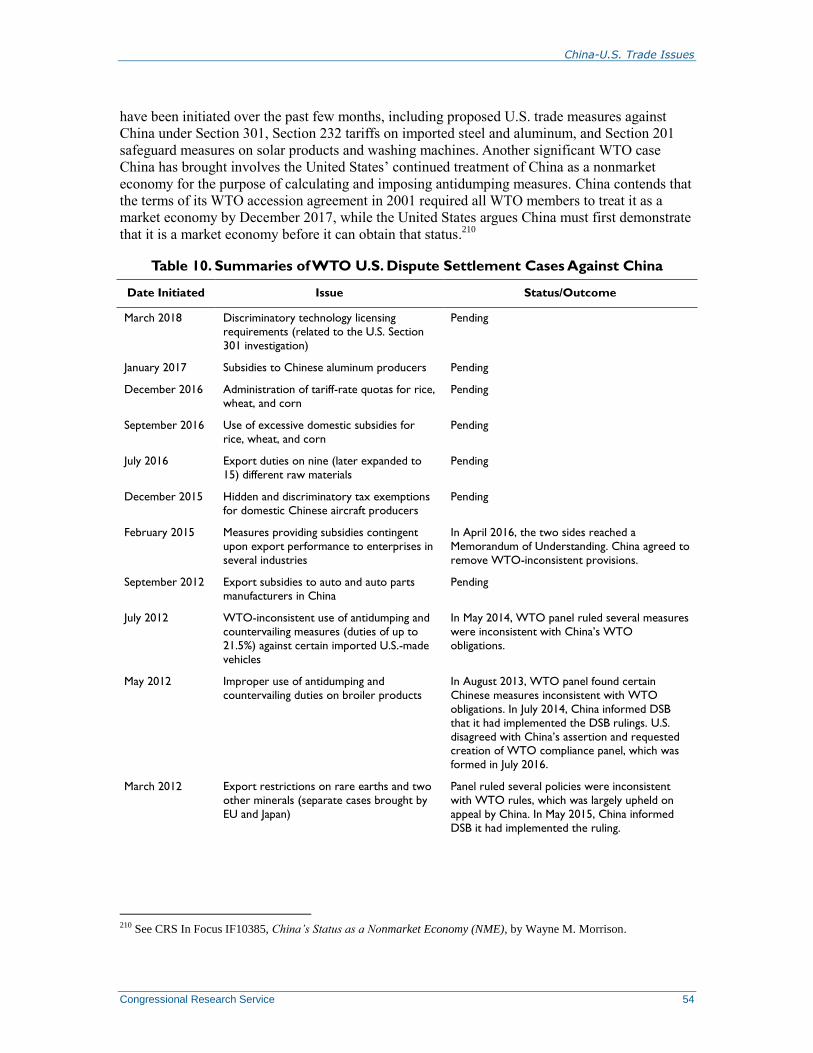
China-U.S. Trade Issues
Congressional Research Service 54
have been initiated over the past few months, including proposed U.S. trade measures against
China under Section 301, Section 232 tariffs on imported steel and aluminum, and Section 201
safeguard measures on solar products and washing machines. Another significant WTO case
China has brought involves the United States’ continued treatment of China as a nonmarket
economy for the purpose of calculating and imposing antidumping measures. China contends that
the terms of its WTO accession agreement in 2001 required all WTO members to treat it as a
market economy by December 2017, while the United States argues China must first demonstrate
that it is a market economy before it can obtain that status.210
Table 10. Summaries of WTO U.S. Dispute Settlement Cases Against China
Date Initiated Issue Status/Outcome
March 2018 Discriminatory technology licensing
requirements (related to the U.S. Section
301 investigation)
Pending
January 2017 Subsidies to Chinese aluminum producers Pending
December 2016 Administration of tariff-rate quotas for rice,
wheat, and corn
Pending
September 2016 Use of excessive domestic subsidies for
rice, wheat, and corn
Pending
July 2016 Export duties on nine (later expanded to
15) different raw materials
Pending
December 2015 Hidden and discriminatory tax exemptions
for domestic Chinese aircraft producers
Pending
February 2015 Measures providing subsidies contingent
upon export performance to enterprises in
several industries
In April 2016, the two sides reached a
Memorandum of Understanding. China agreed to
remove WTO-inconsistent provisions.
September 2012 Export subsidies to auto and auto parts
manufacturers in China
Pending
July 2012 WTO-inconsistent use of antidumping and
countervailing measures (duties of up to
21.5%) against certain imported U.S.-made
vehicles
In May 2014, WTO panel ruled several measures
were inconsistent with China’s WTO
obligations.
May 2012 Improper use of antidumping and
countervailing duties on broiler products
In August 2013, WTO panel found certain
Chinese measures inconsistent with WTO
obligations. In July 2014, China informed DSB
that it had implemented the DSB rulings. U.S.
disagreed with China’s assertion and requested creation of WTO compliance panel, which was
formed in July 2016.
March 2012 Export restrictions on rare earths and two
other minerals (separate cases brought by
EU and Japan)
Panel ruled several policies were inconsistent
with WTO rules, which was largely upheld on
appeal by China. In May 2015, China informed
DSB it had implemented the ruling.
210 See CRS In Focus IF10385, China’s Status as a Nonmarket Economy (NME), by Wayne M. Morrison.
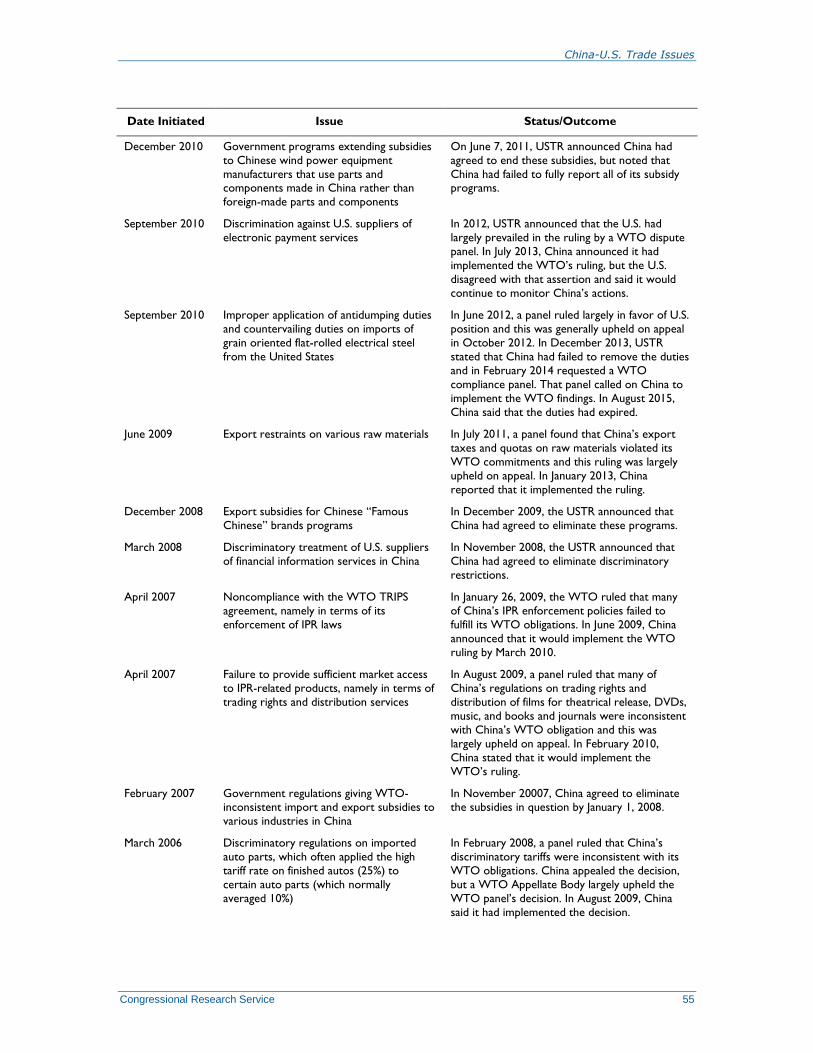
China-U.S. Trade Issues
Congressional Research Service 55
Date Initiated Issue Status/Outcome
December 2010 Government programs extending subsidies
to Chinese wind power equipment
manufacturers that use parts and components made in China rather than
foreign-made parts and components
On June 7, 2011, USTR announced China had
agreed to end these subsidies, but noted that
China had failed to fully report all of its subsidy programs.
September 2010 Discrimination against U.S. suppliers of
electronic payment services
In 2012, USTR announced that the U.S. had
largely prevailed in the ruling by a WTO dispute
panel. In July 2013, China announced it had
implemented the WTO’s ruling, but the U.S.
disagreed with that assertion and said it would
continue to monitor China’s actions.
September 2010 Improper application of antidumping duties
and countervailing duties on imports of
grain oriented flat-rolled electrical steel
from the United States
In June 2012, a panel ruled largely in favor of U.S.
position and this was generally upheld on appeal
in October 2012. In December 2013, USTR
stated that China had failed to remove the duties
and in February 2014 requested a WTO
compliance panel. That panel called on China to
implement the WTO findings. In August 2015,
China said that the duties had expired.
June 2009 Export restraints on various raw materials In July 2011, a panel found that China’s export
taxes and quotas on raw materials violated its
WTO commitments and this ruling was largely
upheld on appeal. In January 2013, China
reported that it implemented the ruling.
December 2008 Export subsidies for Chinese “Famous
Chinese” brands programs
In December 2009, the USTR announced that
China had agreed to eliminate these programs.
March 2008 Discriminatory treatment of U.S. suppliers
of financial information services in China
In November 2008, the USTR announced that
China had agreed to eliminate discriminatory
restrictions.
April 2007 Noncompliance with the WTO TRIPS
agreement, namely in terms of its
enforcement of IPR laws
In January 26, 2009, the WTO ruled that many
of China’s IPR enforcement policies failed to
fulfill its WTO obligations. In June 2009, China
announced that it would implement the WTO
ruling by March 2010.
April 2007 Failure to provide sufficient market access
to IPR-related products, namely in terms of
trading rights and distribution services
In August 2009, a panel ruled that many of
China’s regulations on trading rights and
distribution of films for theatrical release, DVDs,
music, and books and journals were inconsistent
with China’s WTO obligation and this was
largely upheld on appeal. In February 2010,
China stated that it would implement the
WTO’s ruling.
February 2007 Government regulations giving WTO-inconsistent import and export subsidies to
various industries in China
In November 20007, China agreed to eliminate the subsidies in question by January 1, 2008.
March 2006 Discriminatory regulations on imported
auto parts, which often applied the high
tariff rate on finished autos (25%) to
certain auto parts (which normally
averaged 10%)
In February 2008, a panel ruled that China’s
discriminatory tariffs were inconsistent with its
WTO obligations. China appealed the decision,
but a WTO Appellate Body largely upheld the
WTO panel’s decision. In August 2009, China
said it had implemented the decision.
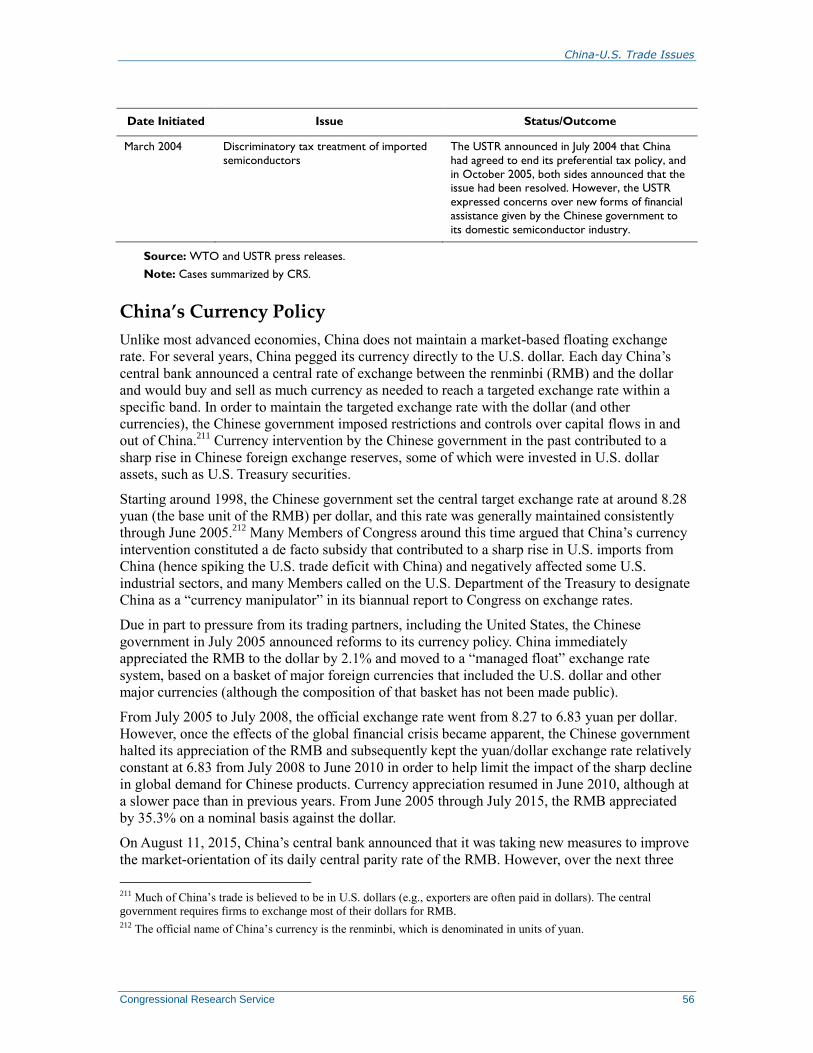
China-U.S. Trade Issues
Congressional Research Service 56
Date Initiated Issue Status/Outcome
March 2004 Discriminatory tax treatment of imported
semiconductors
The USTR announced in July 2004 that China
had agreed to end its preferential tax policy, and
in October 2005, both sides announced that the issue had been resolved. However, the USTR
expressed concerns over new forms of financial
assistance given by the Chinese government to
its domestic semiconductor industry.
Source: WTO and USTR press releases.
Note: Cases summarized by CRS.
China’s Currency Policy
Unlike most advanced economies, China does not maintain a market-based floating exchange
rate. For several years, China pegged its currency directly to the U.S. dollar. Each day China’s
central bank announced a central rate of exchange between the renminbi (RMB) and the dollar
and would buy and sell as much currency as needed to reach a targeted exchange rate within a
specific band. In order to maintain the targeted exchange rate with the dollar (and other
currencies), the Chinese government imposed restrictions and controls over capital flows in and
out of China.211
Currency intervention by the Chinese government in the past contributed to a
sharp rise in Chinese foreign exchange reserves, some of which were invested in U.S. dollar
assets, such as U.S. Treasury securities.
Starting around 1998, the Chinese government set the central target exchange rate at around 8.28
yuan (the base unit of the RMB) per dollar, and this rate was generally maintained consistently
through June 2005.212
Many Members of Congress around this time argued that China’s currency
intervention constituted a de facto subsidy that contributed to a sharp rise in U.S. imports from
China (hence spiking the U.S. trade deficit with China) and negatively affected some U.S.
industrial sectors, and many Members called on the U.S. Department of the Treasury to designate
China as a “currency manipulator” in its biannual report to Congress on exchange rates.
Due in part to pressure from its trading partners, including the United States, the Chinese
government in July 2005 announced reforms to its currency policy. China immediately
appreciated the RMB to the dollar by 2.1% and moved to a “managed float” exchange rate
system, based on a basket of major foreign currencies that included the U.S. dollar and other
major currencies (although the composition of that basket has not been made public).
From July 2005 to July 2008, the official exchange rate went from 8.27 to 6.83 yuan per dollar.
However, once the effects of the global financial crisis became apparent, the Chinese government
halted its appreciation of the RMB and subsequently kept the yuan/dollar exchange rate relatively
constant at 6.83 from July 2008 to June 2010 in order to help limit the impact of the sharp decline
in global demand for Chinese products. Currency appreciation resumed in June 2010, although at
a slower pace than in previous years. From June 2005 through July 2015, the RMB appreciated
by 35.3% on a nominal basis against the dollar.
On August 11, 2015, China’s central bank announced that it was taking new measures to improve
the market-orientation of its daily central parity rate of the RMB. However, over the next three
211 Much of China’s trade is believed to be in U.S. dollars (e.g., exporters are often paid in dollars). The central
government requires firms to exchange most of their dollars for RMB. 212 The official name of China’s currency is the renminbi, which is denominated in units of yuan.
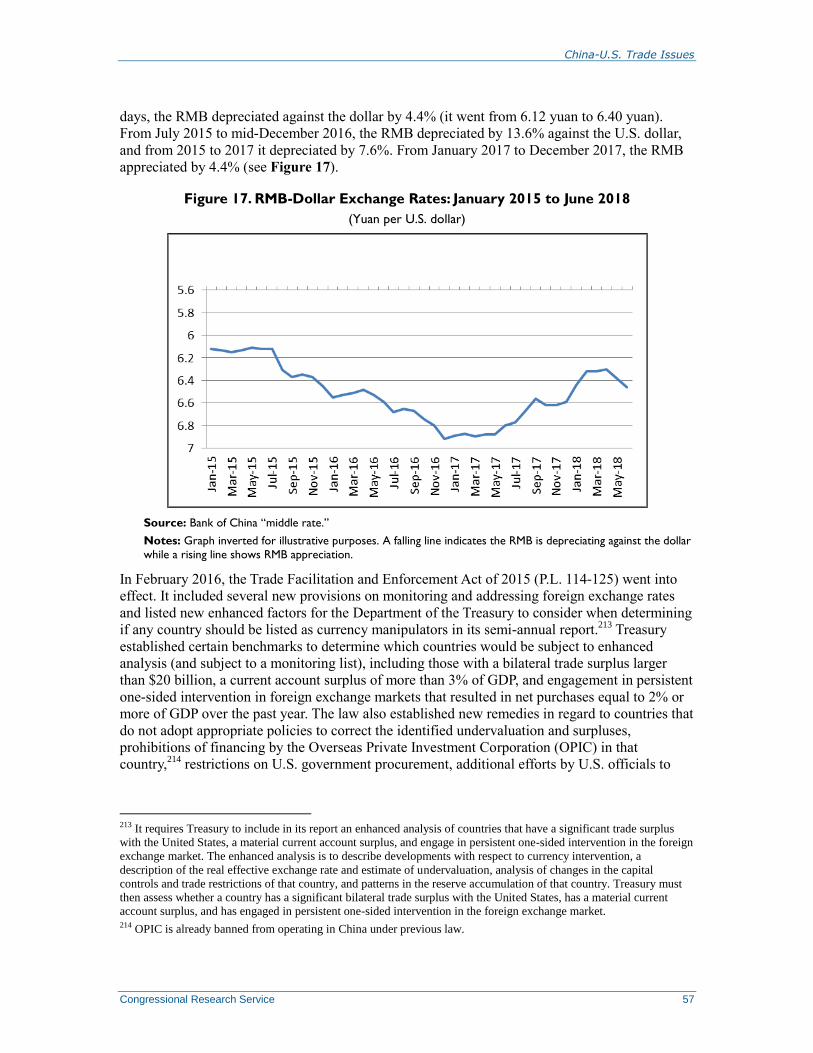
China-U.S. Trade Issues
Congressional Research Service 57
days, the RMB depreciated against the dollar by 4.4% (it went from 6.12 yuan to 6.40 yuan).
From July 2015 to mid-December 2016, the RMB depreciated by 13.6% against the U.S. dollar,
and from 2015 to 2017 it depreciated by 7.6%. From January 2017 to December 2017, the RMB
appreciated by 4.4% (see Figure 17).
Figure 17. RMB-Dollar Exchange Rates: January 2015 to June 2018
(Yuan per U.S. dollar)
Source: Bank of China “middle rate.”
Notes: Graph inverted for illustrative purposes. A falling line indicates the RMB is depreciating against the dollar
while a rising line shows RMB appreciation.
In February 2016, the Trade Facilitation and Enforcement Act of 2015 (P.L. 114-125) went into
effect. It included several new provisions on monitoring and addressing foreign exchange rates
and listed new enhanced factors for the Department of the Treasury to consider when determining
if any country should be listed as currency manipulators in its semi-annual report.213
Treasury
established certain benchmarks to determine which countries would be subject to enhanced
analysis (and subject to a monitoring list), including those with a bilateral trade surplus larger
than $20 billion, a current account surplus of more than 3% of GDP, and engagement in persistent
one-sided intervention in foreign exchange markets that resulted in net purchases equal to 2% or
more of GDP over the past year. The law also established new remedies in regard to countries that
do not adopt appropriate policies to correct the identified undervaluation and surpluses,
prohibitions of financing by the Overseas Private Investment Corporation (OPIC) in that
country,214
restrictions on U.S. government procurement, additional efforts by U.S. officials to
213 It requires Treasury to include in its report an enhanced analysis of countries that have a significant trade surplus
with the United States, a material current account surplus, and engage in persistent one-sided intervention in the foreign
exchange market. The enhanced analysis is to describe developments with respect to currency intervention, a
description of the real effective exchange rate and estimate of undervaluation, analysis of changes in the capital
controls and trade restrictions of that country, and patterns in the reserve accumulation of that country. Treasury must
then assess whether a country has a significant bilateral trade surplus with the United States, has a material current
account surplus, and has engaged in persistent one-sided intervention in the foreign exchange market. 214 OPIC is already banned from operating in China under previous law.

China-U.S. Trade Issues
Congressional Research Service 58
urge IMF action, and taking into account such currency policies before initiating or entering into
any bilateral or regional trade agreement negotiations.
China met two out of the three criteria (large trade surplus and current account surplus at over 3%
of GDP) for enhanced analysis in Treasury’s April 2016 report. The report urged China to
continue to rebalance the economy by boosting private consumption and said that “the RMB
should continue to experience real appreciation over the medium-term.” Treasury’s October 2016
report stated that China had met only one of the criteria (large trade surplus), but went on to say
that “despite the recent downward pressure on the RMB, the Chinese currency is still 21 percent
stronger than the dollar since December 2005, and 38 percent stronger on a real, trade-weighted
basis.”215
The first Treasury report on exchange rates under the Trump Administration, issued on April 14,
2017, did not conclude that China (or any country) had manipulated its currency, noting that the
Chinese government over the past year or so had intervened heavily to prevent rapid RMB
depreciation (as opposed to trying to prevent RMB appreciation, which often occurred in the
past). Although the report indicated that China had met only one of the criteria (trade surplus),
Treasury stated that China’s currency policy would be “closely monitored,” noting that China’s
trade surplus “accounts for a disproportionate share of the overall U.S. trade deficit.” Treasury
said that it would also monitor the currency policies of Japan, Korea, Taiwan, Germany, and
Switzerland. The October 2017 Department of the Treasury report noted that China had
intervened in 2017 to prevent RMB depreciation and that its current account surplus in the first
half of the year as a percent of GDP was 1.4%. However, Treasury complained that China’s trade
surplus with the United States remained high and urged China to deepen economic reforms.
Treasury’s April 2018 report on exchange rates emphasized China’s commitments not to engage
in competitive devaluations and to improve the transparency of its foreign exchange regime.216
The Trump Administration’s Approach to
Commercial Relations with China The Trump Administration has taken a number of steps in regard to U.S-China commercial
relations. At their first official meeting as heads of state in April 2017, President Trump and
Chinese President Xi Jinping announced the establishment of a “100-day plan on trade” as well as
a new high-level forum called the “U.S.-China Comprehensive Dialogue.”217
Following the
meeting then-U.S. Secretary of State Rex Tillerson stated that “President Trump noted the
challenges caused by Chinese government intervention in its economy and raised serious
concerns about the impact of China’s industrial, agricultural, technology, and cyber policies on
U.S. jobs and exports. The President underscored the need for China to take concrete steps to
level the playing field for American workers, stressing repeatedly the need for reciprocal market
access.”218
The Trump Administration’s December 2017 National Security Strategy Report took
aim at a number of Chinese economic policies of concern to the United States (see Text Box).
215 The October 2016 is available at https://www.treasury.gov/resource-center/international/exchange-rate-policies/
Documents/2016-10-14%20%28Fall%202016%20FX%20Report%29%20FINAL.PDF. 216 See https://home.treasury.gov/sites/default/files/2018-04/2018-04-13-Spring-2018-FX-Report-FINAL.pdf. 217 The U.S.-China Comprehensive Dialogue has four pillars: the diplomatic and security dialogue; the comprehensive
economic dialogue; the law enforcement and cybersecurity dialogue; and the social and cultures issues dialogue. The
new dialogue is a continuation of high level forums under the previous two Administrations. 218 The White House, Briefing by Secretary Tillerson, Secretary Mnuchin, and Secretary Ross on President Trump’s
(continued...)

China-U.S. Trade Issues
Congressional Research Service 59
Trump’s 2017 National Security Strategy Report in Regard to China’s Economy
The report highlighted a number of Chinese economic policies of concern to the United States. Below are a few
excerpts:
—“Today, the United States must compete for positive relationships around the world. China and Russia target their
investments in the developing world to expand influence and gain competitive advantages against the United States.
China is investing billions of dollars in infrastructure across the globe.”
—“Although the United States seeks to continue to cooperate with China, China is using economic inducements and
penalties, influence operations, and implied military threats to persuade other states to heed its political and security
agenda.”
—“China is gaining a strategic foothold in Europe by expanding its unfair trade practices and investing in key
industries, sensitive technologies, and infrastructure.”
—“China and Russia challenge American power, influence, and interests, attempting to erode American security and
prosperity. They are determined to make economies less free and less fair, to grow their militaries, and to control
information and data to repress their societies and expand their influence.”
—“Every year, competitors such as China steal U.S. intellectual property valued at hundreds of billions of dollars.
Stealing proprietary technology and early-stage ideas allows competitors to unfairly tap into the innovation of free
societies.”
—“China’s infrastructure investments and trade strategies reinforce its geopolitical aspirations. Its efforts to build and
militarize outposts in the South China Sea endanger the free flow of trade, threaten the sovereignty of other nations,
and undermine regional stability.... China presents its ambitions as mutually beneficial, but Chinese dominance risks
diminishing the sovereignty of many states in the Indo-Pacific.”
On May 11, 2017, the two sides announced that China would open its markets to U.S. beef,
biotechnology products, credit rating services, electronic payment services, and bond
underwriting and settlement. The United States agreed to open its markets to Chinese cooked
poultry and welcomed Chinese purchases of U.S. liquefied gas. Chinese officials also indicated
their support for continuing negotiations for continuing the BIT negotiations, although the Trump
Administration did not indicate its position on this proposal. Following the meeting, President
Trump in a series of tweets appeared to indicate that he would link U.S. trade policy toward
China with China’s willingness to pressure North Korea to curb its nuclear and missile programs.
On July 19, 2017, the two sides held the first session of the CED in Washington, DC, which
sought to build on the 100-day action plan through a new one-year action plan on trade and
investment, seeking to achieve “a more balanced economic relationship.” The outcome of the
meeting is unclear as, unlike past high-level meetings, no joint fact sheet was released. The U.S.
side issued a short statement that said that “China acknowledged our shared objective to reduce
the trade deficit which both sides will work cooperatively to achieve.” This led some U.S.
observers to claim that the CED was marred with high tensions and disagreements, and failed to
produce any meaningful results. They noted, for example, that China’s CED representative, Vice
Premier Wang Yang, stated that “[d]ialogue cannot immediately address all differences, but
confrontation will immediately damage the interests of both.” Politico reported that China’s
excess steel capacity was a contentious issue and may have stalemated the talks.219
The United
States and China have not indicated if and when the CED talks will resume.
(...continued)
Meetings with President Xi of China, April 7, 2017, at https://www.whitehouse.gov/the-press-office/2017/04/07/
briefing-secretary-tillerson-secretary-mnuchin-and-secretary-ross. 219 Politico,” Steel topples U.S.-China talks,” July 20, 2017, at http://www.politico.com/tipsheets/morning-trade/2017/
07/20/steel-topples-us-china-talks-221440.

China-U.S. Trade Issues
Congressional Research Service 60
The Trump Administration has taken a number of trade actions that have raised tensions with
China in recent months and could result in a series of tit-for-tat retaliation. These include using
Section 301 trade action against China’s IPR policies and Section 232 tariffs on U.S. steel and
aluminum imports.
The Administration’s Section 301 Case on China’s IPR Policies
On August 14, 2017, President Trump issued a Presidential Memorandum directing the USTR to
determine whether it should launch a Section 301 investigation into China’s protection of U.S.
intellectual property rights (IPR) and forced technology transfer polices to determine their impact
on U.S. economic interests.220
On August 18, 2017, the USTR announced it had launched a
Section 301 case against China, the first use of Section 301 since 2010.221
On March 22, 2018, President Trump signed a Memorandum on Actions by the United States
Related to the Section 301 Investigation.222
Described by the White House as a targeting of
China’s “economic aggression,” the memorandum identified four broad IPR-related policies that
justified U.S. action under Section 301. It said China (1) uses joint venture requirements, foreign
investment restrictions, and administrative review and licensing processes to force or pressure
technology transfers from American companies; (2) uses discriminatory licensing processes to
transfer technologies from U.S. companies to Chinese companies; (3) directs and facilitates
investments and acquisitions which generate large-scale technology transfer; and (4) conducts
and supports cyberintrusions into U.S. computer networks to gain access to valuable business
information. The USTR, which released a 215-page study of China’s IPR policies that negatively
impact U.S. stakeholders, estimated losses to the U.S. economy of at least $50 billion per year.223
Under the Section 301 action, the Administration proposed to (1) implement 25% ad valorem
tariffs on certain Chinese imports (which in sum are comparable to U.S. trade losses), including
color TVs, machinery parts, electrical parts, and motor vehicles, (2) initiate a WTO dispute
settlement case against China’s “discriminatory” technology licensing (which it did on March
23); and (3) propose new investment restrictions on Chinese efforts to acquire sensitive U.S.
technology.
At his March 22 announcement on Section 301 and China, President Trump stated the following:
“We have a tremendous intellectual property theft situation going on, which likewise is hundreds
of billions of dollars. And that’s on a yearly basis. I’ve spoken to the President. I’ve spoken to
representatives of China. We’ve been dealing with it very seriously.” However, he went on to
mention other non-IPR issues. He said that the United States had a trade deficit with China of
either $504 billion or $375 billion, which he called “the largest deficit of any country in the
history of our world.” He also stated that he had spoken to Chinese officials, including President
Xi to “reduce the trade deficit immediately by $100 billion.” He further emphasized that trade
should be “reciprocal,” claiming that the United States assessed a 2% import tariff on Chinese
220 Sections 301 through 310 of the Trade Act of 1974, as amended, are commonly referred to as “Section 301.” It is
one of the principal statutory means by which the United States enforces U.S. rights under trade agreements and
addresses “unfair” foreign barriers to U.S. exports. 221 For additional information, see CRS In Focus IF10708, Enforcing U.S. Trade Laws: Section 301 and China, by
Wayne M. Morrisonn. 222 The document is available at https://www.whitehouse.gov/presidential-actions/presidential-memorandum-actions-
united-states-related-section-301-investigation/. 223 USTR, Press Release, March 22, 2018, available at https://ustr.gov/about-us/policy-offices/press-office/press-
releases/2018/march/president-trump-announces-strong.

China-U.S. Trade Issues
Congressional Research Service 61
cars while China charged a 25% tariff. Finally, Trump noted that the two sides were “in the midst
of a very large negotiation” on trade.224
China has sharply criticized the proposed U.S. Section
301 actions. On March 24, a spokesperson for China’s Ministry of Commerce (MOFCOM) stated
the following:
The U.S acts in disregard of China’s efforts to strengthen the protection of intellectual
property rights and the voices of the broad masses of the industry, ignoring WTO rules. It
is a typical unilateralism and trade protectionism, to which China firmly opposes. This
move by the U.S. is neither conducive to the interests of China, nor those of the United
States. It also goes against the global interests, a very bad precedent. China will not sit
idly in the event of damages to own legitimate rights and interests. We are fully prepared
to defend our legitimate interests. With regard to the 301 investigation, China has clearly
stated its position on many occasions. China does not want to fight a trade war, but it is
absolutely not afraid of that. We are confident and capable of meeting any challenge. It is
hoped that the U.S. will pull back before it is too late and not drag bilateral economic and
trade relations into danger.225
According to a March 26 Reuters article, China’s WTO Ambassador Zhang Xiangchen said that
the U.S. use of Section 301 sanctions violated its WTO commitments, and warned that “the WTO
is under siege and all of us should lock arms to defend it.” He asserted that “WTO members
should jointly ... lock this beast back into the cage of the WTO rules.”226
However, A U.S. representative at the WTO countered China’s contention by stating the
following:
More broadly, the WTO system is not threatened—as China claims—where a Member
takes steps to address harmful, trade distorting policies not directly covered by WTO
rules. To the contrary, what does threaten the WTO is where a Member, such as China,
asserts that the mere existence of the WTO prevents any action by any Member to
address unfair, trade-distorting policies—unless those policies are currently subject to
WTO dispute settlement.... If the WTO is seen instead as protecting those Members that
choose to adopt policies that can be shown to undermine the fairness and balance of the
international trading system, then the WTO and the international trading system will lose
all credibility and support among our citizens.227
On April 3, the USTR released a list of proposed 25% ad valorem tariffs on about $50 billion
worth of Chinese products. The USTR stated that the proposed tariffs targeted Chinese products
in sectors related to China’s high technology industrial policies, such as “Made in China 2025.”228
The USTR identified aerospace, information and communication technology, robotics, and
machinery as sectors targeted by the Section 301 list.
China responded on April 4 with a list targeting various U.S. products, including soybeans,
aircraft, and motor vehicles and parts, that would be subject to 25% ad valorem tariffs if U.S.
224 The White House, Remarks by President Trump at Signing of a Presidential Memorandum Targeting China’s
Economic Aggression, March 22, 2018, available at https://www.whitehouse.gov/briefings-statements/remarks-
president-trump-signing-presidential-memorandum-targeting-chinas-economic-aggression/. 225 MOFCOM, the MOFCOM Spokesman Comments on the U.S. 301 Investigation Decision, March 24, 2018, available
at http://english.mofcom.gov.cn/article/newsrelease/policyreleasing/201803/20180302723374.shtml. 226 Reuters, “China urges WTO members: Put U.S. tariff ‘beast back in the cage’,” March 26, 2018, available at
https://www.reuters.com/article/us-usa-china-trade-wto/china-urges-wto-members-put-u-s-tariff-beast-back-in-the-
cage-idUSKBN1H2151. 227 Inside U.S. Trade, “U.S., China tussle over Section 301’s compatibility with WTO rules at DSB,” March 29, 2018. 228 The Made in China 2025 initiative is discussed in more detail in the Appendix.

China-U.S. Trade Issues
Congressional Research Service 62
Section 301 tariffs went into effect. On the same day, China initiated a WTO dispute settlement
case against the United States over the Section 301 action.229
On April 5, President Trump asked
the USTR to propose additional tariffs on $100 billion worth of Chinese products. On the same
day USTR Robert Lighthizer issued a statement about President Trump’s request, saying the
following:
President Trump is proposing an appropriate response to China’s recent threat of new
tariffs. After a detailed investigation, USTR found overwhelming evidence that China’s
unreasonable actions are harming the U.S. economy. In the light of such evidence, the
appropriate response from China should be to change its behavior, as China’s
government has pledged to do many times. Economies around the world – including
China’s own – would benefit if China would implement policies that truly reward hard
work and innovation, rather than continuing its policies that distort the vital high-tech
sector. Unfortunately, China has chosen to respond thus far with threats to impose
unjustified tariffs on billions of dollars in U.S. exports, including our agricultural
products. Such measures would undoubtedly cause further harm to American workers,
farmers, and businesses. Under these circumstances, the President is right to ask for
additional appropriate action to obtain the elimination of the unfair acts, policies, and
practices identified in USTR’s report.230
On May 3-4, the two sides held high-level talks in Beijing. The U.S. side released a draft
Framework for Discussion. It included calls for China to reduce the bilateral trade imbalance by
$200 billion over two years; address each of the four IPR practices identified in the Section 301
findings; halt subsidies for the Made in China 2025 initiative; remove foreign investment
restrictions, make China’s tariff levels comparable to U.S. tariff rates and remove certain nontariff
barriers; improve market access for U.S. service providers and agricultural products; and agree
not to oppose, challenge, or take any other action against the United States’ action, including in
the WTO, if China failed to live up to a framework agreement.
On May 19, the United States and China released a joint statement outlining progress on a
number of trade issues. China agreed that it would “significantly increase purchases of United
States goods and services,” including U.S. agricultural and energy products. China also said it
would strengthen its IPR laws and regulations, including on patents. On May 21, U.S. Secretary
of the Treasury Steven Mnuchin stated that a framework agreement had been reached with China
and that both sides had suspended threatened trade sanctions. He estimated that U.S. exports of
agricultural products to China could increase by 35-40% in 2018 and that U.S. energy exports to
China could double.
However, on May 29, the White House announced that it planned to move ahead with the
proposed Section 301 sanctions against China by imposing 25% ad valorem tariffs on $50 billion
worth of imports from China, including those related to the Made in China 2025 initiative (final
list of imports to be issued by June 15); (2) implementing new investment restrictions and
enhanced export controls on Chinese entities and persons in regards to the acquisition of
“industrially significant technology” for national security purposes (details to be released by June
30); and (3) continuing to pursue the WTO case against China’s licensing policies (initiated on
March 23). The White House further stated that it would request China to remove “all of its many
trade barriers” and make taxes and tariffs between the two countries “reciprocal in nature and
value.” A May 29 statement from the Chinese government said that the White House actions were
229 See China’s request for WTO consultations at https://www.wto.org/english/tratop_e/dispu_e/cases_e/ds543_e.htm. 230 USTR, Press Release, April 5, 2018, at https://ustr.gov/about-us/policy-offices/press-office/press-releases/2018/
april/ustr-robert-lighthizer-statement.

China-U.S. Trade Issues
Congressional Research Service 63
“clearly contrary to the recent agreement between the two sides.” Following a visit by a U.S.
trade delegation to China on June 3, the Chinese government warned that “all economic and trade
outcomes of the talks will not take effect if the U.S. side imposes any trade sanctions, including
raising tariffs.”
On June 15, the USTR announced a two-stage plan to impose 25% ad valorem tariffs on $50
billion worth of Chinese imports. Under the first stage, U.S. tariffs would be increased on 818
tariff lines on roughly $34 billion worth of Chinese products on July 6. For the second stage, the
USTR proposed increasing tariffs on 228 tariff lines on $16 billion worth of Chinese imports,
mainly targeting China’s industrial policies. When China on June 16 issued its own two-stage
retaliation plan against the United States, President Trump directed the USTR on June 18 to come
up with a new list of that would increase tariffs by 10% tariffs on $200 billion worth of Chinese
products, which would be imposed if China retaliated against U.S. tariffs, and he further warned
that if China raised its tariffs yet again, the United States would pursue tariffs on another $200
billion worth of Chinese products.
On July 6, the Trump Administration implemented the first round of tariff increases on $34 billion
worth of Chinese products.231
China said it had taken measures to increase its import tariffs of
U.S. products.232
On the same day, the USTR announced procedures that it would use to consider
requests for exclusions from the increased tariffs.233
Chinese and U.S. Commodities that could be Subject to Increased Tariffs
A breakdown of some of the commodities that could be the most impacted by U.S. and Chinese
tariff increases related to U.S. action on Section 301 and Chinese reactions based on each
country’s 2017 imports. Table 11 lists the top 15 U.S. imports from China in 2017 that would be
affected by the first round of U.S. 25% ad valorem tariffs that went into effect on July 6. Major
commodities include certain motor vehicles, computer disk drives, pump parts, and printer parts.
U.S. dependency on China as an import supplier for the covered products varies, but range from
1.4% for certain motor vehicles to 44.8% for light-emitting diodes.
Table 12 lists the top 15 commodities imported from China that would be covered by the USTR’s
second proposed list ($16 billion worth of products) that would be subject to additional 25%
tariffs. Major commodities affected include certain electrical machinery; certain electronic
integrated, circuits and micro-assemblies; certain iron and steel structures; and diodes for
semiconductor devices.
Table 13 lists China’s top 15 commodities from the United States that would be impacted by
Chinese retaliation against the United States’ first round of Section 301 25% tariff increases
(covering $34 billion worth of imports). Soybeans are by far the biggest import commodity that
would be impacted, followed by certain motor vehicles, cotton, and sorghum. Table 14 indicates
China’s second stage retaliation list that could go into effect if the U.S. imposed 25% ad valorem
tariffs on an additional $16 billion worth of imported Chinese products. Major U.S. commodities
that could be impacted include petroleum, liquefied propane, chemicals, and coal.
231 See https://www.cbp.gov/trade/programs-administration/entry-summary/section-301-trade-remedies-be-assessed-
certain-products-china-effective-july-6-2018. 232 See http://www.chinadaily.com.cn/a/201807/06/WS5b3eec6ca3103349141e1258.html. 233 See https://ustr.gov/sites/default/files/enforcement/301Investigations/FRN%20exclusion%20process.pdf.

China-U.S. Trade Issues
Congressional Research Service 64
Table 11. U.S. Section 301 First Round 25% Tariffs Against China
(top 15 U.S. imports from China affected by increased 25% tariffs)
HTS Number HTS Description
2017
imports
($Millions)
Percentage
of Total U.S.
Imports (%)
87032301 Motor vehicles to transport persons, w/spark-ign. IC recip. piston
engine, w/cyl capacity >1, 500cc but <=3, 000cc
1,420 1.4
84717040 ADP magnetic disk drive storage units, disk dia. n/ov 21 cm, not in
cabinet, w/o attached external power supply, n/entered w/rest of a
system
882 16.9
84139190 Parts of pumps, nesoi 814 30.2
84439920 Parts of printer units of subheading 8443.32.10 specified in additional
U.S. note 2 to this chapter
691 29.4
84819090 Parts of taps, cocks, valves and similar appliances for pipes, boiler
shells, tanks, vats or the like, nesoi
672 27.6
85269100 Radio navigational aid apparatus, other than radar 671 23.9
84314990 Parts suitable for use solely or principally with the machinery of
heading 8429 or 8430, nesoi
670 22.9
85414020 Light-emitting diodes (LED's) 638 44.8
85256020 Transmission apparatus incorporating reception apparatus, other than
transceivers
619 42.8
85366940 Connectors: coaxial, cylindrical multi-contact, rack and panel, printed
circuit, ribbon or flat cable, for a voltage not exceeding 1,000 V
533 26.3
85443000 Insulated ignition wiring sets and other wiring sets of a kind used in
vehicles, aircraft or ships
498 4.8
85365090 Switches nesoi, for switching or making connections to or in electrical
circuits, for a voltage not exceeding 1,000 V
483 20.3
88033000 Parts of airplanes and helicopters, nesoi 460 3.2
84186901 Refrigerating or freezing equipment nesoi 456 30.0
84807180 Molds for rubber or plastics, injection or compression types, other
than for shoe machinery or for manufacture of semiconductor devices
426 22.1
Total Top 15 9,933 —
Source: USTR and Global Trade Atlas.
Notes: Nesoi stands for not elsewhere specified or included.

China-U.S. Trade Issues
Congressional Research Service 65
Table 12. U.S. Section 301 Second (Proposed) List of 25% Tariffs Against China
(top 15 U.S imports in 2017 that could be covered by increased 25% tariffs)
HTS number HTS Description
U.S. 2017
Imports($)
85437099 Other machinery in this subheading (Electrical machinery and apparatus, having
individual functions)
1,471
85423100 Processors and controllers, whether or not combined with memories, converters,
logic circuits, amplifiers, clock and timing circuits, or other
1,116
85423200 Memories 754
73089095 Iron or steel, structures (excluding prefab structures of 9406) and parts of
structures, nesoi
711
85423900 Electronic integrated circuits, nesoi 705
85414060 Diodes for semiconductor devices, other than light-emitting diodes, nesoi 562
85030095 Other parts, nesoi, suitable for use solely or principally with the machines in heading
8501 or 8502 (Electric motors and generators, and Electric generating sets and
rotary converters)
485
84869000 Parts and accessories of the machines and apparatus for the manufacture of
semiconductor devices, electronic integrated circuits and flat panels
480
85363080 Electrical apparatus for protecting electrical circuits, for a voltage not exceeding
1,000 V, nesoi
347
86090000 Containers (including containers for transport of fluids) specially designed and
equipped for carriage by one or more modes of transport
335
84079090 Spark-ignition rotary or reciprocating internal-combustion piston engines, for
machinery or equipment nesoi
310
84862000 Machines and apparatus for the manufacture of semiconductor devices or electronic
integrated circuits
288
85411000 Diodes, other than photosensitive or light-emitting diodes 280
85013140 DC motors, nesoi, of an output exceeding 74.6 W but not exceeding 735 W 271
90251980 Thermometers, for direct reading, not combined with other instruments, other
than liquid-filled thermometers
253
Total Top 15 8,621
Source: USTR and Global Trade Atlas
Note: Nesoi stands for not elsewhere specified or included.

China-U.S. Trade Issues
Congressional Research Service 66
Table 13. China’s First Round of Retaliatory 25% Tariffs Against the United States:
(top 15 Chinese imports from the United States impacted by increased tariffs)
HTS number HTS Description
2017 Chinese
imports
($millions)
Percent of
total
Chinese
imports (%)
12019010 Yellow Soya Beans, Not For Cultivation 13,959 35.1
87032362 Cross-Country Cars (4Wd) With Only Spark-Ignition Internal
Combustion Reciprocating Piston Engine, 2500Cc<Cylinder
Capacity≤3000Cc
5,428 36.6
87032342 Cross-Country Cars (4Wd) With Only Spark-Ignition Internal
Combustion Reciprocating Piston Engine, 1500Cc<Cylinder Capacity≤2000Cc
2,363 50.3
87038000 Motor Vehicles Designed Mainly For Transport Of Persons, With
Only Electric Motors For Propulsion
1,403 96.5
52010000 Cotton, Not Carded Or Combed 980 44.9
10079000 Grain Sorghum (Excl. For Sowing) 956 93.3
02064900 Edible Offal Of Swine, Frozen (Excl. Livers) 874 41.4
87032343 Station Wagons, Seats≤9, With Only Spark-Ignition Internal
Combustion Reciprocating Piston Engine, 1500Cc<Cylinder Capacity≤2000Cc
861 18.7
87084099 Parts For Gear Boxes For Tractors, Motor Vehicles 660 12.7
87032363 Station Wagons, Seats≤9, With Only Spark-Ignition Internal
Combustion Reciprocating Piston Engine, 2500Cc<Cylinder Capacity≤3000Cc
609 80.4
12149000 Other Forage Products, not elsewhere specified 399 77.5
87032413 Hearses 367 28.4
87032353 Station Wagons, Seats≤9, With Only Spark-Ignition Internal
Combustion Reciprocating Piston Engine, 2000Cc<Cylinder Capacity≤2500Cc
366 85.5
03031200 Other Frozen Pacific Salmon 295 67.0
10011900 Durum Wheat (Excl. Seed For Sowing) 289 57.1
Total Top 15 29,809
Source: Global Trade Atlas and USTR
Note: Calculations made by CRS.

China-U.S. Trade Issues
Congressional Research Service 67
Table 14. China’s Second Proposed Retaliatory Tariffs on Section 301 Action:
(top 15 Chinese imports from the United States that could be impacted by increased tariffs)
HTS Number HTS Description 2017 Imports
($millions)
27090000 Petroleum Oils & Oils Obtained From Bituminous Minerals, Crude 3,149
27111200 Propane, Liquefied 1,761
38249999 Chemical Products and Preparations Of The Chemical Or Allied Industries,
N.E.S.O.I.; Residual Products Of The Chemical Or Allied Industries
775
38220090 Prepared Diagnostic Or Laboratory Reagents, not elsewhere specified 557
27011210 Coking Coal, Whether Or Not Pulverized, Non-Agglomerated 427
39269090 Articles of plastics, not elsewhere specified 368
38151200 Supported Catalysts With Precious Metal Or Its Compounds 360
39074000 Polycarbonates, In Primary Forms 331
39199090 Plates, Sheets, Film, Foil, Tape And Other Flat Shapes Of Plastics, Self-Adhesive,
not elsewhere specified
326
39209990 Plates, Sheets, Film, Foil And Strip Of Plastics, Not Self-Adhesive, Non-Cellular,
Not Reinforced Or Laminated Etc., not elsewhere specified or included
304
39041090 Other Poly, Not Mixed With Any Other Substances 270
39079999 Polyesters, In Primary Forms, not elsewhere specified 241
90221400 Apparatus Based On The Use Of X-Rays, For Medical, 237
27131190 Other petroleum coke, not calcined 236
39072090 Other Polyethers In Primary Forms 230
Total Top 15 9,572
Source: Global Trade Atlas and Chinese Ministry of Finance.
Economic Effects of Section 301 Tariff Increases
It is difficult to measure the possible economic impact that increased tariffs could have on the
U.S., Chinese, and global economy, in part because it is unclear how extensive such tariffs will be
employed by both sides and whether other commercial restrictions will be used as well. For
example, in addition to raising tariffs on imported U.S. products, China could
encourage its citizens to boycott American products and services;234
impose new restrictions and regulations on the commercial activities of U.S.
firms in China (such as limiting U.S. FDI in China);
selectively increase “enforcement” of its laws and regulations against U.S.
entities (e.g., boosting health and safety inspections of imported U.S.
commodities or delaying customs clearance);
reduce its holdings of U.S. Treasury securities; and
234 According to the U.S. Bureau of Economic Analysis, sales by foreign affiliates of U.S. firms in 2015 totaled $481
billion in 2015.

China-U.S. Trade Issues
Congressional Research Service 68
urge Chinese firms to seek non-U.S. suppliers of goods as services, such as
buying more planes from Airbus and fewer from Boeing.
Various studies have been released that attempt to quantify the impact that a set amount of
increased tariffs would have on the U.S. economy. For example, an April 2018 report prepared by
Trade Partnership Worldwide for the Consumer Technology Association and National Retail
Federation estimated the economic and unemployment effects tariff increases (stemming from
U.S. Section 301 action) could have based on three scenarios: (1) the United States increases
tariffs on $50 billion worth of Chinese imports and China does not respond; (2) the United States
increases tariffs on $50 worth of Chinese imports and China retaliates in kind; and (3): both the
United States and China impose tariffs on $150 billion worth of imports from each other.235
The
report estimated that under the third scenario, the U.S. economy could be impacted as follows:
U.S. GDP could fall by 0.26% or $49.2 billion (2016 dollars);
farm property income could fall by 15.01%;
U.S. exports and imports could drop by $105.5 billion and $341.2 billion,
respectively (2016 dollars);
U.S. net employment could fall by 457,796 jobs (including 123,362 higher
skilled workers and 331,434 lower skilled workers); and
in terms of the distribution of job gains and losses, the manufacturing sector
would gain 132,475 jobs, but net losses would occur in other sectors, including
energy (at -13,305 jobs), agriculture (-180,904 jobs), and services (-393,063 jobs)
(see Figure 18).236
235 The third scenario reflects the original U.S. threat to increase tariffs on $50 billion worth of Chinese products and
President Trump’s threat on April 5 to impose additional tariffs against China on $100 billion worth of imports if China
retaliated against the United States. 236 Trade Partnership Worldwide, LLC, Tariffs on Imports from China: The Estimated Impacts on the U.S. Economy,
April 30, 2018, available at http://tradepartnership.com/wp-content/uploads/2018/04/China-301-Tariffs-FINAL.pdf.
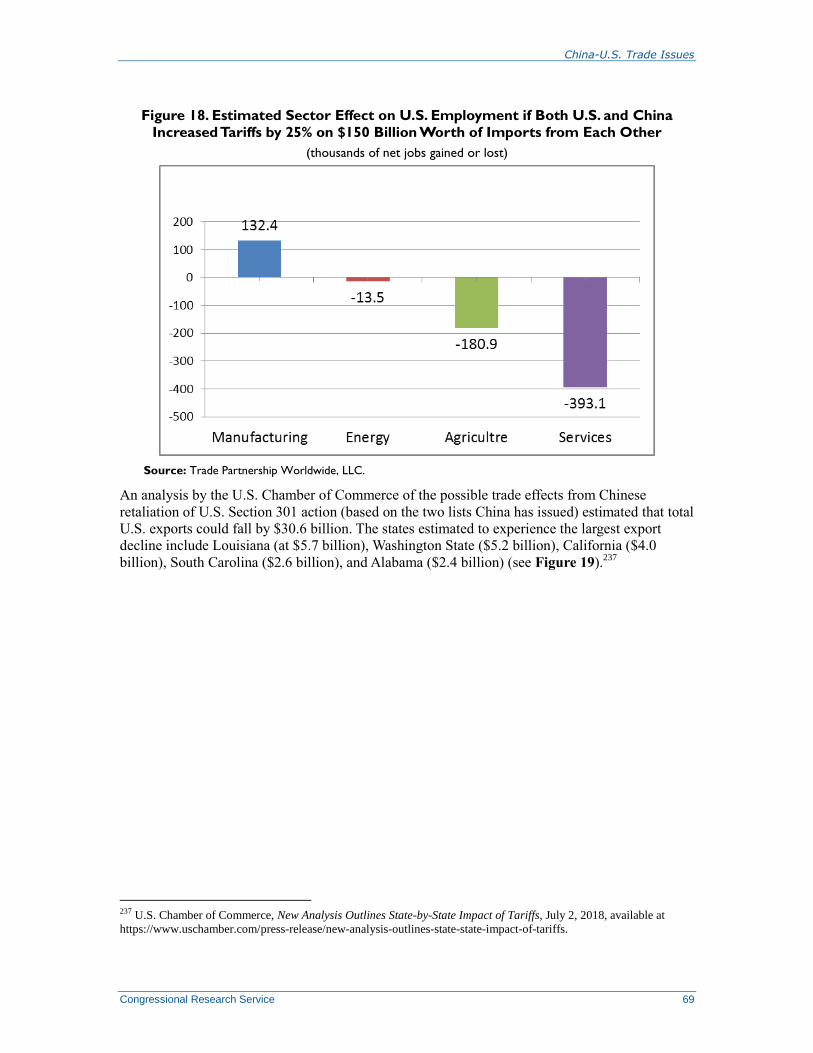
China-U.S. Trade Issues
Congressional Research Service 69
Figure 18. Estimated Sector Effect on U.S. Employment if Both U.S. and China
Increased Tariffs by 25% on $150 Billion Worth of Imports from Each Other
(thousands of net jobs gained or lost)
Source: Trade Partnership Worldwide, LLC.
An analysis by the U.S. Chamber of Commerce of the possible trade effects from Chinese
retaliation of U.S. Section 301 action (based on the two lists China has issued) estimated that total
U.S. exports could fall by $30.6 billion. The states estimated to experience the largest export
decline include Louisiana (at $5.7 billion), Washington State ($5.2 billion), California ($4.0
billion), South Carolina ($2.6 billion), and Alabama ($2.4 billion) (see Figure 19).237
237 U.S. Chamber of Commerce, New Analysis Outlines State-by-State Impact of Tariffs, July 2, 2018, available at
https://www.uschamber.com/press-release/new-analysis-outlines-state-state-impact-of-tariffs.

China-U.S. Trade Issues
Congressional Research Service 70
Figure 19. Estimate of the Top 10 States that Could be Impact by Lost Exports if
China Retaliated Against U.S. Section 301-Related Tariffs
($ in millions)
Source: U.S. Chamber of Commerce.
Notes: Total state export losses were estimated at $30.6 billion.
Section 232 Tariffs on Steel and Aluminum
On March 8, 2018, the Trump Administration announced that it would impose additional imports
tariffs on steel (by 25%) and aluminum (10%), based on national security justifications under the
1962 Trade Act, as amended. China appears to have been a major target of the action since it
accounts for half of global production of both commodities. Yet, in terms of import quantity,
China was the 10th-largest supplier of steel and 4
th-largest for aluminum. On March 26, China
requested consultations with the United States over the Section 232 action on steel and aluminum,
arguing that they were safeguard measures and not justifiable on national security grounds. On
April 1, 2018, China announced that it had raised duties (by 15% to 25%) on 128 tariff lines
covering imports from the United States, including pork products, aluminum waste and scrap, and
fruits and nuts, which together totaled about $3 billion in 2017. On April 9, China initiated a
WTO dispute settlement case against the U.S. use of Section 232 tariffs, arguing that the measure
were in fact safeguards measures. Table 15 lists the top 10 U.S. commodities impacted by the
increased tariffs. These include pork, aluminum waste and scrap, and various fruits and nuts.
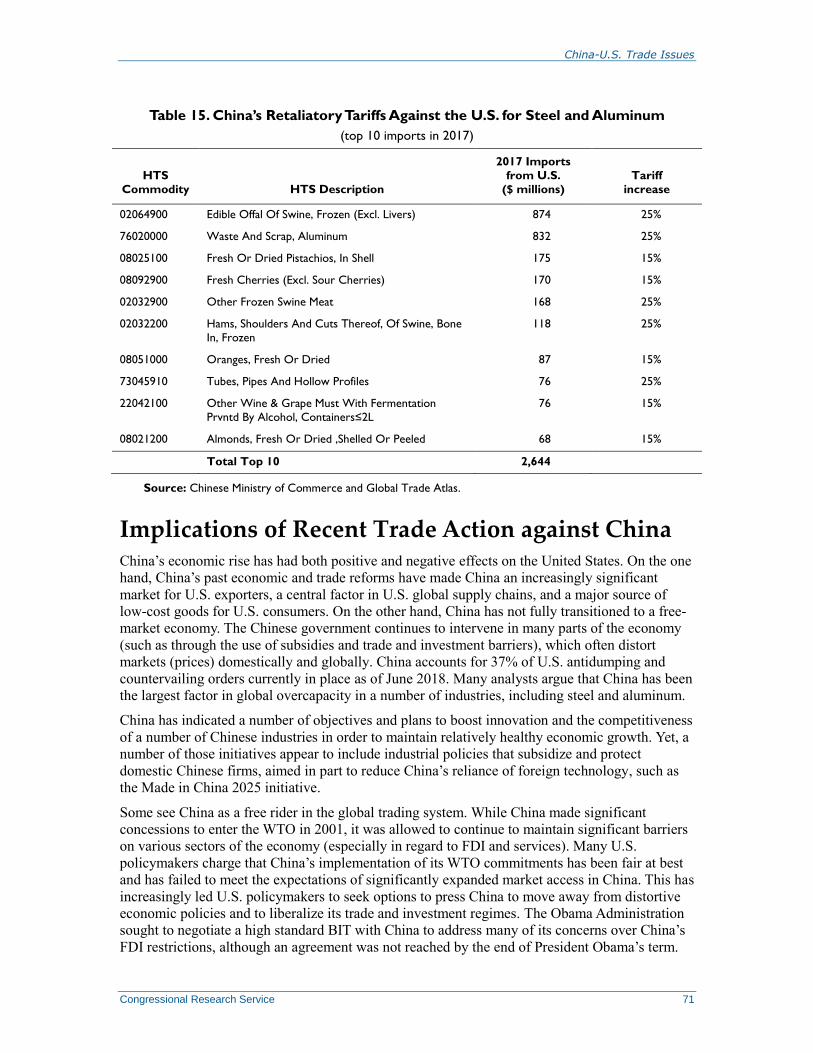
China-U.S. Trade Issues
Congressional Research Service 71
Table 15. China’s Retaliatory Tariffs Against the U.S. for Steel and Aluminum
(top 10 imports in 2017)
HTS
Commodity HTS Description
2017 Imports
from U.S.
($ millions)
Tariff
increase
02064900 Edible Offal Of Swine, Frozen (Excl. Livers) 874 25%
76020000 Waste And Scrap, Aluminum 832 25%
08025100 Fresh Or Dried Pistachios, In Shell 175 15%
08092900 Fresh Cherries (Excl. Sour Cherries) 170 15%
02032900 Other Frozen Swine Meat 168 25%
02032200 Hams, Shoulders And Cuts Thereof, Of Swine, Bone
In, Frozen
118 25%
08051000 Oranges, Fresh Or Dried 87 15%
73045910 Tubes, Pipes And Hollow Profiles 76 25%
22042100 Other Wine & Grape Must With Fermentation
Prvntd By Alcohol, Containers≤2L
76 15%
08021200 Almonds, Fresh Or Dried ,Shelled Or Peeled 68 15%
Total Top 10 2,644
Source: Chinese Ministry of Commerce and Global Trade Atlas.
Implications of Recent Trade Action against China China’s economic rise has had both positive and negative effects on the United States. On the one
hand, China’s past economic and trade reforms have made China an increasingly significant
market for U.S. exporters, a central factor in U.S. global supply chains, and a major source of
low-cost goods for U.S. consumers. On the other hand, China has not fully transitioned to a free-
market economy. The Chinese government continues to intervene in many parts of the economy
(such as through the use of subsidies and trade and investment barriers), which often distort
markets (prices) domestically and globally. China accounts for 37% of U.S. antidumping and
countervailing orders currently in place as of June 2018. Many analysts argue that China has been
the largest factor in global overcapacity in a number of industries, including steel and aluminum.
China has indicated a number of objectives and plans to boost innovation and the competitiveness
of a number of Chinese industries in order to maintain relatively healthy economic growth. Yet, a
number of those initiatives appear to include industrial policies that subsidize and protect
domestic Chinese firms, aimed in part to reduce China’s reliance of foreign technology, such as
the Made in China 2025 initiative.
Some see China as a free rider in the global trading system. While China made significant
concessions to enter the WTO in 2001, it was allowed to continue to maintain significant barriers
on various sectors of the economy (especially in regard to FDI and services). Many U.S.
policymakers charge that China’s implementation of its WTO commitments has been fair at best
and has failed to meet the expectations of significantly expanded market access in China. This has
increasingly led U.S. policymakers to seek options to press China to move away from distortive
economic policies and to liberalize its trade and investment regimes. The Obama Administration
sought to negotiate a high standard BIT with China to address many of its concerns over China’s
FDI restrictions, although an agreement was not reached by the end of President Obama’s term.

China-U.S. Trade Issues
Congressional Research Service 72
The Trump Administration has not expressed interest in resuming the BIT talks even though
China has.
President Trump’s January 2017 decision to withdraw the United States from the Trans-Pacific
Partnership (TPP) free trade agreement (FTA) has been viewed by many analysts as a blow to
U.S. efforts to induce economic and trade liberalization in China.238
Prior to the U.S. pull-out of
TPP, Chinese officials had expressed interest in eventually joining the agreement, in part to avoid
being economically marginalized by an FTA of countries constituting 40% global GDP. The TPP
agreement signed by the United States was described as a “high standard agreement.” It included
enhanced IPR protection, liberalized provisions on digital trade, and new rules governing SOEs.
The remaining 11 TPP members on March 8, 2018, concluded the Comprehensive and
Progressive Agreement for Trans-Pacific Partnership (CPTPP).239
Many analysts contend that the
U.S. withdrawal from TPP weakened U.S. economic leverage with China and damaged U.S.
credibility in Asia.
The Trump Administration and some Members of Congress have advocated taking a harder line
against China in regard to its economic and trade policies. A number of goals and justifications
have been offered. Some argue that greater efforts should be made to require China to afford U.S.
firms the same market access Chinese companies enjoy in the United States. Others contend that
WTO agreements do not cover (or adequately cover) many of the policies and practices that
China employs to protect and support its industries and therefore argue that the United States
should act unilaterally (including the threat of sanctions) when U.S. economic interests are at
stake. Others argue that U.S. trade remedy laws should be more aggressively used to stop imports
of Chinese products that have been dumped in the United States or subsidized by the Chinese
government, in order to afford greater protection to U.S. firms and workers from China’s unfair
trade practices. Finally, some policymakers have advocated for a more forceful response to
Chinese industrial policies that seek to force foreign firms to transfer technology or lock U.S.
technology firms out of China’s markets through domestic content requirements. A number of
congressional Members have expressed concerns over the efforts of Chinese to acquire U.S. high
technology firms or assets, and many have called for reforms to the CFIUS review process to flag
Chinese mergers that may impact the global competitiveness of U.S. economic sectors.
Others support a more balanced approach to dealing with China that seeks to use the multilateral
process in the WTO to resolve major trade disputes, high-level forums to address complex and
long-term economic and trade issues, and negotiated trade agreements to boost market access in
China. Supporters of this view contend that the imposition of unilateral trade sanctions by the
United States (outside the WTO process) against China could result in rounds of economically
damaging retaliation and counter-retaliation. Some critics of the Trump Administration’s
approach to trade policy contend that focusing too much on bilateral trade imbalances to judge
the benefits or fairness of U.S. trade relations with various countries contradicts basic economic
theory that only the overall trade balance matters and is the result of macroeconomic forces, not
unfair trade policies. In addition, U.S. trade data is a poor measurement of who benefits from
trade because it fails to reflect the value that was added in each country before it was shipped to
its final destination. Many U.S. products imported from China (such as iPhones) contain inputs
238 Others saw the TPP as a “high standard” agreement that would be used as the framework for more comprehensive
FTA’s, such as the proposed Free Trade Area of the Asia-Pacific (FTAAP). Some analysts view the U.S. withdrawal
from TPP as a blow to U.S. credibility in Asia-Pacific and an opportunity for China to advance its economic goals in
the region, including the negotiation of regional FTAs where China is the chief architect. 239 For additional information on the CPTPP, see CRS Insight IN10822, TPP Countries Sign New CPTPP Agreement
without U.S. Participation, by Ian F. Fergusson and Brock R. Williams.
China-U.S. Trade Issues
Congressional Research Service 73
from numerous countries, which are not reflected in U.S. trade data. Therefore, some contend, it
makes little sense to make reducing trade imbalances the top priority in trade negotiations with
China (and other countries). Rather, the central focus of trade negotiations, they argue, should be
the reduction of trade and investment barriers that are deemed by the United States as having the
most significant impact in limiting U.S. trade flows, measuring the impact from a reduction of
those barriers, but refraining from using trade balance data to measure the success or failure of
such actions. President Trump’s comments about his request to President Xi to reduce the U.S.
trade deficit with China, while announcing Section 301 action against China’s IPR policies, made
it appear to some observers that deficit reduction, not improvements to China’s IPR regime, was
the Administration’s real motive for using Section 301.The Trump Administration’s focus on
China’s tariff levels and its demand that all tariff be reciprocal is also puzzling to some observers.
While China’s average tariff levels are higher than U.S. tariffs, they are largely what China agreed
to when it joined the WTO in 2001 tariff levels.240
Observers contend that China implemented
most of its scheduled WTO tariff reductions one time. China’s tariff levels are rarely cited as a
major trade barrier by U.S. firms doing business in China, especially compared to the numerous
non-tariff barriers and FDI restrictions they face there.
Many analysts have raised concern that unilateral trade action by the United States against China
(and other countries under Section 232) could undermine the multilateral trading system and
negatively impact global economic growth. For example, on March 23, 2018, WTO Director-
General Roberto Azevêdo stated the following:
I encourage members to continue working through the WTO’s many forums and
mechanisms to deal with their concerns and explore potential solutions. Actions taken
outside these collective processes greatly increase the risk of escalation in a confrontation
that will have no winners, and which could quickly lead to a less stable trading system.
Disrupting trade flows will jeopardize the global economy at a time when economic
recovery, though fragile, has been increasingly evident around the world. I again call for
restraint and urgent dialogue as the best path forward to resolve these problems.241
240 China has reduced or eliminated tariffs on various products under agreements with its FTA partners or through
plurilateral agreements in the WTO, such as the Informational Technology Agreement. 241 World Trade Organization, Statement by Director-General Azevêdo in relation to the Council on Trade in Goods,
March 23, 2018, available at https://www.wto.org/english/news_e/news18_e/dgra_23mar18_e.htm.

China-U.S. Trade Issues
Congressional Research Service 74
Appendix. Chinese Policies to Boost Innovation242
Made in China 2025
On May 19, 2015, the Leading Group for Creating a Strong Manufacturing Country, a task force
created by China’s State Council, released the Made in China 2025 initiative. Made in China
2025 is a comprehensive plan to upgrade the Chinese manufacturing sector, focused largely on
making intelligent information and communications technology (ICT)-based machines, systems,
and networks manage the industrial process, otherwise known as “smart production.”243
China’s
slowing economy and the unsustainability of its “growth at any costs” model have led the
government to focus on new sources of growth, such as promoting innovation.
Although it is the largest manufacturing sector in the world, China is still a relatively weak
manufacturer when it comes to core technology and innovation.244
The innovation gap, desire to
avoid the middle-income trap,245
and the slowing economy have all reportedly pushed the
Chinese government to pursue the Made in China 2025 plan to move the manufacturing sector up
the value chain, shifting from “Made in China” to “Made by China.”246
Priorities
The Made in China 2025 plan was the first of a “three step” strategy involving 10-year national
plans to transform China into a leading high-value manufacturing economy by 2049, which will
mark the 100th anniversary of the founding of the People’s Republic of China (PRC). According
to the Minister of Industry and Information Technology, Miao Wei, “By 2025, China will
basically realize industrialization nearly equal to the manufacturing abilities of Germany and
Japan at their early stages of industrialization.”247
The goals of Made in China 2025 are split into four key categories: innovation, quality efficiency,
smart manufacturing, and green development. There are 9 priority tasks, 10 sectors, and 5
definitive projects with timelines that can be sorted into those four categories. The nine priority
tasks laid out in Made in China 2025 include improving manufacturing innovation, integrating
technology and industry, strengthening green manufacturing, promoting breakthroughs in 10 key
sectors, advancing restructuring of the manufacturing sector, promoting manufacturing-related
service industries, and internationalizing manufacturing. The 10 key sectors identified include
new information technology, numerical control tools and robotics, aerospace equipment, ocean
engineering equipment and high-end vessels, high-end rail transportation equipment, energy
242 Written by Ashley Feng, Research Associate, Foreign Affairs, Defense, and Trade Division. 243 Germany Trade & Invest, Industrie 4.0: Smart Manufacturing for the Future, Berlin, Germany, July 2014,
http://www.gtai.de/GTAI/Content/EN/Invest/_SharedDocs/Downloads/GTAI/Brochures/Industries/industrie4.0-smart-
manufacturing-for-the-future-en.pdf. 244 Li Hui, “Made in China 2025: How Beijing is revamping its manufacturing sector,” South China Morning Post,
June 9, 2015. 245 The middle-income trap is a theoretical “trap” in which a country has attained a certain level of per capita income,
but is unable to keep up with fully developed countries. 246 “Still made in China,” The Economist, September 12, 2015, print edition. 247 Yamei Wang, “Made in China 2025” plan unveiled to boost manufacturing,” Xinhua, May 19, 2015.
China-U.S. Trade Issues
Congressional Research Service 75
saving and new energy vehicles, electrical equipment, and agricultural machinery.248
Within Made
in China 2025, there are also five projects with definitive goals and timelines:249
Construction of 15 manufacturing innovation centers by 2020, with 40 by 2025.
Creation of 1,000 green demonstration factories and 100 green demonstration
zones by 2020 and reduced primary pollution emissions by 20%.
Decreased operating costs for smart manufacturing pilot projects by 30%,
shortened production timelines by 30%, and lower rates of defective products by
30%, with decreased costs, timelines, and defects by another 20% by 2025.
Increased self-sufficiency in development infrastructure by 40% of infrastructure
components and key infrastructure materials by Chinese sources by 2020, with an
increase to 80% by 2025.
New indigenous research and development (R&D) in key sectors by 2020 with
the goal of achieving significant market share growth in indigenous IP for high-
value equipment by 2025.
Made in China 2025 also references strengthened security reviews for investment, mergers and
acquisitions, and procurement in manufacturing sectors that are related to national economy and
national security; promoting indigenous or domestic innovation; enlarging tax policies for smart
manufacturing, and enhancing cooperation with foreign companies in areas such as health care,
aviation, and basic manufacturing.
The plan calls for Chinese firms to invest abroad, become familiar with overseas cultures and
markets, and strengthen investment and operation risk management before investing. According
to a report by CSIS, if China genuinely decides to embrace intelligent manufacturing, it could
become easier for Chinese companies and multinational corporations (MNCs) to collaborate both
in China and abroad and possibly “reduce the zero-sum elements of the business relationship.”250
In addition, if China successfully upgrades its manufacturing capacities, there is also a likely
chance of improved overall economic governance, including financial and fiscal systems, a
strengthened educational system, and increased access to varied sources of information.
The Made in China 2025 is one component of China’s plan to become a center and leader of
innovation. Deputy Head of the Ministry of Industry and Information Technology Li Beiguang
said that the key to a country becoming a manufacturing power is innovation, and “to promote
manufacturing and national competitiveness, it is important to mobilize every conceivable
element to stimulate innovation rather than simply support a single industry.”251
Issues
Made in China 2025 has faced criticisms on its viability. Some analysts say that China will
succeed with its more modest goals, such as the immediate aims to improve the quality,
productivity, digitization, and expansion of numerically controlled machines, which are all
248 State Council of the People’s Republic of China, “ ‘Made in China 2025’ plan issued,” press release, May 19, 2015,
http://english.gov.cn/policies/latest_releases/2015/05/19/content_281475110703534.htm. 249 Dan Markus and Nick Marro, “‘Made in China’ Now ‘Made by China’: Update,” The U.S.-China Business Council,
May 27, 2015. 250 Scott Kennedy, Made in China 2025, Center for Strategic and International Studies, June 1, 2015,
https://www.csis.org/analysis/made-china-2025. 251 Yamei Wang, “‘Made in China 2025’ plan unveiled to boost manufacturing,” Xinhua, May 19, 2015.
China-U.S. Trade Issues
Congressional Research Service 76
already used by manufacturers in developed countries. However, they contend that other goals,
such as encouraging companies to use 3D printing and adopting robotics are or may be
unrealistic.
Trade Implications
The ambiguity surrounding the language of Made in China 2025 objectives may impact foreign
MNCs that operate within China and interact with Chinese companies globally. Made in China
2025 mentions “strengthened security reviews” for investments, mergers and acquisitions, and
procurement in manufacturing areas related to the national economy and national security, which
are not clearly defined. Language in the Made in China 2025 plan also seeks to boost indigenous
innovation. For example, it lists the goal of ensuring that domestic Chinese firms will handle the
majority of local infrastructure development with specific timetables. For example, the plan states
that 40% of core infrastructure components and key infrastructure materials should come from
Chinese sources by 2020 and to increase further to 80% by 2025.252
This has led to concerns that
such goals will discriminate against foreign firms.
Internet Plus
The Internet Plus plan was announced to the National People’s Congress on March 5, 2015 by
Premier Li Keqiang, as part of the Report on the Work of the Government (2015), with a follow-
up implementation plan issued by the State Council on July 4, 2015.253
With 721 million users as
of 2016, China has the largest absolute number of people in the world using the internet.254
The
plan reportedly came out of an effort to push for more innovation, as many Chinese leaders view
innovation as the key to avoiding the middle-income trap. Additionally, there is still the
prevailing idea in China, especially in the rural regions, that enterprises in the traditional sectors
do not know how to link their businesses to the internet.255
According to the United States
Information Technology Office, launched in cooperation with the Department of Commerce’s
International Trade Administration, China’s Internet Plus seeks to “drive economic growth by
integration of internet technologies with manufacturing and business.”256
Goals
In his speech on the Internet Plus plan during the 2015 Report on the Work of the Government,
Premier Li Keqiang described the plan as such: “We will develop the ‘Internet Plus’ action plan to
integrate the mobile internet, cloud computing, big data, and the Internet of Things with modern
manufacturing to encourage the healthy development of e-commerce, industrial networks, and
internet banking, as well as guide internet-based companies to increase their presence in the
international market. In addition to the 40 billion yuan government fund already in place for
investment in China’s emerging industries, more funds need to be raised for promoting business
252 Dan Markus and Nick Marro, “‘Made in China’ Now ‘Made by China’: Update,” The U.S.-China Business Council,
May 27, 2015.
253 “国务院关于积极推进“互联网+”行动的指导意见” (“Guiding Opinions on Actively Promoting the “Internet Plus
Action Plan”) (in Chinese), July 4, 2015, http://www.gov.cn/zhengce/content/2015-07/04/content_10002.htm. 254 “Internet Users by Country (2016),” Internet Live Stats, (2016). 255 Gao Yuan, “Internet Plus plan a real wake-up call for Chinese companies,” China Daily, March 10, 2016. 256 United States Information Technology Office, “China Pursues “Internet Plus” Strategy,” press release, 2015,
http://www.usito.org/news/china-pursues-internet-plus-strategy.
China-U.S. Trade Issues
Congressional Research Service 77
development and innovation.”257
Premier Li reiterated these points in the 2016 Report on the
Work of the Government, but also highlighted the need to improve the efficiency of
communication between governmental departments to cut down on “red tape.”258
Internet Plus has four primary goals: (1) upgrade and strengthen the security of the internet
infrastructure, (2) expand access to the internet and related technologies, (3) make social services
more convenient and effective, and (4) increase both the quality and effectiveness of economic
development.259
The plan also maps development targets and supportive measures for key sectors,
such as mass entrepreneurship and innovation, manufacturing, agriculture, energy, finance, public
services, logistics, e-commerce, traffic, biology, and artificial intelligence.260
In order to achieve
these goals, the Chinese government will reportedly clear barriers and lower limits for the market
entry of Internet Plus-related products, optimize the credit system, and draft a big data strategy
and promote legal services for companies that pursue the Internet Plus system. The government
has also expressed interest in training and making better use of local and foreign talent, providing
financial support and tax preferences to key projects, launching more pilot zones as well as
encouraging innovation demonstration zones and local governments to come up with their own
plans aligned to Internet Plus. Chinese authorities have also promised that families in large cities
will have access to 100 megabyte-per-second internet, and that broadband services will reach
98% of the population living in incorporated villages. According to the Seconded European
Standardization Expert in China (SESEC), a project co-financed by the European Union, the
Chinese government has created a new investment fund worth 40 billion RMB, or approximately
$6 billion, to further promote new industry innovation and entrepreneurship under Internet
Plus.261
Internet Plus is intertwined with other economic plans outlined by the Chinese government. For
example, a goal of Internet Plus, which is restated in the 13th Five-Year Plan, is to increase the
percentage of research and development spending as part of GDP from 2.1 to 2.5.262
The Chinese
government has also tied Internet Plus to the “One Belt One Road” Initiative, an effort to boost
development and economic connectivity across three continents, encouraging Chinese internet
companies to increase their efforts in the global market.
Issues
The release of Internet Plus and Made in China 2025, and the notable mention of both plans in the
13th
Five-Year Plan, are all efforts by the Chinese government to increase the growth rate of the
economy. Within Internet Plus, there is an emphasis on innovation that the government believes
will result from the integration of the internet with economic and social sectors and that an
257 State Council of the People’s Republic of China, “Full Text: Report on the Work of the Government (2015),” press
release, March 16, 2015, http://english.gov.cn/archive/publications/2015/03/05/content_281475066179954.htm. 258 State Council of the People’s Republic of China, “Full Text: Report on the Work of the Government (2016),” press
release, March 17, 2016, http://english.gov.cn/premier/news/2016/03/17/content_281475309417987.htm. 259 Lincoln E. Davidson, “'Internet Plus and the Salvation of China’s Rural Economy,” July 17, 2015. 260 State Council of the People’s Republic of China, “China unveils Internet Plus action plan to fuel growth,” press
release, July 4, 2015, http://english.gov.cn/policies/latest_releases/2015/07/04/content_281475140165588.htm. 261 Betty Xu, China Internet Plus Strategy, Seconded European Standardization Expert in China, February 5, 2015,
http://sesec.eu/app/uploads/2015/06/
2015_05_SESECIII_Newsletter_April_2015_Annex02_China_Internet_Plus_Strat.... pdf.
262 “中华人民共和国国民经济和社会发展第十三个五年规划网要,第三章: 主要目标” (“People’s Republic of China
13th Five-Year Plan for National Economic and Social Development, Chapter 3: Main Targets”) (in Chinese), March
17, 2016, http://www.sdpc.gov.cn/fzgggz/fzgh/ghwb/gjjh/201603/P020160318564052484043.pdf.

China-U.S. Trade Issues
Congressional Research Service 78
increasing trend of innovation will benefit from government intervention. Some experts raise
concerns about a “helping hand,” contending that government intervention could slow the
beneficial effect start-ups have on the economy. Gordon Chang in a Forbes Magazine article, for
example, contends that “perhaps the worst thing for tech companies is direct government support,
which means meddling by central, provincial, and local officials.”263
Chang also pointed out that
new e-commerce companies, like the ones that Internet Plus aims to create, may be net job-
destroyers by contributing to the closing of “brick-and-mortar” shops, and that many of these new
companies may be “zombie shops.” Press reports point out the lack of reference to “freedom of
the Internet” in Internet Plus, leading them to question how strict internet censorship would be,
especially with the trend of increased censorship since Xi Jinping became president in 2012.264
They also mention that if Beijing continues to censor access to information, Internet Plus may
increase consumer shopping, instead of having any significant and long-term impact on the
economy.
Analysts have also criticized the implementation of Internet Plus. Internet Plus places a large
emphasis on modernizing the agricultural sector of the economy, but agencies tasked with
overseeing the implementation of Internet Plus for agriculture include the Ministry of Agriculture;
National Development and Reform Commission; Ministry of Science and Technology; Ministry
of Commerce; General Administration of Quality Supervision, Inspection, and Quarantine; China
Food and Drug Administration; and the State Forestry Administration. A lack of coordination
could lead to problems with Internet Plus, including the misallocation of state resources,
redundant or contradictory policies, and opportunities for local officials to exploit policy overlaps
for their own profits.265
Implications
There are both positive and negative implications for the United States if Internet Plus is
implemented as the Chinese government intends it. Seconded European Standardization Expert in
China (SESEC) notes that transforming and upgrading key sectors could open up new sectors,
highlighting the example of how mobile internet reforms promoted the development of taxi-
hailing apps in a previously closed vehicle transportation and operation market. If Internet Plus is
successful, an example of a possible sector that could open up is the agricultural industry, as there
has been some emphasis on modernizing the sector, specifically moving from network sale
sectors like e-commerce to the production sector.266
Some analysts speculate that Internet Plus could increase censorship, further closing off high-tech
sectors from China and halting innovation. During the announcement of Internet Plus, Premier Li
Keqiang mentioned more precise web management to “clean up illegal and bad information” to
“strengthen the struggle against enemies in online sovereign space and increase control of online
public sentiment.”267
In its 2016 U.S.-China Business Council (USCBC) Recommendations for
the U.S.-Joint Commission on Commerce and Trade (JCCT), USCBC recommended ensuring
263 Gordon G. Chang, “China’s ‘Internet Plus’ Strategy, A Net Minus,” Forbes, April 19, 2015. 264 George Chen, “Can Li Keqiang’s Internet Plus strategy really save China?,” South China Morning Post, March 8,
2015. 265 Lincoln E. Davidson, “ ‘Internet Plus’ and the Salvation of China’s Rural Economy,” The Diplomat, July 17, 2015. 266 Betty Xu, China Internet Plus Strategy, Seconded European Standardization Expert in China, February 5, 2015,
http://sesec.eu/app/uploads/2015/06/
2015_05_SESECIII_Newsletter_April_2015_Annex02_China_Internet_Plus_Strat.... pdf. 267 Lulu Chang, “China Outlines its Latest Five Year Plan, Called Internet Plus,” Digital Trends, March 6, 2016.

China-U.S. Trade Issues
Congressional Research Service 79
“that regulations calling for ‘secure and controllable,’ ‘secure and reliable,’ and similarly worded
standards included in existing policy documents do not discriminate against foreign companies or
procurement of foreign IT equipment and do not create unnecessary requirements that will not
enhance the security of networks.”268
National Informatization Development Strategy
On August 31, 2015, China released its “National Informatization Development Strategy,”269
or
big data development plan.270
In July 2016, China released its Outline of the National
Informatization Development Strategy, a guiding document that explains the regulations and
direction of information-based development in China over the next 10 years.271
According to the United States Information Technology Office, the outline calls for core
information technology, such as integrated circuits and basic software to create a core technology
system; strengthened IPR and standards; improved protection regulations for IPR;
implementation of a multi-level classification information management system; accelerated
lawmaking process for relevant policies; emphasis on the importance of international cyberspace
development and administration cooperation; implementation of network identity administration
regulations; and tightened control over all internet news services and platforms.272
The outline
also emphasizes the leadership of the Central Network Security and Informatization Leading
Group, led by President Xi Jinping.
The outline sets targeted goals for the next 10 years that will be reached by both 2020 and 2025.
By 2020, China wants to strengthen its domestic industry by specifically focusing on certain core
technologies,273
providing internet access to an additional 350 million people by expanding 3G
and 4G services, and achieving breakthroughs in 5G technology. By 2025, China wants to further
improve household fixed-broadband connectivity rates, build a leading mobile
telecommunications network, and increase information consumption values to 12 trillion RMB
(U.S. $1.79 trillion) and e-commerce trading values to 67 trillion RMB (U.S. $10 trillion).274
Implications
The National Informatization Development Strategy builds upon the ICT and big data goals set in
the 13th Five-Year Plan, Internet Plus, and Made in China 2025. However, as some have noted,
the outline differentiates itself from the other goals set in these other plans in that it is bolder with
268 The US-China Business Council, 2016 US-China Business Council Recommendations for the US-China Joint
Commission on Commerce and Trade (JCCT), 2016, https://www.uschina.org/sites/default/files/
2016%20USCBC%20JCCT%20Recommendations.pdf.
269 “促进大数据发展行动纲要” (“National Informatization Development Strategy”) (in Chinese), http://www.gov.cn/
zhengce/content/2015-09/05/content_10137.htm. 270 Office of the United States Trade Representative, 2015 USTR Report to Congress on China’s WTO Compliance,
December 2015, https://ustr.gov/sites/default/files/2015-Report-to-Congress-China-WTO-Compliance.pdf. 271 United States Information Technology Office, “State Council Released an Outline of the National Informatization
Development Strategy,” press release, 2016, http://www.usito.org/news/state-council-released-outline-national-
informatization-development-strategy. 272 Ibid. 273 Core technologies include products such as integrated circuits and broadband networks. 274 “Outline of the National Informatization Development Strategy,” China Copyright and Media, July 27, 2016.

China-U.S. Trade Issues
Congressional Research Service 80
a nationalistic frame.275
The strategy further emphasizes the need for China to strengthen its
domestic industry, easing its dependence off of foreign sectors.
Efforts to Promote an Indigenous Semiconductor Industry
In June 2014, the Chinese government released a plan called “Guidelines to Promote National
Integrated Circuit Industry Development.” A year later, the government announced an investment
of 1 trillion RMB, or 161 billion USD, in the domestic semiconductor industry to be developed
over the next 10 years.276
The guidelines to improve the semiconductor industry are split into
three main strategies: mergers and acquisitions (M&A), market power, and regulation. According
to the U.S. International Trade Administration, “the Chinese government appears to be driven by
a desire to acquire know-how in all segments of the semiconductor supply chain,” resulting in
heavy recruitment of foreign talent by the Chinese government.277
China wants to “catch up
technologically” with other leading semiconductor firms by 2030 and produce 70% of the chips
consumed by the Chinese industry.278
China purchases over half of all semiconductors produced each year globally, but lacks the
capabilities in its domestic semiconductor industry to back up its consumption. In 2014, China
accounted for 56.6% of the global consumption of semiconductors, and its demand grew at an
18.8% compounded annual growth rate between 2003 and 2014.279
In order to build up domestic
industries and promote indigenous innovation, China wants to lessen its dependency on U.S.
technology, especially in the semiconductor industry. Chinese consumption of semiconductors in
2015 was 9% domestically produced and 91% foreign, of which 56.2% was made in the United
States, while domestic Chinese chips accounted for less than one-tenth of local demand.280
Globally, China makes up 4% of global semiconductor sales, and views its reliance on foreign
companies as a national security concern.
Issues
Analysts have compared the Chinese ambitions to the rise of the Taiwanese semiconductor
industry, but point out differences between the two situations. According to The Economist,
Taiwan was able to succeed because they entered the market during an industry shift to a model
that separated the design and fabrication of the chip. However, when Taiwan tried to enter the
market for memory chips, it failed due to the lack of a transitional period in the industry.
Currently, the global semiconductor industry is facing a period of relatively slow growth. This, in
combination with the maturing of the global semiconductor industry, or the increased complexity
of semiconductor chips and their associated software, could, some argue, make it more difficult
for Chinese firms to succeed.281
275 Frank Zhao and Jesse Heatley, “China’s Master Plan for IT Dominance,” The Diplomat, August 11, 2016. 276 Ma Xiaochun and Zhang Qian, “The chips are up,” People’s Daily, August 5, 2015. 277 International Trade Administration, China, 2016 Top Markets Report Semiconductors and Semiconductor
Manufacturing Equipment Country Case Study, 2016, http://trade.gov/topmarkets/pdf/Semiconductors_China.pdf. 278 “Chips on their shoulders,” The Economist, January 23, 2016, Print edition. 279 Dezan Shira & Associates, Chips All In: Investing in China’s Semiconductor Industry, March 2, 2016,
http://www.china-briefing.com/news/2016/03/02/chips-all-in-investing-in-chinas-semiconductor-industry.html. 280 Ian King, “China Has Big Plans for Homegrown Chips,” Bloomberg Businessweek, June 25, 2015. 281 “Chips on their shoulders,” The Economist, January 23, 2016, Print edition.

China-U.S. Trade Issues
Congressional Research Service 81
Other criticisms include the methods and goals that China has undertaken to develop its
semiconductor industry. As of March 2016, China, through its Integrated Circuit (IC) Industry
Investment Fund, has invested 43 billion RMB (6.61 billion USD) to expand its semiconductor
industry, with much of the money going toward mergers and acquisitions.282
Analysts note that
simply acquiring the technology will not help improve China’s competitiveness in the long run,
but will only increase the profit margin for China temporarily. Intel alone spends four times as
much on research and development on its semiconductors as the entire Chinese chip industry.283
The emphasis on increasing domestic demand for domestically made chips is also a concern.
Some analysts note that the emphasis on domestically made chips assumes that Chinese firms will
buy Chinese-produced microchips because they are made in China, disregarding the idea that the
same firms might buy foreign microchips because they are of better quality.284
If Chinese-
produced microchips are of lesser quality, but the Chinese government guides companies toward
buying domestically made products, China could end up with a domestic industry that lacks
global competitiveness. A government mandate for Chinese high tech firms to use Chinese-made
chips could also undermine their global competitiveness as well.
Implications
The United States is a leading actor in the global semiconductor industry, and has great interest in
Asia, with U.S. semiconductor exports to the broader Asia-Pacific region representing 85% of
total U.S. semiconductor goods exported in 2014 at $36.5 billion. Between 2014 and 2015,
semiconductor exports grew from $8.03 billion to $8.45 billion, a growth of 5.2%; 82% of all
semiconductor products produced in the United States are sold to customers overseas, supporting
250,000 U.S. jobs and an additional 1 million jobs in related sectors. In 2015, U.S. companies
accounted for 50% of total semiconductor sales.285
The Department of Commerce’s International
Trade Administration views policies promoting Chinese domestic industries as “potentially
discriminatory” and posing “real long-term threats to not only U.S. firms, but the entire
semiconductor ecosystem.”286
In the short term, some note that there will be larger investment in both U.S. and foreign
companies that develop semiconductors, but in the long term, it is possible that once Chinese
companies have the intellectual property, there could be less reliance on U.S. companies. In
January 2016, the Chinese provincial government of Guizhou and U.S. firm Qualcomm signed an
agreement to form a new joint venture (with an initial registered capital of $280 million),
focusing on the “design, development and sale of advanced server chipset technology in China.”
The Guizhou provincial government investment arm will have a 55% controlling share.287
Qualcomm will provide investment capital, license its server technology to the joint venture, and
assist with R&D process and implementation expertise.
282 Bien Perez, “China’s chip industry bolstered by acquisitions worth US$6.61 billion by government-backed fund,”
South China Morning Post, March 30, 2016. 283 “Chips on their shoulders,” The Economist, January 23, 2016, Print edition. 284 Ibid. 285 Semiconductor Industry Association, U.S. Semiconductor Industry Supports the Trans-Pacific Partnership,
http://www.semiconductors.org/clientuploads/directory/DocumentSIA/International%20Trade%20and%20IP/
TPP%20Benefits%20to%20the%20Semiconductor%20Industry-%20March%202016.pdf. 286 International Trade Administration, China, 2016 Top Markets Report Semiconductors and Semiconductor
Manufacturing Equipment Country Case Study, 2016, http://trade.gov/topmarkets/pdf/Semiconductors_China.pdf. 287Qualcomm, Press Release, January 17, 2016, available at https://www.qualcomm.com/news/releases/2016/01/16/
qualcomm-and-guizhou-province-sign-strategic-cooperation-agreement-and-form.

China-U.S. Trade Issues
Congressional Research Service 82
If China successfully develops its semiconductor industry, it may enjoy a bigger share of the
global electronics industry’s profits, as profit margins for successful semiconductor firms are
around 40% or more. Analysts say that there will be a continuation of strong, but slowing growth
in demand for semiconductors by China and a large increase in their demand for semiconductor
manufacturing equipment in the short term as China continues to develop their industry.288
On January 2017, the President’s Council of Advisors on Science and Technology issued a issued
a report on U.S. semiconductor innovation, competitiveness, and security, which warned that a
“concerted push by China to reshape the market in its favor, using industrial policies backed by
over one hundred billion dollars in government-directed funds, threatens the competitiveness of
U.S. industry and the national and global benefits it brings,” and that such policies “put U.S.
national security at risk.”289
Author Contact Information
Wayne M. Morrison
Specialist in Asian Trade and Finance
[email protected], 7-7767
Acknowledgments
This report greatly benefitted from the assistance of Ashley Feng, Research Associate, Foreign Affairs,
Defense, and Trade Division.
288 The Economist, “Chips on their shoulders,” January 23, 2016. 289 The White House, Office of Science and Technology Policy, Report on Ensuring Long-Term U.S. Leadership in
Semiconductors, January 6, 2017, available at https://obamawhitehouse.archives.gov/sites/default/files/microsites/ostp/
PCAST/pcast_ensuring_long-term_us_leadership_in_semiconductors.pdf.