Belarus Denmark Estonia Finland Germany Latvia Lithuania Norway Poland Russia Sweden
Upload
duonghuongCategory
view
215download
0
Consulting Performance, Reward, and Talent
China Salary Planning Report 2012–2013
Consulting Performance, Reward, and Talent
Proprietary & Confidential | Legal Disclaimer
Table of ContentsSurvey Highlights and Insight 1
Global Salary Increase Survey Report Availability 3
Economic Highlights 4
Overview of Survey Results 5
Pay and Performance 15
Workforce Size 28
Pay Delivery & Management 34
High Potentials and Top Performers 43
Merit Increases by City 47
City Differential 60
Participation Demographics 47
Appendix 53
Definitions of Terms 54
Participants 57
China Salary Planning Report 2012-2013 i
Survey Highlights and Insights This report presents the results of Aon Hewitt’s annual Global Salary Increase Survey. The survey focuses on overall changes in employee compensation for the calendar year 2012, and on current projections for 2013. The survey spans over 100 markets with 14,165 country submissions received during July and August. Participants include service, manufacturing, and multi-industry organizations.
The China country report consists of 658 companies.
China Salary Planning Report 2012-2013 1
Survey Highlights and Insights
How Data is Collected The survey data is collected through multinationals that submit multicountry data and also from companies that are recruited locally and submit data for one single country. The salary increase budget information reported in this report encompasses data for all companies reporting data for China.
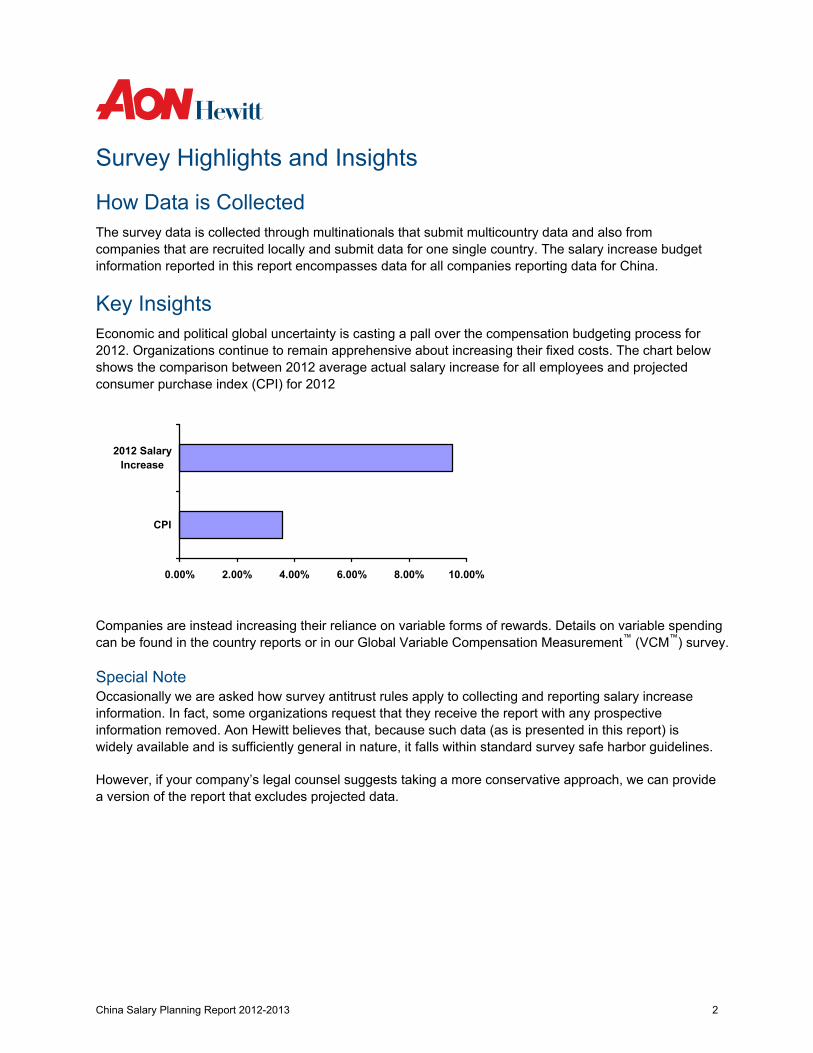
Key Insights Economic and political global uncertainty is casting a pall over the compensation budgeting process for 2012. Organizations continue to remain apprehensive about increasing their fixed costs. The chart below shows the comparison between 2012 average actual salary increase for all employees and projected consumer purchase index (CPI) for 2012
0.00% 2.00% 4.00% 6.00% 8.00% 10.00%
CPI
2012 SalaryIncrease
Companies are instead increasing their reliance on variable forms of rewards. Details on variable spending can be found in the country reports or in our Global Variable Compensation Measurement™ (VCM™) survey.
Special Note Occasionally we are asked how survey antitrust rules apply to collecting and reporting salary increase information. In fact, some organizations request that they receive the report with any prospective information removed. Aon Hewitt believes that, because such data (as is presented in this report) is widely available and is sufficiently general in nature, it falls within standard survey safe harbor guidelines.
However, if your company’s legal counsel suggests taking a more conservative approach, we can provide a version of the report that excludes projected data.
China Salary Planning Report 2012-2013 2

Global Salary Increase Survey Report Availability North America Canada United States Asia Pacific Australia China Fiji Guam Hong Kong India Indonesia Japan Korea Macau Malaysia New Zealand Papua New Guinea Philippines Singapore Sri Lanka Taiwan Thailand Vietnam Europe/Middle East/ Africa Angola Austria Azerbaijan Bahrain Belgium Botswana Bulgaria Croatia Cyprus Czech Republic Denmark
Egypt Estonia Finland France Georgia Germany Ghana Gibraltar Greece Hungary Ireland Israel Italy Jordan Kazakhstan Kenya Kuwait Latvia Lebanon Lithuania Luxembourg Malta Morocco Mozambique Netherlands Norway Oman Poland Portugal Qatar Romania Russia Saudi Arabia Serbia Slovakia Slovenia South Africa Spain Sweden
Switzerland Tanzania Tunisia Turkey Uganda Ukraine United Arab Emirates United Kingdom Yemen Zambia Latin America Antigua Argentina Bahamas Barbados Bermuda Bolivia Brazil Chile Colombia Costa Rica Dominican Republic Ecuador El Salvador Guatemala Honduras Jamaica Mexico Netherlands Antilles Nicaragua Panama Peru Puerto Rico Trinidad and Tobago Uruguay Venezuela
You may purchase detailed survey results from any of the countries above. The 25th annual Global Salary Planning Report will be available in September 2012. For an order form or additional information, please send an email to [email protected].
China Salary Planning Report 2012-2013 3
Economic Highlights According to the statistics by National Bureau of Statistics of China on August 9, China’s consumer price index (CPI) rose 1.8% in July, the lowest level in the past 30 months. While producer price index (PPI) for July, a measure of inflation at the wholesale level, was down 2.9% year-on-year from 2.1% in June. New loan is 540 billion RMB, which is also much lower than expectation (700 billion). China’s second-quarter GDP rose 7.6% from previous year, compared with 8.1% growth in the first quarter. It is the first quarter lower than 8% in the past 12 quarters, the lowest number since 2009. Although 7.6% is higher than the government's expectation of 7.5%, economists predict that 7.5% is more likely the growth bottom-line, rather than the target; government may take actions to stimulate the economic growth. Moreover CPI rose 1.8% in July, much lower than 2.2% in June. It seems that industrial enterprise business situation may continue to deteriorate in the future. It increases the market expectation for the further action by government such as strong investment, release of more loans, reduction of interest etc. Fixed asset investment grew 20.4% from January to July 2012, approaches 18.4 trillion. The percentage is same to first half of the year, and still 4.4% higher than the target of 16% set by National Development and Reform Commission (NDRC) for 2012. Real estate grew 15.4%, quickly dropped 1.2% from June. Chinese government continues to increase spending on health, education, and welfare. Designed to address inequalities between rich and poor and urban and rural areas. Moreover, China reported a trade surplus equivalent to 25.1 billion USD in July of 2012. China’s major exports are: office machines and data processing equipment, telecommunication equipment, electrical machinery and apparel and clothing. China imports mainly commodities: iron and steel, oil and mineral fuels; machinery and equipment, plastics, optical, and medical equipment, and organic chemicals. Its main trading partners are: European Union, The United States, Japan, Hong Kong and South Korea. Exports only increase 1% from a year earlier, to $176.9 billion, Imports climbed 4.7% from a year earlier, to $151.8 billion. Exports and imports each grew much fewer in July than June, The trade surplus narrow.
China Salary Planning Report 2012-2013 4

Overview of Survey Results
China Salary Planning Report 2012-2013 5
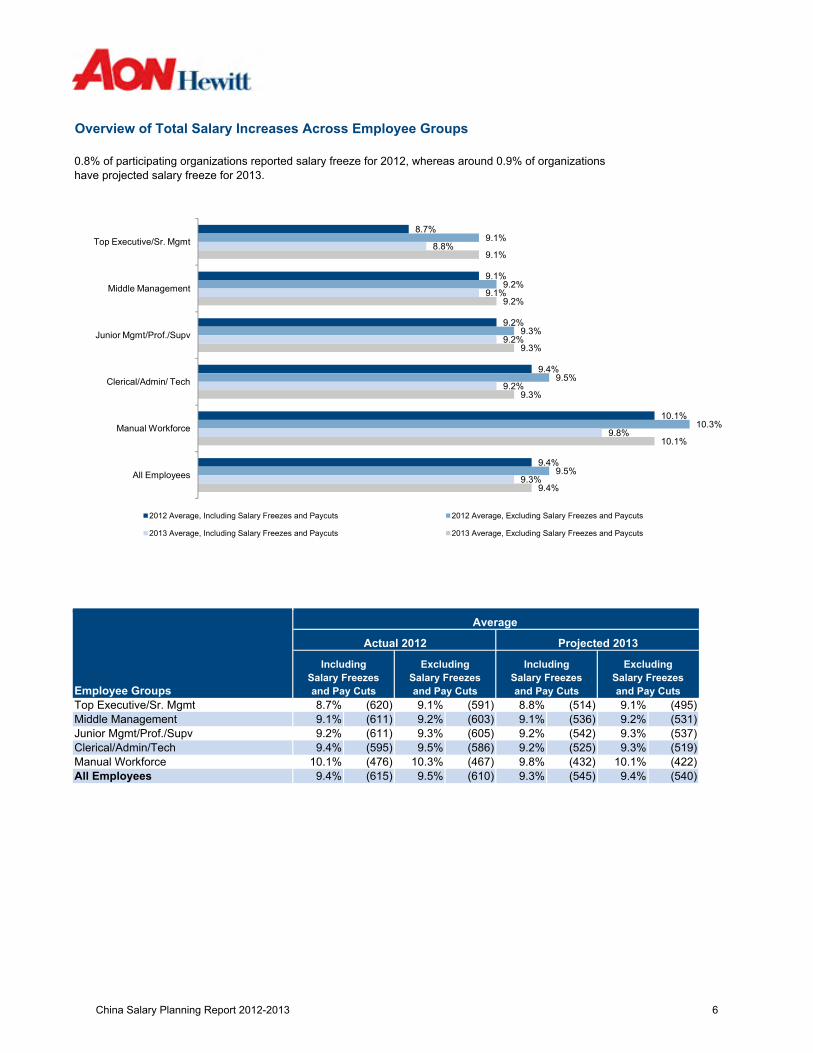
Overview of Total Salary Increases Across Employee Groups
0.8% of participating organizations reported salary freeze for 2012, whereas around 0.9% of organizationshave projected salary freeze for 2013.
8.7%
9.1%
9.2%
9.4%
10.1%
9.4%
9.1%
9.2%
9.3%
9.5%
10.3%
9.5%
8.8%
9.1%
9.2%
9.2%
9.8%
9.3%
9.1%
9.2%
9.3%
9.3%
10.1%
9.4%
Top Executive/Sr. Mgmt
Middle Management
Junior Mgmt/Prof./Supv
Clerical/Admin/ Tech
Manual Workforce
All Employees
2012 Average, Including Salary Freezes and Paycuts 2012 Average, Excluding Salary Freezes and Paycuts
2013 Average, Including Salary Freezes and Paycuts 2013 Average, Excluding Salary Freezes and Paycuts
Employee GroupsTop Executive/Sr. MgmtMiddle ManagementJunior Mgmt/Prof./SupvClerical/Admin/TechManual WorkforceAll Employees
8.7% (620) 9.1% (591)
10.3% (467)9.4% (595)
9.1% (611) 9.2% (603)9.2% (611) 9.3% (605)
9.5% (586)10.1% (476)9.4% (615) 9.5% (610)
9.3%10.1%9.4% (540)
9.2% (525)9.8% (432)9.3% (545)
9.2% (542) 9.3% (537)(519)(422)
9.1% (536) 9.2% (531)8.8% (514) 9.1% (495)
Average
Actual 2012 Projected 2013
Including Salary Freezes and Pay Cuts
Excluding Salary Freezes and Pay Cuts
Including Salary Freezes and Pay Cuts
Excluding Salary Freezes and Pay Cuts
China Salary Planning Report 2012-2013 6
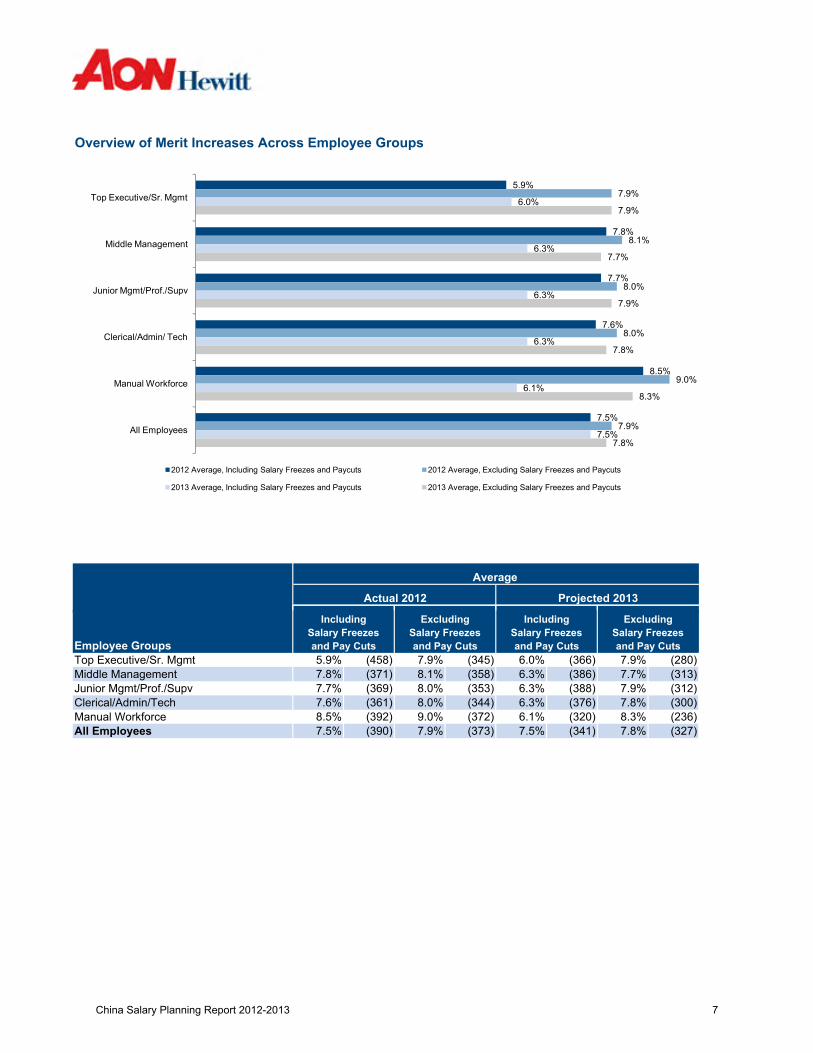
Overview of Merit Increases Across Employee Groups
Average
Projected 2013Actual 2012
5.9%
7.8%
7.7%
7.6%
8.5%
7.5%
7.9%
8.1%
8.0%
8.0%
9.0%
7.9%
6.0%
6.3%
6.3%
6.3%
6.1%
7.5%
7.9%
7.7%
7.9%
7.8%
8.3%
7.8%
Top Executive/Sr. Mgmt
Middle Management
Junior Mgmt/Prof./Supv
Clerical/Admin/ Tech
Manual Workforce
All Employees
2012 Average, Including Salary Freezes and Paycuts 2012 Average, Excluding Salary Freezes and Paycuts
2013 Average, Including Salary Freezes and Paycuts 2013 Average, Excluding Salary Freezes and Paycuts
Employee GroupsTop Executive/Sr. MgmtMiddle ManagementJunior Mgmt/Prof./SupvClerical/Admin/TechManual WorkforceAll Employees
Including Salary Freezes and Pay Cuts
Excluding Salary Freezes and Pay Cuts
5.9% (458) 7.9% (345)
9.0% (372) (236)
8.0% (353)
8.5% (392)
7.8% (371) 8.1% (358)
6.1% (320) 8.3%
7.7% (369)
(390) 7.9% (373)7.5%
7.6% (361) 8.0% (344)
(341) 7.8%
6.3% (376) 7.8%
7.5% (327)
(386) 7.7% (313)6.3% (388) 7.9%
(300)
7.9% (280)
(312)6.3%6.0% (366)
Excluding Salary Freezes and Pay Cuts
Including Salary Freezes and Pay Cuts
China Salary Planning Report 2012-2013 7
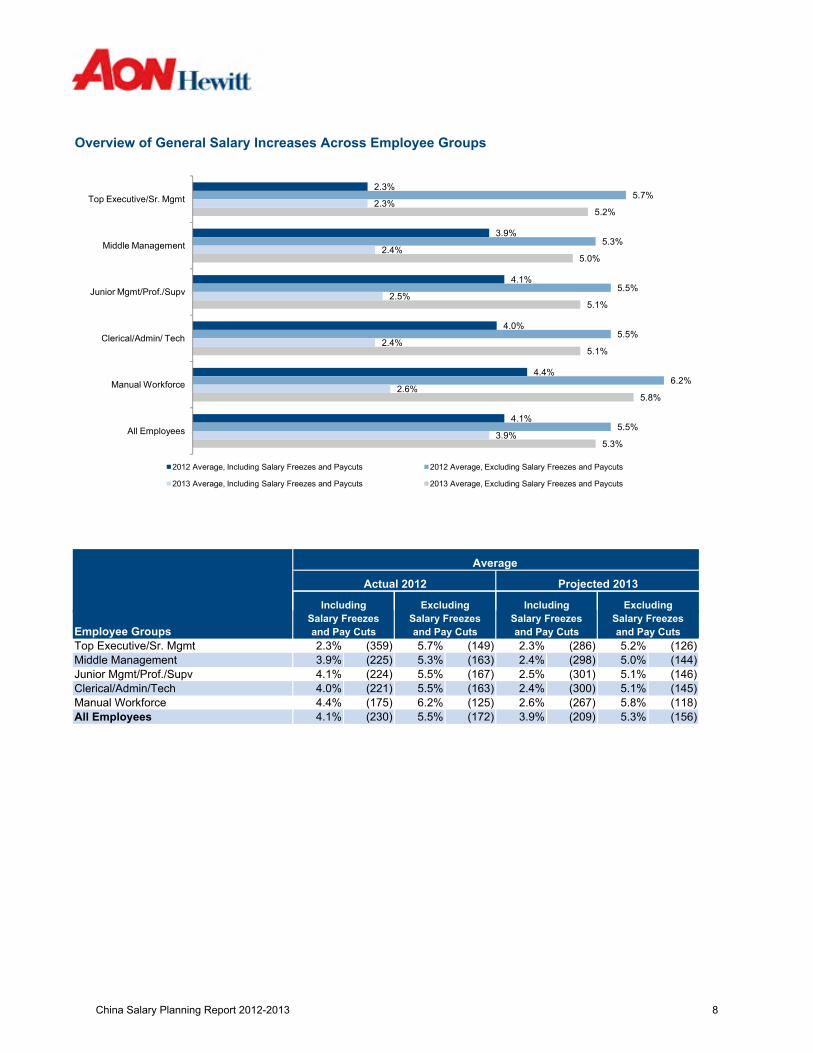
Overview of General Salary Increases Across Employee Groups
Average
Including Excluding Including Excluding
Actual 2012 Projected 2013
2.3%
3.9%
4.1%
4.0%
4.4%
4.1%
5.7%
5.3%
5.5%
5.5%
6.2%
5.5%
2.3%
2.4%
2.5%
2.4%
2.6%
3.9%
5.2%
5.0%
5.1%
5.1%
5.8%
5.3%
Top Executive/Sr. Mgmt
Middle Management
Junior Mgmt/Prof./Supv
Clerical/Admin/ Tech
Manual Workforce
All Employees
2012 Average, Including Salary Freezes and Paycuts 2012 Average, Excluding Salary Freezes and Paycuts
2013 Average, Including Salary Freezes and Paycuts 2013 Average, Excluding Salary Freezes and Paycuts
Employee GroupsTop Executive/Sr. MgmtMiddle ManagementJunior Mgmt/Prof./SupvClerical/Admin/TechManual WorkforceAll Employees
(144)
5.1% (145)
5.3% (156)
(163) 5.0%(225) 5.3%
4.4%
(286) 5.2% (126)
gSalary Freezes and Pay Cuts
gSalary Freezes and Pay Cuts
gSalary Freezes and Pay Cuts
gSalary Freezes and Pay Cuts
2.3% (359) 5.7% (149) 2.3%(298)
2.5% (301) 5.1% (146)
(175) 6.2% (125) 2.6%4.0% (221) 5.5%4.1%
(267) 5.8% (118)(163)
(224) 5.5% (167)2.4% (300)
3.9% 2.4%
3.9% (209)4.1% (230) 5.5% (172)
China Salary Planning Report 2012-2013 8

Overview of Mandatory Increases Across Employee Groups
Excluding Including Excluding
Actual 2012 Projected 2013
Including
Average
0.4%
1.1%
1.1%
1.5%
3.2%
1.8%
4.4%
4.9%
5.0%
5.7%
7.6%
5.4%
0.4%
0.6%
0.6%
0.6%
1.2%
1.6%
4.5%
4.9%
5.0%
4.6%
6.1%
4.6%
Top Executive/Sr. Mgmt
Middle Management
Junior Mgmt/Prof./Supv
Clerical/Admin/ Tech
Manual Workforce
All Employees
2012 Average, Including Salary Freezes and Paycuts 2012 Average, Excluding Salary Freezes and Paycuts
2013 Average, Including Salary Freezes and Paycuts 2013 Average, Excluding Salary Freezes and Paycuts
Employee GroupsTop Executive/Sr. MgmtMiddle ManagementJunior Mgmt/Prof./SupvClerical/Admin/TechManual WorkforceAll Employees
0.6% (241) 4.9% (28)
gSalary Freezes and Pay Cuts4.5% (19)
4.9% (31)1.1% (135)0.4%
gSalary Freezes and Pay Cuts
gSalary Freezes and Pay Cuts4.4% (28) 0.4% (235)
gSalary Freezes and Pay Cuts
(299)
4.6%(242)(51) 1.2% (45)
(46)1.8%
1.5% (135) 5.7%0.6% (244) 5.0% (27)
(36) 0.6%(231) 6.1%
(32)1.1% (134) 5.0%
(146) 5.4% (49)3.2% (121) 7.6%
(29)
1.6% (137) 4.6%
China Salary Planning Report 2012-2013 9

Total Salary Increase Budgets by Type of Company Ownership
Type of Company OwnershipLocally owned companyForeign owned companyJoint venture company
Other Increase Budgets
Salary structure movementPromotional budgetSpecial adjustments
9.0%
Median7.4% (157)
10.0%
Median9.0%
Average
4.4%3.3%
4.3%
Budgets Median
Actual 2012
1.5%
(157)
1.5%(309)(207) 3.4%
7.6% (181) 7.1% (181)(309)(207)
2.0%
10.5% (20)
(273) 2.0%
10.0%9.5%
Projected 2013
Projected 2013
(59)
11.8%
Actual 2012
Average
(204)(21)
8.8%Median
(181)9.4% (181)(20)
7.0%
(59)(204)(21)
9.0%9.5%
(52)8.6% (52)Average
(184)
Average
(273)(184)
Overall Salary Increase by Performance
% of % of % of % of % of
13.7% 7.4% 10.7%
Far Exceeding Expectations
Often Exceeded Expectations Met Expectations Often Did Not Meet
ExpectationsDid not meet Expectations
% Salary Increases Employees Increases Employees Increases Employees Employees Employees
% Salary
3.0%
% Salary % Salary Increases
% Salary Increases
21.4% 8.0% 59.6% 5.7% 7.8% 4.5%(32)(205) (205) (210) (210) (218) (218) (118) (118) (32)
China Salary Planning Report 2012-2013 10
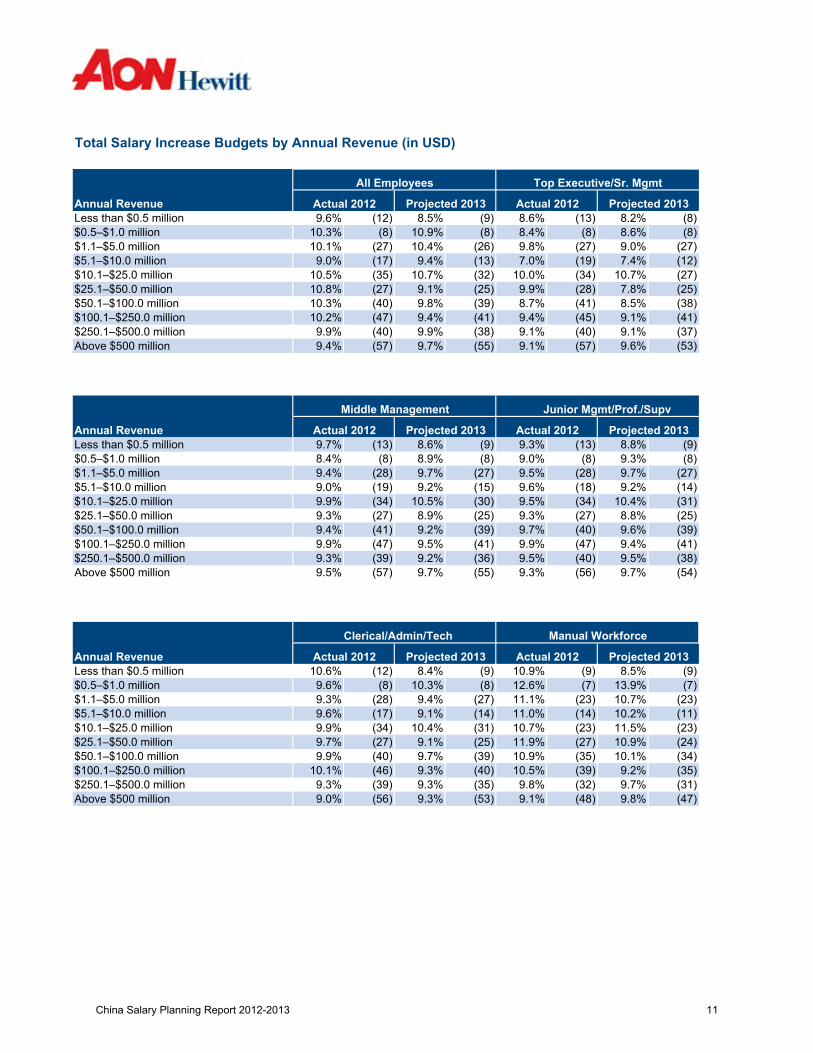
Total Salary Increase Budgets by Annual Revenue (in USD)
Annual RevenueLess than $0.5 million$0.5–$1.0 million$1.1–$5.0 million$5.1–$10.0 million$10.1–$25.0 million$25.1–$50.0 million$50.1–$100.0 million$100.1–$250.0 million$250.1–$500.0 millionAbove $500 million
Less than $0.5 million$0.5–$1.0 million$1.1–$5.0 million$5.1–$10.0 million$10.1–$25.0 million$25.1–$50.0 million$50.1–$100.0 million$100.1–$250.0 million$250.1–$500.0 millionAbove $500 million
10.1%
9.4% (57)
10.4%
9.7%
9.6% (12)Actual 2012
(57)
Annual Revenue
9.7%(38)(54)(57)
(36) 9.5% (40)9.2%(41)
9.7% (55) 9.3% (56)9.5%
10.8%
(47)
9.5%9.3% (39)
10.5% 10.7%
10.3% 10.9%
9.0%
9.5% (41) 9.9%
10.2%9.9%
9.7% (13)
(19)
9.9%9.4% (41)
(47)
10.3%
9.3%
(28)(8)
(45)
(8)
9.6% (39)9.3% (27) 8.8% (25)
(55)
9.4%
9.2%
9.9%
(17)(35)(27)
9.4%
(40)
9.1%(40)(47)
9.8%
(31)9.0% 9.6%9.9% (34) 10.5% (30)
9.2% (15)(27)
9.2% (14)9.7% (27) 9.5%
9.5% (34) 10.4%
9.7%(28)
(39)(27)
9.4%
9.7%9.4%
(18)
(40)8.9% (25)
(9)8.4% (8) 8.9% (8) 9.0%
(32)
(27)
8.5%8.4% (8)
10.0%
9.3% (8)
9.1%
9.3% (13) 8.8%
Actual 2012 Projected 2013
8.6% (9)
All Employees Top Executive/Sr. Mgmt
(9) 8.6% (13) 8.2% (8)Projected 2013
8.6% (8)
(13) 7.0% (19)(26) 9.8% (27)(8)
(34) 10.7%
(41) 8.5% (38)
(27)(25) 9.9% (28) 7.8% (25)
(41) 9.4%(39) 8.7%
9.1%9.1% (40) 9.1%
Projected 2013
Junior Mgmt/Prof./Supv
(41)(37)
Actual 2012
Middle Management
Projected 2013 Actual 2012
9.6% (53)(38)
(27)9.0%7.4% (12)
Less than $0.5 million$0.5–$1.0 million$1.1–$5.0 million$5.1–$10.0 million$10.1–$25.0 million$25.1–$50.0 million$50.1–$100.0 million$100.1–$250.0 million$250.1–$500.0 millionAbove $500 million
(23)
(47)
10.1% (34)
9.3% (39) 9.3% 9.8% (32)
(23)9.1% (25) 11.9% (27) 10.9% (24)
10.7%10.4% (31)
10.7% (23)9.6% (17) 9.1% (14) 11.0% (14) 10.2% (11)
8.5% (9)12.6% (7) 13.9% (7)
(9)10.9%Annual Revenue Actual 2012 Projected 2013 Actual 2012 Projected 2013
10.6% (12) 8.4% (9)
Clerical/Admin/Tech
(8)
10.1% (46)
(34)9.9% (23) 11.5%
9.8%
(35)10.9%
9.3%(35)
10.5%
9.4% (27)10.3%
9.7% (27)9.9% (40)
9.3% (28)9.6% (8)
9.1%(53)(31)
9.0% (56) 9.3%
9.7% (39)
(35)(40) (39) 9.2%
(48)
11.1%
Manual Workforce
9.7%
China Salary Planning Report 2012-2013 11

Total Salary Increase Budgets by Number of Full-Time Employees
Under 500500–1,0001,001–2,0002,001–5,0005,001–10,00010,001–20,00020,001–50,000Over 50,000
Under 500500–1,0001,001–2,0002,001–5,0005,001–10,00010,001–20,00020,001–50,000Over 50,000
Under 500Projected 2013
9 5%9 0% (266) 8 9% (236)
8.9% (271)
(170)
(1) (1)(4) 9.9% (4) 9.4% 9.7%
10 0%
(4)
9.6% (25)9.4% (8)
9.3% (48)
(74)(47)
9.9%
10.1% (75)(61)
Projected 2013
9.6%
(4)
Actual 2012(192)
(30)
(85)
8.5%
8.9%
9.2%9.6%
(47) 9.8%9.5% (30) 9.4%
(55)
9.2% 9.1%
Actual 2012
9.6% (55)
(68) 9.4%8.9% (236) (272)
(25)(7)
(1) -- (1)8.7%
(70)(85) 9.9%(55) 8.9%
(29) 10.2% (24)
9.4% (69) 9.5% (61)
Projected 20138.4% (224)8.7% (59)
(243) 8.5% (275)
All Employees Top Executive/Sr. Mgmt
Full–Time Employees Actual 2012
(9)
(76) 9.3%10.4% (55) 10.4% (49) 9.0%
10.0%(85)
--(4)
10.5%8.8% (9) 9.2% (8) 8.8%
(3)
9.5% (30)
--9.3% (4) 9.9% (4) 9.1%
(1)
(68)
Full–Time Employees
-- (1)
Manual Workforce
--9.3%
(8)-- (1)
8.9% (242)
9.6% (85) 9.9% (75)
Junior Mgmt/Prof./Supv
Full–Time Employees
8.7% (9) 9.0%
(61) 9.2%
Middle Management
Actual 2012 Projected 2013
--
Actual 2012 Projected 2013
Clerical/Admin/Tech
8.7% (9)-- (1)
9.9%
10.2%
(25)
9.0%Projected 2013 Actual 2012
9.1% (274)
Under 500500–1,0001,001–2,0002,001–5,0005,001–10,00010,001–20,00020,001–50,000Over 50,000 7.8% (4)
9.9% (8)10.2% (21)
-- (1) -- (1) -- --(1) (1)(9)
(68)(59) 10.1%
10.6% (43)10.1%
(56) 10.3%9.5%
(54)9.0% (266) 8.9% (236) (170)10.0% (192)
9.7%
(4)
10.3%9.1%
10.1% (83) (77)10.0%(48)
11.5% (27) 9.4% (22) 11.7% (22)
6.4%
10.0% (54) 9.5% (46) 10.5%
8.9% (9) 9.2% (8)
9.7% (4) 9.9% (4)
(67) 9.2%(73)
China Salary Planning Report 2012-2013 12
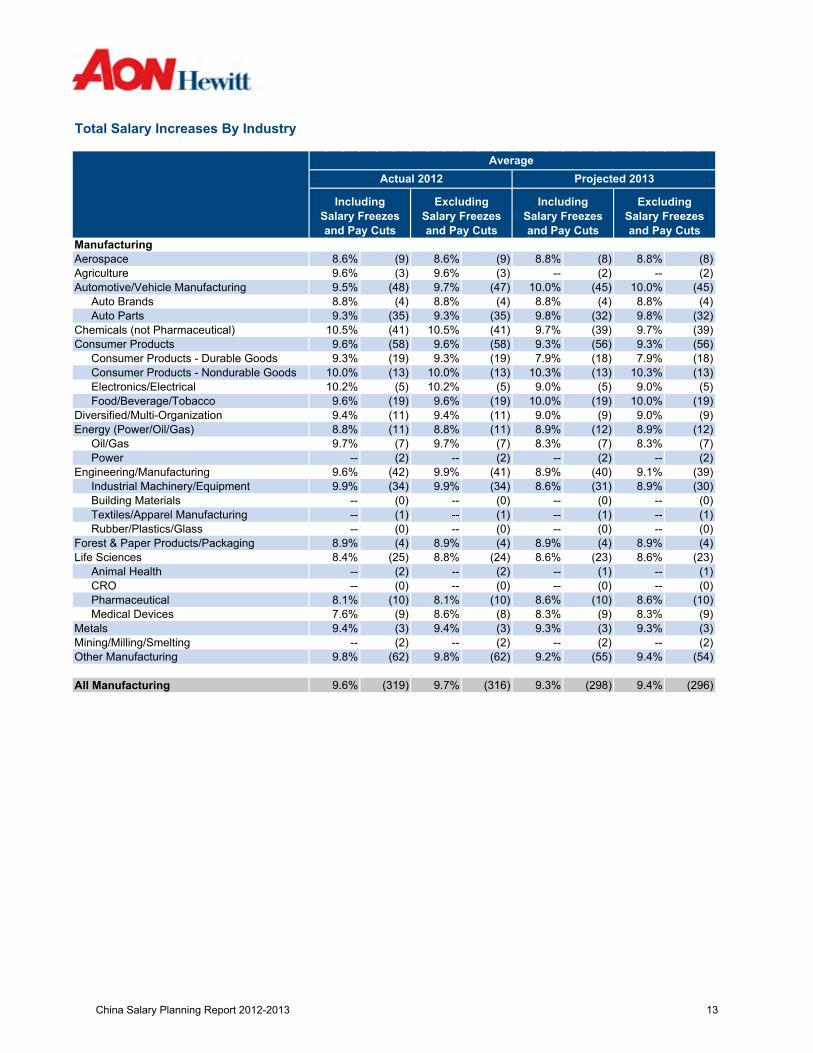
Total Salary Increases By Industry
ManufacturingAerospaceAgricultureAutomotive/Vehicle Manufacturing
Auto BrandsAuto Parts
Chemicals (not Pharmaceutical)Consumer Products
Consumer Products - Durable GoodsConsumer Products - Nondurable GoodsElectronics/ElectricalFood/Beverage/Tobacco
Diversified/Multi-OrganizationEnergy (Power/Oil/Gas)
Oil/GasPower
Engineering/ManufacturingIndustrial Machinery/EquipmentBuilding MaterialsTextiles/Apparel ManufacturingRubber/Plastics/Glass
Forest & Paper Products/PackagingLife Sciences
Animal HealthCROPharmaceuticalMedical Devices
MetalsMining/Milling/SmeltingOther Manufacturing
All Manufacturing 9.3% (298) 9.4% (296)9.6% (319) 9.7% (316)
9.2% (55) 9.4% (54)9.8% (62) 9.8% (62)-- (2) -- (2)-- (2) -- (2)
9.3% (3) 9.3% (3)9.4% (3) 9.4% (3)8.3% (9) 8.3% (9)7.6% (9) 8.6% (8)8.6% (10) 8.6% (10)8.1% (10) 8.1% (10)
-- (0) -- (0)-- (0) -- (0)-- (1) -- (1)-- (2) -- (2)
8.6% (23) 8.6% (23)8.4% (25) 8.8% (24)8.9% (4) 8.9% (4)8.9% (4) 8.9% (4)
-- (0) -- (0)-- (0) -- (0)-- (1) -- (1)-- (1) -- (1)-- (0) -- (0)-- (0) -- (0)
8.6% (31) 8.9% (30)9.9% (34) 9.9% (34)8.9% (40) 9.1% (39)9.6% (42) 9.9% (41)
-- (2) -- (2)-- (2) -- (2)8.3% (7) 8.3% (7)9.7% (7) 9.7% (7)8.9% (12) 8.9% (12)8.8% (11) 8.8% (11)9.0% (9) 9.0% (9)9.4% (11) 9.4% (11)
10.0% (19) 10.0% (19)9.6% (19) 9.6% (19)9.0% (5) 9.0% (5)10.2% (5) 10.2% (5)
10.3% (13) 10.3% (13)10.0% (13) 10.0% (13)7.9% (18) 7.9% (18)9.3% (19) 9.3% (19)9.3% (56) 9.3% (56)9.6% (58) 9.6% (58)9.7% (39) 9.7% (39)10.5% (41) 10.5% (41)9.8% (32) 9.8% (32)9.3% (35) 9.3% (35)8.8% (4) 8.8% (4)8.8% (4) 8.8% (4)
10.0% (45) 10.0% (45)9.5% (48) 9.7% (47)-- (2) -- (2)9.6% (3) 9.6% (3)
8.8% (8) 8.8% (8)8.6% (9) 8.6% (9)
Average Actual 2012 Projected 2013
Including Salary Freezes and Pay Cuts
Excluding Salary Freezes and Pay Cuts
Including Salary Freezes and Pay Cuts
Excluding Salary Freezes and Pay Cuts
China Salary Planning Report 2012-2013 13
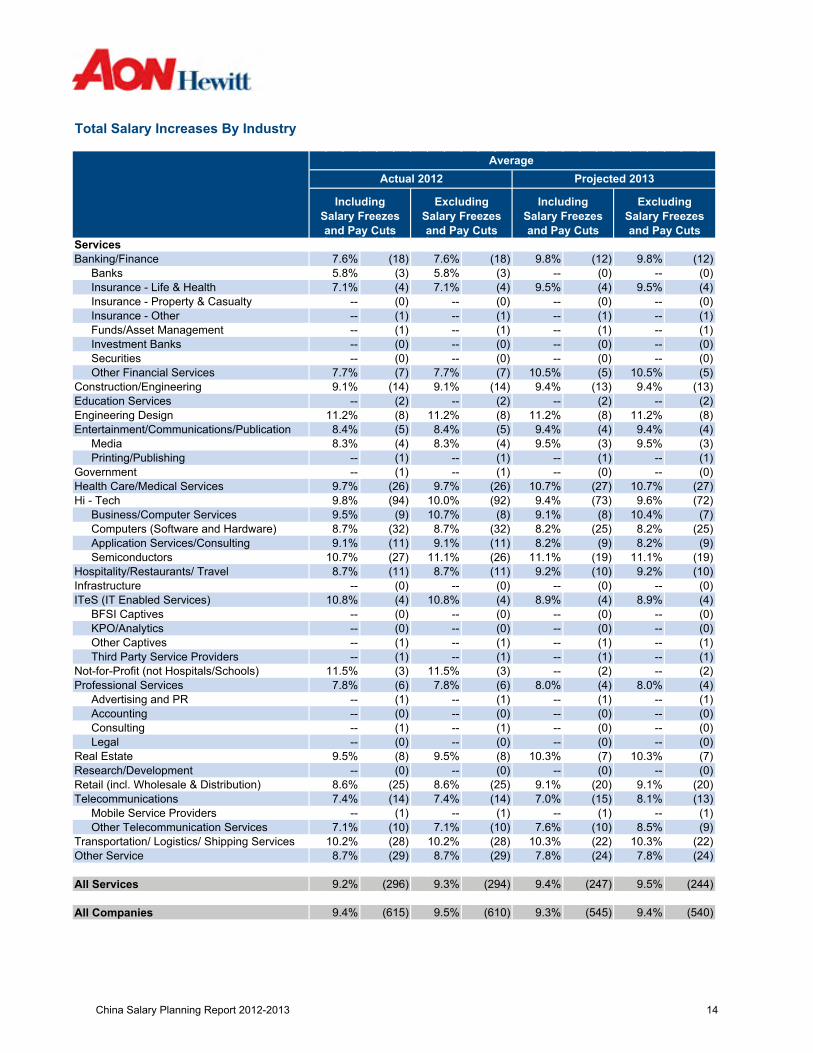
Total Salary Increases By Industry
Average Actual 2012 Projected 2013
Including Salary Freezes and Pay Cuts
Excluding Salary Freezes and Pay Cuts
Including Salary Freezes and Pay Cuts
Excluding Salary Freezes and Pay Cuts
ServicesBanking/Finance
BanksInsurance - Life & HealthInsurance - Property & CasualtyInsurance - OtherFunds/Asset ManagementInvestment BanksSecuritiesOther Financial Services
Construction/EngineeringEducation ServicesEngineering DesignEntertainment/Communications/Publication
MediaPrinting/Publishing
GovernmentHealth Care/Medical ServicesHi - Tech
Business/Computer ServicesComputers (Software and Hardware)Application Services/ConsultingSemiconductors
Hospitality/Restaurants/ TravelInfrastructureITeS (IT Enabled Services)
BFSI CaptivesKPO/AnalyticsOther CaptivesThird Party Service Providers
Not-for-Profit (not Hospitals/Schools)Professional Services
Advertising and PRAccountingConsultingLegal
Real EstateResearch/DevelopmentRetail (incl. Wholesale & Distribution)Telecommunications
Mobile Service ProvidersOther Telecommunication Services
Transportation/ Logistics/ Shipping ServicesOther Service
All Services
All Companies 9.4% (540)9.4% (615) 9.5% (610) 9.3% (545)
9.4% (247) 9.5% (244)9.2% (296) 9.3% (294)
7.8% (24) 7.8% (24)8.7% (29) 8.7% (29)10.3% (22) 10.3% (22)10.2% (28) 10.2% (28)7.6% (10) 8.5% (9)7.1% (10) 7.1% (10)
-- (1) -- (1)-- (1) -- (1)7.0% (15) 8.1% (13)7.4% (14) 7.4% (14)9.1% (20) 9.1% (20)8.6% (25) 8.6% (25)
-- (0) -- (0)-- (0) -- (0)10.3% (7) 10.3% (7)9.5% (8) 9.5% (8)
-- (0) -- (0)-- (0) -- (0)-- (0) -- (0)-- (1) -- (1)-- (0) -- (0)-- (0) -- (0)-- (1) -- (1)-- (1) -- (1)
8.0% (4) 8.0% (4)7.8% (6) 7.8% (6)-- (2) -- (2)11.5% (3) 11.5% (3)-- (1) -- (1)-- (1) -- (1)-- (1) -- (1)-- (1) -- (1)-- (0) -- (0)-- (0) -- (0)-- (0) -- (0)-- (0) -- (0)
8.9% (4) 8.9% (4)10.8% (4) 10.8% (4)-- (0) -- (0)-- (0) -- (0)
9.2% (10) 9.2% (10)8.7% (11) 8.7% (11)11.1% (19) 11.1% (19)10.7% (27) 11.1% (26)8.2% (9) 8.2% (9)9.1% (11) 9.1% (11)8.2% (25) 8.2% (25)8.7% (32) 8.7% (32)9.1% (8) 10.4% (7)9.5% (9) 10.7% (8)9.4% (73) 9.6% (72)9.8% (94) 10.0% (92)
10.7% (27) 10.7% (27)9.7% (26) 9.7% (26)-- (0) -- (0)-- (1) -- (1)-- (1) -- (1)-- (1) -- (1)
9.5% (3) 9.5% (3)8.3% (4) 8.3% (4)9.4% (4) 9.4% (4)8.4% (5) 8.4% (5)
11.2% (8) 11.2% (8)11.2% (8) 11.2% (8)-- (2) -- (2)-- (2) -- (2)
9.4% (13) 9.4% (13)9.1% (14) 9.1% (14)10.5% (5) 10.5% (5)7.7% (7) 7.7% (7)
-- (0) -- (0)-- (0) -- (0)-- (0) -- (0)-- (0) -- (0)-- (1) -- (1)-- (1) -- (1)-- (1) -- (1)-- (1) -- (1)-- (0) -- (0)-- (0) -- (0)
9.5% (4) 9.5% (4)7.1% (4) 7.1% (4)-- (0) -- (0)5.8% (3) 5.8% (3)
9.8% (12) 9.8% (12)7.6% (18) 7.6% (18)
China Salary Planning Report 2012-2013 14

Pay and Performance
China Salary Planning Report 2012-2013 15
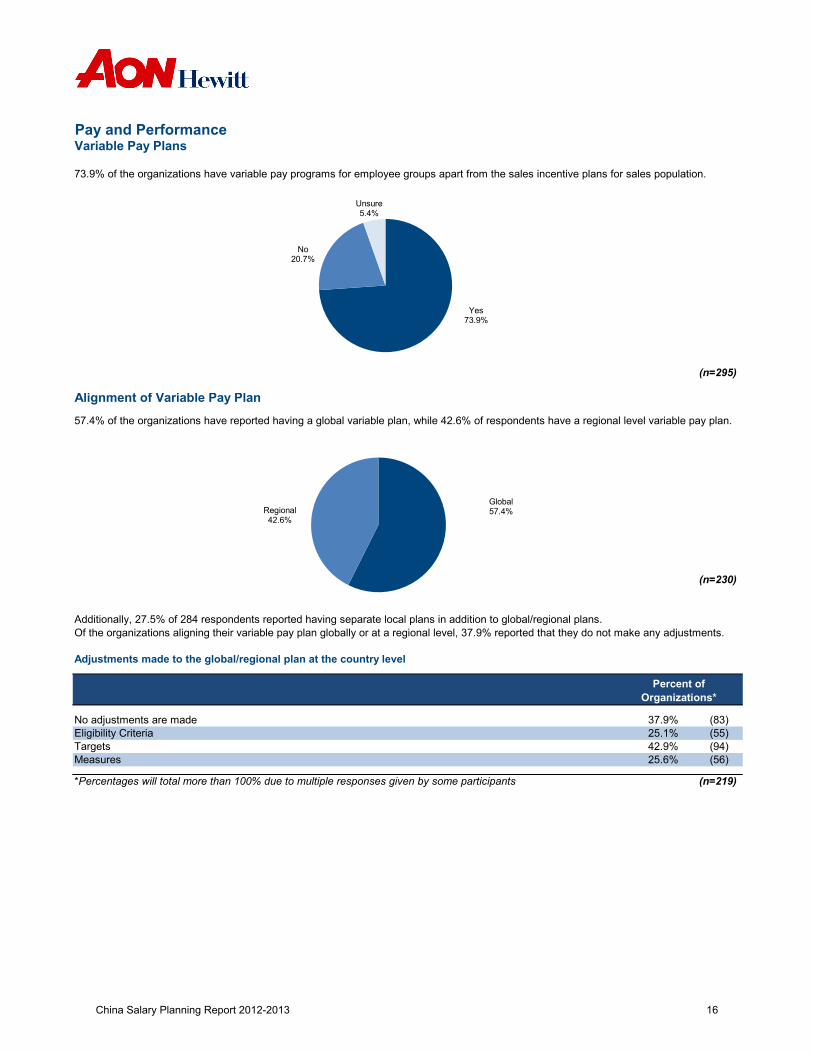
Pay and PerformanceVariable Pay Plans
73.9% of the organizations have variable pay programs for employee groups apart from the sales incentive plans for sales population.
Alignment of Variable Pay Plan
57.4% of the organizations have reported having a global variable plan, while 42.6% of respondents have a regional level variable pay plan.
(n=295)
(n=230)
Yes73.9%
No20.7%
Unsure5.4%
Global57.4%Regional
42.6%
Additionally, 27.5% of 284 respondents reported having separate local plans in addition to global/regional plans.Of the organizations aligning their variable pay plan globally or at a regional level, 37.9% reported that they do not make any adjustments.
Adjustments made to the global/regional plan at the country level
No adjustments are madeEligibility CriteriaTargetsMeasures
*Percentages will total more than 100% due to multiple responses given by some participants (n=219)
Percent of Organizations*
37.9% (83)25.1% (55)42.9% (94)25.6% (56)
China Salary Planning Report 2012-2013 16
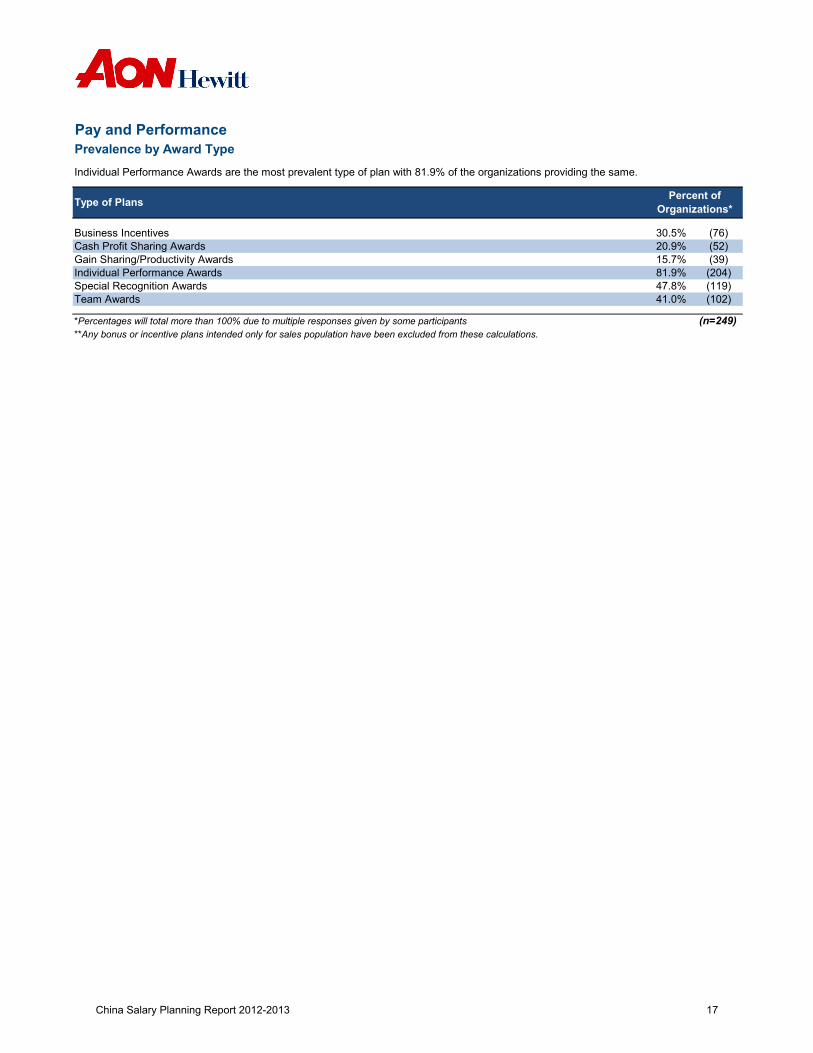
Pay and PerformancePrevalence by Award Type
Individual Performance Awards are the most prevalent type of plan with 81.9% of the organizations providing the same.
Business IncentivesCash Profit Sharing AwardsGain Sharing/Productivity AwardsIndividual Performance AwardsSpecial Recognition AwardsTeam Awards
*Percentages will total more than 100% due to multiple responses given by some participants**Any bonus or incentive plans intended only for sales population have been excluded from these calculations.
20.9% (52)
Type of Plans Percent of Organizations*
30.5% (76)
41.0% (102)
(n=249)
15.7% (39)81.9% (204)47.8% (119)
China Salary Planning Report 2012-2013 17
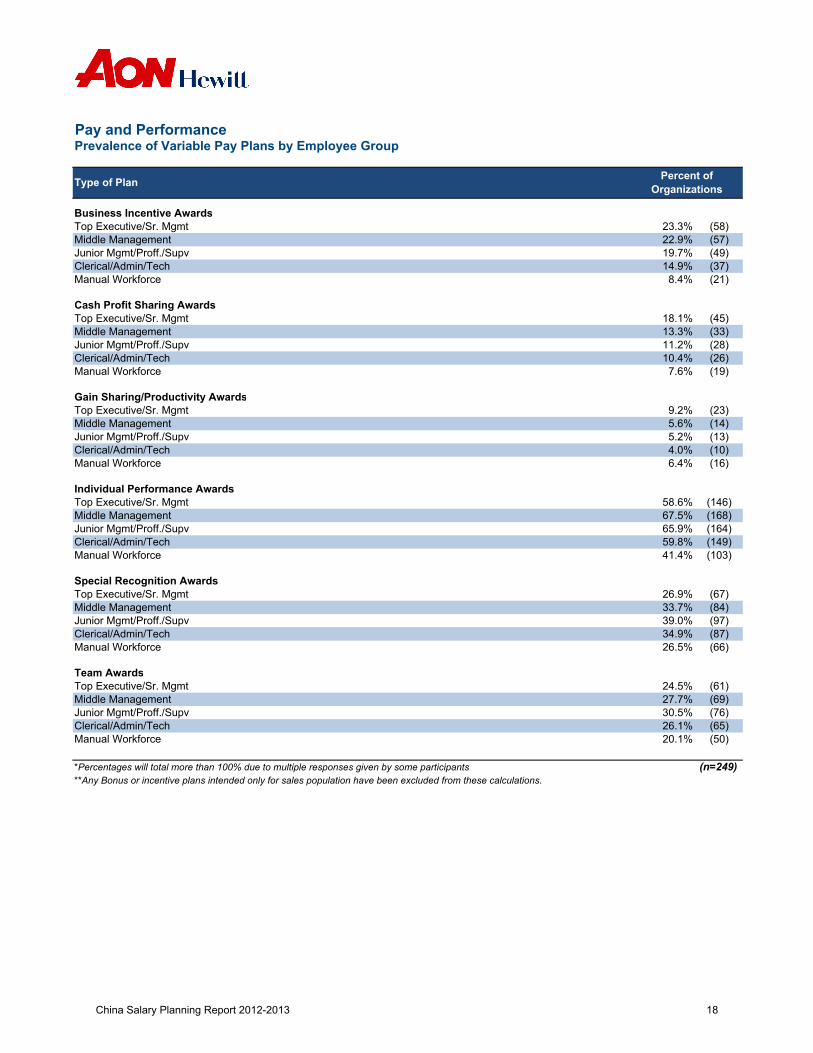
Pay and PerformancePrevalence of Variable Pay Plans by Employee Group
Business Incentive AwardsTop Executive/Sr. Mgmt (58)Middle Management (57)Junior Mgmt/Proff./Supv (49)Clerical/Admin/Tech (37)Manual Workforce (21)
Cash Profit Sharing AwardsTop Executive/Sr. Mgmt (45)Middle Management (33)Junior Mgmt/Proff./Supv (28)Clerical/Admin/Tech (26)Manual Workforce (19)
Gain Sharing/Productivity AwardsTop Executive/Sr. Mgmt (23)Middle Management (14)Junior Mgmt/Proff./Supv (13)Clerical/Admin/Tech (10)Manual Workforce (16)
Individual Performance AwardsTop Executive/Sr. Mgmt (146)Middle Management (168)Junior Mgmt/Proff./Supv (164)Clerical/Admin/Tech (149)Manual Workforce (103)
Special Recognition AwardsTop Executive/Sr. Mgmt (67)Middle Management (84)Junior Mgmt/Proff./Supv (97)Clerical/Admin/Tech (87)Manual Workforce (66)
Team AwardsTop Executive/Sr. Mgmt (61)Middle Management (69)Junior Mgmt/Proff./Supv (76)Clerical/Admin/Tech (65)Manual Workforce (50)
*Percentages will total more than 100% due to multiple responses given by some participants (n=249)**Any Bonus or incentive plans intended only for sales population have been excluded from these calculations.
19.7%14.9%8.4%
Type of Plan Percent of Organizations
23.3%22.9%
10.4%7.6%
18.1%13.3%11.2%
5.6%5.2%4.0%
9.2%
58.6%67.5%
6.4%
65.9%59.8%41.4%
26.9%33.7%39.0%34.9%26.5%
24.5%27.7%30.5%26.1%20.1%
China Salary Planning Report 2012-2013 18
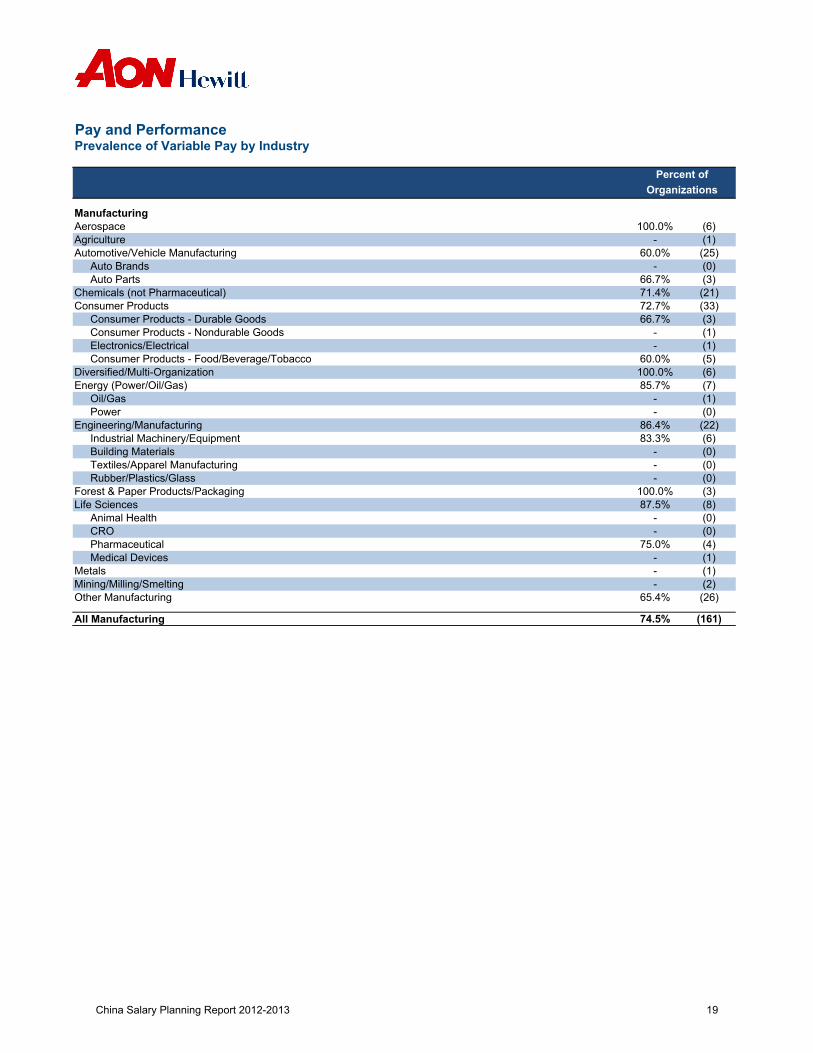
Pay and PerformancePrevalence of Variable Pay by Industry
ManufacturingAerospace 100.0% (6)Agriculture - (1)Automotive/Vehicle Manufacturing 60.0% (25)
Auto Brands - (0)Auto Parts 66.7% (3)
Chemicals (not Pharmaceutical) 71.4% (21)Consumer Products 72.7% (33)
Consumer Products - Durable Goods 66.7% (3)Consumer Products - Nondurable Goods - (1)Electronics/Electrical - (1)Consumer Products - Food/Beverage/Tobacco 60.0% (5)
Diversified/Multi-Organization 100.0% (6)Energy (Power/Oil/Gas) 85.7% (7)
Oil/Gas - (1)Power - (0)
Engineering/Manufacturing 86.4% (22)Industrial Machinery/Equipment 83.3% (6)Building Materials - (0)Textiles/Apparel Manufacturing - (0)Rubber/Plastics/Glass - (0)
Forest & Paper Products/Packaging 100.0% (3)Life Sciences 87.5% (8)
Animal Health - (0)CRO - (0)Pharmaceutical 75.0% (4)Medical Devices - (1)
Metals - (1)Mining/Milling/Smelting - (2)Other Manufacturing 65.4% (26)
All Manufacturing 74.5% (161)
Percent ofOrganizations
China Salary Planning Report 2012-2013 19

Pay and PerformancePrevalence of Variable Pay by Industry
Percent ofOrganizations
ServicesBanking/Finance 100.0% (9)
Banks - (0)Insurance - Life & Health - (0)Insurance - Property & Casualty - (0)Insurance - Other - (1)Funds/Asset Management - (0)Investment Banks - (0)Securities - (0)Other Financial Services - (2)
Construction/Engineering 66.7% (6)Education Services - (1)Engineering Design 50.0% (4)Entertainment/Communications/Publication - (1)
Media - (0)Printing/Publishing - (0)
Government - (1)Health Care/Medical Services 71.4% (14)Hi - Tech 73.3% (45)
Business/Computer Services - (1)Computers and Related Products (Software and Hardware) 50.0% (4)Application Services/Consulting - (1)Semiconductors 60.0% (5)
Hospitality/Restaurants/ Travel - (2)Infrastructure - (0)ITeS (IT Enabled Services) - (1)
BFSI Captives - (0)KPO/Analytics - (0)Other Captives - (0)Third Party Service Providers - (0)
Not-for-Profit (not Hospitals/Schools) - (2)Professional Services - (2)
Advertising and PR - (0)Accounting - (0)Consulting - (0)Legal - (0)
Real Estate - (2)Research/Development - (0)Retail (incl. Wholesale & Distribution) 80.0% (15)Telecommunications 100.0% (6)
Mobile Service Providers - (1)Other Telecommunication Services - (2)
Transportation/ Logistics/ Shipping Services 75.0% (12)Other Service 72.7% (11)
All Services 73.1% (134)
All Companies 73.9% (295)
China Salary Planning Report 2012-2013 20
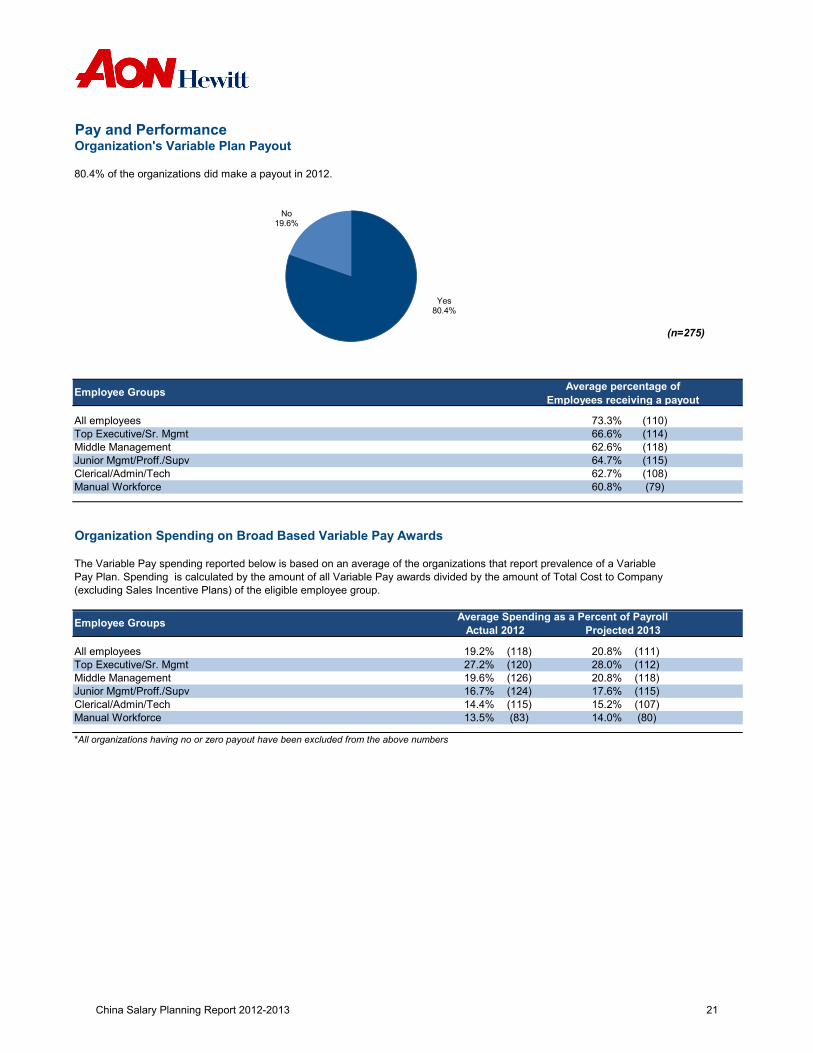
Pay and PerformanceOrganization's Variable Plan Payout
80.4% of the organizations did make a payout in 2012.
All employeesTop Executive/Sr. MgmtMiddle ManagementJunior Mgmt/Proff./SupvClerical/Admin/TechManual Workforce
Organization Spending on Broad Based Variable Pay Awards
The Variable Pay spending reported below is based on an average of the organizations that report prevalence of a Variable Pay Plan. Spending is calculated by the amount of all Variable Pay awards divided by the amount of Total Cost to Company(excluding Sales Incentive Plans) of the eligible employee group.
64.7%62.7%
66.6%62.6%
Employee Groups
73.3%
(n=275)
Average percentage of Employees receiving a payout
60.8%
(110)(114)(118)(115)(108)(79)
Yes80.4%
No19.6%
Average Spending as a Percent of Payroll
All employeesTop Executive/Sr. MgmtMiddle ManagementJunior Mgmt/Proff./SupvClerical/Admin/TechManual Workforce
*All organizations having no or zero payout have been excluded from the above numbers
19.2% (118)27.2% (120)
Actual 2012
19.6% (126)16.7% (124)14.4% (115)
14.0%
17.6%15.2%
13.5% (83)
20.8% (111)28.0% (112)20.8% (118)
(115)(107)(80)
Employee Groups Projected 2013
China Salary Planning Report 2012-2013 21
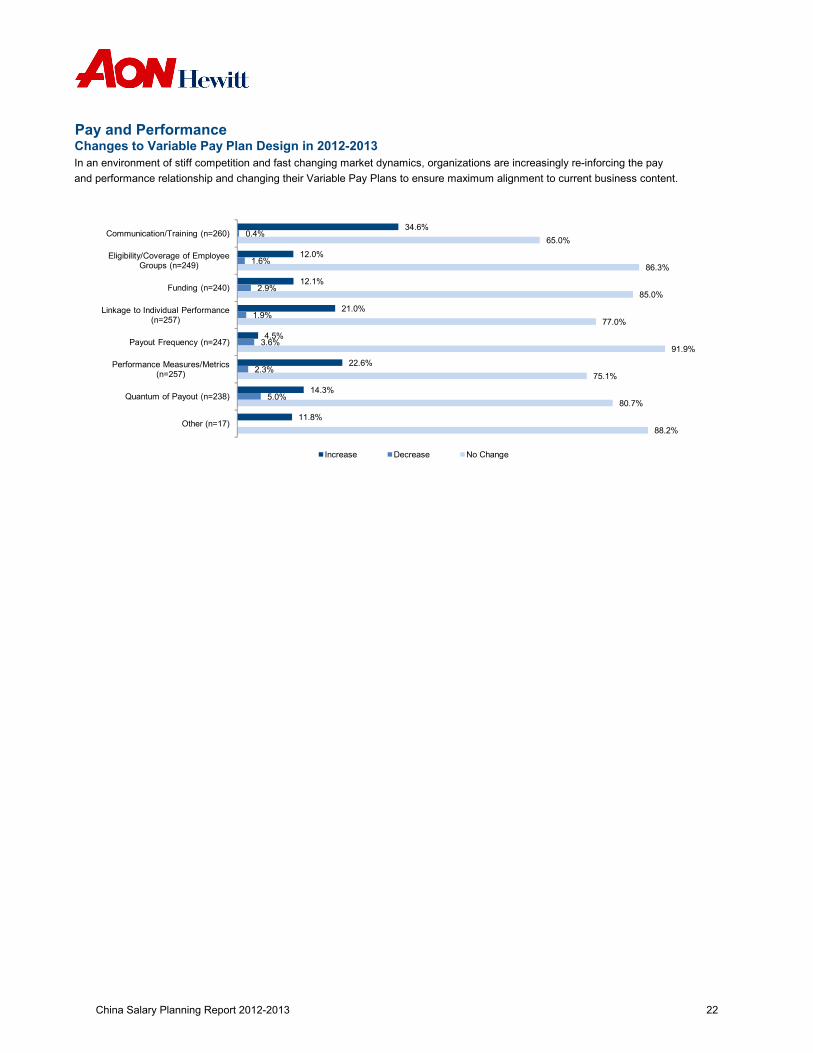
Pay and PerformanceChanges to Variable Pay Plan Design in 2012-2013In an environment of stiff competition and fast changing market dynamics, organizations are increasingly re-inforcing the payand performance relationship and changing their Variable Pay Plans to ensure maximum alignment to current business content.
34.6%
12.0%
12.1%
21.0%
4.5%
22.6%
14.3%
11.8%
0.4%
1.6%
2.9%
1.9%
3.6%
2.3%
5.0%
65.0%
86.3%
85.0%
77.0%
91.9%
75.1%
80.7%
88.2%
Communication/Training (n=260)
Eligibility/Coverage of Employee Groups (n=249)
Funding (n=240)
Linkage to Individual Performance (n=257)
Payout Frequency (n=247)
Performance Measures/Metrics (n=257)
Quantum of Payout (n=238)
Other (n=17)
Increase Decrease No Change
China Salary Planning Report 2012-2013 22
Pay and PerformanceLong-Term Incentives
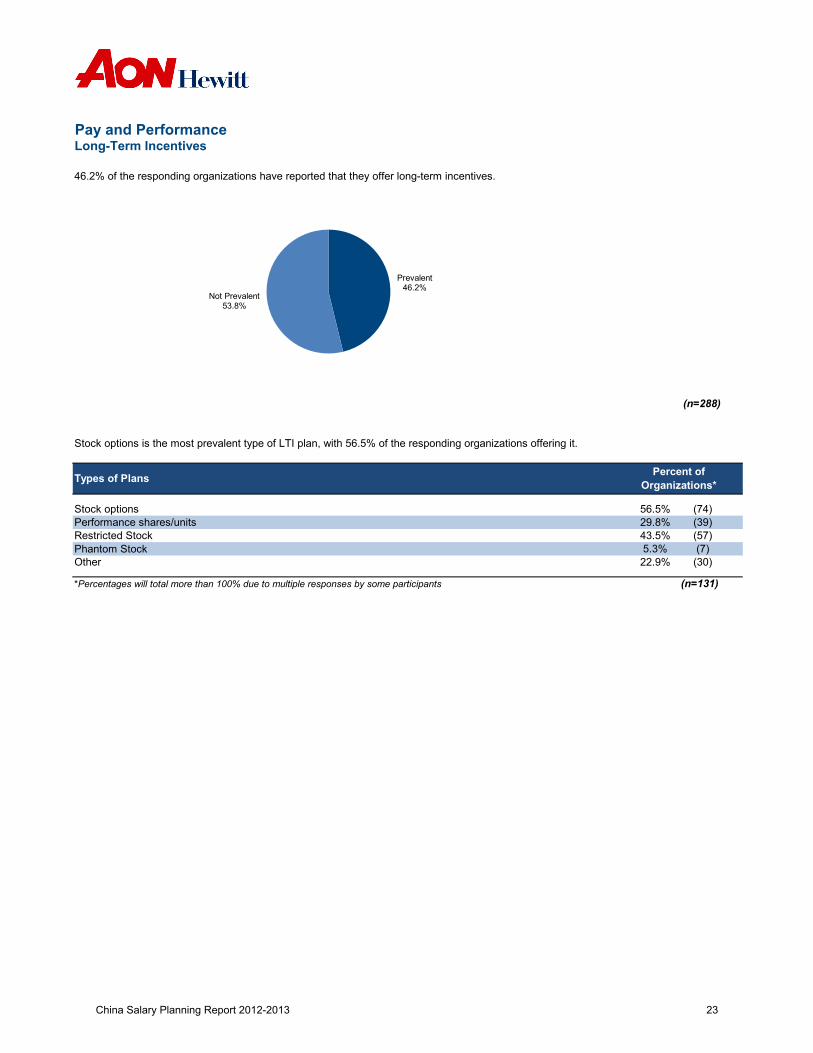
46.2% of the responding organizations have reported that they offer long-term incentives.
Stock options is the most prevalent type of LTI plan, with 56.5% of the responding organizations offering it.
Stock optionsPerformance shares/unitsRestricted StockPhantom StockOther
*Percentages will total more than 100% due to multiple responses by some participants (n=131)
(74)(39)(57)
Types of Plans Percent of Organizations*
56.5%
(n=288)
5.3%22.9%
(7)(30)
29.8%43.5%
Prevalent46.2%
Not Prevalent53.8%
China Salary Planning Report 2012-2013 23
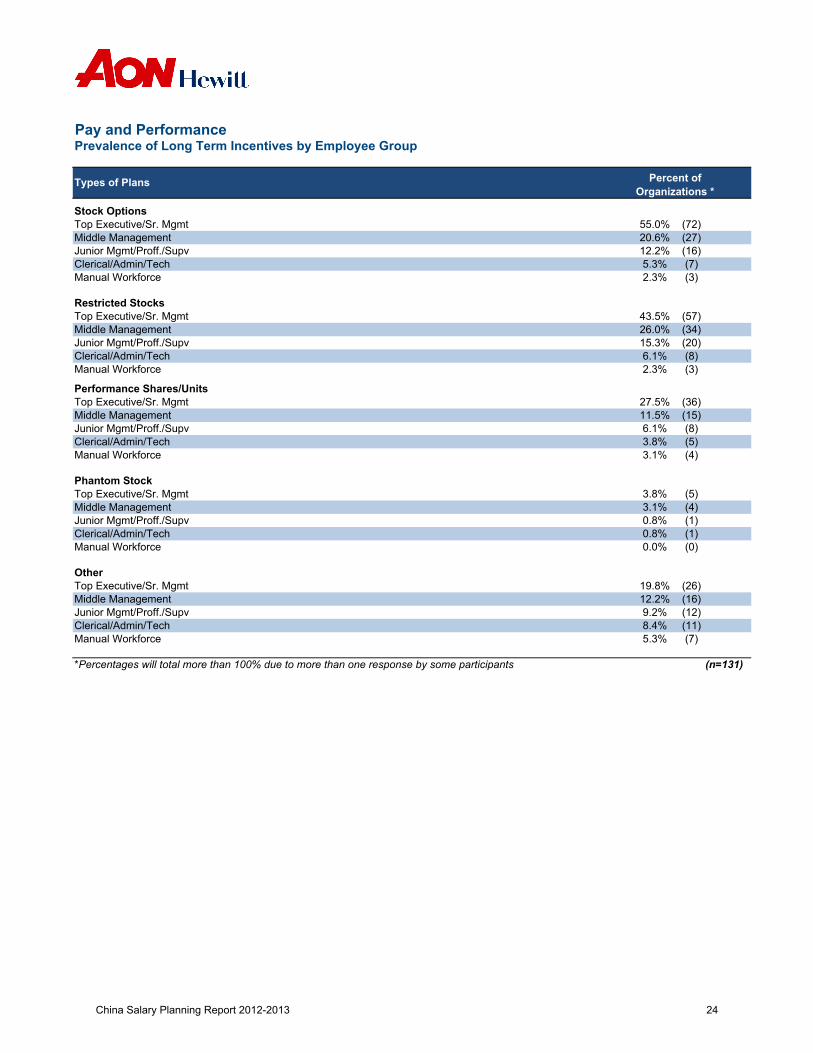
Pay and PerformancePrevalence of Long Term Incentives by Employee Group
Stock OptionsTop Executive/Sr. Mgmt (72)Middle Management (27)Junior Mgmt/Proff./Supv (16)Clerical/Admin/Tech (7)Manual Workforce (3)
Restricted StocksTop Executive/Sr. Mgmt (57)Middle Management (34)Junior Mgmt/Proff./Supv (20)Clerical/Admin/Tech (8)Manual Workforce (3)
Performance Shares/UnitsTop Executive/Sr. Mgmt (36)Middle Management (15)Junior Mgmt/Proff./Supv (8)Clerical/Admin/Tech (5)Manual Workforce (4)
Phantom StockTop Executive/Sr. Mgmt (5)Middle Management (4)Junior Mgmt/Proff./Supv (1)Clerical/Admin/Tech (1)Manual Workforce (0)
OtherTop Executive/Sr. Mgmt (26)Middle Management (16)Junior Mgmt/Proff./Supv (12)Clerical/Admin/Tech (11)Manual Workforce (7)
*Percentages will total more than 100% due to more than one response by some participants (n=131)
11.5%6.1%3.8%3.1%
3.8%3.1%0.8%0.8%0.0%
19.8%12.2%9.2%8.4%5.3%
Types of Plans Percent of Organizations *
55.0%
2.3%
27.5%
20.6%12.2%5.3%2.3%
43.5%26.0%15.3%6.1%
China Salary Planning Report 2012-2013 24
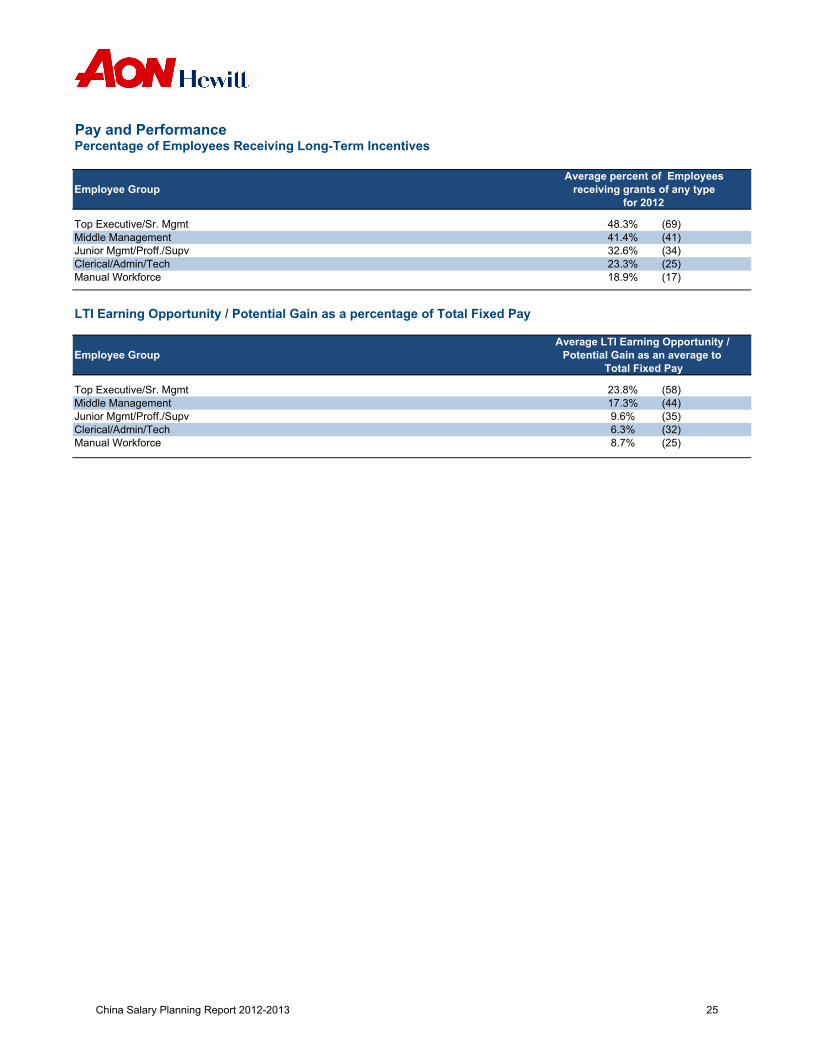
Pay and PerformancePercentage of Employees Receiving Long-Term Incentives
Employee Group
Top Executive/Sr. Mgmt (69)Middle Management (41)Junior Mgmt/Proff./Supv (34)Clerical/Admin/Tech (25)Manual Workforce (17)
LTI Earning Opportunity / Potential Gain as a percentage of Total Fixed Pay
Employee Group
Top Executive/Sr. Mgmt (58)Middle Management (44)Junior Mgmt/Proff./Supv (35)Clerical/Admin/Tech (32)Manual Workforce (25)
41.4%
Average percent of Employeesreceiving grants of any type
for 2012
48.3%
32.6%23.3%18.9%
Average LTI Earning Opportunity / Potential Gain as an average to
Total Fixed Pay
17.3%9.6%6.3%8.7%
23.8%
China Salary Planning Report 2012-2013 25
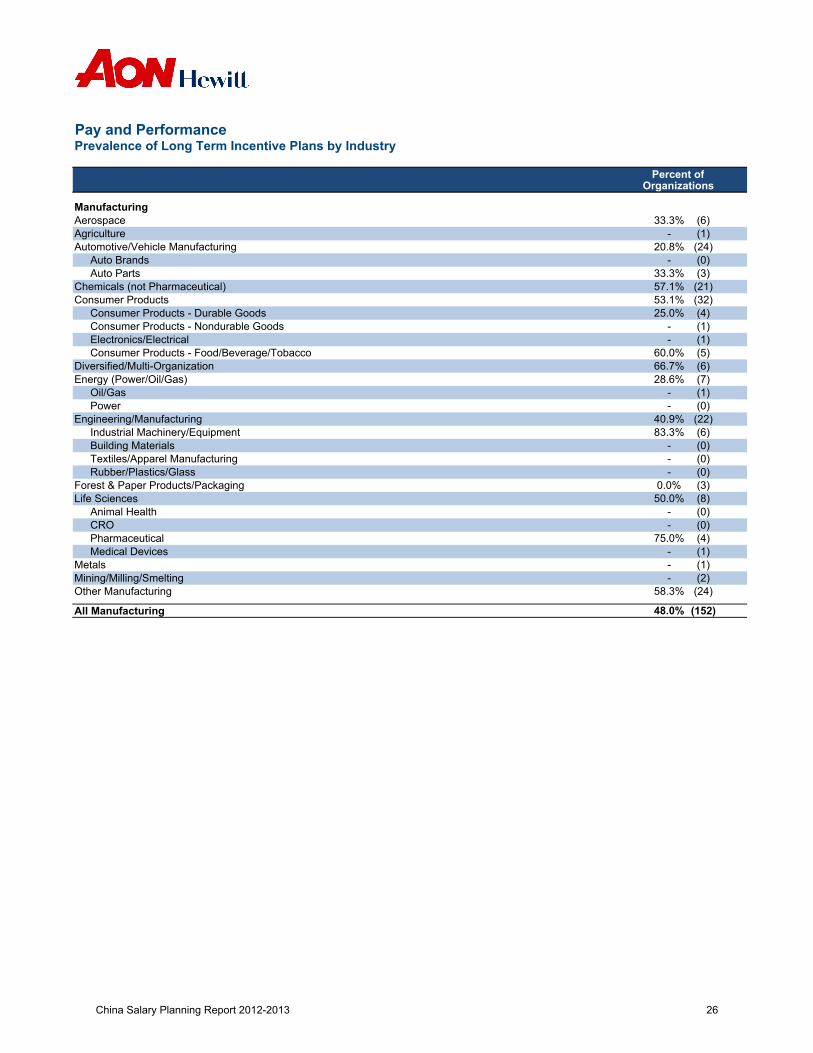
Pay and PerformancePrevalence of Long Term Incentive Plans by Industry
ManufacturingAerospace (6)Agriculture (1)Automotive/Vehicle Manufacturing (24)
Auto Brands (0)Auto Parts (3)
Chemicals (not Pharmaceutical) (21)Consumer Products (32)
Consumer Products - Durable Goods (4)Consumer Products - Nondurable Goods (1)Electronics/Electrical (1)Consumer Products - Food/Beverage/Tobacco (5)
Diversified/Multi-Organization (6)Energy (Power/Oil/Gas) (7)
Oil/Gas (1)Power (0)
Engineering/Manufacturing (22)Industrial Machinery/Equipment (6)Building Materials (0)Textiles/Apparel Manufacturing (0)Rubber/Plastics/Glass (0)
Forest & Paper Products/Packaging (3)Life Sciences (8)
Animal Health (0)CRO (0)Pharmaceutical (4)Medical Devices (1)
Metals (1)Mining/Milling/Smelting (2)Other Manufacturing (24)
All Manufacturing (152)
-33.3%
-20.8%
57.1%33.3%
25.0%53.1%
--
66.7%60.0%
-28.6%
40.9%-
-83.3%
50.0%-
-0.0%
-
-
-
-
-58.3%
75.0%
48.0%
Percent ofOrganizations
China Salary Planning Report 2012-2013 26
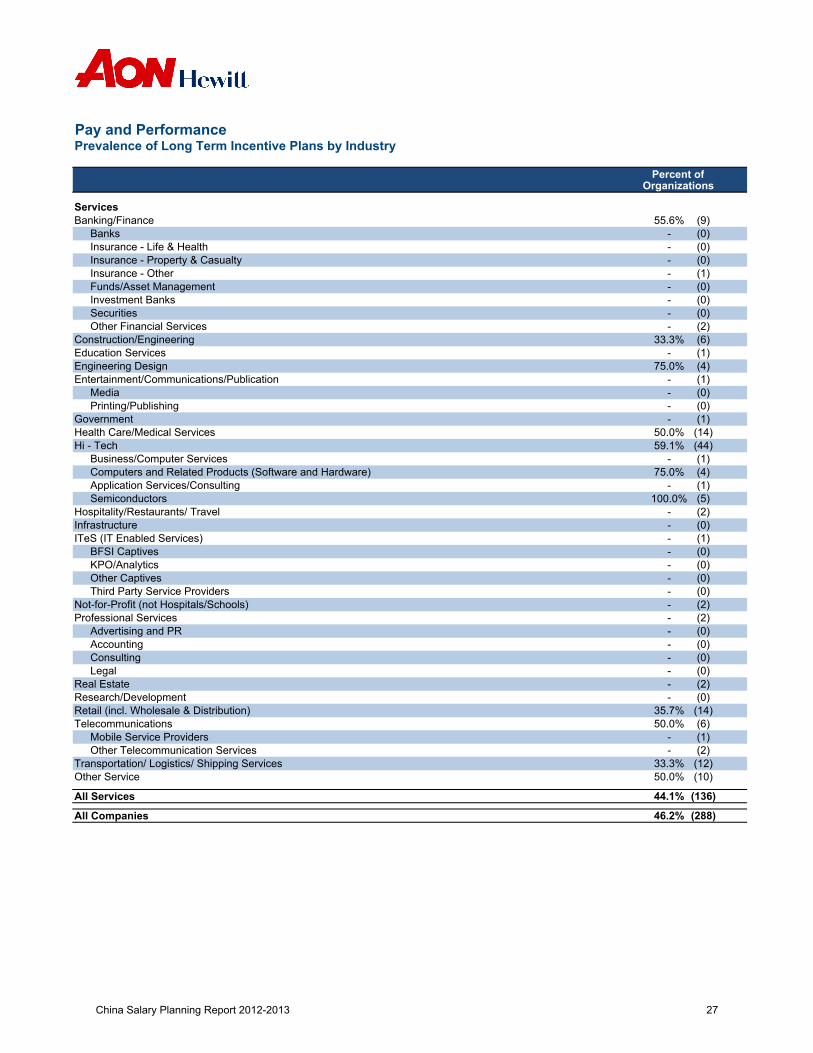
Pay and PerformancePrevalence of Long Term Incentive Plans by Industry
Percent ofOrganizations
ServicesBanking/Finance (9)
Banks (0)Insurance - Life & Health (0)Insurance - Property & Casualty (0)Insurance - Other (1)Funds/Asset Management (0)Investment Banks (0)Securities (0)Other Financial Services (2)
Construction/Engineering (6)Education Services (1)Engineering Design (4)Entertainment/Communications/Publication (1)
Media (0)Printing/Publishing (0)
Government (1)Health Care/Medical Services (14)Hi - Tech (44)
Business/Computer Services (1)Computers and Related Products (Software and Hardware) (4)Application Services/Consulting (1)Semiconductors (5)
Hospitality/Restaurants/ Travel (2)Infrastructure (0)ITeS (IT Enabled Services) (1)
BFSI Captives (0)KPO/Analytics (0)Other Captives (0)Third Party Service Providers (0)
Not-for-Profit (not Hospitals/Schools) (2)Professional Services (2)
Advertising and PR (0)Accounting (0)Consulting (0)Legal (0)
Real Estate (2)Research/Development (0)Retail (incl. Wholesale & Distribution) (14)Telecommunications (6)
Mobile Service Providers (1)Other Telecommunication Services (2)
Transportation/ Logistics/ Shipping Services (12)Other Service (10)
All Services (136)
All Companies (288)
-35.7%50.0%
--
33.3%50.0%
--
55.6%--
---
---
---
33.3%-
75.0%
-
-75.0%
-
-50.0%59.1%
46.2%
44.1%
-
-
-
--
-
-
---
100.0%-
China Salary Planning Report 2012-2013 27

Workforce Size
China Salary Planning Report 2012-2013 28
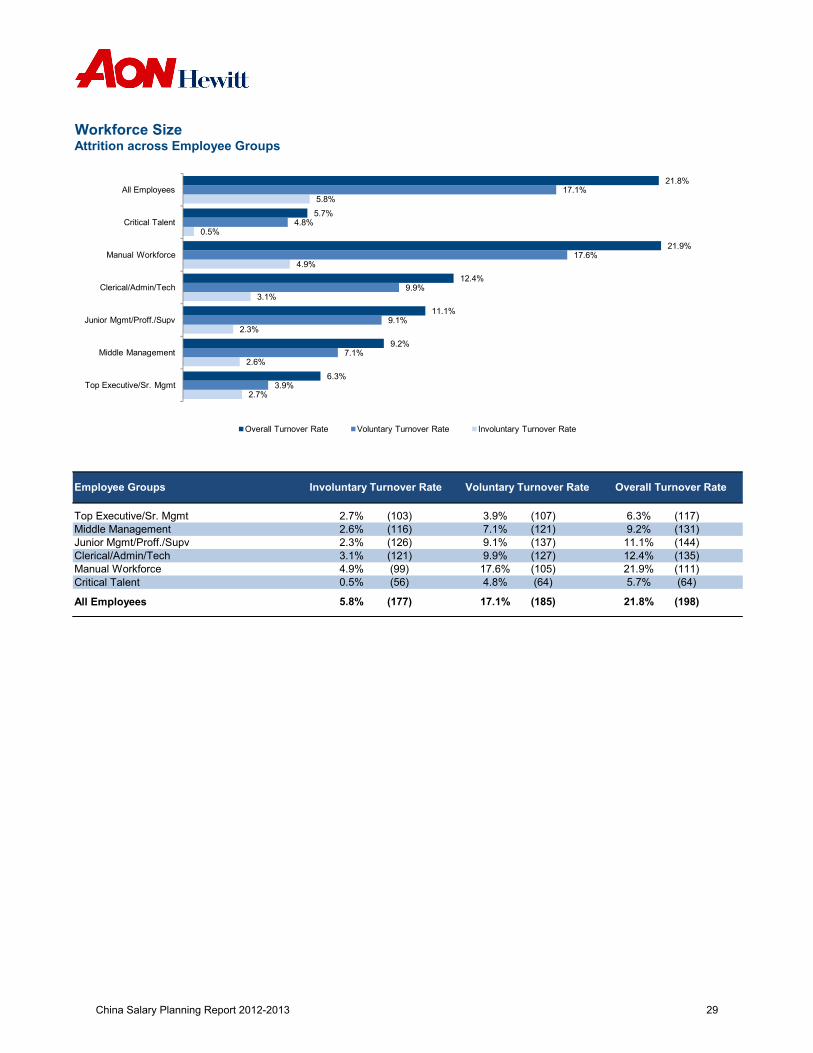
Workforce SizeAttrition across Employee Groups
Top Executive/Sr. MgmtMiddle ManagementJunior Mgmt/Proff./SupvClerical/Admin/TechManual WorkforceCritical Talent
All Employees
Employee Groups Involuntary Turnover Rate Voluntary Turnover Rate Overall Turnover Rate
(131)2.7% (103) 3.9% (107) 6.3% (117)2.6% (116) 7.1% (121) 9.2%
(135)2.3% (126) 9.1% (137) 11.1% (144)3.1% (121) 9.9% (127) 12.4%
(64)4.9% (99) 17.6% (105) 21.9% (111)0.5% (56) 4.8% (64) 5.7%
5.8% (177) 17.1% (185) 21.8% (198)
2.7%
2.6%
2.3%
3.1%
4.9%
0.5%
5.8%
3.9%
7.1%
9.1%
9.9%
17.6%
4.8%
17.1%
6.3%
9.2%
11.1%
12.4%
21.9%
5.7%
21.8%
Top Executive/Sr. Mgmt
Middle Management
Junior Mgmt/Proff./Supv
Clerical/Admin/Tech
Manual Workforce
Critical Talent
All Employees
Overall Turnover Rate Voluntary Turnover Rate Involuntary Turnover Rate
China Salary Planning Report 2012-2013 29
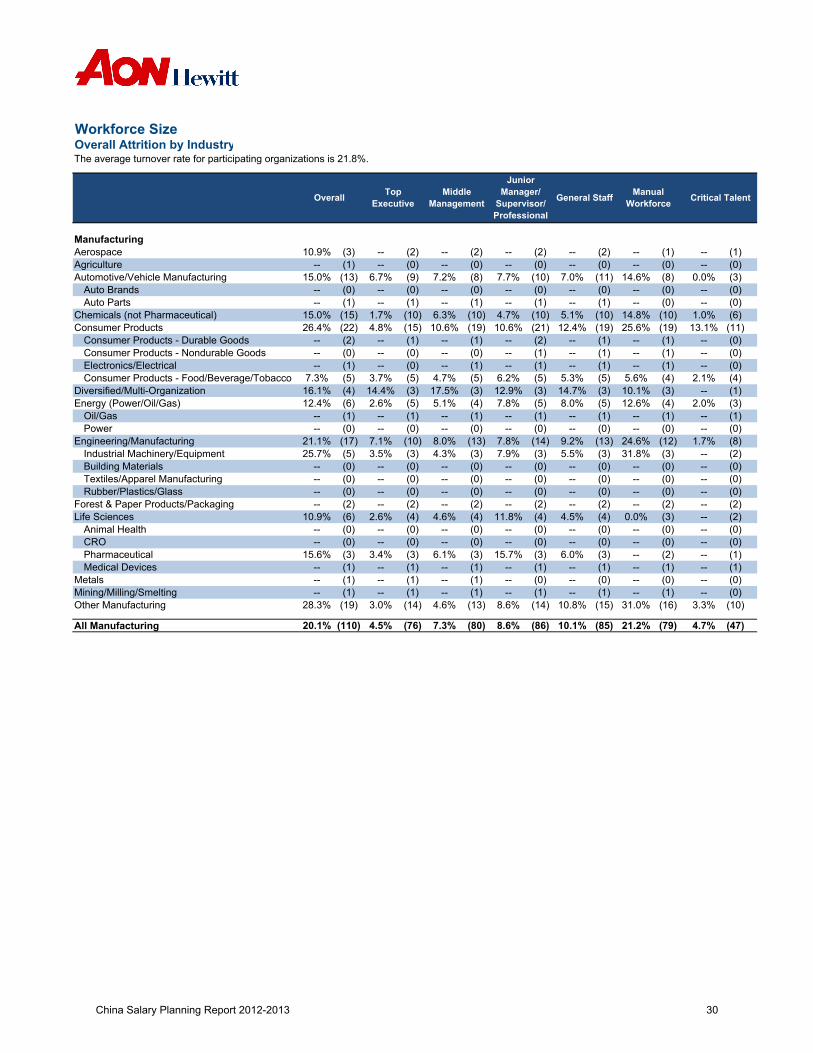
Workforce SizeOverall Attrition by IndustryThe average turnover rate for participating organizations is 21.8%.
ManufacturingAerospace -- (1)Agriculture -- (0)Automotive/Vehicle Manufacturing 0.0% (3)
Auto Brands -- (0)Auto Parts -- (0)
Chemicals (not Pharmaceutical) 1.0% (6)Consumer Products 13.1% (11)
Consumer Products - Durable Goods -- (0)Consumer Products - Nondurable Goods -- (0)Electronics/Electrical -- (0)Consumer Products - Food/Beverage/Tobacco 2.1% (4)
Diversified/Multi-Organization -- (1)Energy (Power/Oil/Gas) 2.0% (3)
Oil/Gas -- (1)Power -- (0)
Engineering/Manufacturing 1.7% (8)Industrial Machinery/Equipment -- (2)Building Materials -- (0)Textiles/Apparel Manufacturing -- (0)Rubber/Plastics/Glass -- (0)
Forest & Paper Products/Packaging -- (2)Life Sciences -- (2)
Animal Health -- (0)CRO -- (0)Pharmaceutical -- (1)Medical Devices -- (1)
Metals -- (0)Mining/Milling/Smelting -- (0)Other Manufacturing 3.3% (10)
All Manufacturing 4.7% (47)
Manual Workforce Critical TalentGeneral StaffOverall Top
ExecutiveMiddle
Management
Junior Manager/
Supervisor/Professional
-- (2) -- (2) -- (1)10.9% (3) -- (2) -- (2)-- (0) -- (0) -- (0)-- (1) -- (0) -- (0)
7.7% (10) 7.0% (11) 14.6% (8)15.0% (13) 6.7% (9) 7.2% (8)-- (0) -- (0) -- (0)-- (0) -- (0) -- (0)-- (1) -- (1) -- (0)-- (1) -- (1) -- (1)
4.7% (10) 5.1% (10) 14.8% (10)15.0% (15) 1.7% (10) 6.3% (10)10.6% (21) 12.4% (19) 25.6% (19)26.4% (22) 4.8% (15) 10.6% (19)
-- (2) -- (1) -- (1)-- (2) -- (1) -- (1)-- (1) -- (1) -- (1)-- (0) -- (0) -- (0)-- (1) -- (1) -- (1)-- (1) -- (0) -- (1)
6.2% (5) 5.3% (5) 5.6% (4)7.3% (5) 3.7% (5) 4.7% (5)12.9% (3) 14.7% (3) 10.1% (3)16.1% (4) 14.4% (3) 17.5% (3)7.8% (5) 8.0% (5) 12.6% (4)12.4% (6) 2.6% (5) 5.1% (4)
-- (1) -- (1) -- (1)-- (1) -- (1) -- (1)-- (0) -- (0) -- (0)-- (0) -- (0) -- (0)
7.8% (14) 9.2% (13) 24.6% (12)21.1% (17) 7.1% (10) 8.0% (13)7.9% (3) 5.5% (3) 31.8% (3)25.7% (5) 3.5% (3) 4.3% (3)
-- (0) -- (0) -- (0)-- (0) -- (0) -- (0)-- (0) -- (0) -- (0)-- (0) -- (0) -- (0)-- (0) -- (0) -- (0)-- (0) -- (0) -- (0)-- (2) -- (2) -- (2)-- (2) -- (2) -- (2)
11.8% (4) 4.5% (4) 0.0% (3)10.9% (6) 2.6% (4) 4.6% (4)-- (0) -- (0) -- (0)-- (0) -- (0) -- (0)-- (0) -- (0) -- (0)-- (0) -- (0) -- (0)
15.7% (3) 6.0% (3) -- (2)15.6% (3) 3.4% (3) 6.1% (3)-- (1) -- (1) -- (1)-- (1) -- (1) -- (1)-- (0) -- (0) -- (0)-- (1) -- (1) -- (1)-- (1) -- (1) -- (1)-- (1) -- (1) -- (1)
8.6% (14) 10.8% (15) 31.0% (16)28.3% (19) 3.0% (14) 4.6% (13)
8.6% (86) 10.1% (85) 21.2% (79)20.1% (110) 4.5% (76) 7.3% (80)
China Salary Planning Report 2012-2013 30
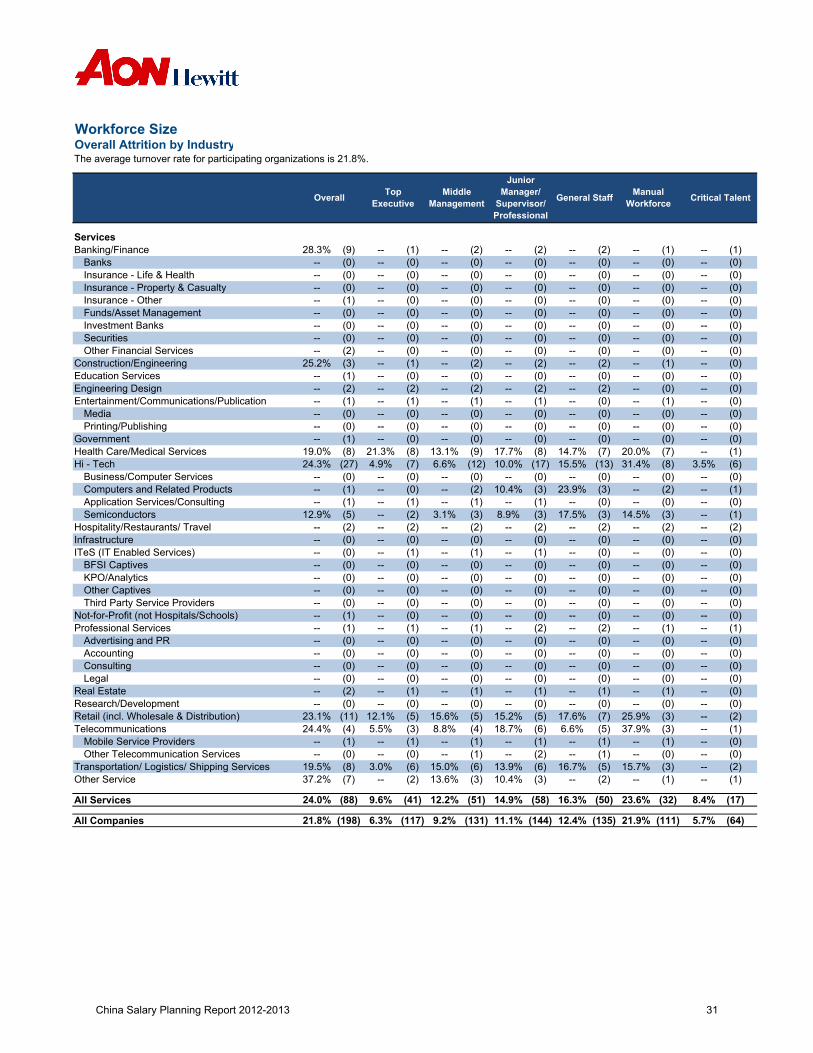
Workforce SizeOverall Attrition by IndustryThe average turnover rate for participating organizations is 21.8%.
Manual Workforce Critical TalentGeneral StaffOverall Top
ExecutiveMiddle
Management
Junior Manager/
Supervisor/Professional
ServicesBanking/Finance -- (1)
Banks -- (0)Insurance - Life & Health -- (0)Insurance - Property & Casualty -- (0)Insurance - Other -- (0)Funds/Asset Management -- (0)Investment Banks -- (0)Securities -- (0)Other Financial Services -- (0)
Construction/Engineering -- (0)Education Services -- (0)Engineering Design -- (0)Entertainment/Communications/Publication -- (0)
Media -- (0)Printing/Publishing -- (0)
Government -- (0)Health Care/Medical Services -- (1)Hi - Tech 3.5% (6)
Business/Computer Services -- (0)Computers and Related Products -- (1)Application Services/Consulting -- (0)Semiconductors -- (1)
Hospitality/Restaurants/ Travel -- (2)Infrastructure -- (0)ITeS (IT Enabled Services) -- (0)
BFSI Captives -- (0)KPO/Analytics -- (0)Other Captives -- (0)Third Party Service Providers -- (0)
Not-for-Profit (not Hospitals/Schools) -- (0)Professional Services -- (1)
Advertising and PR -- (0)Accounting -- (0)Consulting -- (0)Legal -- (0)
Real Estate -- (0)Research/Development -- (0)Retail (incl. Wholesale & Distribution) -- (2)Telecommunications -- (1)
Mobile Service Providers -- (0)Other Telecommunication Services -- (0)
Transportation/ Logistics/ Shipping Services -- (2)Other Service -- (1)
All Services 8.4% (17)
All Companies 5.7% (64)(111)
(2) -- (1)
24.0% (88) 9.6% (41) 12.2% (51) 14.9% (58) 16.3% (50) 23.6% (32)
37.2% (7) -- (2) 13.6% (3) 10.4% (3) --
(1) -- (0)19.5% (8) 3.0% (6) 15.0% (6) 13.9% (6) 16.7% (5) 15.7% (3)
-- (0) -- (0) -- (1) -- (2) --
(5) 37.9% (3)-- (1) -- (1) -- (1) -- (1) -- (1) -- (1)
24.4% (4) 5.5% (3) 8.8% (4) 18.7% (6) 6.6%
-- (0) -- (0) -- (0) -- (0) ---- (0) ---- (2) ---- (0) ---- (0)
(0) -- (0)
-- (2) -- (2) -- (1)28.3% (9) -- (1) -- (2)-- (0) -- (0) -- (0)-- (0) -- (0) -- (0)-- (0) -- (0) -- (0)-- (0) -- (0) -- (0)-- (0) -- (0) -- (0)-- (0) -- (0) -- (0)-- (0) -- (0) -- (0)-- (1) -- (0) -- (0)-- (0) -- (0) -- (0)-- (0) -- (0) -- (0)-- (0) -- (0) -- (0)-- (0) -- (0) -- (0)-- (0) -- (0) -- (0)-- (0) -- (0) -- (0)-- (0) -- (0) -- (0)-- (2) -- (0) -- (0)-- (2) -- (2) -- (1)25.2% (3) -- (1) -- (2)-- (0) -- (0) -- (0)-- (1) -- (0) -- (0)-- (2) -- (2) -- (0)-- (2) -- (2) -- (2)-- (1) -- (0) -- (1)-- (1) -- (1) -- (1)-- (0) -- (0) -- (0)-- (0) -- (0) -- (0)-- (0) -- (0) -- (0)-- (0) -- (0) -- (0)-- (0) -- (0) -- (0)-- (1) -- (0) -- (0)
17.7% (8) 14.7% (7) 20.0% (7)19.0% (8) 21.3% (8) 13.1% (9)10.0% (17) 15.5% (13) 31.4% (8)24.3% (27) 4.9% (7) 6.6% (12)
-- (0) -- (0) -- (0)-- (0) -- (0) -- (0)10.4% (3) 23.9% (3) -- (2)-- (1) -- (0) -- (2)
-- (1) -- (0) -- (0)-- (1) -- (1) -- (1)8.9% (3) 17.5% (3) 14.5% (3)12.9% (5) -- (2) 3.1% (3)
-- (2) -- (2) -- (2)-- (2) -- (2) -- (2)-- (0) -- (0) -- (0)-- (0) -- (0) -- (0)-- (1) -- (0) -- (0)-- (0) -- (1) -- (1)-- (0) -- (0) -- (0)-- (0) -- (0) -- (0)-- (0) -- (0) -- (0)-- (0) -- (0) -- (0)-- (0) -- (0) -- (0)-- (0) -- (0) -- (0)
(0) -- (0)-- (1) -- (0) -- (0)(2) -- (1)-- (1) -- (1) -- (1)(0) -- (0)-- (0) -- (0) -- (0)(0) -- (0)-- (0) -- (0) -- (0) --
-- (0) -- (0)-- (0) -- (0) -- (0) -- (0)-- (0) -- (0) -- (0)-- (0) -- (0) -- (0)-- (1) -- (1) -- (1)-- (2) -- (1) -- (1)-- (0) -- (0) -- (0)-- (0) -- (0) -- (0)
15.2% (5) 17.6% (7) 25.9% (3)23.1% (11) 12.1% (5) 15.6% (5)
21.8% 6.3% 9.2% 11.1% 12.4% 21.9%(198) (117) (131) (144) (135)
China Salary Planning Report 2012-2013 31

Workforce SizeReasons for Voluntary Attrition
Internal Equity of CompensationExternal Equity of CompensationBetter External OpportunityFurther StudiesRole StagnationUnder utilization of skillsLimited growth opportunitiesRelationship with managerWork life balanceLack of RecognitionPerformance AssessmentTrust/Confidence in LeadershipAnticipated company financial performance issuesOther
* Prevalence denotes the frequency of reason for attrition as cited by responding organizations, irrespective of rank. (n=234)
Key Retention Measures
Pay above market (Off cycle Market Adjustment or Merit Increases)Long-Term IncentivesShort-Term IncentivesImplemented/Increased Retention BonusInternational/Cross Functional MobilityAccelerated Career Development OpportunitiesImproved Work Life BalanceMore flexible work arrangementsTimely and meaningful feedback from managersLeadership accessibilityOther
* Prevalence denotes the frequency of retention measures cited by responding organizations, irrespective of rank. (n=234)
Key Attraction Measures
Competitive fixed compensationCompetitive variable compensation (eg. Bonus, stock awards etc)Competitive benefits and perquisites (eg. Pension, company car, time off)Work environment (eg. Leadership, culture, flexible work arrangements)Career development opportunitiesEmployer brandNo formal responseOther
* Prevalence denotes the frequency of attraction measures cited by responding organizations, irrespective of rank. (n=248)
1.2%
46.4%66.1%70.6%50.4%4.0%
35.9%26.9%41.0%35.9%1.3%
592541112
27.8%42.7%19.2%15.4%
26.5%18.4%59.4%
Reasons Prevalence
24.8%59.0%
Rank
8317
90.6%30.8%
Rank
131410
26
Measures Prevalence
54.7%
9.4%13.7%
12.8%
485
32.9%39.7%34.2%29.5%
19
Measures Prevalence Rank
570.2%48.0%
1
62.4%
731011
7
63248
China Salary Planning Report 2012-2013 32

Workforce SizeApproaches adopted for New Joinees during the Increment Process
65.4% of the participating organizations grant prorated increases to new-joinees, i.e. on the basis of the number of months served in the current performance year within the organization. In the current context, organizations are increasingly movingaway from granting anniversary increases to employees, primarily due to administrative difficulties.
(n=272)
Grant full increase in the current
performance year 23.9%
Grant prorated increase in the current performance year
depending on the no. of months served
65.4%
Grant increase on Anniversary
10.7%
China Salary Planning Report 2012-2013 33

Pay Delivery & Management
China Salary Planning Report 2012-2013 34

Pay Delivery & ManagementFactors Considered while making Budget Recommendations
Organization Performance is the most prevalent factor driving budget recommendations with 87.6% of the organisations citing this as a factor.
Factors
Organization PerformanceIndustry PerformanceCompetitive positioning with respect to the relevant marketPayroll Cost as a percentage to RevenueOther Employee Costs such as Training, Recruitment etc.Manpower ProductivityEmployee AttritionInflationOthers
*Percentages will total more than 100% due to multiple responses by some participants (n=299)
Factors Influencing Organization's Pay Decisions
Performance is the most prevalent factor driving pay decisions with 97.3% of the organisations citing this as an influence.
Factors
Knowledge & SkillInternal EquityPerformancePotentialScope & Size of Role Seniority of LevelAvailability of BudgetsMarket Competitiveness of PayOthers
Percent of Organizations*
87.6% (262)46.8% (140)79.6% (238)44.8% (134)19.1% (57)26.8% (80)39.8% (119)72.6% (217)4.7% (14)
Percent of Organizations*
51.7% (152)78.2% (230)97.3% (286)49.0% (144)
1.7% (5)
53.7% (158)32.3% (95)62.2% (183)85.7% (252)
*Percentages will total more than 100% due to multiple responses by some participants (n=294)
China Salary Planning Report 2012-2013 35

Pay Delivery & ManagementPay Ranges for Internal Pay Management Process We asked companies to identify the pay range they use for their internal pay management process
Methodologies Used to Determine Pay Increase
A majority of the organizations confirmed differentiating salary increases by performance rating and by the current positioning / compa-ratio of employees within the current pay range. This approach promotes a fine balance between external as well as internal parity.
(n=293)
Level Pay Ranges37.9%
Level Functional Pay Ranges
22.9%
Position Pay Ranges33.8%
No Pay Ranges5.5%
Performance Rating
Discretionary4.0%
Others2.0%
(n=298)
29.5%
Merit Matrix based on performance
and positioning/compa
ratio of the individual in the current range
64.4%
China Salary Planning Report 2012-2013 36

Pay Delivery & ManagementFrequency of Salary Increases
78.2% of responding organizations have a yearly frequency for Salary Increases.
AnnualMore than once a year
2 times a yearMore than 2 times a year
In cases where salary increases are provided more than once a year, 93.9% of 82 organizations reported that the increases are based on individual performance assessment.
Performance Rating Scale
Percentage ofOrganizations
(n=298)
1.0% (3)
78.2% (233)21.8% (65)6.7% (20)
No performance rating scale
4.4%3-point scale
9.8%
4-point scale10.8%
5-point scale60.9%
6-point scale5.1%
Others9.1%
(n=297)
China Salary Planning Report 2012-2013 37
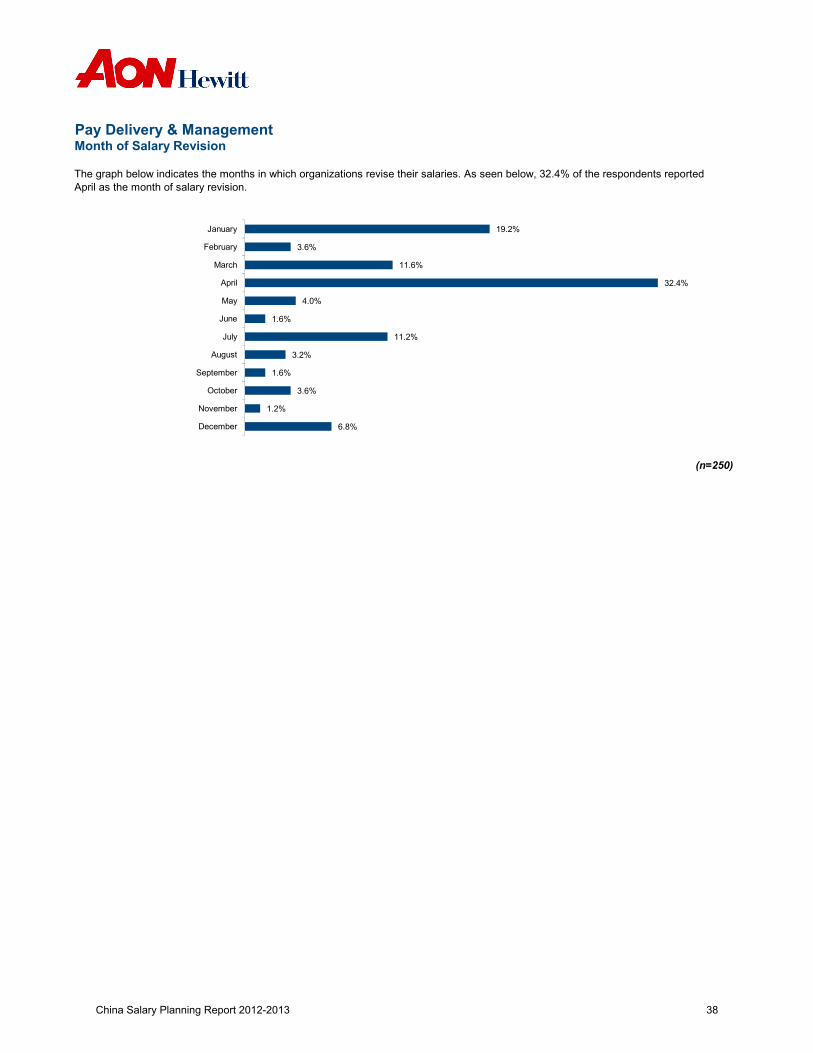
Pay Delivery & ManagementMonth of Salary Revision
The graph below indicates the months in which organizations revise their salaries. As seen below, 32.4% of the respondents reportedApril as the month of salary revision.
(n=250)
19.2%
3.6%
11.6%
32.4%
4.0%
1.6%
11.2%
3.2%
1.6%
3.6%
1.2%
6.8%
January
February
March
April
May
June
July
August
September
October
November
December
China Salary Planning Report 2012-2013 38
Pay Delivery & ManagementCommunication
Of the 294 responding organizations, 77.9% have formal salary ranges. Out of these, 47 organizations communicate theirsalary ranges to their employees, details of which are given in the table below.
Employees know their own salary range information only (48)Communicate all salary range information to all employees, excluding executive salary ranges (5)
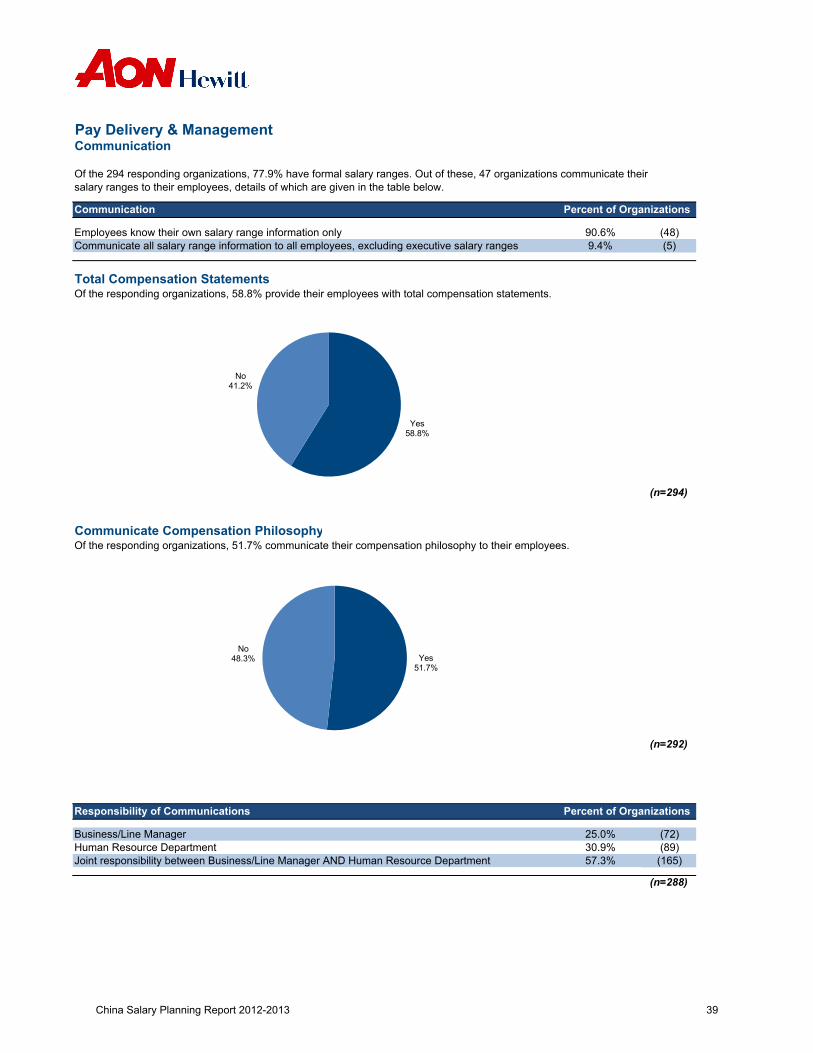
Total Compensation StatementsOf the responding organizations, 58.8% provide their employees with total compensation statements.
(n=294)
Communicate Compensation PhilosophyOf the responding organizations, 51.7% communicate their compensation philosophy to their employees.
Communication Percent of Organizations
90.6%9.4%
Yes58.8%
No41.2%
(n=292)
Business/Line Manager (72)Human Resource Department (89)Joint responsibility between Business/Line Manager AND Human Resource Department (165)
(n=288)
25.0%30.9%57.3%
Percent of OrganizationsResponsibility of Communications
Yes51.7%
No48.3%
China Salary Planning Report 2012-2013 39

Pay Delivery & ManagementCompensation and Other HR Budgets
Compensation/Payroll Cost as a percentage to Total Revenue and Total Operating Expense is a key productivity metric that is being increasingly tracked by all organizations as the focus of the Management Team is clearly on maximizingthe ROI on Compensation spends.
Metrics
Total Remuneration Budget as a % of Total RevenueTotal Remuneration Budget as a % of Total Operating ExpenseOther HR Budget as a % of Total RevenueOther HR Budget as a % of Total Operating Expenses 1.0% 3.0% 7.6% 10.0% (90)
10.0% 30.0% 31.9% 50.0% (103)0.5% 2.0% 6.2% 5.0% (97)
P25 P50 Avg. P75 (n)
6.9% 12.3% 20.0% 29.1% (124)
China Salary Planning Report 2012-2013 40
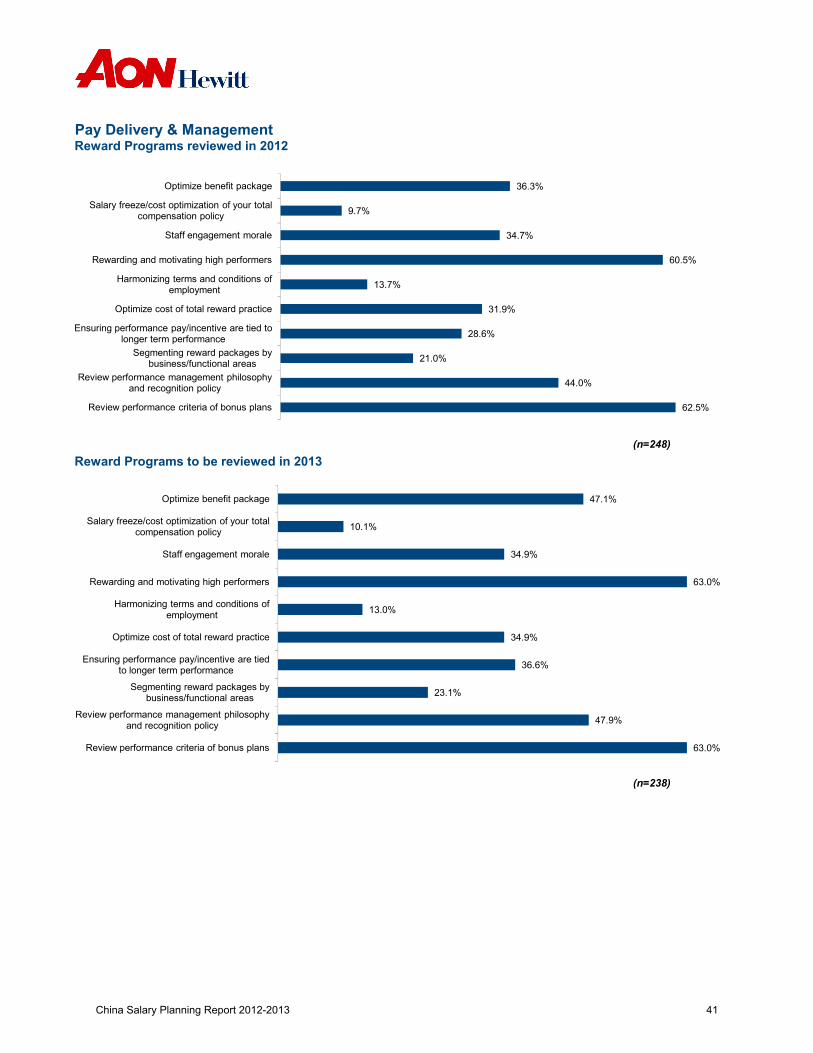
Pay Delivery & ManagementReward Programs reviewed in 2012
(n=248)Reward Programs to be reviewed in 2013
62.5%
44.0%
21.0%
28.6%
31.9%
13.7%
60.5%
34.7%
9.7%
36.3%
Review performance criteria of bonus plans
Review performance management philosophy and recognition policy
Segmenting reward packages by business/functional areas
Ensuring performance pay/incentive are tied to longer term performance
Optimize cost of total reward practice
Harmonizing terms and conditions of employment
Rewarding and motivating high performers
Staff engagement morale
Salary freeze/cost optimization of your total compensation policy
Optimize benefit package
13 0%
63.0%
34.9%
10.1%
47.1%
Harmonizing terms and conditions of l t
Rewarding and motivating high performers
Staff engagement morale
Salary freeze/cost optimization of your total compensation policy
Optimize benefit package
(n=238)
63.0%
47.9%
23.1%
36.6%
34.9%
13.0%
Review performance criteria of bonus plans
Review performance management philosophy and recognition policy
Segmenting reward packages by business/functional areas
Ensuring performance pay/incentive are tied to longer term performance
Optimize cost of total reward practice
employment
China Salary Planning Report 2012-2013 41

Pay Delivery & ManagementTop priorities concerning reward policies for the year 2013
(n=284)40.1%
46.1%
22.5%
47.2%
30.6%
18.0%
7.0%
10.9%
12.7%
15.8%
28.2%
26.8%
Job Evaluation/Job Leveling
Pay Structure
Pay review process
Performance management process
Employee bonus plans (e.g. profit sharing)
Salesforce effectiveness
Executive long-term incentives (e.g. executive stock options)
All employee long-term (share) incentive plans
Equal pay audit (pay equity)
Train managers on total reward strategy and compensation policy
Communicate on compensation and reward (e.g. individual statement)
Employee engagement
China Salary Planning Report 2012-2013 42

High Potentials and Top Performers
China Salary Planning Report 2012-2013 43
High Potentials and Top Performers
High Potentials—An elite group of employees who are seen as being capable of contributing to the organization in a role with greater complexity, impact, scope and scale than their current roles. They have the versatility to play a number of roles in the organization; demonstrate the ability to see things from new perspectives and to quickly adapt; would be difficult to replace due to the value that they bring to the organization; and consistently deliver strong results.
Top Performers—A group of employees who clearly and consistently demonstrate extraordinary and exceptional accomplishments in all major areas of responsibility. Performance of this caliber is rarely qualed by others who hold positions of comparable responsibility. A top performer is not automatically a High Potential.
Critical Talent/ Key Positions —Those positions that require specific knowledge and specialization. Would be difficult to replace them due to the value that they bring to the organization. Positions that support the core business, without them the operations are at risk and with them profitability and growth is achieved.
Low Performers— A group of employees who clearly and consistently demonstrate a performance under the minimum expectations in major areas of responsibility. Low performers could be either or both in terms of results or versus individual objectives or disruptive behaviors for the team or for the company efficiency and/or values.
Identification of High Potentials, Top and Low Performers and Key Positions67.1% of the responding organizations could identify their high potentials. 82.2% can identify their top performers.Low performers can be identified by 82.3% and 74.3% could identify key positions.
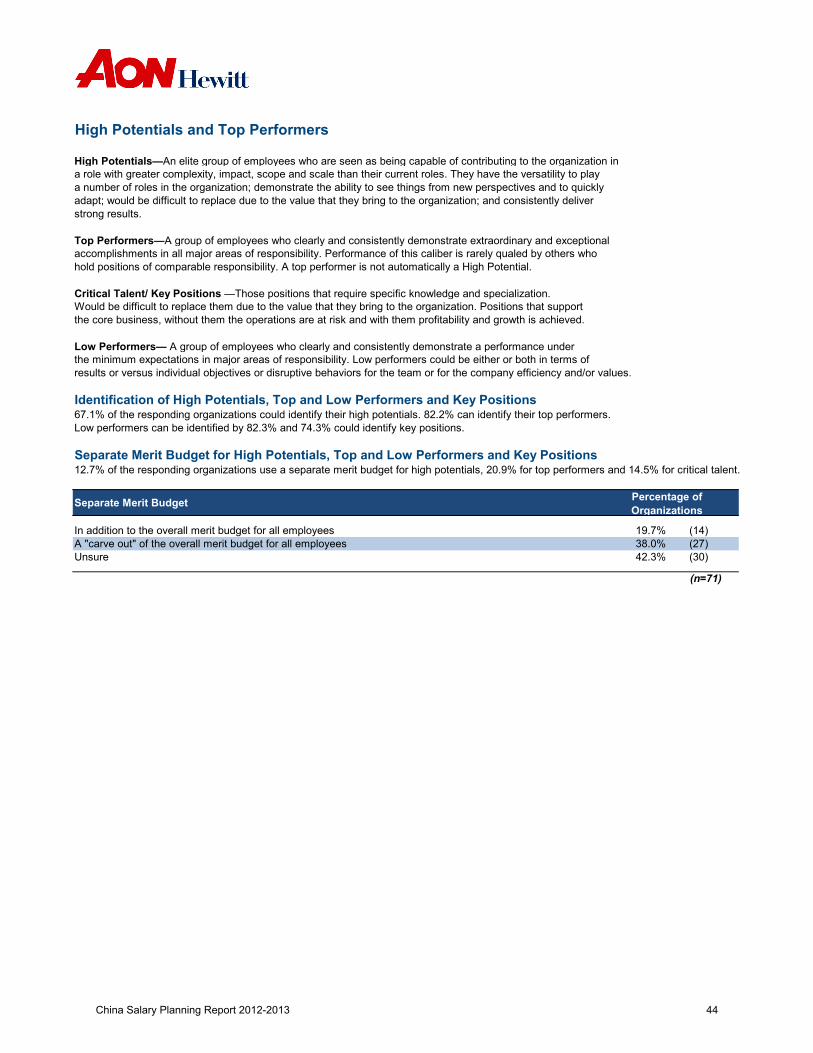
Separate Merit Budget for High Potentials, Top and Low Performers and Key Positions12.7% of the responding organizations use a separate merit budget for high potentials, 20.9% for top performers and 14.5% for critical talent.
Separate Merit Budget
In addition to the overall merit budget for all employeesA "carve out" of the overall merit budget for all employeesUnsure
(n=71)
Percentage of Organizations
19.7% (14)38.0% (27)42.3% (30)
China Salary Planning Report 2012-2013 44

High Potentials and Top PerformersPercentage of Overall Merit Budget allocated for High Potentials, Top Performers and Key Positions
Percentage of Overall Merit BudgetCount
Rewards with the Greatest Impact
Most participants indicated that merit increases and promotions and variable pay as well have the greatest ability to reward high potentials as well as top performers and key positions
Type of Reward
Merit increases to base salaryPromotions
Variable pay (bonus/incentive)Stock/Stock optionsUnsureOther
High Potentials Top Performers
(25)
(44)
High Potentials Key PositionsActual 2012 Projected 2013
Top Performers
(38) (37) (51) (47) (46)
High Potentials Top Performers
22.5% (51)
(n=224)
(12)(6)
(75)
Key Positions
17.0%33.5%
2.7%
12.1% (27)(38)
(41)
36.2% (85)
4.8% (11) 11.5% (27)Special recognition (cash, merchandise, travel)9.3% (21) 31.5% (74) 11.2%4.4% (10) 1.3% (3) 18.3%5.3% (12) 3.4% (8) 5.4%
(n=227)
1.3% (3) 1.3% (3)
(n=235)
12.9% 12.3% 12.3% 12.6% 11.5% 11.9%
Actual 2012 Projected 2013 Actual 2012 Projected 2013
52.4% (119) 14.9% (35)
Merit increases to base salary
Variable pay (bonus/incentive
)
Stock/Stock options4.4%
Unsure5.3%
Other 1.3%
Merit Variable pay (bonus/incent
Stock/Stock options1.3%
Unsure3.4% Other
1.3%
Key Positions
22.5%
Promotions52.4%
Special recognition
(cash, merchandise,
travel)4.8%
)9.3% increases to
base salary36.2%
Promotions14.9%
Special recognition
(cash, merchandise,
travel)11.5%
ive)31.5%
Merit increases to base salary33.5%
Promotions17.0%Special recognition (cash,
merchandise, travel)12.1%
Variable pay (bonus/incentive)
11.2%
Stock/Stock options18.3%
Unsure5.4%
Other 2.7%
China Salary Planning Report 2012-2013 45

High Potentials and Top PerformersMethods Used to Ensure Differential Pay
The methods used to differentiate pay increases for high potentials, top performers and/or key positions are shown in the table below.
Methods used (n) High Potentials Top Performers
(57) 12.3% (7) 43.9% (25)
14.4% (18) 69.6% (87)(125)
47.1% (40)
16.0% (20)
43.9% (25)
(85)
(53)(101) 24.8% (25) 22.8% (23) 52.5%
29.4% (25) 23.5% (20)
34.0% (16)
(45) 44.4% (20) 22.2% (10) 33.3% (15)
(47) 17.0% (8) 48.9% (23)
(10) 20.0% (2) 20.0% (2) 60.0% (6)
Key Positions
Mid-year/more frequent salary reviews for:
Merit matrix includes highest increases for:
Separate merit budget for:
Pay adjustments outside the merit process budget for :
Written guidance is given to managers around high differentiation for :
Managers receive training in differentiation in pay decisions for :
Other
China Salary Planning Report 2012-2013 46

Merit Increases by City
China Salary Planning Report 2012-2013 47

Merit Increases by CityBeijing
Top Executive/ Senior Management
2012 Averages Projected 2013 AveragesIncluding 0% Excluding 0% Including 0% Excluding 0%
Increases Increases Increases Increases1. By Manufacturing/Non ManufacturingManufacturing 6.2% (7) 6.2% (7) 5.7% (7) 6.6% (6)Multi-Industry - (0) - (0) - (0) - (0)Service 3.1% (10) - (4) 3.4% (10) - (4)All Companies 4.4% (17) 6.8% (11) 4.3% (17) 7.3% (10)
2. Business EntityA locally Owned Company - (2) - (0) - (2) - (0)Foreign Owned Company 5.1% (13) 6.7% (10) 5.0% (13) 7.2% (9)Joint Venture Company - (2) - (1) - (2) - (1)All Companies 4.4% (17) 6.8% (11) 4.3% (17) 7.3% (10)
Middle Management
2012 Averages Projected 2013 AveragesIncluding 0% Excluding 0% Including 0% Excluding 0%
Increases Increases Increases Increases1. By Manufacturing/Non ManufacturingManufacturing 6.1% (6) 6.1% (6) 5.8% (7) 6.8% (6)Multi-Industry - (0) - (0) - (0) - (0)Service - (4) - (3) 3.4% (10) - (4)All Companies 5.8% (10) 6.5% (9) 4.4% (17) 7.4% (10)
2. Business EntityA locally Owned Company - (0) - (0) - (2) - (0)Foreign Owned Company 5.6% (9) 6.3% (8) 5.1% (13) 7.3% (9)Joint Venture Company - (1) - (1) - (2) - (1)All Companies 5.8% (10) 6.5% (9) 4.4% (17) 7.4% (10)
China Salary Planning Report 2012-2013 48
Merit Increases by CityBeijing
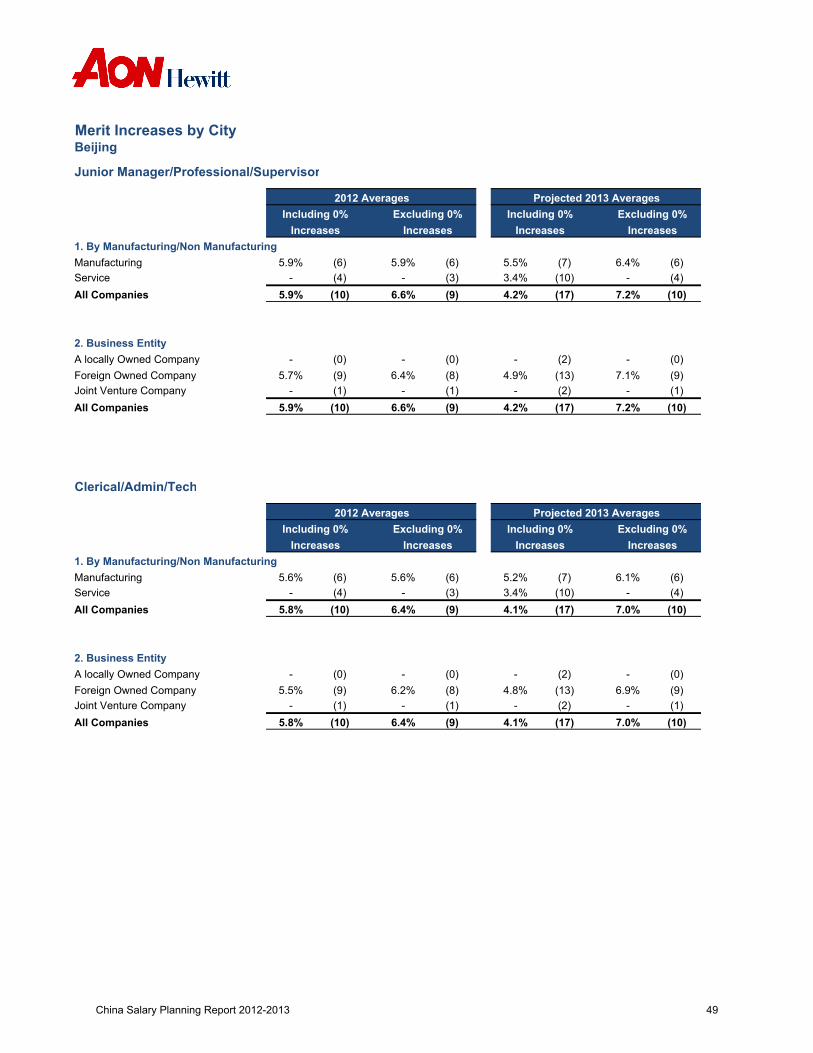
Junior Manager/Professional/Supervisor
2012 Averages Projected 2013 AveragesIncluding 0% Excluding 0% Including 0% Excluding 0%
Increases Increases Increases Increases1. By Manufacturing/Non ManufacturingManufacturing 5.9% (6) 5.9% (6) 5.5% (7) 6.4% (6)Service - (4) - (3) 3.4% (10) - (4)All Companies 5.9% (10) 6.6% (9) 4.2% (17) 7.2% (10)
2. Business EntityA locally Owned Company - (0) - (0) - (2) - (0)Foreign Owned Company 5.7% (9) 6.4% (8) 4.9% (13) 7.1% (9)Joint Venture Company - (1) - (1) - (2) - (1)All Companies 5.9% (10) 6.6% (9) 4.2% (17) 7.2% (10)
Clerical/Admin/Tech
2012 Averages Projected 2013 AveragesIncluding 0% Excluding 0% Including 0% Excluding 0%
Increases Increases Increases Increases1. By Manufacturing/Non ManufacturingManufacturing 5.6% (6) 5.6% (6) 5.2% (7) 6.1% (6)Service - (4) - (3) 3.4% (10) - (4)All Companies 5.8% (10) 6.4% (9) 4.1% (17) 7.0% (10)
2. Business EntityA locally Owned Company - (0) - (0) - (2) - (0)Foreign Owned Company 5.5% (9) 6.2% (8) 4.8% (13) 6.9% (9)Joint Venture Company - (1) - (1) - (2) - (1)All Companies 5.8% (10) 6.4% (9) 4.1% (17) 7.0% (10)
China Salary Planning Report 2012-2013 49

Merit Increases by CityBeijing
Manual Workforce
2012 Averages Projected 2013 AveragesIncluding 0% Excluding 0% Including 0% Excluding 0%
Increases Increases Increases Increases1. By Manufacturing/Non ManufacturingManufacturing 7.7% (6) 7.7% (6) 4.1% (5) - (4)Service 8.7% (5) 8.7% (5) 3.4% (10) - (4)All Companies 8.1% (11) 8.1% (11) 3.6% (15) 6.8% (8)
2. Business EntityA locally Owned Company - (1) - (1) - (2) - (0)Foreign Owned Company 8.7% (9) 8.7% (9) 4.2% (11) 6.6% (7)Joint Venture Company - (1) - (1) - (2) - (1)All Companies 8.1% (11) 8.1% (11) 3.6% (15) 6.8% (8)
China Salary Planning Report 2012-2013 50

Merit Increases by CityBeijing
Total Company
2012 Averages Projected 2013 AveragesIncluding 0% Excluding 0% Including 0% Excluding 0%
Increases Increases Increases Increases1. By Manufacturing/Non ManufacturingManufacturing 7.0% (7) 7.0% (7) 6.4% (6) 6.4% (6)Service 6.8% (5) - (4) - (4) - (4)All Companies 6.9% (12) 7.5% (11) 7.2% (10) 7.2% (10)
2. Business EntityA locally Owned Company - (0) - (0) - (0) - (0)Foreign Owned Company 6.8% (11) 7.5% (10) 7.1% (9) 7.1% (9)Joint Venture Company - (1) - (1) - (1) - (1)All Companies 6.9% (12) 7.5% (11) 7.2% (10) 7.2% (10)
China Salary Planning Report 2012-2013 51

Merit Increases by CityShanghai
Top Executive/ Senior Management
2012 Averages Projected 2013 AveragesIncluding 0% Excluding 0% Including 0% Excluding 0%
Increases Increases Increases Increases1. By Manufacturing/Non ManufacturingManufacturing 6.2% (10) 6.2% (10) 5.7% (10) 6.4% (9)Service 4.1% (10) 8.2% (5) 4.2% (10) 8.3% (5)All Companies 5.1% (20) 6.8% (15) 4.9% (20) 7.1% (14)
2. Business EntityA locally Owned Company - (4) - (3) - (4) - (3)Foreign Owned Company 5.0% (12) 6.7% (9) 4.7% (12) 7.1% (8)Joint Venture Company - (3) - (2) - (3) - (2)All Companies 5.1% (20) 6.8% (15) 4.9% (20) 7.1% (14)
Middle Management
2012 Averages Projected 2013 AveragesIncluding 0% Excluding 0% Including 0% Excluding 0%
Increases Increases Increases Increases1. By Manufacturing/Non ManufacturingManufacturing 5.9% (9) 5.9% (9) 5.7% (10) 6.4% (9)Service 6.2% (5) - (4) 4.3% (10) 8.5% (5)All Companies 6.0% (14) 6.5% (13) 5.0% (20) 7.1% (14)
2. Business EntityA locally Owned Company - (3) - (3) - (4) - (3)Foreign Owned Company 5.3% (8) 6.1% (7) 4.7% (12) 7.1% (8)Joint Venture Company - (2) - (2) - (3) - (2)All Companies 6.0% (14) 6.5% (13) 5.0% (20) 7.1% (14)
China Salary Planning Report 2012-2013 52

Merit Increases by CityShanghai
Junior Manager/Professional/Supervisor
2012 Averages Projected 2013 AveragesIncluding 0% Excluding 0% Including 0% Excluding 0%
Increases Increases Increases Increases1. By Manufacturing/Non ManufacturingManufacturing 5.9% (9) 5.9% (9) 5.7% (10) 6.4% (9)Service 6.6% (5) - (4) 4.5% (10) 8.9% (5)All Companies 6.1% (14) 6.6% (13) 5.1% (20) 7.3% (14)
2. Business EntityA locally Owned Company - (3) - (3) - (4) - (3)Foreign Owned Company 5.4% (8) 6.2% (7) 4.7% (12) 7.1% (8)Joint Venture Company - (2) - (2) - (3) - (2)All Companies 6.1% (14) 6.6% (13) 5.1% (20) 7.3% (14)
Clerical/Admin/Tech
2012 Averages Projected 2013 AveragesIncluding 0% Excluding 0% Including 0% Excluding 0%
Increases Increases Increases Increases1. By Manufacturing/Non ManufacturingManufacturing 6.1% (9) 6.1% (9) 5.7% (10) 6.4% (9)Service 6.6% (5) - (4) 4.5% (10) 8.9% (5)All Companies 6.3% (14) 6.8% (13) 5.1% (20) 7.3% (14)
2. Business EntityA locally Owned Company - (3) - (3) - (4) - (3)Foreign Owned Company 5.4% (8) 6.2% (7) 4.7% (12) 7.1% (8)Joint Venture Company - (2) - (2) - (3) - (2)All Companies 6.3% (14) 6.8% (13) 5.1% (20) 7.3% (14)
China Salary Planning Report 2012-2013 53
Merit Increases by CityShanghai
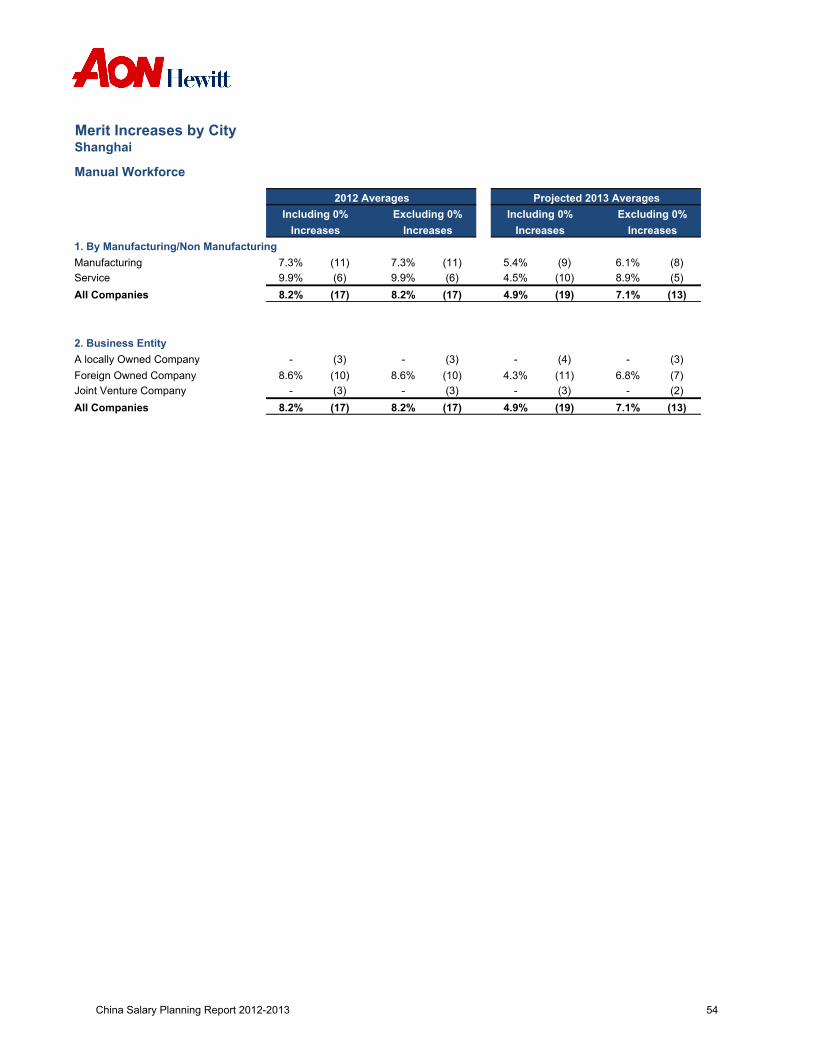
Manual Workforce
2012 Averages Projected 2013 AveragesIncluding 0% Excluding 0% Including 0% Excluding 0%
Increases Increases Increases Increases1. By Manufacturing/Non ManufacturingManufacturing 7.3% (11) 7.3% (11) 5.4% (9) 6.1% (8)Service 9.9% (6) 9.9% (6) 4.5% (10) 8.9% (5)All Companies 8.2% (17) 8.2% (17) 4.9% (19) 7.1% (13)
2. Business EntityA locally Owned Company - (3) - (3) - (4) - (3)Foreign Owned Company 8.6% (10) 8.6% (10) 4.3% (11) 6.8% (7)Joint Venture Company - (3) - (3) - (3) - (2)All Companies 8.2% (17) 8.2% (17) 4.9% (19) 7.1% (13)
China Salary Planning Report 2012-2013 54

Merit Increases by CityShanghai
Total Company
2012 Averages Projected 2013 AveragesIncluding 0% Excluding 0% Including 0% Excluding 0%
Increases Increases Increases Increases1. By Manufacturing/Non ManufacturingManufacturing 6.2% (11) 6.8% (10) 6.4% (9) 6.4% (9)Service 7.1% (6) 8.6% (5) 8.9% (5) 8.9% (5)All Companies 6.5% (17) 7.4% (15) 7.3% (14) 7.3% (14)
2. Business EntityA locally Owned Company - (3) - (3) - (3) - (3)Foreign Owned Company 6.1% (11) 7.4% (9) 7.1% (8) 7.1% (8)Joint Venture Company - (2) - (2) - (2) - (2)All Companies 6.5% (17) 7.4% (15) 7.3% (14) 7.3% (14)
China Salary Planning Report 2012-2013 55

Merit Increases by CityGuangzhou & Shenzhen
Top Executive/ Senior Management
2012 Averages Projected 2013 AveragesIncluding 0% Excluding 0% Including 0% Excluding 0%
Increases Increases Increases Increases1. By Manufacturing/Non ManufacturingManufacturing 3.7% (5) - (4) 4.3% (5) - (4)Service 4.0% (5) - (2) 4.0% (5) - (2)All Companies 3.8% (10) 6.4% (6) 4.2% (10) 6.9% (6)
2. Business EntityA locally Owned Company - (1) - (0) - (1) - (0)Foreign Owned Company 4.4% (7) 6.1% (5) 4.8% (7) 6.7% (5)Joint Venture Company - (2) - (1) - (2) - (1)All Companies 3.8% (10) 6.4% (6) 4.2% (10) 6.9% (6)
Middle Management
2012 Averages Projected 2013 AveragesIncluding 0% Excluding 0% Including 0% Excluding 0%
Increases Increases Increases Increases1. By Manufacturing/Non ManufacturingManufacturing 5.8% (5) 5.8% (5) 4.3% (5) - (4)Service - (2) - (1) 4.0% (5) - (2)All Companies 5.6% (7) 6.5% (6) 4.2% (10) 6.9% (6)
2. Business EntityA locally Owned Company - (0) - (0) - (1) - (0)Foreign Owned Company 5.2% (6) 6.2% (5) 4.8% (7) 6.7% (5)Joint Venture Company - (1) - (1) - (2) - (1)All Companies 5.6% (7) 6.5% (6) 4.2% (10) 6.9% (6)
China Salary Planning Report 2012-2013 56
Merit Increases by CityGuangzhou & Shenzhen
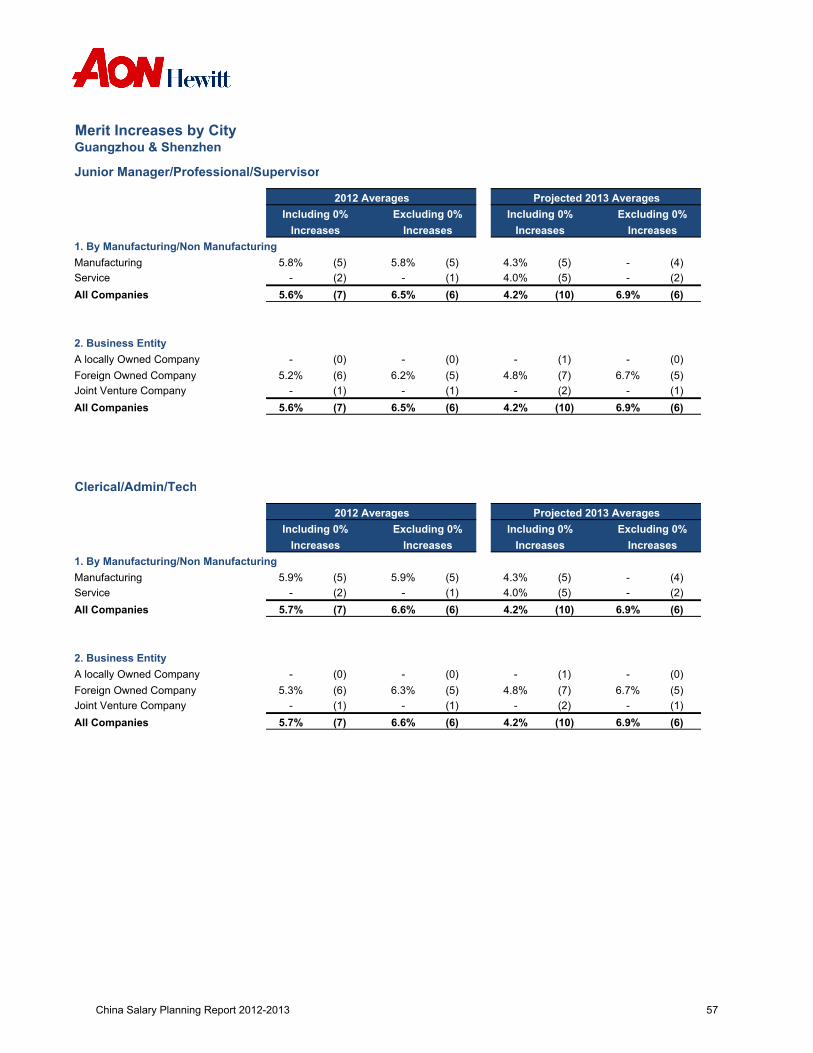
Junior Manager/Professional/Supervisor
2012 Averages Projected 2013 AveragesIncluding 0% Excluding 0% Including 0% Excluding 0%
Increases Increases Increases Increases1. By Manufacturing/Non ManufacturingManufacturing 5.8% (5) 5.8% (5) 4.3% (5) - (4)Service - (2) - (1) 4.0% (5) - (2)All Companies 5.6% (7) 6.5% (6) 4.2% (10) 6.9% (6)
2. Business EntityA locally Owned Company - (0) - (0) - (1) - (0)Foreign Owned Company 5.2% (6) 6.2% (5) 4.8% (7) 6.7% (5)Joint Venture Company - (1) - (1) - (2) - (1)All Companies 5.6% (7) 6.5% (6) 4.2% (10) 6.9% (6)
Clerical/Admin/Tech
2012 Averages Projected 2013 AveragesIncluding 0% Excluding 0% Including 0% Excluding 0%
Increases Increases Increases Increases1. By Manufacturing/Non ManufacturingManufacturing 5.9% (5) 5.9% (5) 4.3% (5) - (4)Service - (2) - (1) 4.0% (5) - (2)All Companies 5.7% (7) 6.6% (6) 4.2% (10) 6.9% (6)
2. Business EntityA locally Owned Company - (0) - (0) - (1) - (0)Foreign Owned Company 5.3% (6) 6.3% (5) 4.8% (7) 6.7% (5)Joint Venture Company - (1) - (1) - (2) - (1)All Companies 5.7% (7) 6.6% (6) 4.2% (10) 6.9% (6)
China Salary Planning Report 2012-2013 57

Merit Increases by CityGuangzhou & Shenzhen
Manual Workforce
2012 Averages Projected 2013 AveragesIncluding 0% Excluding 0% Including 0% Excluding 0%
Increases Increases Increases Increases1. By Manufacturing/Non ManufacturingManufacturing 7.5% (7) 7.5% (7) - (4) - (3)Service - (2) - (2) 4.0% (5) - (2)All Companies 7.6% (9) 7.6% (9) 3.6% (9) 6.5% (5)
2. Business EntityA locally Owned Company - (0) - (0) - (1) - (0)Foreign Owned Company 7.2% (7) 7.2% (7) 4.1% (6) - (4)Joint Venture Company - (2) - (2) - (2) - (1)All Companies 7.6% (9) 7.6% (9) 3.6% (9) 6.5% (5)
China Salary Planning Report 2012-2013 58

Merit Increases by CityGuangzhou & Shenzhen
Total Company
2012 Averages Projected 2013 AveragesIncluding 0% Excluding 0% Including 0% Excluding 0%
Increases Increases Increases Increases1. By Manufacturing/Non ManufacturingManufacturing 6.8% (5) 6.8% (5) 5.5% (5) 5.5% (5)Service - (3) - (2) - (2) - (2)All Companies 6.7% (8) 7.7% (7) 6.8% (7) 6.8% (7)
2. Business EntityA locally Owned Company - (0) - (0) - (0) - (0)Foreign Owned Company 6.6% (7) 7.7% (6) 6.6% (6) 6.6% (6)Joint Venture Company - (1) - (1) - (1) - (1)All Companies 6.7% (8) 7.7% (7) 6.8% (7) 6.8% (7)
China Salary Planning Report 2012-2013 59

City Differential
China Salary Planning Report 2012-2013 60

City Differential IndexNorth
Management Non Management SalesSenior Middle Overall Spvr./Sr. General Manual Overall Regional Area Sales OverallMgt. Mgt. Prof Prof Staff Mgr. Mgr. Rep.
BeijingNo. of companies 10 12 35 14 14 14 7 34 8 8 9 30Average 100 100 94 93 93 93 100 93 100 100 100 9725% ile 100 100 100 100 100 100 100 100 100 100 100 10050% ile 100 100 100 100 100 100 100 100 100 100 100 10075% ile 100 100 100 100 100 100 100 100 100 100 100 100Tianjin No. of companies 5 6 17 7 7 7 4 15 4 4 5 19Average 92 86 87 86 87 86 86 86 89 89 89 8625% ile 82 83 82 81 83 81 80 81 88 88 86 8150% ile 95 88 85 85 85 85 85 85 90 90 90 8575% ile 100 90 95 90 90 90 91 90 91 91 90 90Shijiazhuang No. of companies 2 3 7 3 3 3 2 7 3 3 3 8Average - - 86 - - - - 86 - - - 8425% ile - - 85 - - - - 85 - - - 8350% ile - - 85 - - - - 85 - - - 8575% ile - - 90 - - - - 88 - - - 86Harbin No. of companies 2 3 7 3 3 3 2 7 4 4 5 12Average - - 87 - - - - 86 86 86 86 8325% ile - - 85 - - - - 85 83 83 84 7550% ile - - 85 - - - - 85 88 88 85 8575% ile - - 92 - - - - 89 91 91 90 89Shenyang No. of companies 4 5 9 5 5 5 4 9 4 4 5 13Average 89 86 88 87 87 86 87 87 91 91 89 8625% ile 88 85 85 85 85 85 85 85 89 89 85 8350% ile 95 90 88 90 90 90 90 88 93 93 90 8575% ile 96 95 95 90 90 90 91 90 95 95 90 90Changchun No. of companies 2 3 8 3 3 3 0 8 3 3 3 11Average - - 88 - - - - 86 - - - 8125% ile - - 85 - - - - 85 - - - 7550% ile - - 86 - - - - 86 - - - 8575% ile - - 95 - - - - 87 - - - 88Jiamusi No. of companies 2 2 5 2 2 2 2 5 2 2 2 5Average - - 85 - - - - 84 - - - 8425% ile - - 81 - - - - 81 - - - 8150% ile - - 85 - - - - 85 - - - 8575% ile - - 90 - - - - 90 - - - 90
China Salary Planning Report 2012-2013 61

City Differential IndexNorth
Management Non Management SalesSenior Middle Overall Spvr./Sr. General Manual Overall Regional Area Sales OverallMgt. Mgt. Prof Prof Staff Mgr. Mgr. Rep.
DalianNo. of companies 3 4 11 4 4 4 2 11 4 4 5 13Average - 88 88 88 88 88 - 86 88 88 87 8425% ile - 84 84 84 84 84 - 81 84 84 85 8050% ile - 88 85 88 88 88 - 85 88 88 85 8575% ile - 91 95 91 91 91 - 89 91 91 90 85QingdaoNo. of companies 5 6 10 7 7 7 3 9 5 5 6 13Average 88 84 85 73 73 73 - 85 85 85 85 8525% ile 82 83 83 79 78 77 - 82 82 82 83 8250% ile 95 85 85 85 85 85 - 85 85 85 85 8575% ile 100 89 85 88 88 88 - 85 90 90 89 85Jinan No. of companies 2 3 7 3 3 3 2 7 3 3 3 9Average - - 87 - - - - 86 - - - 8725% ile - - 85 - - - - 85 - - - 8550% ile - - 85 - - - - 85 - - - 8575% ile - - 91 - - - - 88 - - - 90YantaiNo. of companies 2 3 6 3 3 3 2 6 3 3 3 8Average - - 86 - - - - 85 - - - 8125% ile - - 81 - - - - 81 - - - 7850% ile - - 85 - - - - 85 - - - 8375% ile - - 89 - - - - 89 - - - 86XuzhouNo. of companies 2 0 7 3 3 3 2 7 3 3 3 7Average - - 85 - - - - 84 - - - 8425% ile - - 83 - - - - 83 - - - 8350% ile - - 85 - - - - 85 - - - 8575% ile - - 88 - - - - 88 - - - 88HuhehaoteNo. of companies 2 3 7 3 3 3 2 7 3 3 3 8Average - - 86 - - - - 85 - - - 8425% ile - - 84 - - - - 84 - - - 8150% ile - - 85 - - - - 85 - - - 8575% ile - - 90 - - - - 88 - - - 86LangfangNo. of companies 2 3 6 3 3 3 2 6 3 3 3 7Average - - 84 - - - - 83 - - - 7925% ile - - 80 - - - - 80 - - - 7850% ile - - 83 - - - - 83 - - - 8075% ile - - 89 - - - - 89 - - - 88
China Salary Planning Report 2012-2013 62
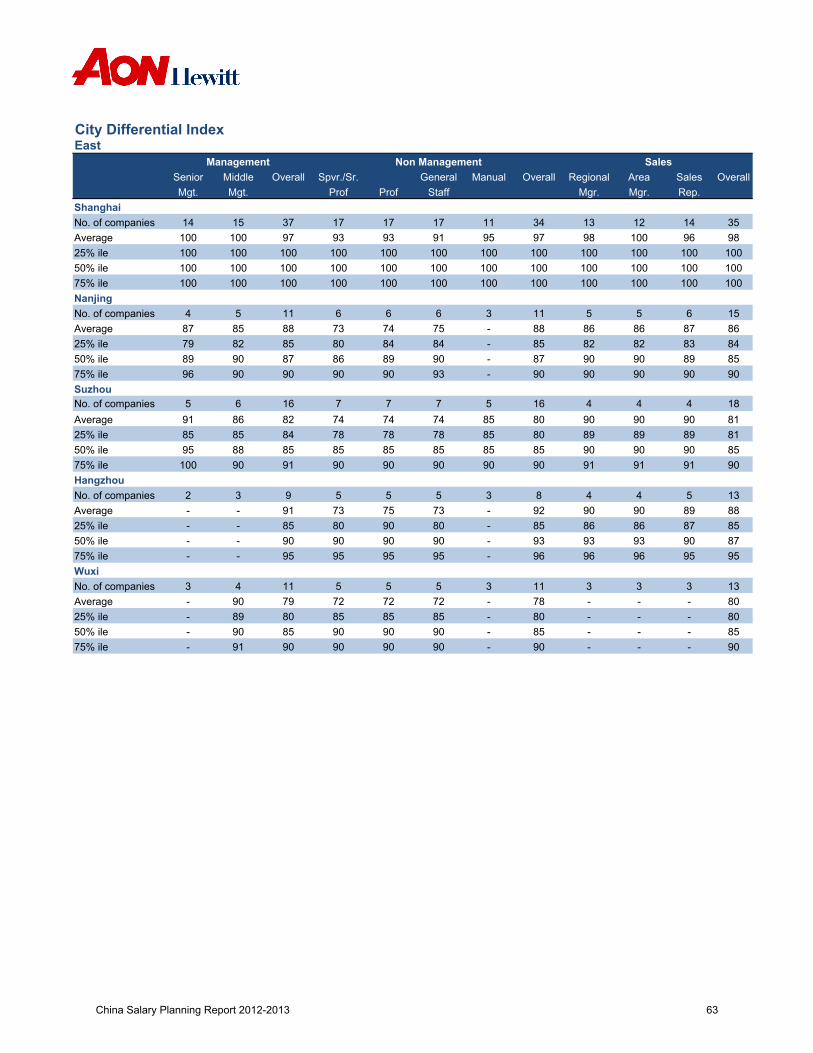
City Differential IndexEast
Management Non Management SalesSenior Middle Overall Spvr./Sr. General Manual Overall Regional Area Sales OverallMgt. Mgt. Prof Prof Staff Mgr. Mgr. Rep.
ShanghaiNo. of companies 14 15 37 17 17 17 11 34 13 12 14 35Average 100 100 97 93 93 91 95 97 98 100 96 9825% ile 100 100 100 100 100 100 100 100 100 100 100 10050% ile 100 100 100 100 100 100 100 100 100 100 100 10075% ile 100 100 100 100 100 100 100 100 100 100 100 100Nanjing No. of companies 4 5 11 6 6 6 3 11 5 5 6 15Average 87 85 88 73 74 75 - 88 86 86 87 8625% ile 79 82 85 80 84 84 - 85 82 82 83 8450% ile 89 90 87 86 89 90 - 87 90 90 89 8575% ile 96 90 90 90 90 93 - 90 90 90 90 90Suzhou No. of companies 5 6 16 7 7 7 5 16 4 4 4 18Average 91 86 82 74 74 74 85 80 90 90 90 8125% ile 85 85 84 78 78 78 85 80 89 89 89 8150% ile 95 88 85 85 85 85 85 85 90 90 90 8575% ile 100 90 91 90 90 90 90 90 91 91 91 90Hangzhou No. of companies 2 3 9 5 5 5 3 8 4 4 5 13Average - - 91 73 75 73 - 92 90 90 89 8825% ile - - 85 80 90 80 - 85 86 86 87 8550% ile - - 90 90 90 90 - 93 93 93 90 8775% ile - - 95 95 95 95 - 96 96 96 95 95Wuxi No. of companies 3 4 11 5 5 5 3 11 3 3 3 13Average - 90 79 72 72 72 - 78 - - - 8025% ile - 89 80 85 85 85 - 80 - - - 8050% ile - 90 85 90 90 90 - 85 - - - 8575% ile - 91 90 90 90 90 - 90 - - - 90
China Salary Planning Report 2012-2013 63
City Differential IndexEast
Management Non Management SalesSenior Middle Overall Spvr./Sr. General Manual Overall Regional Area Sales OverallMgt. Mgt. Prof Prof Staff Mgr. Mgr. Rep.
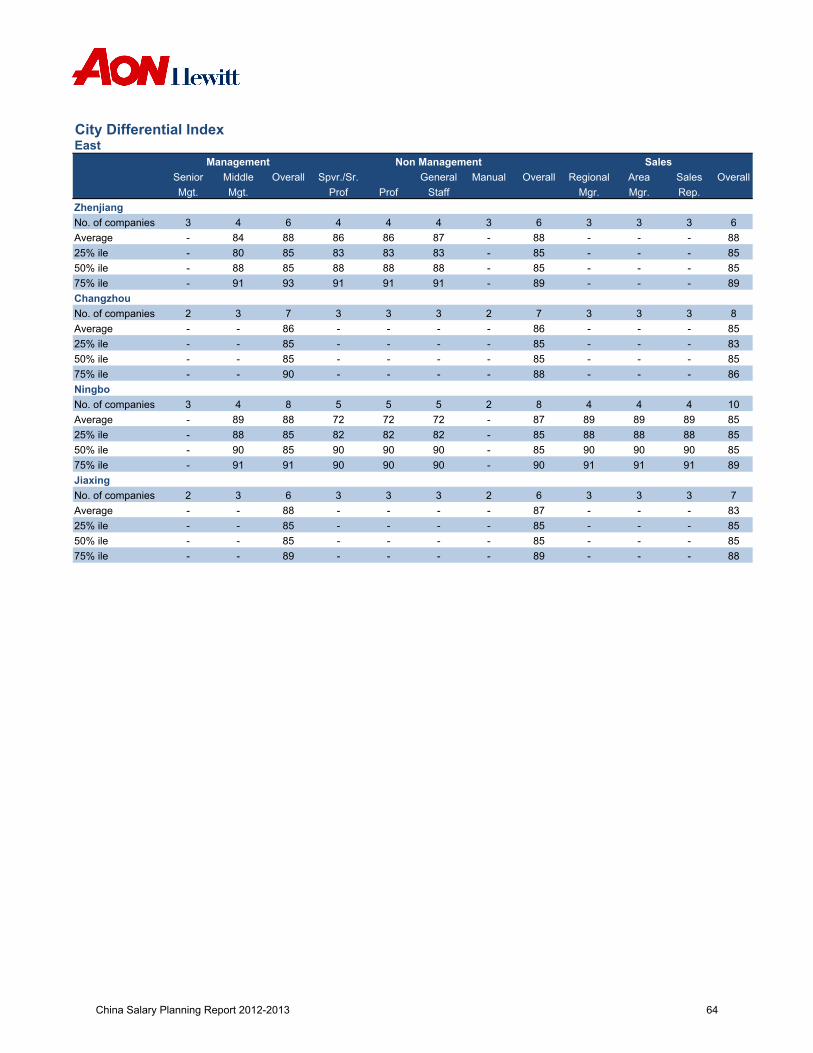
Zhenjiang No. of companies 3 4 6 4 4 4 3 6 3 3 3 6Average - 84 88 86 86 87 - 88 - - - 8825% ile - 80 85 83 83 83 - 85 - - - 8550% ile - 88 85 88 88 88 - 85 - - - 8575% ile - 91 93 91 91 91 - 89 - - - 89ChangzhouNo. of companies 2 3 7 3 3 3 2 7 3 3 3 8Average - - 86 - - - - 86 - - - 8525% ile - - 85 - - - - 85 - - - 8350% ile - - 85 - - - - 85 - - - 8575% ile - - 90 - - - - 88 - - - 86NingboNo. of companies 3 4 8 5 5 5 2 8 4 4 4 10Average - 89 88 72 72 72 - 87 89 89 89 8525% ile - 88 85 82 82 82 - 85 88 88 88 8550% ile - 90 85 90 90 90 - 85 90 90 90 8575% ile - 91 91 90 90 90 - 90 91 91 91 89JiaxingNo. of companies 2 3 6 3 3 3 2 6 3 3 3 7Average - - 88 - - - - 87 - - - 8325% ile - - 85 - - - - 85 - - - 8550% ile - - 85 - - - - 85 - - - 8575% ile - - 89 - - - - 89 - - - 88
China Salary Planning Report 2012-2013 64

City Differential IndexCentral
Management Non Management SalesSenior Middle Overall Spvr./Sr. General Manual Overall Regional Area Sales OverallMgt. Mgt. Prof Prof Staff Mgr. Mgr. Rep.
WuhanNo. of companies 4 5 11 6 6 6 3 11 6 6 7 18Average 93 89 87 74 74 74 - 86 87 87 86 8325% ile 92 85 84 83 83 83 - 84 83 83 82 7650% ile 95 90 85 88 88 88 - 85 88 88 85 8575% ile 96 95 93 90 90 90 - 90 94 94 90 89ChangshaNo. of companies 2 3 7 3 3 3 2 7 4 4 4 10Average - - 87 - - - - 86 86 86 86 8025% ile - - 85 - - - - 85 83 83 83 7550% ile - - 85 - - - - 85 88 88 88 8575% ile - - 92 - - - - 89 91 91 91 87NanchangNo. of companies 2 3 7 3 3 3 2 7 3 3 3 8Average - - 87 - - - - 86 - - - 8425% ile - - 85 - - - - 85 - - - 8350% ile - - 85 - - - - 85 - - - 8575% ile - - 93 - - - - 90 - - - 90HefeiNo. of companies 3 4 8 4 4 4 2 8 4 4 4 10Average - 88 86 88 88 88 - 85 86 86 86 8125% ile - 84 84 84 84 84 - 84 83 83 83 7550% ile - 88 85 88 88 88 - 85 88 88 88 8575% ile - 91 88 91 91 91 - 86 91 91 91 85
China Salary Planning Report 2012-2013 65

City Differential IndexCentral
Management Non Management SalesSenior Middle Overall Spvr./Sr. General Manual Overall Regional Area Sales OverallMgt. Mgt. Prof Prof Staff Mgr. Mgr. Rep.
XianNo. of companies 2 3 8 3 3 3 2 8 4 4 4 11Average - - 86 - - - - 86 86 86 86 8525% ile - - 85 - - - - 85 83 83 83 8050% ile - - 85 - - - - 85 88 88 88 8575% ile - - 88 - - - - 87 91 91 91 88ChengduNo. of companies 4 5 16 6 6 6 3 16 0 5 6 22Average 94 90 86 74 74 74 - 84 - 88 86 8325% ile 93 85 84 85 85 85 - 80 - 85 82 7550% ile 95 90 88 88 88 88 - 85 - 90 88 8575% ile 96 95 91 90 90 90 - 90 - 95 90 90KunmingNo. of companies 2 3 7 4 4 4 2 7 4 4 4 9Average - - 86 68 68 68 - 86 86 86 86 8325% ile - - 85 64 64 64 - 85 83 83 83 7550% ile - - 85 88 88 88 - 85 88 88 88 8575% ile - - 90 91 91 91 - 88 91 91 91 85ChongqingNo. of companies 4 5 9 6 6 6 3 9 4 4 5 14Average 90 86 86 72 74 75 - 85 88 88 87 8425% ile 82 82 82 82 83 83 - 82 84 84 82 8050% ile 89 85 85 84 88 88 - 85 88 88 85 8575% ile 96 90 90 89 92 94 - 90 91 91 90 89ZhengzhouNo. of companies 2 3 7 3 3 3 2 7 3 3 3 11Average - - 87 - - - - 86 - - - 8325% ile - - 85 - - - - 85 - - - 8050% ile - - 85 - - - - 85 - - - 8575% ile - - 91 - - - - 88 - - - 88TaiyuanNo. of companies 2 3 7 3 3 3 2 7 3 3 3 9Average - - 87 - - - - 86 - - - 8625% ile - - 85 - - - - 85 - - - 8550% ile - - 85 - - - - 85 - - - 8575% ile - - 91 - - - - 88 - - - 90
China Salary Planning Report 2012-2013 66
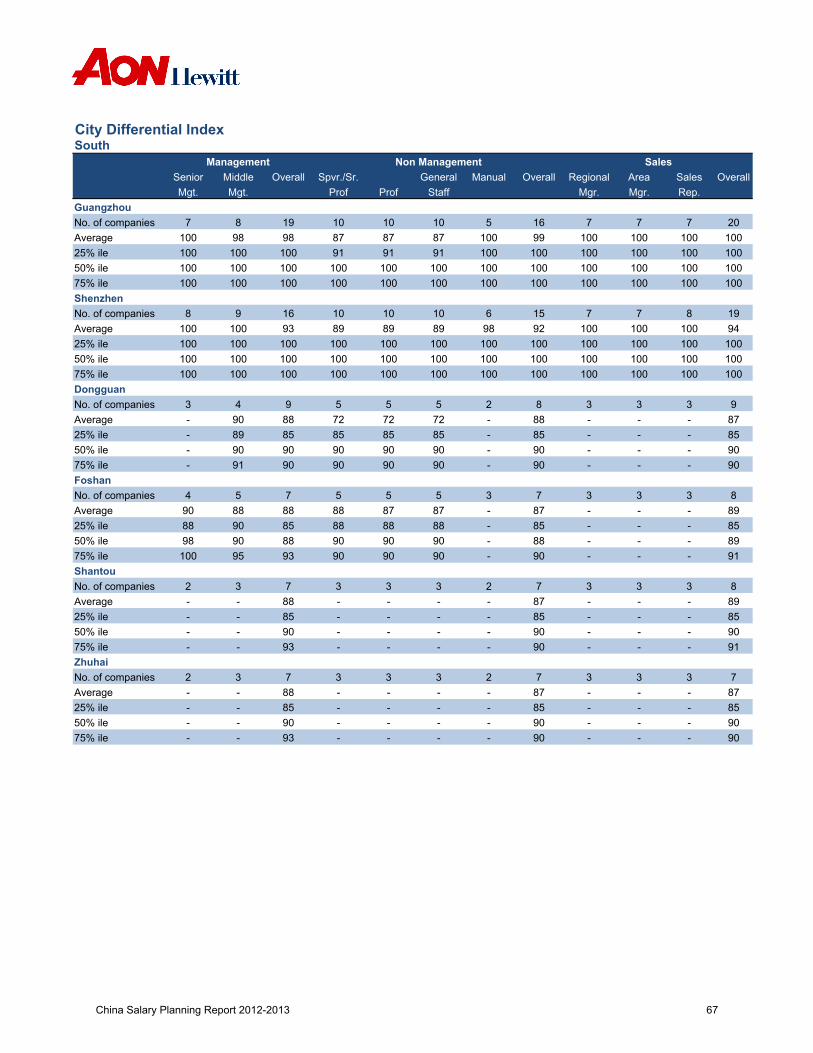
City Differential IndexSouth
Management Non Management SalesSenior Middle Overall Spvr./Sr. General Manual Overall Regional Area Sales OverallMgt. Mgt. Prof Prof Staff Mgr. Mgr. Rep.
GuangzhouNo. of companies 7 8 19 10 10 10 5 16 7 7 7 20Average 100 98 98 87 87 87 100 99 100 100 100 10025% ile 100 100 100 91 91 91 100 100 100 100 100 10050% ile 100 100 100 100 100 100 100 100 100 100 100 10075% ile 100 100 100 100 100 100 100 100 100 100 100 100ShenzhenNo. of companies 8 9 16 10 10 10 6 15 7 7 8 19Average 100 100 93 89 89 89 98 92 100 100 100 9425% ile 100 100 100 100 100 100 100 100 100 100 100 10050% ile 100 100 100 100 100 100 100 100 100 100 100 10075% ile 100 100 100 100 100 100 100 100 100 100 100 100DongguanNo. of companies 3 4 9 5 5 5 2 8 3 3 3 9Average - 90 88 72 72 72 - 88 - - - 8725% ile - 89 85 85 85 85 - 85 - - - 8550% ile - 90 90 90 90 90 - 90 - - - 9075% ile - 91 90 90 90 90 - 90 - - - 90FoshanNo. of companies 4 5 7 5 5 5 3 7 3 3 3 8Average 90 88 88 88 87 87 - 87 - - - 8925% ile 88 90 85 88 88 88 - 85 - - - 8550% ile 98 90 88 90 90 90 - 88 - - - 8975% ile 100 95 93 90 90 90 - 90 - - - 91ShantouNo. of companies 2 3 7 3 3 3 2 7 3 3 3 8Average - - 88 - - - - 87 - - - 8925% ile - - 85 - - - - 85 - - - 8550% ile - - 90 - - - - 90 - - - 9075% ile - - 93 - - - - 90 - - - 91ZhuhaiNo. of companies 2 3 7 3 3 3 2 7 3 3 3 7Average - - 88 - - - - 87 - - - 8725% ile - - 85 - - - - 85 - - - 8550% ile - - 90 - - - - 90 - - - 9075% ile - - 93 - - - - 90 - - - 90
China Salary Planning Report 2012-2013 67
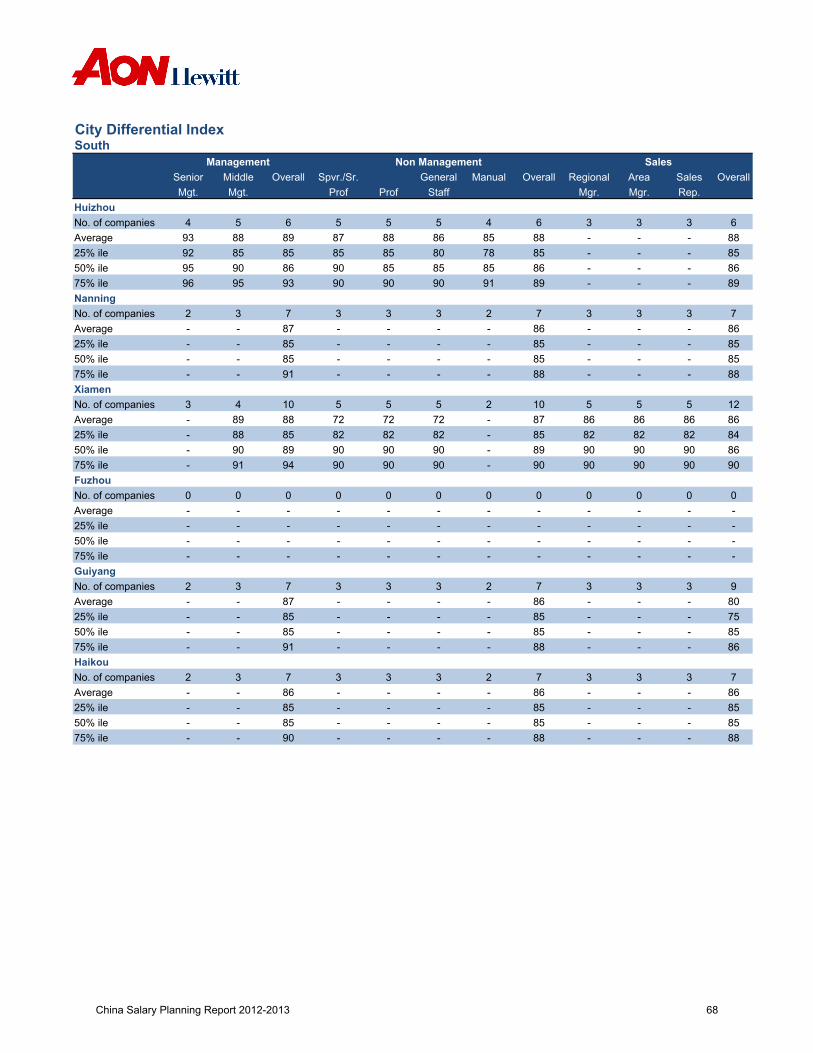
City Differential IndexSouth
Management Non Management SalesSenior Middle Overall Spvr./Sr. General Manual Overall Regional Area Sales OverallMgt. Mgt. Prof Prof Staff Mgr. Mgr. Rep.
HuizhouNo. of companies 4 5 6 5 5 5 4 6 3 3 3 6Average 93 88 89 87 88 86 85 88 - - - 8825% ile 92 85 85 85 85 80 78 85 - - - 8550% ile 95 90 86 90 85 85 85 86 - - - 8675% ile 96 95 93 90 90 90 91 89 - - - 89NanningNo. of companies 2 3 7 3 3 3 2 7 3 3 3 7Average - - 87 - - - - 86 - - - 8625% ile - - 85 - - - - 85 - - - 8550% ile - - 85 - - - - 85 - - - 8575% ile - - 91 - - - - 88 - - - 88XiamenNo. of companies 3 4 10 5 5 5 2 10 5 5 5 12Average - 89 88 72 72 72 - 87 86 86 86 8625% ile - 88 85 82 82 82 - 85 82 82 82 8450% ile - 90 89 90 90 90 - 89 90 90 90 8675% ile - 91 94 90 90 90 - 90 90 90 90 90FuzhouNo. of companies 0 0 0 0 0 0 0 0 0 0 0 0Average - - - - - - - - - - - -25% ile - - - - - - - - - - - -50% ile - - - - - - - - - - - -75% ile - - - - - - - - - - - -GuiyangNo. of companies 2 3 7 3 3 3 2 7 3 3 3 9Average - - 87 - - - - 86 - - - 8025% ile - - 85 - - - - 85 - - - 7550% ile - - 85 - - - - 85 - - - 8575% ile - - 91 - - - - 88 - - - 86HaikouNo. of companies 2 3 7 3 3 3 2 7 3 3 3 7Average - - 86 - - - - 86 - - - 8625% ile - - 85 - - - - 85 - - - 8550% ile - - 85 - - - - 85 - - - 8575% ile - - 90 - - - - 88 - - - 88
China Salary Planning Report 2012-2013 68

City Differential IndexSouth
Management Non Management SalesSenior Middle Overall Spvr./Sr. General Manual Overall Regional Area Sales OverallMgt. Mgt. Prof Prof Staff Mgr. Mgr. Rep.
ZhongshanNo. of companies 3 4 8 4 4 4 2 8 4 4 4 8Average - 89 87 89 89 89 - 86 89 89 89 8625% ile - 88 84 88 88 88 - 84 88 88 88 8450% ile - 90 87 90 90 90 - 87 90 90 90 8775% ile - 91 91 91 91 91 - 90 91 91 91 90JiangmenNo. of companies 2 3 7 3 3 3 2 7 4 4 4 8Average - - 86 - - - - 85 85 85 85 8425% ile - - 85 - - - - 85 83 83 83 8350% ile - - 85 - - - - 85 88 88 88 8575% ile - - 88 - - - - 88 90 90 90 86HanjiangNo. of companies 2 2 4 2 2 2 2 4 2 2 2 4Average - - 88 - - - - 87 - - - 8725% ile - - 85 - - - - 85 - - - 8550% ile - - 88 - - - - 88 - - - 8875% ile - - 91 - - - - 90 - - - 90QuanzhouNo. of companies 2 3 6 3 3 3 2 6 3 3 3 8Average - - 88 - - - - 87 - - - 8525% ile - - 85 - - - - 85 - - - 8550% ile - - 85 - - - - 85 - - - 8575% ile - - 93 - - - - 89 - - - 91ZhangzhouNo. of companies 2 3 6 3 3 3 2 6 3 3 3 6Average - - 85 - - - - 84 - - - 8425% ile - - 81 - - - - 81 - - - 8150% ile - - 84 - - - - 84 - - - 8475% ile - - 89 - - - - 89 - - - 89
China Salary Planning Report 2012-2013 69
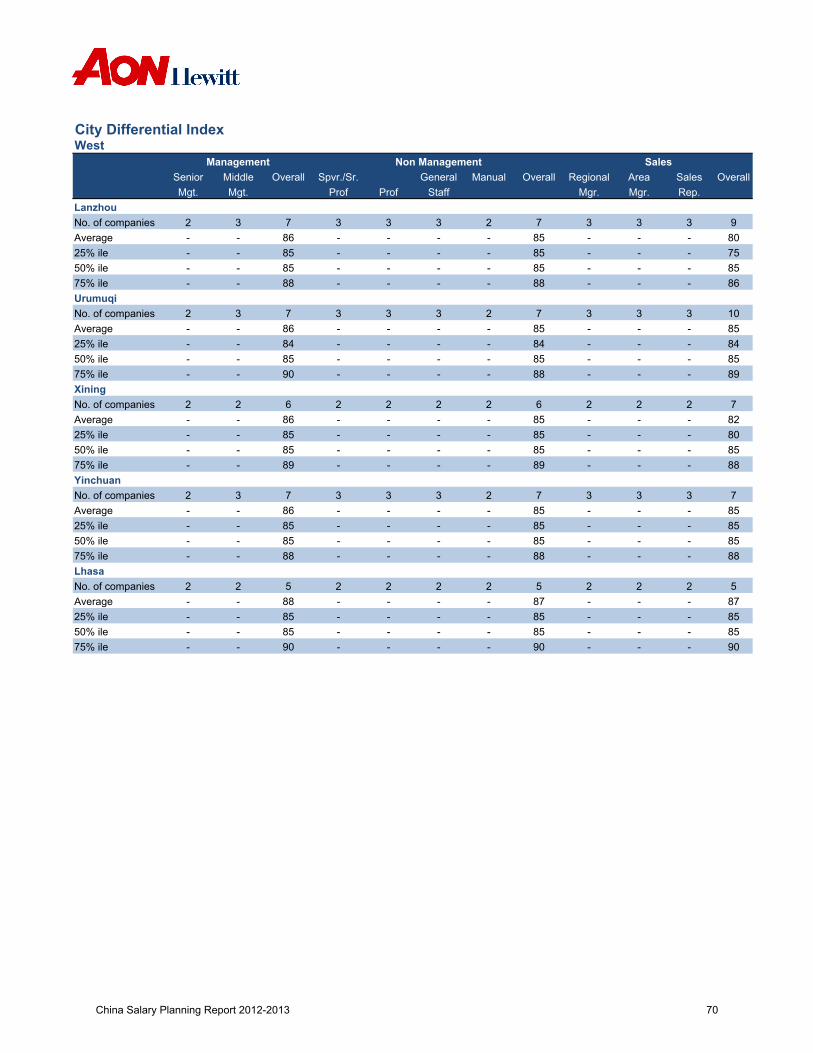
City Differential IndexWest
Management Non Management SalesSenior Middle Overall Spvr./Sr. General Manual Overall Regional Area Sales OverallMgt. Mgt. Prof Prof Staff Mgr. Mgr. Rep.
LanzhouNo. of companies 2 3 7 3 3 3 2 7 3 3 3 9Average - - 86 - - - - 85 - - - 8025% ile - - 85 - - - - 85 - - - 7550% ile - - 85 - - - - 85 - - - 8575% ile - - 88 - - - - 88 - - - 86UrumuqiNo. of companies 2 3 7 3 3 3 2 7 3 3 3 10Average - - 86 - - - - 85 - - - 8525% ile - - 84 - - - - 84 - - - 8450% ile - - 85 - - - - 85 - - - 8575% ile - - 90 - - - - 88 - - - 89XiningNo. of companies 2 2 6 2 2 2 2 6 2 2 2 7Average - - 86 - - - - 85 - - - 8225% ile - - 85 - - - - 85 - - - 8050% ile - - 85 - - - - 85 - - - 8575% ile - - 89 - - - - 89 - - - 88YinchuanNo. of companies 2 3 7 3 3 3 2 7 3 3 3 7Average - - 86 - - - - 85 - - - 8525% ile - - 85 - - - - 85 - - - 8550% ile - - 85 - - - - 85 - - - 8575% ile - - 88 - - - - 88 - - - 88LhasaNo. of companies 2 2 5 2 2 2 2 5 2 2 2 5Average - - 88 - - - - 87 - - - 8725% ile - - 85 - - - - 85 - - - 8550% ile - - 85 - - - - 85 - - - 8575% ile - - 90 - - - - 90 - - - 90
China Salary Planning Report 2012-2013 70

Participation Demographics
China Salary Planning Report 2012-2013 71
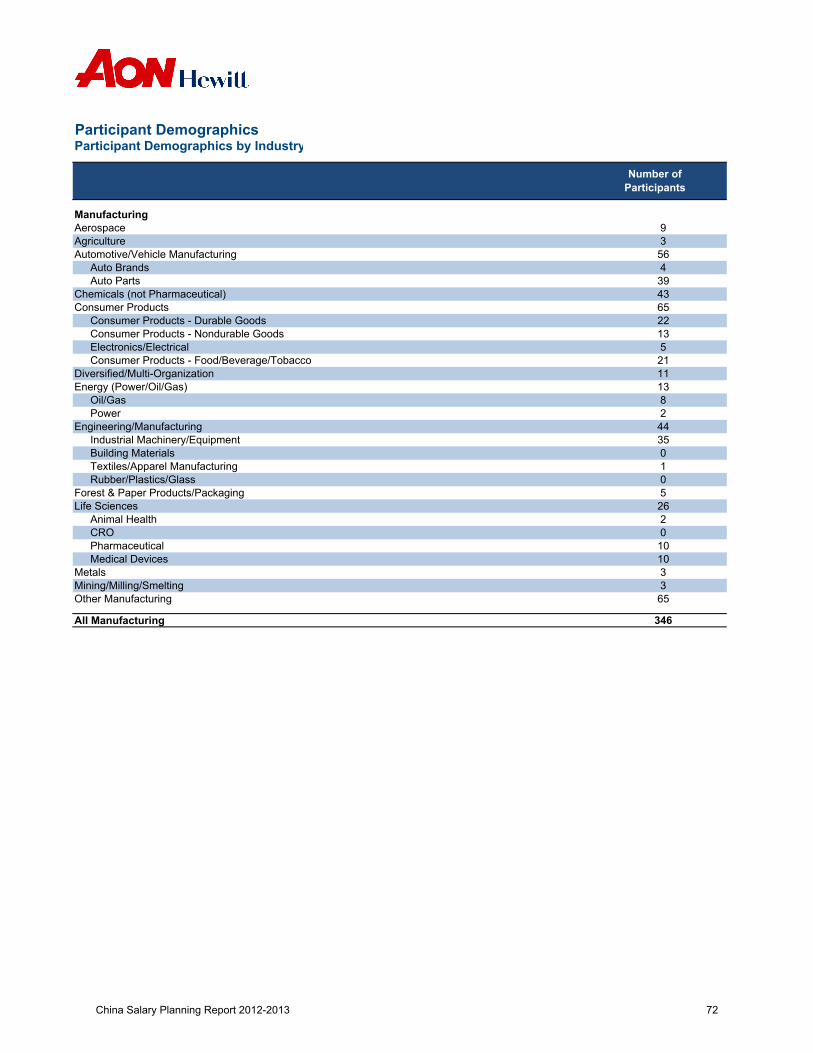
Participant DemographicsParticipant Demographics by Industry
ManufacturingAerospaceAgricultureAutomotive/Vehicle Manufacturing
Auto BrandsAuto Parts
Chemicals (not Pharmaceutical)Consumer Products
Consumer Products - Durable GoodsConsumer Products - Nondurable GoodsElectronics/ElectricalConsumer Products - Food/Beverage/Tobacco
Diversified/Multi-OrganizationEnergy (Power/Oil/Gas)
Oil/GasPower
Engineering/ManufacturingIndustrial Machinery/EquipmentBuilding MaterialsTextiles/Apparel ManufacturingRubber/Plastics/Glass
Forest & Paper Products/PackagingLife Sciences
Animal HealthCROPharmaceuticalMedical Devices
MetalsMining/Milling/SmeltingOther Manufacturing
All Manufacturing
Number of Participants
93564394365221352111138244350105262010103365
346
China Salary Planning Report 2012-2013 72

Participant DemographicsParticipant Demographics by Industry
Number of Participants
ServicesBanking/Finance
BanksInsurance - Life & HealthInsurance - Property & CasualtyInsurance - OtherFunds/Asset ManagementInvestment BanksSecuritiesOther Financial Services
Construction/EngineeringEducation ServicesEngineering DesignEntertainment/Communications/Publication
MediaPrinting/Publishing
GovernmentHealth Care/Medical ServicesHi - Tech
Business/Computer ServicesComputers and Related Products (Software and Hardware)Application Services/ConsultingSemiconductors
Hospitality/Restaurants/ TravelInfrastructureITeS (IT Enabled Services)
BFSI CaptivesKPO/AnalyticsOther CaptivesThird Party Service Providers
Not-for-Profit (not Hospitals/Schools)Professional Services
Advertising and PRAccountingConsultingLegal
Real EstateResearch/DevelopmentRetail (incl. Wholesale & Distribution)Telecommunications
Mobile Service ProvidersOther Telecommunication Services
Transportation/ Logistics/ Shipping ServicesOther Service
All Services
All Companies 658
19340120071429641128989331129130400113610109027
312
151112830
China Salary Planning Report 2012-2013 73
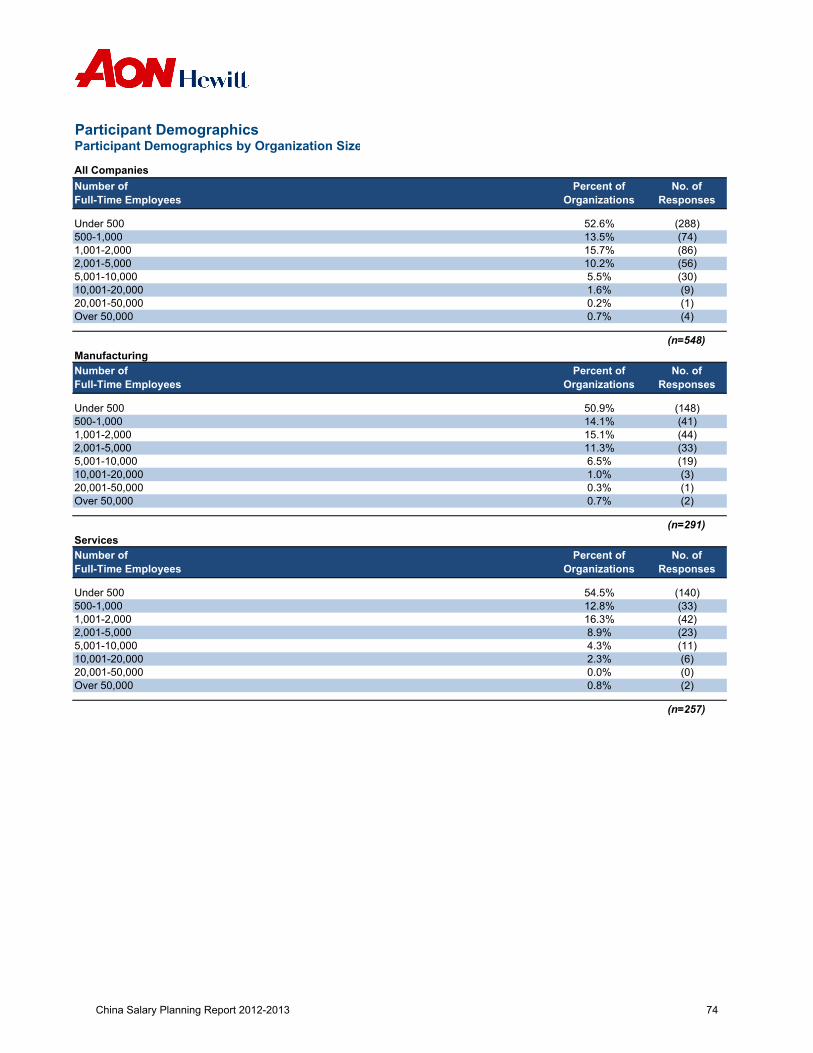
Participant DemographicsParticipant Demographics by Organization Size
All Companies
Under 500500-1,0001,001-2,0002,001-5,0005,001-10,00010,001-20,00020,001-50,000Over 50,000
Manufacturing
Under 500500-1,0001,001-2,0002,001-5,0005,001-10,00010,001-20,00020,001-50,000Over 50,000
Services
Under 500500-1,0001,001-2,0002,001-5,0005,001-10,00010,001-20,00020,001-50,000Over 50,000
Number of Full-Time Employees
Percent of Organizations
No. ofResponses
52.6% (288)13.5% (74)15.7% (86)10.2% (56)5.5% (30)1.6% (9)0.2% (1)0.7% (4)
(n=548)
Number of Full-Time Employees
Percent of Organizations
No. ofResponses
50.9% (148)14.1% (41)15.1% (44)
Number of Full-Time Employees
Percent of Organizations
No. ofResponses
11.3% (33)6.5% (19)1.0% (3)0.3% (1)0.7% (2)
(n=291)
54.5% (140)12.8% (33)16.3% (42)8.9% (23)4.3% (11)2.3% (6)0.0% (0)0.8% (2)
(n=257)
China Salary Planning Report 2012-2013 74
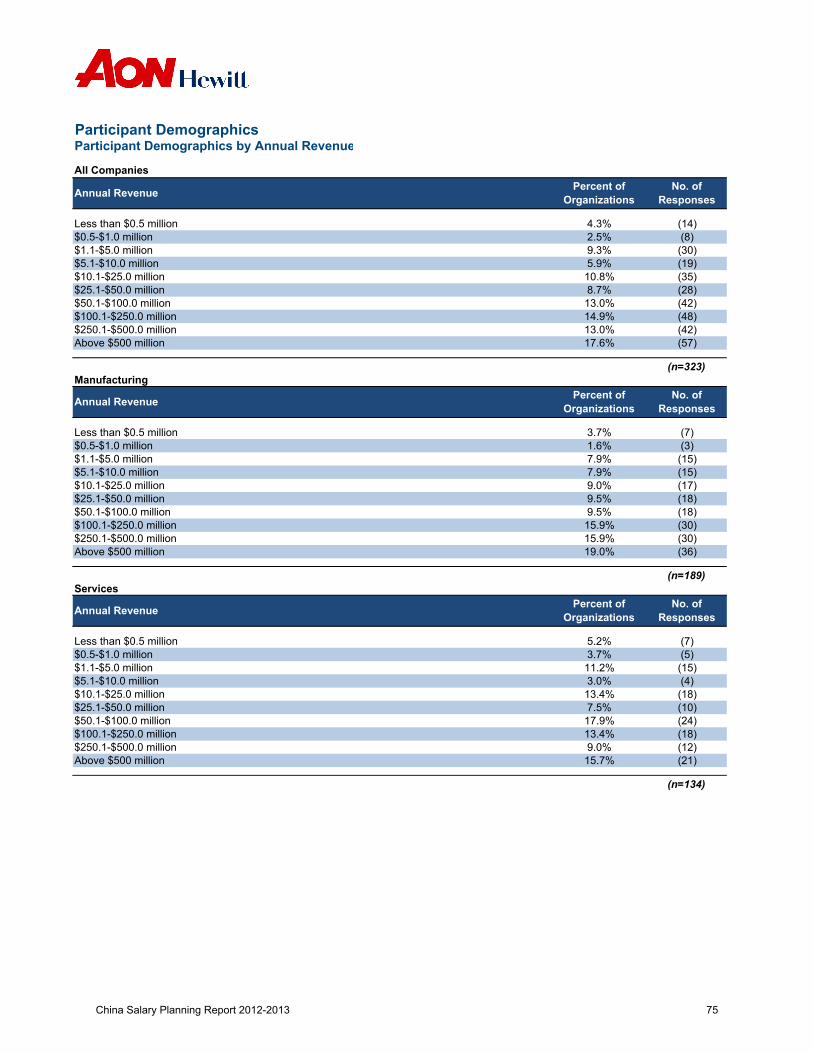
Participant DemographicsParticipant Demographics by Annual Revenue
All Companies
Less than $0.5 million$0.5-$1.0 million$1.1-$5.0 million$5.1-$10.0 million$10.1-$25.0 million$25.1-$50.0 million$50.1-$100.0 million$100.1-$250.0 million$250.1-$500.0 millionAbove $500 million
Manufacturing
Less than $0.5 million$0.5-$1.0 million$1.1-$5.0 million$5.1-$10.0 million$10.1-$25.0 million$25.1-$50.0 million$50.1-$100.0 million$100.1-$250.0 million$250.1-$500.0 millionAbove $500 million
Services
Less than $0.5 million$0.5-$1.0 million$1.1-$5.0 million$5.1-$10.0 million$10.1-$25.0 million$25.1-$50.0 million$50.1-$100.0 million$100.1-$250.0 million$250.1-$500.0 millionAbove $500 million
2.5% (8)
Annual Revenue Percent of Organizations
No. ofResponses
4.3% (14)
9.3% (30)5.9% (19)10.8% (35)
Annual Revenue Percent of Organizations
No. ofResponses
8.7% (28)13.0% (42)14.9% (48)13.0% (42)17.6% (57)
(n=323)
3.7% (7)1.6% (3)7.9% (15)7.9% (15)9.0% (17)9.5% (18)9.5% (18)15.9% (30)15.9% (30)19.0% (36)
(n=189)
Annual Revenue Percent of Organizations
No. ofResponses
5.2% (7)3.7% (5)11.2% (15)3.0% (4)13.4% (18)7.5% (10)
15.7% (21)
(n=134)
17.9% (24)13.4% (18)9.0% (12)
China Salary Planning Report 2012-2013 75
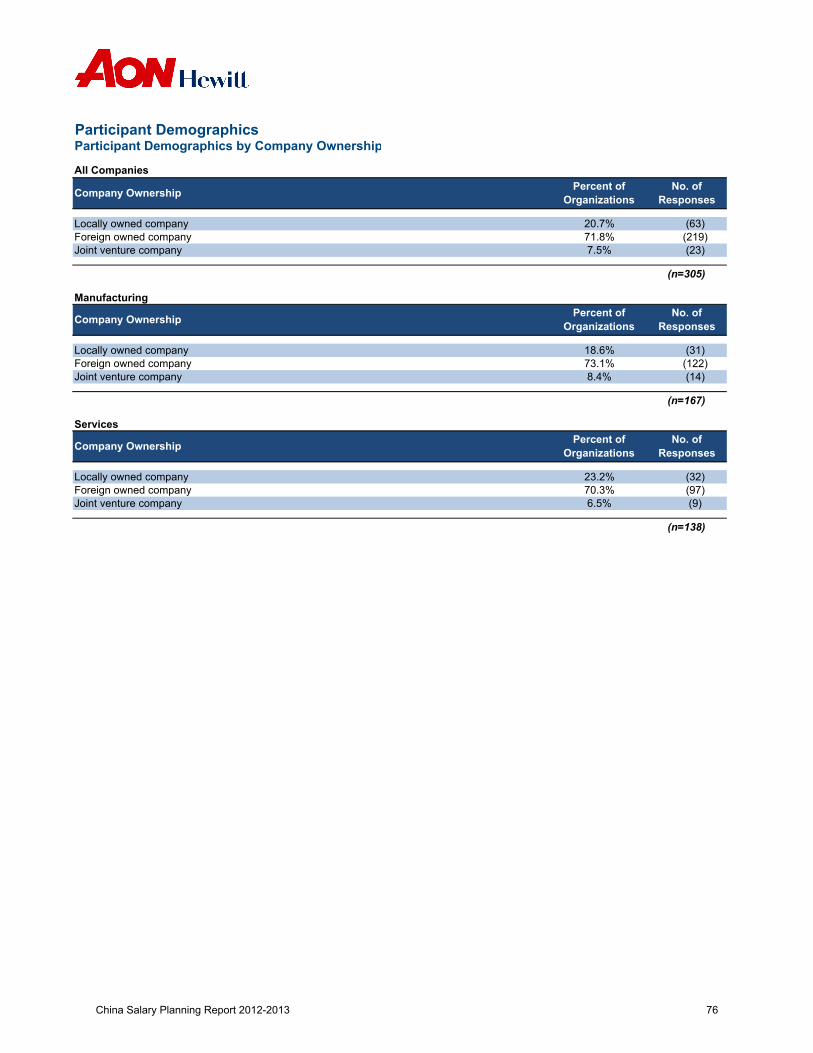
Participant DemographicsParticipant Demographics by Company Ownership
All Companies
Locally owned companyForeign owned companyJoint venture company
Manufacturing
Locally owned companyForeign owned companyJoint venture company
Services
Locally owned companyForeign owned companyJoint venture company
Company Ownership Percent of Organizations
No. ofResponses
20.7% (63)71.8% (219)7.5% (23)
(n=305)
Company Ownership Percent of Organizations
No. ofResponses
18.6% (31)73.1% (122)8.4% (14)
(n=167)
Company Ownership Percent of Organizations
No. ofResponses
23.2% (32)
(n=138)
70.3% (97)6.5% (9)
China Salary Planning Report 2012-2013 76

Appendix
China Salary Planning Report 2012-2013 77

Definitions of Terms
Report Definitions The following are brief definitions of some of the concepts that are used throughout this report.
Top Executive/Senior Management Top executives and senior managers play a key role in both short- and long-term decision-making of a major function area or business unit, direct or coordinate activities within two or more major departments, establish policy, and have a major impact on the achievement of the business unit or function goal.
Example: Country manager and direct reports
Middle Management Middle management are first-line managers, who manage the activities of one major department and set-up standard procedure and policy or lead projects or programs which have broad effect on overall policy and achievement of organization-wide objectives.
Example: Plant manager, business unit controller, marketing manager, systems manager
Junior Management/Professional/Supervisor Provide day-to-day management of a team, has knowledge of a specialized field of technical or administrative function and resolve problems of some difficulty, could be supervising a team or individual contributor or be an entry-level professional.
Example: Production engineer/production planning manager, key account manager systems analyst, business process team leader
Clerical/Admin/Tech Administrative and support level staff.
Example: Administrative employee—sales trainee, merchandiser, business process associate—junior
Manual Workforce Employees in positions such as skilled-production worker, unskilled-production worker, and warehouse handler.
Example: Assembler, loaders etc.
China Salary Planning Report 2012-2013 78

Data Collection Terms The following are brief definitions of some of the concepts that are used within the data collection materials.
Mandatory Salary Increase Budget This is an increase that is mandated by either a government or by a union. It could apply to the entire company or to different groups in the organization.
Merit Salary Increase Budget The amount of any nonguaranteed, individual performance-based increases, including merit lump sums. The budget percentage is calculated by dividing the sum of increases granted/anticipated in the year, divided by the total salaries of all eligible employees, whether or not they received a merit increase.
Note: For India the numbers represent a percent of total fixed pay.
General Salary Increase Budget Any increases given over and above the merit salary and mandatory increase. The budget percentage is calculated by dividing the sum of increases granted/anticipated in the year, divided by the total salaries of all eligible employees, whether or not they received a general increase. General increase includes market correction, special adjustment and promotional budgets.
Note: For India the numbers represent a percent of total fixed pay.
Total Salary Increase Budget The total amount of all increases combined (that is, merit increases plus general increases plus mandatory salary increases).
Note: For India the numbers represent a percent of total fixed pay.
Special Adjustment and/or Miscellaneous Budget The amount of any salary adjustment granted to an employee for a special, or unique, situation that is not typically covered by a merit increase. This would include market, equity, or "hot skills" adjustments. The budget percentage is calculated by dividing the sum of increases granted/anticipated in the year, divided by the total salaries of all eligible employees, whether or not they received a special adjustment and/or miscellaneous increase.
Note: For India the numbers represent a percent of total fixed pay.
China Salary Planning Report 2012-2013 79
Promotional Budget The amount of any promotional increase granted to an employee for receiving a promotion. The budget percentage is calculated by dividing the sum of increases granted/anticipated in the year, divided by the total salaries of all eligible employees, whether or not they received a promotional increase.
Note: For India the numbers represent a percent of total fixed pay.
Salary Structure Movement This is an increase that is applied to the salary grades and bands to reflect movements in the market. In other words, this represents an increase to the salary structure and not an individual or employee group increase.
China Salary Planning Report 2012-2013 80
Participant List
Manufacturing Services
AB SCIEX AAXIS Software (Chengdu) Co., Ltd.Acushnet Company Abercrombie & FitchADM International Sarl ACCENTUREAdvanced Technology Materials Incorporated ACCORAir Products and Chemicals, Inc. ACSAlbea Packing (Suzhou) Co.,Ltd Acxiom CorporationAlliance Construction Materials Limited Adobe SystemsAmerican Axle & Manufacturing Advance Micro DevicesAMETEK, Inc. Affiliated Computer Services of India Pvt. Ltd., A Xerox CompanyAMGEN International Air CanadaAmway (China) Co., Limited Akamai TechnologiesAnadarko Petroleum Corp Alcatel-LucentAndrew Telecommunications (China) Co., Ltd. ALi Corp.AQ Holmbergs Suzhou Co., Ltd. Ally Financial, Inc.AREVA Alpha & Omega Semiconductor (Shenzhen) LimitedARINC Incorporated American Express International Inc.Armstrong World Industries Aon-COFCO Insurance Brokers Co., LtdAshcroft Instrument Suzhou CO.,LTD. APL China Co., LtdAshland (China)Holdings Co., Ltd. APM Terminals Management (Shanghai) Co., LtdAtlas Copco (Wuxi) Compressor Co.,Ltd. ARICENT GROUPAtotech (China) Chemiscals Ltd. AsiaInfo-Linkage Co., Ltd.Avery Dennison (Guangzhou) Converted Products Ltd. ASIAN PAC Holdings (Shanghai) Co., LtdBall Corporation ASIAN PAC Holdings(shanghai) Co.,LtdBarnes Group Inc. ASM Assembly Automation LimitedBASF ASM Technology ChinaBeckman Coulter Astellas Pharma (China) Co., Ltd.Behr-hella thermoncontrol (Shanghai) Co., Ltd AusencoBETAFENCE Wire and Mesh Products (Tianjin) Co.,Ltd. Automatic Data ProcessingBEUMER Machinery (Shanghai) Co., Ltd B & Q (China) Investment Co., Ltd.BHP Billiton Bank of Nova ScotiaBHTC Banta Global Turnkey (Shenzhen) Co.,LtdBIC Baxter Healthcare Pvt LtdBiogen Idec Inc Bayer AGBio-Rad Laboratories Bayer Technology and Engineering (Shanghai) Co., Ltd.Black Diamond Sports Equipment (Zhuhai FTZ) Co., Ltd. Bayer(Sichuan)animal health Co,. LtdBombardier Transportation GmbH Bayer(Sichuan)Animal Health Co.,LtdBorgWarner Inc. Bechtel CorporationBosch Automotive Products (Suzhou) Co., Ltd. Beckman Coulter Commercial Enterprise(China) Co., LTD.Bosch Trading (Shanghai) Ltd Beckman Coulter Laboratory System (Suzhou)Co.,LtdBosch(China) investment Ltd Beijing Fresenius Kabi Pharmaceutical Co.,Ltd.Boston Scientific Beijing Polk-Catarc Vehicle Information Consulting Company Ltd.BP YPC Acetyls Company(Nanjing) Limited Best Buy (AsiaPacific) LimitedBrady Corporation Asia Pacific Pte Ltd Biocon LimitedBristol-Myers Squibb Company Black & VeatchBrose Wuhan Automotive Systems Co., ltd. Black and VeatchBrown-Forman Corporation BMC SoftwareBrunswick Bose Electtronics (Shanghai) Co. Ltd., Shenzhen BranchBSH Home Appliances (China) Co., Ltd. Broadcom CorporationCabot Microelectronics Corporation Cambridge Silicon RadioCameron (Beijing) Commercial Co. Ltd Capgemini Business Services (China) Ltd.Cargill Investments (China) Ltd. Carlson, IncCarhartt, Inc. Caterpillar Financial Services CorporationCarl Zeiss (Shanghai) Co., Ltd. Celestica (Suzhou) Technology Co., Ltd.Carl Zeiss Suzhou Co.,LTD. Celgene Pharmaceutical (Shanghai) Co. Ltd.Caterpillar Inc CH2M HILLCelestica Chartered Institute of Management AccountantsChanel (China) Trading Co., Ltd. CHEP China Co., Ltd.
China Salary Planning Report 2012-2013 81
Participant List
Manufacturing Services
Changan PSA automobiles co.,LTD Cintas Corporate Services Limited (Tianjin)Char-Broil Technical Consulting(Shenzhen) Co. Ltd. CIT GroupChart Industries, Inc. CMA CGMChem-Trend(Shanghai)Trading CO.,LTD Cognizant Technology SolutionsCHIC Foods, CO., Ltd. CommScope Asia(Suzhou) Technologies Co.,LtdChina Resources Snow Breweries (China) Co., Ltd. Compass Group PLCChint solar(zhejiang)CO.,Ltd Comptel Communications Sdn BhdCHS Inc. Conexant SystemsCoats Pl Convergys CorporationColumbia Sportswear Company Con-way IncContinental Automotive System Changshu Co., Ltd CooperVision Optical Trading (Shanghai) Co., Ltd.Continential Automotive System Changshu Co. Ltd. CorningCookson Performance Materials Corning ChinaCooper Industries, plc Crossing Automation China,LtdCooper Saiyang (Wuhu) Automotive Co., Ltd Cushman & WakefieldCooperVision, Inc. Cypress Semiconductor Technology (Shanghai) Co., LtdCovance Dachser GmbH & Co. KGCSG International Damco China LimitedCSG TRW Chassis Systems Co.,Ltd DASSAULT SYSTEMESCummins Generator Technologies (China) Co., Ltd Decathlon (Shanghai) Sports Co., Ltd.Curtiss-Wright Corporation Deckers (Beijing) Trading Co. LtdCYTEC Industries Inc Dell, IncCytec Surface Specialties ( Shanghai ) Co,. Ltd DHL Global Forwarding ChinaDaimler AG DHL-Sinotrans International Air Courier Ltd.Dana Management (Shanghai) Co., Ltd dianping.comDaramic Tianjin PE Separator Co., Ltd. Digia Software (Chengdu) Co.,LtdDeere & Company Discovery CommunicationsDelphi DOCOMO interTouch Pte LtdDelphi Packard Electric Systems Co., Ltd. Yantai Branch Draeger Medical Equipment Co., Ltd.Denso (China) Investment Co., Ltd. DTZDISA (Changzhou) Machinery Ltd. E.G.. Compents (China) Co.,Ltd.Donaldson Far East Ltd eBay, IncDongguan Lamex Furniture Co., Ltd. ElectrocomponentsDoosan Infracore Construction Equipment electronic artsDouble A International Network Company Limited Eli Lilly and the CompanyDow Chemical Epson (China) co.,ltdDow Corning Ernst & YoungDuPont China Holding Co. Ltd. Shanghai Branch Excelitas TechnologiesE & J Gallo Winery F5 NetworksEastman Kodak Company Fairchild Semiconductor(Suzhou)Co.,Ltd.Eaton FedEx (China) Co., Ltd.Eaton Corporation FedEx International Freight Forwarding Services(Shanghai)Co., Ltd.Embraer (China) Aircraft Technical Services Co., Ltd FEI CompanyEmerson Network Power Fenwal Inc.Estee Lauder (Shanghai) Commercial Co., Ltd. Finisar Shanghai Inc.Evergreen Packaging(Shanghai) Co., LTD Finisar Wuxi, IncF. Hoffman La Roche FluorFAURECIA Fluor (China) Engineering & Construction Co. LtdFederal-Mogul (China) Co., Ltd. FM GlobalFellowes Office Products(Suzhou) Co.,Ltd FossilFerring Pharmaceuticals (China) Co., Ltd French Trade Commission - UBIFRANCE in China - Shanghai OfficeFFT EDAG Production Systems (Shanghai) Co., Ltd. Gap Inc.FLEXCO Conveying Equipment TRading (Shanghai) Co.,Ltd. Garmin International, Inc.Flextronics Multek Electronics(Zhuhai)Co.Ltd GartnerFlint Group Chemical ( China) Co., Ltd. Gartner Australasia Pty LimitedFlowserve Corporation GE HealthcareFMC Korea Ltd GEMALTOFord Asia Pasific and Africa Genpact (Dalian) Co., Ltd.Foshan Kohler Co.Ltd Genworth FinancialFoshan Shunde CEL Machinery Co., Ltd Glaxo Smith Kline (China) Investment Co., Ltd.Fountain Set (Holdings) Limited GLORIOUS PROPERTYFuturis Automotive Interiors Trading (Shanghai) Co.,Ltd Goodman Management Consulting (Shanghai) Co., Ltd.
China Salary Planning Report 2012-2013 82

Participant List
Manufacturing Services
Fuyao Glass Industry Group Co., Ltd. Google IncGAC FIAT Automobile Co., Ltd. GuangZhou FengShen Logistics CO.LTDGardner Denver Machinery Shanghai Guoco GroupGardner Denver Nash Machinery Ltd. GXS INCGardner Denver, Inc. Habia Cable ChinaGE Aviation Suzhou HalliburtonGeneral Electric Hamburg Sud Hong Kong LimitedGeneral Mills (China) Holding Ltd. Hangzhou MSD Pharmaceutical Co., Ltd.General Mills, Inc. Heitman LLCGeneral Motors Company Herma GroupGestamp Auto Components(Kunshan) Co., Ltd. Hewlett PackardGlen Raven Asia Hilti (China) Distribution Ltd.,GODIVA(Shanghai) Food Trading Ltd Hilton Beijing Capital AirportGoodrich TAECO Aeronautical Systems (Xiamen) Co Ltd HILTON WORLDWIDEGrace China Ltd. Hyatt Hotels CorporationGracedon Knitters Ltd. IBAGraco Fluid Equipment (Suzhou) Co., Ltd. IBMGraco Inc. IBM Global Delivery (Dalian) Co., LtdGT Advanced Technologies Limited ICF InternationalGTECH Corporation ICON Clinical Research LtdGuangdong Whirlpool Electrical Appliances Co., Ltd. IHSGuangzhou Amphenol Electronics Co.,Ltd. IMS HealthGuangzhou Jarden Technical Center IMS Market Research Consulting (Shanghai) Co., LtdGuangzhou Trendiano Co., Ltd IndraGulfstream Aerospace Infineon Technologies AGHaas Automation Asia Co., Ltd. Ingram Micro Asia Pacific Pte Ltd.Habasit AG Intel CorporationHansgrohe SE Intel Mobile Communications South East Asia Pte LtdHarley-Davidson Motor Company Intelsat CorporationHasbro Far East Limited InterContinental Hotels GroupHasbro Toys (Shenzhen) Ltd. INVESCOhaydon linear motors (Changzhou) Co., LTD Jabil Circuit (Guangzhou) Co. LtdHenkel Jardine OneSolutionHERMES INTERNATIONAL JHJ International Transportation Co., Ltd.Hill-Rom Holdings, Inc John Wiley & Sons, Inc.Hilti Johnson & Johnson Medical ChinaHilti (Shanghai) Ltd. Johnson Control Dalian Business CenterHitachi Global Storage Products(Shenzhen) Co.,Ltd / Hitachi Global St Jumeirah GroupHoneywell International Kantar GroupHoneywell International Inc. Kempinski Hotel Beijing Lufthansa CenterHusky Energy Keppel Land China Limited.Husky Injection Molding System (Shanghai) Ltd. Keppel Land International LtdHusky Injection Molding Systems Kingfisher (Shanghai) Sourcing Consultancy Co., Ltd.IDEX Trading (Shanghai) Co., Ltd. Kingston Technology (shanghai) Co. LtdIDEXX Europe BV Knight FrankIKEA Dalian manufacture company Kronos IncorporatedIllumina, Inc. Kuehne & Nagel LimitedInfinera Corporation Kuliche&Soffa(Suzhou)Ltd.Infinitus (China) Company Ltd. Kungfu Catering Management Co., Ltd.Ingersoll Rand Lagerinn Home Purchase OfficeInternational Flavors & Fragrances Laird TechnologiesInvensys Laureate Education, Inc.ITT LogitechITW (China) Investment Co., Ltd Lundbeck (Beijing) Pharmaceuticals Consulting Co., LTDJaguar Land Rover Luxba Group LimitedJCB (Shanghai) Construction Machine Co. Ltd Luxottica Retail Greater ChinaJiangsu Akcome Solar & Science Technology Co.,Ltd LVMH ASIA PACIFIC LIMITEDJohn Bean Technologies Corporation Maersk Global Service Centres (India) Private LimitedJohnson Controls (China) Investment Co., Ltd. Mahindra SatyamJohnson Controls, Inc Manhattan Associates, Inc.Johnson Matthey (Shanghai) Catalyst Co., Ltd. Manulife Business Processing Services (Chengdu)
China Salary Planning Report 2012-2013 83

Participant List
Manufacturing Services
Keystone Foods LLC Manulife Financial Asia LimitedKohler China Investment Co., Ltd Marriott InternationalKohler Co. MAST Industries (FE) LtdKonecranes (Shanghai) Co., Ltd. MasterCard WorldwideKraft Foods China Matson Shipping (Shanghai) Co., Ltd.Krauss Maffei Extrusion Technology (Zhejiang) Co., Ltd McDonald's ChinaKunshan Oceanview Leisure Sports Products L.L.C. MediaMarkt (Shanghai) Consulting Service Company LimitedL.L.Bean, Inc. MedtronicLear Corporation Changchun Automotive Interior Systems Co.Ltd Medtronic (Shanghai) Management Co., LtdLennox International, Inc. MEMC Enterpise Consulting Shanghai Co., ltdLife Technologies Menlo worldwide logisticsLittelfuse, Inc. Mentor Graphics CorporationLORD Corporation Merck Serono Co., Ltd.L'Oreal China Microchip Technologylubrizol Corp MicrosoftLUMINEX CORPORATION Misumi Precision Machinery Trading Co., Ltd. (China)LyondellBasell Industries MOL (China) Co., LtdMagnapowertrain(Changzhou) Co., Ltd. Molex Interconnect(Chengdu)Co.,LtdMAHLE International GmbH Monier (Shanghai) Management Co.,LtdMary Kay Inc. Moody'sMBH PowerSystems (Changzhou) Co., Ltd. Moravia ITMckey Food Services Limited MWH GlobalMead Johnson Myriad ChinaMead Johnson Nutrition (China) Ltd. Nagra Kudelski GroupMeadWestvaco National InstrumentsMeiya Power Company Limited NATURAL BEAUTY BIO-TECHNOLOGY LTD,ShanghaiMerak Railway Technologies (Shanghai) Co.,Ltd NBA Sports and Culture Development (Beijing) Co. Ltd.Mercury Marine Technology Suzhou Newheight Holdings LTDMeritor (China) Investment Co., Ltd. NNE PharmaplanMeritor. Inc. NokiaMESSIER BUGATTI DOWTY Nokia Siemens NetworksMoen (Shanghai) Kitchen & Bath Products Co., Ltd. NXP Semiconductors Guangdong Co., LtdMolex Offshore Incorporations HK LimitedMoxa Inc. ON SemiconductorMTD Machinery (Suzhou) Co., Ltd Oracle CorporationMylan, Inc. Orange Business ServicesNalco, an Ecolab Company ORBIS InternationalNavistar, Inc Orient Overseas Container Line (China) LtdNBTY Inc. Pacific Life InsuranceNEWELL RUBBERMAID Panalpina World Transport (PRC) Ltd.Newfield Exploration Pentland Brands PlcNewMarket Corporation Perfect WorldNike Inc PerkinElmer Instrments (Shanghai) Co, Ltd.Nilit Nylon Technologies (Suzhou) Co., Ltd Powerwave Technologies, IncNingbo Shenglong Automotive Powertrain System Co., Ltd Prada SPANovo Nordisk Pharmaceuticals Co., Ltd. QualcommOSI (China) Holding Co., LTD Qualcomm IncorporatedOutotec China Ralph LaurenOwens Corning China Investment Co., Ltd Ramaxel technology(shenzhen) co.,limitedPanduit Corporation Rayco APAC Investment Management Shanghai LtdParker Hannifin RicardoParker Hannifin Management (Shanghai) Co. Ltd. Robert Half InternationalPeabody Energy Royal Bank of CanadaPentair ruhlamat Automation Technologies(Suzhou) Co., Ltd.Pepsi Cola International Ltd Ryder Logistics (Shangha) Co.,ltdPepsiCo China SAGEMCOMPerfetti Vanmelle confectionary (China) Co.,Ltd SanDisk Semiconductor (Shanghai) Co.,LtdPetSafe Shenzhen Limited SAP AGPhilip Morris (China) Management Co. Ltd. Sasken Communication Technologies LimitedPHILIP MORRIS INTERNATIONAL Schawk Asia Pacific Pte LtdPitney Bowes Inc. Seagate Technology International
China Salary Planning Report 2012-2013 84
Participant List
Manufacturing Services
Polaris Industries Shanda GamesPolyplastics (Shanghai) Ltd. Shanghai Roche Pharmaceutials Ltd.PPG Industries International, Inc Shanghai Shilu Instrument Co., Ltd.Printpack, Inc. Shangri-La International Hotel Management Ltd.PTM Engineering Plastics(Nantong) Co.,Ltd. SHENZHEN SMART WORLD APPAREL CO.,LTDPuls Electronics( Suzhou) Co. Ltd. Shenzhen STS Microelectronics Co,.LtdQIAGEN GmbH Shenzhen Yantian International Container Terminals Ltd.Quintiles Shine EnergyRanbaxy Laboratories Limited Sichuan Luye Baoguang Pharmaceutical Industrial Co.,LtdRegal Beloit Corporation Sichuan Maker Science And Technology Co., Ltd.Remy International Sinclair Knight MerzRevlon, Inc Singapore Telecommunications LtdRGE Management (China) Co., Ltd Sino-US United MetLife Insurance Co., LtdRhodia - Hengchang (Zhangjiagang) Specialty Chemical Co., Ltd. SITA INC B.V.Rich Products SMART TechnologiesRio Tinto SmartracRittal Electro-Mechanical Technology (Shanghai) Co., Ltd. Sobey Digital Technology Co.,LTDRodenstock GmbH Société GénéraleRogers Corporation Somfy Chinarose plastic (Kunshan) Co., Ltd. Sony Pictures EntertainmentROYAL DUTCH SHELL SSOE China Co., LtdSABIC SST ChinaSABIC Innovative Plactics Stanford UniversitySafilo Eyewear Industries (Suzhou) Ltd. Starwood Asis Pacific Hotels & Resorts Pte LtdSAFRAN State Street Zhejiang Tecnology Co., LtdSaint-Gobain Gypsum Building Materials (Changzhou) Co., Ltd. STMICROELECTRONICSSanmina-SCI Technology (Shenzhen) Co., Ltd. Suzhou ASEN Semiconductors Co.,LtdSapa Heat Transfer (Shanghai) Ltd. Suzhou Modern Terminals. LtdSasol Olefins & Surfactants Suzhou TMT International Logistics Co., LtdServier (Tianjin) Pharmaceutical Co., Ltd. Swagelok(Shanghai) Fluid Systems Technologies Co., LtdSGL Carbon SE Swiss Reinsurance Company LtdShanghai Faiveley Railway Technology Co., Ltd SymantecShanghai Hankook Tire Sales Co., Ltd. TakedaShanghai Johnson Limited Target CorporationShanghai McCormick Foods Co., Ltd. Tecan (Shanghai) Trading Co., Ltd.Shanghai OnStar Telematics Co., Ltd. TelecaShanghai Parker Hannifin Fluid Connectors Co.,Ltd Tellabs, IncShanghai Valeo Automotive Electrical Systems Co.Ltd Teradata CorporationShanghai Volkswagen Powertrain Limited Terex (Changzhou) Machinery Co.,LtdShanghai Yanfeng Johnson Controls Seating Co.,Ltd The Church of Jesus Christ of Latter-Day SaintsShell Eastern Petroleum Pte Ltd The Coca-Cola CompanyShenzhen KSTAR Science and Technology Co., Ltd. The Hongkong and Shanghai Hotels, LimitedShure Incorporated The Opposite House BeijingSHV China Investment Co. Ltd The Walt Disney CompanySiegwerk Druckfarben AG & Co KG aA Thomson ReutersSiemens Electrical Apparatus Ltd., Suzhou Tiffany & Co.Siemens Ltd., China Timken (Chengdu) Aerospace & Precision Products Co., LTD.Sigma Aldrich (Wuxi) Life Science&Technology Co., Ltd TNSSigma-Aldrich China Toyo Engineering Corporation (China)Sika (China) Co., Ltd. T-Systems International GmbHSINO-SWED PHARMACEUTICAL Co., Ltd. Tyco Electronics (Shanghai) Co., Ltd.Smith and Nephew UBS AGSOCOMEC S.A. UL LLCSonos, Inc. Varian Medical Systems, Inc.Spectrum Brands Vopak China Management Co., Ltd.SPT Energy Group Company Vopak Shanghai Logistics Co., Ltd.SPX Corporation (China) Co., Ltd. Wal-Mart (China) Investment Co., Ltd.SSB Wind Energy Technology (Qingdao) Co., Ltd Wal-Mart Global ProcurementSuncor Energy Inc. WESCO Distribution, Inc.SUSPA (nanjing) Co.,Ltd Western Union, LLCSuzhou Littelfuse OVS Ltd. Wilmer Cutler Pickering Hale and Dorr LLP
China Salary Planning Report 2012-2013 85
Participant List
Manufacturing Services
Suzhou Red Maple Wid Blade Mould Co., Ltd Wison Engineering Ltd.Targus Group International WPMI (Shanghai) Enterprise Service Co., Ltd.Tekni-PlexTechnologies (Suzhou) Co., LTD WR GraceTeleflex Incorporated WS Atkins plcTenneco Zebra TechnologiesTerex Corporation Zilog, an Ixys CompanyTessenderlo Chemie NVThe Dow Chemical CompanyThe Hershey CompanyThe Lubrizol CorporationThe Toro CompanyTianjin Takeda Pharmaceutical co., ltdTimken China Investment Co.,LtdTognum AGTop Score Fashion Shoes Co., Ltd.Tower InternationalTrico Automotive system (Suzhou) Co., LtdTrico Automotive system (Suzhou) Co.,LtdUCB S.A.UCB Trading (Shanghai) Co., Ltd.UnitedUnited Test & Assembly CentreValspar CorporationVesuviu Advanced Ceramics (Suzhou) Co Ltd.VETOQUINOL SAVF ChinaVilleroy & Boch AGVisteon Asia Pacific Inc.Vitalink Industry (ShenZhen) Co., Ltd.Voith Corporate Management (Shanghai) Co., Ltd.Voith Turbo Systems (Shanghai) Co., Ltd.Volkswagen (China) Investment Co., Ltd.Volkswagen Automatic Tranmission (Dalian) Co. Ltd.Volkswagen Transmission (Shanghai) Co., Ltd.Vopak Terminal Zhangjiagang Co.,LtdWarnaco Commerce (Shanghai) Company LimitedWelch Allyn Inc.Weyerhaeuser CompanyWieland Metals (Shanghai) LimitedWrigley Confectionery (China) LimitedXiamen Fu Min Yuan Apparel Trade Co.,Ltd.Xylem (Shanghai) Co., LtdZF Drivetech(Suzhou) Co.,Ltd.ZF Shanghai Steering Systems Co., Ltd.
China Salary Planning Report 2012-2013 86

About Aon Hewitt Aon Hewitt is the global leader in human resource solutions. The company partners with organizations to solve their most complex benefits, talent and related financial challenges, and improve business performance. Aon Hewitt designs, implements, communicates, and administers a wide range of human capital, retirement, investment management, health care, compensation, and talent management strategies. With more than 29,000 professionals in 90 countries, Aon Hewitt makes the world a better place to work for clients and their employees. For more information on Aon Hewitt, please visit
www.aonhewitt.com
© 2012 Aon plc. All rights reserved.
To protect the confidential and proprietary information included in this material, it may not be disclosed or provided to any third parties without the prior written consent of Aon Hewitt.
Aon Hewitt does not accept or assume any responsibility for any consequences arising from any person, other than the intended recipient, using or relying on this material.
Authorized and regulated by the Financial Services Authority.
China Salary Planning Report 2012-2013 87