China Property Market, RBC Wealth Management Global Insight - Special Report
20
APRIL 2013 GLOBAL I NSIGHT – SPECIAL REPORT CHINA P ROPERTY MARKET BY JAY ROBERTS & YUFEI YANG, HONG KONG, CHINA, RBC Dominion Securities Inc.
-
Upload
theng-roger -
Category
Documents
-
view
222 -
download
2
Transcript of China Property Market, RBC Wealth Management Global Insight - Special Report

April 2013
Global InsIGht – specIal RepoRt chIna pRopeRty MaRketby Jay RobeRts & yufei yang, Hong Kong, CHina, RBC Dominion Securities Inc.

Global INSIGHT – CHINa ProPerTy markeT 2
in tHis RepoRt
Introduction 3
The Chinese Housing Market in Context 4
Shenzhen: A Case Study 5
Concerns About the Property Market 6
Property Prices and Inventory 11
The Government & Housing 12
Recent Initiatives to Cool the Market 14
Outlook: Short Term 15
Outlook: Long Term 16
Conclusion 17
� At a time when much of the world’s economic burdens sit on China’s shoulders, the country’s property market has become a flash point for investors and a pivotal battlefield between China bulls and bears.
� From so-called ghost towns, to property speculators, to the “shadow banking system,” to the impact of corruption, we address the major concerns surrounding China’s property market.
� We also examine whether the property boom is justifiable based on growth and income trends, and dig deeper into the government’s attempts to influence housing prices.
� Finally, we discuss the short- and long-term outlook for China’s property market, including whether there are enough catalysts to drive additional demand.

Global INSIGHT – CHINa ProPerTy markeT 3
CHina pRopeRty MaRKetPutting Challenges in Perspective
Jay RobeRts – Hong Kong, CHina [email protected]; RBC Dominion Securities Inc.
yufei yang – Hong Kong, CHina [email protected]; RBC Dominion Securities Inc.
intRoduCtion
The Chinese property market is perhaps the most widely discussed in the world. This is certainly the case for global investors who are trying to understand the path ahead for the world’s second-largest economy and biggest contributor to global GDP growth. It is impossible, for example, to form a view on many commodities such as copper and iron ore without first having a view on China, the single-largest consumer of most industrial commodities. The stakes for investors, though, go beyond commodity demand. At a time when the world is starved of economic growth, more now lies on China’s shoulders than ever before.
In recent years, the property market has become a flash point that has come up time and time again in the financial press. It has become a pivotal battlefield between China bulls and bears. This discussion is often long on hyperbole. Dramatic prognostications abound for the Chinese property market: prices are rising, “there’s a bubble”; prices are falling, “the end is near.” Videos of so-called
ghost towns in Inner Mongolia in the north of China, or the world’s biggest shopping mall lying empty in Guangdong province in the south, cause fear among audiences thousands of miles away, most of whom have never been to China. Someone from afar may ask, “Is it all like that?” The question is valid. Could it be that the Chinese growth story is little more than a mirage?
Well, no, it’s not all like that. China's 1.35 billion people have to live somewhere. The boom in Chinese property in that respect is different to booms in countries that are already developed. China is home to a huge number of people that have lived in a highly sub-standard housing environment for a long time. Coupled with the unprecedented industrialization, urbanization, and wealth creation that are ongoing in China—as well as limited domestic investment opportunities and a desire to own property—the ingredients for a volatile housing market are clear for all to see.

Global INSIGHT – CHINa ProPerTy markeT 4
CHina pRopeRty MaRKet
China’s industrial Commodities Consumption as a percentage of Global Demand
Source - bP - Statistical Review of World Energy 2010, International energy agency, ministry of Industry and Information Technology of China, International Corporate Services Group
11%
46%
61%
43%
89%
54%
39%
57%
0%
20%
40%
60%
80%
100%
Oil (2010) Coal(2011)
Iron Ore(2011)
Copper(2012)
Others
China
That said, poor planning and speculative excess have impacted the market. Moreover, housing market problems in the West over the past five years have cast a long shadow for investors with respect to their perspective on China’s position.
tHe CHinese Housing MaRKet in Context
There are a number of reasons why the property market in China causes so much confusion. It boils down to the following: the market is so large and varied across the country it defies simple explanation; for historical, social, and legal reasons, there was a dearth of housing development in China for many decades, thus providing a fundamental justification for the building boom in recent years; China’s rapid economic growth, which has led to wealth creation on an unprecedented scale in terms of the number of people lifted out of poverty; and a lack of investment alternatives for capital in China.
Market size does complicate analysis. We are talking about the living conditions of one-fifth of the world’s population. China’s population of 1.35 billion people (official estimate for end of 2012), which is still growing modestly, is four times that of the U.S. and nearly 40 times the population of Canada. Just over one-half of these people live in over 650 cities in China, the rest in the countryside. There are around 100 cities with a population greater than 1 million people. Some have populations numbering well over 10 million.
China’s Contribution to Global GDp Growth
Source - International monetary Fund (ImF), World economic outlook Database, october 2012
-10%
0%
10%
20%
30%
40%
50%
60%
70%
80%
1990 1993 1996 1999 2002 2005 2008 2011
The municipality of Chongqing is home to more than 30 million people. The disparity between cities and provinces can be immense.
Let’s put the Chinese property market in some historical context, and turn the clock back to 1949. The Chinese Communists have taken power and established the People’s Republic of China (PRC) on October 1. After hundreds of years of perceived imperial cronyism and feudal oppression, a populist group is now in power. Landlords are identified as bourgeois enemies of the people and the revolution. The government takes over all land holdings and ostensibly distributes them to the people. Communes—groups of people living together and pooling resources—are formed all over the country. Those entering the commune give up their land titles. Private property rights are, at best, a vague concept. There isn’t much codified law of any kind, let alone with respect to property. Ultimately, ownership and control of economic assets, including property, is with the ruling party, despite its populist credentials.
In 1949, China’s population is 540 million. There are approximately 130 cities, but only 10% of the population lives in those cities. Access to cities is strictly controlled via the “hukou” or registration system. This is basically a form of control over population movement and still exists today. (People can now move into a city if they do not have the relevant “hukou,” but access to the city’s resources, such as education and health care, are limited.)
Global INSIGHT – CHINa ProPerTy markeT 5
CHina pRopeRty MaRKet
China's population –1949 to December 2012
Source - National bureau of Statistics of China; data through December 2012
400
600
800
1000
1200
1400
1600
1949 1959 1969 1979 1989 1999 2009
Mill
ions
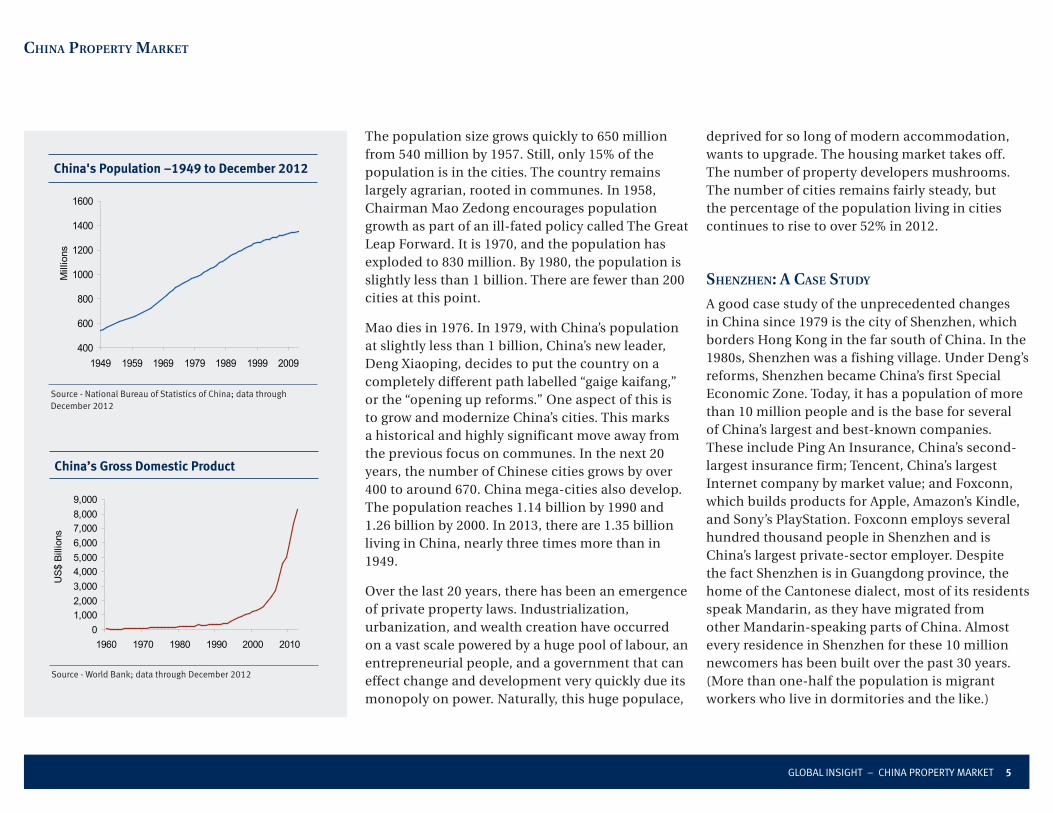
The population size grows quickly to 650 million from 540 million by 1957. Still, only 15% of the population is in the cities. The country remains largely agrarian, rooted in communes. In 1958, Chairman Mao Zedong encourages population growth as part of an ill-fated policy called The Great Leap Forward. It is 1970, and the population has exploded to 830 million. By 1980, the population is slightly less than 1 billion. There are fewer than 200 cities at this point.
Mao dies in 1976. In 1979, with China’s population at slightly less than 1 billion, China’s new leader, Deng Xiaoping, decides to put the country on a completely different path labelled “gaige kaifang,” or the “opening up reforms.” One aspect of this is to grow and modernize China’s cities. This marks a historical and highly significant move away from the previous focus on communes. In the next 20 years, the number of Chinese cities grows by over 400 to around 670. China mega-cities also develop. The population reaches 1.14 billion by 1990 and 1.26 billion by 2000. In 2013, there are 1.35 billion living in China, nearly three times more than in 1949.
Over the last 20 years, there has been an emergence of private property laws. Industrialization, urbanization, and wealth creation have occurred on a vast scale powered by a huge pool of labour, an entrepreneurial people, and a government that can effect change and development very quickly due its monopoly on power. Naturally, this huge populace,
deprived for so long of modern accommodation, wants to upgrade. The housing market takes off. The number of property developers mushrooms. The number of cities remains fairly steady, but the percentage of the population living in cities continues to rise to over 52% in 2012.
sHenzHen: a Case study
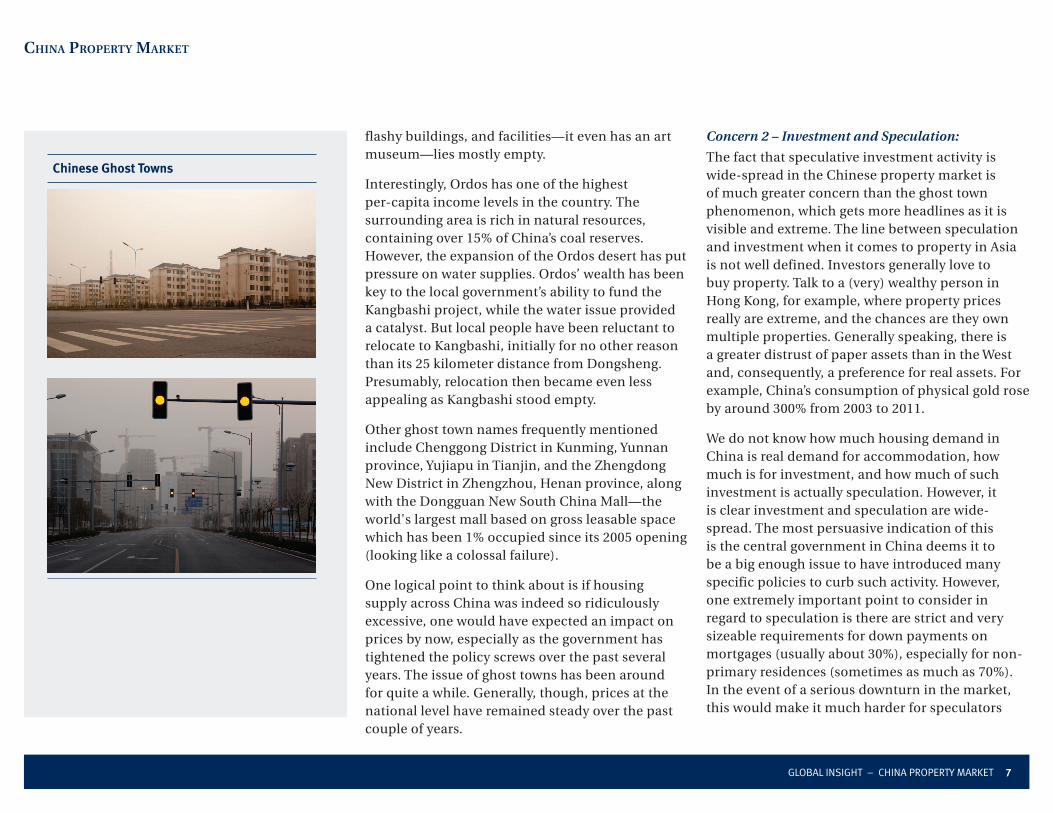
A good case study of the unprecedented changes in China since 1979 is the city of Shenzhen, which borders Hong Kong in the far south of China. In the 1980s, Shenzhen was a fishing village. Under Deng’s reforms, Shenzhen became China’s first Special Economic Zone. Today, it has a population of more than 10 million people and is the base for several of China’s largest and best-known companies. These include Ping An Insurance, China’s second-largest insurance firm; Tencent, China’s largest Internet company by market value; and Foxconn, which builds products for Apple, Amazon’s Kindle, and Sony’s PlayStation. Foxconn employs several hundred thousand people in Shenzhen and is China’s largest private-sector employer. Despite the fact Shenzhen is in Guangdong province, the home of the Cantonese dialect, most of its residents speak Mandarin, as they have migrated from other Mandarin-speaking parts of China. Almost every residence in Shenzhen for these 10 million newcomers has been built over the past 30 years. (More than one-half the population is migrant workers who live in dormitories and the like.)
China’s Gross Domestic product
Source - World bank; data through December 2012
01,0002,0003,0004,0005,0006,0007,0008,0009,000
1960 1970 1980 1990 2000 2010
US$
Bill
ions

Global INSIGHT – CHINa ProPerTy markeT 6
CHina pRopeRty MaRKet
Shenzhen – Then and Now
ConCeRns about tHe pRopeRty MaRKet
Concerns abound over the outlook for the property market, including whether prices are excessive, whether supply is excessive, the extent of speculation, the impact of corruption, the importance of the housing market to local government financing, the potential impact of a pronounced housing downturn on banks, what a downturn in housing would mean for Chinese growth, and the influence of the property market on the equity market. The list goes on. The chairman of Vanke, China’s largest property developer, recently noted China was caught in a property bubble. (Although somewhat confusingly, during Vanke’s last earnings call, management was optimistic about the 2013 outlook.) Such concerns are one reason why big Chinese banks are trading at very low valuation multiples.
We will address a number of these issues. In the big picture, though, a counter argument to the overarching tone of these concerns is China is still only about half way through its urbanization process. 100 million people are forecast to become urbanites in the next decade alone. This, combined with very strong per-capita income growth, will continue to create real and significant demand for housing. The propensity for central planning adds an extra dimension to the process, too.
In no particular order, the following are some of the major concerns, and our thoughts, regarding the property market.
Concern 1 – Ghost Towns
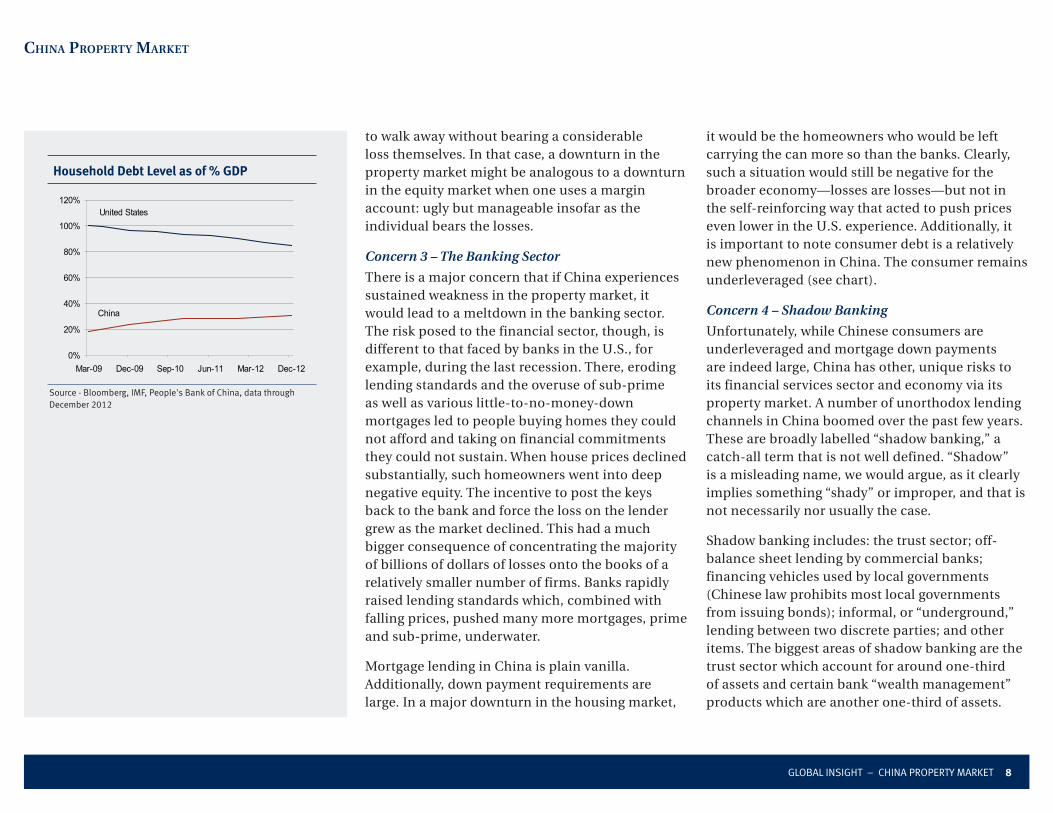
At the more-extreme end of things, pictures and videos of empty buildings and even entire towns bereft of residents leave distant audiences in fear of China’s ghost towns. We view such projects as either failed anomalies or works in progress. They are either the result of simply poor planning by certain local governments (perhaps even an effort to inflate local GDP figures) or traits of China’s centrally planned economy. Also, empty buildings have a habit of filling up after a while (although there are notable exceptions to this). Shenzhen, in its day, had many empty towers. It’s not easy building a city for 10 million people in a couple of decades. And, to be fair to provincial leaders, there are many more examples of entirely new areas being successfully planned, developed, built, and populated than there are of ghost towns.
Perhaps the most famous ghost town in China is Ordos in Inner Mongolia. In fact, Ordos City covers a huge area divided into eight districts that have a combined population of 1.6 million people. Dongsheng is the metropolitan heart of Ordos and has a population of nearly 600,000. It is the Kangbashi New Area, a suburb built by the local government to develop a modern city, that is the ghost town. The local government plans to have, eventually, at least several hundred thousand people living there. However, the current population is just a few thousand people, most of whom are government employees that have been relocated. Kangbashi, with its thousands of houses,
Recently ...
early 1980s ...
Global INSIGHT – CHINa ProPerTy markeT 7
CHina pRopeRty MaRKet
Chinese Ghost Towns
flashy buildings, and facilities—it even has an art museum—lies mostly empty.
Interestingly, Ordos has one of the highest per-capita income levels in the country. The surrounding area is rich in natural resources, containing over 15% of China’s coal reserves. However, the expansion of the Ordos desert has put pressure on water supplies. Ordos’ wealth has been key to the local government’s ability to fund the Kangbashi project, while the water issue provided a catalyst. But local people have been reluctant to relocate to Kangbashi, initially for no other reason than its 25 kilometer distance from Dongsheng. Presumably, relocation then became even less appealing as Kangbashi stood empty.
Other ghost town names frequently mentioned include Chenggong District in Kunming, Yunnan province, Yujiapu in Tianjin, and the Zhengdong New District in Zhengzhou, Henan province, along with the Dongguan New South China Mall—the world's largest mall based on gross leasable space which has been 1% occupied since its 2005 opening (looking like a colossal failure).
One logical point to think about is if housing supply across China was indeed so ridiculously excessive, one would have expected an impact on prices by now, especially as the government has tightened the policy screws over the past several years. The issue of ghost towns has been around for quite a while. Generally, though, prices at the national level have remained steady over the past couple of years.
Concern 2 – Investment and Speculation:
The fact that speculative investment activity is wide-spread in the Chinese property market is of much greater concern than the ghost town phenomenon, which gets more headlines as it is visible and extreme. The line between speculation and investment when it comes to property in Asia is not well defined. Investors generally love to buy property. Talk to a (very) wealthy person in Hong Kong, for example, where property prices really are extreme, and the chances are they own multiple properties. Generally speaking, there is a greater distrust of paper assets than in the West and, consequently, a preference for real assets. For example, China’s consumption of physical gold rose by around 300% from 2003 to 2011.
We do not know how much housing demand in China is real demand for accommodation, how much is for investment, and how much of such investment is actually speculation. However, it is clear investment and speculation are wide-spread. The most persuasive indication of this is the central government in China deems it to be a big enough issue to have introduced many specific policies to curb such activity. However, one extremely important point to consider in regard to speculation is there are strict and very sizeable requirements for down payments on mortgages (usually about 30%), especially for non-primary residences (sometimes as much as 70%). In the event of a serious downturn in the market, this would make it much harder for speculators
Global INSIGHT – CHINa ProPerTy markeT 8
CHina pRopeRty MaRKet
to walk away without bearing a considerable loss themselves. In that case, a downturn in the property market might be analogous to a downturn in the equity market when one uses a margin account: ugly but manageable insofar as the individual bears the losses.
Concern 3 – The Banking Sector
There is a major concern that if China experiences sustained weakness in the property market, it would lead to a meltdown in the banking sector. The risk posed to the financial sector, though, is different to that faced by banks in the U.S., for example, during the last recession. There, eroding lending standards and the overuse of sub-prime as well as various little-to-no-money-down mortgages led to people buying homes they could not afford and taking on financial commitments they could not sustain. When house prices declined substantially, such homeowners went into deep negative equity. The incentive to post the keys back to the bank and force the loss on the lender grew as the market declined. This had a much bigger consequence of concentrating the majority of billions of dollars of losses onto the books of a relatively smaller number of firms. Banks rapidly raised lending standards which, combined with falling prices, pushed many more mortgages, prime and sub-prime, underwater.
Mortgage lending in China is plain vanilla. Additionally, down payment requirements are large. In a major downturn in the housing market,
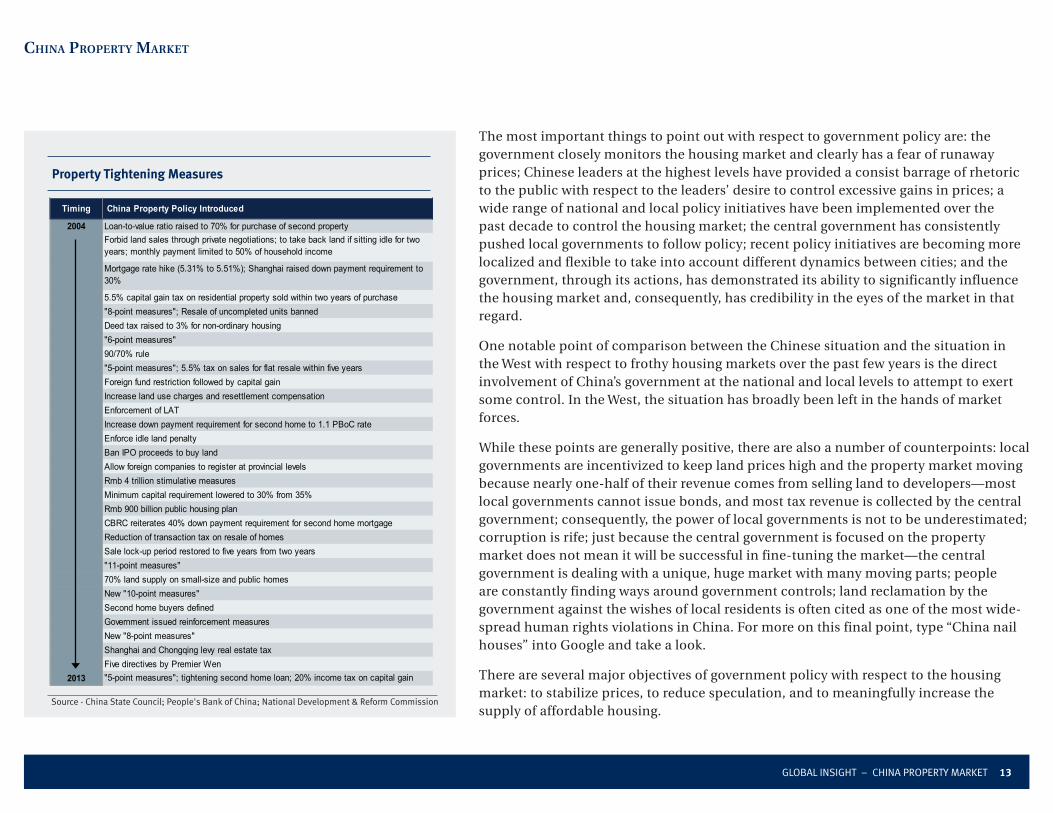
it would be the homeowners who would be left carrying the can more so than the banks. Clearly, such a situation would still be negative for the broader economy—losses are losses—but not in the self-reinforcing way that acted to push prices even lower in the U.S. experience. Additionally, it is important to note consumer debt is a relatively new phenomenon in China. The consumer remains underleveraged (see chart).
Concern 4 – Shadow Banking
Unfortunately, while Chinese consumers are underleveraged and mortgage down payments are indeed large, China has other, unique risks to its financial services sector and economy via its property market. A number of unorthodox lending channels in China boomed over the past few years. These are broadly labelled “shadow banking,” a catch-all term that is not well defined. “Shadow” is a misleading name, we would argue, as it clearly implies something “shady” or improper, and that is not necessarily nor usually the case.
Shadow banking includes: the trust sector; off-balance sheet lending by commercial banks; financing vehicles used by local governments (Chinese law prohibits most local governments from issuing bonds); informal, or “underground,” lending between two discrete parties; and other items. The biggest areas of shadow banking are the trust sector which account for around one-third of assets and certain bank “wealth management” products which are another one-third of assets.
Household Debt level as of % GDp
0%
20%
40%
60%
80%
100%
120%
Mar-09 Dec-09 Sep-10 Jun-11 Mar-12 Dec-12
United States
China
Source - bloomberg, ImF, People's bank of China, data through December 2012

Global INSIGHT – CHINa ProPerTy markeT 9
CHina pRopeRty MaRKet
In 2012, a significant part of China’s credit growth was via shadow banking. According to our correspondent research provider, the shadow banking market is estimated to be over RMB20 trillion (US$3.2 trillion). A full discussion of the sector is beyond the scope of this article, but we shall touch on two aspects.
Trust Sector: Trust financing has various permutations, but at its root it is a way to distribute capital without directly using a bank’s balance sheet. Trust financing in its current form in China began to expand around 10 years ago, although there have been previous waves. However, it grew rapidly after the government’s fiscal stimulus package in 2008-2009 had the unwanted side effect of inflating property prices. The key reason for the sector’s growth over the past few years was that in 2010 the government severely restricted bank lending to the property sector and to local governments (who are responsible for much of the country’s infrastructure spending).
In 2007 and 2008, the trust sector had around RMB 1 trillion (US$160 billion) in assets. This had risen to RMB 3 trillion by end of the 2010 and nearly RMB 7.5 trillion (US$1.2 trillion) by the end of 2012. Two-thirds of this is lending to local governments and property developers. Banks had been the main conduit of capital distribution in the economy until that time. When the government cut property developers off from the banks, developers turned to other avenues for financing. In addition
to the rapid growth in trusts, there has also been rapid growth in the issuance of Chinese property developer bonds.
Trusts can be passive (single-unit trusts) or active (collective trusts). About 75% of trust assets are passive and 25% are active, with active trusts growing more quickly. For passive trusts, the trust distributes capital, that someone else has raised, to borrowers. For active trusts, the trust company does everything including raising and managing the funds.
When the trust partners with a bank, it is generally passive in nature and distributes the capital according to where the bank wants it to go. Because the bank is putting money through a trust and not lending directly, it can bypass central government-mandated loan quotas or lending restrictions. These kinds of arrangements with banks are probably reasonably regulated, according to research sources. Other types of trust arrangements, such as when the lender is a non-bank institution, are less well regulated. These lead to a key point—there is nothing necessarily wrong about the trust sector’s existence. The question is, is the sector being regulated and monitored sufficiently?
“Wealth Management”: One of the biggest concerns regarding the shadow banking system is the development of certain types of “wealth management” products. An example might be
When the government cut property developers off from the banks, developers turned to other avenues for financing, including trusts. In 2007 and 2008, the trust sector had around $160 billion in assets, and rose to nearly $1.2 trillion by the end of 2012.

Global INSIGHT – CHINa ProPerTy markeT 10
CHina pRopeRty MaRKet
when a bank partners with a trust to provide money to a third party and, in doing so, creates a product that is then sold to investors. This includes individual investors. Note that with respect to the property market in particular, this is not pooling mortgages and dividing them up into securities for onward selling to institutions (e.g. mortgage-backed security [MBS]). This is the reverse: pooling loans to firms, dividing them up, and then onward selling to individuals. One issue is whether the investor understands what he/she is buying and the associated risks. As these are widely sold (via banks), it is highly unlikely everyone buying them has full understanding of what they are. The government is partly responsible for this development, though, as it keeps depositors out of pocket with very low bank deposit rates in a fairly high inflationary environment. Depositors have looked for yield elsewhere.
Better regulation of “wealth management” products on the occasion where banks partner with trust companies began in 2010. But these products are originated by the bank. It is unclear what controls are in place for “wealth management” products produced only by a collective trust that are then distributed by the bank (i.e., the bank is passive).
One could easily imagine someone buying such a product from a bank might mistakenly think the bank would be liable for the product if something went wrong. This is very similar to the “mini-bond” saga that rocked Hong Kong for several
years during and after the financial crisis. Lehman Brothers’ investment bank structured fairly conservative products (linked to some big Chinese companies) that paid a single-digit annual return. These were widely sold to individual investors via various retail and commercial banks in Hong Kong under the misleading name of “mini-bonds.” In fact, they were structured notes. When Lehman went bankrupt, investors discovered these were not bonds at all. The subsequent public outcry, aimed mostly at banks that had distributed these products, was vociferous and unrelenting. Eventually, investors got most of their money back.
We are not saying these “wealth management” structured products are being mis-marketed as “mini-bonds” in China, nor are we evaluating the risk of such products or forecasting something will blow up. The point is that public outcry, if and when things do go wrong and investors get burned, would likely be large, to say the least. In such circumstances, it is unlikely the public would be forced to bear all the losses, according to Hong Kong’s experience. One important reason we discuss this here is the size of the market for shadow banking “wealth management” products is gigantic. Official government figures for 2012 put the size at RMB7.5 trillion (US$1.2 trillion).
In a somewhat ironic twist, the government ultimately has caused the explosion in trust financing and shadow banking by placing much-stricter controls on bank lending.
It is unclear what controls are in place for China’s property-related “wealth management” products. One could easily imagine someone buying such a product from a bank might mistakenly think the bank would be liable for the product if something went wrong.

Global INSIGHT – CHINa ProPerTy markeT 11
CHina pRopeRty MaRKet
Concern 5 – Criminal Activity
China has a big corruption problem in many areas of the economy. This trait is unfortunately shared among many emerging market economies; China just happens to be the biggest of them. Corruption and fraud have certainly permeated the property market. One of the more-common fraudulent techniques is to use multiple, fake IDs to get around restrictions on the purchase of multiple properties. A couple of cases have become famous in China. Ms. Gong Ai’ai, a former deputy head of Rural Commercial Bank in Shaanxi province and now known as “House Sister” in the press, is alleged to have fraudulently amassed 41 properties in Beijing worth tens of millions of dollars using multiple IDs. There are also other well-known cases involving House Brother, House Uncle, and even House Ancestor.
pRopeRty pRiCes and inventoRy
Chinese cities are commonly categorized as Tier 1, Tier 2, or Tier 3. Tier 1 cities are the biggest, including Beijing, Shanghai, Guangdong, and Shenzhen. Tier 2 cities are those that are regionally important, and so on.
As one would expect from a fast-growing economy such as China, property prices have registered robust growth for many years. Using secondary housing prices (as opposed to primary, or newly built, units), since 2004 prices have risen by more than 150% in Shanghai; more than 200% in Beijing, Guangzhou, and Shenzhen; and by nearly
300% in Tianjin. At first glance, these are scary numbers. However, on a nationwide average—China has over 650 cities, not just very expensive Tier 1 cities—affordability of housing in China has actually modestly improved over the same time period. China housing, on average, costs six times household income, steady from about six times in 2004, but down from eight times at the end of the 1990s.
The reason for improved affordability despite rising prices is because urban household disposable income (UHDI) has also been growing strongly, on average, at a high, single-digit rate per annum over the past 20 years. In the early 1990s, UHDI in China was about RMB10,000 (about US$1,600 at today’s exchange rate) per annum. By 2011, it had risen to RMB63,000 (US$10,100), an increase of more than 600%.
Income growth has remained robust in recent years. In 2004, UHDI was about RMB30,000 (US$4,800). So, from 2004 to 2011, UHDI doubled, implying an average compound annual growth rate of 8%. Note, though, the average hides huge differences between urban citizens and rural citizens as well as wealthy cities and poorer cities.
As noted earlier, house prices in key cities have risen by much more than 100% since 2004, far outpacing growth in UHDI. Affordability in these cities has generally gotten worse, not better. (However, this varies markedly from one city to another. Affordability has gotten much worse in
Chinese Urban Household Disposable income Growth
Source - National bureau of Statistics of China; data through December 2012
0
5,000
10,000
15,000
20,000
25,000
1978 1982 1986 1990 1994 1998 2002 2006 2010
China’s Secondary Home price index (2006 – 2012)
Source - Wind
90
100
110
120
130
140
150
2006 2007 2008 2009 2010 2011 2012 2013
BeijingShanghaiGuangzhouShenzhenTianjin

Global INSIGHT – CHINa ProPerTy markeT 12
CHina pRopeRty MaRKet
Shenzhen, but only moderately so in Guangdong, despite the cities being only 70 miles apart.)
There have been phases where price growth has been excessive. The most recent example was from early 2009 to early 2011 when prices in China’s key cities rose by over 90%. Part of this was due to the sluggish or even negative performance of prices in the two years prior to 2009 as global economic activity peaked, the global financial crisis unfolded (hitting China’s manufacturing and export sectors hard), and an earlier raft of tightening policies in the housing market took effect. Part of it was because China’s large, fiscal stimulus package then gave a bid to real assets.
The rapid rise in prices through to 2011 eventually led to meaningful government tightening in the sector. Primary house prices in Tier 1 cities trended downward to about RMB13,000 (US$2,100) psm by early 2012 from around RMB15,000 (US$2,400) per square meter at the start of 2011. Prices then picked up again, and at the end of 2012 were back to about RMB15,000 (US$2,400). Prices have since showed real strength in the last few months, and the government has stepped back into the fray.
However, a closer look at Tier 1 cities shows that average can be misleading. For example, primary house prices in Beijing rose by 10% in 2011 but fell 7% in 2012. In Guangzhou by comparison, prices fell by 8% in 2011 but rose by 11% in 2012. In Hangzhou (not Tier 1, but a big city), which has been one of the more-volatile housing markets, prices declined by 21% in 2011 but rose by 27% in
2012. In Tianjin, a Tier 1 city, prices rose by 5% in 2011 and 2% in 2012. Prices in Shanghai fell by 8% in 2011 and 1% in 2012. Clearly, regional differences play a major role in the housing market.
Even within the same city, house price data may be misleading. For example, housing developments that are increasingly concentrated in the cheaper, outlying areas of a city will make the average price appear lower. Alternatively, when the market improves, developers may bring higher-priced housing to market, pushing up the average selling price.
Primary house prices in 2011 and 2012 were relatively stable—on average—in Tier 2 cities (around RMB6,300 psm) and Tier 3 cities (RMB4,000 psm). One interesting point around relatively stable housing prices in Tier 2 and Tier 3 cities was sales volumes notably declined as the government turned the policy screws in 2011.
Inventory levels of new housing stood between seven and eight months of demand at the end of 2012, down by several months from the end of 2011.
tHe goveRnMent & Housing
The table on the following page highlights some of the measures that have been introduced nationally over the years to control the market. Note, though, in times of market weakness, the government has also taken measures to support the property market.
100 Cities Housing price index: Tier 1, Tier 2, Tier 3 (% change m/m)
Source - Soufun
-1.5
-1.0
-0.5
0.0
0.5
1.0
1.5
2.0
2.5
Jul-10 Nov-10 Mar-11 Jul-11 Nov-11 Mar-12 Jul-12 Nov-12
Tier-1 Cities
Tier-2 Cities
Tier-3 Cities
100 Cities Housing price index: Average Selling prices
Source - Soufun
20,000
22,500
25,000
27,500
30,000
Jun-10 Dec-10 Jun-11 Dec-11 Jun-12 Dec-128,000
10,000
12,000
14,000
16,000
Beijing (left axis) Shanghai (left axis)Shenzhen (left axis) National Average (right axis)Guangzhou (right axis) Tianjin (right axis)
RMB per square meter RMB per square meter
Global INSIGHT – CHINa ProPerTy markeT 13
CHina pRopeRty MaRKet
The most important things to point out with respect to government policy are: the government closely monitors the housing market and clearly has a fear of runaway prices; Chinese leaders at the highest levels have provided a consist barrage of rhetoric to the public with respect to the leaders’ desire to control excessive gains in prices; a wide range of national and local policy initiatives have been implemented over the past decade to control the housing market; the central government has consistently pushed local governments to follow policy; recent policy initiatives are becoming more localized and flexible to take into account different dynamics between cities; and the government, through its actions, has demonstrated its ability to significantly influence the housing market and, consequently, has credibility in the eyes of the market in that regard.
One notable point of comparison between the Chinese situation and the situation in the West with respect to frothy housing markets over the past few years is the direct involvement of China’s government at the national and local levels to attempt to exert some control. In the West, the situation has broadly been left in the hands of market forces.
While these points are generally positive, there are also a number of counterpoints: local governments are incentivized to keep land prices high and the property market moving because nearly one-half of their revenue comes from selling land to developers—most local governments cannot issue bonds, and most tax revenue is collected by the central government; consequently, the power of local governments is not to be underestimated; corruption is rife; just because the central government is focused on the property market does not mean it will be successful in fine-tuning the market—the central government is dealing with a unique, huge market with many moving parts; people are constantly finding ways around government controls; land reclamation by the government against the wishes of local residents is often cited as one of the most wide-spread human rights violations in China. For more on this final point, type “China nail houses” into Google and take a look.
There are several major objectives of government policy with respect to the housing market: to stabilize prices, to reduce speculation, and to meaningfully increase the supply of affordable housing.
property Tightening Measures
Source - China State Council; People's bank of China; National Development & reform Commission
Timing China Property Policy Introduced
2004 Loan-to-value ratio raised to 70% for purchase of second propertyForbid land sales through private negotiations; to take back land if sitting idle for two years; monthly payment limited to 50% of household income
Mortgage rate hike (5.31% to 5.51%); Shanghai raised down payment requirement to 30%
5.5% capital gain tax on residential property sold within two years of purchase"8-point measures"; Resale of uncompleted units bannedDeed tax raised to 3% for non-ordinary housing"6-point measures"90/70% rule"5-point measures"; 5.5% tax on sales for flat resale within five yearsForeign fund restriction followed by capital gainIncrease land use charges and resettlement compensationEnforcement of LATIncrease down payment requirement for second home to 1.1 PBoC rateEnforce idle land penaltyBan IPO proceeds to buy landAllow foreign companies to register at provincial levelsRmb 4 trillion stimulative measuresMinimum capital requirement lowered to 30% from 35%Rmb 900 billion public housing planCBRC reiterates 40% down payment requirement for second home mortgageReduction of transaction tax on resale of homesSale lock-up period restored to five years from two years"11-point measures"70% land supply on small-size and public homesNew "10-point measures"Second home buyers definedGovernment issued reinforcement measuresNew "8-point measures"Shanghai and Chongqing levy real estate taxFive directives by Premier Wen
2013 "5-point measures"; tightening second home loan; 20% income tax on capital gain

Global INSIGHT – CHINa ProPerTy markeT 14
CHina pRopeRty MaRKet
Price Stabilization
This is arguably the most important goal of policy. As the Chinese property market is relatively new, huge, and complex, property prices have gone through periods of fairly rapid inflation and weakness. Stable prices indicate a stable market and reduced risks. Some have argued the government is seeking to engineer stable prices while promoting robust income growth. Over time, this leads to improved affordability. The approach of the government is likely more refined than this. Modest price appreciation is allowed—perhaps even desirable—as long as it does not outpace income growth and, thereby, impact affordability. Indeed, this year, the central government has requested local governments submit housing price targets for the year.
Reduced Speculation
As discussed, the line between speculators and investors is, at best, blurred. There have been many policy initiatives over the last few years targeted specifically at speculators such as restrictions on the purchase of second and third homes and significant increases in required down payments for mortgages for such homes.
Affordable Housing
In 2011, former Premier Wen Jiabao announced China would seek to improve living standards by embarking on a huge project to build 36 million units of affordable housing by 2015. Some have said the target is beyond reach. Others have noted
The recent Notice from China’s State Council clearly reminds investors the government is still firm in its resolve to control the housing market.
some existing projects have simply been relabelled “affordable” to meet the government’s demands.
Even so, there is a push to introduce a significant number of new units. In 2013, for example, the government is targeting to begin construction on six million new units and completing 4.3 million according to Jiang Weixin, minister of housing and urban-rural development. Officially, the government claims to have completed six million units in 2012, having allocated US$37 billion during the year to such projects.
Demand for affordable housing is huge. Hundreds of millions of people still earn very little, and many live in inadequate conditions, such as small, old housing units or dormitories. Many people living in the cities still do not own their own property.
ReCent initiatives to Cool tHe MaRKet
On March 1, after several months of data showed a resurgence in Chinese house prices, China's State Council issued a Notice with more specifics regarding market controls. While much of this was either a reiteration of existing policy or a broadening of existing initiatives, it clearly reminds investors the government is still firm in its resolve to control the housing market.
There were three areas in particular of note. The first was clarification regarding "home purchase restrictions" (HPRs), a range of policies such as
Global INSIGHT – CHINa ProPerTy markeT 15
CHina pRopeRty MaRKet
limiting the number of properties someone can buy and increasing down payment requirements. HPRs are in place in 46 Chinese cities—across the whole city in 12 and in parts of the remaining 34. These 34 will now have to widen their HPRs to cover the whole city. While this is clearly a headwind for the housing market in those cities, there are a few points to note. First, China has more than 650 cities, so the widening of HPRs affects about 5% of the total. Second, a number of the biggest cities already have HPRs across the whole city, including Beijing, Shanghai, Tianjin, Shenzhen, and Wuhan. Chongqing, China's largest municipality, does not have any HPR policy in place (but it is one of the few Chinese cities to have a property tax). Of the 34 cities that will have to widen HPR to cover the whole city, most have them in place in the downtown area.
The second policy was the strict enforcement of a capital gains tax of 20% payable if a property is sold within five years. This policy was introduced a number of years ago. The difference is the central government is now looking to local governments to enforce it strictly. This is a meaningful move by the government, although we would point out it should not impact fundamental demand but rather is targeted at speculative demand.
The third policy concerned credit tightening. The Notice says banks can increase mortgage down payment requirements for second mortgages. What is notable about this is it shows policy is becoming
increasingly localized, presumably in order to deal with the disparity between different cities.
The government also encouraged cities with oversupply and where pricing is weaker to support their housing market. All in all, the measures in the Notice are more than was expected, but, for the most part, remain a reiteration of previous policies combined with a fine-tuning of policy at the local government level.
outlooK: sHoRt teRM
Over the past few months, the sector has shown some strength. Housing prices have been moving up, and the government has been more vocal. The government is set to remain vigilant on prices; excessive prices gains will inevitably lead to further policy tightening.
The government has a fine line to walk in controlling Chinese housing prices. Excessive house price inflation would clearly lead to further problems down the road. Too much tightening by the government, though, leading to a big decline in prices, could have challenging consequences. It is unlikely China would go through the U.S. experience of mass defaults on risky mortgages, concentrating losses in the banks. However, the Chinese housing market is a large chunk of China’s fixed asset investment and, therefore, growth. It also impacts consumer discretionary spending and influences the performance of the equity market.
The government has a fine line to walk. Excessive house price inflation would clearly lead to further problems down the road. Too much tightening, though, leading to a big decline in prices, could have challenging consequences.

Global INSIGHT – CHINa ProPerTy markeT 16
CHina pRopeRty MaRKet
Chinese Urbanization versus South Korean Urbanization
Source - bloomberg, National bureau of Statistics of China, Statistics korea
10%
20%
30%
40%
50%
60%
70%
80%
90%China (1980-2012)
South Korea (1970-2011)
Also, if losses were to hit the trust sector and the “wealth management” products tied to housing, it seems losses would not be concentrated in the financial sector, but rather to a more-dispersed group of investors. This would have a different set of consequences.
outlooK: long teRM
There are two drivers that will lead to significant demand for housing in China over the long term: urbanization and income growth.
Urbanization
Unsurprisingly, the majority of housing is built in China’s cities. The cities are growing in terms of people moving from the countryside, either permanently or temporarily. This accounts for about one-third of the increase in the urbanization level. The other two-thirds occurs when existing cities expand and engulf smaller communities that exist on their edges. China’s urbanization trend still has a long way to go. Approximately 53% of the population live in cities. This has risen by about 1% per year for the past 30 years. At the beginning of the “opening up” reforms of Deng Xiaoping in 1979, only 20% of the population lived in cities. Approximately 700 million people live in cities and 650 million live in the countryside.
While levels of urbanization vary across developed countries, it seems unlikely China has reached its urbanization limit. Indeed, new Prime Minister
Li Keqiang has emphasized the importance of urbanization to sustain the next leg of Chinese growth. By comparison, more than 80% of the populations in the U.S. and South Korea live in cities, and over 90% in Japan. Assuming China’s urbanization rate eventually gets to 70% or higher, at current rates, this would still take another two decades and mean an additional 17% of the population, or 230 million people, would become urbanites and require housing. In short, there is a clear, long-term need for significant growth in China’s housing stock.
Income Growth
In the Chinese government’s 12th five-year plan, a target was set to double per-capita income in China by 2020. For all of its fabled growth over the past three decades, China per-capita income remains low with plenty of room to grow. Thus, with incomes potentially doubling by 2020 and approximately 6-8%, or 80-110 million, of the population transitioning to China’s cities over the same time period, the natural bias will be for house prices in China to continue rising.
Finally, one important development to watch over time will be the introduction of property taxes in China, currently only applied in a couple of locations. On the one hand, this would be a big benefit to local governments and transform their income streams. With 45% of their revenues coming from land sales, local government revenues in China are “transactional.” A property tax would

Global INSIGHT – CHINa ProPerTy markeT 17
CHina pRopeRty MaRKet
provide recurring revenue. On the other hand, a property tax would have a really meaningful impact on reducing investment and speculative demand. One reason investment demand is so high in China is the carrying cost of property is not high. A property tax would change that.
ConClusion
China’s property market is enormous, unique, and full of challenges and opportunities. The scale of China’s urbanization is unparalleled, backed by the biggest population migration in history. And there is undoubted, real and significant wealth creation occurring in the economy. Anyone who has been a regular visitor to China over the past 20 years can attest to that. Yet this unique market carries with it unique risks which we have already outlined. The lynchpin at the centre of the market is the government. What is good is the government recognizes the importance of controlling the property market and has been explicitly attempting to do so for years. What is bad is China needs to maintain high economic growth—a crash landing of the economy is probably the biggest single risk to the incumbent Party’s hegemony—which means a continued reliance for some time yet on fixed asset investment growth, which includes housing. If there is a bubble in certain parts of the market, the government will be caught between the need to deflate it and the need for continued growth.
The lynchpin at the centre of the property market is the government.
Global INSIGHT – CHINa ProPerTy markeT 18
Analyst Certification All of the views expressed in this report accurately reflect the personal views of the responsible analyst(s) about any and all of the subject securities or issuers. No part of the compensation of the responsible analyst(s) named herein is, or will be, directly or indirectly, related to the specific recommendations or views expressed by the responsible analyst(s) in this report.
important DisclosuresRBC Wealth Management is a division of RBC Capital Markets, LLC, which is an indirect wholly-owned subsidiary of the Royal Bank of Canada and, as such, is a related issuer of Royal Bank of Canada.
Jay Roberts & Yufei Yang, employees of RBC Wealth Management USA’s foreign affiliate RBC Dominion Securities Inc. contributed to the preparation of this publication. These individuals are not registered with or qualified as research analysts with the U.S. Financial Industry Regulatory Authority (“FINRA”) and, since they are not associated persons of RBC Wealth Management, they may not be subject to NASD Rule 2711 and Incorporated NYSE Rule 472 governing communications with subject companies, the making of public appearances, and the trading of securities in accounts held by research analysts.
In the event that this is a compendium report (covers six or more companies), RBC Wealth Management may choose to provide important disclosure information by reference. To access current disclosures, clients should refer to http://www.rbccm.com/GLDisclosure/PublicWeb/DisclosureLookup.aspx?EntityID=2 to view disclosures regarding RBC Wealth Management and its affiliated firms. Such information is also available upon request to RBC Wealth Management Publishing, 60 South Sixth St, Minneapolis, MN 55402.
References to a Recommended List in the recommendation history chart may include one or more recommended lists or model portfolios maintained by RBC Wealth Management or one of its affiliates. RBC Wealth Management recommended lists include a former list called the Prime Opportunity List (RL 3), the Guided Portfolio: Prime Income (RL 6), the Guided Portfolio: Large Cap (RL 7), the Guided Portfolio: Dividend Growth (RL 8), the Guided Portfolio: Midcap 111 (RL9), and the Guided Portfolio: ADR (RL 10). RBC Capital Markets recommended lists include the Strategy Focus List and the Fundamental Equity Weightings (FEW) portfolios. The abbreviation ‘RL On’ means the date a security was placed on a Recommended List. The abbreviation ‘RL Off’ means the date a security was removed from a Recommended List.
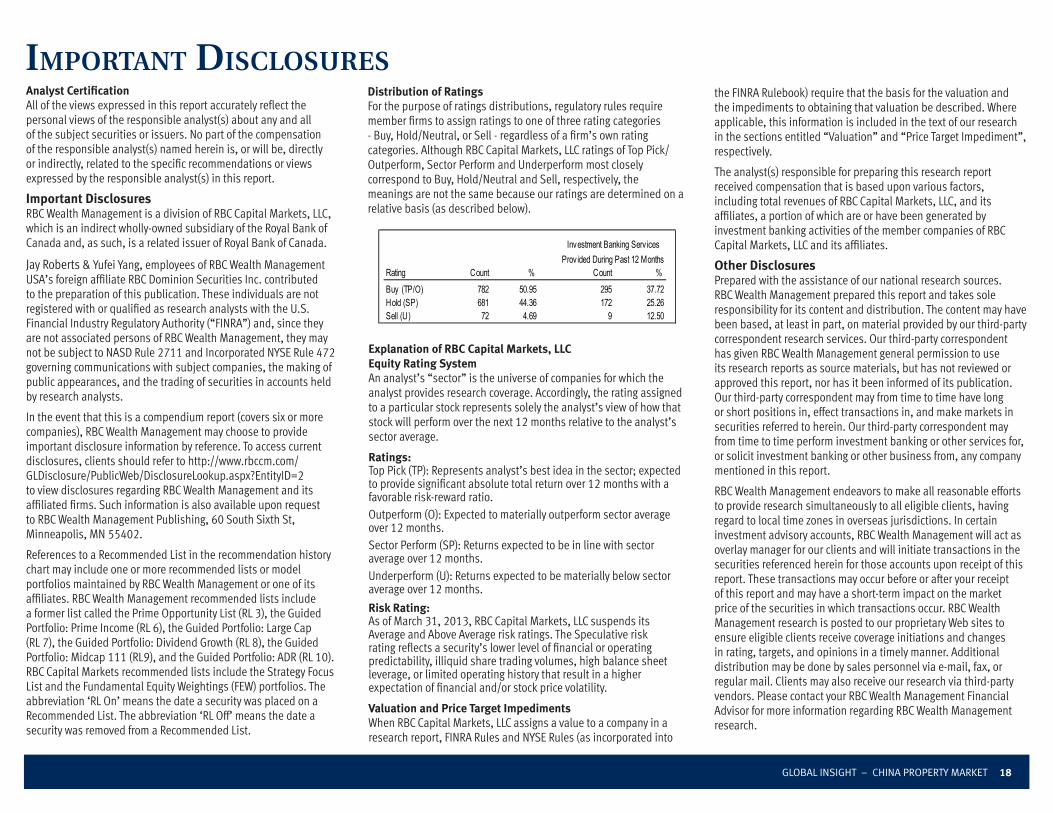
Distribution of ratingsFor the purpose of ratings distributions, regulatory rules require member firms to assign ratings to one of three rating categories - Buy, Hold/Neutral, or Sell - regardless of a firm’s own rating categories. Although RBC Capital Markets, LLC ratings of Top Pick/Outperform, Sector Perform and Underperform most closely correspond to Buy, Hold/Neutral and Sell, respectively, the meanings are not the same because our ratings are determined on a relative basis (as described below).
Rating Count % Count %Buy (TP/O) 782 50.95 295 37.72Hold (SP) 681 44.36 172 25.26Sell (U) 72 4.69 9 12.50
Investment Banking Serv ices Prov ided During Past 12 Months
the FINRA Rulebook) require that the basis for the valuation and the impediments to obtaining that valuation be described. Where applicable, this information is included in the text of our research in the sections entitled “Valuation” and “Price Target Impediment”, respectively.
The analyst(s) responsible for preparing this research report received compensation that is based upon various factors, including total revenues of RBC Capital Markets, LLC, and its affiliates, a portion of which are or have been generated by investment banking activities of the member companies of RBC Capital Markets, LLC and its affiliates.
Other DisclosuresPrepared with the assistance of our national research sources. RBC Wealth Management prepared this report and takes sole responsibility for its content and distribution. The content may have been based, at least in part, on material provided by our third-party correspondent research services. Our third-party correspondent has given RBC Wealth Management general permission to use its research reports as source materials, but has not reviewed or approved this report, nor has it been informed of its publication. Our third-party correspondent may from time to time have long or short positions in, effect transactions in, and make markets in securities referred to herein. Our third-party correspondent may from time to time perform investment banking or other services for, or solicit investment banking or other business from, any company mentioned in this report.
RBC Wealth Management endeavors to make all reasonable efforts to provide research simultaneously to all eligible clients, having regard to local time zones in overseas jurisdictions. In certain investment advisory accounts, RBC Wealth Management will act as overlay manager for our clients and will initiate transactions in the securities referenced herein for those accounts upon receipt of this report. These transactions may occur before or after your receipt of this report and may have a short-term impact on the market price of the securities in which transactions occur. RBC Wealth Management research is posted to our proprietary Web sites to ensure eligible clients receive coverage initiations and changes in rating, targets, and opinions in a timely manner. Additional distribution may be done by sales personnel via e-mail, fax, or regular mail. Clients may also receive our research via third-party vendors. Please contact your RBC Wealth Management Financial Advisor for more information regarding RBC Wealth Management research.
Explanation of rBC Capital Markets, llC Equity rating SystemAn analyst’s “sector” is the universe of companies for which the analyst provides research coverage. Accordingly, the rating assigned to a particular stock represents solely the analyst’s view of how that stock will perform over the next 12 months relative to the analyst’s sector average.
ratings:Top Pick (TP): Represents analyst’s best idea in the sector; expected to provide significant absolute total return over 12 months with a favorable risk-reward ratio.Outperform (O): Expected to materially outperform sector average over 12 months.Sector Perform (SP): Returns expected to be in line with sector average over 12 months.Underperform (U): Returns expected to be materially below sector average over 12 months.
risk rating:As of March 31, 2013, RBC Capital Markets, LLC suspends its Average and Above Average risk ratings. The Speculative risk rating reflects a security’s lower level of financial or operating predictability, illiquid share trading volumes, high balance sheet leverage, or limited operating history that result in a higher expectation of financial and/or stock price volatility.
Valuation and price Target impedimentsWhen RBC Capital Markets, LLC assigns a value to a company in a research report, FINRA Rules and NYSE Rules (as incorporated into
iMpoRtant disClosuRes

Global INSIGHT – CHINa ProPerTy markeT 19
Conflicts Disclosure: RBC Wealth Management is registered with the Securities and Exchange Commission as a broker/dealer and an investment adviser, offering both brokerage and investment advisory services. RBC Wealth Management’s Policy for Managing Conflicts of Interest in Relation to Investment Research is available from us on our Web site at http://www.rbccm.com/GLDisclosure/PublicWeb/DisclosureLookup.aspx?EntityID=2. Conflicts of interests related to our investment advisory business can be found in Part II of the Firm’s Form ADV or the Investment Advisor Group Disclosure Document. Copies of any of these documents are available upon request through your Financial Advisor. We reserve the right to amend or supplement this policy, Part II of the ADV, or Disclosure Document at any time.
The authors are employed by one of the following entities: RBC Wealth Management USA, a division of RBC Capital Markets, LLC, a securities broker-dealer with principal offices located in Minnesota and New York, USA; by RBC Dominion Securities Inc., a securities broker-dealer with principal offices located in Toronto, Canada; by RBC Investment Services (Asia) Limited, a subsidiary of RBC Dominion Securities Inc., a securities broker-dealer with principal offices located in Hong Kong, China; and by Royal Bank of Canada Investment Management (U.K.) Limited, an investment management company with principal offices located in London, United Kingdom.
DisclaimerThe information contained in this report has been compiled by RBC Wealth Management, a division of RBC Capital Markets, LLC, from sources believed to be reliable, but no representation or warranty, express or implied, is made by Royal Bank of Canada, RBC Wealth Management, its affiliates or any other person as to its accuracy, completeness or correctness. All opinions and estimates contained in this report constitute RBC Wealth Management’s judgment as of the date of this report, are subject to change without notice and are provided in good faith but without legal responsibility. This report is not an offer to sell or a solicitation of an offer to buy any securities. Past performance is not a guide to future performance, future returns are not guaranteed, and a loss of original capital may occur. Every province in Canada, state in the U.S., and most countries throughout the world have their own laws regulating the types of securities and other investment products which may be offered to their residents, as well as the process for doing so. As a result, the securities discussed in this report may not be eligible for sale in some jurisdictions. This report is not, and under no circumstances should be construed as, a solicitation to act
as securities broker or dealer in any jurisdiction by any person or company that is not legally permitted to carry on the business of a securities broker or dealer in that jurisdiction. Nothing in this report constitutes legal, accounting or tax advice or individually tailored investment advice. This material is prepared for general circulation to clients, including clients who are affiliates of Royal Bank of Canada, and does not have regard to the particular circumstances or needs of any specific person who may read it. The investments or services contained in this report may not be suitable for you and it is recommended that you consult an independent investment advisor if you are in doubt about the suitability of such investments or services. To the full extent permitted by law neither Royal Bank of Canada nor any of its affiliates, nor any other person, accepts any liability whatsoever for any direct or consequential loss arising from any use of this report or the information contained herein. No matter contained in this document may be reproduced or copied by any means without the prior consent of Royal Bank of Canada. Additional information is available upon request.
To U.S. residents: This publication has been approved by RBC Capital Markets, LLC, Member NYSE/FINRA/SIPC, which is a U.S. registered broker-dealer and which accepts responsibility for this report and its dissemination in the United States. RBC Capital Markets, LLC, is an indirect wholly-owned subsidiary of the Royal Bank of Canada and, as such, is a related issuer of Royal Bank of Canada. Any U.S. recipient of this report that is not a registered broker-dealer or a bank acting in a broker or dealer capacity and that wishes further information regarding, or to effect any transaction in, any of the securities discussed in this report, should contact and place orders with RBC Capital Markets, LLC. International investing involves risks not typically associated with U.S. investing, including currency fluctuation, foreign taxation, political instability and different accounting standards.To Canadian residents: This publication has been approved by RBC Dominion Securities Inc. RBC Dominion Securities Inc.* and Royal Bank of Canada are separate corporate entities which are affiliated. *Member-Canadian Investor Protection Fund. ®Registered trademark of Royal Bank of Canada. Used under license. RBC Wealth Management is a registered trademark of Royal Bank of Canada. Used under license.To European residents: Clients of United Kingdom subsidiaries may be entitled to compensation from the UK Financial Services Compensation Scheme if any of these entities cannot meet its obligations. This depends on the type of business and the circumstances of the claim. Most types of investment business are covered for up to a total of £50,000. The Channel Islands subsidiaries are not covered by the UK Financial Services
Compensation Scheme; the offices of Royal Bank of Canada (Channel Islands) Limited in Guernsey and Jersey are covered by the respective compensation schemes in these jurisdictions for deposit taking business only. To Hong Kong residents: This publication is distributed in Hong Kong by RBC Investment Services (Asia) Limited and RBC Investment Management (Asia) Limited, licensed corporations under the Securities and Futures Ordinance or, by Royal Bank of Canada, Hong Kong Branch, a registered institution under the Securities and Futures Ordinance. This material has been prepared for general circulation and does not take into account the objectives, financial situation, or needs of any recipient. Hong Kong persons wishing to obtain further information on any of the securities mentioned in this publication should contact RBC Investment Services (Asia) Limited, RBC Investment Management (Asia) Limited or Royal Bank of Canada, Hong Kong Branch at 17/Floor, Cheung Kong Center, 2 Queen’s Road Central, Hong Kong (telephone number is 2848-1388).To Singapore residents: This publication is distributed in Singapore by RBC (Singapore Branch) and RBC (Asia) Limited, registered entities granted offshore bank status by the Monetary Authority of Singapore. This material has been prepared for general circulation and does not take into account the objectives, financial situation, or needs of any recipient. You are advised to seek independent advice from a financial adviser before purchasing any product. If you do not obtain independent advice, you should consider whether the product is suitable for you. Past performance is not indicative of future performance.
Copyright © RBC Capital Markets, LLC 2013 - Member NYSE/FINRA/SIPCCopyright © RBC Dominion Securities Inc. 2013 - Member - Canadian Investor Protection FundCopyright © RBC Europe Limited 2013Copyright © Royal Bank of Canada 2013All rights reserved
disClosuRes and disClaiMeR

This document is produced by the Global Portfolio Advisory Committee within RBC Wealth Management’s Portfolio Advisory Group. The RBC Wealth Management Portfolio Advisory Group provides support related to asset allocation and portfolio construction for the firm’s investment advisors / financial advisors who are engaged in assembling portfolios incorporating individual marketable securities. The Committee leverages the broad market outlook as developed by the RBC Investment Strategy Committee, providing additional tactical and thematic support utilizing research from the RBC Investment Strategy Committee, RBC Capital Markets, and third party resources.
Global Portfolio Advisory Committee members: Janet Engels – Co-chair; Head of U.S. Equities, RBC Wealth Management Portfolio Advisory Group, RBC Capital Markets, LLC Jim Allworth – Co-chair; Portfolio Strategist, RBC Dominion Securities Inc.
Maarten Jansen – Head of RBC Wealth Management Portfolio Advisory Group, RBC Dominion Securities Inc. Mark Allen – Portfolio Advisor, RBC Wealth Management Portfolio Advisory Group, RBC Dominion Securities Inc.
Rajan Bansi – Head of Fixed Income Strategies, RBC WM Portfolio Advisory Group, RBC Dominion Securities Inc. Matt Barasch – Head of Canadian Equities, RBC WM Portfolio Advisory Group, RBC Dominion Securities Inc.
Craig Bishop – Manager, Fixed Income Strategies, RBC Wealth Management Portfolio Advisory Group, RBC Capital Markets, LLC Kelly Bogdanov – Portfolio Analyst, RBC Wealth Management Portfolio Advisory Group, RBC Capital Markets, LLC
Frédérique Carrier – Director, European Equities, Royal Bank of Canada Investment Management (UK) Ltd. George King – Head of Portfolio Strategy, Royal Bank of Canada Investment Management (UK) Ltd.
René Morgenthaler – Head of Investment, RBC (Suisse) SA, RBC International Wealth Management Alan Robinson – Portfolio Advisor, RBC Wealth Management Portfolio Advisory Group, RBC Capital Markets, LLC
Jay Roberts – Head of Asian Equities, RBC Wealth Management Portfolio Advisory Group, RBC Dominion Securities Inc.
ReseaRCH ResouRCes
(4/13)