China Polyurethane Monthly Report 201801pu.chem366.com/report/2018/ms1.pdf · 2018-04-24 · China...
42
China Polyurethane Monthly Report 201801
Transcript of China Polyurethane Monthly Report 201801pu.chem366.com/report/2018/ms1.pdf · 2018-04-24 · China...
China Polyurethane Monthly Report 201801

China Polyurethane Monthly Report 201801
Content
1 Polyurethane Market Overview and Forecast .......................................................................................................... 1 1.1 Polyurethane Index Analysis .......................................................................................................................... 1
2 Polyurethane Raw Material Market .......................................................................................................................... 2 2.1 Propylene Oxide ............................................................................................................................................. 2
2.1.1 Market Overview ............................................................................................................................ 2 2.1.2 RMB & USD Prices .......................................................................................................................... 2 2.1.3 China Propylene Oxide Facility Dynamics ....................................................................................... 3 2.1.4 Import & Export Data ..................................................................................................................... 3 2.1.5 Future Market Forecast .................................................................................................................. 4
2.2 TDI .................................................................................................................................................................. 5 2.2.1 Market Overview ............................................................................................................................ 5 2.2.2 RMB & USD Prices .......................................................................................................................... 5 2.2.3 Asian TDI Facility Dynamics ............................................................................................................ 6 2.2.4 Import & Export Data ..................................................................................................................... 6 2.2.5 Future Market Forecast .................................................................................................................. 8
2.3 Polyether Polyols ........................................................................................................................................... 8 2.3.1 Market Overview ............................................................................................................................ 8 2.3.2 RMB & USD Prices .......................................................................................................................... 9 2.3.3 China Polyether Polyols Facility Dynamics .................................................................................... 10 2.3.4 Import & Export Data ................................................................................................................... 11 2.3.5 Future Market Forecast ................................................................................................................ 12
2.4 Polymeric MDI.............................................................................................................................................. 13 2.4.1 Market Overview .......................................................................................................................... 13 2.4.2 RMB & USD Prices ........................................................................................................................ 13 2.4.3 Asian MDI Facility Dynamics ......................................................................................................... 14 2.4.4 Import & Export Data ................................................................................................................... 14 2.4.5 Future Market Forecast ................................................................................................................ 16
2.5 Pure MDI ...................................................................................................................................................... 16 2.5.1 Market Overview .......................................................................................................................... 16 2.5.2 RMB & USD Prices ........................................................................................................................ 17 2.5.3 Asian MDI Facility Dynamics ......................................................................................................... 17 2.5.4 Import & Export Data ................................................................................................................... 18 2.5.5 Future Market Forecast ................................................................................................................ 20
2.6 HDI ............................................................................................................................................................... 20 2.7 Adipic Acid ................................................................................................................................................... 20
2.7.1 Market Overview .......................................................................................................................... 20 2.7.2 RMB & USD Prices ........................................................................................................................ 20 2.7.3 China AA Facility Dynamics ........................................................................................................... 21 2.7.4 Import & Export Data ................................................................................................................... 22 2.7.5 Future Market Forecast ................................................................................................................ 23
2.8 PTMEG ......................................................................................................................................................... 24
China Polyurethane Monthly Report 201801
2.8.1 Market Overview .......................................................................................................................... 24 2.8.2 RMB & USD Prices ........................................................................................................................ 24 2.8.3 Asian PTMEG Facility Dynamics .................................................................................................... 25 2.8.4 Import & Export Data ................................................................................................................... 26 2.8.5 Future Market Forecast ................................................................................................................ 28
2.9 Southeast Asia & India PU Market ............................................................................................................... 28 2.9.1 TDI ................................................................................................................................................ 28
2.9.1.1 Market Overview ................................................................................................................... 28 2.9.1.2 Price Trend ............................................................................................................................. 28 2.9.1.3 Forecast .................................................................................................................................. 29
2.9.2 MDI ............................................................................................................................................... 29 2.9.2.1 Market Overview ................................................................................................................... 29 2.9.2.2 Polymeric MDI Price Trend ..................................................................................................... 30 2.9.2.3 Forecast .................................................................................................................................. 30
2.9.3 Polyether Polyols .......................................................................................................................... 30 2.9.3.1 Market Overview ................................................................................................................... 30 2.9.3.2 Price Trend ............................................................................................................................. 31 2.9.3.3 Forecast .................................................................................................................................. 32
3. Polyurethane Products Market Analysis ................................................................................................................ 32 3.1 Flexible Foam ............................................................................................................................................... 32 3.2 Rigid Foam ................................................................................................................................................... 32 3.3 PU Resin ....................................................................................................................................................... 32
4. Downstream Industries .......................................................................................................................................... 33 4.1 Flexible Foam Downstream ......................................................................................................................... 33
4.1.1 Upholstered Furniture .................................................................................................................. 33 4.1.2 Automobile ................................................................................................................................... 33
4.2 Rigid Foam Downstream .............................................................................................................................. 34 4.2.1 Home Appliances .......................................................................................................................... 34 4.2.2 Building Insulation ........................................................................................................................ 35
4.3 PU Resin Downstream ................................................................................................................................. 35 4.3.1 Light Leather ................................................................................................................................. 35 4.3.2 Footwear ...................................................................................................................................... 35
About Suntower Consulting Limited .......................................................................................................................... 36

China Polyurethane Monthly Report 201801
Table & Graph
Figure 1 China PU Index Trend in Jan. 2017 ......................................................................................................... 1 Figure 2 2016-2017 Propylene Oxide Weekly Price Trend ................................................................................... 2 Figure 3 2016-2017 China Propylene Oxide Imports Volume Comparison ......................................................... 4 Figure 4 2016-2017 China TDI RMB & USD Price Trend ....................................................................................... 5 Figure 5 2016-2017 China TDI Imports & Exports Volume Comparison .............................................................. 7 Figure 6 2016-2017 China Flexible Slab Polyols RMB & USD Price Trend .......................................................... 10 Figure 7 2016-2017 China Polyols Im/Exports Volume Comparison ................................................................. 12 Figure 8 2017-2018 China Polymeric MDI RMB & USD Price Trend .................................................................. 13 Figure 9 2016-2017 China Polymeric MDI Im & Exports Volume Comparison .................................................. 15 Figure 10 2017-2018 China Pure MDI RMB & USD Price Trend ......................................................................... 17 Figure 11 2016-2017 China Pure MDI Im & Exports Volume Comparison......................................................... 19 Figure 12 2016-2017 China AA RMB Price Trend ............................................................................................... 20 Figure 13 2016-2017 China AA, its Salts and Esters Im/Exports Volume Comparison ...................................... 22 Figure 14 2016-2017 China PTMEG RMB & USD Price Trend ............................................................................ 25 Figure 15 2016-2017 China PTMEG Imports & Exports Volume Comparison ................................................... 26 Figure 16 2016-2017 SE Asia & India TDI Price Trend ........................................................................................ 29 Figure 17 2016-2017 SE Asia & India Polymeric MDI Price Trend ...................................................................... 30 Figure 18 2017-2018 SE Asia & India Polyether Polyols Price Trend .................................................................. 31 Table 1 Monthly PO RMB and USD Prices Comparison ....................................................................................... 2 Table 2 China Propylene Oxide Im/Export Flow in 2016 and 2017 (Tons) ........................................................... 3 Table 3 China PO Imports Top Origins in 2017 (Tons) .......................................................................................... 4 Table 4 Monthly TDI RMB and USD Prices Comparison ....................................................................................... 5 Table 5 China TDI Im/Export Flow in 2017 (Tons) ................................................................................................ 6 Table 6 China TDI Imports Top Origins in 2017 (Tons) ......................................................................................... 7 Table 7 China TDI Exports Top Destinations in 2017 (Tons) ................................................................................. 7 Table 8 Domestic Main TDI Exporters in 2017 (Tons) .......................................................................................... 7 Table 9 Monthly Polyols RMB and USD Prices Comparison ................................................................................. 9 Table 10 China Polyols Im/Export Flow in 2016 and 2017 (Tons) ...................................................................... 11 Table 11 China Polyols Exports Top Destinations in 2017 (Tons) ....................................................................... 12 Table 12 Domestic Main Polyols Exporters in 2017 (Tons) ................................................................................ 12 Table 13 Monthly Polymeric MDI RMB and USD Prices Comparison ................................................................ 13 Table 14 China Polymeric MDI Im/Export Flow in 2017 (Tons) .......................................................................... 14 Table 15 China Polymeric MDI Imports Top Origins in 2017 (Tons) ................................................................... 15 Table 16 China PMDI Exports Top Destinations in 2017 (Tons) .......................................................................... 16 Table 17 Domestic Main PMDI Exports in 2017 (Tons) ...................................................................................... 16 Table 18 Monthly Pure MDI RMB and USD Prices Comparison ......................................................................... 17 Table 19 China Pure MDI Im/Export Flow in 2017 (Tons) .................................................................................. 18 Table 20 China Pure MDI Imports Top Origins in 2017 (Tons) ............................................................................ 19 Table 21 China Pure MDI Exports Top Destinations in 2017 (Tons) ................................................................... 19 Table 22 China Pure MDI Main Exports in 2017 (Tons) ...................................................................................... 19 Table 23 Monthly Adipic Acid RMB and USD Prices Comparison ...................................................................... 20

China Polyurethane Monthly Report 201801
Table 24 China AA, its Salts and Esters Im/Export Flow in 2017 (Tons) ............................................................. 22 Table 25 China AA, its Salts and Esters Exports Top Destinations in 2017(Tons) ............................................... 23 Table 26 Domestic Main AA, its Salts and Esters Exporters in 2017 (Tons) ....................................................... 23 Table 27 Monthly PTMEG RMB and USD Prices Comparison ............................................................................ 24 Table 28 China PTMEG Export/Import Flow in 2017 (Tons) ............................................................................... 26 Table 29 China PTMEG Imports Top Origins in 2017 (Tons) ............................................................................... 27 Table 30 China PTMEG Imports Top Origins in 2017 (Tons) ............................................................................... 27 Table 31 China PTMEG Exports Top Destinations in 2017 (Tons) ....................................................................... 27 Table 32 Domestic Main PTMEG Exporters in 2017 (Tons) ................................................................................ 27 Table 33 China BHI index in 2017 ....................................................................................................................... 33 Table 34 China Auto Outputs & Sales in 2017 (Unit: 1,000) .............................................................................. 33 Table 35 China Auto Im/Export Data in 2017 ..................................................................................................... 33 Table 36 China Household Refrigerator Outputs in 2017 .................................................................................. 34 Table 37 China Household Freezer Outputs in 2017 .......................................................................................... 34
China Polyurethane Monthly Report 201801
1 Polyurethane Market Overview and Forecast
Jan. Ave. (RMB/Ton)
Dec. Ave. (RMB/Ton) Up & Down Remarks Overview & Forecast
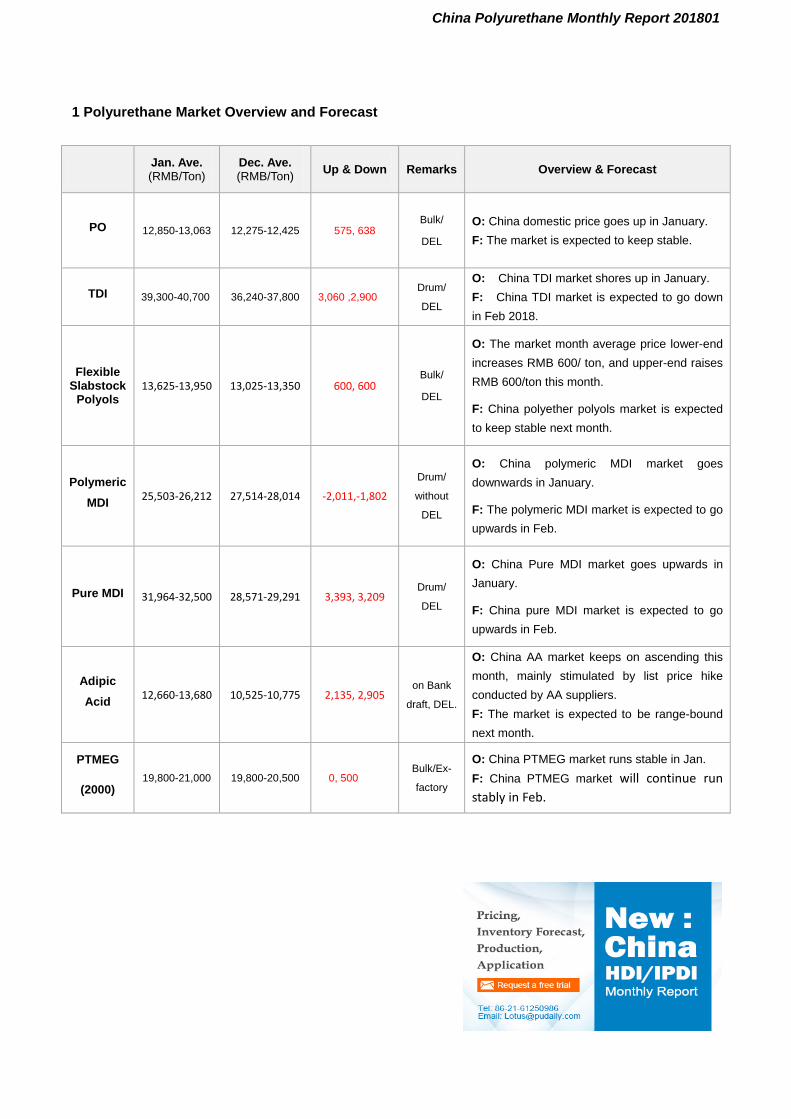
PO 12,850-13,063 12,275-12,425 575, 638 Bulk/
DEL
O: China domestic price goes up in January. F: The market is expected to keep stable.
TDI 39,300-40,700 36,240-37,800 3,060 ,2,900 Drum/
DEL
O: China TDI market shores up in January. F: China TDI market is expected to go down in Feb 2018.
Flexible Slabstock
Polyols 13,625-13,950 13,025-13,350 600, 600
Bulk/
DEL
O: The market month average price lower-end increases RMB 600/ ton, and upper-end raises RMB 600/ton this month.
F: China polyether polyols market is expected to keep stable next month.
Polymeric MDI 25,503-26,212 27,514-28,014 -2,011,-1,802
Drum/
without
DEL
O: China polymeric MDI market goes downwards in January.
F: The polymeric MDI market is expected to go upwards in Feb.
Pure MDI 31,964-32,500 28,571-29,291 3,393, 3,209 Drum/
DEL
O: China Pure MDI market goes upwards in January.
F: China pure MDI market is expected to go upwards in Feb.
Adipic Acid 12,660-13,680 10,525-10,775 2,135, 2,905
on Bank
draft, DEL.
O: China AA market keeps on ascending this month, mainly stimulated by list price hike conducted by AA suppliers. F: The market is expected to be range-bound next month.
PTMEG
(2000) 19,800-21,000 19,800-20,500 0, 500
Bulk/Ex-
factory
O: China PTMEG market runs stable in Jan. F: China PTMEG market will continue run stably in Feb.

China Polyurethane Monthly Report 201801
1.1 Polyurethane Index Analysis
Figure 1 China PU Index Trend in Jan. 2017
PUdaily PU Composite index peaked at the beginning of the month and has since risen slowly. This
month the composite index is mainly supported by flexible foam and PU resin index. PUdaily rigid foam index keeps weak running in January as downstream sectors are in slack season recently. Main raw
materials like polymeric MDI remain regular supply this month, so its price decreases heavily this month.
The rigid foam index is decreasing everyday. The flexible foam index goes down in the first ten days and
then keeps almost stable in January, because both TDI and polyether polyols continue to rise to current
price range. The PU Resin Index goes upwards this month due to increasing pure MDI and AA price.
1,3651,3701,3751,3801,3851,3901,3951,4001,4051,410
2-Jan-18 11-Jan-18 20-Jan-18 29-Jan-18
Inde
x Po
int
Composite
1,4601,4801,5001,5201,5401,5601,5801,6001,620
1-Jan-18 8-Jan-18 15-Jan-1822-Jan-1829-Jan-18
Inde
x po
int
PUdaily Flexible Foam Index
1,400
1,450
1,500
1,550
1,600
Inde
x Po
int
PUdaily Rigid Foam Index
940
970
1,000
1,030
1,060
1,090
1-Jan-18 10-Jan-18 19-Jan-18 28-Jan-18
Inde
x po
int
PUdaily PU Resin Index
1 / 36
China Polyurethane Monthly Report 201801
2 Polyurethane Raw Material Market
2.1 Propylene Oxide
2.1.1 Market Overview
China propylene oxide market price goes down this month, from RMB 14,000/ton to RMB 12,200/ton,
and the average price increases by RMB 575-638/ton than last month. This month China propylene oxide
deal market continued stalemate, factories have a small amount of inventories, and the downstream
market have low purchasing atmosphere. By the end of this month, the mainstream transaction price is
about RMB 12,200-12,350/ton by cash payment by bulk in east China.
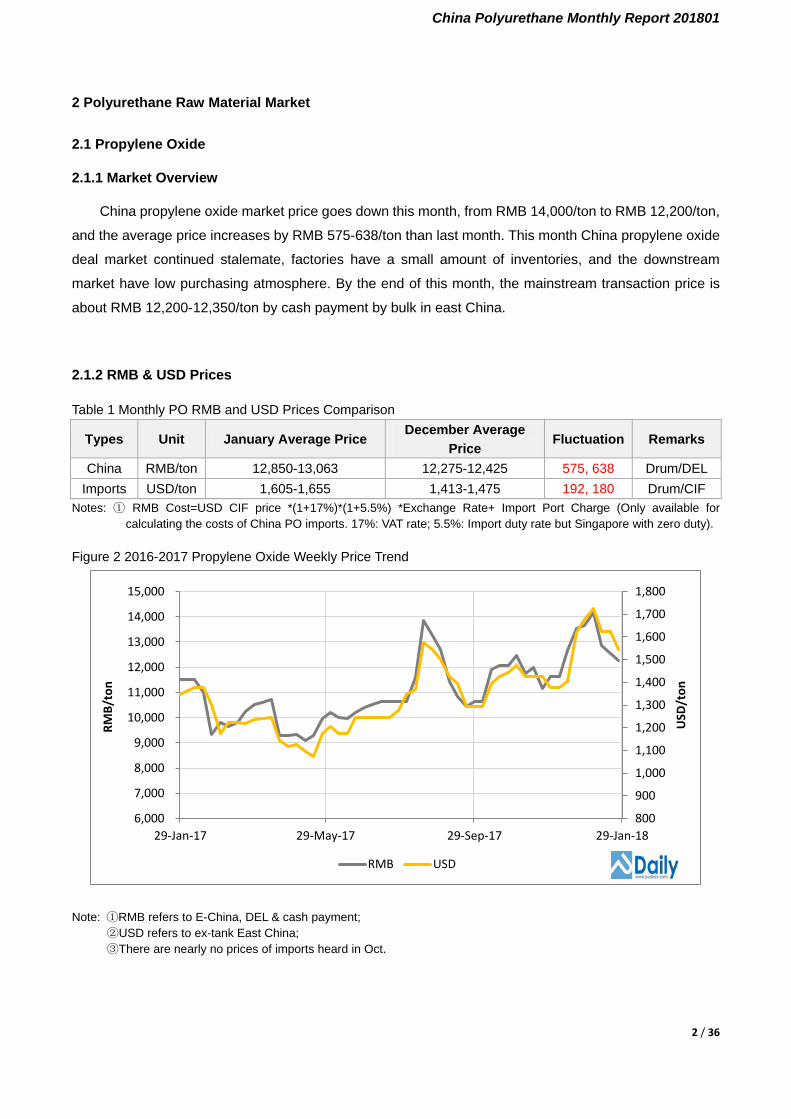
2.1.2 RMB & USD Prices
Table 1 Monthly PO RMB and USD Prices Comparison
Types Unit January Average Price December Average
Price Fluctuation Remarks
China RMB/ton 12,850-13,063 12,275-12,425 575, 638 Drum/DEL Imports USD/ton 1,605-1,655 1,413-1,475 192, 180 Drum/CIF
Notes: ① RMB Cost=USD CIF price *(1+17%)*(1+5.5%) *Exchange Rate+ Import Port Charge (Only available for calculating the costs of China PO imports. 17%: VAT rate; 5.5%: Import duty rate but Singapore with zero duty).
Figure 2 2016-2017 Propylene Oxide Weekly Price Trend
Note: ①RMB refers to E-China, DEL & cash payment;
②USD refers to ex-tank East China; ③There are nearly no prices of imports heard in Oct.
800
900
1,000
1,100
1,200
1,300
1,400
1,500
1,600
1,700
1,800
6,000
7,000
8,000
9,000
10,000
11,000
12,000
13,000
14,000
15,000
29-Jan-17 29-May-17 29-Sep-17 29-Jan-18
USD
/ton
RMB/
ton
RMB USD
2 / 36

China Polyurethane Monthly Report 201801
2.1.3 China Propylene Oxide Facility Dynamics
Producer Location Capacity(Ktpa) Average Monthly Production Rate
Wudi Xinyue Chemical Co., Ltd. Binzhou, Shandong 350 79% CNOOC and Shell Petrochemicals Company
Limited Huizhou, Guangdong 320 90%
Jishen Chemical Industry Co., Ltd. Jilin, Jilin 300 0% Ningbo ZRCC Lyondell Chemical Co., Ltd. Ningbo, Zhejiang 285 100%
Jinling Hunsman Co., Ltd. Nanjing, Jiangsu 240 90% Shandong Befar Group Co., Ltd. Binzhou, Shandong 280 69%
Wanhua Chemical Yantai, Shandong 264 98% Shandong Jinling Chemical Co., Ltd. Dongying, Shandong 160 100% Shandong Sanyue Group Co., Ltd Binzhou, Shandong 240 80% Tianjin Dagu Chemical Co., Ltd. Tianjin 150 48%
Fangda Jinhua Chemical Technology Co., Ltd. Huludao, Liaoning 120 100% Nanjing KUMHO GPRO Chemical Co., Ltd. Nanjing, Jiangsu 100 71%
Shandong Daze Chemical Co., Ltd. Heze, Shandong 100 70%
Shandong Huatai Chemical Co., Ltd. Dongying, Shandong 80 77% Shandong Shida Shenghua Chemical Co., Ltd. Dongying, Shandong 70 100%
Shandong Zhonghai Fine Chemical Binzhou, Shandong 62 50% Meizhouwan Chlor-alkali Chemical Industry Co.,
Ltd. Quanzhou, Fujian 40 100%
Total 3,161
Average Monthly Production Rate 74.42%
2.1.4 Import & Export Data
China propylene oxide imports were 19,054 tons in December, increasing by 18.66% from year on
year (16,058), decreasing by 22.32% from last month (24,530). Top imports came from Saudi Arabia and
the follower is Thailand with each quantity at 12,350 tons and 6,704 tons.
China propylene oxide exports were 19 tons in December, decreasing by 99.37% from year on year
(6), decreasing by 99.38% from last month (3,052). Top exports came from India and American with each
quantity is 18.5 tons and 0.6 tons.
Table 2 China Propylene Oxide Im/Export Flow in 2016 and 2017 (Tons)
Month HS Code: 29102000
Import Export Jan-17 32,701 122
Feb-17 12,156 0.25
Mar-17 18,719 101
Apr-17 10,588 264
May-17 13,208 13.2
Jun-17 25,917 18
Jul-17 22,109 0.3
Aug-17 7,801 6
3 / 36

China Polyurethane Monthly Report 201801
Sept-17 32,247 0.9
Oct-17 13,515 0.15
Nov-17 24,530 3,052
Dec-17 19,054 19
Sum-17 232,545 3,597
Nov -17 Year on Year 18.66% -99.37%
Nov -17 Month on Month -22.32% -99.38%
Table 3 China PO Imports Top Origins in 2017 (Tons)
Jan. Feb. Mar. Apr. May Jun. Jul. Aug. Sep. Oct. Nov. Dec. Total
Saudi Arabia
23,630 2,800 1,000 5,574 0 12,500 11,500 3,000 15,910 6,490 13,133 12,350 107,887
Thailand 5,143 6,504 7,333 3,002 10,708 9,305 10,608 4,801 7,352 4,402 9,304 6,704 85,165
USA 3,929 2,851 8,377 2,012 0 4,110 1
7,990 2,623 2,093 0 33,986
Brazil 0 0 2,001 0 2,500 0 0 0 0 0 0 0 4,501
Singapore 0 0 0 0 0 0 0 0 991 0 0 0 991
Japan 0 0 9 0 0 2 0 0 3 0 0 0 14
Figure 3 2016-2017 China Propylene Oxide Imports Volume Comparison
2.1.5 Future Market Forecast
In next month, China propylene oxide is expected to keep stable. Recently, the propylene oxide
market continues to be horizontal and deadlocked. The propylene oxide holder is expected to hold the
quotation, and the downstream customers will buy it properly, but it may not be bought in large quantities.
The market atmosphere is insipid, on the other hand, the terminal factory will soon stop working,
preparing for the Spring Festival. The upstream and downstream stalemate, the market is mainly stable.
The price of propylene oxide is expected to be in the range of about RMB 11,900-12,200/ton in next
month.
05,000
10,00015,00020,00025,00030,00035,00040,00045,00050,000
Jan. Feb. Mar. Apr. May Jun. Jul. Aug. Sep. Oct. Nov. Dec.
Uni
t: to
ns
2016-2017 China Propylene Oxide Imports Volume Comparison
2016 2017
4 / 36

China Polyurethane Monthly Report 201801
2.2 TDI
2.2.1 Market Overview
China TDI market rises up in January supported by supply tightness. Before Jan. 10, the prices
soften slightly as suppliers begin to deliver cargoes of orders placed at them, and traders do not have
much cargo in hand, but buyers are bearish on future outlook as prices already run at high level. However,
on Jan. 10, the news that BASF Shanghai begin to reduce allocation to distributors and traders come to
be known by market participants, and the TDI prices begin to rebound as the trading market does not
have many stocks circulating. Later, many suppliers include Gansu Yinguang, SEEC and Cangzhou
Dahua report that they have production issues, which worsens the supply tightness and boost the prices
to rise up by another RMB 1,000-2,000/ton in late January.
2.2.2 RMB & USD Prices
Table 4 Monthly TDI RMB and USD Prices Comparison Types Unit January Average Price December Average Price Fluctuation Remarks
China RMB/ton 39,300 -40,700 36,240-37,800 3,060 , 2,900 Drum/DEL
Imports USD/ton 4,500-4,540 4,410-4,480 90, 60 Drum/CIF
Note: RMB Cost =USD CIF price*(1+17%)*(1+6.5%)*(1+ anti-dumping Rate) * Exchange Rate +Import Port Charge (Only
available for calculating the costs of China TDI imports. 17%: VAT rate, 6.5%: import duty rate; Anti-dumping rate depends
on origins).
Figure 4 2016-2017 China TDI RMB & USD Price Trend
Note: ①RMB refers to E-China, Drum/DEL;
②USD refers to Spot Price Drum/CIF China
1,000
2,000
3,000
4,000
5,000
10,000
20,000
30,000
40,000
50,000
60,000
1-Jan-16 18-Apr-16 4-Aug-16 20-Nov-16 8-Mar-17 24-Jun-17 10-Oct-17 26-Jan-18
USD
/ton
RMB/
ton
RMB USD
5 / 36
China Polyurethane Monthly Report 201801
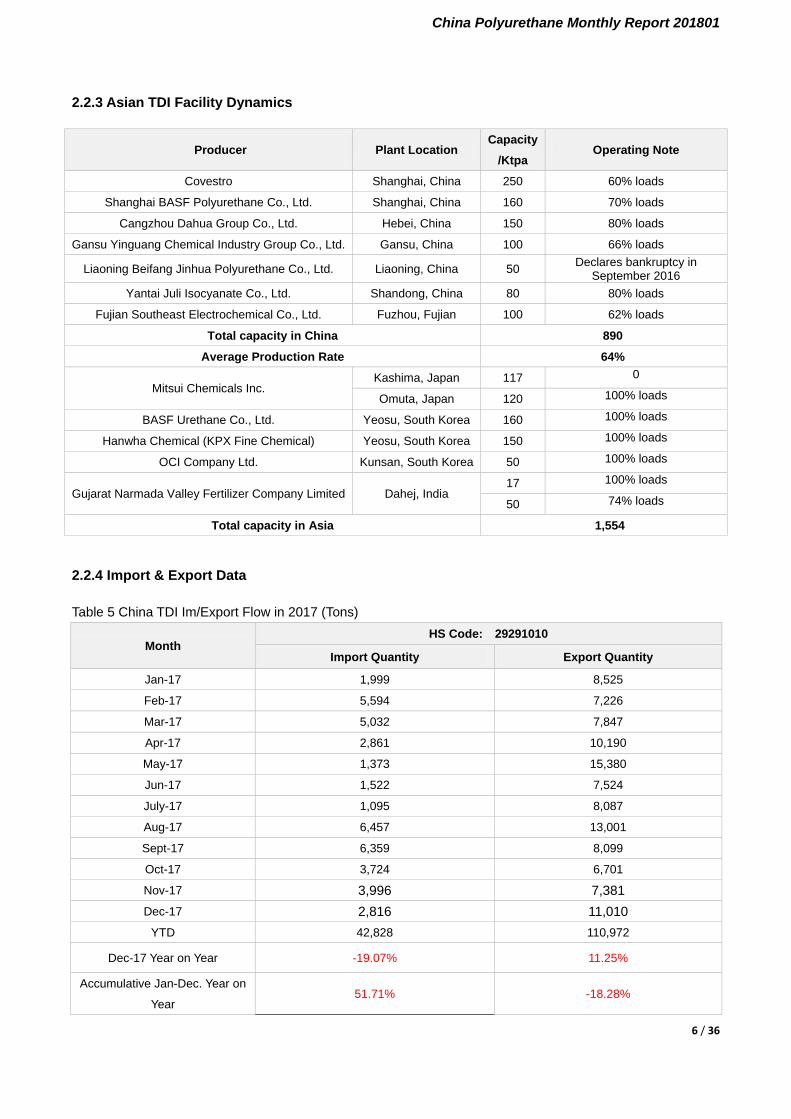
2.2.3 Asian TDI Facility Dynamics
Producer Plant Location Capacity
/Ktpa Operating Note
Covestro Shanghai, China 250 60% loads
Shanghai BASF Polyurethane Co., Ltd. Shanghai, China 160 70% loads
Cangzhou Dahua Group Co., Ltd. Hebei, China 150 80% loads
Gansu Yinguang Chemical Industry Group Co., Ltd. Gansu, China 100 66% loads
Liaoning Beifang Jinhua Polyurethane Co., Ltd. Liaoning, China 50 Declares bankruptcy in September 2016
Yantai Juli Isocyanate Co., Ltd. Shandong, China 80 80% loads
Fujian Southeast Electrochemical Co., Ltd. Fuzhou, Fujian 100 62% loads
Total capacity in China 890
Average Production Rate 64%
Mitsui Chemicals Inc. Kashima, Japan 117 0
Omuta, Japan 120 100% loads
BASF Urethane Co., Ltd. Yeosu, South Korea 160 100% loads
Hanwha Chemical (KPX Fine Chemical) Yeosu, South Korea 150 100% loads
OCI Company Ltd. Kunsan, South Korea 50 100% loads
Gujarat Narmada Valley Fertilizer Company Limited Dahej, India 17 100% loads
50 74% loads
Total capacity in Asia 1,554
2.2.4 Import & Export Data
Table 5 China TDI Im/Export Flow in 2017 (Tons)
Month HS Code: 29291010
Import Quantity Export Quantity
Jan-17 1,999 8,525
Feb-17 5,594 7,226
Mar-17 5,032 7,847
Apr-17 2,861 10,190
May-17 1,373 15,380
Jun-17 1,522 7,524
July-17 1,095 8,087
Aug-17 6,457 13,001
Sept-17 6,359 8,099
Oct-17 3,724 6,701
Nov-17 3,996 7,381 Dec-17 2,816 11,010
YTD 42,828 110,972
Dec-17 Year on Year -19.07% 11.25%
Accumulative Jan-Dec. Year on
Year 51.71% -18.28%
6 / 36

China Polyurethane Monthly Report 201801
Figure 5 2016-2017 China TDI Imports & Exports Volume Comparison
Table 6 China TDI Imports Top Origins in 2017 (Tons)
Jan. Feb. Mar. Apr. May Jun. Jul. Aug. Sep. Oct. Nov. Dec. Total
South Korea 1,095 4,221 3,191 2,300 738 772 415 4,677 5,316 2,554 2,361 972 28,612
Japan 525 1,180 1,660 281 335 150 100 1,100 883 781 645 581 8,221
Germany 20 80 140 120 120 60 40 120 60 50 90 40 940
Hungary -- -- -- -- -- 200 -- -- -- -- -- -- 200
Table 7 China TDI Exports Top Destinations in 2017 (Tons)
Jan. Feb. Mar. Apr. May Jun. Jul. Aug. Sep. Oct. Nov. Dec. Total
India 459 505 1,182 391 428 1,097 1,245 538 989 738 1,171 425 9,168
Indonesia 580 540 2,120 580 360 400 40 1,540 740 320 620 460 8,300
Taiwan 1,520 449 25 2,405 160 45 650 600 1,950 1,150 25 935 9,914
Philippines 840 280 685 700 500 720 380 500 620 620 800 360 7,005
Thailand 538 424 414 394 459 319 473 284 424 394 399 344 4,866
Table 8 Domestic Main TDI Exporters in 2017 (Tons)
Jan. Feb. Mar. Apr. May. Jun. Jul. Aug. Sep. Oct. Nov. Dec. Total
Covestro 6,08
5
7,06
2
7,62
7
7,01
0
10,00
0
4,42
4
4,61
7
10,87
7
7,63
9
5,96
1
5,64
1
9,32
0
86,26
3
BASF -- -- -- -- -- 100 400 580 -- -- 500 280 1,860
Cangzhou Dahua
723 26 -- 880 2,300 780 380 440 220 -- -- -- 5,749
Gansu Yinguang
620 -- -- -- -- -- -- -- -- -- -- -- 620
SEEC 180 -- -- 140 1,900 1,48
0
1,55
0 800 100 680 980
1,13
0 8,940
Yantai Juli
820 -- 140 1,90
0 1,020 540
1,04
0 203 -- -- 120 180 5,963
01,0002,0003,0004,0005,0006,0007,0008,0009,000
Jan. Mar. May Jul. Sep. Nov.
Uni
t: to
ns
Imports Volume Comparision
2016 2017
0
5,000
10,000
15,000
20,000
25,000
Jan. Mar. May Jul. Sep. Nov.
Uni
t: to
ns
Exports Volume Comparison
2016 2017
7 / 36
China Polyurethane Monthly Report 201801
2.2.5 Future Market Forecast
China TDI market is expected to go down in February. For supply, the two Shanghai suppliers will
reduce allocations to customers in February, but China brand TDI supply will be sufficient in the month.
For demand, downstream producers are to come back till the last week of February, so demand will be
the weakest of the year, which is expected to drag down the market as a result.
2.3 Polyether Polyols
2.3.1 Market Overview
Flexible Slabstocks Polyols
China flexible slabstocks polyols price goes down this month, and the average price increases by
RMB 600/ton than last month. The negotiation interval is downward, the market trading volume is light,
the high-end price is back down. At the end of this month, spot prices are heard at RMB
12,600-12,800/ton in bulk and ex-work in north China, and RMB 12,900-13,200/ton in east China in bulk
and ex-work in east China, and RMB 13,100-13,600/ton in south China in bulk and DEL.
Flexible High Resilience Polyols
China flexible high resilience (HR) polyols price goes down this month, and the average price
increases by RMB 550-775/ton than last month. The downstream replenishment is cautious, the
transaction is weak. At the end of this month, spot prices are heard at RMB 13,000-13,600/ton in bulk and
ex-work in north China, RMB 14,200-14,600/ton in drum and ex-work in east China, and RMB
14,200-14,600/ton in south China in drum and DEL.
Polymer Polyols
China polymer polyols market price goes down this month, The negotiation interval is downward, the
high-end price is back down, the transaction is weak. Till the month end, 2045 pop spot prices are heard
at RMB 13,100-13,600/ton in bulk and ex-work in north China, RMB 14,200-14,800/ton in drum and
ex-work in east and south China. HR POP spot prices are heard at RMB 13,500-15,500/ton in bulk and
ex-work in north China, RMB 14,600-15,800/ton in drum and ex-work in east and south China.
Elastomer Polyols
China elastomer polyols market price meets a large rise compared with last month. China elastomer
polyols market average price increase by RMB 500-550/ton compared with last month. The downstream
replenishment is careful, the high-end price is back down. Till the month end, offers are heard at RMB
13,800-14,200/ton in east China, RMB 13,800-14,200/ton in south China, both in drum and DEL, and
RMB 12,600-13,200/ton in north China in bulk and EXW.
8 / 36

China Polyurethane Monthly Report 201801
Rigid Polyols
Rigid polyols market goes up compared with last month. The downstream replenishment is cautious,
the market trading volume is light and the transaction mood is weak. Till the end of this month,
mainstream discussions of middle class 4110, oil included, are at RMB 10,800-12,000/ton EXW in drum
and cash. Mainstream discussions of middle class 4110, oil excluded, stand at RMB 11,800-12,500/ton.
2.3.2 RMB & USD Prices
Table 9 Monthly Polyols RMB and USD Prices Comparison
Products Types Unit January
Average Price December
Average Price Fluctuation Remarks
Flexible Slabstock Polyols
China RMB/ton 13,625-13,950 13,025-13,350 600, 600 Bulk/DEL
Import USD/ton 1,725-1,775 1,613-1,675 112, 100 Drum/CIF
Export USD/ton 1,980-2,043 1,775-1,825 205, 218 Drum/FOB
Flexible Polyols (HR) China RMB/ton 14,725-15,250 14,175-14,475 550, 775 Drum/DEL
Export USD/ton 2,090-2,153 1,888-1,938 202, 215 Drum/FOB
POP (slabstock)
China RMB/ton 14,700-15,575 15,000-15,700 -300, -125 Drum/DEL
Import USD/ton 2,075-2,100 1,938-2,025 137, 75 Drum/CIF
Export USD/ton 2,173-2,100 2,035-2,100 138, 0 Drum/FOB
POP (HR) China RMB/ton 15,275-16,575 15,225-15,975 50, 600 Drum/DEL
Elastomer Polyols China RMB/ton 14,400-14,775 13,900-14,225 500, 550 Drum/DEL
Export USD/ton 2,083-2,138 1,888-1,938 195, 200 Drum/FOB
Rigid Polyols China RMB/ton 11,750-12,275 11,175-11,875 575, 400 Drum/DEL
Note: China: ① Flexible Slabstock Polyols brands: 5623、5613、560S、3031K、5616, etc;
② Flexible Polyols (HR) brands: 330N、820、703、3603, etc;
③ Rigid Polyols brands: Conventional rigid polyols 4110;
④POP (slabstock) brands: 2045、2042;
⑤ POP (HR) brands: 3628、3630, etc.
⑥ Elastomer Polyols brands: 220, 210, etc.
Imports: ① Flexible Slabstock Polyols brands include: 5613、2025A、5616, etc.
② POP (slabstock) refers to 42-45% solid content polymeric polyols.
Exports: ① Flexible Slabstock Polyols includes the MW 3000;
② POP (common-grade) refers to 42-45% solid content polymeric polyols;
③ HR Polyols: MW 4800-5000, such as 330N;
④ Elastomer Polyols: MW 1000 and MW 2000, such as 210/220.
RMB Cost=USD CIF price *(1+17%)*(1+6.5%)*Exchange Rate+ Import Port Charge
(Only available for calculating the costs of China polyether polyols imports. 17%: VAT Rate; 6.5%: Import Duty Rate but
Singapore with zero duty.
9 / 36

China Polyurethane Monthly Report 201801
Figure 6 2016-2017 China Flexible Slab Polyols RMB & USD Price Trend
Note: ①RMB refers to E-China, Bulk /DEL;
②USD refers to Drum/CIF China.
2.3.3 China Polyether Polyols Facility Dynamics
Producer Location Capacity (Ktpa) Production Note
Shandong Bluestar Dongda Chemical Industry Co., Ltd Zibo, Shandong 300 60%
CNOOC and Shell Petrochemicals Company Ltd Huizhou, Guangdong 270 90%
Zibo Dexin Lianbang Industry Chemical Co., Ltd Zibo, Shandong 230 60% Shandong Longhua Chemical Technology Co., Ltd Zibo, Shandong 200 60%
Jiangsu Changhua Polyurethane Co., Ltd Zhangjiagang, Jiangsu 180 70%
Fangda Jinhua Chemical Technology Co., Ltd Huludao, Liaoning 190 70% Jiangsu Zhongshan Chemical Co., Ltd. Nanjing, Jiangsu 150 60%
Jiahua (Binzhou) Chemical Co., Ltd Binzhou, Shandong 150 60% Sinopec Tianjin Petrochemical Polyether Polyols Division Tianjin 140 60%
Nanjing KUMHO GPRO Chemical Co., Ltd Nanjing, Jiangsu 130 50% Tianjin Dagu Fine Chemical Co., Ltd Tianjin 120 Shut down
Rigid Polyols Supplier Location Capacity (Ktpa) Production Note
Jurong Ningwu New Material Development Co., Ltd. Jurong, Jiangsu 400 60% Hebei Yadong Chemical Group Co., Ltd Shijiazhuang, Hebei 200 60%
Jiahua (Binzhou) Chemical Co., Ltd Binzhou, Shandong 150 50% Others 2,310
Total capacity 4,970 Average Monthly Production Rate 70%
1,000
1,100
1,200
1,300
1,400
1,500
1,600
1,700
1,800
1,900
7,000
8,000
9,000
10,000
11,000
12,000
13,000
14,000
15,000
16,000
26-Jan-17 26-May-17 26-Sep-17 26-Jan-18
USD
/ton
RMB/
ton
RMB USD
10 / 36

China Polyurethane Monthly Report 201801
2.3.4 Import & Export Data
China polyether polyols imports are 51,179 tons in December, increasing by 1.56% compared with
last month and up by 13.54% on year-on-year basis. Top imports come from Saudi Arabia and the
followers are Singapore and Thailand with each quantity of 11,370 tons, 10,008 tons and 9,500 tons
respectively.
China polyether polyols exports are 42,824 tons in December, increasing by 0.87% compared with
last month and up by 6.61% on year-on-year basis. Top exports come from South Korea, followed by
Vietnam and Pakistan, with each quantity at 3,945 tons, 3,543 tons and 3,340 tons respectively.
Table 10 China Polyols Im/Export Flow in 2017 (Tons)
Month HS Code: 39072090
Import Export
Jan-17 36,819 33,907
Feb-17 44,884 28,917
Mar-17 48,989 41,428
Apr-17 39,106 43,902
May-17 41,567 52,150
Jun-17 36,188 51,937
Jul-17 38,937 45,891
Aug-17 47,291 40,935
Sept-17 50,180 36,299
Oct-17 43,048 40,863
Nov-17 50,395 42,453
Dec-17 51,179 42,824
Sum-17 528,583 501,506
Nov -17 Year on Year 13.54% 6.61%
Nov -17 Month on Month 1.56% 0.87%
11 / 36
China Polyurethane Monthly Report 201801
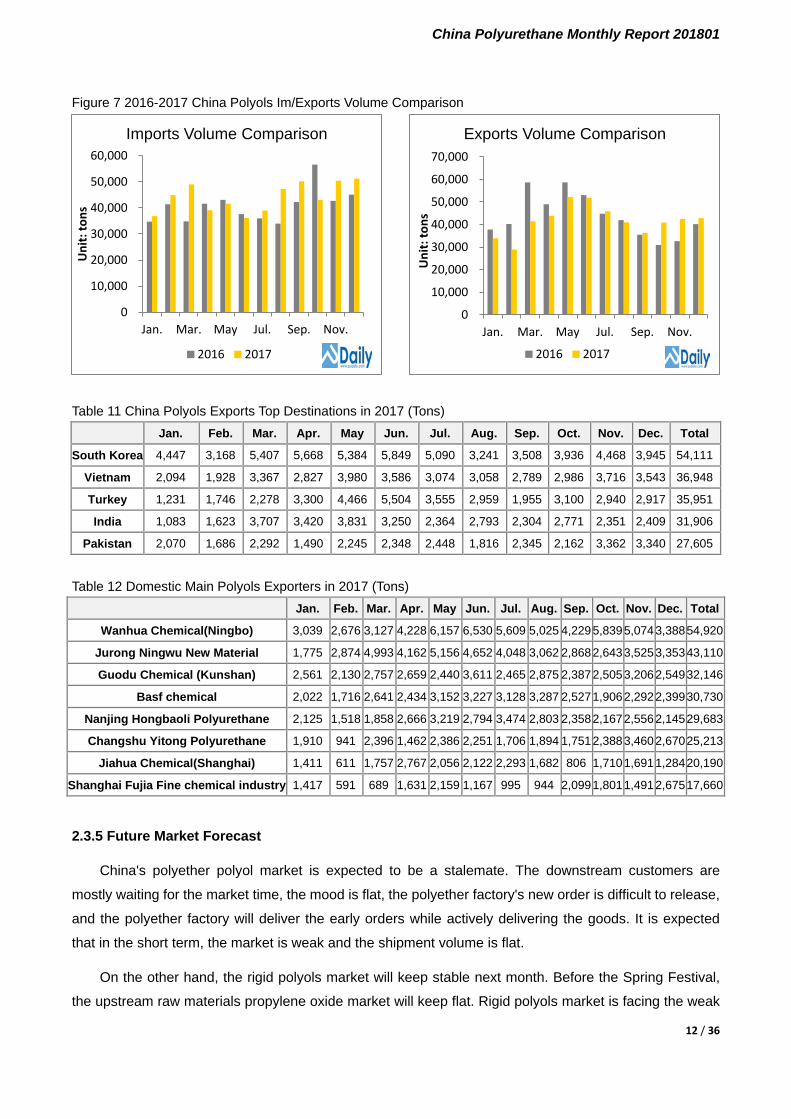
Figure 7 2016-2017 China Polyols Im/Exports Volume Comparison
Table 11 China Polyols Exports Top Destinations in 2017 (Tons)
Jan. Feb. Mar. Apr. May Jun. Jul. Aug. Sep. Oct. Nov. Dec. Total
South Korea 4,447 3,168 5,407 5,668 5,384 5,849 5,090 3,241 3,508 3,936 4,468 3,945 54,111
Vietnam 2,094 1,928 3,367 2,827 3,980 3,586 3,074 3,058 2,789 2,986 3,716 3,543 36,948
Turkey 1,231 1,746 2,278 3,300 4,466 5,504 3,555 2,959 1,955 3,100 2,940 2,917 35,951
India 1,083 1,623 3,707 3,420 3,831 3,250 2,364 2,793 2,304 2,771 2,351 2,409 31,906
Pakistan 2,070 1,686 2,292 1,490 2,245 2,348 2,448 1,816 2,345 2,162 3,362 3,340 27,605
Table 12 Domestic Main Polyols Exporters in 2017 (Tons)
Jan. Feb. Mar. Apr. May Jun. Jul. Aug. Sep. Oct. Nov. Dec. Total
Wanhua Chemical(Ningbo) 3,039 2,676 3,127 4,228 6,157 6,530 5,609 5,025 4,229 5,839 5,074 3,388 54,920
Jurong Ningwu New Material 1,775 2,874 4,993 4,162 5,156 4,652 4,048 3,062 2,868 2,643 3,525 3,353 43,110
Guodu Chemical (Kunshan) 2,561 2,130 2,757 2,659 2,440 3,611 2,465 2,875 2,387 2,505 3,206 2,549 32,146
Basf chemical 2,022 1,716 2,641 2,434 3,152 3,227 3,128 3,287 2,527 1,906 2,292 2,399 30,730
Nanjing Hongbaoli Polyurethane 2,125 1,518 1,858 2,666 3,219 2,794 3,474 2,803 2,358 2,167 2,556 2,145 29,683
Changshu Yitong Polyurethane 1,910 941 2,396 1,462 2,386 2,251 1,706 1,894 1,751 2,388 3,460 2,670 25,213
Jiahua Chemical(Shanghai) 1,411 611 1,757 2,767 2,056 2,122 2,293 1,682 806 1,710 1,691 1,284 20,190
Shanghai Fujia Fine chemical industry 1,417 591 689 1,631 2,159 1,167 995 944 2,099 1,801 1,491 2,675 17,660
2.3.5 Future Market Forecast
China's polyether polyol market is expected to be a stalemate. The downstream customers are
mostly waiting for the market time, the mood is flat, the polyether factory's new order is difficult to release,
and the polyether factory will deliver the early orders while actively delivering the goods. It is expected
that in the short term, the market is weak and the shipment volume is flat.
On the other hand, the rigid polyols market will keep stable next month. Before the Spring Festival,
the upstream raw materials propylene oxide market will keep flat. Rigid polyols market is facing the weak
0
10,000
20,000
30,000
40,000
50,000
60,000
Jan. Mar. May Jul. Sep. Nov.
Uni
t: to
ns
Imports Volume Comparison
2016 2017
0
10,000
20,000
30,000
40,000
50,000
60,000
70,000
Jan. Mar. May Jul. Sep. Nov.
Uni
t: to
ns
Exports Volume Comparison
2016 2017
12 / 36
China Polyurethane Monthly Report 201801
operation, some downstream manufacturers reserve raw materials in case of the Spring Festival
transportation inconvenience, but in the sales slack season, the market transactions has small amount,
the atmosphere is light, the actual negotiation space increases.
2.4 Polymeric MDI
2.4.1 Market Overview
China polymeric MDI market goes downwards with price decreasing by RMB 1,900/ton compared to last
month. Supply from MDI manufactures keeps regular, while downstream demand is stepping into deep cold
seasons. For the supply is overcoming demand, price is slightly decreasing with price decreasing by RMB
100-200/ton day by day. Covestro low price cargos crush the market at the last half of this month. Traders are
hurry to make fast deliveries for their negative attitude towards the future market.
However, Wanhua sources are still quoted at high price for they want to stable the market, it’s decreasing
so heavily recently. It seems that this policy does no work for many manufactures are lowing quotations to sell
more cargos.
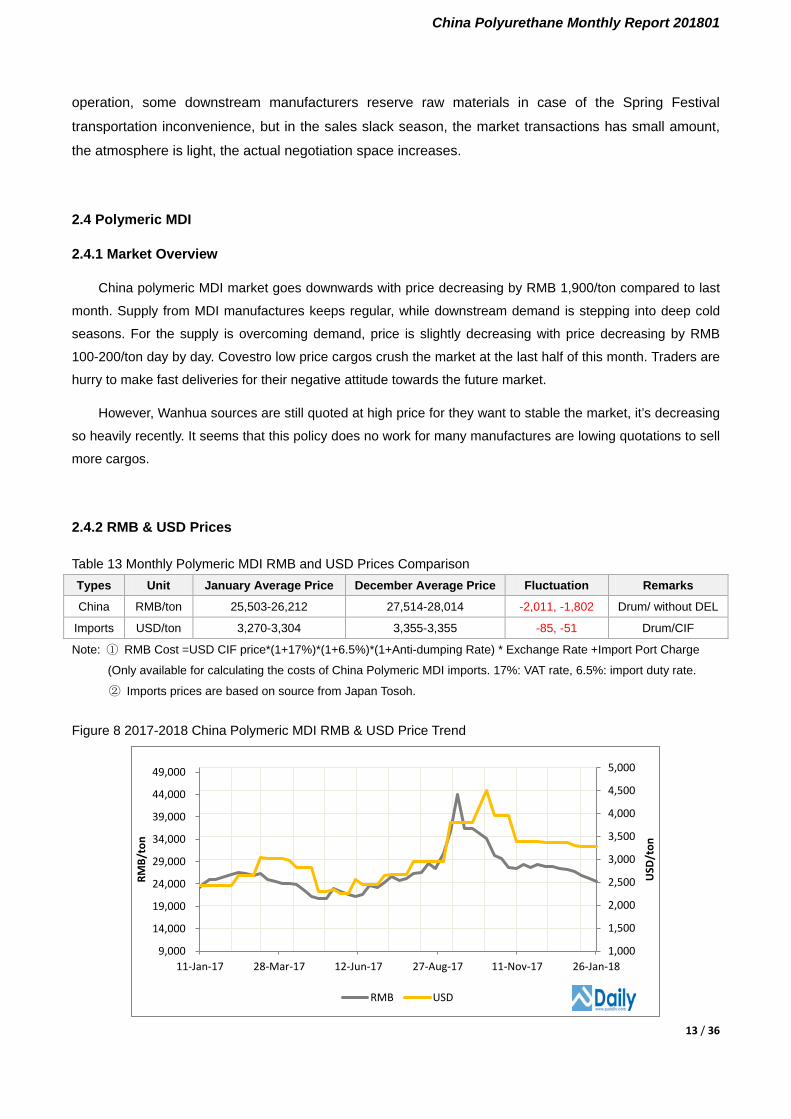
2.4.2 RMB & USD Prices
Table 13 Monthly Polymeric MDI RMB and USD Prices Comparison Types Unit January Average Price December Average Price Fluctuation Remarks
China RMB/ton 25,503-26,212 27,514-28,014 -2,011, -1,802 Drum/ without DEL
Imports USD/ton 3,270-3,304 3,355-3,355 -85, -51 Drum/CIF
Note: ① RMB Cost =USD CIF price*(1+17%)*(1+6.5%)*(1+Anti-dumping Rate) * Exchange Rate +Import Port Charge
(Only available for calculating the costs of China Polymeric MDI imports. 17%: VAT rate, 6.5%: import duty rate.
② Imports prices are based on source from Japan Tosoh.
Figure 8 2017-2018 China Polymeric MDI RMB & USD Price Trend
1,000
1,500
2,000
2,500
3,000
3,500
4,000
4,500
5,000
9,000
14,000
19,000
24,000
29,000
34,000
39,000
44,000
49,000
11-Jan-17 28-Mar-17 12-Jun-17 27-Aug-17 11-Nov-17 26-Jan-18
USD
/ton
RMB/
ton
RMB USD
13 / 36

China Polyurethane Monthly Report 201801
Note: ① RMB refers to E-China, Drum/Ex-Factory; ②USD refers to Drum/CIF China.
2.4.3 Asian MDI Facility Dynamics
Producer Plant Location Capacity/Ktpa Production Rate
Wanhua Chemical (Ningbo) Co., Ltd. Ningbo, China 400 40% loads
Wanhua Chemical (Ningbo) Co., Ltd. Ningbo, China 800 0% loads
Wanhua Chemical Group Co., Ltd. Yantai, China 600 80% loads
Covestro Shanghai, China 500 90% loads
BASF Chongqing Chongqing, China 400 0% loads
Shanghai Lianheng Isocyanate Co., Ltd.# Shanghai, China 350 100% loads.
Shanghai BASF Polyurethane Co., Ltd.* Shanghai, China 210 80% loads.
Huntsman (Shanghai) Polyurethane Co., Ltd.* Shanghai, China 160 90% loads
Tosoh (Ruian) Co., Ltd.* Zhejiang, China 80 100% loads
Total capacity in China 3,050
Average Operation loads 48% loads
Tosoh Corporation Nanyo, Japan 400 80% loads
Kumho Mitsui Chemicals Inc. Yeosu, South Korea 350 60% loads
BASF Urethane Co., Ltd. Yeosu, South Korea 250 80% loads
Sadara Chemical Company Saudi Arabia Jubail 400 50% loads
Total capacity in Asia 4,450
Average Operation loads 53% loads
Note: ①“#” means that Shanghai Lianheng has only synthesis facility.
②“*” refers that BASF, Huntsman and Tosoh (Ruian) have only distillation facility.
③Total capacity is calculated on mother liquid.
2.4.4 Import & Export Data
In December, China polymeric MDI imports under the HS code of 39093100 were 25,836 tons, up by
48.91% year on year and up by 23.99% month on month, according to PUdaily im & exports Data. Major
origins for December imports were Japan (11,615 tons), Saudi Arabia (10,646 tons) and South Korea
(2,521 tons).
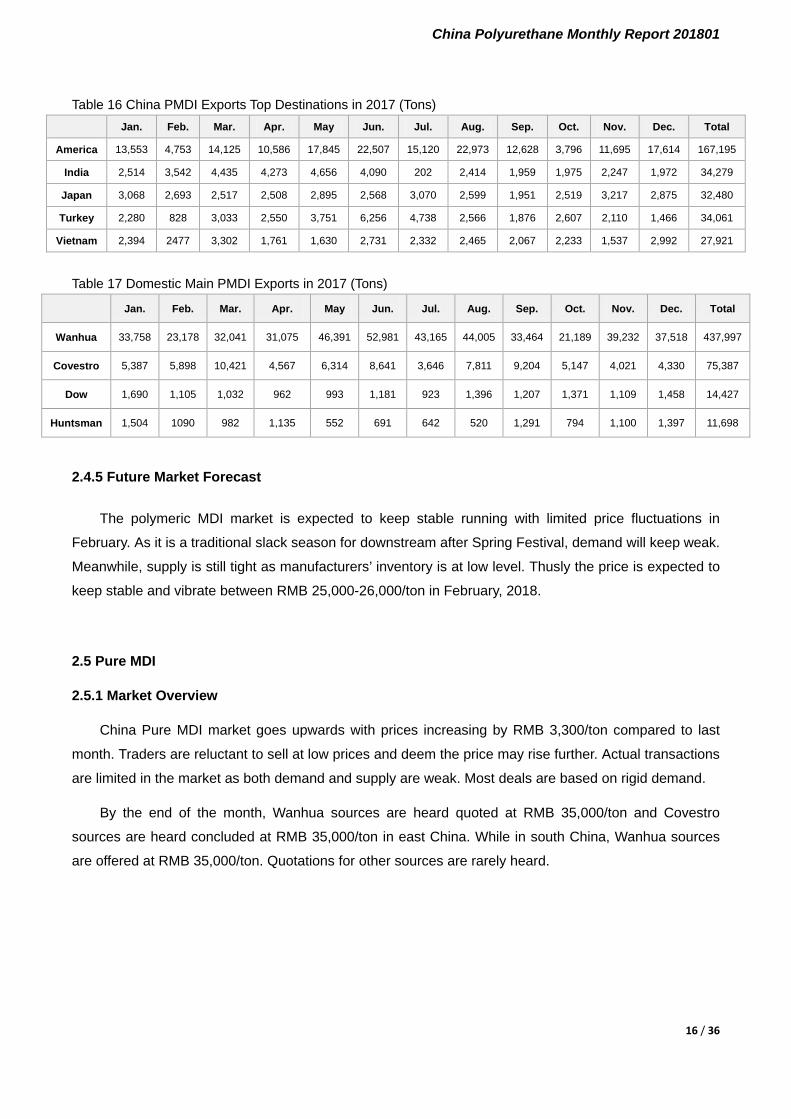
Exports in December, 2017 were 46,258 tons, up by 63.64% year on year and down by 1.27% month
on month. The top destinations for exports were US (11,695 tons), Netherlands (6,000 tons), South Korea
(4,557 tons) and Japan (3,217 tons).
Wanhua Chemical remained as the largest MDI exporter in China with total exports volume of 37,518
tons in December, accounting for 81.11% in total exports, followed by Covestro (4,330 tons), and
Huntsman (1,397 tons).
14 / 36

China Polyurethane Monthly Report 201801
Table 14 China Polymeric MDI Im/Export Flow in 2017 (Tons)
Month HS Code: 39093010
Import Export
Jan-17 19,488 44,014
Feb-17 22,301 32,189
Mar-17 26,855 45,687
Apr-17 15,180 40,296
May-17 13,803 56,715
Jun-17 15,226 68,245
Jul-17 17,833 50,573
Aug-17 18,875 55,449
Sep-17 21,618 46,382
Oct-17 15,842 29,705
Nov-17 20,838 46,854
Dec-17 25,836 46,258
Total 233,694 562,366
Dec -17 Year on Year 48.91% 63.64%
Dec -17 Month on Month 23.99% -1.27%
Figure 9 2016-2017 China Polymeric MDI Im & Exports Volume Comparison
Table 15 China Polymeric MDI Imports Top Origins in 2017 (Tons)
Jan. Feb. Mar. Apr. May Jun. Jul. Aug. Sep. Oct. Nov. Dec. Total
Japan 12,850 12,805 13,724 8,618 7,066 8,749 9,235 11,031 11,194 7,549 8,605 11,615 123,041
KR 5,637 8,248 8,972 3,654 2,066 3,561 4,896 5,692 4,670 2,926 3,009 2,521 55,852
America 326 525 874 956 1,528 160 2,508 331 2,275 462 2,100 334 12,379
NL 60 167 576 680 215 140 371 240 279 210 286 241 3,465
Germany 461 342 274 538 383 544 515 244 246 339 657 362 4,905
0
8,000
16,000
24,000
32,000
Jan. Mar. May Jul. Sep. Nov.
Uni
t: To
ns
Imports Volume Comparison
2016 2017
0
20,000
40,000
60,000
80,000
Jan. Mar. May Jul. Sep. Nov.
Uni
t: To
ns
Exports Volume Comparison
2016 2017
15 / 36
China Polyurethane Monthly Report 201801
Table 16 China PMDI Exports Top Destinations in 2017 (Tons)
Jan. Feb. Mar. Apr. May Jun. Jul. Aug. Sep. Oct. Nov. Dec. Total
America 13,553 4,753 14,125 10,586 17,845 22,507 15,120 22,973 12,628 3,796 11,695 17,614 167,195
India 2,514 3,542 4,435 4,273 4,656 4,090 202 2,414 1,959 1,975 2,247 1,972 34,279
Japan 3,068 2,693 2,517 2,508 2,895 2,568 3,070 2,599 1,951 2,519 3,217 2,875 32,480
Turkey 2,280 828 3,033 2,550 3,751 6,256 4,738 2,566 1,876 2,607 2,110 1,466 34,061
Vietnam 2,394 2477 3,302 1,761 1,630 2,731 2,332 2,465 2,067 2,233 1,537 2,992 27,921
Table 17 Domestic Main PMDI Exports in 2017 (Tons)
Jan. Feb. Mar. Apr. May Jun. Jul. Aug. Sep. Oct. Nov. Dec. Total
Wanhua 33,758 23,178 32,041 31,075 46,391 52,981 43,165 44,005 33,464 21,189 39,232 37,518 437,997
Covestro 5,387 5,898 10,421 4,567 6,314 8,641 3,646 7,811 9,204 5,147 4,021 4,330 75,387
Dow 1,690 1,105 1,032 962 993 1,181 923 1,396 1,207 1,371 1,109 1,458 14,427
Huntsman 1,504 1090 982 1,135 552 691 642 520 1,291 794 1,100 1,397 11,698
2.4.5 Future Market Forecast
The polymeric MDI market is expected to keep stable running with limited price fluctuations in
February. As it is a traditional slack season for downstream after Spring Festival, demand will keep weak.
Meanwhile, supply is still tight as manufacturers’ inventory is at low level. Thusly the price is expected to
keep stable and vibrate between RMB 25,000-26,000/ton in February, 2018.
2.5 Pure MDI
2.5.1 Market Overview
China Pure MDI market goes upwards with prices increasing by RMB 3,300/ton compared to last
month. Traders are reluctant to sell at low prices and deem the price may rise further. Actual transactions
are limited in the market as both demand and supply are weak. Most deals are based on rigid demand.
By the end of the month, Wanhua sources are heard quoted at RMB 35,000/ton and Covestro
sources are heard concluded at RMB 35,000/ton in east China. While in south China, Wanhua sources
are offered at RMB 35,000/ton. Quotations for other sources are rarely heard.
16 / 36

China Polyurethane Monthly Report 201801
2.5.2 RMB & USD Prices
Table 18 Monthly Pure MDI RMB and USD Prices Comparison Types Unit January Average Price December Average Price Fluctuation Remarks
China RMB/ton 31,964-32,500 28,571-29,291 3,393, 3,209 Drum/DEL
Imports USD/ton 3,404-3,404 3,257-3,257 147, 147 Drum/CIF
Note: RMB Cost =USD CIF price*(1+17%)*(1+6.5%)*(1+Anti-dumping Rate) * Exchange Rate +Import Port Charge
(Only available for calculating the costs of China pure MDI imports. 17%: VAT rate, 6.5%: import duty rate.
Figure 10 2017-2018 China Pure MDI RMB & USD Price Trend
Note: ① RMB refers to E-China, Drum/Ex-Factory;
②USD refers to Drum/CIF China.
2.5.3 Asian MDI Facility Dynamics
Producer Plant Location Capacity/Ktpa Production Rate
Wanhua Chemical (Ningbo) Co., Ltd. Ningbo, China 400 40% loads
Wanhua Chemical (Ningbo) Co., Ltd. Ningbo, China 800 0% loads
Wanhua Chemical Group Co., Ltd. Yantai, China 600 80% loads
Covestro Shanghai, China 500 90% loads
BASF Chongqing Chongqing, China 400 0% loads
Shanghai Lianheng Isocyanate Co., Ltd.# Shanghai, China 350 100% loads.
Shanghai BASF Polyurethane Co., Ltd.* Shanghai, China 210 80% loads.
Huntsman (Shanghai) Polyurethane Co., Ltd.* Shanghai, China 160 90% loads
Tosoh (Ruian) Co., Ltd.* Zhejiang, China 80 100% loads
Total capacity in China 3,050
Average Operation loads 47% loads
Tosoh Corporation Nanyo, Japan 400 80% loads
Kumho Mitsui Chemicals Inc. Yeosu, South Korea 240 60% loads
BASF Urethane Co., Ltd. Yeosu, South Korea 250 80% loads
Sadara Chemical Company Saudi Arabia Jubail 400 50% loads
1,600
1,900
2,200
2,500
2,800
3,100
3,400
3,700
4,000
15,000
18,500
22,000
25,500
29,000
32,500
36,000
11-Jan-17 28-Mar-17 12-Jun-17 27-Aug-17 11-Nov-17 26-Jan-18
USD
/ton
RMB/
ton
RMB USD
17 / 36

China Polyurethane Monthly Report 201801
Total capacity in Asia 4,450
Average Operation loads 53% loads
Note: ①“#” means that Shanghai Lianheng has only synthesis facility.
②“*” refers that BASF, Huntsman and Tosoh (Ruian) have only distillation facility.
③Total capacity is calculated on mother liquid.
2.5.4 Import & Export Data
China December pure MDI imports under the HS code of 29291030 were 5,013 tons, posting an
decrease of 39.80% year on year and an increase of 32.06% month on month, according to PUdaily
import & exports Data. The top origins for imports were Japan (3,646 tons) and South Korea (1,186 tons).
Exports in December, 2017 were 8,242 tons, decreasing by 39.01% from December, 2016 and
decreasing by 8.74% over November, 2017. The top destinations for exports were Turkey (1,168 tons),
Chinese Taiwan (1,060 tons) and India (984 tons).
Table 19 China Pure MDI Im/Export Flow in 2017 (Tons)
Month HS Code: 29291030
Import Export
Jan-17 6,263 5,795
Feb-17 8,682 6,274
Mar-17 8,058 6,806
Apr-17 6,416 6,576
May-17 4,493 11,227
Jun-17 4,352 11,184
Jul-17 5,170 9,413
Aug-17 7,284 7,830
Sep-17 7,378 6,593
Oct-17 4,489 6,106
Nov-17 3,796 9,032
Dec-17 5,013 8,242
Total 71,394 95,078
Dec -17 Year on Year -39.80% -39.01%
Dec -17 Month on Month 32.06% -8.74%
18 / 36

China Polyurethane Monthly Report 201801
Figure 11 2016-2017 China Pure MDI Im & Exports Volume Comparison
Table 20 China Pure MDI Imports Top Origins in 2017 (Tons)
Jan. Feb. Mar. Apr. May Jun. Jul. Aug. Sep. Oct. Nov. Dec. Total
Japan 3,375 4,987 4,534 4,085 2,538 1,446 2,901 845 4,736 3,195 2,821 3,646 42,385
South
Korea 2,151 2,870 2,928 1,802 1,345 2,215 1,736 790 2,483 1,158 834 1,186 23,314
China 95 268 209 439 344 320 332 674 948 25 5 18 3,383
Belgium 56 37 88 26 14 16 16 816 0 16 0 16 445
Germany 75 49 152 56 29 102 62 595 360 48 62 134 1,243
Table 21 China Pure MDI Exports Top Destinations in 2017 (Tons)
Jan. Feb. Mar. Apr. May Jun. Jul. Aug. Sep. Oct. Nov. Dec. Total
Taiwan 1,374 1,302 1,128 1,319 1,542 1,134 1,222 4,121 1,191 1,021 1,240 1,060 14,378
Singapore 854 758 1,251 691 1,070 1,068 954 2,606 888 789 1,484 541 11,138
Pakistan 987 1,036 559 740 1,349 1,217 773 380 658 345 345 576 9,259
Vietnam 449 608 490 358 562 586 633 160 570 571 1,196 941 7,780
India 319 545 689 647 788 835 509 114 488 576 812 984 7,787
Table 22 China Pure MDI Main Exports in 2017 (Tons)
Jan. Feb. Mar. Apr. May Jun. Jul. Aug. Sep. Oct. Nov. Dec. Total
Wanhua 3,498 4415 4472 4,374 8,471 7,920 6,990 5,693 4,910 4,076 5,087 6,367 67,333
Covestro 2,069 1705 2103 1,862 2,444 2,516 1,943 1,840 1,105 1,526 2,262 1,094 22,469
Huntsman 89 50 185 213 1,214 115 386 176 501 277 372 377 3,955
BASF 21 0 0 0 815 263 49 25 2 0 148 292 1,615
02,0004,0006,0008,000
10,00012,00014,000
Jan. Mar. May Jul. Sept. Nov.
Uni
t: to
ns
Imports Volume Comparison
2016 2017
01,0002,0003,0004,0005,0006,0007,0008,000
Jan. Mar. May Jul. Sept. Nov.
Uni
t: to
ns
Exports Volume Comparison
2016 2017
19 / 36
China Polyurethane Monthly Report 201801
2.5.5 Future Market Forecast
China pure MDI market is expected to go upwards in February, 2018. Spot supply from MDI
manufactures still keep tight and will hardly get recovery in next month. Traders also hold low stocks, and
whole stocks in the market keep at low level. After the Chongqing BASF MDI plant get restarting from its
overhaul, tight supply will be relieved. Market price will come down to reasonable level.
In conclusion, the market will remain stable and price is estimated to vibrate between RMB
36,000-38,000/ton in February, 2018.
2.6 HDI
2.7 Adipic Acid
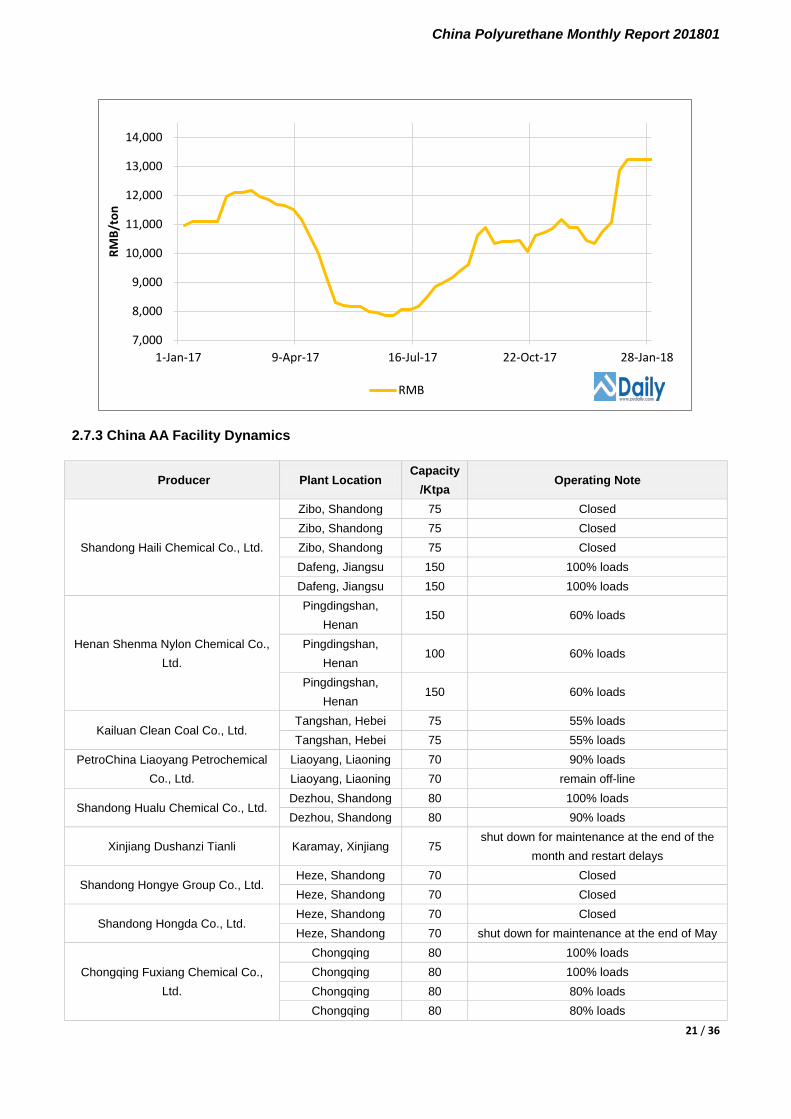
2.7.1 Market Overview
China AA market keeps on ascending this month, mainly stimulated by list price hike conducted by
AA suppliers. The stocking up comes to the last stage. Bullish mood gets stronger with increasing market
enquiries. Market traders are reluctant to make offers at low prices and quote their prices at high end.
2.7.2 RMB & USD Prices
Table 23 Monthly Adipic Acid RMB and USD Prices Comparison Types Unit January Average Price December Average Price Fluctuation Remarks China RMB/ton 12,660-13,680 10,525-10,775 2,135, 2,905 on bank receipt, DEL.
Exports USD/ton 1,620-1,632 1,400-1,450 220, 182 FOB
Figure 12 2016-2017 China AA RMB Price Trend
20 / 36
China Polyurethane Monthly Report 201801
2.7.3 China AA Facility Dynamics
Producer Plant Location Capacity
/Ktpa Operating Note
Shandong Haili Chemical Co., Ltd.
Zibo, Shandong 75 Closed Zibo, Shandong 75 Closed Zibo, Shandong 75 Closed Dafeng, Jiangsu 150 100% loads Dafeng, Jiangsu 150 100% loads
Henan Shenma Nylon Chemical Co., Ltd.
Pingdingshan, Henan
150 60% loads
Pingdingshan, Henan
100 60% loads
Pingdingshan, Henan
150 60% loads
Kailuan Clean Coal Co., Ltd. Tangshan, Hebei 75 55% loads Tangshan, Hebei 75 55% loads
PetroChina Liaoyang Petrochemical Co., Ltd.
Liaoyang, Liaoning 70 90% loads Liaoyang, Liaoning 70 remain off-line
Shandong Hualu Chemical Co., Ltd. Dezhou, Shandong 80 100% loads Dezhou, Shandong 80 90% loads
Xinjiang Dushanzi Tianli Karamay, Xinjiang 75 shut down for maintenance at the end of the
month and restart delays
Shandong Hongye Group Co., Ltd. Heze, Shandong 70 Closed Heze, Shandong 70 Closed
Shandong Hongda Co., Ltd. Heze, Shandong 70 Closed Heze, Shandong 70 shut down for maintenance at the end of May
Chongqing Fuxiang Chemical Co., Ltd.
Chongqing 80 100% loads Chongqing 80 100% loads Chongqing 80 80% loads Chongqing 80 80% loads
7,000
8,000
9,000
10,000
11,000
12,000
13,000
14,000
1-Jan-17 9-Apr-17 16-Jul-17 22-Oct-17 28-Jan-18
RMB/
ton
RMB
21 / 36

China Polyurethane Monthly Report 201801
Chongqing 80 50% Chongqing 80 Closed
Shanxi Yangmei Taihua advanced material Co., Ltd.
Yuncheng, Shanxi 70 run with 60% loads Yuncheng, Shanxi 70 Closed
Shanxi Yangmei Fengxi Fertilizer Industry Co., Ltd.
Yuncheng, Shanxi 70 Closed
Total capacity in Asia 2,420 Overall Operating Rate in China 49.9%
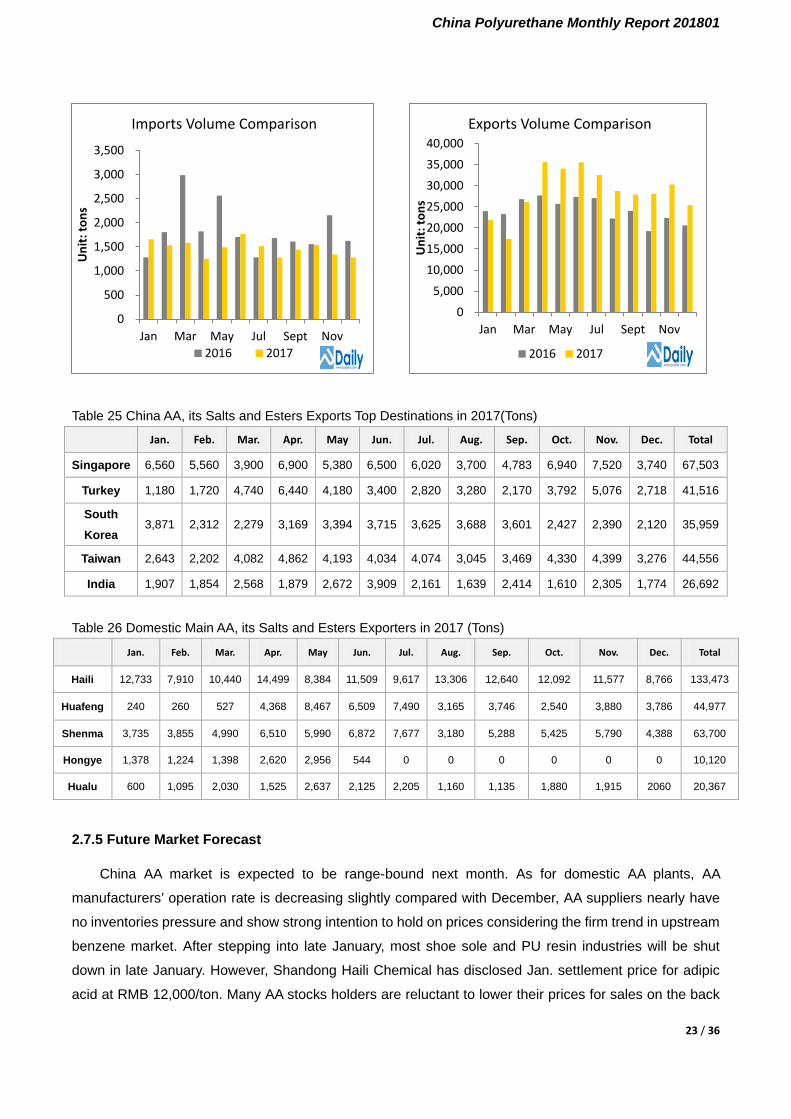
2.7.4 Import & Export Data
In December 2017, China AA, its salts and esters imports under the HS code of 29171200 were
1,275 tons, decreasing by 21.37% year on year and 4.92% month on month. Meanwhile, exports in
December of 2017 were 25,381 tons, up by 23.32% year on year while down by 16.19% month on month.
From January to December, China totally imported 17,664 tons and exported 343,454 tons of AA salts
and esters.
Table 24 China AA, its Salts and Esters Im/Export Flow in 2017 (Tons)
Month HS Code: 29171200
Import Export
Jan-17 1,657 21,835
Feb-17 1,531 17,390
Mar-17 1,583 26,111
Apr-17 1,251 35,618
May-17 1,490 34,050
Jun-17 1,768 35,536
Jul-17 1,513 32,540
Aug-17 1,277 28,759
Sep-17 1,442 27,878
Oct-17 1,536 28,067
Nov-17 1,341 30,286
Dec-17 1,275 25,381
Sum-17 17,664 343,454
Dec-17 Year on Year -21.37% 23.32%
Jan to Dec-17 Year on Year -19.94% 18.32%
Figure 13 2016-2017 China AA, its Salts and Esters Im/Exports Volume Comparison
22 / 36
China Polyurethane Monthly Report 201801
Table 25 China AA, its Salts and Esters Exports Top Destinations in 2017(Tons)
Jan. Feb. Mar. Apr. May Jun. Jul. Aug. Sep. Oct. Nov. Dec. Total
Singapore 6,560 5,560 3,900 6,900 5,380 6,500 6,020 3,700 4,783 6,940 7,520 3,740 67,503
Turkey 1,180 1,720 4,740 6,440 4,180 3,400 2,820 3,280 2,170 3,792 5,076 2,718 41,516
South Korea
3,871 2,312 2,279 3,169 3,394 3,715 3,625 3,688 3,601 2,427 2,390 2,120 35,959
Taiwan 2,643 2,202 4,082 4,862 4,193 4,034 4,074 3,045 3,469 4,330 4,399 3,276 44,556
India 1,907 1,854 2,568 1,879 2,672 3,909 2,161 1,639 2,414 1,610 2,305 1,774 26,692
Table 26 Domestic Main AA, its Salts and Esters Exporters in 2017 (Tons)
Jan. Feb. Mar. Apr. May Jun. Jul. Aug. Sep. Oct. Nov. Dec. Total
Haili 12,733 7,910 10,440 14,499 8,384 11,509 9,617 13,306 12,640 12,092 11,577 8,766 133,473
Huafeng 240 260 527 4,368 8,467 6,509 7,490 3,165 3,746 2,540 3,880 3,786 44,977
Shenma 3,735 3,855 4,990 6,510 5,990 6,872 7,677 3,180 5,288 5,425 5,790 4,388 63,700
Hongye 1,378 1,224 1,398 2,620 2,956 544 0 0 0 0 0 0 10,120
Hualu 600 1,095 2,030 1,525 2,637 2,125 2,205 1,160 1,135 1,880 1,915 2060 20,367
2.7.5 Future Market Forecast
China AA market is expected to be range-bound next month. As for domestic AA plants, AA
manufacturers’ operation rate is decreasing slightly compared with December, AA suppliers nearly have
no inventories pressure and show strong intention to hold on prices considering the firm trend in upstream
benzene market. After stepping into late January, most shoe sole and PU resin industries will be shut
down in late January. However, Shandong Haili Chemical has disclosed Jan. settlement price for adipic
acid at RMB 12,000/ton. Many AA stocks holders are reluctant to lower their prices for sales on the back
0
500
1,000
1,500
2,000
2,500
3,000
3,500
Jan Mar May Jul Sept Nov
Uni
t: to
ns
Imports Volume Comparison
2016 2017
0
5,000
10,000
15,000
20,000
25,000
30,000
35,000
40,000
Jan Mar May Jul Sept Nov
Uni
t: to
ns
Exports Volume Comparison
2016 2017
23 / 36

China Polyurethane Monthly Report 201801
of factory costs. As a result, it is predicted that domestic adipic acid market are likely to be range-bound
based on cost although the overall demand is not that good in the short run. It is expected AA market price
is estimated at RMB 12,700-13,800/ton in February.
2.8 PTMEG
2.8.1 Market Overview
China PTMEG market falls into a stalemate last month. Upstream raw material of BDO/THF have
risen sharply, PTMEG continues steadily runs due to downstream demand has always been light.
Regarding to spandex field, mainstream prices for PTMEG 1800 mol/g are heard at RMB
19,000-19,500/ton, up by RMB 500/ton compared with last month.
As for non-spandex field, the transaction prices are closing to low end. Spot prices for PTMEG 2000
mol/g are offered at RMB 19,800-21,000/ton, up by RMB 1,000/ton at the upper end compared with last
month. Meanwhile, mainstream price of PTMEG 1000 mol/g is quoted at RMB 22,000-24,000/ton, up by
RMB 1,000/ton at the lower end compared with last month (RMB 21,000-24,000). Sources from
Mitsubishi are tight and the quotations for PTMEG 1000 mol/g are heard offered at RMB
23,500-25,000/ton, down by RMB 1,000/ton compared with last month.
2.8.2 RMB & USD Prices
Table 27 Monthly PTMEG RMB and USD Prices Comparison
Notes: ① RMB Cost=USD CIF price *(1+17%)*(1+3%) *Exchange Rate+ Import Port Charge
(Only available for calculating the costs of China PTMEG imports. 17%: VAT rate; 3%: Import duty rate)
② n/c refers to “No Change”.
Grade Types Unit January
Average Price December
Average Price Fluctuation Remarks
1800 mol/g China RMB/ton 19,000-19,500 18,000-19,000 1,000; 500 Bulk/Ex-factory
Taiwan Dairen USD/ton 2,300-2,400 2,200-2,400 100; 0 Bulk/CIF
1000 mol/g Mitsubishi USD/ton 3,300 3,000-3,100 300;200 Drum/CIF
Taiwan Darien USD/ton 2,800 2,700-2,900 100;-100 Drum/CIF
2000 mol/g
China RMB/ton 19,800-21,000 19,800-20,000 0; 1,000 Drum/Ex-factory
Mitsubishi USD/ton 3,100-3,200 2,750-2,900 350; 300 Drum/CIF
Taiwan Darien USD/ton 2,650-2,800 2,650-2,800 0;0 Drum/CIF
24 / 36

China Polyurethane Monthly Report 201801
Figure 14 2016-2017 China PTMEG RMB & USD Price Trend
Note: ①RMB refers to E-China, 2000 mol/g Drum/Ex-factory; ②USD refers to Drum/CIF China.
2.8.3 Asian PTMEG Facility Dynamics
Producer Plant Location Capacity/ktpa Production Note
Shanghai BASF Shanghai 80 now runs with 80% loads
Hyosung Chemical Fiber (Jiaxing) Co., Ltd. Jiaxing, Zhejiang 70 now runs with 70% loads
Changlian Chemicals (Panjin) Co., Ltd Panjin, Liaoning 60 70%
Henan Coal Chemical Industry Group Hebi, Henan 50 now runs with 80%
Xinjiang Blue Ridge TunHe Energy Co., Ltd.
Changji, Xinjiang 46 now runs with 60% loads
Sichuan Tianhua Fubang Chemical Industry Co., Ltd.
Luzhou, Sichuan 46 now runs with 70% loads
Chongqing Chiyuan Chemicals Chongqing 46 now runs with 70%-80% loads
Shanxi BDO Chemical Co., Ltd Weinan, Shanxi 46 Carried out maintenance on Apr.20 and reset on May 5, now runs with
80% loads Sinopec Great Wall Energy and Chemical
Co., Ltd. Ningxia 46 70%
Shanxi Sanwei Co., Ltd. Hongtong, Shanxi 45 60%
Hangzhou Sanlong New Materials Co., Ltd Hangzhou, Zhejiang 40 80%
Dahua Group Dalian Chemical Co., Ltd Dalian, Liaoning 40 80% Mitsubishi Yokkaichi, Japan 35 100%
1,800
2,300
2,800
3,300
3,800
15,000
16,000
17,000
18,000
19,000
20,000
21,000
22,000
1-Jan-17 19-Mar-17 4-Jun-17 20-Aug-17 5-Nov-17 21-Jan-18
USD
/ton
RMB/
ton
RMB USD
25 / 36
China Polyurethane Monthly Report 201801
PTG Ulsan, South Korea 30 100%
MCC Advanced Polymers (Ningbo) Ningbo, Zhejiang 28 Closed
Total Capacity in China 708 Overall Operating Rate in China 53.9%
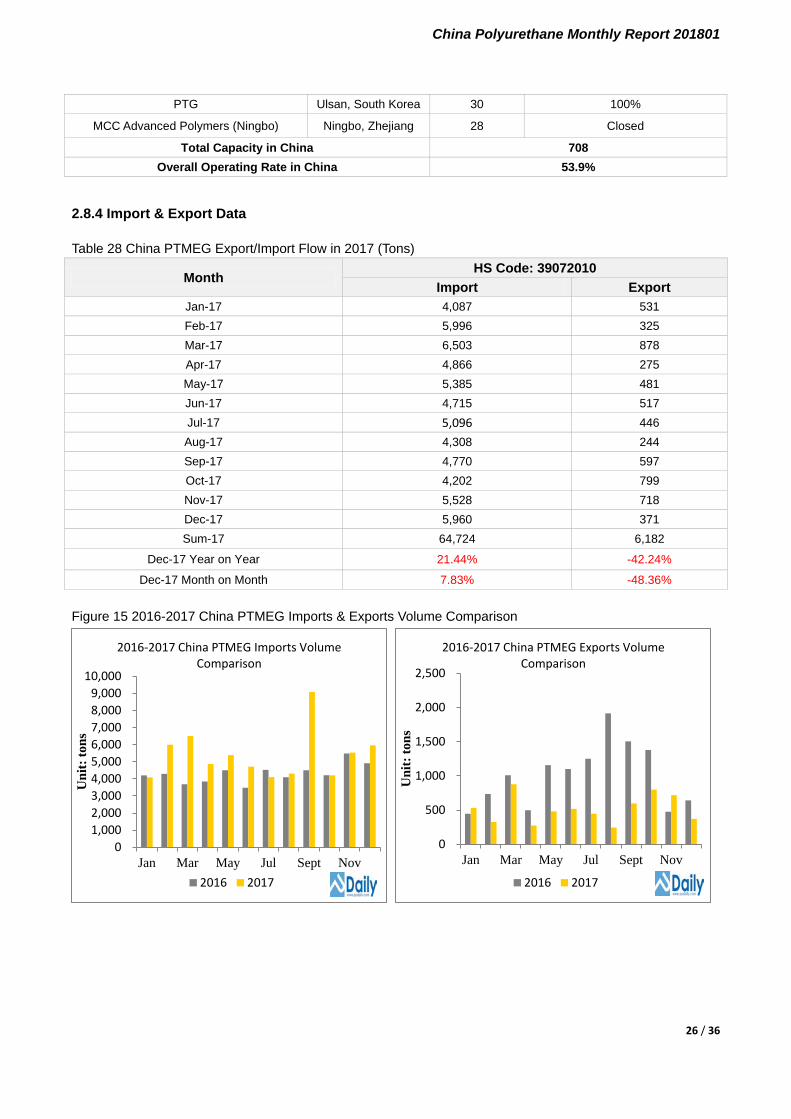
2.8.4 Import & Export Data
Table 28 China PTMEG Export/Import Flow in 2017 (Tons)
Month HS Code: 39072010
Import Export Jan-17 4,087 531 Feb-17 5,996 325 Mar-17 6,503 878 Apr-17 4,866 275 May-17 5,385 481 Jun-17 4,715 517 Jul-17 5,096 446 Aug-17 4,308 244 Sep-17 4,770 597 Oct-17 4,202 799 Nov-17 5,528 718 Dec-17 5,960 371 Sum-17 64,724 6,182
Dec-17 Year on Year 21.44% -42.24%
Dec-17 Month on Month 7.83% -48.36% Figure 15 2016-2017 China PTMEG Imports & Exports Volume Comparison
01,0002,0003,0004,0005,0006,0007,0008,0009,000
10,000
Jan Mar May Jul Sept Nov
Uni
t: to
ns
2016-2017 China PTMEG Imports Volume Comparison
2016 2017
0
500
1,000
1,500
2,000
2,500
Jan Mar May Jul Sept Nov
Uni
t: to
ns
2016-2017 China PTMEG Exports Volume Comparison
2016 2017
26 / 36
China Polyurethane Monthly Report 201801
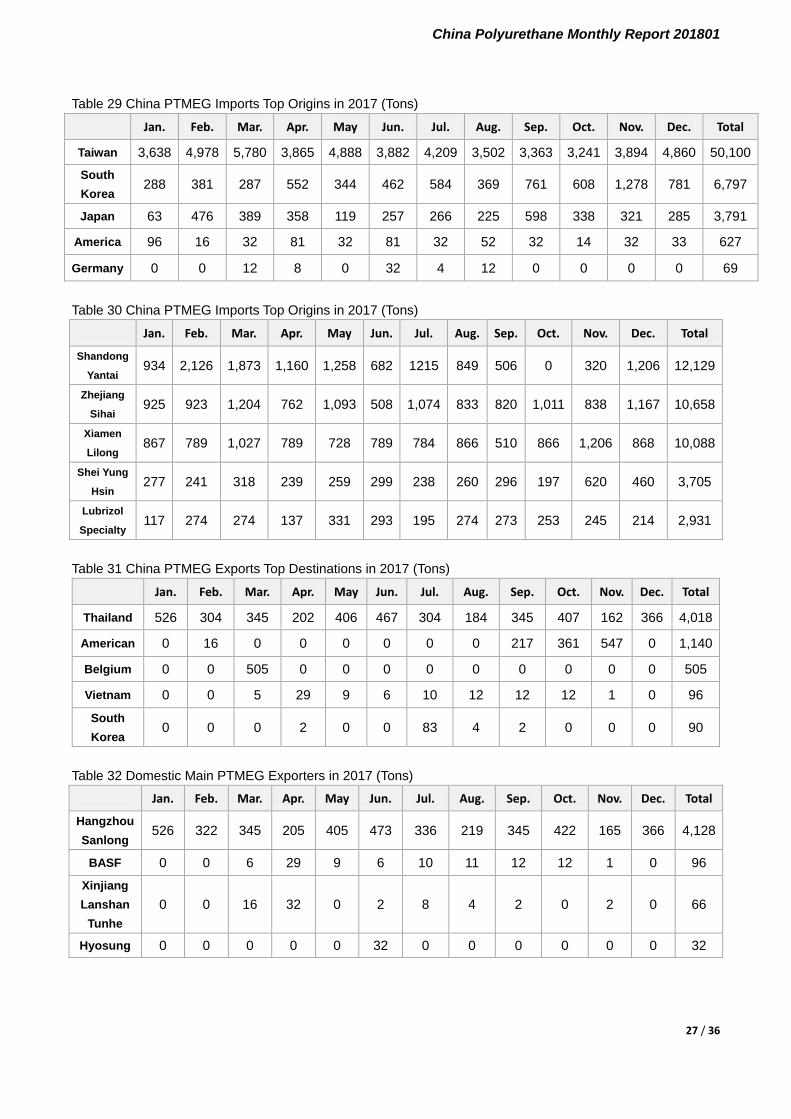
Table 29 China PTMEG Imports Top Origins in 2017 (Tons)
Jan. Feb. Mar. Apr. May Jun. Jul. Aug. Sep. Oct. Nov. Dec. Total
Taiwan 3,638 4,978 5,780 3,865 4,888 3,882 4,209 3,502 3,363 3,241 3,894 4,860 50,100 South Korea
288 381 287 552 344 462 584 369 761 608 1,278 781 6,797
Japan 63 476 389 358 119 257 266 225 598 338 321 285 3,791
America 96 16 32 81 32 81 32 52 32 14 32 33 627
Germany 0 0 12 8 0 32 4 12 0 0 0 0 69
Table 30 China PTMEG Imports Top Origins in 2017 (Tons)
Jan. Feb. Mar. Apr. May Jun. Jul. Aug. Sep. Oct. Nov. Dec. Total
Shandong
Yantai 934 2,126 1,873 1,160 1,258 682 1215 849 506 0 320 1,206 12,129
Zhejiang
Sihai 925 923 1,204 762 1,093 508 1,074 833 820 1,011 838 1,167 10,658
Xiamen
Lilong 867 789 1,027 789 728 789 784 866 510 866 1,206 868 10,088
Shei Yung
Hsin 277 241 318 239 259 299 238 260 296 197 620 460 3,705
Lubrizol
Specialty 117 274 274 137 331 293 195 274 273 253 245 214 2,931
Table 31 China PTMEG Exports Top Destinations in 2017 (Tons)
Jan. Feb. Mar. Apr. May Jun. Jul. Aug. Sep. Oct. Nov. Dec. Total
Thailand 526 304 345 202 406 467 304 184 345 407 162 366 4,018
American 0 16 0 0 0 0 0 0 217 361 547 0 1,140
Belgium 0 0 505 0 0 0 0 0 0 0 0 0 505
Vietnam 0 0 5 29 9 6 10 12 12 12 1 0 96
South Korea
0 0 0 2 0 0 83 4 2 0 0 0 90
Table 32 Domestic Main PTMEG Exporters in 2017 (Tons)
Jan. Feb. Mar. Apr. May Jun. Jul. Aug. Sep. Oct. Nov. Dec. Total
Hangzhou Sanlong
526 322 345 205 405 473 336 219 345 422 165 366 4,128
BASF 0 0 6 29 9 6 10 11 12 12 1 0 96
Xinjiang Lanshan
Tunhe 0 0 16 32 0 2 8 4 2 0 2 0 66
Hyosung 0 0 0 0 0 32 0 0 0 0 0 0 32
27 / 36
China Polyurethane Monthly Report 201801
2.8.5 Future Market Forecast
In February, the price of PTMEG is expected to be stable. With the festival coming, downstream
plants start to stop hoard cargoes, overall deals atmosphere performs weakly. Despite the rising price of
raw materials, PTMEG manufacturers only suffer the cost pressure. Demand from spandex field did not
perform well in the off-season. All in all, it is estimated that PTMEG market will keeps stable in next month.
Mainstream prices for PTMEG 1800 mol/g material are expected to settle at about RMB 19,500/ton,
PTMEG 2000 mol/g materials are settled at RMB 20,000-20,500/ton, and PTMEG 1000 mol/g materials
are offered at RMB 21,000-24,000/ton.
2.9 Southeast Asia & India PU Market
2.9.1 TDI
2.9.1.1 Market Overview
Southeast Asia (hereinafter referred to as SE A or SE Asia) TDI market inches up slightly with the
ruling concluded price for January reported at around USD 4,300-4,500/ton CIF, with lower end for Japan
sources while higher end for Korea sources, up by USD 100-200/ton compared with last month. The
increase in January, especially for 2nd half of the month, is mainly affected by buoyant China TDI market,
local supply in SE Asia tightens as a result and most suppliers hike quotations successively. For demand
it is still relatively weak pressured by the high price and buyers mainly purchase based on rigid demand.
In India, the TDI market runs stably in the 1st half month but then shores up quickly around Jan. 15
due to the sudden gas leakage of GNFC, after the incident, GNFC raises its official offer to INR 325/kg, up
by INR 25/kg in one time, which is equal to USD 4,687/ton, which makes the local market participants
very bullish on future trends, and buyers are also actively in building inventory as local marriage season is
about to come. On Jan. 23, the supplier begins to restart its TDI plant after safety check.
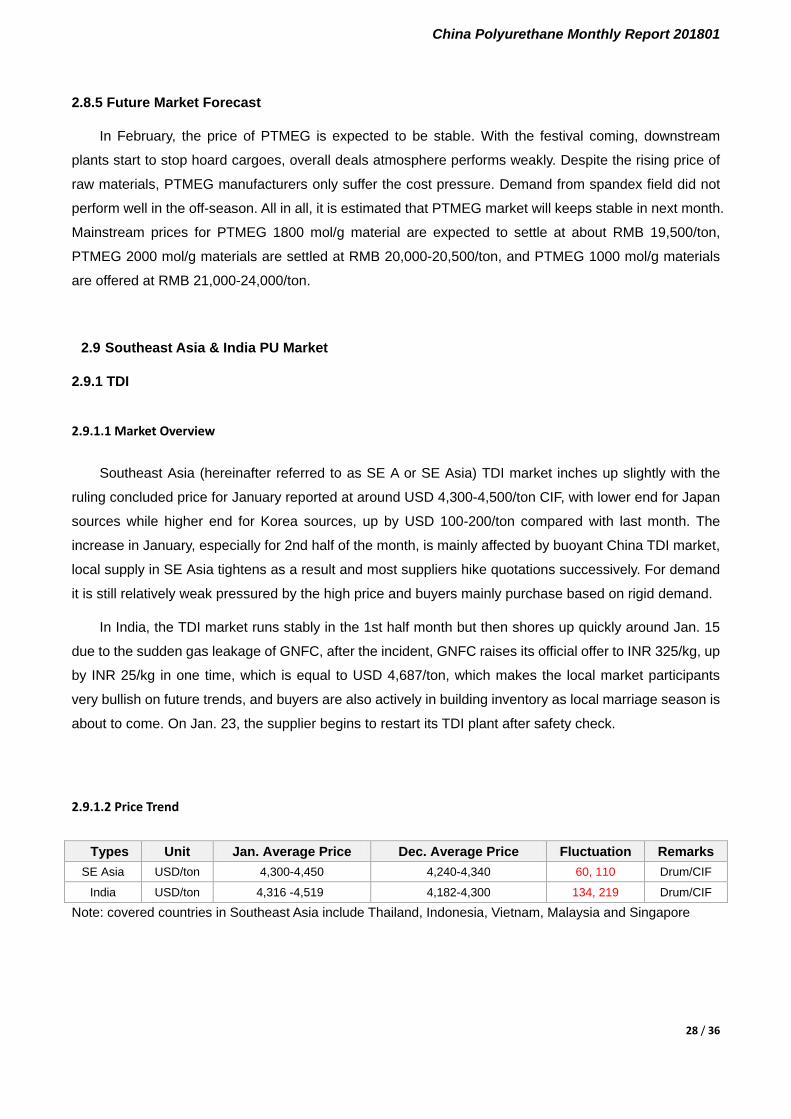
2.9.1.2 Price Trend
Types Unit Jan. Average Price Dec. Average Price Fluctuation Remarks SE Asia USD/ton 4,300-4,450 4,240-4,340 60, 110 Drum/CIF
India USD/ton 4,316 -4,519
4,182-4,300
134, 219 Drum/CIF
Note: covered countries in Southeast Asia include Thailand, Indonesia, Vietnam, Malaysia and Singapore
28 / 36
China Polyurethane Monthly Report 201801
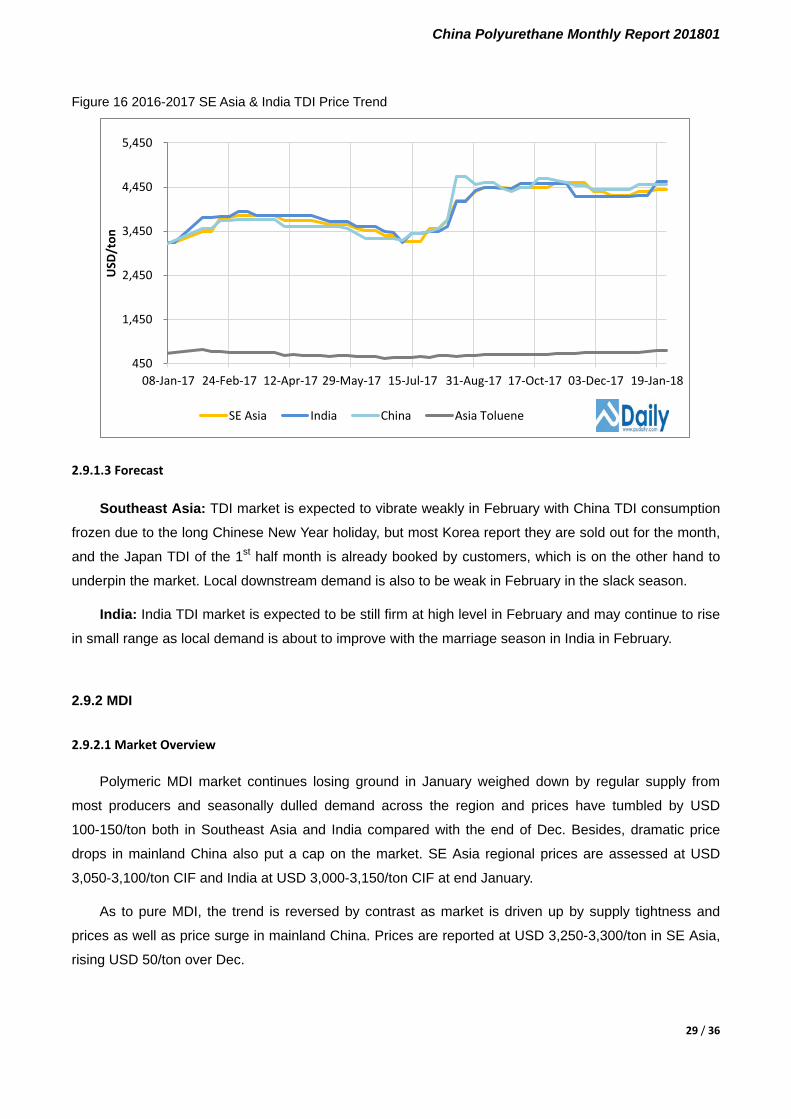
Figure 16 2016-2017 SE Asia & India TDI Price Trend
2.9.1.3 Forecast
Southeast Asia: TDI market is expected to vibrate weakly in February with China TDI consumption
frozen due to the long Chinese New Year holiday, but most Korea report they are sold out for the month,
and the Japan TDI of the 1st half month is already booked by customers, which is on the other hand to
underpin the market. Local downstream demand is also to be weak in February in the slack season.
India: India TDI market is expected to be still firm at high level in February and may continue to rise
in small range as local demand is about to improve with the marriage season in India in February.
2.9.2 MDI
2.9.2.1 Market Overview
Polymeric MDI market continues losing ground in January weighed down by regular supply from
most producers and seasonally dulled demand across the region and prices have tumbled by USD
100-150/ton both in Southeast Asia and India compared with the end of Dec. Besides, dramatic price
drops in mainland China also put a cap on the market. SE Asia regional prices are assessed at USD
3,050-3,100/ton CIF and India at USD 3,000-3,150/ton CIF at end January.
As to pure MDI, the trend is reversed by contrast as market is driven up by supply tightness and
prices as well as price surge in mainland China. Prices are reported at USD 3,250-3,300/ton in SE Asia,
rising USD 50/ton over Dec.
450
1,450
2,450
3,450
4,450
5,450
08-Jan-17 24-Feb-17 12-Apr-17 29-May-17 15-Jul-17 31-Aug-17 17-Oct-17 03-Dec-17 19-Jan-18
USD
/ton
SE Asia India China Asia Toluene
29 / 36
China Polyurethane Monthly Report 201801
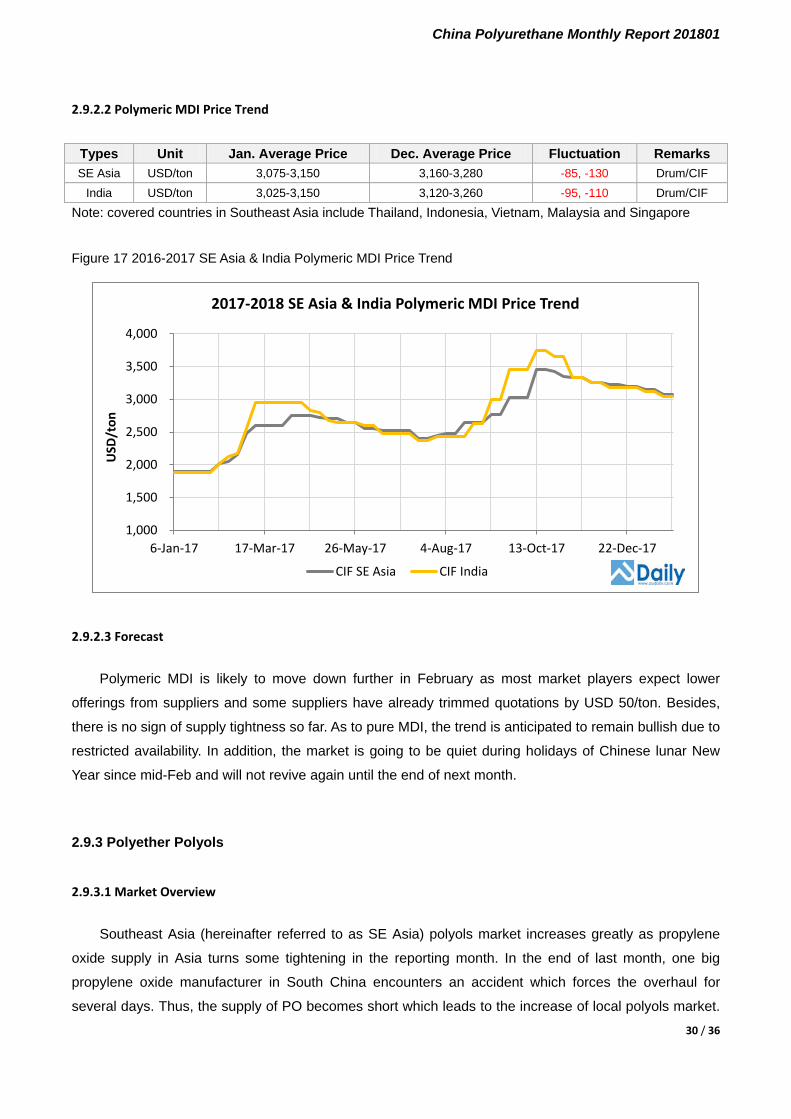
2.9.2.2 Polymeric MDI Price Trend
Types Unit Jan. Average Price Dec. Average Price Fluctuation Remarks SE Asia USD/ton 3,075-3,150 3,160-3,280 -85, -130 Drum/CIF
India USD/ton 3,025-3,150 3,120-3,260 -95, -110 Drum/CIF
Note: covered countries in Southeast Asia include Thailand, Indonesia, Vietnam, Malaysia and Singapore
Figure 17 2016-2017 SE Asia & India Polymeric MDI Price Trend
2.9.2.3 Forecast
Polymeric MDI is likely to move down further in February as most market players expect lower
offerings from suppliers and some suppliers have already trimmed quotations by USD 50/ton. Besides,
there is no sign of supply tightness so far. As to pure MDI, the trend is anticipated to remain bullish due to
restricted availability. In addition, the market is going to be quiet during holidays of Chinese lunar New
Year since mid-Feb and will not revive again until the end of next month.
2.9.3 Polyether Polyols
2.9.3.1 Market Overview
Southeast Asia (hereinafter referred to as SE Asia) polyols market increases greatly as propylene
oxide supply in Asia turns some tightening in the reporting month. In the end of last month, one big
propylene oxide manufacturer in South China encounters an accident which forces the overhaul for
several days. Thus, the supply of PO becomes short which leads to the increase of local polyols market.
1,000
1,500
2,000
2,500
3,000
3,500
4,000
6-Jan-17 17-Mar-17 26-May-17 4-Aug-17 13-Oct-17 22-Dec-17
USD
/ton
2017-2018 SE Asia & India Polymeric MDI Price Trend
CIF SE Asia CIF India
30 / 36
China Polyurethane Monthly Report 201801
And it attracts more polyols coming to China which derive from SE Asia sources. Therefore, the supply of
polyols in SE Asia is restrained and the quotations are also raised at the same time. The price of slab
polyols is heard at USD 1,800-1,900/ton CIF in drum, up by around USD 100/ton than that of December.
For high resilience polyols, it is negotiated at USD 1,900-1,980/ton CIF in drum. The discussion of
polymer polyols is reported at USD 2,000-2,100/ton CIF in drum.
In South Korea, the polyols market keeps stable in January. Despite the price increase of propylene
oxide from China sources, local polyols market hold steadily when downstream industry is still wandering
in the off season. The main price of slab polyols is heard at USD 1,800-1,850/ton FOB in drum. For high
resilience polyols, it is reported at USD 1,900-1,950/ton FOB in drum. For polymer polyols, it is discussed
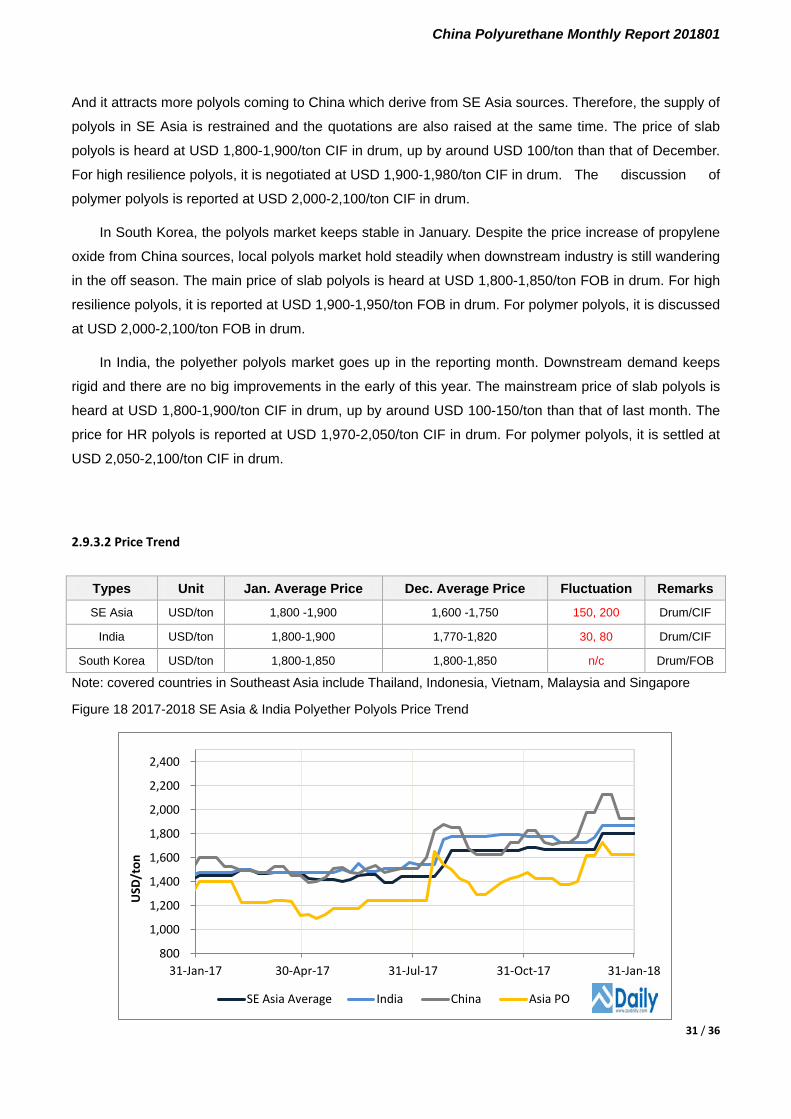
at USD 2,000-2,100/ton FOB in drum.
In India, the polyether polyols market goes up in the reporting month. Downstream demand keeps
rigid and there are no big improvements in the early of this year. The mainstream price of slab polyols is
heard at USD 1,800-1,900/ton CIF in drum, up by around USD 100-150/ton than that of last month. The
price for HR polyols is reported at USD 1,970-2,050/ton CIF in drum. For polymer polyols, it is settled at
USD 2,050-2,100/ton CIF in drum.
2.9.3.2 Price Trend
Types Unit Jan. Average Price Dec. Average Price Fluctuation Remarks
SE Asia USD/ton 1,800 -1,900 1,600 -1,750 150, 200 Drum/CIF
India USD/ton 1,800-1,900 1,770-1,820 30, 80 Drum/CIF
South Korea USD/ton 1,800-1,850 1,800-1,850 n/c Drum/FOB
Note: covered countries in Southeast Asia include Thailand, Indonesia, Vietnam, Malaysia and Singapore
Figure 18 2017-2018 SE Asia & India Polyether Polyols Price Trend
800
1,000
1,200
1,400
1,600
1,800
2,000
2,200
2,400
31-Jan-17 30-Apr-17 31-Jul-17 31-Oct-17 31-Jan-18
USD
/ton
SE Asia Average India China Asia PO
31 / 36
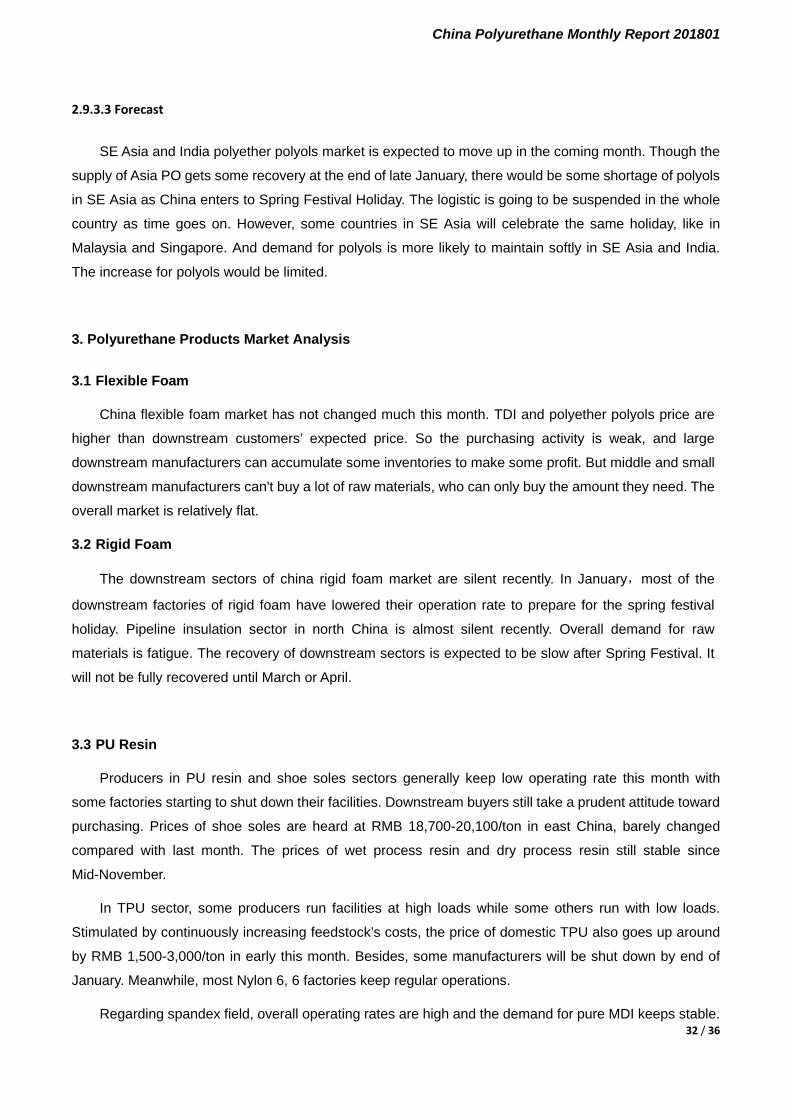
China Polyurethane Monthly Report 201801
2.9.3.3 Forecast
SE Asia and India polyether polyols market is expected to move up in the coming month. Though the
supply of Asia PO gets some recovery at the end of late January, there would be some shortage of polyols
in SE Asia as China enters to Spring Festival Holiday. The logistic is going to be suspended in the whole
country as time goes on. However, some countries in SE Asia will celebrate the same holiday, like in
Malaysia and Singapore. And demand for polyols is more likely to maintain softly in SE Asia and India.
The increase for polyols would be limited.
3. Polyurethane Products Market Analysis
3.1 Flexible Foam
China flexible foam market has not changed much this month. TDI and polyether polyols price are
higher than downstream customers’ expected price. So the purchasing activity is weak, and large
downstream manufacturers can accumulate some inventories to make some profit. But middle and small
downstream manufacturers can't buy a lot of raw materials, who can only buy the amount they need. The
overall market is relatively flat.
3.2 Rigid Foam
The downstream sectors of china rigid foam market are silent recently. In January,most of the
downstream factories of rigid foam have lowered their operation rate to prepare for the spring festival
holiday. Pipeline insulation sector in north China is almost silent recently. Overall demand for raw
materials is fatigue. The recovery of downstream sectors is expected to be slow after Spring Festival. It
will not be fully recovered until March or April.
3.3 PU Resin
Producers in PU resin and shoe soles sectors generally keep low operating rate this month with
some factories starting to shut down their facilities. Downstream buyers still take a prudent attitude toward
purchasing. Prices of shoe soles are heard at RMB 18,700-20,100/ton in east China, barely changed
compared with last month. The prices of wet process resin and dry process resin still stable since
Mid-November.
In TPU sector, some producers run facilities at high loads while some others run with low loads.
Stimulated by continuously increasing feedstock’s costs, the price of domestic TPU also goes up around
by RMB 1,500-3,000/ton in early this month. Besides, some manufacturers will be shut down by end of
January. Meanwhile, most Nylon 6, 6 factories keep regular operations.
Regarding spandex field, overall operating rates are high and the demand for pure MDI keeps stable. 32 / 36

China Polyurethane Monthly Report 201801
But it is said that some spandex factories have some stocks and are faced with impediment to make
deliveries, the price of spandex goes down around by RMB 2,000/ton.
In general, stepping into late January, overall operating rate in downstream industry is declining
slowly. Some manufacturers operate facilities regularly while most may gradually shut down their plants in
late January as the Spring Festival is approaching.
4. Downstream Industries
4.1 Flexible Foam Downstream
4.1.1 Upholstered Furniture
According to National building materials home boom index, China BHI index in November 2017 is
92.06, decrease by 10.50% month on month and down by -10.42% year on year.
Table 33 China BHI index in 2017
Jan. Feb. Mar. Apr. May Jun. Jul. Aug. Sep. Oct. Nov. Dec.
BHI Index 71.35 78.97 94.48 99.76 97.03 91.63 91.65 94.14 103.39 102.56 92.06 86.40
MOM -24.82% 7.62% 15.51% 5.28% -2.73% 5.40% 0.02% 2.49% 9.25% -0.83% -10.50% -5.66%
YOY -7.17% -3.73% -10.87% -11.9% -13.70% 15.52% -13.55% -14.48% 8.12% -12.07% -10.42% -10.16%
4.1.2 Automobile
According to statistical analysis from China Association of Automotive Manufacturers (CAAM), China
automobile output from in 2017 were 29.02 million units, with year on year growth of 3.19%, including
24.81 million passenger cars and 4.21 million commercial cars, with year on year growth of 1.58% and
13.81% respectively.
Table 34 China Auto Outputs & Sales in 2017 (Unit: 1,000 units)
Month Automobile Total Passenger Cars Commercial Cars
Output Sales Output YOY
Sales YOY
Output Sales Output YOY
Sales YOY
Output Sales Output YOY
Sales YOY
Jan. 2,369 2,519 -3.38% 0.23% 2,072 2,218 -4.17% -1.1% 297 301 -1.61% 11.32%
Feb. 2,160 1,939 33.77% 22.37% 1,848 1,633 31.50% 18.29% 312 307 49.04% 49.90%
Mar. 2,604 2,243 3.04% 3.98% 2,188 2,096 1,78% 1.70% 416 447 10.20% 16.19%
Apr. 2,138 2,084 5.38% 4.58% 1,783 1,722 -3.32% -3.68% 356 362 5.86% 5.26%
May 2,087 2,096 0.69% 0.09% 1,748 1,751 1.76% 1.79% 339 345 15.55% 15.23%
Jun. 2,167 2,172 5.42% 4.54% 1,845 1,832 3.72% 2.32% 323 340 16.36% 18.36%
33 / 36
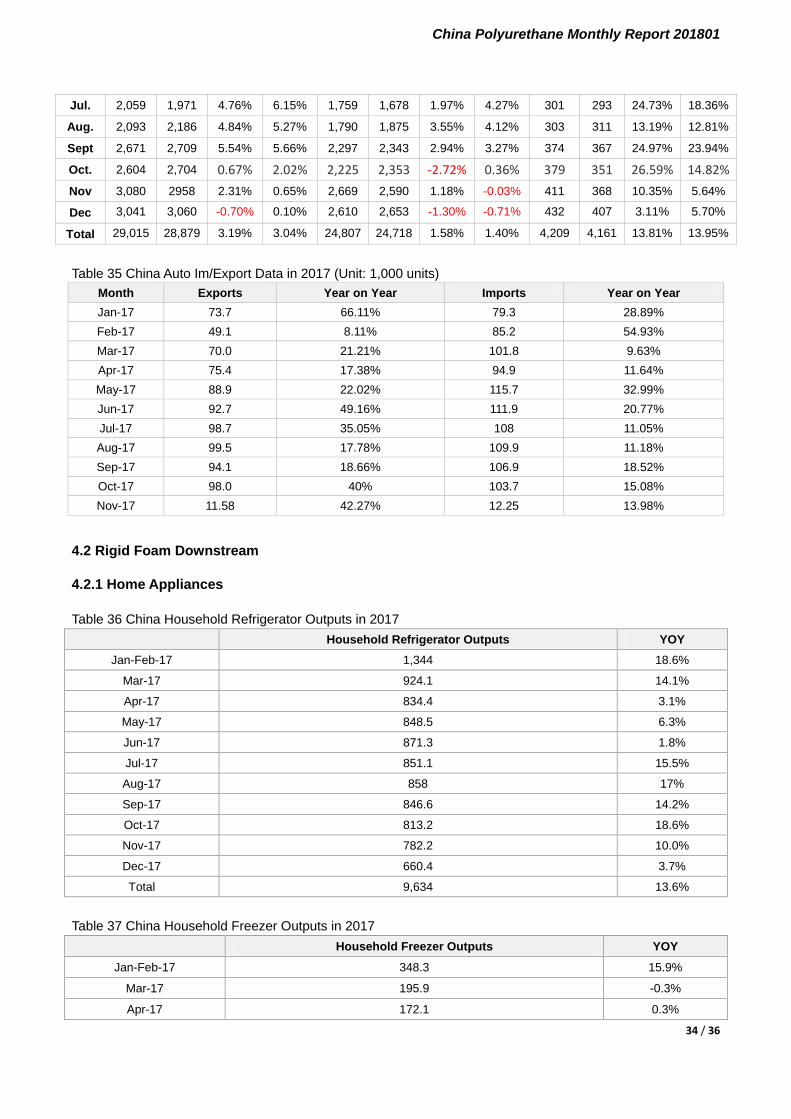
China Polyurethane Monthly Report 201801
Jul. 2,059 1,971 4.76% 6.15% 1,759 1,678 1.97% 4.27% 301 293 24.73% 18.36%
Aug. 2,093 2,186 4.84% 5.27% 1,790 1,875 3.55% 4.12% 303 311 13.19% 12.81%
Sept 2,671 2,709 5.54% 5.66% 2,297 2,343 2.94% 3.27% 374 367 24.97% 23.94%
Oct. 2,604 2,704 0.67% 2.02% 2,225 2,353 -2.72% 0.36% 379 351 26.59% 14.82%
Nov 3,080 2958 2.31% 0.65% 2,669 2,590 1.18% -0.03% 411 368 10.35% 5.64%
Dec 3,041 3,060 -0.70% 0.10% 2,610 2,653 -1.30% -0.71% 432 407 3.11% 5.70%
Total 29,015 28,879 3.19% 3.04% 24,807 24,718 1.58% 1.40% 4,209 4,161 13.81% 13.95%
Table 35 China Auto Im/Export Data in 2017 (Unit: 1,000 units)
Month Exports Year on Year Imports Year on Year Jan-17 73.7 66.11% 79.3 28.89% Feb-17 49.1 8.11% 85.2 54.93% Mar-17 70.0 21.21% 101.8 9.63% Apr-17 75.4 17.38% 94.9 11.64% May-17 88.9 22.02% 115.7 32.99% Jun-17 92.7 49.16% 111.9 20.77% Jul-17 98.7 35.05% 108 11.05% Aug-17 99.5 17.78% 109.9 11.18% Sep-17 94.1 18.66% 106.9 18.52% Oct-17 98.0 40% 103.7 15.08% Nov-17 11.58 42.27% 12.25 13.98%
4.2 Rigid Foam Downstream
4.2.1 Home Appliances
Table 36 China Household Refrigerator Outputs in 2017
Household Refrigerator Outputs YOY
Jan-Feb-17 1,344 18.6%
Mar-17 924.1 14.1%
Apr-17 834.4 3.1%
May-17 848.5 6.3%
Jun-17 871.3 1.8%
Jul-17 851.1 15.5%
Aug-17 858 17%
Sep-17 846.6 14.2%
Oct-17 813.2 18.6%
Nov-17 782.2 10.0%
Dec-17 660.4 3.7%
Total 9,634 13.6%
Table 37 China Household Freezer Outputs in 2017
Household Freezer Outputs YOY
Jan-Feb-17 348.3 15.9%
Mar-17 195.9 -0.3%
Apr-17 172.1 0.3%
34 / 36

China Polyurethane Monthly Report 201801
May-17 166.8 7.1%
Jun-17 188.5 -3.8%
Jul-17 171.2 3.0%
Aug-17 169.6 14.4%
Sep-17 159.6 9.9%
Oct-17 150.5 7.8%
Nov-17 172.3 11.2%
Dec-17 184.2 6.1%
Total 2,079 9.0%
4.2.2 Building Insulation
From January to November in 2017, China’s investment in real estate development grew by 7.5%
year on year to 10.04 trillion yuan, and the growth rate increasing by 0.14% point compared with the first
ten months in 2017. Residential investment reached about 6.87 trillion yuan, increasing by 9.7% year on
year, and the growth rate decreased by 0.2%. Residential investment accounted for 68.4% of total
investment in real estate development.
From January to November in 2017, the housing construction area of real estate development
enterprises totaled up to 7684.43 million square meters, growing by 3.1% year on year, increasing by 0.2%
point compared with the first nine months in 2017.
In November, the Real Estate Development Boom Index (shortened as National Housing Boom Index)
was 101.63, growing by 0.14 compared with October.
Data shows that China real estate industry is edging up from January to November. The running of
real estate market will influence related industries to some extent, such as rigid foam insulation, spray
coating products, etc.
4.3 PU Resin Downstream
4.3.1 Light Leather
In November 2017, the output of light leather is around 45.66 million square meters in China, down
by 17.66% compared to that of the same period in 2016. Domestic output of light leather from January to
November increases to 610.01 million square meters, decreasing by 4.10% compared with last year.
4.3.2 Footwear
In November 2017, the output of leather boots are around 403.00 million pairs in China, up by 0.97%
compared with that of the same period in 2016. The total output of leather boots from January to
November reaches around 4.13 billion pairs, increasing by 1.19% when compared with that of 2016.
35 / 36
China Polyurethane Monthly Report 201801
About Suntower Consulting Limited
Suntower Consulting Limited professionalizes itself in polyurethane market analysis as a consulting
organization. Comprised of an experienced research team, it focuses on studies of the PU industry chain.
Through close and constant interaction with industry insiders, the team is dedicated to provide customers
with quick, precise and useful market information.
PUdaily.com and Chem366.com, under the operation of Suntower, are two website platforms
targeting respectively overseas and Chinese clients. Up to now, PUdaily now covers over 139 countries
across the world.
© PUDaily, 2017. All rights reserved.
Pudaily makes no warranty of any kind with regard to this material, including, but not limited to, the implied
warranties of merchantability and fitness for a p articular purpose. PUDaily shall not be liable for errors
contained herein or for incidental or consequential damages in connection with the use of this material.
This document contains proprietary information, which is protected by copyright. No part of this document
may be photocopied, reproduced, or translated into another language without the prior written consent of
PUDaily.
If you have any question, please contact us at:
Tel: 0086-21- 61250980 E-mail: [email protected] Fax: 0086-21-61159277
36 / 36