
MCKINSEY RECOVERY& TRANSFORMATION SERVICES U.S., LLC, MCKINSEY
Upload
franck-le-deuCategory
view
3.824download
2
Building Bridges to
InnovationDecoding the Big Slowdown;
Assessing Progress on Innovation
Shanghai, October 20-21 2015
CONFIDENTIAL AND PROPRIETARY
Any use of this material without specific permission of McKinsey & Company is strictly prohibited
McKinsey & Company 2|
Decoding the big
slowdown
Contents
2015 in the mirror Assessing progress
on innovation

McKinsey & Company 3|
2015 in the mirror
McKinsey & Company 4|
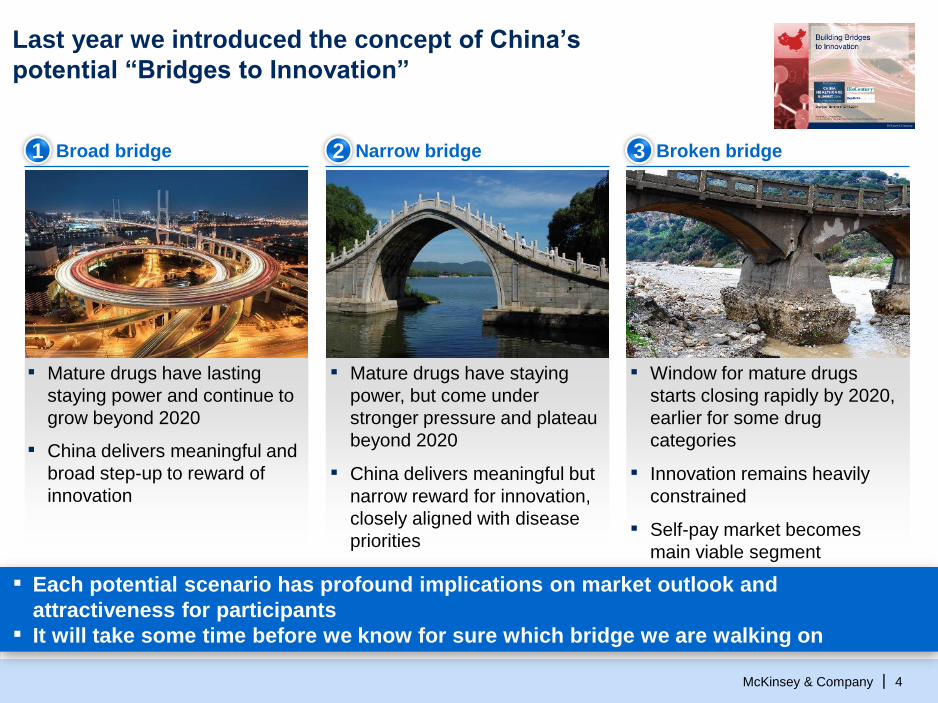
Last year we introduced the concept of China’s
potential “Bridges to Innovation”
Broken bridgeNarrow bridgeBroad bridge1 2 3
▪ Mature drugs have lasting
staying power and continue to
grow beyond 2020
▪ China delivers meaningful and
broad step-up to reward of
innovation
▪ Mature drugs have staying
power, but come under
stronger pressure and plateau
beyond 2020
▪ China delivers meaningful but
narrow reward for innovation,
closely aligned with disease
priorities
▪ Window for mature drugs
starts closing rapidly by 2020,
earlier for some drug
categories
▪ Innovation remains heavily
constrained
▪ Self-pay market becomes
main viable segment
e-Health
▪ Each potential scenario has profound implications on market outlook and
attractiveness for participants
▪ It will take some time before we know for sure which bridge we are walking on
McKinsey & Company 5|
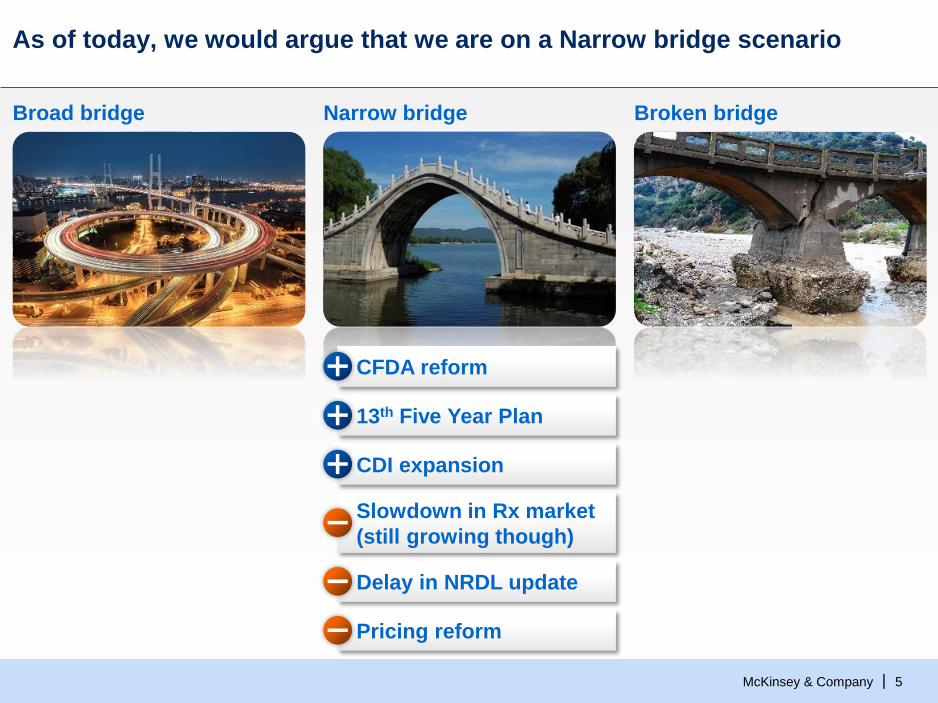
As of today, we would argue that we are on a Narrow bridge scenario
Narrow bridgeBroad bridge Broken bridge
Slowdown in Rx market
(still growing though)
CFDA reform
13th Five Year Plan
CDI expansion
Delay in NRDL update
Pricing reform
McKinsey & Company 6|
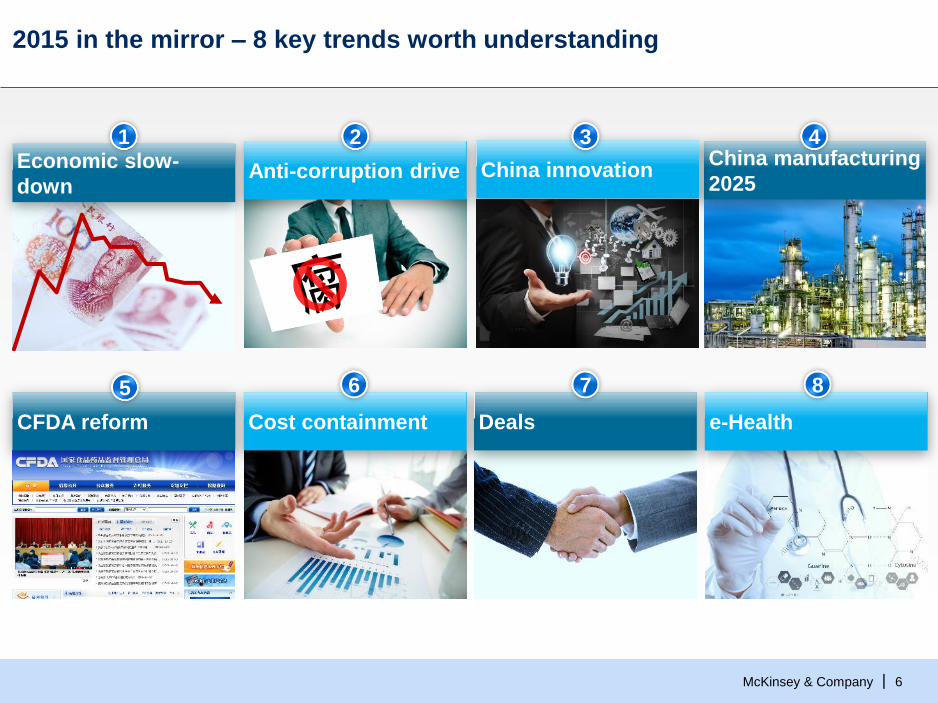
2015 in the mirror – 8 key trends worth understanding
Deals
7
Anti-corruption drive
2Economic slow-
down
1China manufacturing
2025
CFDA reform
5
Cost containment
6
e-Health
8
China innovation
43
McKinsey & Company 7|
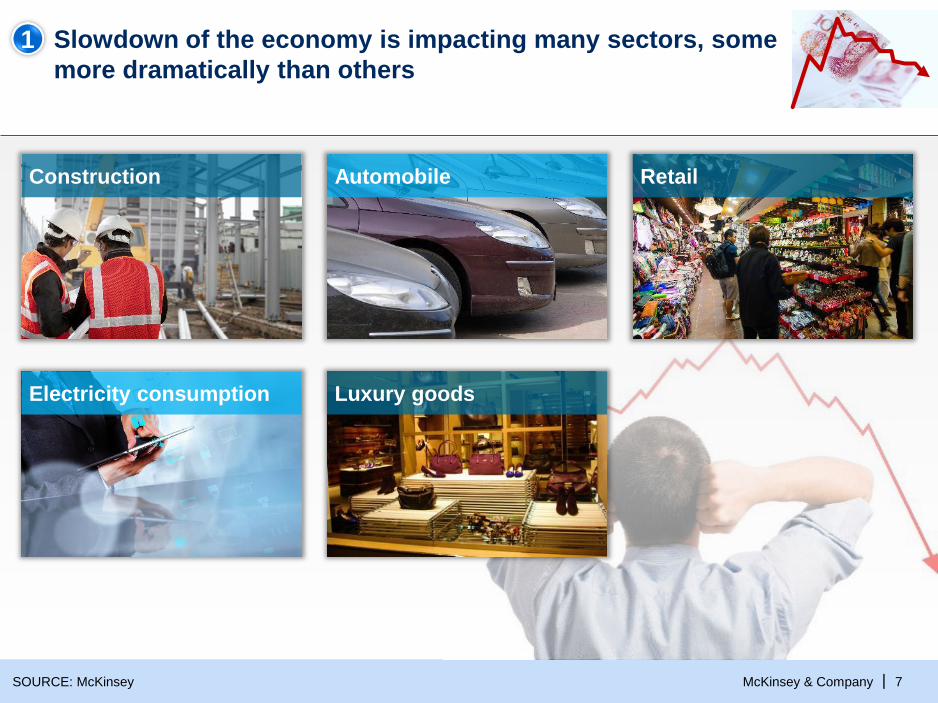
Slowdown of the economy is impacting many sectors, some
more dramatically than others
Construction Automobile Retail
Electricity consumption Luxury goods
1
SOURCE: McKinsey
McKinsey & Company 8|
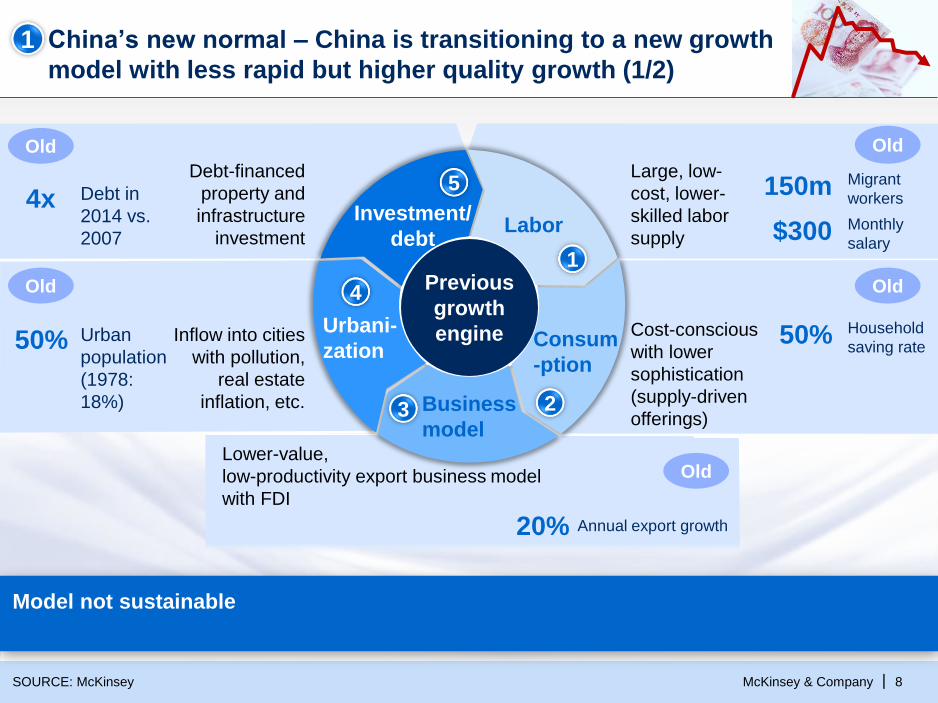
Large, low-
cost, lower-
skilled labor
supply $300
150m
Monthly
salary
Migrant
workers
Old
Lower-value,
low-productivity export business model
with FDI
20% Annual export growth
Old
Cost-conscious
with lower
sophistication
(supply-driven
offerings)
50% Household
saving rate
Old
4x Debt in
2014 vs.
2007
Debt-financed
property and
infrastructure
investment
Old
50% Urban
population
(1978:
18%)
Inflow into cities
with pollution,
real estate
inflation, etc.
Old
China’s new normal – China is transitioning to a new growth
model with less rapid but higher quality growth (1/2)
SOURCE: McKinsey
Previous
growth
engine
1
Labor
5
Investment/
debt
4
Urbani-
zation
2
Consum
-ption
3 Business
model
Model not sustainable
1
McKinsey & Company 9|
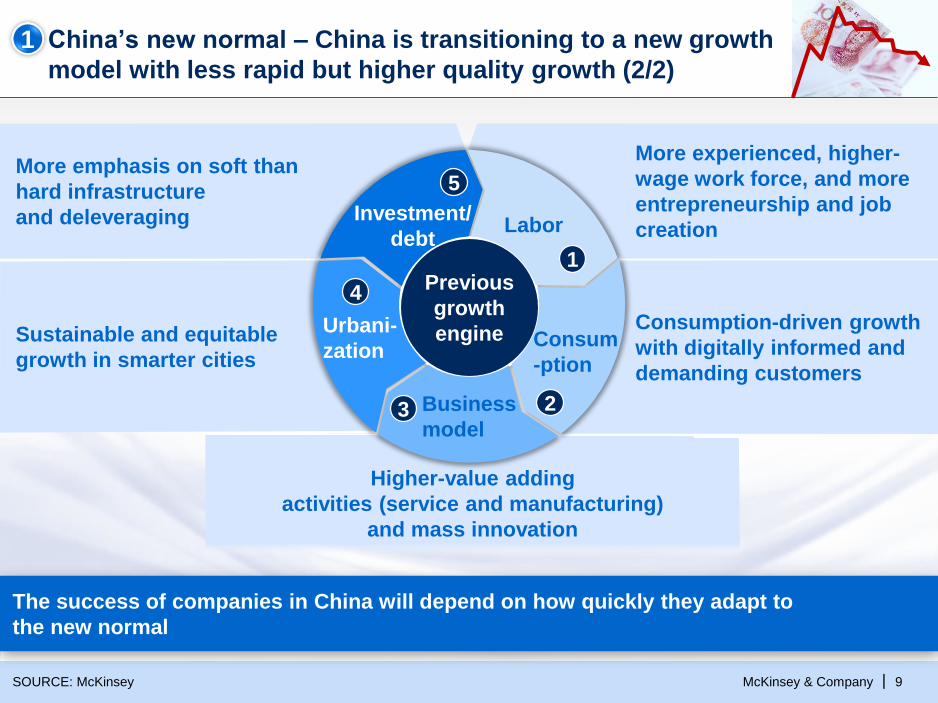
More emphasis on soft than
hard infrastructure
and deleveraging
More experienced, higher-
wage work force, and more
entrepreneurship and job
creation
Sustainable and equitable
growth in smarter cities
Consumption-driven growth
with digitally informed and
demanding customers
Higher-value adding
activities (service and manufacturing)
and mass innovation
China’s new normal – China is transitioning to a new growth
model with less rapid but higher quality growth (2/2)
SOURCE: McKinsey
Previous
growth
engine
1
Labor
5
Investment/
debt
4
Urbani-
zation
2
Consum
-ption
3 Business
model
The success of companies in China will depend on how quickly they adapt to
the new normal
1
McKinsey & Company 10|
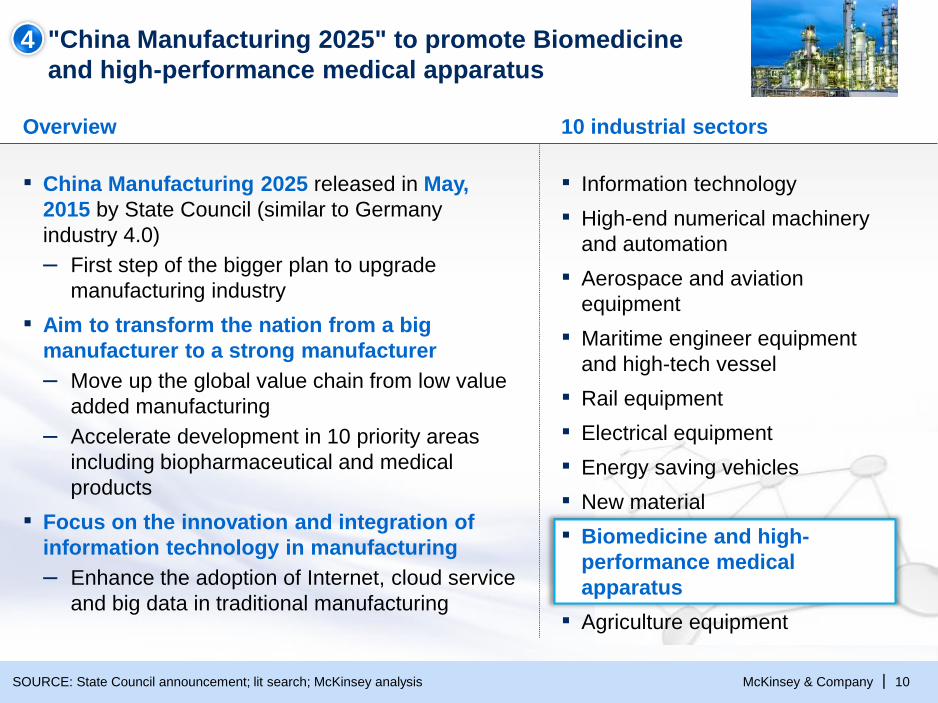
"China Manufacturing 2025" to promote Biomedicine
and high-performance medical apparatus
SOURCE: State Council announcement; lit search; McKinsey analysis
▪ China Manufacturing 2025 released in May,
2015 by State Council (similar to Germany
industry 4.0)
– First step of the bigger plan to upgrade
manufacturing industry
▪ Aim to transform the nation from a big
manufacturer to a strong manufacturer
– Move up the global value chain from low value
added manufacturing
– Accelerate development in 10 priority areas
including biopharmaceutical and medical
products
▪ Focus on the innovation and integration of
information technology in manufacturing
– Enhance the adoption of Internet, cloud service
and big data in traditional manufacturing
▪ Information technology
▪ High-end numerical machinery
and automation
▪ Aerospace and aviation
equipment
▪ Maritime engineer equipment
and high-tech vessel
▪ Rail equipment
▪ Electrical equipment
▪ Energy saving vehicles
▪ New material
▪ Biomedicine and high-
performance medical
apparatus
▪ Agriculture equipment
4
Overview 10 industrial sectors
McKinsey & Company 11|
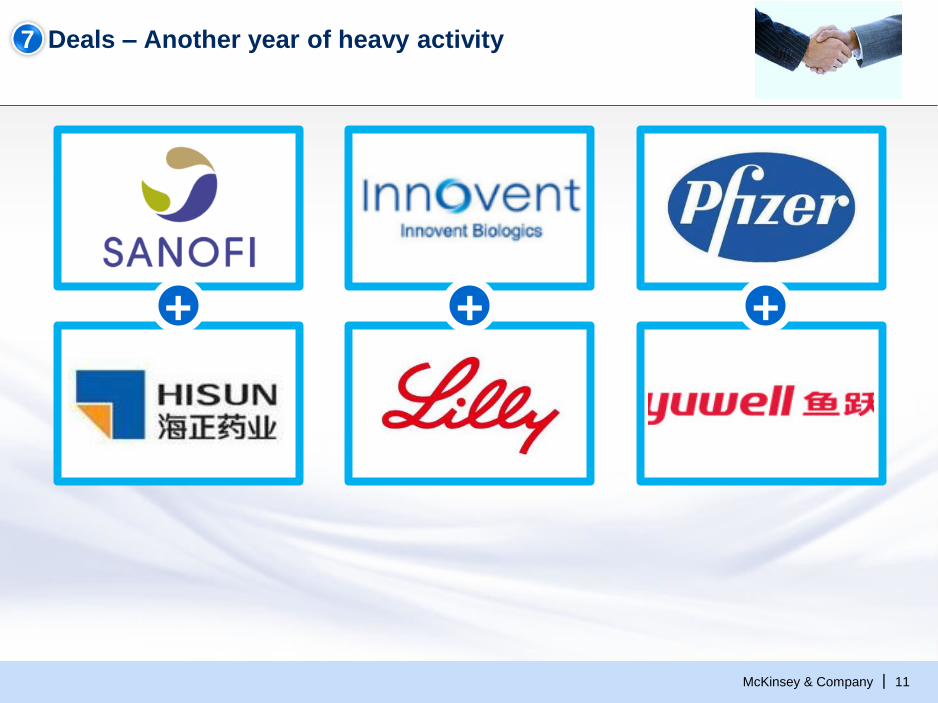
Deals – Another year of heavy activity
+++
7
McKinsey & Company 12|
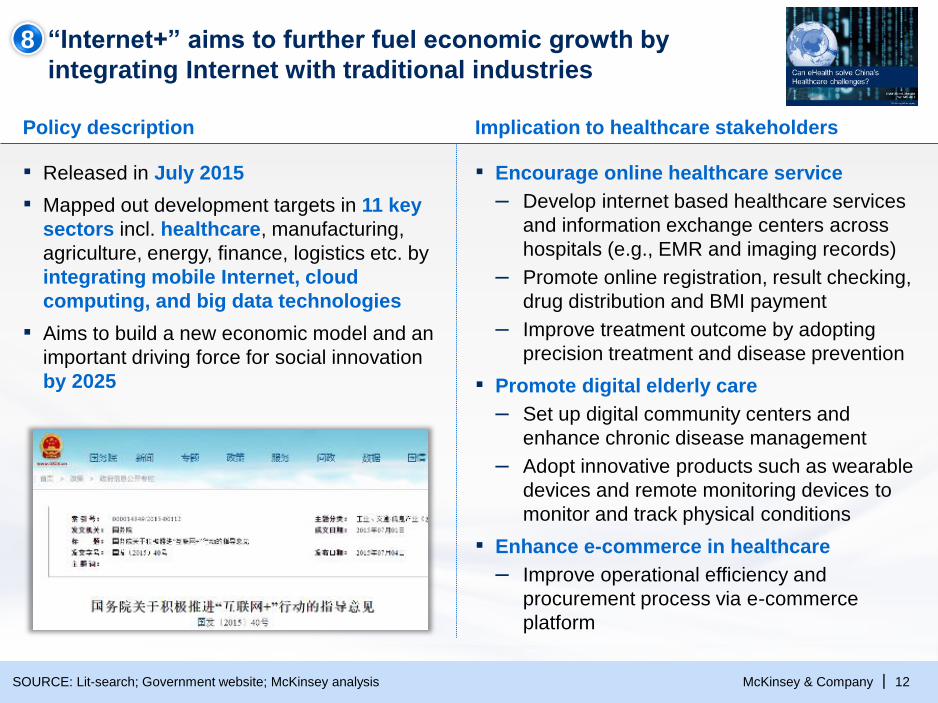
“Internet+” aims to further fuel economic growth by
integrating Internet with traditional industries
Policy description Implication to healthcare stakeholders
▪ Encourage online healthcare service
– Develop internet based healthcare services
and information exchange centers across
hospitals (e.g., EMR and imaging records)
– Promote online registration, result checking,
drug distribution and BMI payment
– Improve treatment outcome by adopting
precision treatment and disease prevention
▪ Promote digital elderly care
– Set up digital community centers and
enhance chronic disease management
– Adopt innovative products such as wearable
devices and remote monitoring devices to
monitor and track physical conditions
▪ Enhance e-commerce in healthcare
– Improve operational efficiency and
procurement process via e-commerce
platform
▪ Released in July 2015
▪ Mapped out development targets in 11 key
sectors incl. healthcare, manufacturing,
agriculture, energy, finance, logistics etc. by
integrating mobile Internet, cloud
computing, and big data technologies
▪ Aims to build a new economic model and an
important driving force for social innovation
by 2025
SOURCE: Lit-search; Government website; McKinsey analysis
8
McKinsey & Company 13|
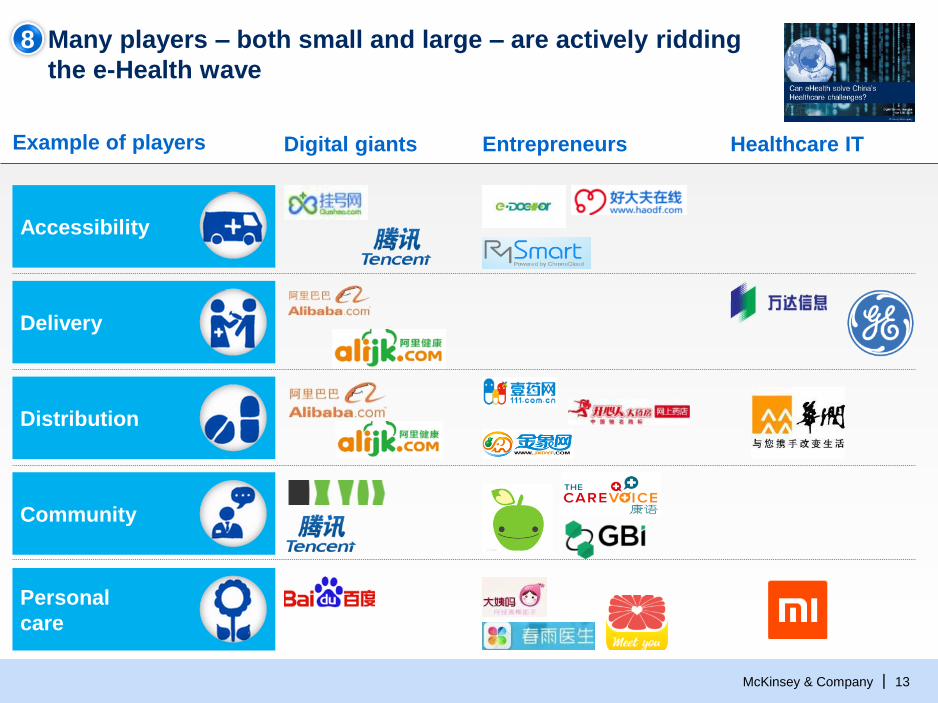
Many players – both small and large – are actively ridding
the e-Health wave
Example of players Digital giants Healthcare ITEntrepreneurs
Delivery
Personal
care
Accessibility
Distribution
Community
8
McKinsey & Company 14|
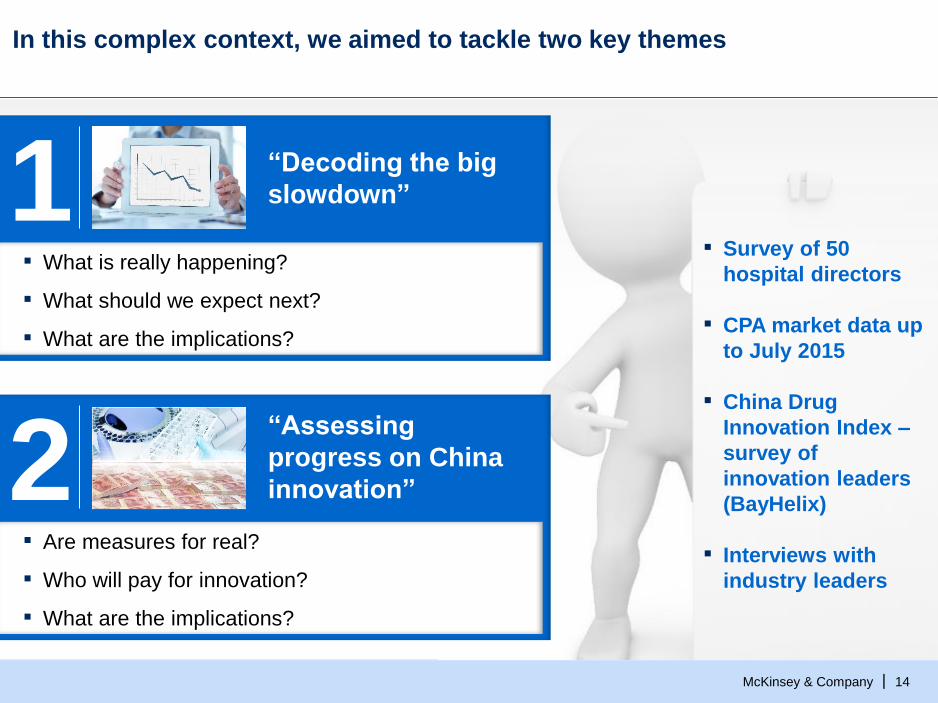
In this complex context, we aimed to tackle two key themes
▪ Survey of 50
hospital directors
▪ CPA market data up
to July 2015
▪ China Drug
Innovation Index –
survey of
innovation leaders
(BayHelix)
▪ Interviews with
industry leaders
“Decoding the big
slowdown”
▪ What is really happening?
▪ What should we expect next?
▪ What are the implications?
“Assessing
progress on China
innovation”
▪ Are measures for real?
▪ Who will pay for innovation?
▪ What are the implications?
1
2

McKinsey & Company 15|
Decoding the big slowdown
McKinsey & Company 16|
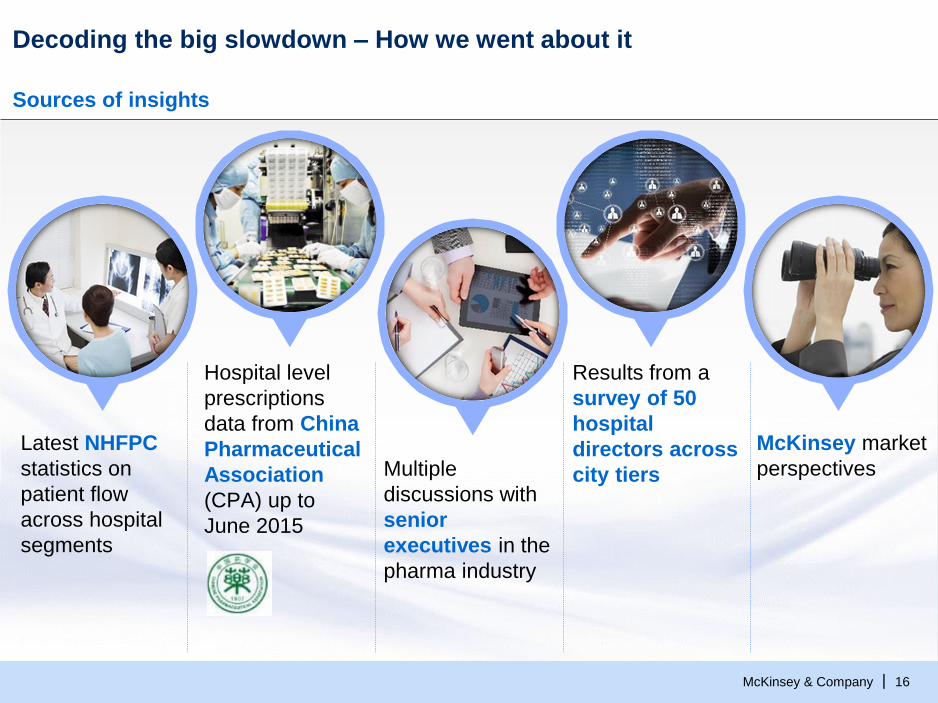
Decoding the big slowdown – How we went about it
Sources of insights
Latest NHFPC
statistics on
patient flow
across hospital
segments
Hospital level
prescriptions
data from China
Pharmaceutical
Association
(CPA) up to
June 2015
Multiple
discussions with
senior
executives in the
pharma industry
Results from a
survey of 50
hospital
directors across
city tiers
McKinsey market
perspectives
McKinsey & Company 17|
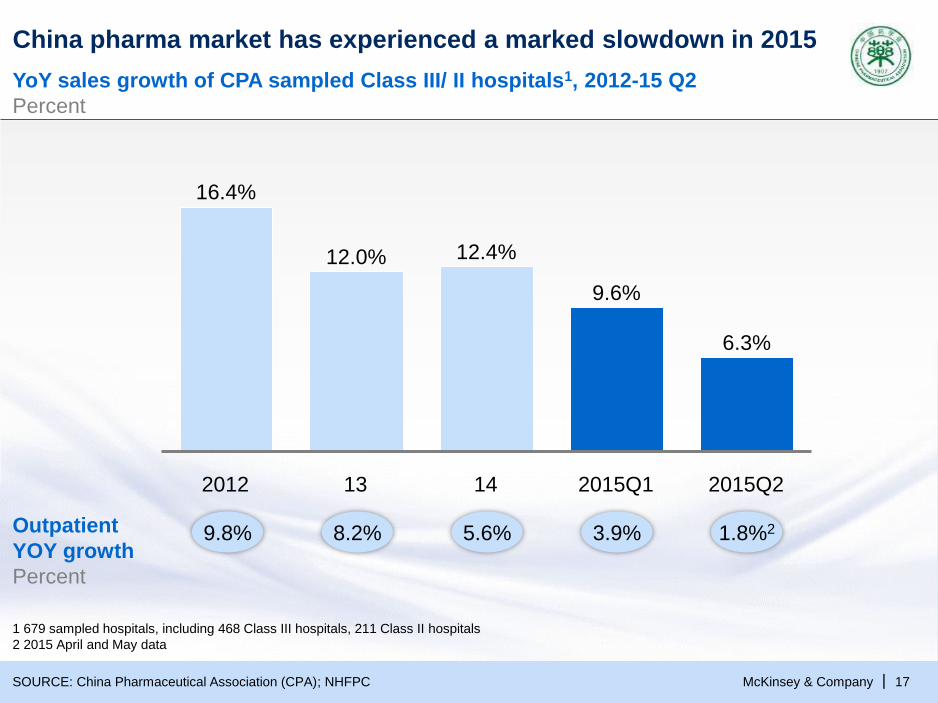
China pharma market has experienced a marked slowdown in 2015
YoY sales growth of CPA sampled Class III/ II hospitals1, 2012-15 Q2
Percent
SOURCE: China Pharmaceutical Association (CPA); NHFPC
1 679 sampled hospitals, including 468 Class III hospitals, 211 Class II hospitals
2 2015 April and May data
6.3%
2015Q114 2015Q213
9.6%
12.4%
16.4%
2012
12.0%
9.8%Outpatient
YOY growth
Percent
8.2% 5.6% 3.9% 1.8%2
McKinsey & Company 18|
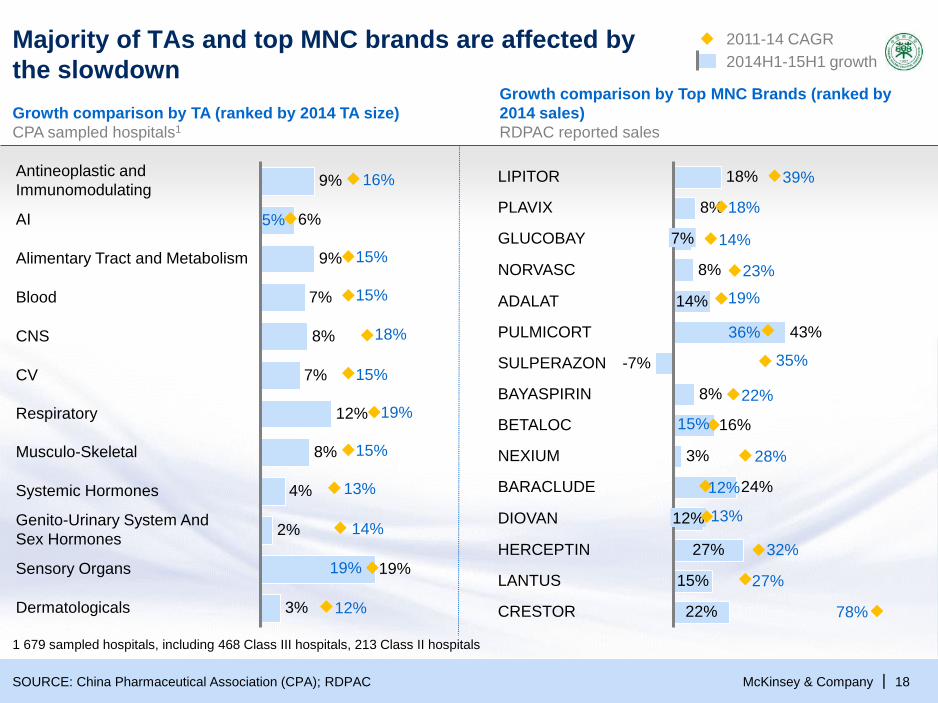
Majority of TAs and top MNC brands are affected by
the slowdown
Growth comparison by TA (ranked by 2014 TA size)
CPA sampled hospitals1
Growth comparison by Top MNC Brands (ranked by
2014 sales)
RDPAC reported sales
CV
CNS
Blood
Alimentary Tract and Metabolism
AI
Antineoplastic and
Immunomodulating
12%
7%
8%
7%
9%
6%
9%
Sensory Organs
3%
Genito-Urinary System And
Sex Hormones
Dermatologicals
19%
2%
Systemic Hormones 4%
Musculo-Skeletal 8%
Respiratory
8%
LIPITOR
GLUCOBAY
14%
18%
PLAVIX
8%
BETALOC
27%
7%
12%
22%
15%
24%
DIOVAN
NEXIUM
HERCEPTIN
LANTUS
CRESTOR
SULPERAZON
NORVASC
ADALAT
BARACLUDE
-7%
3%
PULMICORT
16%
BAYASPIRIN 8%
43%
16%
5%
15%
15%
18%
19%
15%
13%
14%
19%
12%
15%
39%
18%
14%
23%
19%
36%
35%
22%
15%
28%
12%
13%
32%
27%
78%
2011-14 CAGR
2014H1-15H1 growth
1 679 sampled hospitals, including 468 Class III hospitals, 213 Class II hospitals
SOURCE: China Pharmaceutical Association (CPA); RDPAC
McKinsey & Company 19|
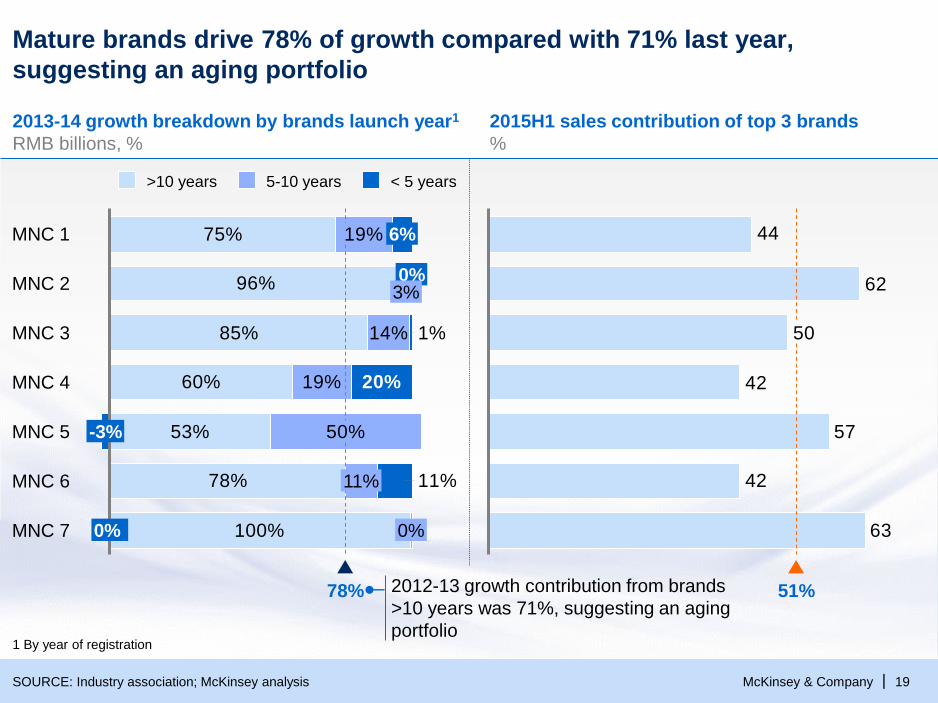
Mature brands drive 78% of growth compared with 71% last year,
suggesting an aging portfolio
SOURCE: Industry association; McKinsey analysis
1 By year of registration
2013-14 growth breakdown by brands launch year1
RMB billions, %
2015H1 sales contribution of top 3 brands
%
75%
96%
85%
60%
53%
78%
100%
19%
14%
19%
50%
11%
20%
1%
11%
MNC 4
MNC 7 0%
MNC 6
0%
MNC 5 -3%
MNC 3
0%
MNC 1
3%MNC 2
6%
78%
< 5 years>10 years 5-10 years
63
42
57
42
50
62
44
51%2012-13 growth contribution from brands
>10 years was 71%, suggesting an aging
portfolio
McKinsey & Company 20|
4
8
10
7
12
4
6
34
17
8
7
15
24
10%
25%
20%
15%
5%
0
6
6
1310 1411
17
6
1208 09
10
2006
10
9
07 2015
Apr-May
2
2015
Q1
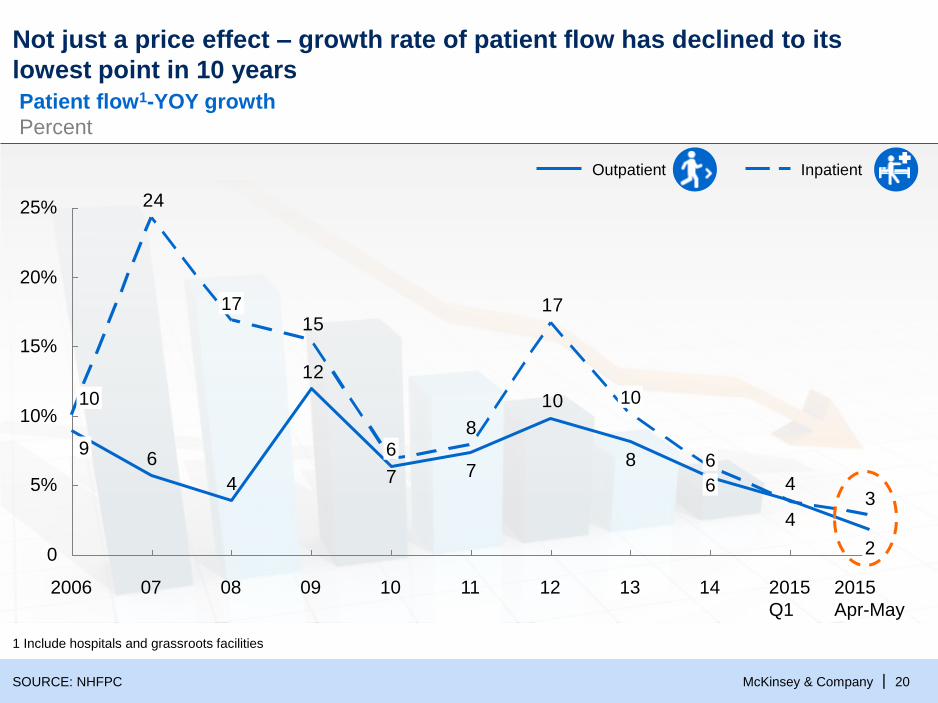
Not just a price effect – growth rate of patient flow has declined to its
lowest point in 10 years
SOURCE: NHFPC
1 Include hospitals and grassroots facilities
Patient flow1-YOY growth
Percent
InpatientOutpatient
McKinsey & Company 21|
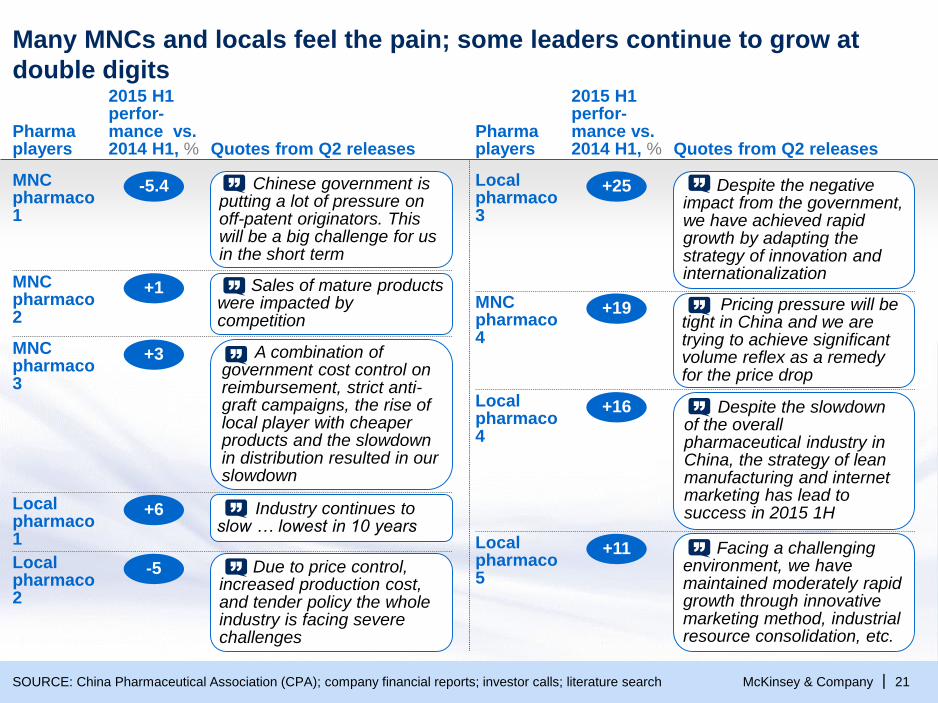
Many MNCs and locals feel the pain; some leaders continue to grow at
double digits
SOURCE: China Pharmaceutical Association (CPA); company financial reports; investor calls; literature search
2015 H1 perfor-mance vs. 2014 H1, %
2015 H1 perfor-mance vs. 2014 H1, %
Pharma players
Pharma playersQuotes from Q2 releases
+1MNC pharmaco 2
Sales of mature products were impacted by competition
+3MNC pharmaco 3
A combination of government cost control on reimbursement, strict anti-graft campaigns, the rise of local player with cheaper products and the slowdown in distribution resulted in our slowdown
+6Local pharmaco 1
Industry continues to slow … lowest in 10 years
-5Local pharmaco 2
Due to price control, increased production cost, and tender policy the whole industry is facing severe challenges
Quotes from Q2 releases
-5.4MNC pharmaco 1
Chinese government is putting a lot of pressure on off-patent originators. This will be a big challenge for us in the short term
+25Local pharmaco 3
Despite the negative impact from the government, we have achieved rapid growth by adapting the strategy of innovation and internationalization
+19MNC pharmaco 4
Pricing pressure will be tight in China and we are trying to achieve significant volume reflex as a remedy for the price drop
+16Local pharmaco 4
Despite the slowdown of the overall pharmaceutical industry in China, the strategy of lean manufacturing and internet marketing has lead to success in 2015 1H
+11Local pharmaco 5
Facing a challenging environment, we have maintained moderately rapid growth through innovative marketing method, industrial resource consolidation, etc.
McKinsey & Company 22|
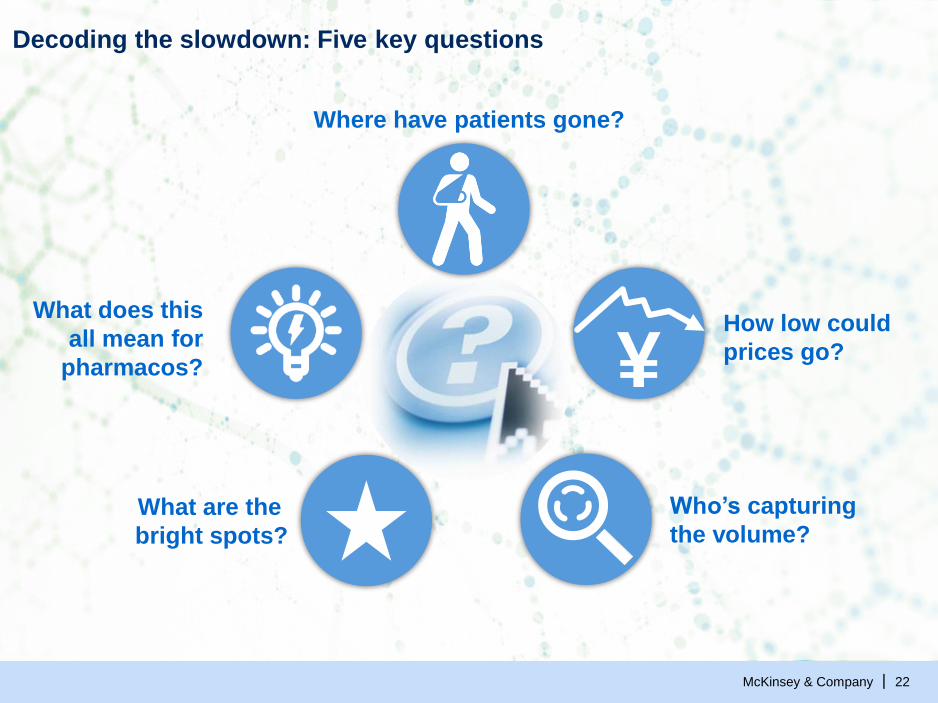
Decoding the slowdown: Five key questions
Where have patients gone?
How low could
prices go?¥What does this
all mean for
pharmacos?
What are the
bright spots?
Who’s capturing
the volume?
McKinsey & Company 23|
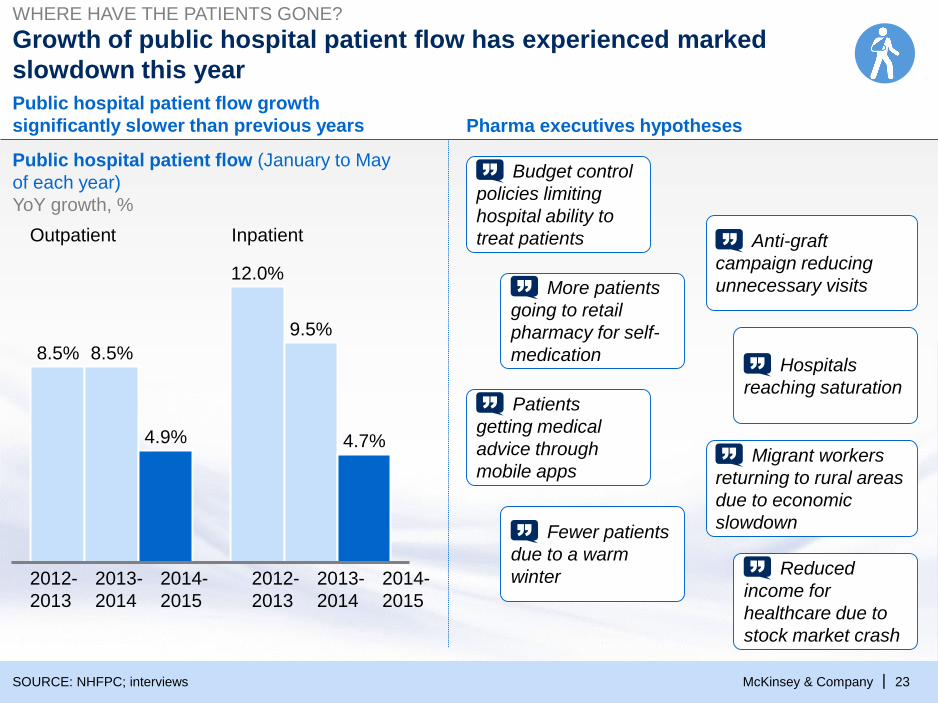
Growth of public hospital patient flow has experienced marked
slowdown this year
Public hospital patient flow (January to May
of each year)
YoY growth, %
SOURCE: NHFPC; interviews
WHERE HAVE THE PATIENTS GONE?
4.7%
9.5%
8.5%
12.0%
4.9%
8.5%
2012-
2013
2013-
2014
2014-
2015
2012-
2013
2013-
2014
2014-
2015
Outpatient Inpatient
Budget control
policies limiting
hospital ability to
treat patients Anti-graft
campaign reducing
unnecessary visitsMore patients
going to retail
pharmacy for self-
medication
Reduced
income for
healthcare due to
stock market crash
Hospitals
reaching saturation
Migrant workers
returning to rural areas
due to economic
slowdown
Pharma executives hypotheses
Public hospital patient flow growth
significantly slower than previous years
Patients
getting medical
advice through
mobile apps
Fewer patients
due to a warm
winter
McKinsey & Company 24|
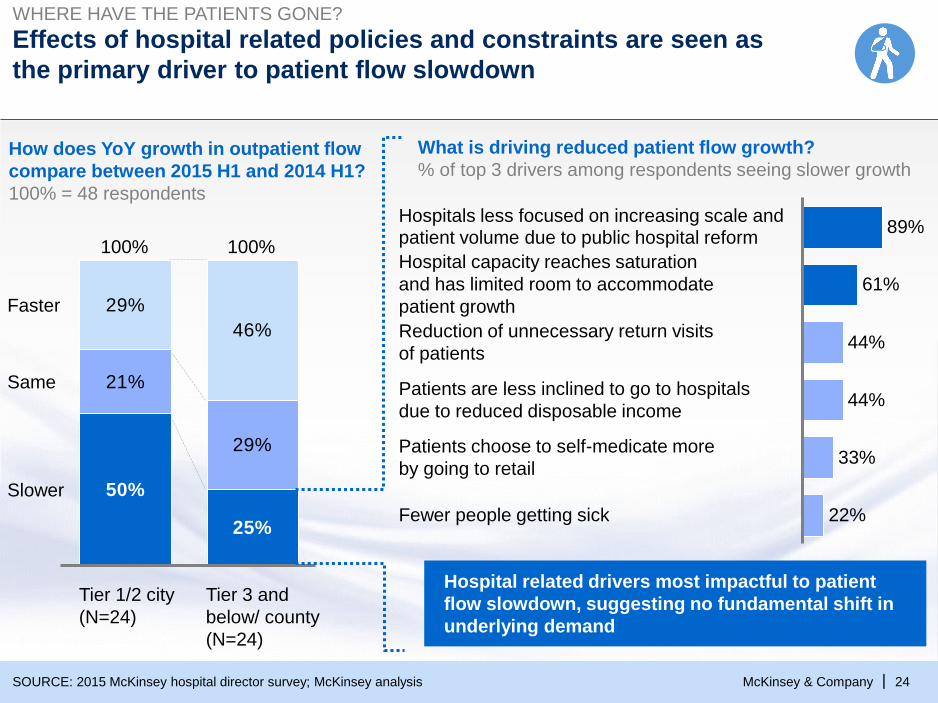
Effects of hospital related policies and constraints are seen as
the primary driver to patient flow slowdown
How does YoY growth in outpatient flow
compare between 2015 H1 and 2014 H1?
100% = 48 respondents
22%
Patients are less inclined to go to hospitals
due to reduced disposable income44%
Reduction of unnecessary return visits
of patients
33%
Fewer people getting sick
Patients choose to self-medicate more
by going to retail
Hospital capacity reaches saturation
and has limited room to accommodate
patient growth
Hospitals less focused on increasing scale and patient volume due to public hospital reform
61%
89%
44%
What is driving reduced patient flow growth?
% of top 3 drivers among respondents seeing slower growth
WHERE HAVE THE PATIENTS GONE?
SOURCE: 2015 McKinsey hospital director survey; McKinsey analysis
Hospital related drivers most impactful to patient
flow slowdown, suggesting no fundamental shift in
underlying demand
50%
25%
21%
29%
46%
29%
Slower
Faster
Same
100%
Tier 3 and
below/ county
(N=24)
Tier 1/2 city
(N=24)
100%
McKinsey & Company 25|
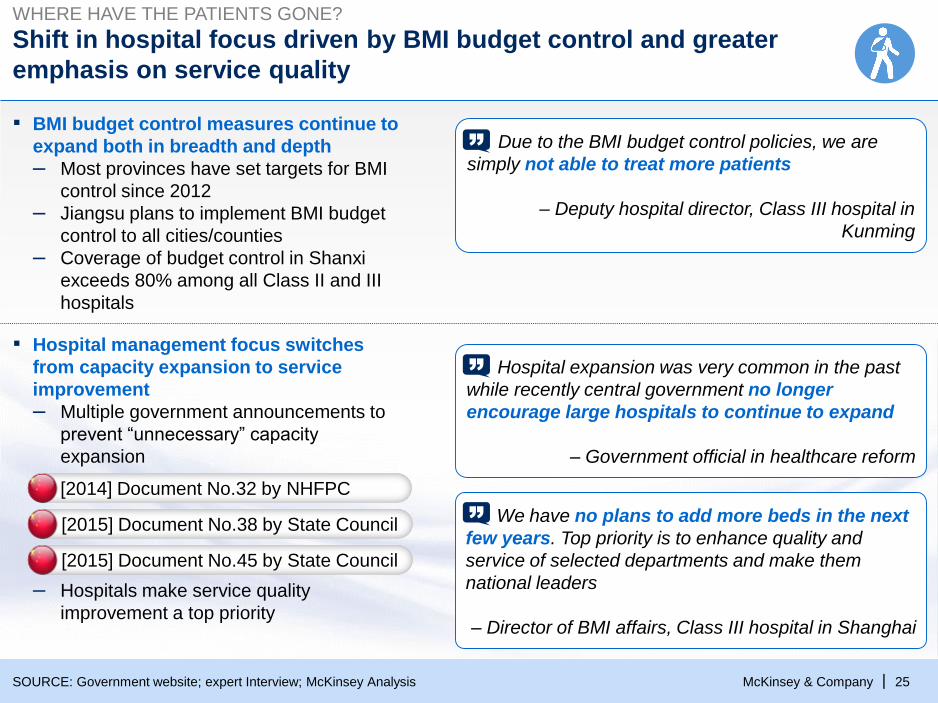
Shift in hospital focus driven by BMI budget control and greater
emphasis on service quality
Due to the BMI budget control policies, we are
simply not able to treat more patients
– Deputy hospital director, Class III hospital in
Kunming
▪ BMI budget control measures continue to
expand both in breadth and depth
– Most provinces have set targets for BMI
control since 2012
– Jiangsu plans to implement BMI budget
control to all cities/counties
– Coverage of budget control in Shanxi
exceeds 80% among all Class II and III
hospitals
▪ Hospital management focus switches
from capacity expansion to service
improvement
– Multiple government announcements to
prevent “unnecessary” capacity
expansion
– Hospitals make service quality
improvement a top priority
[2014] Document No.32 by NHFPC
[2015] Document No.45 by State Council
Hospital expansion was very common in the past
while recently central government no longer
encourage large hospitals to continue to expand
– Government official in healthcare reform
We have no plans to add more beds in the next
few years. Top priority is to enhance quality and
service of selected departments and make them
national leaders
– Director of BMI affairs, Class III hospital in Shanghai
[2015] Document No.38 by State Council
SOURCE: Government website; expert Interview; McKinsey Analysis
WHERE HAVE THE PATIENTS GONE?
McKinsey & Company 26|
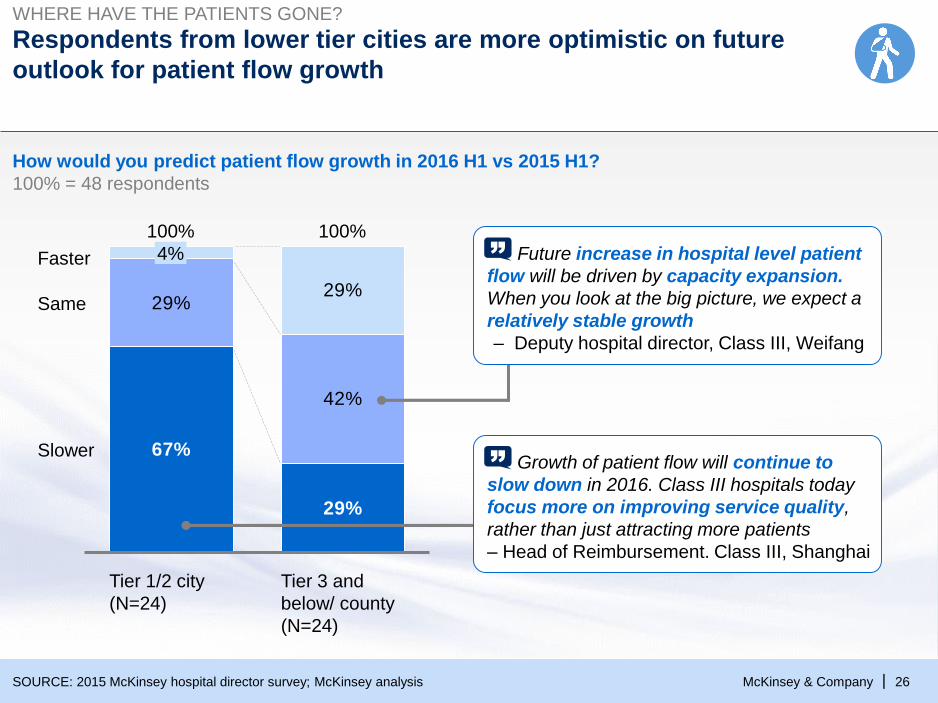
Respondents from lower tier cities are more optimistic on future
outlook for patient flow growth
WHERE HAVE THE PATIENTS GONE?
How would you predict patient flow growth in 2016 H1 vs 2015 H1?
100% = 48 respondents
SOURCE: 2015 McKinsey hospital director survey; McKinsey analysis
67%
29%
29%
42%
29%Same
Slower
Faster
Tier 3 and
below/ county
(N=24)
4%
100% 100%
Tier 1/2 city
(N=24)
Future increase in hospital level patient
flow will be driven by capacity expansion.
When you look at the big picture, we expect a
relatively stable growth
– Deputy hospital director, Class III, Weifang
Growth of patient flow will continue to
slow down in 2016. Class III hospitals today
focus more on improving service quality,
rather than just attracting more patients
– Head of Reimbursement. Class III, Shanghai
McKinsey & Company 27|
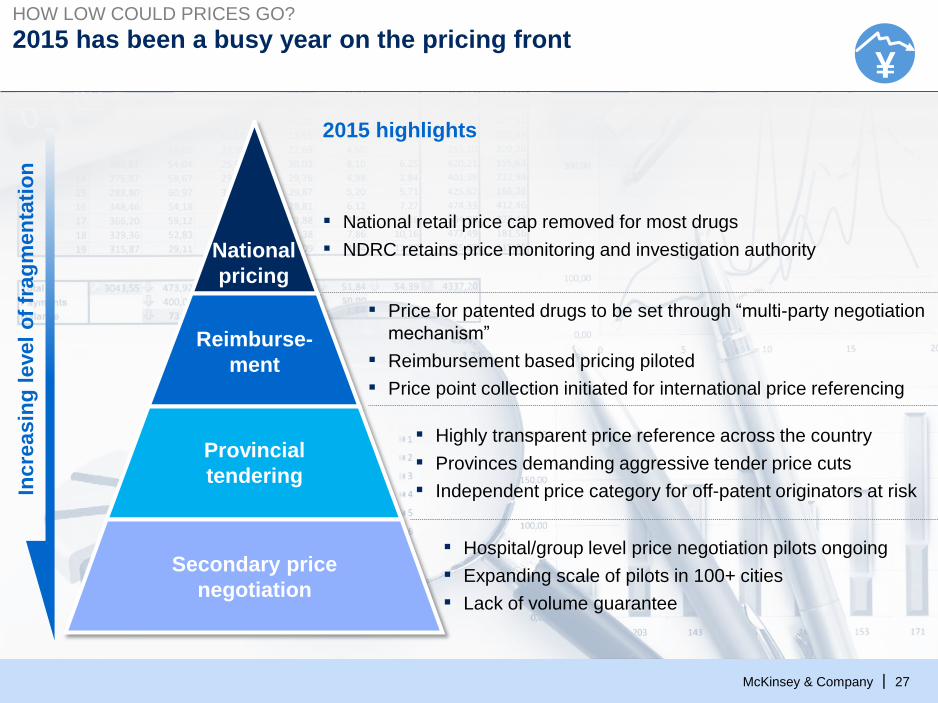
2015 has been a busy year on the pricing front
National
pricing
Reimburse-
ment
Provincial
tendering
Secondary price
negotiation
Incre
asin
g l
evel
of
frag
men
tati
on
2015 highlights
▪ National retail price cap removed for most drugs
▪ NDRC retains price monitoring and investigation authority
▪ Price for patented drugs to be set through “multi-party negotiation
mechanism”
▪ Reimbursement based pricing piloted
▪ Price point collection initiated for international price referencing
▪ Highly transparent price reference across the country
▪ Provinces demanding aggressive tender price cuts
▪ Independent price category for off-patent originators at risk
▪ Hospital/group level price negotiation pilots ongoing
▪ Expanding scale of pilots in 100+ cities
▪ Lack of volume guarantee
HOW LOW COULD PRICES GO?
¥
McKinsey & Company 28|
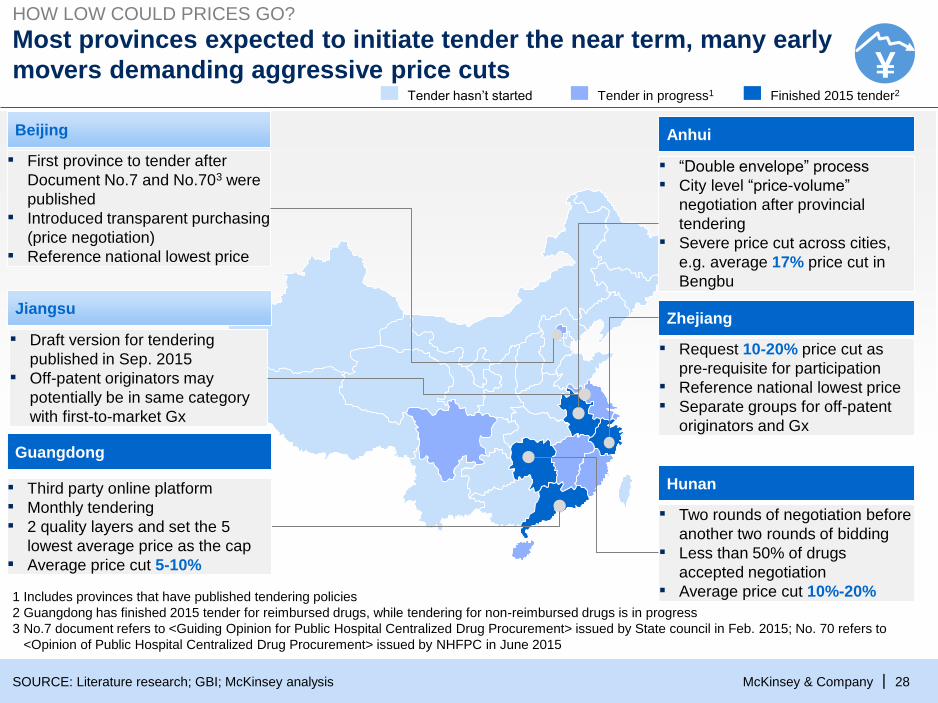
Most provinces expected to initiate tender the near term, many early
movers demanding aggressive price cuts
SOURCE: Literature research; GBI; McKinsey analysis
Tender in progress1Tender hasn’t started Finished 2015 tender2
Anhui
▪ “Double envelope” process
▪ City level “price-volume”
negotiation after provincial
tendering
▪ Severe price cut across cities,
e.g. average 17% price cut in
Bengbu
Hunan
▪ Two rounds of negotiation before
another two rounds of bidding
▪ Less than 50% of drugs
accepted negotiation
▪ Average price cut 10%-20%1 Includes provinces that have published tendering policies
2 Guangdong has finished 2015 tender for reimbursed drugs, while tendering for non-reimbursed drugs is in progress
3 No.7 document refers to <Guiding Opinion for Public Hospital Centralized Drug Procurement> issued by State council in Feb. 2015; No. 70 refers to
<Opinion of Public Hospital Centralized Drug Procurement> issued by NHFPC in June 2015
▪ Request 10-20% price cut as
pre-requisite for participation
▪ Reference national lowest price
▪ Separate groups for off-patent
originators and Gx
Zhejiang
Guangdong
▪ Third party online platform
▪ Monthly tendering
▪ 2 quality layers and set the 5
lowest average price as the cap
▪ Average price cut 5-10%
▪ First province to tender after
Document No.7 and No.703 were
published
▪ Introduced transparent purchasing
(price negotiation)
▪ Reference national lowest price
Beijing
HOW LOW COULD PRICES GO?
Jiangsu
▪ Draft version for tendering
published in Sep. 2015
▪ Off-patent originators may
potentially be in same category
with first-to-market Gx
¥
McKinsey & Company 29|
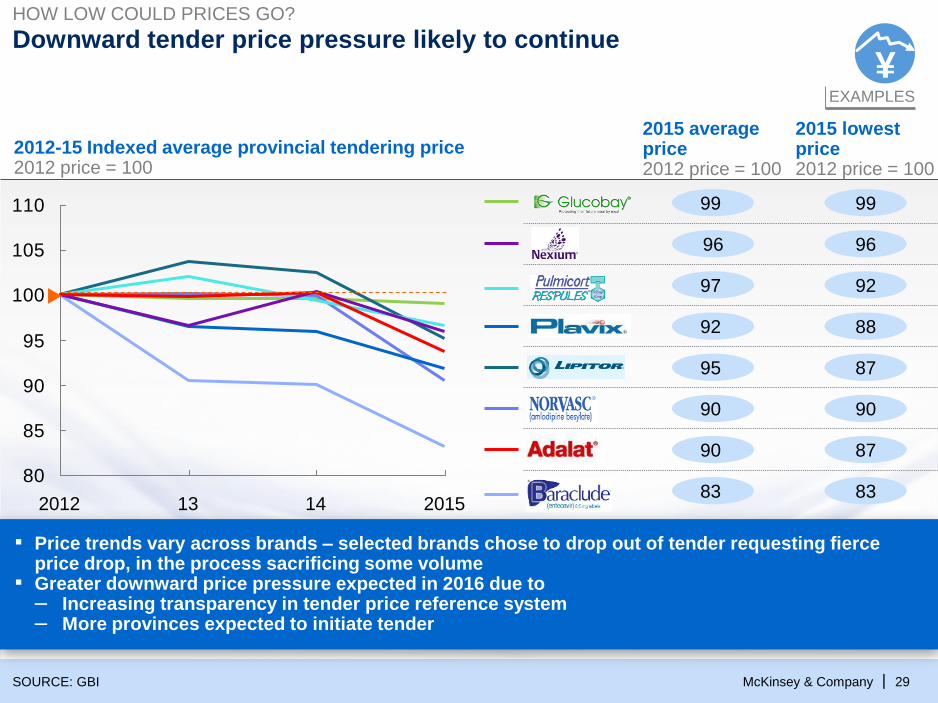
Downward tender price pressure likely to continue
SOURCE: GBI
HOW LOW COULD PRICES GO?
2012-15 Indexed average provincial tendering price2012 price = 100
80
85
90
95
100
105
110
142012 13 2015
2015 averageprice2012 price = 100
2015 lowest price2012 price = 100
9999
9696
9297
8892
8795
9090
8790
8383
EXAMPLES
¥
▪ Price trends vary across brands – selected brands chose to drop out of tender requesting fierce price drop, in the process sacrificing some volume
▪ Greater downward price pressure expected in 2016 due to– Increasing transparency in tender price reference system – More provinces expected to initiate tender
McKinsey & Company 30|
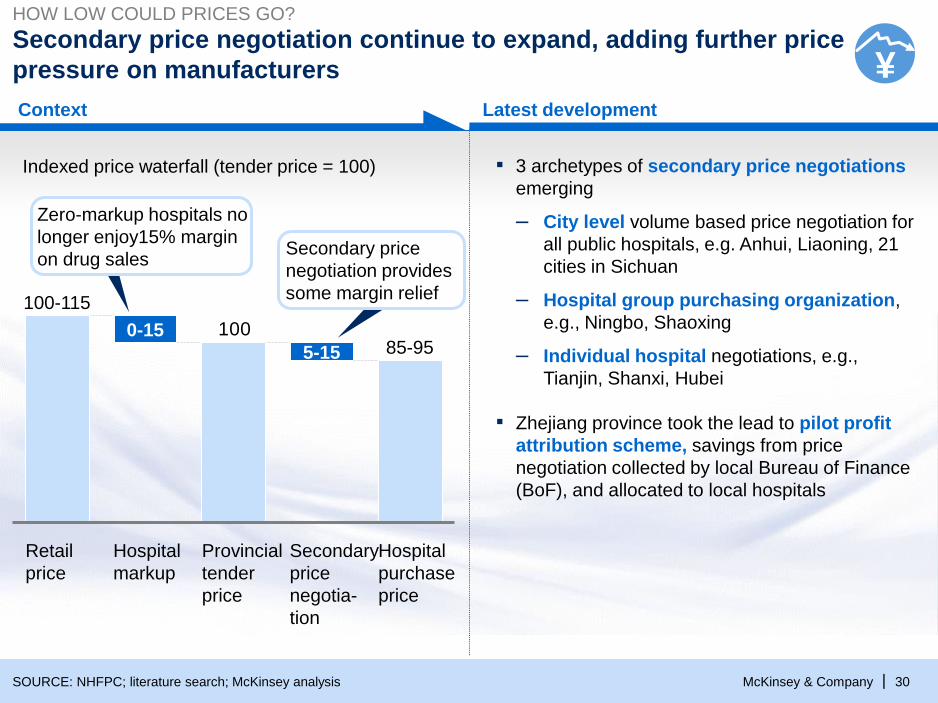
Secondary price negotiation continue to expand, adding further price
pressure on manufacturers
100
Hospital
purchase
price
85-95
Secondary
price
negotia-
tion
0-15
Retail
price
Provincial
tender
price
5-15
Hospital
markup
100-115
Zero-markup hospitals no
longer enjoy15% margin
on drug salesSecondary price
negotiation provides
some margin relief
SOURCE: NHFPC; literature search; McKinsey analysis
Latest development
▪ 3 archetypes of secondary price negotiations
emerging
– City level volume based price negotiation for
all public hospitals, e.g. Anhui, Liaoning, 21
cities in Sichuan
– Hospital group purchasing organization,
e.g., Ningbo, Shaoxing
– Individual hospital negotiations, e.g.,
Tianjin, Shanxi, Hubei
▪ Zhejiang province took the lead to pilot profit
attribution scheme, savings from price
negotiation collected by local Bureau of Finance
(BoF), and allocated to local hospitals
Indexed price waterfall (tender price = 100)
Context
HOW LOW COULD PRICES GO?
¥
McKinsey & Company 31|
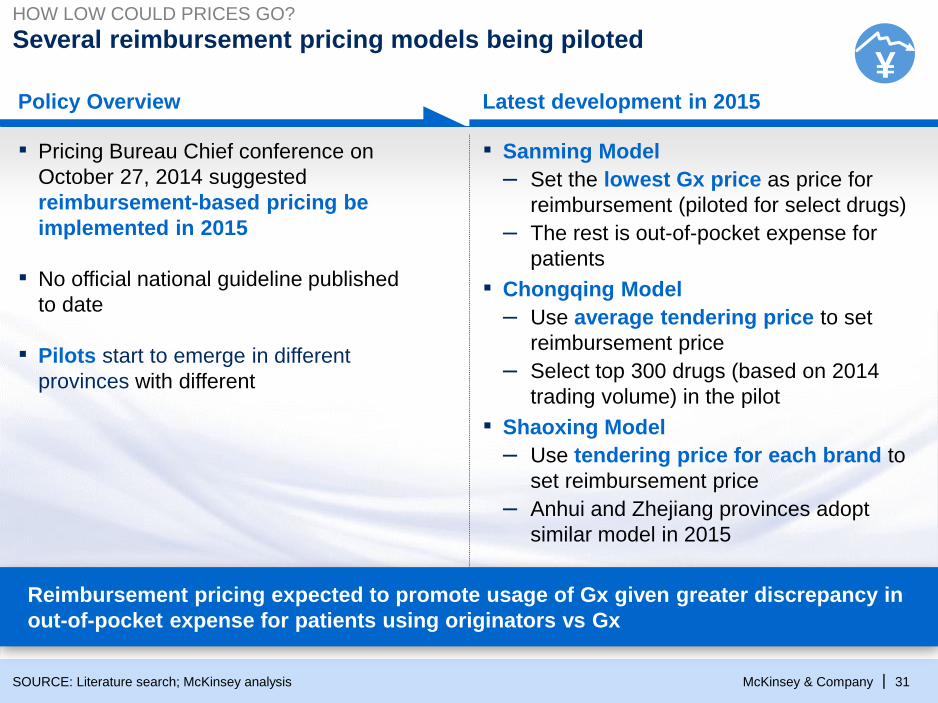
Several reimbursement pricing models being piloted
SOURCE: Literature search; McKinsey analysis
HOW LOW COULD PRICES GO?
Policy Overview Latest development in 2015
▪ Sanming Model
– Set the lowest Gx price as price for
reimbursement (piloted for select drugs)
– The rest is out-of-pocket expense for
patients
▪ Chongqing Model
– Use average tendering price to set
reimbursement price
– Select top 300 drugs (based on 2014
trading volume) in the pilot
▪ Shaoxing Model
– Use tendering price for each brand to
set reimbursement price
– Anhui and Zhejiang provinces adopt
similar model in 2015
▪ Pricing Bureau Chief conference on
October 27, 2014 suggested
reimbursement-based pricing be
implemented in 2015
▪ No official national guideline published
to date
▪ Pilots start to emerge in different
provinces with different
¥
Reimbursement pricing expected to promote usage of Gx given greater discrepancy in
out-of-pocket expense for patients using originators vs Gx
McKinsey & Company 32|
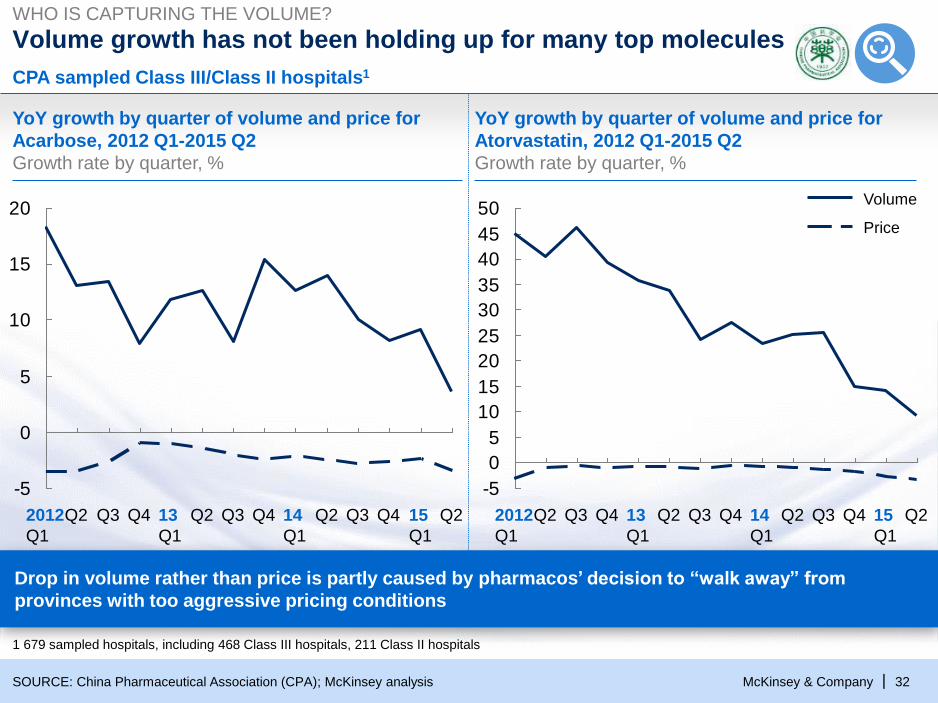
Volume growth has not been holding up for many top molecules
-5
0
5
10
15
20
Q215
Q1
Q4Q3Q2Q413
Q1
Q22012
Q1
Q3 Q4 Q3Q2 14
Q1
-5
0
5
10
15
20
25
30
35
40
45
50
15
Q1
Q4Q3Q214
Q1
Q22012
Q1
Q3Q2Q3Q2 13
Q1
Q4 Q4
Price
Volume
YoY growth by quarter of volume and price for
Acarbose, 2012 Q1-2015 Q2
Growth rate by quarter, %
YoY growth by quarter of volume and price for
Atorvastatin, 2012 Q1-2015 Q2
Growth rate by quarter, %
CPA sampled Class III/Class II hospitals1
SOURCE: China Pharmaceutical Association (CPA); McKinsey analysis
WHO IS CAPTURING THE VOLUME?
Drop in volume rather than price is partly caused by pharmacos’ decision to “walk away” from
provinces with too aggressive pricing conditions
1 679 sampled hospitals, including 468 Class III hospitals, 211 Class II hospitals
McKinsey & Company 33|
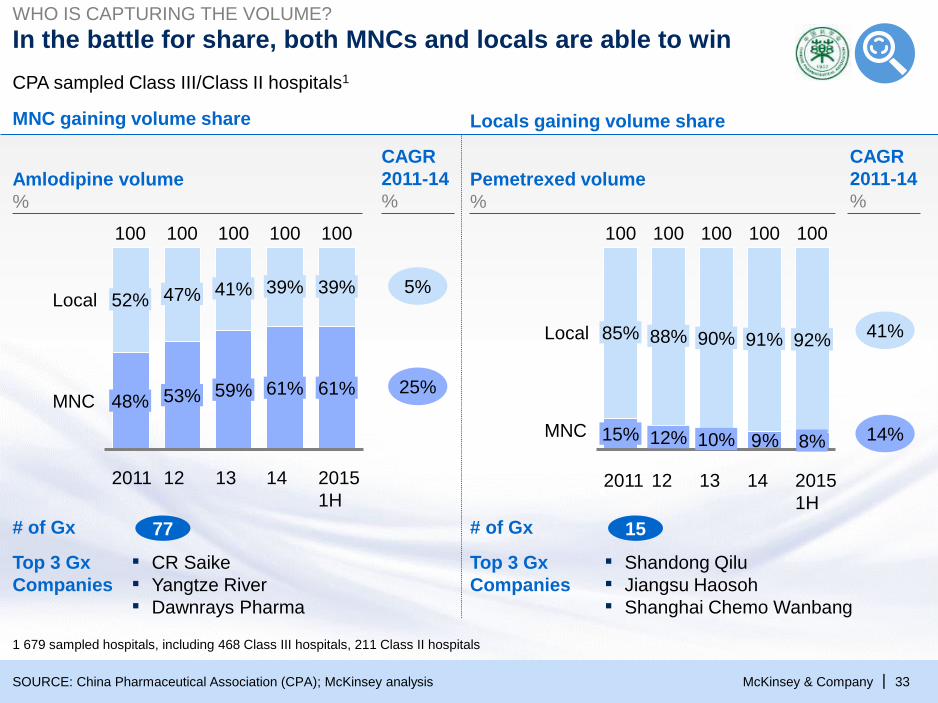
In the battle for share, both MNCs and locals are able to winWHO IS CAPTURING THE VOLUME?
9%
Local
14
10%
90%
12%
91%
2015
1H
8%
100
MNC
92%
100 100
1312
100
88%
2011
15%
85%
100100
59%
41%
48%
52% 47%
100
2011 12 13
100
53%
39%
MNC
Local
61%
2015
1H
14
100
39%
61%
100
Locals gaining volume share
# of Gx
Top 3 Gx
Companies
15
▪ Shandong Qilu
▪ Jiangsu Haosoh
▪ Shanghai Chemo Wanbang
41%
14%
CAGR
2011-14
%
MNC gaining volume share
77
▪ CR Saike
▪ Yangtze River
▪ Dawnrays Pharma
5%
25%
CAGR
2011-14
%
# of Gx
Top 3 Gx
Companies
Amlodipine volume
%
Pemetrexed volume
%
SOURCE: China Pharmaceutical Association (CPA); McKinsey analysis
CPA sampled Class III/Class II hospitals1
1 679 sampled hospitals, including 468 Class III hospitals, 211 Class II hospitals
McKinsey & Company 34|
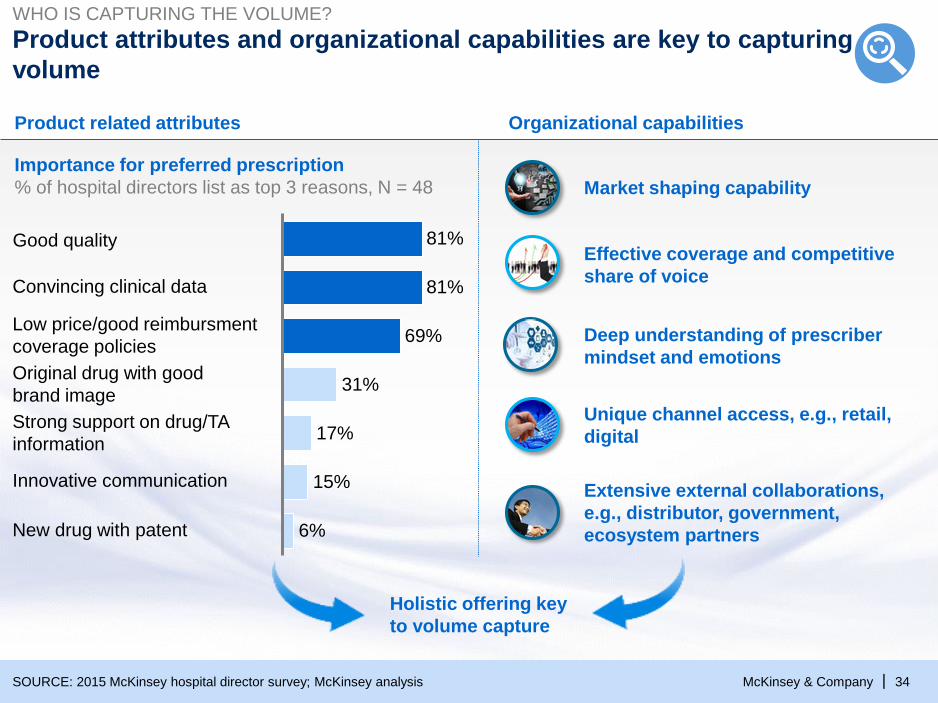
WHO IS CAPTURING THE VOLUME?
17%
81%
81%
31%
6%
69%
15%
Importance for preferred prescription
% of hospital directors list as top 3 reasons, N = 48
Product attributes and organizational capabilities are key to capturing
volume
Good quality
Convincing clinical data
Low price/good reimbursment
coverage policies
Original drug with good
brand image
Strong support on drug/TA
information
Innovative communication
New drug with patent
SOURCE: 2015 McKinsey hospital director survey; McKinsey analysis
Product related attributes
Deep understanding of prescriber
mindset and emotions
Unique channel access, e.g., retail,
digital
Extensive external collaborations,
e.g., distributor, government,
ecosystem partners
Effective coverage and competitive
share of voice
Market shaping capability
Organizational capabilities
Holistic offering key
to volume capture
McKinsey & Company 35|
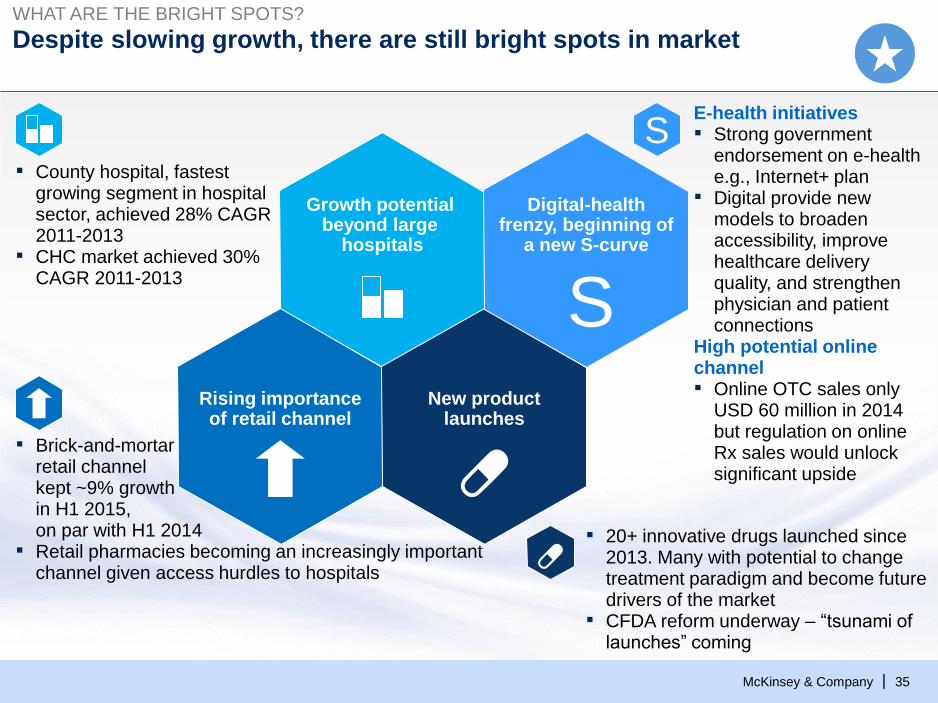
Despite slowing growth, there are still bright spots in marketWHAT ARE THE BRIGHT SPOTS?
E-health initiatives▪ Strong government
endorsement on e-health e.g., Internet+ plan
▪ Digital provide new models to broaden accessibility, improve healthcare delivery quality, and strengthen physician and patient connections
High potential online channel▪ Online OTC sales only
USD 60 million in 2014 but regulation on online Rx sales would unlock significant upside
▪ County hospital, fastest growing segment in hospital sector, achieved 28% CAGR2011-2013
▪ CHC market achieved 30% CAGR 2011-2013
▪ Brick-and-mortar retail channel kept ~9% growth in H1 2015, on par with H1 2014
▪ Retail pharmacies becoming an increasingly important channel given access hurdles to hospitals
S
Growth potential beyond large
hospitals
Rising importance of retail channel
New product launches
Digital-health frenzy, beginning of
a new S-curve
S
▪ 20+ innovative drugs launched since 2013. Many with potential to change treatment paradigm and become future drivers of the market
▪ CFDA reform underway – “tsunami of launches” coming
McKinsey & Company 36|
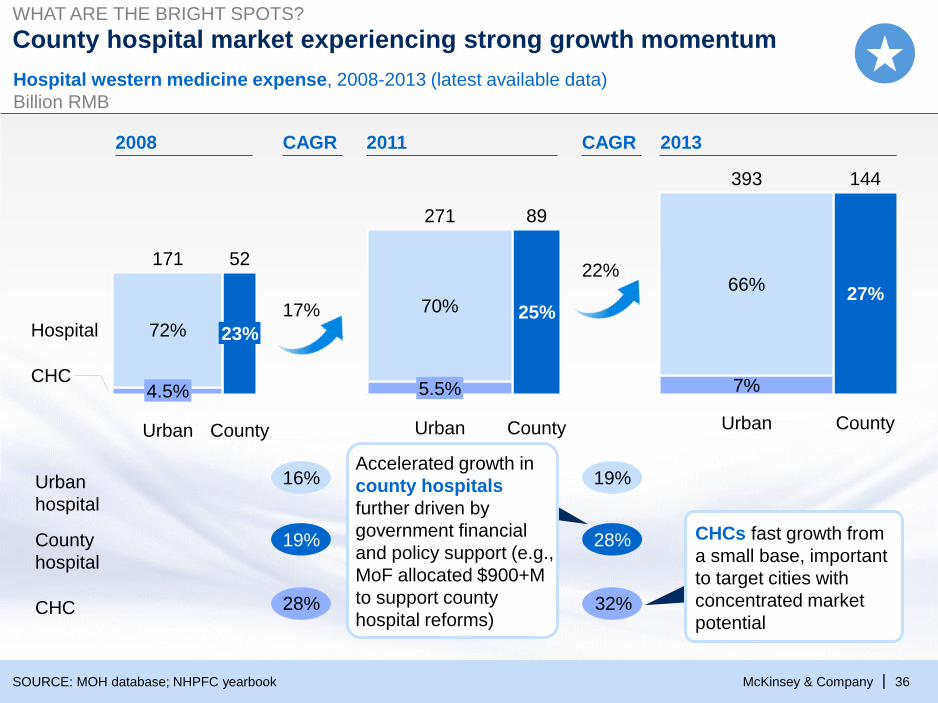
County hospital market experiencing strong growth momentum
7%
66%
Urban
393
County
144
27%25%
5.5%
70%
County
89
Urban
271
County
52
Urban
171
CHC
Hospital
4.5%
23%72%
2008 2011 2013
17%
22%
Hospital western medicine expense, 2008-2013 (latest available data)
Billion RMB
SOURCE: MOH database; NHPFC yearbook
16%
19%
28%
CAGR CAGR
19%
28%
32%
Urban
hospital
County
hospital
CHC
WHAT ARE THE BRIGHT SPOTS?
Accelerated growth in
county hospitals
further driven by
government financial
and policy support (e.g.,
MoF allocated $900+M
to support county
hospital reforms)
CHCs fast growth from
a small base, important
to target cities with
concentrated market
potential
McKinsey & Company 37|
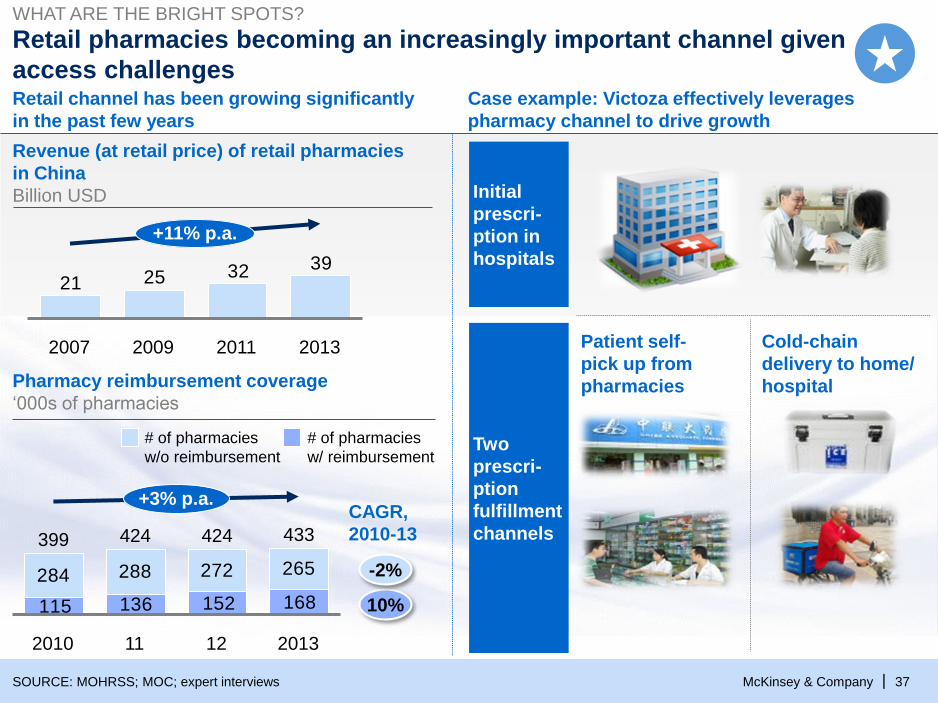
Retail pharmacies becoming an increasingly important channel given
access challenges
SOURCE: MOHRSS; MOC; expert interviews
WHAT ARE THE BRIGHT SPOTS?
Initial
prescri-
ption in
hospitals
Two
prescri-
ption
fulfillment
channels
Patient self-
pick up from
pharmacies
Cold-chain
delivery to home/
hospital
Case example: Victoza effectively leverages
pharmacy channel to drive growth
Retail channel has been growing significantly
in the past few years
39322521
+11% p.a.
20112009 20132007
Revenue (at retail price) of retail pharmacies
in China
Billion USD
Pharmacy reimbursement coverage
‘000s of pharmacies
284 288 272 265
168152136115
424 424
12112010
399
+3% p.a.
433
2013
# of pharmacies
w/o reimbursement
# of pharmacies
w/ reimbursement
10%
CAGR,
2010-13
-2%
McKinsey & Company 38|
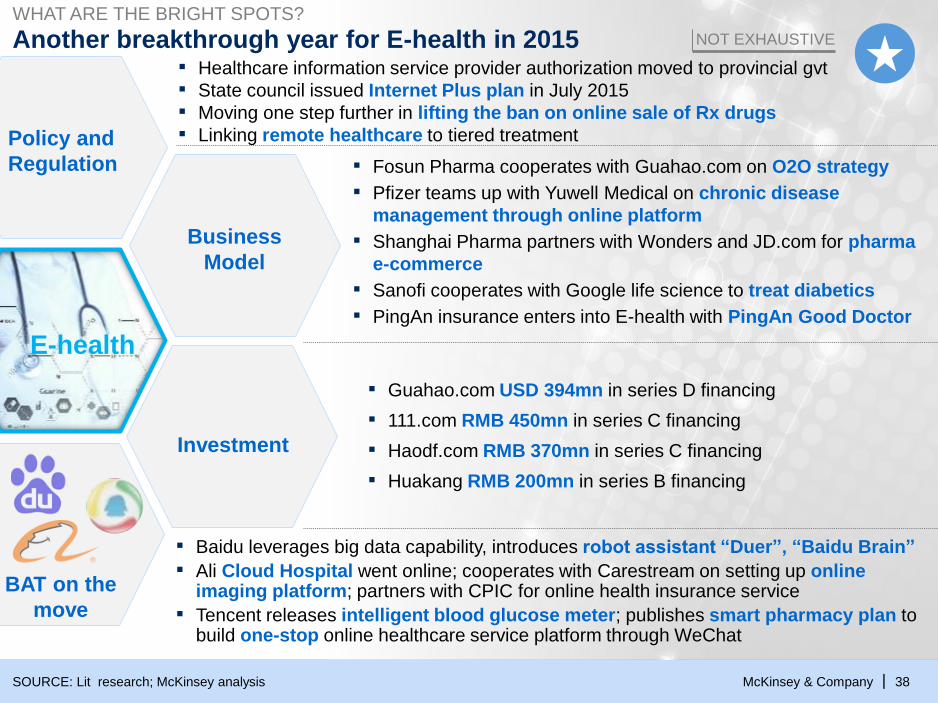
Another breakthrough year for E-health in 2015
SOURCE: Lit research; McKinsey analysis
WHAT ARE THE BRIGHT SPOTS?
NOT EXHAUSTIVE
▪ Healthcare information service provider authorization moved to provincial gvt
▪ State council issued Internet Plus plan in July 2015
▪ Moving one step further in lifting the ban on online sale of Rx drugs
▪ Linking remote healthcare to tiered treatment
▪ Fosun Pharma cooperates with Guahao.com on O2O strategy
▪ Pfizer teams up with Yuwell Medical on chronic disease
management through online platform
▪ Shanghai Pharma partners with Wonders and JD.com for pharma
e-commerce
▪ Sanofi cooperates with Google life science to treat diabetics
▪ PingAn insurance enters into E-health with PingAn Good Doctor
▪ Guahao.com USD 394mn in series D financing
▪ 111.com RMB 450mn in series C financing
▪ Haodf.com RMB 370mn in series C financing
▪ Huakang RMB 200mn in series B financing
▪ Baidu leverages big data capability, introduces robot assistant “Duer”, “Baidu Brain”
▪ Ali Cloud Hospital went online; cooperates with Carestream on setting up online imaging platform; partners with CPIC for online health insurance service
▪ Tencent releases intelligent blood glucose meter; publishes smart pharmacy plan to build one-stop online healthcare service platform through WeChat
E-health
Policy and
Regulation
Business
Model
Investment
BAT on the
move
McKinsey & Company 39|
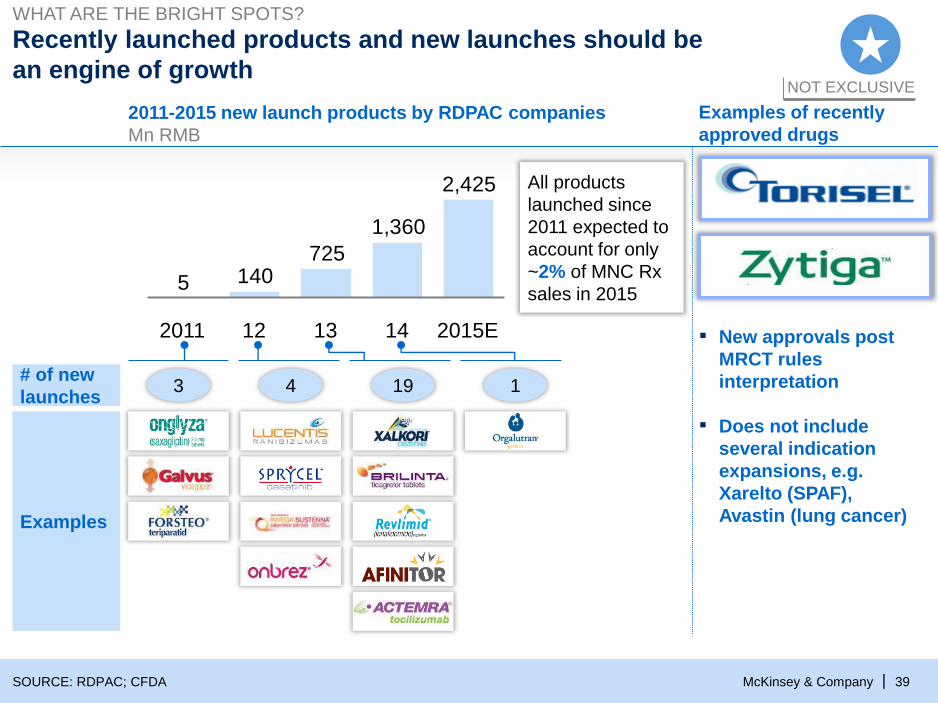
Recently launched products and new launches should be
an engine of growth
SOURCE: RDPAC; CFDA
WHAT ARE THE BRIGHT SPOTS?
Examples of recently
approved drugs
2011-2015 new launch products by RDPAC companies
Mn RMB
NOT EXCLUSIVE
Examples
2,425
1,360
7251405
122011 13 2015E14
All products
launched since
2011 expected to
account for only
~2% of MNC Rx
sales in 2015
# of new
launches3 4 19 1
▪ New approvals post
MRCT rules
interpretation
▪ Does not include
several indication
expansions, e.g.
Xarelto (SPAF),
Avastin (lung cancer)
McKinsey & Company 40|
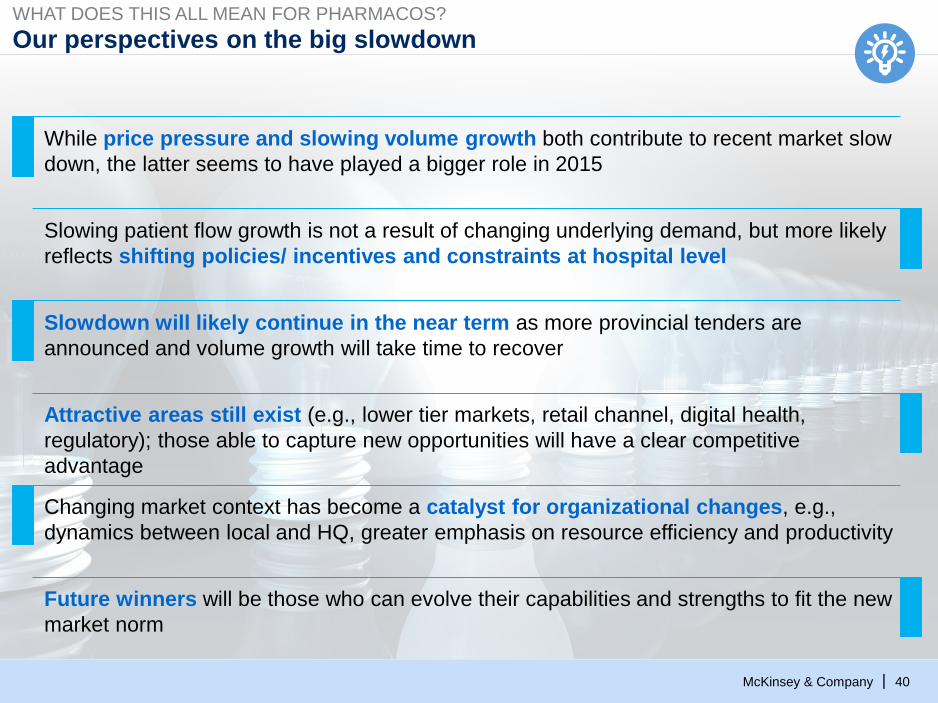
Our perspectives on the big slowdownWHAT DOES THIS ALL MEAN FOR PHARMACOS?
While price pressure and slowing volume growth both contribute to recent market slow
down, the latter seems to have played a bigger role in 2015
Slowing patient flow growth is not a result of changing underlying demand, but more likely
reflects shifting policies/ incentives and constraints at hospital level
Slowdown will likely continue in the near term as more provincial tenders are
announced and volume growth will take time to recover
Attractive areas still exist (e.g., lower tier markets, retail channel, digital health,
regulatory); those able to capture new opportunities will have a clear competitive
advantage
Changing market context has become a catalyst for organizational changes, e.g.,
dynamics between local and HQ, greater emphasis on resource efficiency and productivity
Future winners will be those who can evolve their capabilities and strengths to fit the new
market norm
McKinsey & Company 41|
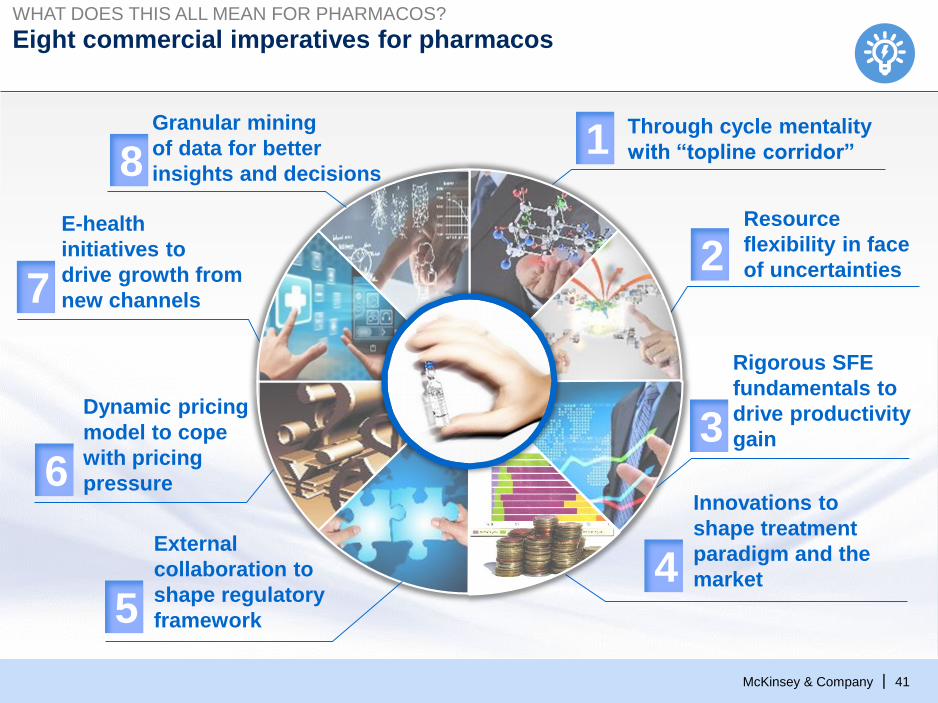
Eight commercial imperatives for pharmacos
Through cycle mentality
with “topline corridor”
Resource
flexibility in face
of uncertainties
Dynamic pricing
model to cope
with pricing
pressure
E-health
initiatives to
drive growth from
new channels
1
2
5
36
7
8
Rigorous SFE
fundamentals to
drive productivity
gain
External
collaboration to
shape regulatory
framework
Granular mining
of data for better
insights and decisions
WHAT DOES THIS ALL MEAN FOR PHARMACOS?
4
Innovations to
shape treatment
paradigm and the
market

McKinsey & Company 42|
Assessing progress on innovation
McKinsey & Company 43|
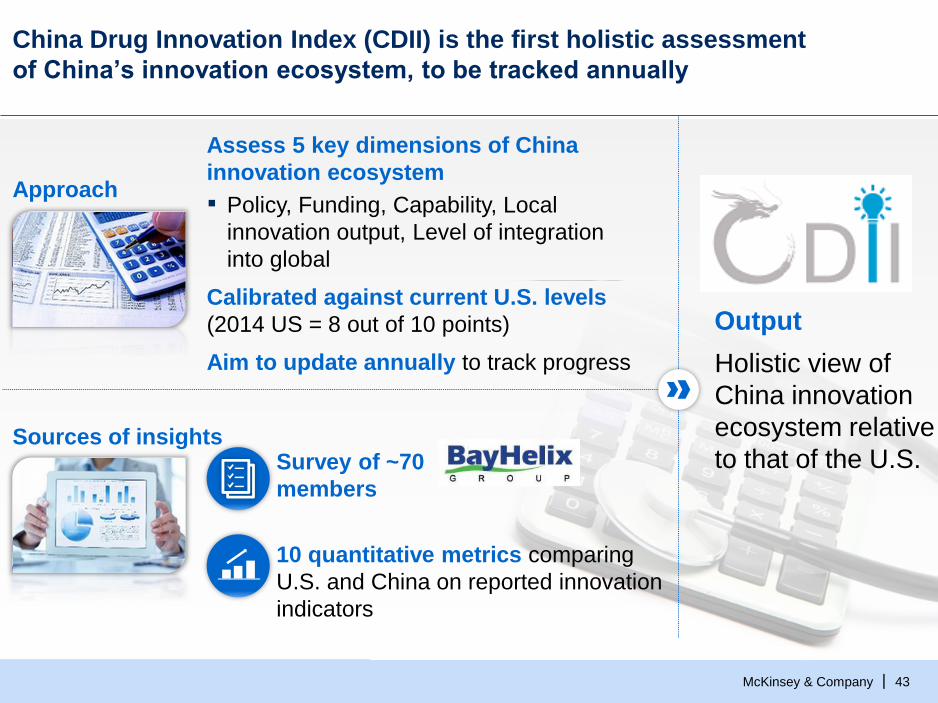
China Drug Innovation Index (CDII) is the first holistic assessment
of China’s innovation ecosystem, to be tracked annually
Assess 5 key dimensions of China
innovation ecosystem
▪ Policy, Funding, Capability, Local
innovation output, Level of integration
into global
Calibrated against current U.S. levels
(2014 US = 8 out of 10 points)
Aim to update annually to track progress
Approach
Sources of insightsSurvey of ~70
members
10 quantitative metrics comparing
U.S. and China on reported innovation
indicators
Holistic view of
China innovation
ecosystem relative
to that of the U.S.
Output
McKinsey & Company 44|SOURCE: Source
Text
Where does China stand on drug innovation?
McKinsey & Company 45|
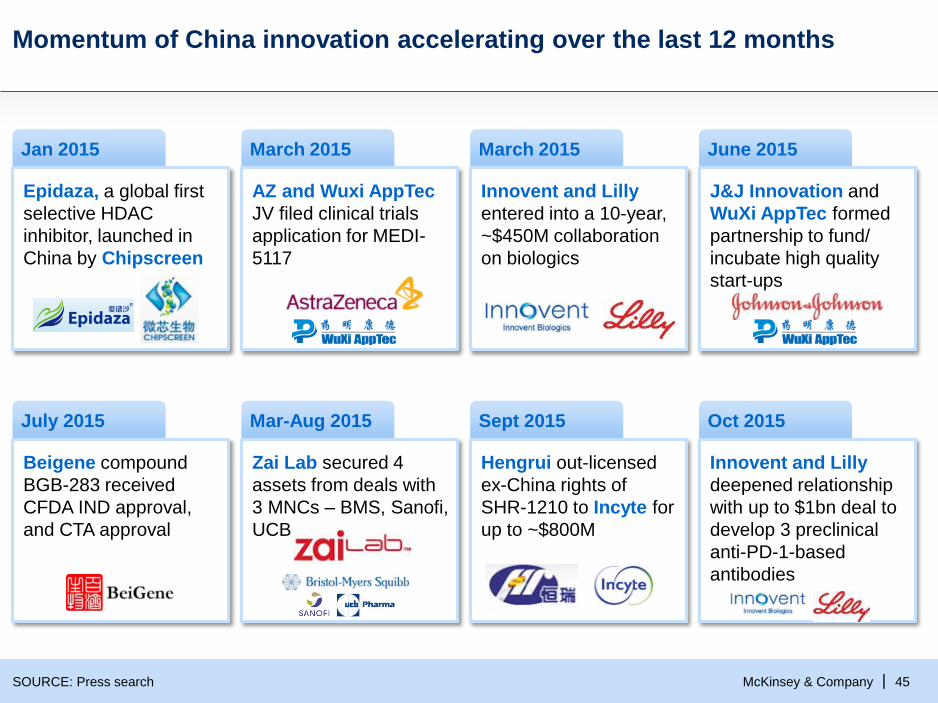
Jan 2015 March 2015 March 2015 June 2015
Epidaza, a global first
selective HDAC
inhibitor, launched in
China by Chipscreen
AZ and Wuxi AppTec
JV filed clinical trials
application for MEDI-
5117
Innovent and Lilly
entered into a 10-year,
~$450M collaboration
on biologics
J&J Innovation and
WuXi AppTec formed
partnership to fund/
incubate high quality
start-ups
July 2015
Beigene compound
BGB-283 received
CFDA IND approval,
and CTA approval
Mar-Aug 2015
Zai Lab secured 4
assets from deals with
3 MNCs – BMS, Sanofi,
UCB
Sept 2015
Hengrui out-licensed
ex-China rights of
SHR-1210 to Incyte for
up to ~$800M
Oct 2015
Innovent and Lilly
deepened relationship
with up to $1bn deal to
develop 3 preclinical
anti-PD-1-based
antibodies
Momentum of China innovation accelerating over the last 12 months
SOURCE: Press search
McKinsey & Company 46|
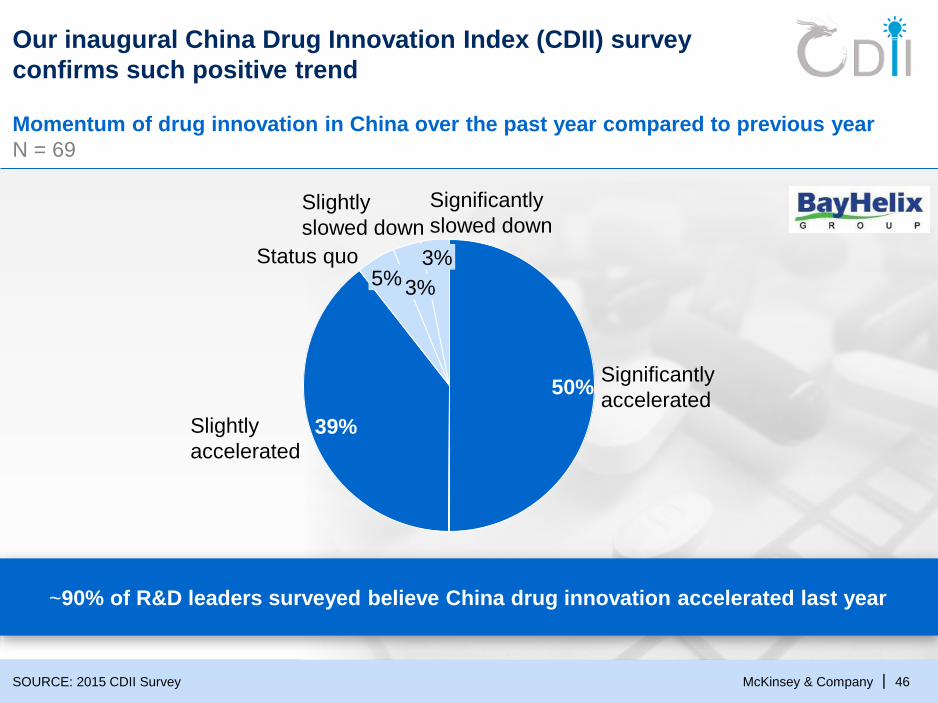
Our inaugural China Drug Innovation Index (CDII) survey
confirms such positive trend
Momentum of drug innovation in China over the past year compared to previous year
N = 69
SOURCE: 2015 CDII Survey
3%
Significantly
slowed down
5%
Slightly
accelerated
Status quo 3%
Slightly
slowed down
Significantly
accelerated
39%
50%
~90% of R&D leaders surveyed believe China drug innovation accelerated last year
McKinsey & Company 47|
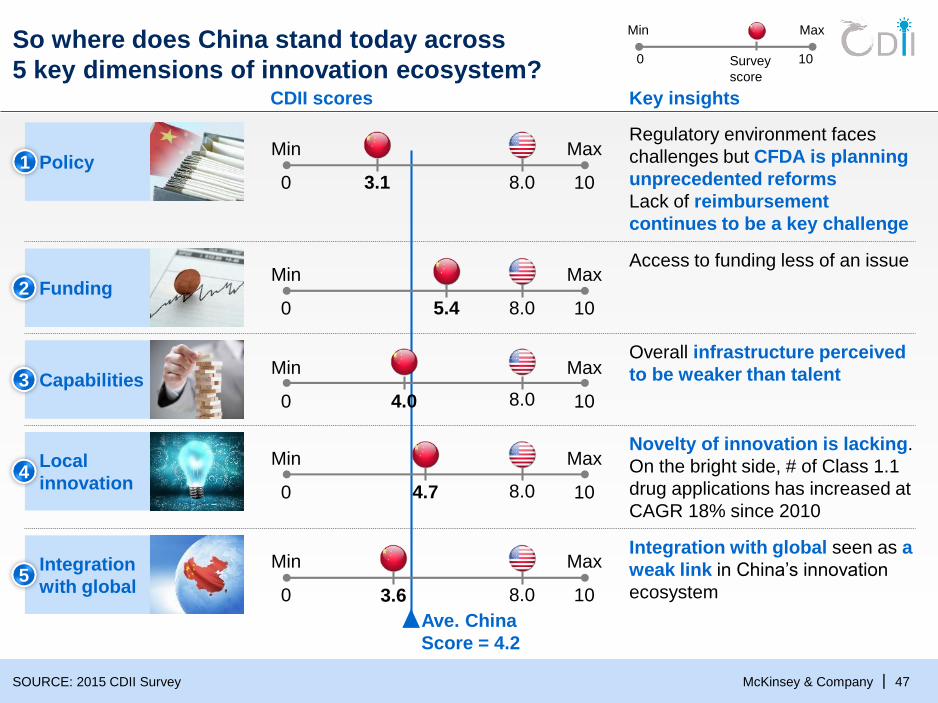
So where does China stand today across
5 key dimensions of innovation ecosystem?
SOURCE: 2015 CDII Survey
Min Max
0 10Survey
score
Ave. China
Score = 4.2
Key insightsCDII scores
Access to funding less of an issue
Novelty of innovation is lacking.
On the bright side, # of Class 1.1
drug applications has increased at
CAGR 18% since 2010
Local
innovation 4
Min
0 4.7
Max
10
Integration with global seen as a
weak link in China’s innovation
ecosystem
Integration
with global5
Min
0 3.6
Max
10
Regulatory environment faces
challenges but CFDA is planning
unprecedented reforms
Lack of reimbursement
continues to be a key challenge
Min
0 3.1
Max
108.0
Overall infrastructure perceived
to be weaker than talentCapabilities 3
Min
0 5.4
Max
108.0
8.0
8.0
Min
0
Max
108.04.0
Funding2
Policy1
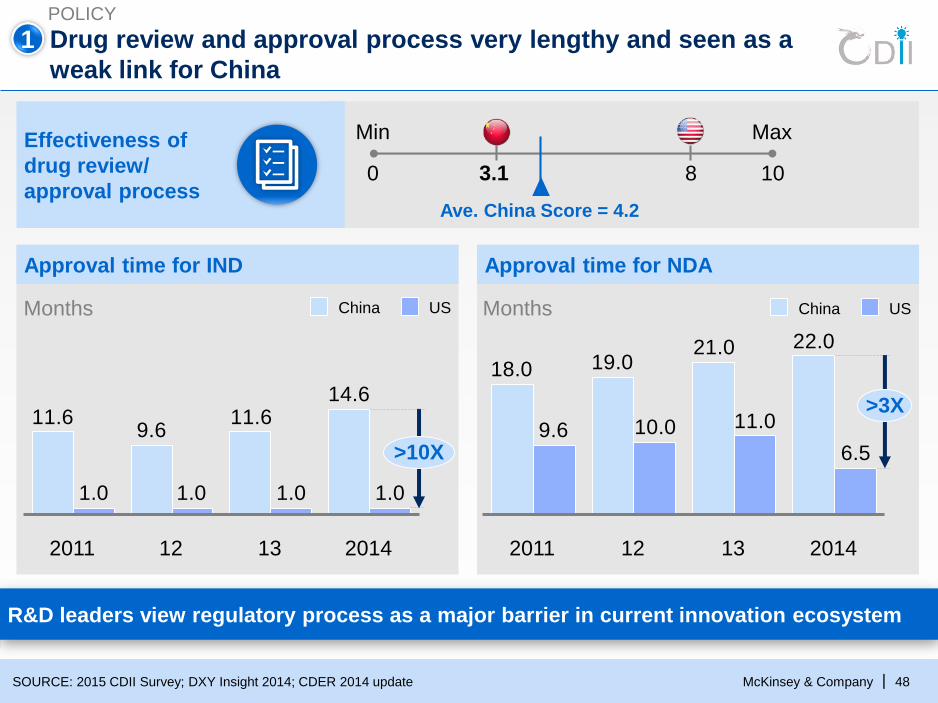
McKinsey & Company 48|
Approval time for IND Approval time for NDA
Drug review and approval process very lengthy and seen as a
weak link for China
14.611.6
9.611.6
1.01.01.01.0
>10X
201413122011
USChina
22.021.019.018.0
6.5
11.010.09.6
>3X
201413122011
USChinaMonths Months
Min Max
0 103.1 8
Ave. China Score = 4.2
Effectiveness of
drug review/
approval process
SOURCE: 2015 CDII Survey; DXY Insight 2014; CDER 2014 update
R&D leaders view regulatory process as a major barrier in current innovation ecosystem
POLICY
1
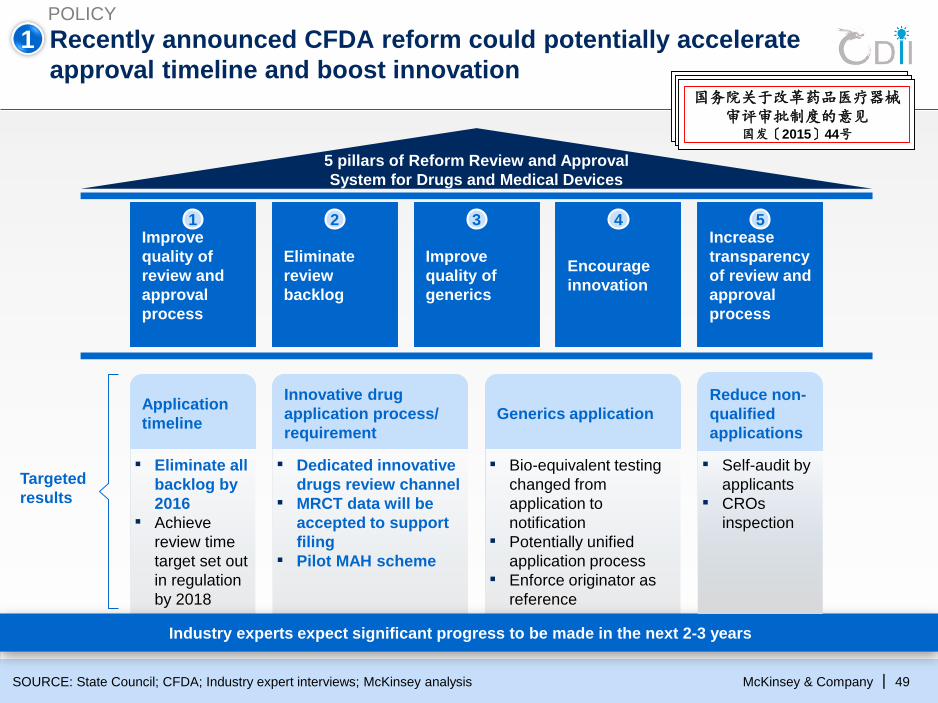
McKinsey & Company 49|
Recently announced CFDA reform could potentially accelerate
approval timeline and boost innovation
SOURCE: State Council; CFDA; Industry expert interviews; McKinsey analysis
Industry experts expect significant progress to be made in the next 2-3 years
Application
timeline
▪ Dedicated innovative
drugs review channel
▪ MRCT data will be
accepted to support
filing
▪ Pilot MAH scheme
▪ Bio-equivalent testing
changed from
application to
notification
▪ Potentially unified
application process
▪ Enforce originator as
reference
Eliminate
review
backlog
Improve
quality of
generics
Encourage
innovation
Improve
quality of
review and
approval
process
Increase
transparency
of review and
approval
process
Reduce non-
qualified
applications
▪ Self-audit by
applicants
▪ CROs
inspection
5 pillars of Reform Review and Approval
System for Drugs and Medical Devices
国务院关于改革药品医疗器械审评审批制度的意见
国发〔2015〕44号
Targeted
results
Generics application
Innovative drug
application process/
requirement
▪ Eliminate all
backlog by
2016
▪ Achieve
review time
target set out
in regulation
by 2018
2 3 41 5
POLICY
1
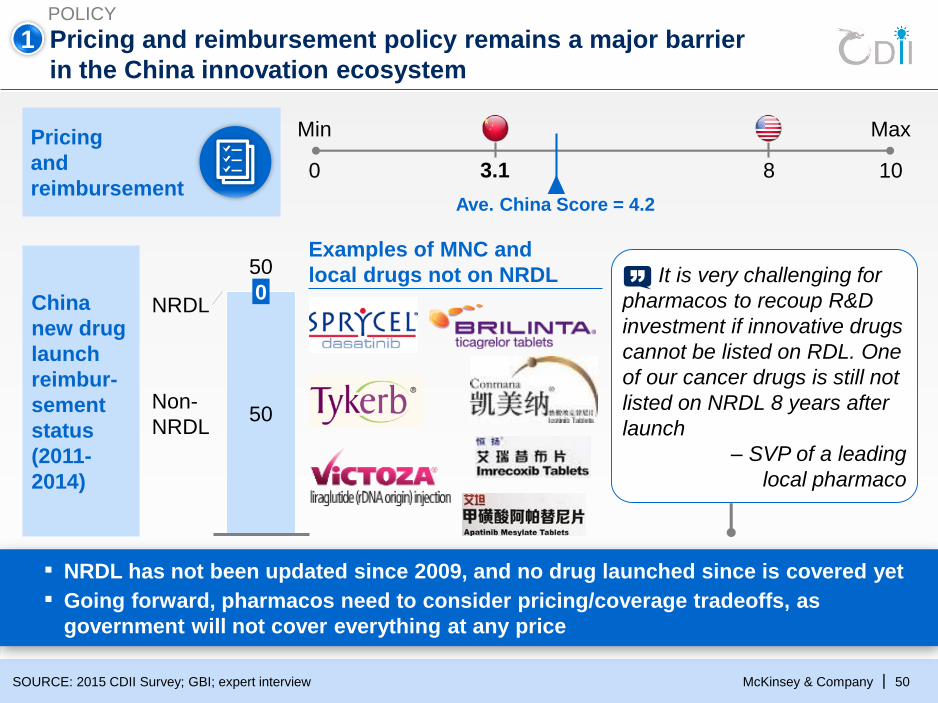
McKinsey & Company 50|
Pricing and reimbursement policy remains a major barrier
in the China innovation ecosystem
Examples of MNC and
local drugs not on NRDL
Non-
NRDL
50
0
50
NRDL
It is very challenging for
pharmacos to recoup R&D
investment if innovative drugs
cannot be listed on RDL. One
of our cancer drugs is still not
listed on NRDL 8 years after
launch
– SVP of a leading
local pharmaco
Min Max
0 103.1 8
Ave. China Score = 4.2
Pricing
and
reimbursement
China
new drug
launch
reimbur-
sement
status
(2011-
2014)
SOURCE: 2015 CDII Survey; GBI; expert interview
▪ NRDL has not been updated since 2009, and no drug launched since is covered yet
▪ Going forward, pharmacos need to consider pricing/coverage tradeoffs, as
government will not cover everything at any price
POLICY
1
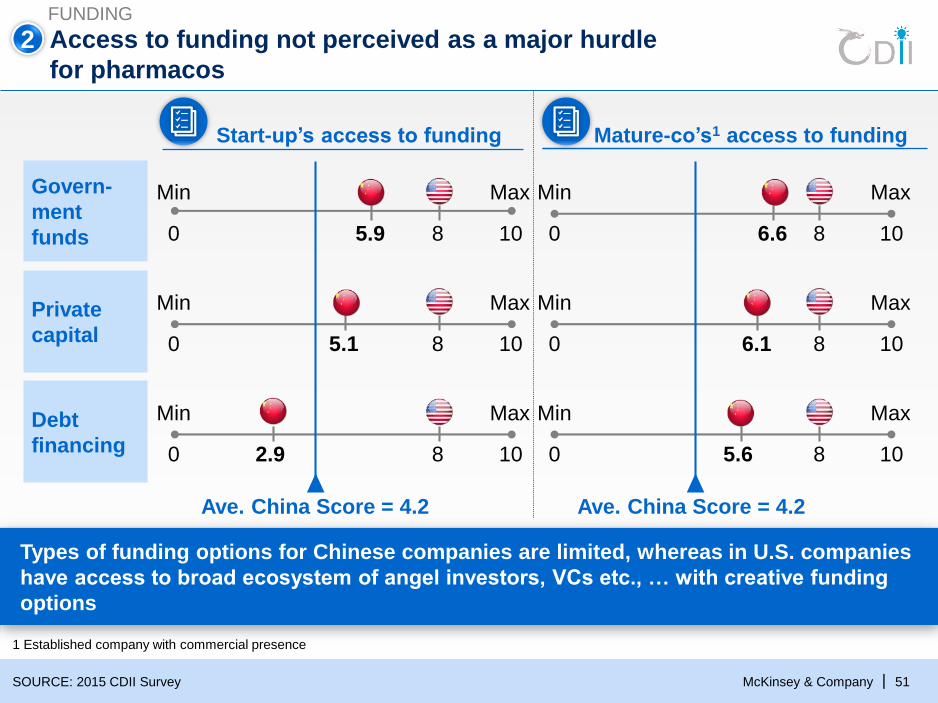
McKinsey & Company 51|
Access to funding not perceived as a major hurdle
for pharmacos
Start-up’s access to funding
Min Max
0 1085.9
Min Max
0 1086.6
Mature-co’s1 access to funding
Private
capital
Min Max
0 1085.1
Min Max
0 1086.1
Govern-
ment
funds
Debt
financing
Min Max
0 1082.9
Min Max
0 1085.6
Ave. China Score = 4.2 Ave. China Score = 4.2
SOURCE: 2015 CDII Survey
1 Established company with commercial presence
Types of funding options for Chinese companies are limited, whereas in U.S. companies
have access to broad ecosystem of angel investors, VCs etc., … with creative funding
options
FUNDING
2
McKinsey & Company 52|
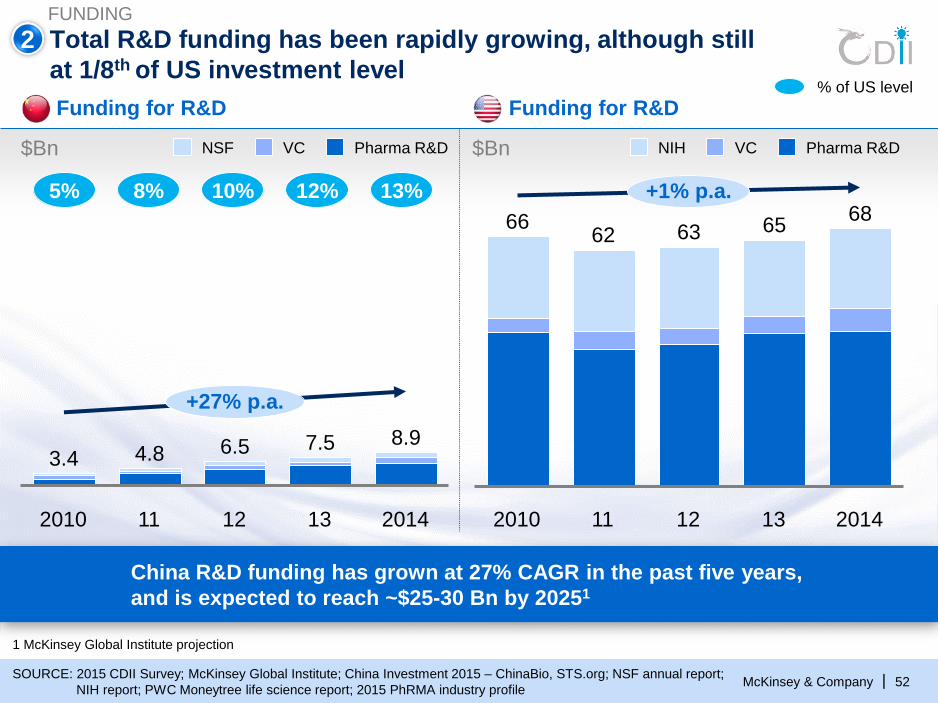
Total R&D funding has been rapidly growing, although still
at 1/8th of US investment level
+27% p.a.
2014
8.9
13
6.5 7.5
2010 11 12
4.83.4
2014
68
13
+1% p.a.
65
12
63
11
62
2010
66
NSF Pharma R&DVC
Funding for R&D
$Bn
Funding for R&D
$Bn VCNIH Pharma R&D
5% 8% 10% 12% 13%
% of US level
1 McKinsey Global Institute projection
SOURCE: 2015 CDII Survey; McKinsey Global Institute; China Investment 2015 – ChinaBio, STS.org; NSF annual report;
NIH report; PWC Moneytree life science report; 2015 PhRMA industry profile
China R&D funding has grown at 27% CAGR in the past five years,
and is expected to reach ~$25-30 Bn by 20251
FUNDING
2

McKinsey & Company 53|SOURCE: Press search
Funding raised by Chinese innovation companies has been growing in
past 12 months; first wave of IPOs also coming up
FUNDING
2
Jan, 2015
Dec, 2014
Dec, 2014
Dec, 2014
Jan, 2015
May, 2015
Oct, 2015
Sep, 2015
Aug, 2015
May, 2015
$100M
$75M
$8M
$10M
$25M
$97M
$100M
$35M
$16M
$45M
Growing fund raising in innovation Recent IPOs from China Pharmacos
Oct, 2015
Jun, 2015
Oct, 2015
McKinsey & Company 54|
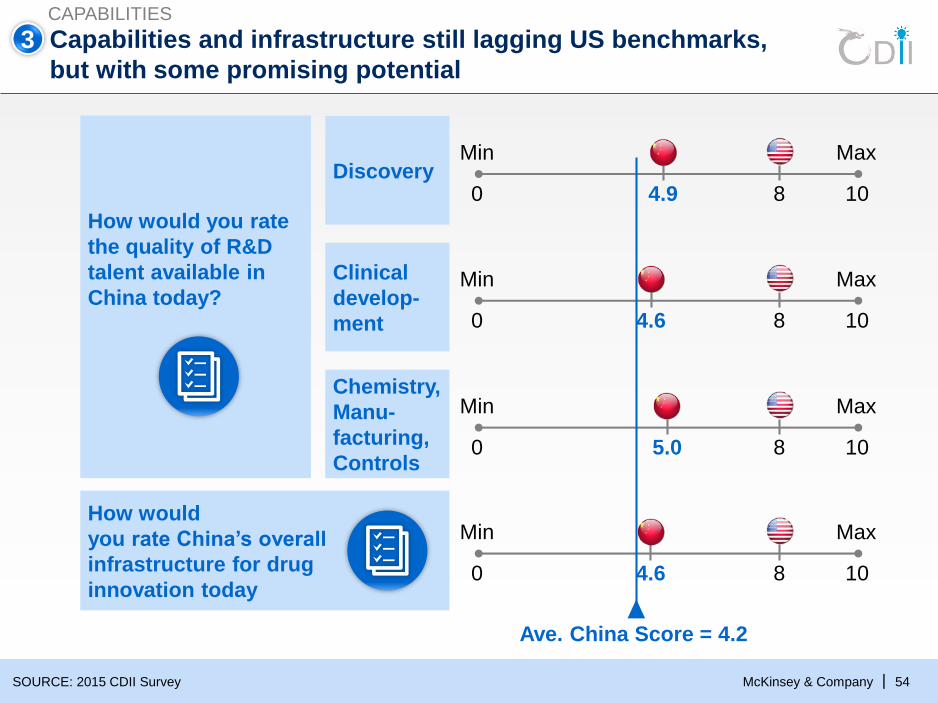
Capabilities and infrastructure still lagging US benchmarks,
but with some promising potential
SOURCE: 2015 CDII Survey
Discovery
Clinical
develop-
ment
How would
you rate China’s overall
infrastructure for drug
innovation today
Chemistry,
Manu-
facturing,
Controls
How would you rate
the quality of R&D
talent available in
China today?
Min Max
0 1084.9
Min Max
0 1084.6
Min Max
0 1085.0
Min Max
0 108
Ave. China Score = 4.2
CAPABILITIES
4.6
3
McKinsey & Company 55|
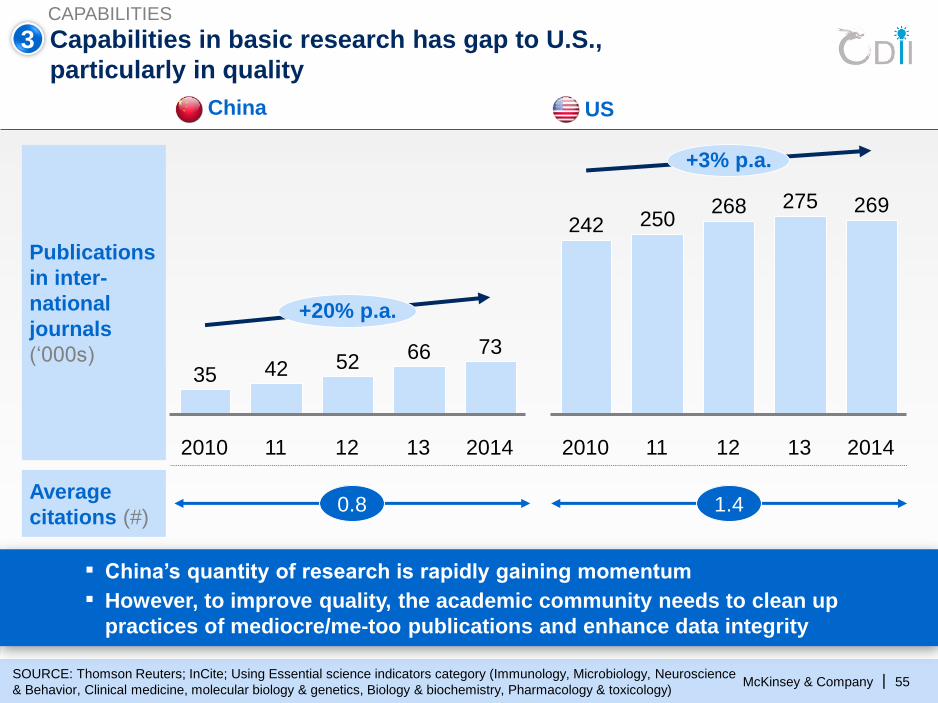
Capabilities in basic research has gap to U.S.,
particularly in quality
Publications
in inter-
national
journals
(‘000s)
+20% p.a.
2014
73
13
66
12
52
11
42
2010
35
269
+3% p.a.
201413
275
12
268
11
250
2010
242
Average
citations (#)
SOURCE: Thomson Reuters; InCite; Using Essential science indicators category (Immunology, Microbiology, Neuroscience
& Behavior, Clinical medicine, molecular biology & genetics, Biology & biochemistry, Pharmacology & toxicology)
0.8 1.4
▪ China’s quantity of research is rapidly gaining momentum
▪ However, to improve quality, the academic community needs to clean up
practices of mediocre/me-too publications and enhance data integrity
CAPABILITIES
3
China US
McKinsey & Company 56|SOURCE: Company website; annual report; news release; expert interviews
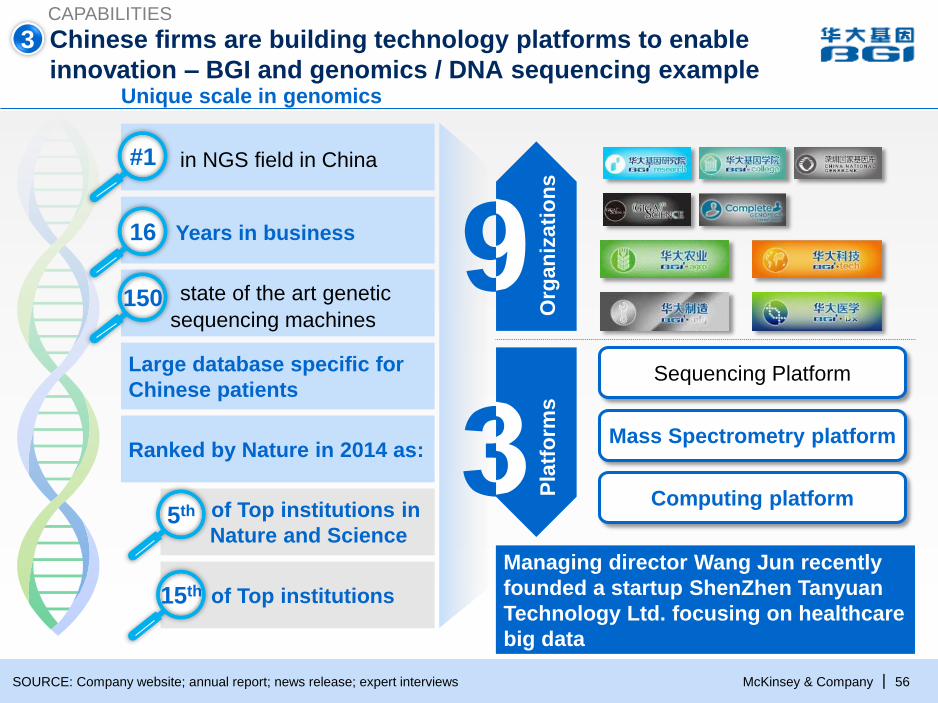
Chinese firms are building technology platforms to enable
innovation – BGI and genomics / DNA sequencing example
CAPABILITIES
Unique scale in genomics
#1 in NGS field in China
16 Years in business
15 state of the art genetic
sequencing machines
Large database specific for
Chinese patients
#1
16
150
Ranked by Nature in 2014 as:
5th of Top institutions in
Nature and Science
15th of Top institutions
5th
15th
Sequencing Platform
Mass Spectrometry platform
Computing platform3
9
Org
an
izati
on
sP
latf
orm
s
3
Managing director Wang Jun recently
founded a startup ShenZhen Tanyuan
Technology Ltd. focusing on healthcare
big data
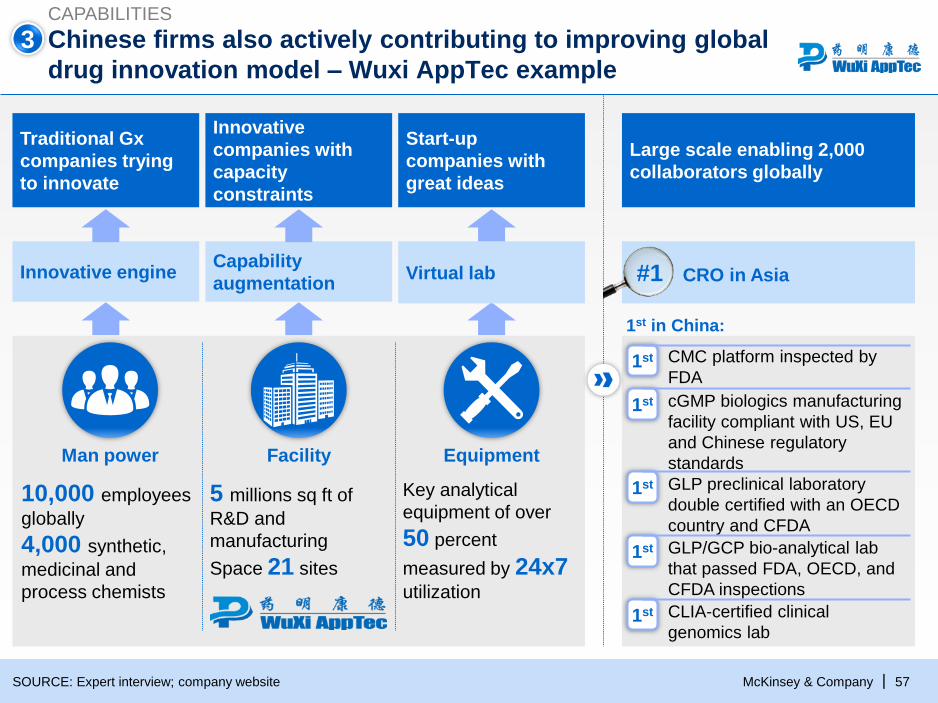
McKinsey & Company 57|
Chinese firms also actively contributing to improving global
drug innovation model – Wuxi AppTec example
SOURCE: Expert interview; company website
CAPABILITIES
Large scale enabling 2,000
collaborators globally
Start-up
companies with
great ideas
Equipment
Key analytical
equipment of over
50 percent
measured by 24x7utilization
Innovative
companies with
capacity
constraints
Capability
augmentation
Facility
5 millions sq ft of
R&D and
manufacturing
Space 21 sites
Traditional Gx
companies trying
to innovate
Virtual labInnovative engine
Man power
10,000 employees
globally
4,000 synthetic,
medicinal and
process chemists
#1 CRO in Asia
CMC platform inspected by
FDA1st
cGMP biologics manufacturing
facility compliant with US, EU
and Chinese regulatory
standards
1st
GLP preclinical laboratory
double certified with an OECD
country and CFDA
1st
GLP/GCP bio-analytical lab
that passed FDA, OECD, and
CFDA inspections
1st
CLIA-certified clinical
genomics lab 1st
#1
3
1st in China:
McKinsey & Company 58|
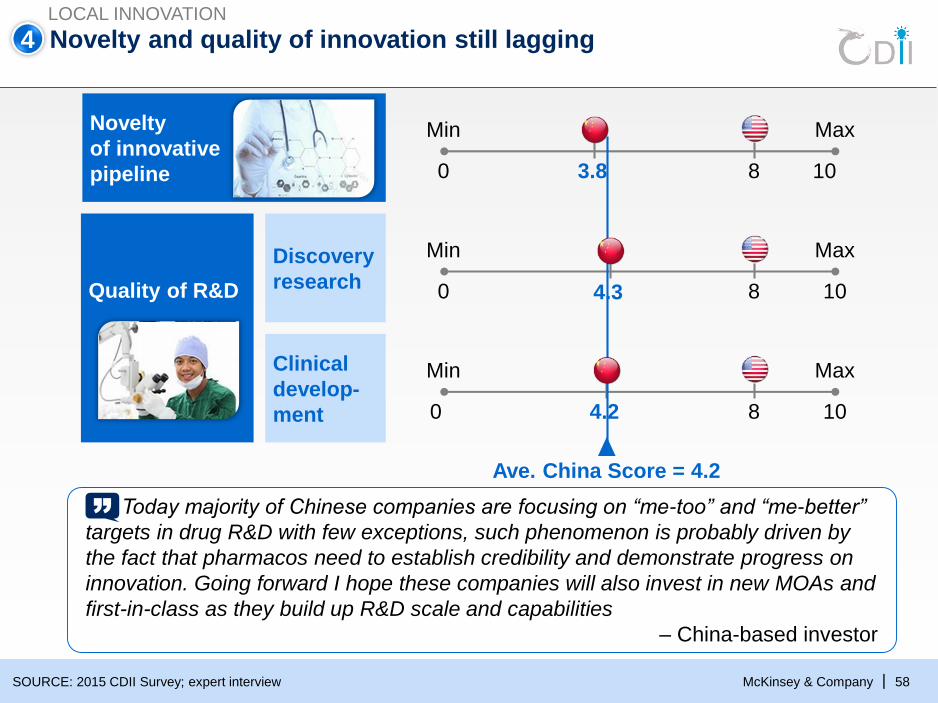
4 Novelty and quality of innovation still lagging
SOURCE: 2015 CDII Survey; expert interview
LOCAL INNOVATION
Min Max
0 1083.8
Min Max
0 108
Min Max
0 1084.2
Ave. China Score = 4.2
4.3Quality of R&D
Novelty
of innovative
pipeline
Discovery
research
Clinical
develop-
ment
Today majority of Chinese companies are focusing on “me-too” and “me-better”
targets in drug R&D with few exceptions, such phenomenon is probably driven by
the fact that pharmacos need to establish credibility and demonstrate progress on
innovation. Going forward I hope these companies will also invest in new MOAs and
first-in-class as they build up R&D scale and capabilities
– China-based investor
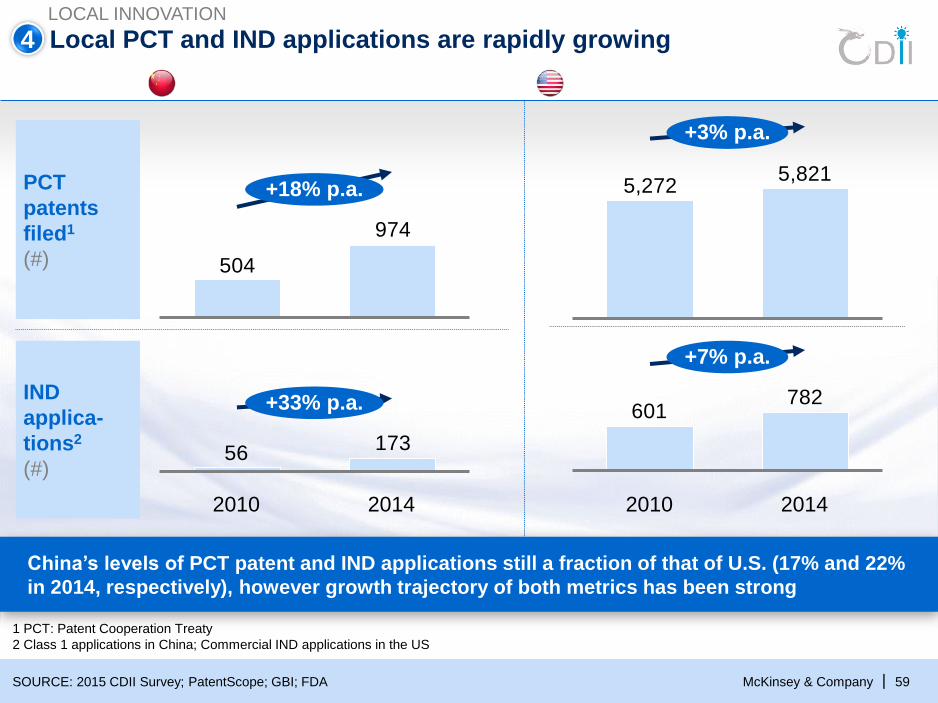
McKinsey & Company 59|
Local PCT and IND applications are rapidly growing
PCT
patents
filed1
(#)
1 PCT: Patent Cooperation Treaty
2 Class 1 applications in China; Commercial IND applications in the US
SOURCE: 2015 CDII Survey; PatentScope; GBI; FDA
IND
applica-
tions2
(#)
China’s levels of PCT patent and IND applications still a fraction of that of U.S. (17% and 22%
in 2014, respectively), however growth trajectory of both metrics has been strong
LOCAL INNOVATION
974
504
+18% p.a.
17356
+33% p.a.
20142010
5,8215,272
+3% p.a.
782601
+7% p.a.
2010 2014
4
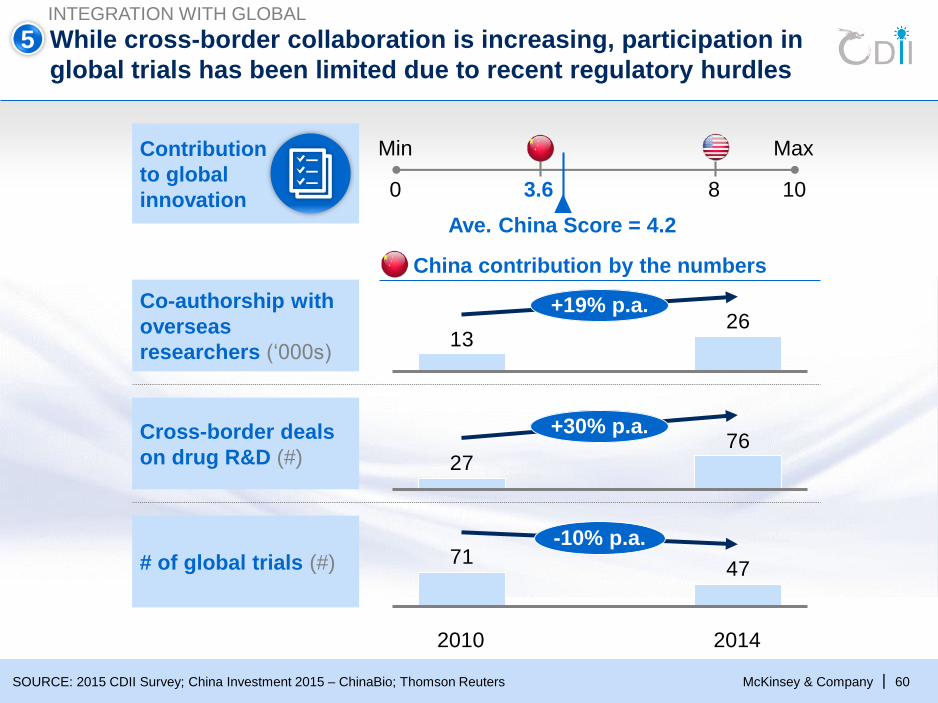
McKinsey & Company 60|
While cross-border collaboration is increasing, participation in
global trials has been limited due to recent regulatory hurdles
SOURCE: 2015 CDII Survey; China Investment 2015 – ChinaBio; Thomson Reuters
# of global trials (#)
Cross-border deals
on drug R&D (#)
Min Max
0 103.6 8
Ave. China Score = 4.2
Contribution
to global
innovation
Co-authorship with
overseas
researchers (‘000s)
China contribution by the numbers
INTEGRATION WITH GLOBAL
5
4771
2014
-10% p.a.
2010
2613
+19% p.a.
7627
+30% p.a.
McKinsey & Company 61|
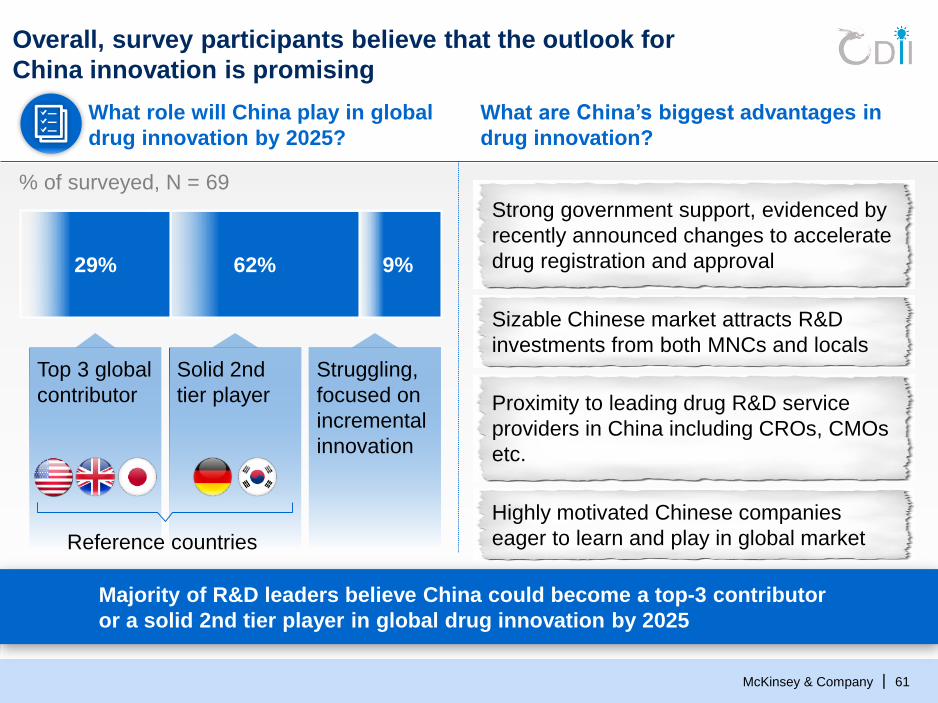
Overall, survey participants believe that the outlook for
China innovation is promising
What role will China play in global
drug innovation by 2025?
% of surveyed, N = 69
Majority of R&D leaders believe China could become a top-3 contributor
or a solid 2nd tier player in global drug innovation by 2025
9%62%29%
Top 3 global
contributor
Solid 2nd
tier player
Struggling,
focused on
incremental
innovation
What are China’s biggest advantages in
drug innovation?
Strong government support, evidenced by
recently announced changes to accelerate
drug registration and approval
Sizable Chinese market attracts R&D
investments from both MNCs and locals
Proximity to leading drug R&D service
providers in China including CROs, CMOs
etc.
Highly motivated Chinese companies
eager to learn and play in global marketReference countries
McKinsey & Company 62|
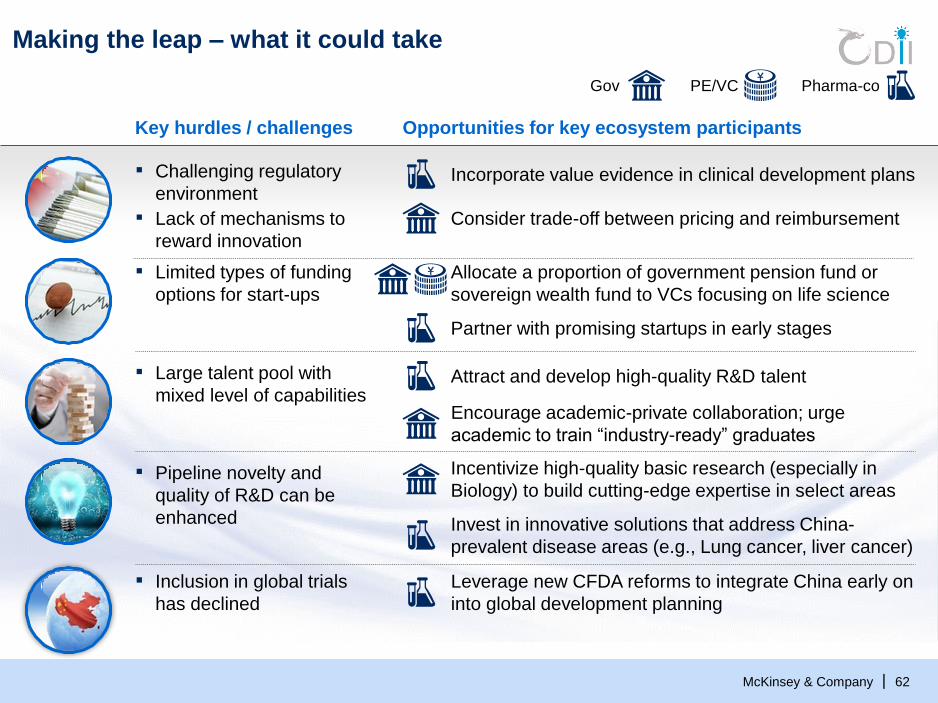
¥
Opportunities for key ecosystem participants Key hurdles / challenges
Making the leap – what it could take
Pharma-coGov PE/VC
▪ Challenging regulatory
environment
▪ Lack of mechanisms to
reward innovation
Consider trade-off between pricing and reimbursement
Incorporate value evidence in clinical development plans
▪ Limited types of funding
options for start-ups
Allocate a proportion of government pension fund or
sovereign wealth fund to VCs focusing on life science
Partner with promising startups in early stages
▪ Large talent pool with
mixed level of capabilitiesEncourage academic-private collaboration; urge
academic to train “industry-ready” graduates
Attract and develop high-quality R&D talent
▪ Pipeline novelty and
quality of R&D can be
enhanced Invest in innovative solutions that address China-
prevalent disease areas (e.g., Lung cancer, liver cancer)
▪ Inclusion in global trials
has declined
Leverage new CFDA reforms to integrate China early on
into global development planning
Incentivize high-quality basic research (especially in
Biology) to build cutting-edge expertise in select areas
¥
McKinsey & Company 63|
Finding the funds for innovation
McKinsey & Company 64|
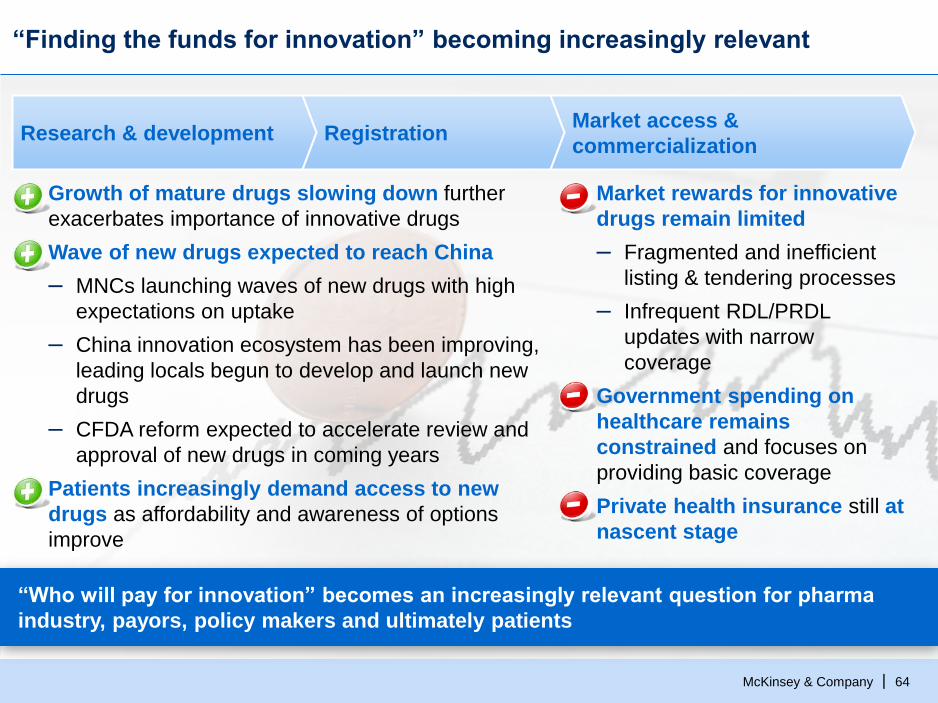
“Finding the funds for innovation” becoming increasingly relevant
“Who will pay for innovation” becomes an increasingly relevant question for pharma
industry, payors, policy makers and ultimately patients
Research & development Registration Market access &
commercialization
▪ Growth of mature drugs slowing down further
exacerbates importance of innovative drugs
▪ Wave of new drugs expected to reach China
– MNCs launching waves of new drugs with high
expectations on uptake
– China innovation ecosystem has been improving,
leading locals begun to develop and launch new
drugs
– CFDA reform expected to accelerate review and
approval of new drugs in coming years
▪ Patients increasingly demand access to new
drugs as affordability and awareness of options
improve
▪ Market rewards for innovative
drugs remain limited
– Fragmented and inefficient
listing & tendering processes
– Infrequent RDL/PRDL
updates with narrow
coverage
▪ Government spending on
healthcare remains
constrained and focuses on
providing basic coverage
▪ Private health insurance still at
nascent stage
McKinsey & Company 65|
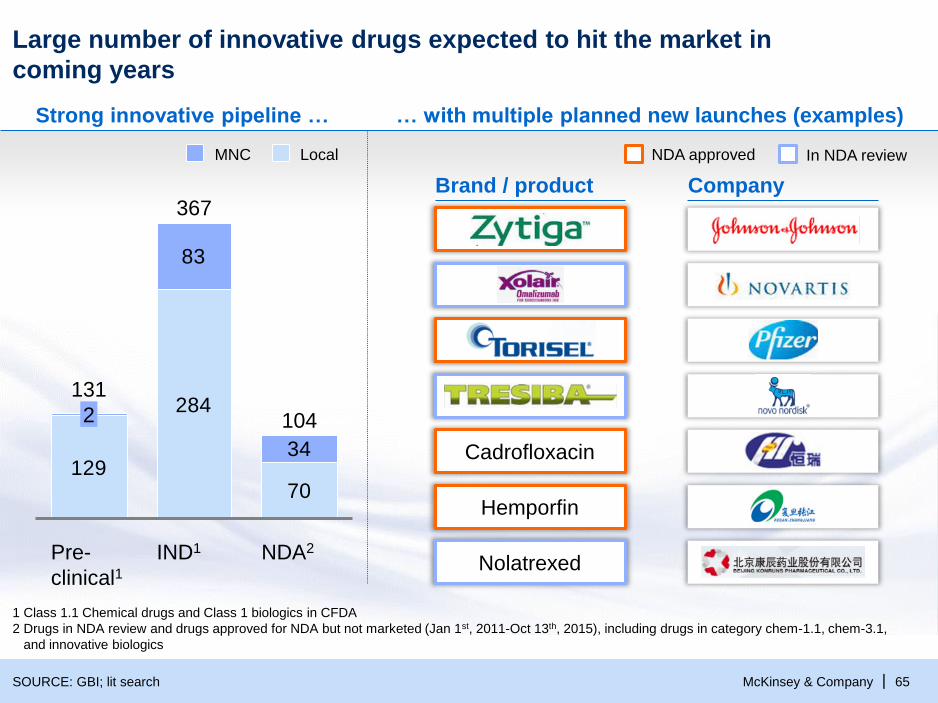
Large number of innovative drugs expected to hit the market in
coming years
SOURCE: GBI; lit search
Strong innovative pipeline …
129
284
70
83
34
IND1
367
NDA2
104
131
Pre-
clinical1
2
1 Class 1.1 Chemical drugs and Class 1 biologics in CFDA
2 Drugs in NDA review and drugs approved for NDA but not marketed (Jan 1st, 2011-Oct 13th, 2015), including drugs in category chem-1.1, chem-3.1,
and innovative biologics
… with multiple planned new launches (examples)
Cadrofloxacin
Hemporfin
Nolatrexed
LocalMNC
Brand / product Company
NDA approved In NDA review
McKinsey & Company 66|
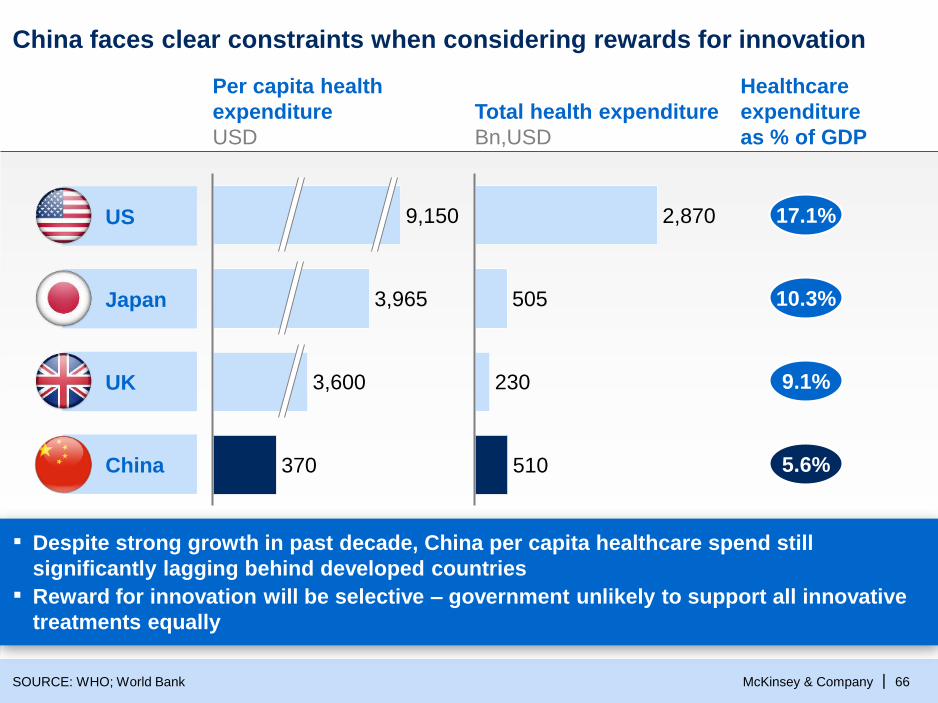
China faces clear constraints when considering rewards for innovation
SOURCE: WHO; World Bank
Per capita health
expenditure
USD
US
Japan
UK
China
3,965
9,150
3,600
370
Total health expenditure
Bn,USD
230
2,870
510
505
▪ Despite strong growth in past decade, China per capita healthcare spend still
significantly lagging behind developed countries
▪ Reward for innovation will be selective – government unlikely to support all innovative
treatments equally
17.1%
10.3%
9.1%
5.6%
Healthcare
expenditure
as % of GDP
McKinsey & Company 67|
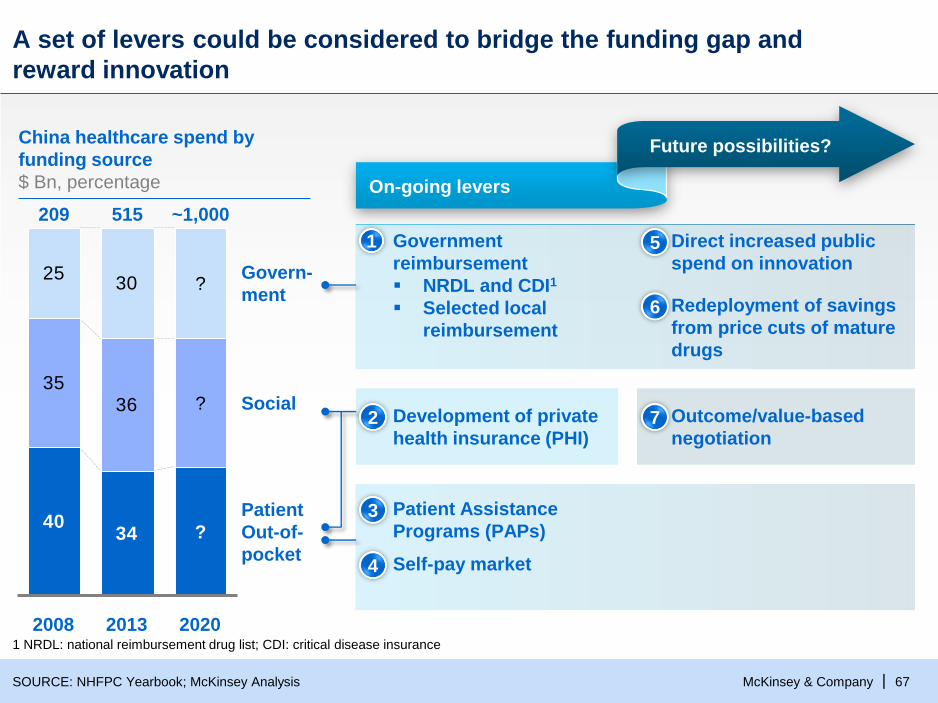
A set of levers could be considered to bridge the funding gap and
reward innovation
SOURCE: NHFPC Yearbook; McKinsey Analysis
China healthcare spend by
funding source
$ Bn, percentage
4034
3536
2530
515209
2008
Social
Patient
Out-of-
Govern-
ment
2013 2020
?
~1,000
?
?
On-going levers
Future possibilities?
Direct increased public
spend on innovation 5
Redeployment of savings
from price cuts of mature
drugs
6
Government
reimbursement
NRDL and CDI1
Selected local
reimbursement
4 Self-pay market
3 Patient Assistance
Programs (PAPs)
Outcome/value-based
negotiation7Development of private
health insurance (PHI)2
1 NRDL: national reimbursement drug list; CDI: critical disease insurance
1
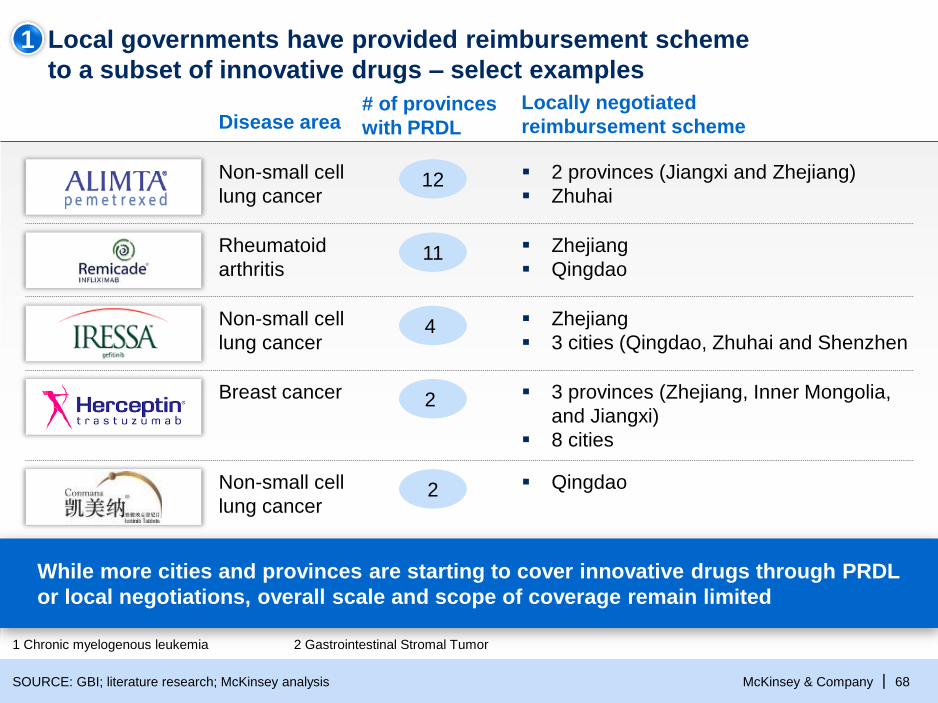
McKinsey & Company 68|
Local governments have provided reimbursement scheme
to a subset of innovative drugs – select examples
1
SOURCE: GBI; literature research; McKinsey analysis
1 Chronic myelogenous leukemia 2 Gastrointestinal Stromal Tumor
# of provinces
with PRDLDisease areaLocally negotiated
reimbursement scheme
2Non-small cell
lung cancer
Qingdao
4 Non-small cell
lung cancer
Zhejiang
3 cities (Qingdao, Zhuhai and Shenzhen
2 Breast cancer 3 provinces (Zhejiang, Inner Mongolia,
and Jiangxi)
8 cities
11Rheumatoid
arthritis
Zhejiang
Qingdao
12Non-small cell
lung cancer
2 provinces (Jiangxi and Zhejiang)
Zhuhai
While more cities and provinces are starting to cover innovative drugs through PRDL
or local negotiations, overall scale and scope of coverage remain limited
McKinsey & Company 69|
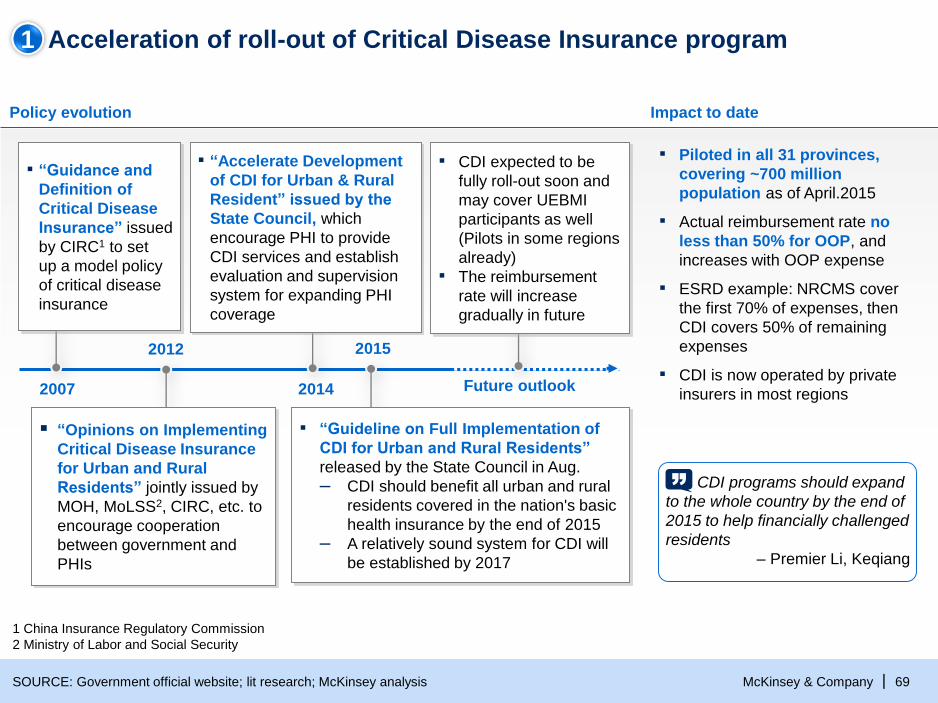
Acceleration of roll-out of Critical Disease Insurance program
SOURCE: Government official website; lit research; McKinsey analysis
Policy evolution Impact to date
2007
2012
2014
▪ Piloted in all 31 provinces,
covering ~700 million
population as of April.2015
▪ Actual reimbursement rate no
less than 50% for OOP, and
increases with OOP expense
▪ ESRD example: NRCMS cover
the first 70% of expenses, then
CDI covers 50% of remaining
expenses
▪ CDI is now operated by private
insurers in most regions
▪ “Guidance and
Definition of
Critical Disease
Insurance” issued
by CIRC1 to set
up a model policy
of critical disease
insurance
“Opinions on Implementing
Critical Disease Insurance
for Urban and Rural
Residents” jointly issued by
MOH, MoLSS2, CIRC, etc. to
encourage cooperation
between government and
PHIs
▪ “Accelerate Development
of CDI for Urban & Rural
Resident” issued by the
State Council, which
encourage PHI to provide
CDI services and establish
evaluation and supervision
system for expanding PHI
coverage
▪ “Guideline on Full Implementation of
CDI for Urban and Rural Residents”
released by the State Council in Aug.
– CDI should benefit all urban and rural
residents covered in the nation's basic
health insurance by the end of 2015
– A relatively sound system for CDI will
be established by 2017
▪ CDI expected to be
fully roll-out soon and
may cover UEBMI
participants as well
(Pilots in some regions
already)
▪ The reimbursement
rate will increase
gradually in future
Future outlook
2015
1 China Insurance Regulatory Commission
2 Ministry of Labor and Social Security
CDI programs should expand
to the whole country by the end of
2015 to help financially challenged
residents
– Premier Li, Keqiang
1
McKinsey & Company 70|
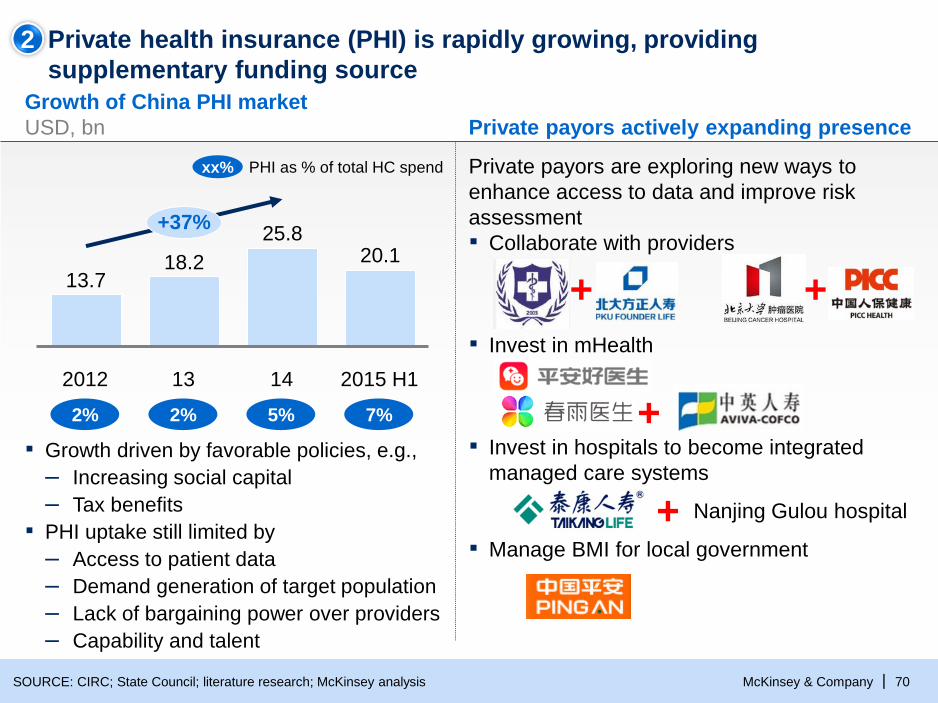
Growth of China PHI market
USD, bn
Private health insurance (PHI) is rapidly growing, providing
supplementary funding source
SOURCE: CIRC; State Council; literature research; McKinsey analysis
13
18.213.7
2012
20.1
2015 H114
25.8+37%
Private payors actively expanding presence
Private payors are exploring new ways to
enhance access to data and improve risk
assessment
▪ Collaborate with providers
▪ Invest in mHealth
▪ Invest in hospitals to become integrated
managed care systems
▪ Manage BMI for local government
▪ Growth driven by favorable policies, e.g.,
– Increasing social capital
– Tax benefits
▪ PHI uptake still limited by
– Access to patient data
– Demand generation of target population
– Lack of bargaining power over providers
– Capability and talent
+
++
+
2% 2% 5% 7%
xx% PHI as % of total HC spend
2
Nanjing Gulou hospital
McKinsey & Company 71|SOURCE: China Charity Federation; literature search; McKinsey analysis
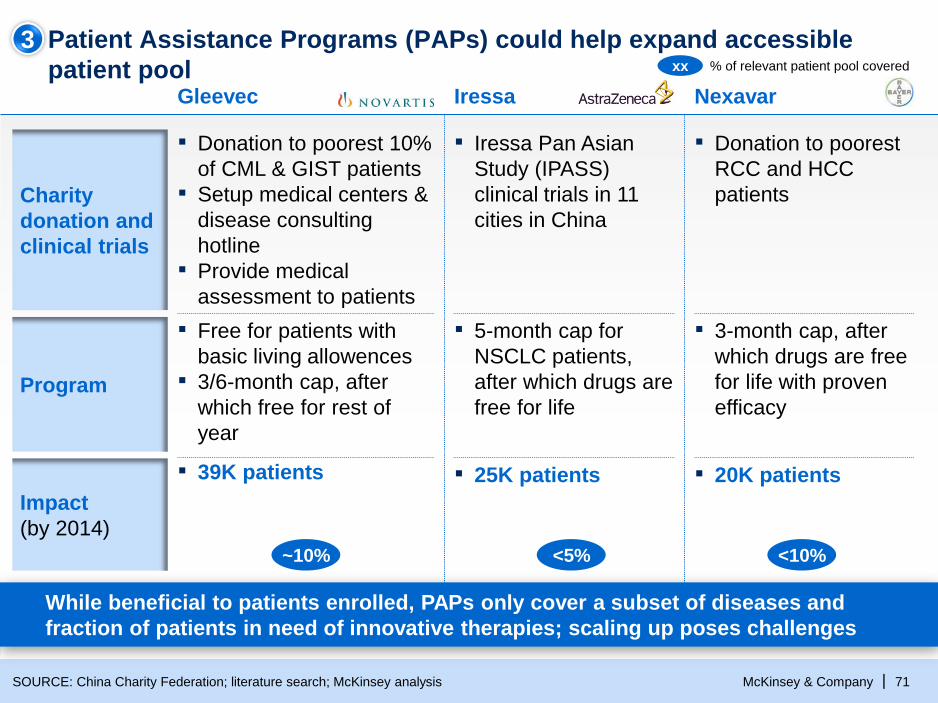
Patient Assistance Programs (PAPs) could help expand accessible
patient poolNexavarGleevec Iressa
▪ Donation to poorest
RCC and HCC
patients
▪ Donation to poorest 10%
of CML & GIST patients
▪ Setup medical centers &
disease consulting
hotline
▪ Provide medical
assessment to patients
▪ Iressa Pan Asian
Study (IPASS)
clinical trials in 11
cities in ChinaCharity
donation and
clinical trials
▪ 3-month cap, after
which drugs are free
for life with proven
efficacy
▪ Free for patients with
basic living allowences
▪ 3/6-month cap, after
which free for rest of
year
▪ 5-month cap for
NSCLC patients,
after which drugs are
free for lifeProgram
3% of relevant patient pool covered xx
▪ 20K patients▪ 25K patients
Impact
(by 2014)
▪ 39K patients
~10% <5% <10%
While beneficial to patients enrolled, PAPs only cover a subset of diseases and
fraction of patients in need of innovative therapies; scaling up poses challenges
McKinsey & Company 72|
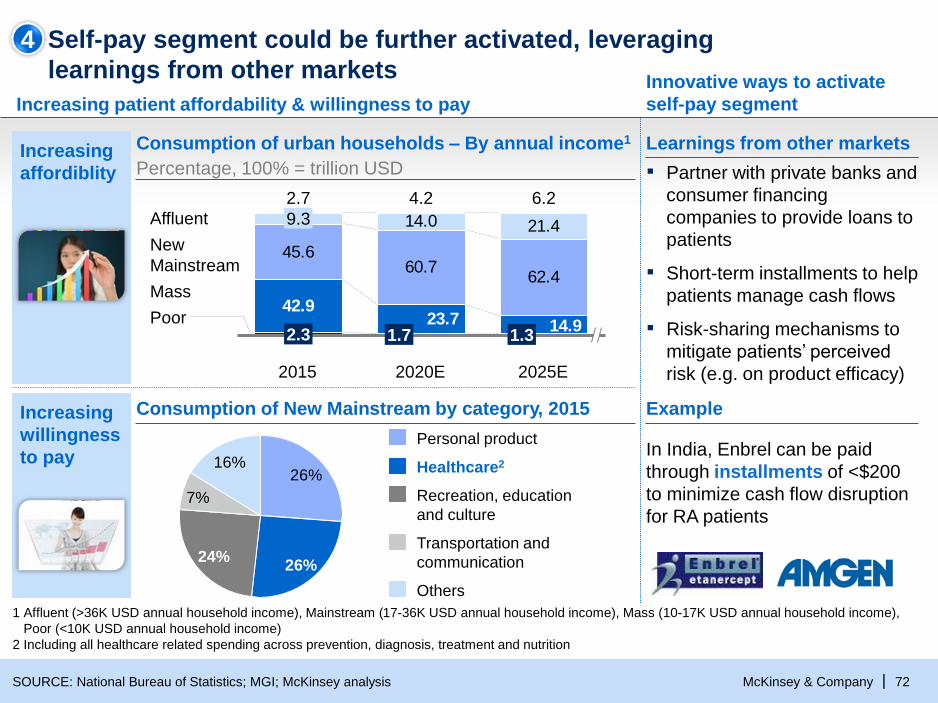
Self-pay segment could be further activated, leveraging
learnings from other markets
Increasing
willingness
to pay
Increasing patient affordability & willingness to pay
Innovative ways to activate
self-pay segment
SOURCE: National Bureau of Statistics; MGI; McKinsey analysis
1 Affluent (>36K USD annual household income), Mainstream (17-36K USD annual household income), Mass (10-17K USD annual household income),
Poor (<10K USD annual household income)
2 Including all healthcare related spending across prevention, diagnosis, treatment and nutrition
Example
Learnings from other markets
▪ Partner with private banks and
consumer financing
companies to provide loans to
patients
▪ Short-term installments to help
patients manage cash flows
▪ Risk-sharing mechanisms to
mitigate patients’ perceived
risk (e.g. on product efficacy)
24%
7%
26%
16%26%
Healthcare2
Transportation and
communication
Recreation, education
and culture
Others
Personal product
Consumption of New Mainstream by category, 2015
42.9
45.660.7
62.4
14.0 21.4
14.923.7
9.3
Poor
Affluent
New
Mainstream
Mass
2025E
6.2
1.3
2020E
4.2
1.7
2015
2.7
2.3
Increasing
affordiblity
Consumption of urban households – By annual income1
Percentage, 100% = trillion USD
In India, Enbrel can be paid
through installments of <$200
to minimize cash flow disruption
for RA patients
4
McKinsey & Company 73|
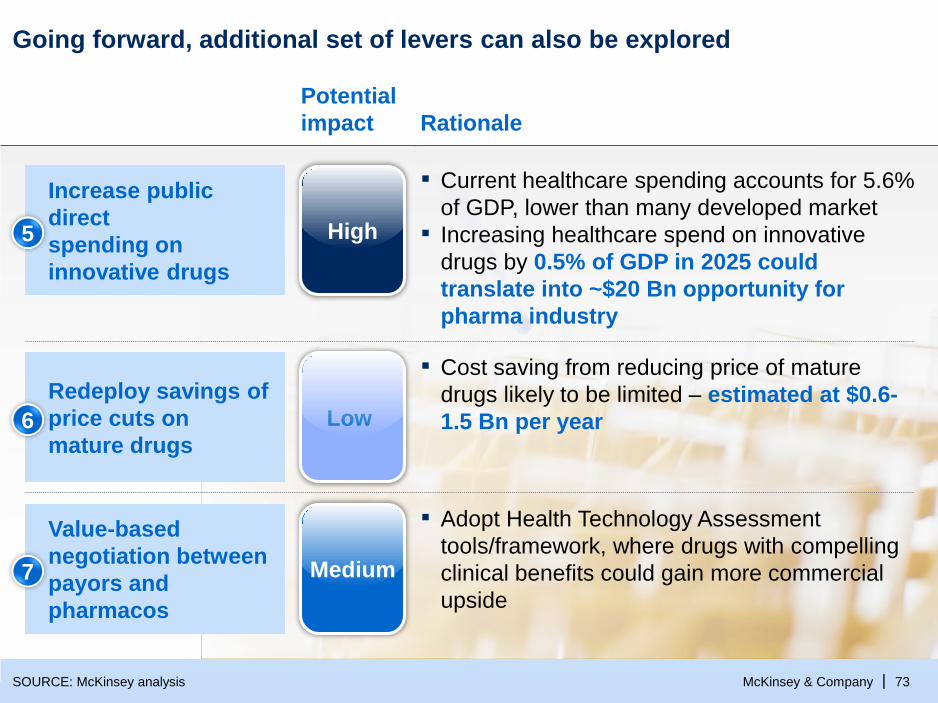
Going forward, additional set of levers can also be explored
SOURCE: McKinsey analysis
Rationale
Potential
impact
▪ Current healthcare spending accounts for 5.6%
of GDP, lower than many developed market
▪ Increasing healthcare spend on innovative
drugs by 0.5% of GDP in 2025 could
translate into ~$20 Bn opportunity for
pharma industry
Increase public
direct
spending on
innovative drugs
5 High
▪ Cost saving from reducing price of mature
drugs likely to be limited – estimated at $0.6-
1.5 Bn per year
Redeploy savings of
price cuts on
mature drugs6 Low
▪ Adopt Health Technology Assessment
tools/framework, where drugs with compelling
clinical benefits could gain more commercial
upside
Value-based
negotiation between
payors and
pharmacos
7 Medium
McKinsey & Company 74|
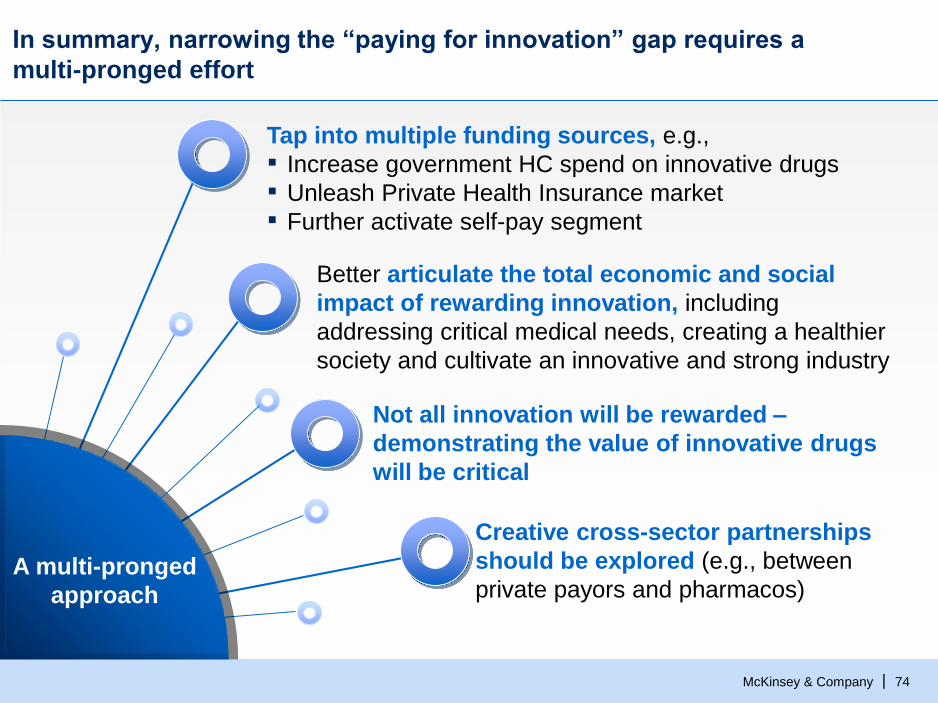
A multi-pronged
approach
In summary, narrowing the “paying for innovation” gap requires a
multi-pronged effort
Better articulate the total economic and social
impact of rewarding innovation, including
addressing critical medical needs, creating a healthier
society and cultivate an innovative and strong industry
Tap into multiple funding sources, e.g.,
▪ Increase government HC spend on innovative drugs
▪ Unleash Private Health Insurance market
▪ Further activate self-pay segment
Not all innovation will be rewarded –
demonstrating the value of innovative drugs
will be critical
Creative cross-sector partnerships
should be explored (e.g., between
private payors and pharmacos)
McKinsey & Company 75|
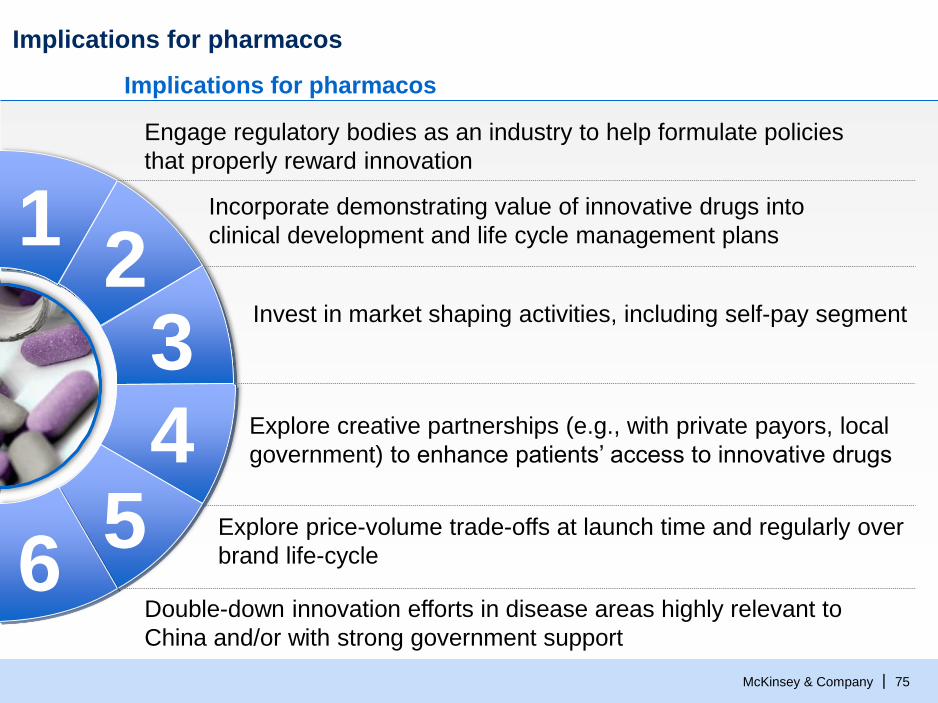
Implications for pharmacos
Implications for pharmacos
Engage regulatory bodies as an industry to help formulate policies
that properly reward innovation
Invest in market shaping activities, including self-pay segment
Incorporate demonstrating value of innovative drugs into
clinical development and life cycle management plans
Explore creative partnerships (e.g., with private payors, local
government) to enhance patients’ access to innovative drugs
Double-down innovation efforts in disease areas highly relevant to
China and/or with strong government support
12
34
56
Explore price-volume trade-offs at launch time and regularly over
brand life-cycle
McKinsey & Company 76|
Closing thoughts
We are on a narrow bridge to innovation, with still
a high degree of uncertainty on outlook1
2The going gets tougher; however there are
still tremendous opportunities to capture
3The time to drive real change in business and
operating models is now
McKinsey & Company 77|
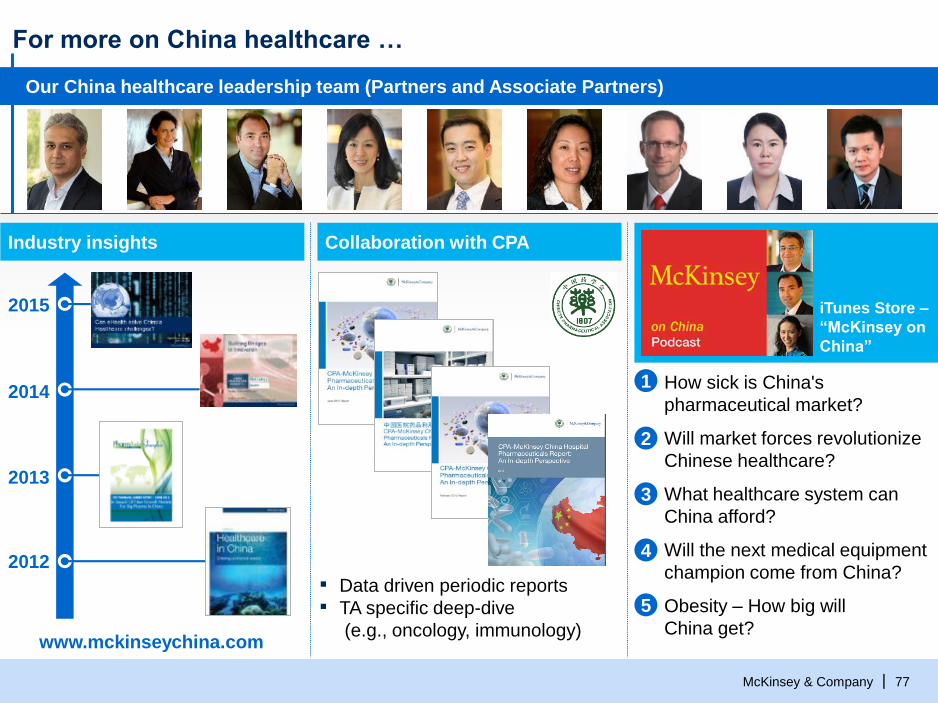
For more on China healthcare …
Our China healthcare leadership team (Partners and Associate Partners)
Industry insights Collaboration with CPA
▪ Data driven periodic reports
▪ TA specific deep-dive
(e.g., oncology, immunology)
iTunes Store –
“McKinsey on
China”
▪ How sick is China's
pharmaceutical market?
▪ Will market forces revolutionize
Chinese healthcare?
▪ What healthcare system can
China afford?
▪ Will the next medical equipment
champion come from China?
▪ Obesity – How big will
China get?www.mckinseychina.com
2014
2013
2012
2015
1
2
3
4
5