China - Peoples Republic of Fresh Deciduous Fruit Annual U ... · Post estimates the grape planted...
15
1 THIS REPORT CONTAINS ASSESSMENTS OF COMMODITY AND TRADE ISSUES MADE BY USDA STAFF AND NOT NECESSARILY STATEMENTS OF OFFICIAL U.S. GOVERNMENT POLICY Date: GAIN Report Number: Approved By: Prepared By: Report Highlights: Chinese demand for high quality fruit remains strong and imports of apples and pears are expected to increased in MY 2018/19. Demand for imported table grapes is also strong, but imports will decrease due to a constrained supply. As long as additional Chinese tariffs are in place on U.S.-origin products, U.S. apples, pears, and table grapes are expected to lose market share. Extreme weather this spring across northern China will result in a sharp fall of the country’s apple, pear, and table grape production in MY 2018/19. Apple production is forecast to fall 25 percent to 31 million metric tons (MMT), pears 20 percent to 13 MMT, and table grapes 10 percent to 945,000 metric tons. Abraham Inouye Michael Ward U.S.-origin Deciduous Fruit Likely to Lose Market Share in China Due to Additional Tariffs Fresh Deciduous Fruit Annual China - Peoples Republic of CH18074 11/01/2018 Required Report - public distribution
Transcript of China - Peoples Republic of Fresh Deciduous Fruit Annual U ... · Post estimates the grape planted...

1
THIS REPORT CONTAINS ASSESSMENTS OF COMMODITY AND TRADE ISSUES MADE BY
USDA STAFF AND NOT NECESSARILY STATEMENTS OF OFFICIAL U.S. GOVERNMENT
POLICY
Date:
GAIN Report Number:
Approved By:
Prepared By:
Report Highlights:
Chinese demand for high quality fruit remains strong and imports of apples and pears are expected to
increased in MY 2018/19. Demand for imported table grapes is also strong, but imports will decrease
due to a constrained supply. As long as additional Chinese tariffs are in place on U.S.-origin products,
U.S. apples, pears, and table grapes are expected to lose market share. Extreme weather this spring
across northern China will result in a sharp fall of the country’s apple, pear, and table grape production
in MY 2018/19. Apple production is forecast to fall 25 percent to 31 million metric tons (MMT), pears
20 percent to 13 MMT, and table grapes 10 percent to 945,000 metric tons.
Abraham Inouye
Michael Ward
U.S.-origin Deciduous Fruit Likely to Lose Market Share in
China Due to Additional Tariffs
Fresh Deciduous Fruit Annual
China - Peoples Republic of
CH18074
11/01/2018
Required Report - public distribution
2
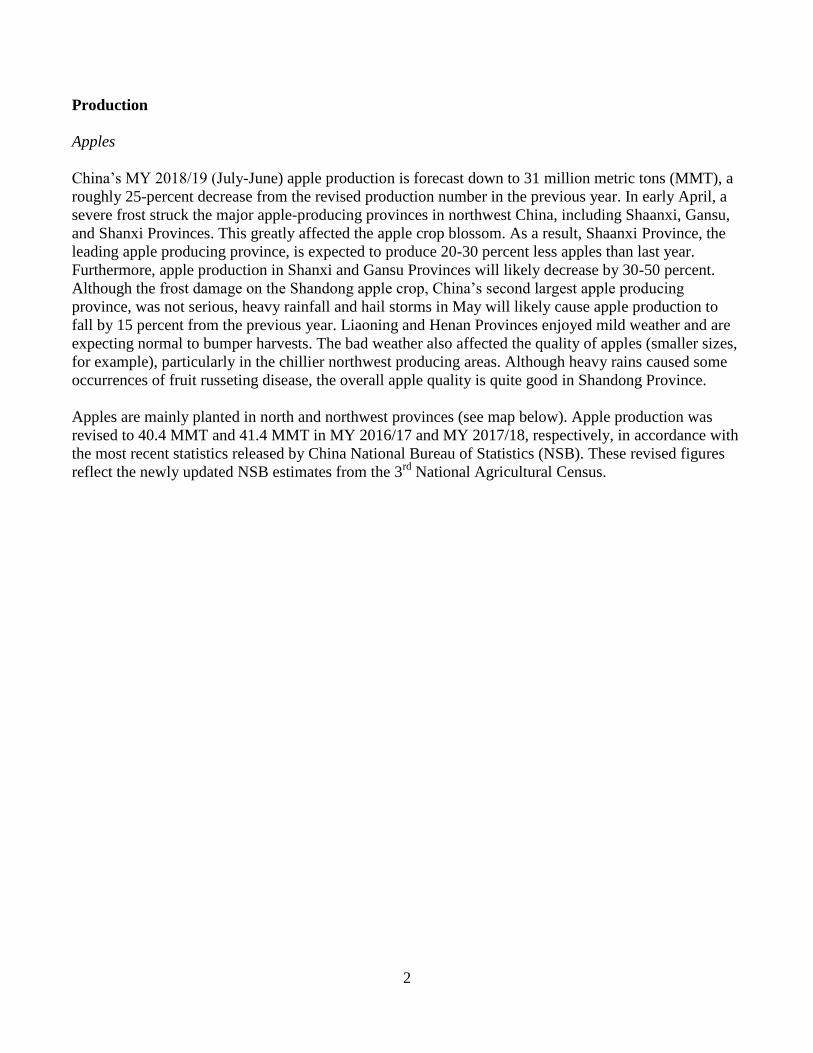
Production
Apples
China’s MY 2018/19 (July-June) apple production is forecast down to 31 million metric tons (MMT), a
roughly 25-percent decrease from the revised production number in the previous year. In early April, a
severe frost struck the major apple-producing provinces in northwest China, including Shaanxi, Gansu,
and Shanxi Provinces. This greatly affected the apple crop blossom. As a result, Shaanxi Province, the
leading apple producing province, is expected to produce 20-30 percent less apples than last year.
Furthermore, apple production in Shanxi and Gansu Provinces will likely decrease by 30-50 percent.
Although the frost damage on the Shandong apple crop, China’s second largest apple producing
province, was not serious, heavy rainfall and hail storms in May will likely cause apple production to
fall by 15 percent from the previous year. Liaoning and Henan Provinces enjoyed mild weather and are
expecting normal to bumper harvests. The bad weather also affected the quality of apples (smaller sizes,
for example), particularly in the chillier northwest producing areas. Although heavy rains caused some
occurrences of fruit russeting disease, the overall apple quality is quite good in Shandong Province.
Apples are mainly planted in north and northwest provinces (see map below). Apple production was
revised to 40.4 MMT and 41.4 MMT in MY 2016/17 and MY 2017/18, respectively, in accordance with
the most recent statistics released by China National Bureau of Statistics (NSB). These revised figures
reflect the newly updated NSB estimates from the 3rd
National Agricultural Census.

3
Apple Growing Provinces in China
Source: China Ministry of Agriculture and Rural Affairs (2016 data)
Legend:
Dark Green = 20% or more of total Chinese production (Shaanxi, Shandong)
Green = 10 to 20% (Shanxi, Henan)
Light Green = 5 to 10% (Gansu, Liaoning, Hebei)
China’s apple acreage is forecast at 2.32 million hectares in MY 2018/19, basically unchanged from the
previous year. While the removal of apple trees still occurs in southern Shaanxi, western Shanxi, and
Henan Provinces, new plantings are expanding in northern Shaanxi and southeastern Gansu Provinces.
Meanwhile, Shandong farmers are replacing old apple trees with new plantings. With all of these
changes, China’s apple acreage is expected to remain stable or decline slowly in the foreseeable future
(after MY 2018/19). Another industry-wide trend is the ageing nature of China’s fruit farmers. As fruit
farmers abandon production due to old age, they are transferring the production to cooperatives, and
private companies. Although consolidated fruit farming has historically been rare in the apple industry,
it is slowly, but inevitably, heading in this direction.
Despite improved farming skills, premium quality apples accounted for only 30 percent or less of the
total production. There are only a few apple varieties planted in China. Fuji varieties dominate more
than 70 percent of total production and other varieties, including early maturing Gala, account for the
balance.

4
0
5
10
15
20
25
30
35
40
45
2005 2006 2007 2008 2009 2010 2011 2012 2013 2014 2015 2016 2017
Mil
lion
MT
China's Apple, Pear, and Table Grape Production from 2005-2017
apple pear grape
Source: National Statistics Bureau, FAS Beijing
Pears
China’s pear production is forecast at 13.1 MMT in MY 2018/19 (July-June), which is down 20 percent
from the revised number in the previous year. Like the apple crop, pear flowering was also affected by
the severe spring frost across northern China. In Hebei Province, the country’s top pear-producing
province, pear production is estimated to drop by 20-25 percent from a year ago. Likewise, pear
production in Shandong, the second largest pear-producing province, is likely to decrease by 10-20
percent year-on-year. Significant reductions were also reported in Xinjiang, Shaanxi, Henan, and Anhui
Provinces as a result of the severe weather. However, Liaoning and Sichuan Provinces, also major pear
producing provinces, are anticipating bumper harvests. In spite of crop losses, pear quality has not been
seriously impacted by the spring frost. Pears are grown in almost all mainland Chinese provinces except
for Hainan, with more than 70 percent being planted in northern China (see map below). Post has
revised the pear production number to 16 MMT and 16.4 MMT in MY 2016/17 and MY 2017/18,
respectively, according to revised NBS statistics.

5
Pear Growing Provinces in China
Source: China Ministry of Agriculture and Rural Affairs (2016 data)
Legend:
Brown= 20% or more of total Chinese production (Hebei)
Yellow = 5 to 10% (Shandong, Xinjiang, Liaoning, Henan, Shaanxi, Sichuan)
China’s pear acreage is forecast at 1.1 million hectares in MY 2018/19, down slightly from the previous
year. The acreage decreases occurred in traditional pear production areas, such as Hebei Province.
Reportedly, some pear farmers have shifted to producing grapes due to the increased profitability, and
other farmers, generally older farmers, have given up fruit farming and turned to less labor-intensive
commodities, like corn. Industry sources indicate that the Chinese pear industry is faced with a series of
challenges such as increasing labor costs, outdated production patterns, and difficulty in cultivating new
fruit varieties. More than 40 varieties are planted throughout China, notably Snow, Ya, Su, Huangguan,
Frangrant, and Nanguo.
Table grapes
China is forecast to produce 945,000 MT of table grapes in MY 2018/19 (June-May), down 10 percent
from the revised number in the previous year, due to spring frost damage. Hebei and Shaanxi Provinces
were the two most heavily hit grape producing provinces, with production falling by 30-50 percent,
according to local estimates. The grape crop in other major producing provinces was not seriously
impacted by the extreme weather. According to media reports, Chinese grape quality remains fair this
year. Leading grape-producing provinces include Xinjiang, Hebei, Shandong, Yunnan, Zhejiang,

6
Liaoning, Shaanxi, Guangxi, and Jiangsu Provinces (see map below). Post has revised the table grape
production number to 10.1 MMT and 10.5 MMT in MY 2016/17 and MY 2017/18, respectively, based
on the revised statistics released by NSB.
Grape Growing Provinces in China
Source: China Ministry of Agriculture and Rural Affairs (2016 data)
Legend:
Pink = 10 to 20% (Xinjian, Hebei)
Light Pink = 5 to 10% (Shandong, Yunnan, Zhejiang, Liaoning)
Although rapid expansion has slowed, grape acreage continues to increase given favorable market
returns. Post estimates the grape planted area at 826,000 hectares, slightly up from the previous year.
China’s table grapes varieties include Eurasia varieties such as Kyoho, Xiahei, Fujiminori, and Jingya,
and Euramerica varieties such as Red Globe, Thompson Seedless, Muscat, Victoria, and Manicure
Finger. Some newly developed varieties have become popular, including Ruiducuixia, Jumbo Muscat,
Flame Seedless, Gold Finger, Shine Muscat, and Crimson Seedless. Increased varieties with diverse
ripening times, coupled with investment in additional farming technologies (greenhouse facilities, for
example), has substantially extended the grape harvest season which now runs from April to November.
Grape quality, however, varies significantly based on different management practices. From a food
safety standpoint, over-application of fertilizers and plant regulators (and the resulting residues)
continue to be a concern for Chinese consumers.
Prices

7
Source
: China Fruit Marketing Association
A sharp decrease in production has pushed apple prices above last year’s. According to a national TV
survey, the farm gate price for top-grade Fuji apples (8 cm in diameter or above) is currently 8.4 RMB
(1.22 USD) per kilo in Shandong Province, a 50-percent increase from a year ago. The strong apple
price is also supported by the high futures price, which is currently at 11,000 RMB (1,594 USD) per
metric ton.
Pear prices have also been on the rise heading into MY 2018/19. The farm gate price for Huangguan
pears, for example, was quoted at 2.8-3.4 RMB (0.4-0.5 USD) per kilo in Hebei Province during this
harvest season (early July-late August), an increase of 30 to 40 percent from the previous season,
according to media reports.
Chinese grape farmers report that farm gate prices for Kyoho grapes were 7.0 RMB (1.01 USD) per kilo,
a 40-percent increase from the previous year.
Consumption
Fresh fruit consumption is steadily growing in China. Fresh fruit and fruit products have gradually
become a core part of the daily diet among most Chinese consumers. This trend is primarily due to
rising incomes, increased focus on healthy diets, improved fruit availability, and improved fruit
diversity. China’s annual per capita fruit consumption was estimated at 92.5 kilograms in 2017 and this
number is expected to increase to 97.9 kilograms by 2020, according to China Agricultural Outlook
Report (2018-2027). Generally, when choosing fruit, Chinese consumers tend to focus on nutritional
value, freshness, and “specialty” fruits. This focus is reflected in the growing popularity of branded fruit.
Chinese consumption of domestically grown apples and pears has shown signs of slowing and possibly
leveling off due to it reaching saturation levels and competition with other fruits (including imported
fruits). Although the continuing expansion of cold storage facilities will extend the supply season for

8
apples and pears, China’s current per capita consumption of apples and pears is already very high
compared to other countries and has limited room to grow. Competition from other fruit varieties,
including locally-produced lychee, grapes, cherries, and imported dragon fruit, mangos, and durians has
resulted in apples and pears accounting for less of the China’s deciduous fruit consumption. However,
high quality apples and pears are still aggressively sought after by China’s consumers and in short
supply.
China’s table grape consumption continues to increase at a fairly quick pace, largely because of a longer
supply season and availability of newly-developed varieties. Modern greenhouse facilities, delayed
cultivation technology, and the double-harvest model have effectively extended the season that China’s
farmers can supply locally-produced table grapes. New varieties with different flavors, colors, and
shapes (for example, finger or cylinder shaped grapes) are attracting increased interest from Chinese
consumers, spurring an increased demand for grapes overall.
Trade
Imports
China’s apple imports are forecast to increase by 10 percent to 75,000 MT in MY 2018/19 (July-June),
due to reduced local supplies. Apple imports from the United States, the largest supplier to China, are
expected to drop dramatically as a result of the additional import tariffs China has placed on U.S.
products. However, the supply gap left by shrinking imports of U.S. apples will likely be filled by
competitor suppliers, including Poland and France. Imports from Southern Hemisphere countries,
including New Zealand and Chile, are expected to increase as well, further cutting into U.S. market
share.
China imports a much smaller quantity of pears compared to other deciduous fruit, but will still see
imports increase. China’s pear imports in MY 2018/19 are forecast at 9,000 MT, an increase of more
than 12 percent due to constrained domestic supplies. The United States is the second largest supplier of
pears to China, but will see its exports decrease as a result of the additional import duties. However,
supplies from competitors, such as the Netherlands and Belgium, will likely pick up to fill the supply
gap.
China’s table grape imports are forecast to decrease by 7 percent to 200,000 MT in MY 2018/19 (June-
May). The United States is the largest supplier in the Northern Hemisphere and does not have major
competitors during its main shipping season. As a result of the additional Chinese tariffs, U.S. apple
imports to China will likely shrink, leaving a sizeable supply gap. While the Southern Hemisphere
suppliers will likely increase their table grape exports to China, they will not be able to completely fill
the gap, resulting in a net decrease of table grape imports.
9
Source: China Customs Data
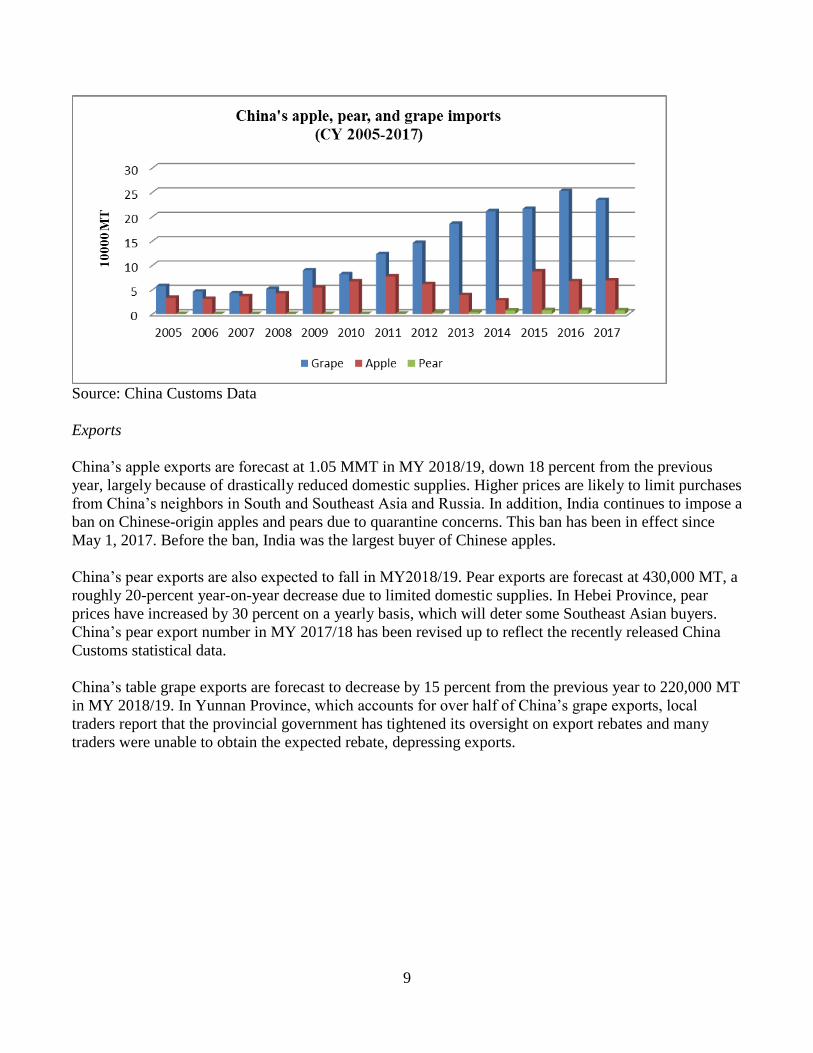
Exports
China’s apple exports are forecast at 1.05 MMT in MY 2018/19, down 18 percent from the previous
year, largely because of drastically reduced domestic supplies. Higher prices are likely to limit purchases
from China’s neighbors in South and Southeast Asia and Russia. In addition, India continues to impose a
ban on Chinese-origin apples and pears due to quarantine concerns. This ban has been in effect since
May 1, 2017. Before the ban, India was the largest buyer of Chinese apples.
China’s pear exports are also expected to fall in MY2018/19. Pear exports are forecast at 430,000 MT, a
roughly 20-percent year-on-year decrease due to limited domestic supplies. In Hebei Province, pear
prices have increased by 30 percent on a yearly basis, which will deter some Southeast Asian buyers.
China’s pear export number in MY 2017/18 has been revised up to reflect the recently released China
Customs statistical data.
China’s table grape exports are forecast to decrease by 15 percent from the previous year to 220,000 MT
in MY 2018/19. In Yunnan Province, which accounts for over half of China’s grape exports, local
traders report that the provincial government has tightened its oversight on export rebates and many
traders were unable to obtain the expected rebate, depressing exports.

10
Source: China Customs Data
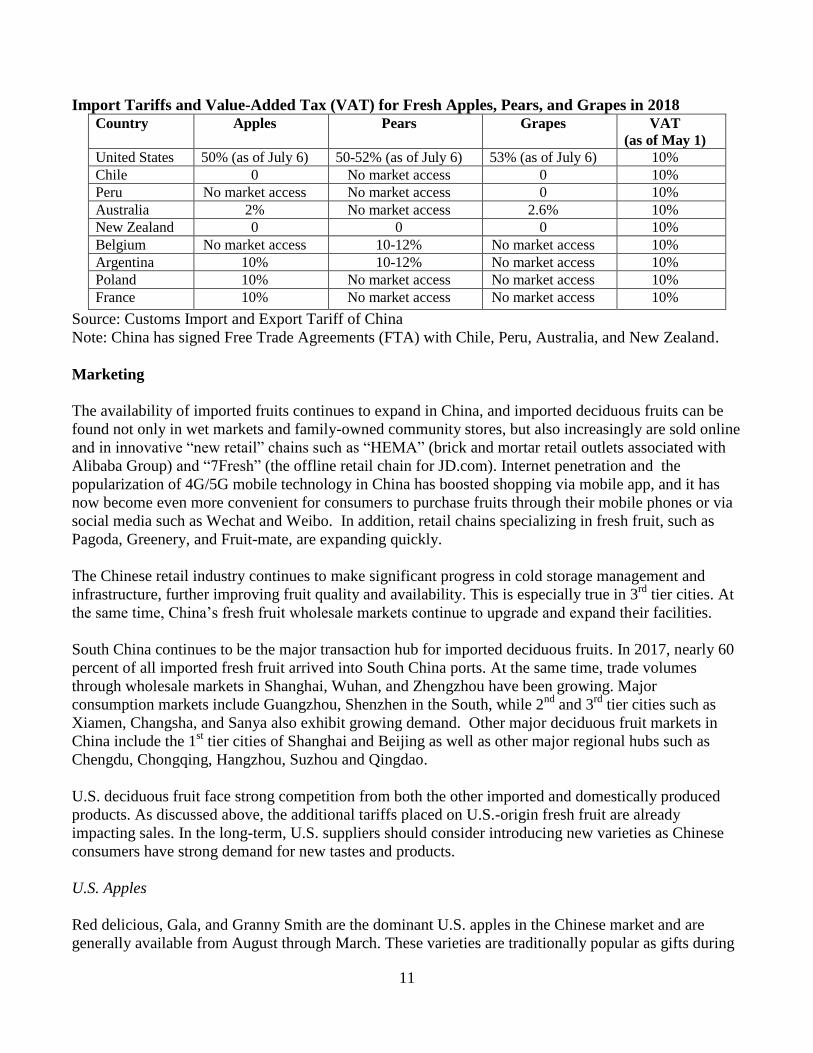
Policy
China’s levying of additional tariffs on U.S.-origin fruit imports will likely result in lost market share by
U.S. fruit producers
While China has encouraged fruit imports by reducing the value-added tax (VAT) rate, and increasing
the export rebate, it has imposed additional duties on U.S.-origin fruit imports. On May 1, 2018, the
Chinese government lowered the value-added tax (VAT) for agricultural products (including imported
agricultural products) to 10 percent from 11 percent (see GAIN report CH18022). This reduction
follows a reduction in the VAT rate from 13 percent to 11 percent on July 1, 2017. In an effort to
encourage exports, the Chinese government announced on October 22 that export rebate rates will be
increased for most or many exported products on November 1, 2018.
For fresh deciduous fruit, the export rebate for apples (HS 08081000) and pears (HS 08083010,
08083090, 08084000) will be increased to 10 percent (of the export value) from 5 percent. The export
rebate for grapes will be increased to 6 percent from 5 percent.
On March 23, 2018, the People’s Republic of China’s State Council Tariff Commission (SCTC)
announced a list of U.S. products subject to additional tariffs in response to the United States imposing
tariffs related to the U.S. 232 Trade Action (see FAS GAIN report CH18017). For fresh apples, pears,
and grapes, the additional Chinese tariff was 10 percent and went into effect on April 2, 2018. In
addition, on July 6, 2018, SCTC implemented another set of tariffs on U.S. products in response to the
U.S. Section 301 Investigation (see FAS GAIN report CH18034). For apples, pears, and grapes, China
added another 25-percent tariff in addition to the existing MFN rate and added 10-percent tariff. For
most fresh apples, pears, and grapes, the total additional import tariff is 40 percent (fragrant pears were
not assessed the earlier 10-percent tariff). These additional tariffs put U.S. fruit at a price disadvantage
with fruit from other countries. The following table provides details about the import tariffs and VAT on
fresh deciduous fruit originating from the United States and other trading partners.
11
Import Tariffs and Value-Added Tax (VAT) for Fresh Apples, Pears, and Grapes in 2018
Country Apples Pears Grapes VAT
(as of May 1)
United States 50% (as of July 6) 50-52% (as of July 6) 53% (as of July 6) 10%
Chile 0 No market access 0 10%
Peru No market access No market access 0 10%
Australia 2% No market access 2.6% 10%
New Zealand 0 0 0 10%
Belgium No market access 10-12% No market access 10%
Argentina 10% 10-12% No market access 10%
Poland 10% No market access No market access 10%
France 10% No market access No market access 10%
Source: Customs Import and Export Tariff of China
Note: China has signed Free Trade Agreements (FTA) with Chile, Peru, Australia, and New Zealand.
Marketing
The availability of imported fruits continues to expand in China, and imported deciduous fruits can be
found not only in wet markets and family-owned community stores, but also increasingly are sold online
and in innovative “new retail” chains such as “HEMA” (brick and mortar retail outlets associated with
Alibaba Group) and “7Fresh” (the offline retail chain for JD.com). Internet penetration and the
popularization of 4G/5G mobile technology in China has boosted shopping via mobile app, and it has
now become even more convenient for consumers to purchase fruits through their mobile phones or via
social media such as Wechat and Weibo. In addition, retail chains specializing in fresh fruit, such as
Pagoda, Greenery, and Fruit-mate, are expanding quickly.
The Chinese retail industry continues to make significant progress in cold storage management and
infrastructure, further improving fruit quality and availability. This is especially true in 3rd
tier cities. At
the same time, China’s fresh fruit wholesale markets continue to upgrade and expand their facilities.
South China continues to be the major transaction hub for imported deciduous fruits. In 2017, nearly 60
percent of all imported fresh fruit arrived into South China ports. At the same time, trade volumes
through wholesale markets in Shanghai, Wuhan, and Zhengzhou have been growing. Major
consumption markets include Guangzhou, Shenzhen in the South, while 2nd
and 3rd
tier cities such as
Xiamen, Changsha, and Sanya also exhibit growing demand. Other major deciduous fruit markets in
China include the 1st tier cities of Shanghai and Beijing as well as other major regional hubs such as
Chengdu, Chongqing, Hangzhou, Suzhou and Qingdao.
U.S. deciduous fruit face strong competition from both the other imported and domestically produced
products. As discussed above, the additional tariffs placed on U.S.-origin fresh fruit are already
impacting sales. In the long-term, U.S. suppliers should consider introducing new varieties as Chinese
consumers have strong demand for new tastes and products.
U.S. Apples
Red delicious, Gala, and Granny Smith are the dominant U.S. apples in the Chinese market and are
generally available from August through March. These varieties are traditionally popular as gifts during

12
national holidays such as the Mid-Autumn Festival and Chinese New Year. New varieties should also be
considered when choosing which products to export to China.
Even before additional tariffs were placed on U.S. products, competition for U.S. apples was strong,
both from domestic and imported sources. China is the world’s largest apple producer and New Zealand
and Chile enjoy preferential tax treatment due to free-trade agreements. The majority of imported apples
come through South China, with Shenzhen being the largest entry point. Trade contacts report that
educational seminars and interaction with consumers will help enhance the positive image of U.S.
apples.
U.S. Pears
U.S. pears face strong competition from domestically produced pears and from other imported varieties
from multiple countries (for example, Belgium, Argentina, and the Netherlands). The major importing
ports for U.S. pears are Dalian, Guangzhou, and Shanghai. U.S. pears are relatively more popular in the
North as Chinese consumers are more familiar with soft textured pears. Southern consumers prefer
crunchy and crisp Asian varieties. The three most commonly found U.S. varieties in the Chinese market
include Starkrimson, Red Anjou, and Green Anjou. All three of these varieties are readily available in
higher-end supermarkets in 1st tier cities.
U.S. Table Grapes
Over the past several years, U.S. seedless Red Globe, Autumn Royal, Thompson and Crimson varieties
have largely replaced the U.S. seeded Red Globe variety in the Chinese market. Retail contacts report
this change is a result of robust consumer demand for high-quality seedless varieties combined with the
fact that importers now prefer to trade in U.S. seedless varieties as the profit margin is much greater.
Retail contacts report that in-store promotions with point-of-sale materials and decorations highlighting
attributes of imported grapes can dramatically increase sales. Retail contacts also report that timing
promotional events with major Chinese holidays can be especially effective and there are a growing
number of consumers (especially in 1st tier markets) that are willing to pay a significant premium for
high quality, new-to-market varieties. Trade contacts also report that demand for imported green
seedless varieties are also expanding in China.

13
Production, Supply, and Demand (PS&D) Tables
Apples
Apples, Fresh 2016/2017 2017/2018 2018/2019
Market Begin Year Jul 2016 Jul 2017 Jul 2018
China USDA
Official
New
Post
USDA
Official
New
Post
USDA
Official
New
Post
Area Planted 2324000 232400
0
2320000 232000
0
0 232200
0
Area Harvested 0 0 0 0 0 0
Bearing Trees 0 0 0 0 0 0
Non-Bearing Trees 0 0 0 0 0 0
Total Trees 0 0 0 0 0 0
Commercial
Production
43900000 403930
00
44500000 413900
00
0 310000
00
Non-Comm.
Production
0 0 0 0 0 0
Production 43900000 403930
00
44500000 413900
00
0 310000
00
Imports 70700 70700 70000 68000 0 75000
Total Supply 43970700 404637
00
44570000 414580
00
0 310750
00
Fresh Dom.
Consumption
38189300 346823
00
38370000 353780
00
0 270250
00
Exports 1381400 138140
0
1200000 128000
0
0 105000
0
For Processing 4400000 440000
0
5000000 480000
0
0 300000
0
Withdrawal From
Market
0 0 0 0 0 0
Total Distribution 43970700 404637
00
44570000 414580
00
0 310750
00
Unit: hectare, metric ton.
Note: Post revised the 2016 and 2017 New Post production figures to reflect recently released revisions
by NSB.

14
Pears
Pears, Fresh 2016/2017 2017/2018 2018/2019
Market Begin Year Jul 2016 Jul 2017 Jul 2018
China USDA
Official
New
Post
USDA
Official
New
Post
USDA
Official
New
Post
Area Planted 1113000 111300
0
1110000 111000
0
0 110800
0
Area Harvested 0 0 0 0 0 0
Bearing Trees 0 0 0 0 0 0
Non-Bearing Trees 0 0 0 0 0 0
Total Trees 0 0 0 0 0 0
Commercial
Production
18700000 159600
00
19000000 164100
00
0 131000
00
Non-Comm.
Production
0 0 0 0 0 0
Production 18700000 159600
00
19000000 164100
00
0 131000
00
Imports 6900 6900 8000 8000 0 9000
Total Supply 18706900 159669
00
19008000 164180
00
0 131090
00
Fresh Dom.
Consumption
16478299 139382
99
16743000 143250
00
0 114790
00
Exports 508601 508601 515000 543000 0 430000
For Processing 1720000 152000
0
1750000 155000
0
0 120000
0
Withdrawal From
Market
0 0 0 0 0 0
Total Distribution 18706900 159669
00
19008000 164180
00
0 131090
00
Unit: hectare, metric ton.
Note: Post revised the 2016 and 2017 New Post production figures to reflect recently released revisions
by NSB.

15
Table Grapes
Grapes, Fresh
Table 2016/2017 2017/2018 2018/2019
Market Begin Year Jun 2016 Jun 2017 Jun 2018
China USDA
Official
New
Post
USDA
Official
New
Post
USDA
Official
New
Post
Area Planted 810000 810000 812000 812000 0 81600
0
Area Harvested 0 0 0 0 0 0
Commercial
Production
10800000 101000
00
11200000 105000
00
0 94500
00
Non-Comm.
Production
0 0 0 0 0 0
Production 10800000 101000
00
11200000 105000
00
0 94500
00
Imports 237100 237100 215000 215000 0 20000
0
Total Supply 11037100 103371
00
11415000 107150
00
0 96500
00
Fresh Dom.
Consumption
10780400 100804
00
11135000 104540
00
0 94300
00
Exports 256700 256700 280000 261000 0 22000
0
Withdrawal From
Market
0 0 0 0 0 0
Total Distribution 11037100 103371
00
11415000 107150
00
0 96500
00
Unit: hectare, metric ton