China Logistics OVERWEIGHT - Kim Eng Hong · PDF fileChina Logistics. On a structural ... High...
56
July 23, 2014 China SECTOR RESEARCH | SEE PAGE 54 FOR IMPORTANT DISCLOSURES AND ANALYST CERTIFICATIONS China Logistics On a structural uptrend High cost of logistics in China will create demand for sophisticated value-added logistics services, providing numerous opportunities to industry players. Structural, rather than cyclical, drivers support the uptrend in China’s logistics sector over the long term. Top pick still Sinotrans; China Merchants (CM) is an alternative play. Kerry Logistics Network’s (KLN) growth is slow and valuations stretched, initiate at HOLD. Numerous opportunities for logistics players China’s logistics costs reached 17.9% of GDP in FY13, 9.5ppt higher than the average for developed countries such as the US, Japan and Germany. We expect a continued drive to lower logistics costs, advancement of technology and the improvement of infrastructure networks to further stimulate demand for sophisticated logistics services, translating into numerous business opportunities for experienced logistics providers with solid service know-how. Seven drivers positive for sector outlook We see seven key drivers underpinning solid logistics demand in China: 1) growth in e-commerce volume, driven by online shopping and “Haitao” demand; 2) manufacturers relocating production, stimulating supply chain services; 3) increase in enterprise outsourcing accelerating third-party logistics (3PL); 4) rise in demand for value-added services translating into more profit opportunities; 5) upgrading of logistics facilities enhancing unit revenue; 6) expansion of Chinese enterprises overseas generating cross-border logistics demand; and 7) more favourable government policies creating a more positive operating environment. BUY Sinotrans and CM, HOLD KLN Reiterate BUY on Sinotrans and CM, as both fit well into the trend of accelerated logistics demand. We expect Sinotrans to continue to generate solid growth from 3PL and warehouse upgrades, and it will see further parent-asset injections. CM has a growing logistics business, though its contribution is only 7.2% for FY15F. For KLN, while it has good exposure to the China and Asia logistics markets, growth will be weighed down by its Hong Kong warehouses. It will also take time for the M&A to reflect significantly on its earnings; ROE will remain low for the next two years. Initiate at HOLD and believe its current valuation is fair. Analysts (New) OVERWEIGHT Osbert TK Tang, CFA (86) 21-5096 8370 [email protected] Tracy Liu (86) 21 5096 8367 [email protected] Stock Mkt cap Rating Price TP Upside (USD'm) (LC) (LC) (%) 14E 15E 14E 15E 14E 15E China Merchants 8,311.7 Buy 25.50 29.80 17 14.9 14.0 1.3 1.2 3.2 3.5 Sinotrans 2,912.0 Buy 4.90 6.20 27 15.2 11.3 1.4 1.2 1.7 2.2 Kerry Logistics 2,778.7 Hold 12.74 12.80 0 21.9 19.9 1.5 1.4 1.0 1.1 P/E (x) P/B (x) Dividend yld (%)
Transcript of China Logistics OVERWEIGHT - Kim Eng Hong · PDF fileChina Logistics. On a structural ... High...

July 23, 2014
Chin
a SE
CTO
R RE
SEA
RCH
|
SEE PAGE 54 FOR IMPORTANT DISCLOSURES AND ANALYST CERTIFICATIONS
China Logistics
On a structural uptrend High cost of logistics in China will create demand for
sophisticated value-added logistics services, providing numerous opportunities to industry players.
Structural, rather than cyclical, drivers support the uptrend in China’s logistics sector over the long term.
Top pick still Sinotrans; China Merchants (CM) is an alternative play. Kerry Logistics Network’s (KLN) growth is slow and valuations stretched, initiate at HOLD.
Numerous opportunities for logistics players China’s logistics costs reached 17.9% of GDP in FY13, 9.5ppt higher than the average for developed countries such as the US, Japan and Germany. We expect a continued drive to lower logistics costs, advancement of technology and the improvement of infrastructure networks to further stimulate demand for sophisticated logistics services, translating into numerous business opportunities for experienced logistics providers with solid service know-how.
Seven drivers positive for sector outlook We see seven key drivers underpinning solid logistics demand in China: 1) growth in e-commerce volume, driven by online shopping and “Haitao” demand; 2) manufacturers relocating production, stimulating supply chain services; 3) increase in enterprise outsourcing accelerating third-party logistics (3PL); 4) rise in demand for value-added services translating into more profit opportunities; 5) upgrading of logistics facilities enhancing unit revenue; 6) expansion of Chinese enterprises overseas generating cross-border logistics demand; and 7) more favourable government policies creating a more positive operating environment.
BUY Sinotrans and CM, HOLD KLN Reiterate BUY on Sinotrans and CM, as both fit well into the trend of accelerated logistics demand. We expect Sinotrans to continue to generate solid growth from 3PL and warehouse upgrades, and it will see further parent-asset injections. CM has a growing logistics business, though its contribution is only 7.2% for FY15F.
For KLN, while it has good exposure to the China and Asia logistics markets, growth will be weighed down by its Hong Kong warehouses. It will also take time for the M&A to reflect significantly on its earnings; ROE will remain low for the next two years. Initiate at HOLD and believe its current valuation is fair.
Analysts
(New)OVERWEIGHT
Osbert TK Tang, CFA(86) 21-5096 [email protected]
Tracy Liu(86) 21 5096 [email protected]
Stock Mkt cap Rating Price TP Upside
(USD'm) (LC) (LC) (%) 14E 15E 14E 15E 14E 15E
China Merchants 8,311.7 Buy 25.50 29.80 17 14.9 14.0 1.3 1.2 3.2 3.5
Sinotrans 2,912.0 Buy 4.90 6.20 27 15.2 11.3 1.4 1.2 1.7 2.2
Kerry Logistics 2,778.7 Hold 12.74 12.80 0 21.9 19.9 1.5 1.4 1.0 1.1
P/E (x) P/B (x) Dividend yld (%)
July 23, 2014 2
China Logistics
Three key charts
Figure 1: Emerging Markets logistics potential quadrant
Source: Agility
Figure 2: Internal and external management of logistics processes
Source: PWC Logistics in China
Figure 3: Greater China 3PL market share breakdown
Source: Armstrong
23%
28%
44%
63%
35%
36%
20%
8%
36%
27%
9%
13%
6%
9%
27%
16%
0% 20% 40% 60% 80% 100%
Transport management
Customs clearance
Warehousing
Supply chain monitoring
InternalExternal,Chinese logistics companiesExternal, non-Chinese logistics companiesUnknown, n/a, does not apply to our company
*24% *36% *7% *12%
Sinotrans 6.0%
DHL Supply Chain & Global
Forwarding 1.9%
Kerry Logistics 1.3%
CEVA Logistics 1.0%
Expeditors International of
Washington 1.0%
Others 88.8%
China is an attractive market for logistics investment.
Outsourcing of logistics management to external companies remains low.
3PL market in China is highly fragmented with Sinotrans being the largest, followed by DHL and KLN

July 23, 2014 3
China Logistics
Drivers for China’s logistics industry
Weak infrastructure and a less efficient network mean logistics costs in China are higher than in most other countries. In 2013, China’s social logistics revenue reached CNY1,978b, achieving a 10-year CAGR of 14.6%. Based on data from the China Federation of Logistics & Purchasing, China’s logistics costs reached 17.9% of GDP in FY13. This is 9.5ppt higher than the average for developed countries like the US, Japan and Germany. We expect the continuous drive to lower logistics costs, advancement of logistics technology and the improvement in infrastructure network to further stimulate the demand for sophisticated logistics services. This should translate into numerous business opportunities for experienced logistics providers with solid service know-how.
Figure 4: China’s total social logistics cost
Source: iFind
Figure 5: China’s total social logistics cost breakdown
Source: iFind
Traditionally, Chinese companies tend to manage their product distribution in-house, mostly due to the high volumes (which made it cost-efficient), the lack of quality logistics service providers and the under-development of logistics information systems. However, over the past five years, manufacturers and retailers have become increasingly aware of the importance of an efficient logistics network. The increase in market competition, driven by e-commerce growth and the rise in demand for timely deliveries, has also driven the demand for more efficient logistics arrangements. The emergence of bigger and more professional 3PL companies that offer more comprehensive services have made it even
0%
2%
4%
6%
8%
10%
12%
14%
16%
18%
20%
0
2
4
6
8
10
12
2004 2005 2006 2007 2008 2009 2010 2011 2012 2013
CNYt China social logistics cost % Change (RHS)
Transportation expense 52.9% Storage cost
35.3%
Management expense 12.7%
Continuous drive to lower logistics cost will further stimulate the demand for sophisticated logistics services.

July 23, 2014 4
China Logistics
more efficient and cost-effective for enterprises to outsource their logistics requirements rather than handling them in-house.
In China, most of the logistics service providers are small companies involved in just one or two segments of the overall supply chain. There are just a handful of companies capable of providing customers with comprehensive supply chain management services. The logistics market in China is highly fragmented, with more knowledgeable overseas companies like UPS, FedEx and DHL dominating the cross-border arena. Domestically, state-owned and Hong Kong-based players like Sinotrans and KLN have been aggressively building up their presences. Additionally, domestic express operators like SF Express and Shentong have started to construct a nation-wide logistics network, while the Cainiao Network, a logistics infrastructure initiated by Alibaba Executive Chairman Jack Ma, has caught significant market attention.
Based on Armstrong & Associates, logistics spending in China amounted to USD1.5t in 2012, making it, as a single country, the highest in the world. We expect China’s logistics spending to experience a CAGR of 10-12% between FY13 and FY17. However, the growth in demand for more value-added services and increase in outsourcing by corporates mean the 3PL market will grow much faster than the growth in logistics spending in the next five years.
Figure 6: 3PL revenue growth by region
Source: Armstrong
We continue to be positive on the China logistics sector over the next five years and envisage the key demand drivers to be: 1) growth in e-commerce volume; 2) manufacturing relocations; 3) increase in enterprise outsourcing; 4) rise in demand for value-added services; 5) upgrade in facility quality; 6) expansion of Chinese enterprises overseas; and 7) more favourable government policies. According to Agility, China is classified as a country with high market potential but few barriers to entry, effectively meaning it is one of the biggest targets for logistics investments as well as the easiest markets in which to operate.
18.8%
9.5%
13.3%
4.0% 6.3%
-1.7%
8.0%
4.8% 3.6% 4.2%
1.5% 1.0%
-5%
0%
5%
10%
15%
20%
GreaterChina
Asia Pacific(ex. GreaterChina and
Japan)
SouthAmerica
NorthAmerica
Japan Europe
2007-2012 2012-2015E
The logistics market in China is highly fragmented, with more knowledgeable overseas companies like UPS, FedEx and DHL dominating the cross-border arena.

July 23, 2014 5
China Logistics
Figure 7: Emerging Market logistics potential quadrant
Source: Agility
1) Growth in retail e-commerce volume The rise in domestic consumption is expected to be an important driver for logistics demand in China. Over the past seven years, China’s retail sales have increased at a CAGR of 17.4%. Although growth slowed to 11.9% in 1Q14, the pace remains decent. Continued urbanization is one of the key impetuses to support growth in retail sales. Under the 12th Five-Year Plan and Premier Li, urbanization is an important focus of China’s development in the next five years. Based on data from the National Bureau of Statistics of China (NBS), China’s urbanization rate rose from 47.0% in 2008 to 53.7% in 2013, primarily driven by the government’s policy of actively relocating rural residents to urban areas. According to the NBS, urbanization will continue to increase as rural residents migrate to cities to provide labour for the processing and service industries. As a result, China’s urbanization rate is expected to reach 58.9% by 2017 and 70% by 2030. Urban disposable income has been growing at a 10-year CAGR of 11.1%, and rising urbanization rate will keep this on the growth track. The Boao Review forecasts the middle class in China will grow from over 100m currently to more than 400m (accounting for 30-40% of China’s total population) in the next 10 years, and the resultant spending power is extremely significant.
Figure 8: China's retail sales growth
Source: iFind
0%
5%
10%
15%
20%
25%
0
5
10
15
20
25
2001 2002 2003 2004 2005 2006 2007 2008 2009 2010 2011 2012 2013
CNYt China's retail sales % Change (RHS)
Continued urbanization is one of the key impetuses to support growth in retail sales and e-commerce.

July 23, 2014 6
China Logistics
Figure 9: China's urbanization rate
Source: iFind
The government has consistently emphasized the importance of supporting domestic consumption as the growth engine of the country, shifting away from using FAI as the driver of economic expansion. Between 2003 and 2012, consumption as a percentage of total GDP increased from 35.8% to 55%. However, China still significantly lags the US in terms of chain store sales. In the US, roughly 65% of total retail sales are chain store sales but the figure for China is just 10%, implying huge room for growth.
Figure 10: e-commerce revenue growth
Source: iFind
Figure 11: e-commerce revenue breakdown
Source: 100EC.CN
0
10
20
30
40
50
60
1956 1961 1965 1969 1973 1978 1982 1986 1990 1995 1999 2003 2007 2012
(%)
0%
5%
10%
15%
20%
25%
30%
35%
0
2
4
6
8
10
12
14
16
18
20
2008 2009 2010 2011 2012 2013 2014E 2015E 2016E
CNYt China's e-commerce revenue % Change (RHS)
B2B 80.4%
online retail sales 17.6%
online group purchase
0.6%
others 1.4%
In the US, roughly 65% of total retail sales are chain store sales but the figure for China is just 10%, implying huge room for growth.

July 23, 2014 7
China Logistics
China’s e-commerce market has grown rapidly at a CAGR of 22.5% in 2009-2013. In FY13, the total turnover of China’s e-commerce market reached CNY10.2t, up 29.9% YoY. Of this, 80.4% was generated from B2B, 17.6% from online retail and 0.6% from online group purchases. Online retail sales momentum is strong, which grew at a CAGR of 84% between 2006 and 2013 and are forecast to double to CNY3.8t in the next three years. In China, there is a rapid adoption of online purchasing, with online retail sales accounting for 8.04% of total retail sales of consumer goods. This is expected to reach 9.8% in FY14F. However, this cannot be considered as particularly high when compared with the developed countries, which have online retail sales representing between 5% and 15% of total retail sales. Apart from well-known local names like Taobao and TMall in China, there are abundant online stores in China spanning various products and services. For example, VIP Shop, JD.com and Yihaodian.
Figure 12: B2B market breakdown Figure 13: B2C market breakdown
Source: 100EC.CN Source: 100EC.CN
Figure 14: Online retail sales in China Fig 15: Online retail sales as a percentage of total retail sales
Source: iResearch Source: iFind, iResearch
With the rise in online purchases, the logistics operating models for retailers have also changed over time, creating opportunities for 3PL operators. The increase in complexity of transactions and rise in the demand for speedy and accurate deliveries underpinned the need for quality logistics services. These have led to a growth in demand for new e-fulfillment facilities, instead of traditional storage-oriented warehouses, and a rise in value-added services like sorting, labeling, packaging and returns handling, for example. In our view, this will stimulate growth prospects for 3PL operators, and open up further areas into which these operators can expand.
Alibaba 44.5%
Mysteel 10.6%
Global Sources
7.1%
hc360 3.6%
Made-in-China 2.4%
GMC 1.7%
Toocle 1.3%
Others 28.8%
Tmall 50.1%
Jingdong 22.4%
Suning Egou 4.9%
QQ mall 3.1%
Joyo amazon 2.7%
YHD 2.6%
Vipshop 2.3%
Dangdang 1.4%
Gome 0.4%
Vancl 0.2%
Others 9.9%
26 56 128 263 498
774
1,300
1,850
2,420
3,119
3,790
0
500
1,000
1,500
2,000
2,500
3,000
3,500
4,000CNY b
1.18%
2.10%
3.22%
4.27%
6.28%
7.89%
0%
1%
2%
3%
4%
5%
6%
7%
8%
9%
2008 2009 2010 2011 2012 2013
China’s e-commerce market has grown rapidly at a CAGR of 22.5% in 2009-2013.

July 23, 2014 8
China Logistics
Figure 16: The evolution of retail logistics
Source: Jones Lang LaSalle
Another area of rapid growth is domestic express services. Over the past five years, China’s domestic express volume has increased by a CAGR of 37.7% on the back of the boom in e-commerce transactions. According to 100EC.cn, China became the second largest express market in the world in 2013, with a total volume of 9.19b packages handled and the total express industry revenue reached CNY144.2b. Deloitte forecasts express industry revenue will reach CNY280b in 2015, translating into a CAGR of 39.3% between 2013 and 2015. The industry, however, except the state-owned EMS, is dominated by a few private-owned domestic express companies, for example, SF Express (www.sf-express.com), Shentong Express (www.sto.com), Yuantong (www.yto.net.cn), Zhongtong (www.zto.cn), Best Express (www.htky365.com) and Yunda (www.yundaex.com). Industry concentration is comparatively high and the top 10 players have a combined business volume that accounts for 87% of the overall industry in China. Generally speaking, the bigger and more comprehensive logistics companies are not as competitive as the smaller private enterprises, given the less flexible cost structure, hence cost competitiveness, of the former.
Over the past five years, China’s domestic express volume has increased by a CAGR of 37.7% on the back of the boom in e-commerce transactions.

July 23, 2014 9
China Logistics
Figure 17: China express delivery volume and growth rate
Source: iFind
Figure 18: China express revenue and growth
Source: iFind
Figure 19: Market share breakdown for China domestic express
Source: 100EC.cn
0%
10%
20%
30%
40%
50%
60%
70%
0
1
2
3
4
5
6
7
8
9
10
2007 2008 2009 2010 2011 2012 2013
CNY b Express delievery volume % Change (RHS)
0%
5%
10%
15%
20%
25%
30%
35%
40%
45%
0
20
40
60
80
100
120
140
160
2008 2009 2010 2011 2012 2013
CNY b Express sector revenue % Change (RHS)
EMS 22%
SF Express 20%
Shentong 12%
Yuantong 10%
Yunda 8%
Zhongtong 6%
Others 22%

July 23, 2014 10
China Logistics
Figure 20: Domestic express volume market concentration over past five years
Source: China's Express Sector Development Report 2014
Figure 21: Development history of major express enterprises in China
Source: Deloitte
Another rapidly developing e-commerce market is the cross-border purchases by individual consumers in China. This is termed as “Haitao”, which effectively means overseas Taobao. Through Haitao, Chinese consumers are buying products from overseas websites and then entrusted logistics companies handle the transportation, customs clearance and delivery to China. According to the China e-commerce Research Center, the market size of Haitao increased at a CAGR of 83.7% between 2010 and 2013. For 2013, the total market size amounted to CNY74.4b. The rapid growth in the Haitao market, supported by the improvement in spending power and the rise in demand for quality products, has led to the rise in demand for reliable logistics arrangements for the products purchased overseas. This represents a huge market up for grabs by just a few companies that have the extensive international and domestic logistics networks and relation with major retailers overseas.
77.0%
70.3% 67.2%
62.9%
55.4%
85.0% 82.7%
86.5% 85.6% 83.3%
40%
45%
50%
55%
60%
65%
70%
75%
80%
85%
90%
2009 2010 2011 2012 2013
CR4 CR8
The market size of Haitao increased at a CAGR of 83.7% between 2010 and 2013. For 2013, the total market size amounted to CNY74.4b.

July 23, 2014 11
China Logistics
Figure 22: Haitao process (overseas online purchases by Chinese individuals)
Source: www.tdpyh.com
2) Manufacturing relocations There are numerous studies that discuss the trend of migration of manufacturing facilities from coastal China to inland provinces so we will not elaborate here. In fact, this trend has been a prevailing one over the past five years, particularly during a period when the renminbi appreciated significantly, which further amplified operating costs for the Chinese manufacturers for foreign buyers. This structural trend has boosted the economies of many inland provinces and areas. For example, the GDP growth of Chongqing reached a CAGR of 14.9% in the past five years, while Sichuan’s was 13.4%, outperforming 8.9% for China’s GDP. Manufacturing relocations will give rise to significant change in the logistics for transportation and storage of raw materials and components and the distribution of finished products to domestic and overseas customers. We believe such procurement and distribution services will translate into profit opportunities for sophisticated logistics services.
Manufacturing relocations will give rise to significant change in the logistics for transportation and storage of raw materials and components and the distribution of finished products to domestic and overseas customers.

July 23, 2014 12
China Logistics
Figure 23: Five-year CAGR in industrial output by province
Source: NBSC
Figure 24: Five-year CAGR in GDP by province
Source: iFind
6.9% 7.4%
8.4% 9.1% 9.2% 9.2% 9.4% 9.7% 10.0% 10.2% 10.3% 10.6%
11.6% 12.0% 12.0% 12.1% 12.2% 12.4% 12.7% 12.8% 13.0% 13.1% 13.2% 13.2% 13.3% 13.6% 13.8%
14.3% 14.4% 14.5% 14.6% 14.9%
0.0% 2.0% 4.0% 6.0% 8.0% 10.0% 12.0% 14.0% 16.0%
ShanghaiBeijing
ZhejiangHeilongjiang
GuangdongHebei
HainanNational industrial output
XinjiangShandongLiaoningJiangsuGansu
YunnanNingxia
TibetJilin
ShanxiInner Mongolia
HenanFujian
GuizhouQinghaiShaanxiJiangxiHunanHubei
SichuanGuangxiTianjin
AnhuiChongqing
6.67% 6.70% 6.96%
7.36% 7.73%
8.18% 8.42% 8.50% 8.59% 8.61% 8.82% 9.01% 9.07% 9.27% 9.28% 9.39% 9.42% 9.45% 9.48% 9.61% 9.63% 9.66% 9.81% 9.86% 9.99% 10.09% 10.23% 10.33% 10.39% 10.63%
11.69% 11.85%
0% 2% 4% 6% 8% 10% 12% 14%
ShanghaiBeijing
National GDPZhejiang
GuangdongHebei
ShandongHeilongjiang
JiangsuHenan
LiaoningXinjiang
ShanxiNingxiaHainanJiangxiGansu
JilinGuangxi
FujianHunanTibet
Inner MongoliaHubeiAnhui
YunnanQinghaiShaanxiSichuanGuizhou
ChongqingTianjin

July 23, 2014 13
China Logistics
Besides relocations within China, there are also companies seeking to move outside of China. Based on a survey carried out by Agility in 2013, 63% of the respondents agree there is a trend for moving production away from China.
Figure 25: Trend for moving production away from China
Source: Transport Intelligence
In the same survey by Agility, 22% of companies that intend to move away from China choose Vietnam as the number one preferred destination, with India as the second (12%). However, this was before the outbreak of the anti-Chinese protests and political standoff between Vietnam and China. With the recent social and political unrest in South East Asian countries like Vietnam and Thailand, we will potentially see more manufacturers returning to China as the country has enjoyed significantly better political and social stability. We believe this will benefit the supply chain management companies in China. In fact, despite complaints of rising manufacturing costs in China, the country is still ranked first in terms of logistics attractiveness in the Agility Emerging Market Logistics Index. China, with a score of 8.11, is still way ahead of the second-place Brazil, which has a score of just 6.8. We take this an indication of the continued promising outlook for logistics demand in China.
Figure 26: Destinations of production shifts away from China
Source: Transport Intelligence
Strongly agree 15.43%
Agree 48.15%
Neither agree nor disagree
24.23%
Disagree 11.27%
Strongly Disagree
0.93%
22.05%
12.40% 10.72% 10.27%
6.31% 5.86% 5.78% 3.65% 3.42% 3.04%
0%
5%
10%
15%
20%
25%
22% of companies that intend to move away from China choose Vietnam as the number one preferred destination, with India as the second (12%).

July 23, 2014 14
China Logistics
Figure 27: Agility Emerging Market Logistics Index
Source: Transport Intelligence
3) Increase in enterprise outsourcing We believe a major growth opportunity for the logistics industry is the outsourcing of companies’ logistics requirements to 3PL providers. As we said earlier, many domestic and multinational companies are still managing their logistics requirements in-house. Despite this, we continue to see logistics outsourcing as a long-term structural trend. We estimate only about 20-30% of corporates in China currently outsource their logistics requirements to 3PL providers, which is significantly below the average of 60-80% for developed countries. Further pressure to cut logistics costs and to raise profitability will present huge room for growth for 3PL operators.
According to the PwC survey, across various segments of the logistics value chain, companies have between 23% and 63% of their requirements managed internally. The segment that has the lowest proportion of internal management (effectively the highest outsourcing) is transport and the highest (effectively the lowest outsourcing) is supply chain monitoring. This is understandable as it is comparatively difficult and costly for companies to maintain their own trucking fleet with an optimal utilization level. Meanwhile, it is relatively easy for companies to maintain their own proprietary supply chain information system given their extensive access to in-house production and distribution information. However, it is interesting to note that on average, companies still manage close to 40% of their logistics requirements internally, based on the result of this survey.
6.01
6.09
6.14
6.45
6.5
6.59
6.75
6.77
6.8
8.11
0 1 2 3 4 5 6 7 8 9
Turkey
Mexico
Malaysia
Russia
UAE
Indonesia
India
Saudi Arabia
Brazil
China
We believe a major growth opportunity for the logistics industry is the outsourcing of companies’ logistics requirements to 3PL providers.

July 23, 2014 15
China Logistics
Figure 28: Internal and external management of logistics processes
Source: PWC Logistics in China
Most of the logistics functions that enterprises outsource are customs clearance and transport management. These are areas where the logistics companies have clear advantages due to their knowledge about the local requirements and their ability to achieve economies of scale. Meanwhile, this also shows that a lot of room exists for 3PL companies to gain outsourcing businesses from providing more complex logistics solutions (like supply chain monitoring and warehousing) to multi-national and domestic companies.
Across various key industries, the proportion of enterprises that utilize the services by contract logistics providers is still quite low. On average, this proportion is only 27% for retail consumer goods, automotive, construction and plant engineering, mechanical engineering and chemicals industries combined. Some companies suggest the key reasons for NOT outsourcing are worries 3PL operators do not comply with security or environmental requirements and that there will be leakage of knowledge and technical knowhow. We believe, over the long run, these issues can be resolved with the improving quality of 3PL providers and the rise in standard of intellectual property protection, generating excellent growth potential for contract logistics companies in China.
Figure 29: Awarding of contracts to logistics providers by industry
Source: PWC Logistics in China
23%
28%
44%
63%
35%
36%
20%
8%
36%
27%
9%
13%
6%
9%
27%
16%
0% 20% 40% 60% 80% 100%
Transport management
Customs clearance
Warehousing
Supply chain monitoring
InternalExternal,Chinese logistics companiesExternal, non-Chinese logistics companiesUnknown, n/a, does not apply to our company
*24% *36% *7% *12%
26%
24%
32%
26%
28%
72%
74%
64%
66%
70%
2%
2%
4%
8%
2%
Chemicals
Mechanical engineering
Construction, plantengineering
Automotive
Retail and consumer goods
Yes No Unknown, n/a
There is a lot of room for 3PL companies to gain outsourcing businesses from providing more complex logistics solutions (like supply chain monitoring and warehousing) to multi-national and domestic companies.

July 23, 2014 16
China Logistics
4) Rise in demand for value-added services The logistics industry has developed from offering plain vanilla transportation services (like sea and air freight forwarding) to increasingly comprehensive supply chain management services over the past 10 years. We expect the demand for even more advanced and value-added services to drive the future evolvement of the logistics ecosystem. For example, packaging, materials recycling and procurement are popular services being outsourced to external providers. There is, however, still a lot of room for logistics companies in China to extend to other services like returns management, assembly and complaints handling. In fact, these are very common services being offered by logistics companies to their customers in developed countries, but are still in their relative infancy in China.
Figure 30: Awarding of contracts to logistics providers by services
Source: PWC Logistics in China
On the storage front, one additional area of growing importance is cold chain service. According to the China Cold Chain Logistics Alliance, the market for China’s cold chain demand is expected to grow at a CAGR of 25% to CNY470bn in 2017. Specifically, cold chain services include the provision of temperature-controlled storage and distribution, refrigerated and frozen transportation, less-than-truckload transportation, food packaging services, and food quality testing and consulting services. A key type of customer cold chain logistics serves is online food sales.
Currently, online food sales account for only a small percentage of total grocery sales globally. For example, it is about 3.8% in UK. However, we think the trend will continue to rise as more advanced technologies are developed to preserve the freshness of food and produces. Several dedicated B2C e-commerce websites have been developed in China, catering specifically to online food retailing, particularly fresh foods. These include www.womai.com (我买网 ), www.sfbest.com (优选网 ), www.benlai.com (本来网), www.itruelife.com (正大天地网) etc. The rise in offline-to-online fresh food sales will mean an expansion in dedicated multi-temperature (for example, frozen/chilled/constant/normal) e-fulfillment centres and temperature-controlled delivery services. Such demand for value-added logistics services is expected to drive further boom in the logistics industry.
9%
15%
25%
28%
31%
35%
37%
43%
43%
56%
None, Unknown, n/a
Complaints handling
Assembly
Manufacturing
Returns management
Repairs and spare-parts supply
Packing
Procurement
Materials recycling
Packaging
We expect the demand for even more advanced and value-added services to drive the future evolvement of the logistics ecosystem.
The market for China’s cold chain demand is expected to grow at a CAGR of 25% to CNY470bn in 2017.

July 23, 2014 17
China Logistics
Figure 31: Cold chain logistics flow
Source: www.kelvincoldchain.com
Another area that logistics companies can expand into is on-site repair and return processing centres. According to PwC, repairs and spare parts supply and returns management are the two areas that attracted relatively low proportion of outsourcing to 3PL companies, as they are at 35% and 31% only. This is especially low when compared to 56% for packaging.
Figure 32: Potential for contract logistics providers
Source: PWC Logistics in China
On-site repair is a service logistics companies offers to a manufacturer to handle repair requests by the manufacturer’s customers. This involves the employment of skilled teams who work in the logistics facility to repair returns, defects or products under warranty period. These products are mostly consumer electronics and telecommunication products.
Returns processing, which is also referred to as ‘reverse logistics’, involves the movement in a direction backward to the supply chain network. Some 3PL providers see that up to 7% of an enterprise's gross sales are captured by return costs and the 3PL companies may realize 12% to 15% profits on this return processing business.
12%
16%
20%
23%
32%
37%
39%
40%
Sales planning
Accounting and settling accounts
Manufacturing
Order management
Complaints handling
Procurement management
Quality control
Returns management
Another area that logistics companies can expand into is on-site repair and return processing centres.

July 23, 2014 18
China Logistics
Figure 33: Reverse logistics flow
Source: ZeroWIN wiki
5) Upgrade in facility quality Although there is plenty of warehouse space in China, most is sub-quality with minimal capability of providing value-added services to cater to the growing demand for comprehensive logistics. In addition, China still lags the US significantly in terms of warehouse space. It is estimated the supply of logistics facilities per capita in the US is 5.06 sqm, some 12x more than China at just 0.41 sqm. As mentioned, much of China’s warehouse space is of inferior quality and unable to keep up with the needs of the increasingly affluent and demanding consumers in China.
Figure 34: Supply of logistics facilities in the US vs China
Source: Global Logistics Properties
According to Global Logistics Properties, out of the 550m sqm of logistics facilities in China, only 100m sqm are of modern quality. This implies over 75% of China’s warehouses do not meet modern logistics requirements and will face demolition. Modern logistics facilities normally provide large floor plates, high ceilings, enhanced safety systems and advanced IT systems, which the sub-quality facilities are unable to provide.
The current e-commerce boom has given rise to a new breed of logistics facilities. According to Jones Lang LaSalle, there are three distinct types of these logistics facilities: 1) mega e-fulfillment centres where merchandise are stocked and picked at an item level; and are either operated by the retailer or a logistics service provider on a 24/7 basis; 2) parcel hubs/sorting centres, which sort orders by zip or post codes so they can be
0.41
5.06
0.0
1.0
2.0
3.0
4.0
5.0
6.0
China US
12X
Many of China’s warehouse space is of inferior quality and unable to keep up with the needs of the increasingly affluent and demanding consumers in China.

July 23, 2014 19
China Logistics
delivered to the relevant parcel delivery centre for final delivery to the customer’s home or designated collection point; and 3) parcel delivery centres, which handle the ‘last-mile’ delivery to customers. These sophisticated and state-of-the-art facilities are not something the current huge inventory of warehouses in China can provide.
Figure 35: Types of logistics facilities
Source: Jones Lang LaSalle
Another booming trend is the rise in demand for specialized logistics facilities, for example, temperature-controlled facilities for the pharmaceutical and medical industries, and for perishable products. Sub-quality warehouses will be unable to provide customers with value-added services and cater to more complex logistics demands. As such, we envisage continued high utilization for quality facilities and expect to see further development of more comprehensive logistics centres and aggressive facilities upgrades. For example, KLN has upgraded some of its old-fashion warehouses (godowns) into cold chain storages/data centres/medical packaging facilities; and has subsequently increased the company’s return on these assets.
Another booming trend is the rise in demand for specialized logistics facilities, for example, temperature-controlled facilities for the pharmaceutical and medical industries, and for perishable products.
July 23, 2014 20
China Logistics
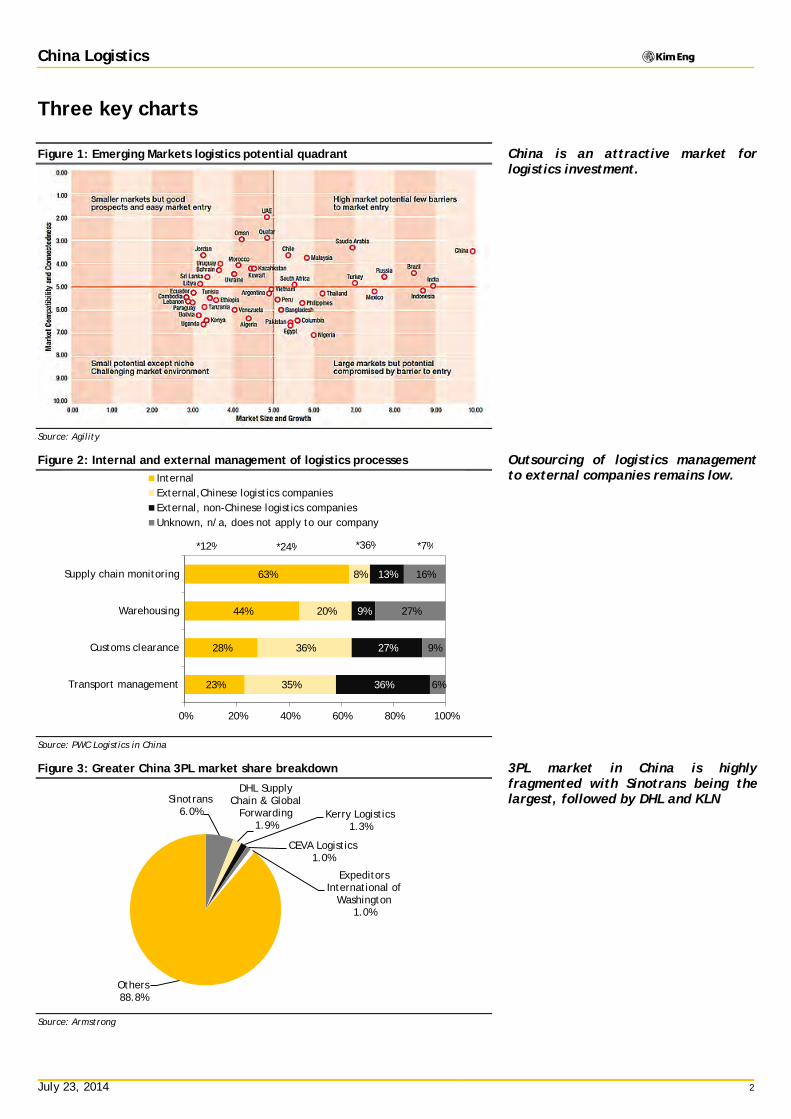
6) Expansion of China enterprises overseas Over the past five years, Chinese companies have accelerated the pace of overseas expansion. China’s overseas direct investment reached USD90b in 2013, up by a CAGR of 12.1% over this period. Key areas of China’s investment are infrastructure and railway construction, acquisitions of mining assets and installation of construction material production lines. Such moves are the results of the increase in need to secure commodities supply and the export of mature technology overseas. We believe this is a structural trend as China continues to raise its commodity demand, upgrade the technological content of its products and advance its building construction skills.
Figure 36: Key overseas investments by China corporates
Name Sector Location of investment
Amount of investment Investment highlights
598 HK Sinotrans Industrial Transportation
Dubai AED400,000 Maxx Logistics FZCO – freight forwarding warehousing
London GBP 181.5b Acquired 35% equity interests of InterBulk –Intermodal logistics services
386 HK Sinopec Oil&Gas Kazakhstan USD 1,486m Acquired 50% equity interests of CIR (Caspian Investment Resources Ltd) - company has 4 oil and gas project in Kazakhstan
Colombia USD 775m Acquired 50% of equity interests of Mansarovar (Mansarovar Energy Colombia Ltd.)
Russia USD 807m Acquired 49% equity interests of Taihu
2727 HK SH Electric
Industrial Engineering
Italy EUR 400m Acquire 40% equity interest in AEN. AEN is the largest manufacturer and related service provider in respect of power plants equipment and related parts in Italy and is also one of the leading companies worldwide in its industry.
2600 HK CHALCO Diversified Metals & Minerals
Jersey Island USD 909.69m Iron ore development in Guinea, West Africa
941 HK China Mobile
Telecommunications Thailand CNY 5.5b Subscribed 18% interest in True Corporation PCL
Pakistan USD 284m 100% equity interest of Paktel
HK HKD 22b 66% equity interests of China Resources Peoples Telephone Company Limited
1766 HK CSR Industrial Engineering
Canada CAD 167.2b Acquired 75% equity interests in Dynex Power Inc - Manufacturing and selling of power semiconductors and integrated circuit products.
Germany EUR 290m Acquired 55% of equity interest of E+M Drilling Technologies GmbH whose export contracts amounted to USD2.23b covering 80 countries and regions.
Source: Company report
One implication from this trend is the demand for project logistics, which serves the deployment of equipment and materials to the overseas investee countries. Many of these equipment and materials require specialized intermodal transportation, timely delivery of components and efficient custom clearances. We believe these are areas experienced logistics service providers can differentiate themselves from the small logistics companies. Moreover, other services including sourcing of supplies, on-site logistics arrangement, and packaging and storage are potential areas project logistics providers can serve their customers. Foreign logistics companies have extensive experience and competitive strengths in these services. However, Chinese logistics companies have definite advantages over the foreign companies as they have been co-operating with many Chinese companies in various similar domestic logistics projects. For example, Sinotrans has already completed logistics projects for numerous mainland companies, including SINOMA, CITIC Group, China North Rail, China South Rail and Metallurgical Corporation of China.
One implication from the trend of expansion of China enterprises overseas is the demand for project logistics, which serves the deployment of equipment and materials to the overseas investee countries.

July 23, 2014 21
China Logistics
7) More favourable government policies The Chinese government has been supportive of the logistics industry given the vast growth opportunities. Over the past few years, support policies have included tax cuts, the reduction in toll charges, encouraging private investment, and simplification of regulatory procedures for project approvals, financing, investment and cargo handling etc. These policies have achieved various degrees of success but there is still room to improve the industry outlook.
In 2009, the government promulgated the “Plan for the adjustment and rejuvenation of the logistics industry” but the pace and success of this programme has been less than encouraging. Since 2013, the move to replace business taxes with VAT has reduced the tax burden of some logistics and related companies. In early Jun’14, the government issued the “medium- to long-term plan for logistics industry development”, aiming at setting up a framework for the development of the industry. The key targets under the plan are to reduce logistics costs, promote the scale of logistics service providers and improve logistics infrastructure. We believe the government will continue to support the industry, which will be positive for the development of the logistics industry by accelerating the growth outlook and encouraging healthy consolidations.
We believe the government will continue to support the industry, which will be positive for the development of the logistics industry by accelerating the growth outlook and encouraging healthy consolidations.

July 23, 2014 22
China Logistics
Figure 37: Key government support policies Date Policy Key points Government policies in recent years 2009 The logistics industry restructuring and revitalization plan
《物流业调整和振兴规划》 Actively expand market demand for logistics services Promote professionalism of logistics service Encourage M&A Encourage development of international logistics and Free Trade Zones
2010 Development plan for cold chain logistics of agriculture products《农产品冷链物流发展规划》
Promote modern cold chain logistics concept and technology Perfect cold chain logistics standard system Accelerate development of 3PL enterprises in cold chain logistics Enhance infrastructure construction Accelerate equipment upgrade
2011 Development plan for commercial logistics 《商贸物流发展专项规则》
Perfect commercial logistics network geographical layout in China Strengthen logistics infrastructure construction Enhance commercial logistics innovation Promote green logistics Promote cross-border cooperation
2012 Encourage and guide private investment into logistics industry《关于鼓励和引导民间投资进入物流领域的实施意
见》
Encourage private investment in 3PL industry Improve regulatory system by improve logistics companies’ qualification
management, simplify operating procedures Reduce tax burden for private enterprises, improve financing conditions for
private enterprises as well as reform land & property policies to attract more private investment
Favorable government policies in FY13 Jan-13 Guideline for the development of city delivery
《全国城市配送发展指引》 Aim to improve efficiency through logistics operation and delivery system
upgrade. The guideline has confirmed 15 cities for pilot programme, with supporting funds granted
Apr-13 On further advancing the freight organization reform 《关于进一步推进货运组织改革的意见》
Simplify procedures for cargo handling Regulating toll charges on roads Develop door-to-door service in railway transportation, implement fixed prices
Jun-13 Notice on carrying out the e-commerce integration innovation pilot project 《关于开展电子商务集成创新试点工程工作的通知》
Enhance e-commerce and supply chain information in large enterprises Innovation in industry e-commerce platform services Cross-border e-commerce Mobile e-commerce Product information traceability
Jun-13 The 2013-2030 plan for national roadway 《国家公路网规
划(2013 年-2030 年)》 Provincial capitals distant within 1,000 km can be reached on same day. Improve the national roadway coverage area and enhance coherence. Scale of national roadway to reach 265,000 km Scale of national highway to reach 118,000 km
Aug-13 Special action program on the integration of information technology and industrialization 《工业和信息化部关于印
发信息化和工业化深度融合专项行动计划(2013-2018 年)
的通知》
Improve creative integration of in e-commerce and logistics Penetrate the use of e-commerce in key industries Promote new type of producer services with core of 3PL, e-commerce
platform
Aug-13 Plan on speeding up the Yangtze River shipping development 《交通运输部关于印发加快推进长江等内核水
运发展行动方案(2013-2020 年)的通知》
Speed up the channel construction for inland river Promote inland river transportation service upgrade enhance technology innovation and information construction elevate industry management and public service level
Sep-13 Notice on the printing of National logistics park development plan 《关于印发全国物流园区发展规划的通
知》
This is the continuation and developed plan based on the "Specific plan for national logistics standards" issued in 2009. It proposed the resource integration and rational distribution of logistics parks. Enhance information construction and services provided in logistics parks.
Nov-13 Outline for building the transportation logistics public information platform 《交通运输物流公共信息平台建设纲
要》
Aiming to launch a logistics information exchange web and web portal with nationwide coverage. Major function of this platform is for exchange and public information service.
Dec-13 Business Tax Reform to Levy VAT Pilot for Railway Transport and Postal Service Industries 《关于将铁路运输
和邮政业纳入营业税改征增殖税试点的通知 》
International cargo transportation agency services can enjoy preferential business tax, exempt from VAT.
An 11% tax rate will be adopted for railway transport and postal service industries as the railway transport industry pilot programme.
Delivery service is also under the pilot programme, enjoy a tax rate of 6%. Special region can enjoy tax refund policy(i.e. pilot bonded-zone)
Dec-13 Notice issued by the State Concil on investment projects subject to government approval《国务院关于发布政府核准
的投资项目目录的通知》
After the revision of the catalog, projects needed for central government approval has reduced by 60%. Decentralization of approval authority for transportation infrastructure such as metro communication projects, post projects, and partial railway projects, roadway projects , and container terminal projects, etc.
Source: CFLP, NDRC

July 23, 2014 23
China Logistics
Competitive market landscape The 3PL market in China is highly fragmented, with over 10,000 service providers competing against each other, based on estimates by Armstrong and Associates. Many of these companies are SMEs and only provide services in one province or are just involved in one or two business segments. In 2012, 3PL revenue for Greater China was USD126b, with Sinotrans being the largest provider (6%), followed by DHL Supply Chain & Global Forwarding (1.9%) and KLN (1.3%). Given the fragmented industry, the top five 3PL players combined accounted for just around 11% of total market share in China. Even for the express service companies with a higher industry concentration, there are still more than 8,000 express enterprises in the China, according to estimates by Deloitte.
Figure 38: Greater China 3PL market share breakdown
Source: Armstrong
The low market concentration should prompt more M&A and market consolidation. The need for higher efficiency and government policy is the supportive factor to drive a rise in industry concentration. Over the past six years, the logistics industry in China has had 248 M&A transactions with a total value of USD2.5b. The M&A peak was in 2010, with 47 deals at a total value of USD915m; while the trough was 2012 with just 25 deals and a total value of just USD193m. Both volume and value for the past three years (2011-2013) have lagged 2008-2010. However, we expect M&A to pick up going forward. Many PEs/VCs entered into the industry over the past 10 years and with the improvement in profitability of the investee companies, we see increasing opportunities for exit by these PE/VCs, providing more M&A opportunities. We also see a rise in competition, for example unit price, in China’s express market has come down by 13%, 31% and 43% for cross-region, intra-city and international deliveries. This should open more room for M&A as enterprises are keen to improve their competitive position. All in all, we foresee a rise in industry concentration to represent a positive improve on industry profitability.
Sinotrans 6.0%
DHL Supply Chain & Global
Forwarding 1.9%
Kerry Logistics 1.3%
CEVA Logistics 1.0%
Expeditors International of
Washington 1.0%
Others 88.8%
We foresee a rise in industry concentration to represent a positive improve on industry profitability.

July 23, 2014 24
China Logistics
Figure 39: M&A amount and volume of logistics industry per year
Source: China's Express Sector Development Report 2014
Stock recommendations While these trends are the main drivers for sector growth, the benefits to individual logistics companies are different. In our view, Sinotrans will reap the most given its strong China presence and significant room to upgrade services. It also has a unique edge of serving Chinese companies on project logistics as they further expand overseas.
As for China Merchants (CM), we expect its Americold JV to gain from the rise in cold chain demand in China, while its bonded port zones should also grow on the back of the increase in logistics demand. However, as their combined profit accounts for only 6.5% of FY14F earnings (the slower-growth port business makes up 77%) we believe CM has yet to turn into a full-fledged logistics player in China.
KLN’s extensive presence in the region is a competitive edge, but it will be in a weaker position compared with Sinotrans for the Chinese, especially state-owned, enterprises. KLN’s portfolio of warehouses in Hong Kong (which accounts for 26.8% of its FY14F segment profit) is likely to hold back the company from growing rapidly due to the slower earnings growth of this business.
Figure 40: Comparative benefits from the key drivers Key drivers Sinotrans CM KLN e-commerce XXX XX XXX Manufacturing relocation XXX XX XXX 3PL outsourcing XXX X XXX Value-added services XXX X XX Facility upgrades XX XX XXX China enterprises overseas expansion XXX XX X Government policies XXX XX XX Source: Maybank Kim Eng Note: XXX = Highly benefited, XX = Moderately benefited, X = Lightly benefited
Given the numerous business lines of these diversified logistics companies, we derive our target price for all of them based on their SOTP. At the current share prices, Sinotrans is trading on 22.7% discount to its FY15F SOTP value, followed by 15.4% discount for CM and 3.2% discount for KLN. In terms of PEG, Sinotrans rated the best at 0.59x, followed by 1.45x for CM and 2.15x for CM. Summing up, these valuation metrics support our preference ranks of: 1.) Sinotrans, 2.) CM and 3.) KLN.
0
10
20
30
40
50
60
0
100
200
300
400
500
600
700
800
900
1,000
2008 2009 2010 2011 2012 2013 1Q14
USD m Amount Volume
Top pick still Sinotrans and CM is an alternative play. KLN’s growth is slow and valuations stretched, initiate at HOLD
July 23, 2014 25
China Logistics
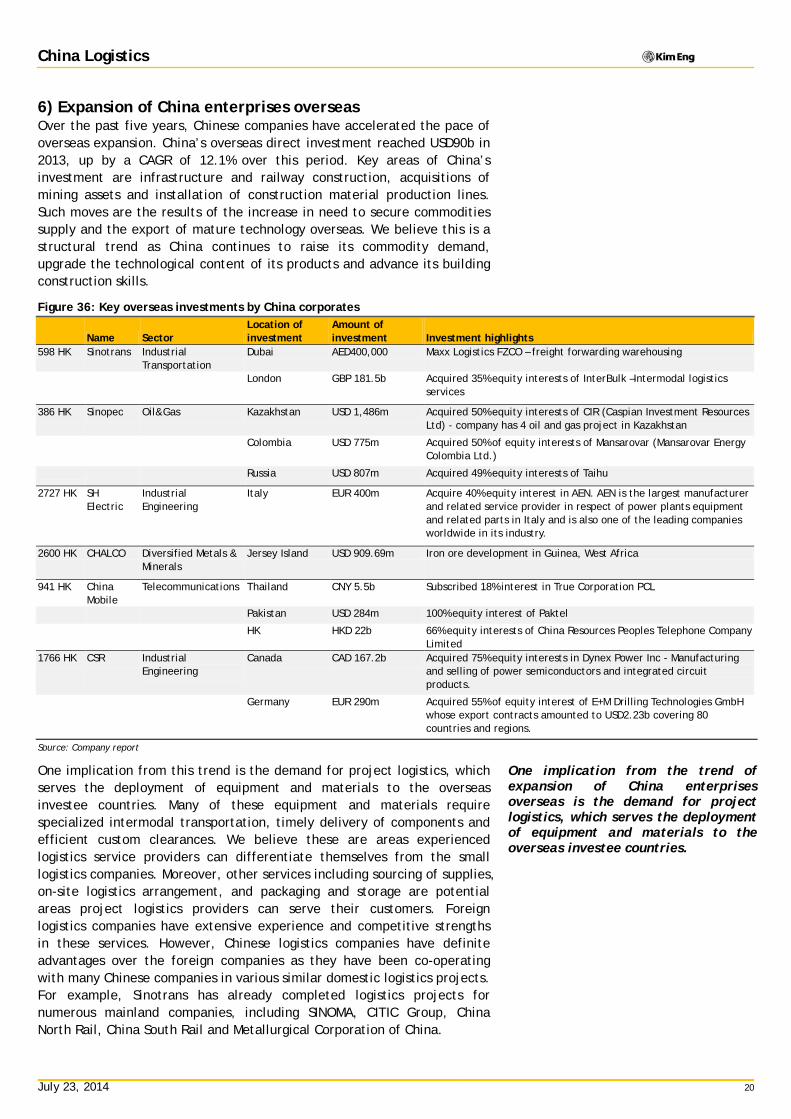
Sinotrans (0598.HK, BUY, TP HKD6.20) Sinotrans maintained its positive operational trend in the past few months, with more 3PL contract wins. Also, the business volume of most segments showed sequential improvement in 2Q14. We believe it will see increasing benefits from Haitao demand (for air freight-forwarding business) and the completion of more high-grade logistics centres (for value-added services for 3PL and storage/terminal businesses). The company is still in discussions with its parent on further asset injections, potentially translating into upside for its earnings. We forecast spectacular EPS CAGR of 27% between FY14 and FY16. Despite the huge share price outperformance this year, we find its PER of 11.3x for FY15F not expensive relative to both its earnings growth and valuations of its peers. Reiterate BUY.
CM (0144.HK, BUY, TP HKD29.80) CM’s cold chain JV and bonded port zone businesses will underpin its logistics earnings growth at a CAGR of 19% over the next two years. We project these businesses to account for 7.2% of FY15 EBIT, but this is still small relative to its port earnings (77% of FY14F total). We expect slower growth for its port business due to the loss of market share in Shenzhen and only single-digit throughput improvement in Shanghai. We expect total throughput growth of 14.7% in FY14 (driven by acquisitions made last year, or 3.6% organically) and 5.9% in FY15, driving a 7.9% YoY earnings growth in FY14 and 6.3% YoY in FY15. Based on a 12-month forward NAV for CM, we cut our target price of HKD29.80 (from HKD33.3). We think valuation is inexpensive (14.9x FY14F PER, five-year range is 11-27x) with good exposure to major ports in China and a growing overseas port portfolio. Reiterate BUY but our preference is for COSCO Pacific (1199.HK, BUY, TP HKD13.0).
KLN (0636.HK, HOLD, TP HKD12.80) KLN is a good play on the growing logistics demand in China and Asia (84% of FY14F revenue), and we forecast its FY14 margins for logistics operations to be 0.11ppt higher YoY, while international freight forwarding margins will grow 0.1ppt. However, Hong Kong warehouse profits will increase by only 5-6% in the next two years. In our view, M&A is unlikely to provide enough earnings contribution to boost its profit growth significantly. We forecast ex-exceptional earnings growth of 9.7% YoY and 11.5% YoY for FY14 and FY15. We value KLN at a target price of HKD12.80, based on 12-month forward sum-of-the-parts value, and initiate coverage at HOLD. The stock is trading at 19.9x FY15F PER, and we believe the current premium valuations have well reflected the strengths of the company. We forecast ROE of only 6.9% and 7.2% for FY14 and FY15.

July 23, 2014
Com
pany
Upd
ate
COM
PAN
Y RE
SEA
RCH
|
SEE PAGE 54 FOR IMPORTANT DISCLOSURES AND ANALYST CERTIFICATIONS
Sinotrans (598 HK)
Building further momentum Reiterate BUY w/HKD6.20 TP. We upgrade FY14-16 earnings
by 0.9%/6.7%/8.3% to reflect better outlook, lower finance costs and high interest income from placement proceeds.
Strong 3PL momentum cont’d into 2Q and margins remained good; this led to our profit upgrades for this business.
Haitao should drive air freight forwarding volume while completion of over 300,000 sqm of logistics centres will boost its competitiveness.
What’s New Operational momentum for the last few months maintained the positive trend in 1Q14, with more 3PL contract wins. Business volume at most segments exhibited accelerated growth in 2Q14 sequentially. We also expect Sinotrans to see increasing benefits from the Haitao demand (for air freight forwarding business) and the completion of more high-grade logistics centers (for value-added services for 3PL and storage/terminal business). After recently acquiring CNY901m of assets from its parent at cheap valuations, Sinotrans is still having discussions on further potential injections. The 8.41% new share placement also nets Sinotrans HKD1.68b of proceeds for future expansion with slight EPS dilution.
What’s Our View We raise our earnings forecasts for FY14-16 by 0.9%/6.7%/8.3% to incorporate better 3PL and air freight forwarding outlook, lower interest expenses from the bond issue and higher interest income from the new share placement. After taking into account our higher earnings forecasts and EPS dilution, Sinotrans is still projected to achieve a spectacular 27% EPS CAGR between FY14 and FY16. We maintain our TP of HKD6.20, based on the 12-month forward SOTP value as higher earnings are offset by more outstanding shares. Despite the huge share-price outperformance, we find its 11.3x PER FY15F not expensive relative to both its EPS growth and valuations of its peers. Reiterate BUY and forecast the company to remain CNY1.7b net cash by end-FY14.
Key Data
Share Price Performance
Maybank vs Market
Share Price: HKD4.90 MCap (USD): 2.9B Hong Kong
Target Price: HKD6.20(+27%) ADTV (USD): 8M Transport (Unchanged)BUY52w high/low (HKD)
3m avg turnover (USDm)
Free float (%)
Issued shares (m)
Market capitalization
Major shareholders:
-Sinotrans & CSC Group 55.4%
-Deutsche Post AG 13.3%
-Brandes Investment Partners LP 8.0%
5.67/1.46
4,607
46.6
HKD22.6B
8.3
50
100
150
200
250
300
350
400
450
500
550
600
0.50
1.00
1.50
2.00
2.50
3.00
3.50
4.00
4.50
5.00
5.50
6.00
Jul-12 Nov-12 Mar-13 Jul-13 Nov-13 Mar-14
Sinotrans - (LHS, HKD) Sinotrans / Hang Seng Index - (RHS, %)
1 Mth 3 Mth 12 Mth
Absolute(%) 2.1 17.5 237.9
Relative to index (%) (0.4) 12.3 204.3
Positive Neutral Negative
Market Recs 9 0 0
Maybank Consensus % +/-
Target Price (HKD) 6.20 6.20 0.0
'14 PATMI (CNYm) 1,197 1,137 5.3
'15 PATMI (CNYm) 1,592 1,330 19.7
Source: FactSet; Maybank
FYE Dec (CNY m) FY12A FY13A FY14E FY15E FY16ERevenue 47,630.2 47,930.0 46,278.1 54,964.2 62,145.6EBITDA 1,222.0 1,611.9 1,901.3 2,403.2 2,764.3Core net profit 649.1 844.5 1,136.1 1,592.3 1,901.1Core FDEPS (CNY) 0.15 0.20 0.25 0.35 0.41Core FDEPS growth(%) 1.0 30.1 24.1 40.2 19.4Net DPS (CNY) 0.02 0.05 0.07 0.09 0.10Core FD P/E (x) 25.7 19.7 15.9 11.3 9.5P/BV (x) 1.6 1.5 1.4 1.2 1.1Net dividend yield (%) 0.5 1.3 1.7 2.2 2.6ROAE (%) 6.4 7.9 9.4 11.5 12.4ROAA (%) 2.3 2.9 3.7 4.9 5.6EV/EBITDA (x) 4.9 7.2 9.6 7.9 6.8Net debt/equity (%) net cash net cash net cash net cash net cash
Osbert TK Tang, CFA(86) 21-5096 [email protected]
Tracy Liu(86) 21 5096 [email protected]

July 23, 2014 27
Sinotrans
3PL staging good momentum Management suggested that momentum of the 3PL business in 2Q14 continued its positive trend from 1Q14, which has witnessed over 20% growth in profit across various sub-divisions like contract logistics, energy logistics and chemical logistics. Revenue from its top 10 customers rose 36% YoY in 1Q14, as logistics for more products and regions are outsourced to Sinotrans, and the trailing momentum remained solid in 2Q14. Margins for 3PL also expanded on securing more lucrative projects and increasing more value-added services to customers. We hence raise our expectations for profit contribution from 3PL and forecast this will increase by 38% in FY14 and another 39% in FY15, making this division a key growth driver.
Figure 41: Examples of Sinotrans’ supply chain services
Source: Company data, Maybank Kim Eng
Figure 42: Sinotrans’ key clients for 3PL business
Source: Company data, Maybank Kim Eng

July 23, 2014 28
Sinotrans
For example, Sinotrans has achieved positive order flows for its project logistics division. In June, it won the bid for providing logistics services to Yantai Jereh Oilfield Service Group’s Petroleos de Venezuela SA (PDVSA) Project, for the former to supply oilfield equipment totaling USD190m to PDVSA. This marks an important step for Sinotrans to expand into the South American market. Also, it provided logistics services to many media and manufacturing enterprises in the 2014 FIFA World Cup. On the regional front, Sinotrans Logistics Hong Kong — the subsidiary focused on South-East Asian markets — has experienced strong profit performance YTD. This indicates further success in its expansion outside China; and we expect the growth trend to remain solid as China’s intra-Asia trade ties continue to advance.
Figure 43: Sinotrans’ project logistics business Industry Projects
Infrastructure Construction
CITIC Construction Co., Ltd's expressway project in Algeria CITIC Construction Co., Ltd's social housing project in Angola CITIC Construction Co., Ltd's RED project in Angola China Overseas Engineering Co., Ltd's municipal facilities and stadium project in Bata City China WuYi Co., Ltd project in Kenya
Building Materials
Sinoma International Engineering Co., Ltd and Southern Province Cement Co.Ltd (SPCC)'s cement project in Saudi Arabia Nanjing Cement Design and Research Institute and Nigeria Dangote's IBESE/Obajana cement project Sinoma-Suzhou's Iraq Sulaymaniyah Cement Plant(SCP) cement project Sinoma International Engineering Co., Ltd's Ethiopia Dangote cement project
Railway Vehicle
China North Rail Co., Ltd's Hong Kong subway project China South Rail, Co., Ltd's Saudi Arabia wagon project China South Rail Co., Ltd's Australia wagon project China South Rail Co., Ltd's United Arab Emirates wagon project
Metallurgy
China Metallurgical Group Corporation’s Ramu nickel cobalt project in Papua New Guinea China Metallurgical Group Corporation’s Afghan Aynat copper mine project Capital Engineering & Research Incorporation Ltd.’s Iran Ardakan steel-making plant project CITIC International Cooperation Co., Ltd. and ThyssenKrupp CSA Siderurgica do Atlantico Ltda (CSA)'s carbonization project in Brazil
Mining
China-Union (Hong Kong) Ming Co., Ltd. (WISCO as shareholder) Liberia Bong mines project Mitsubishi Brazil fresh water valley mines project
Source: Company data, Maybank Kim Eng
Potential upside from strong air freight We think there is upside potential for Sinotrans’ air freight forwarding business. Its air freight forwarding volume increased 16.7% YoY in 5M14. Traditionally, Sinotrans uses its 64.3%-owned subsidiary Sinoair as the primary air freight forwarding sales network but it has now expanded to include its own network to sell Sinoair’s services. Besides, we believe the strong growth is partly driven by the increase in demand from Haitao. Sinotrans is exploring more speedy custom clearance arrangements for Haitao products and this should strengthen its competitiveness in this area.

July 23, 2014 29
Sinotrans
Figure 44: 5M14 operating performance vs 1Q14 Business segment (YoY volume growth) 5M14 1Q14 Freight forwarding - Sea (TEU) 5.1% 4.9% Air (tonnes) 16.7% 19.3% Shipping agency - Vessel calls 1.8% 1.7% Tonnage (m) 8.8% 9.2% Containers handled (m TEUs) 5.2% 1.6% Bulk cargo (m tonnes) 6.2% 10.4% Container yards - Containers (m TEUs) 1.5% -1.6% Bulk cargo (m tonnes) -0.4% -5.8% Terminal throughput - Containers (m TEUs) 0.1% -3.7% Bulk cargo (m tonnes) -3.6% 1.5% Marine transportation - Volume (m TEUs) 7.6% 3.2% Trucking - Volume (m TEUs) 22.9% 26.6% Source: Company data
For FY14, Sinotrans has budgeted capex of CNY2.4b and 68% of it to be invested in logistics infrastructure and storage/terminal. It will expand its current portfolio of logistics centres and we expect more logistics centres will be constructed to cater to the growing e-commerce demand. Currently, it has over 300,000 sqm of logistics centres under construction, with logistics facilities in Shenyang, Jinan, Weifang and Shenzhen Pinghu to be completed this year. Other bonded warehouses/logistics centres to be completed next year include those in Tianjin, Chongqing, Chengdu, Anhui and Changzhou. As more sophisticated facilities are built out, we believe Sinotrans will be able to offer more value-added services; realizing higher yield and margin for both its 3PL business and storage/terminal division.
Figure 45: Locations of contract logistics centers
Source: Company data
July 23, 2014 30
Sinotrans
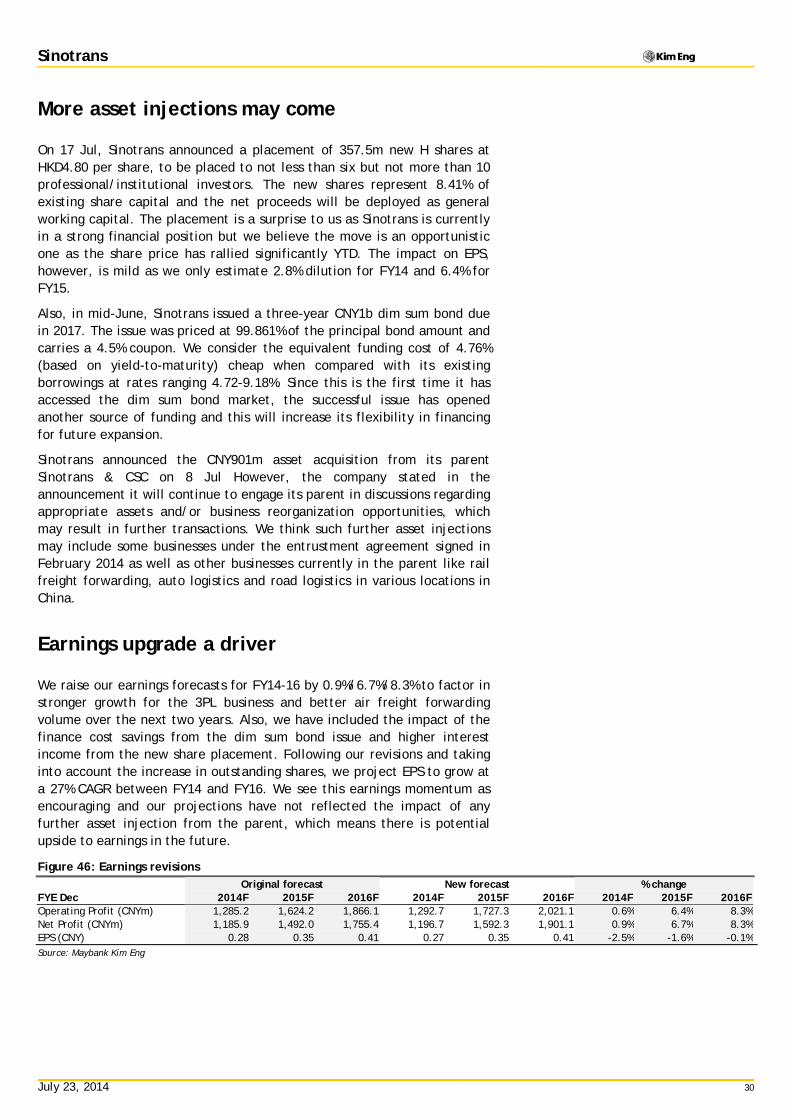
More asset injections may come On 17 Jul, Sinotrans announced a placement of 357.5m new H shares at HKD4.80 per share, to be placed to not less than six but not more than 10 professional/institutional investors. The new shares represent 8.41% of existing share capital and the net proceeds will be deployed as general working capital. The placement is a surprise to us as Sinotrans is currently in a strong financial position but we believe the move is an opportunistic one as the share price has rallied significantly YTD. The impact on EPS, however, is mild as we only estimate 2.8% dilution for FY14 and 6.4% for FY15.
Also, in mid-June, Sinotrans issued a three-year CNY1b dim sum bond due in 2017. The issue was priced at 99.861% of the principal bond amount and carries a 4.5% coupon. We consider the equivalent funding cost of 4.76% (based on yield-to-maturity) cheap when compared with its existing borrowings at rates ranging 4.72-9.18%. Since this is the first time it has accessed the dim sum bond market, the successful issue has opened another source of funding and this will increase its flexibility in financing for future expansion.
Sinotrans announced the CNY901m asset acquisition from its parent Sinotrans & CSC on 8 Jul However, the company stated in the announcement it will continue to engage its parent in discussions regarding appropriate assets and/or business reorganization opportunities, which may result in further transactions. We think such further asset injections may include some businesses under the entrustment agreement signed in February 2014 as well as other businesses currently in the parent like rail freight forwarding, auto logistics and road logistics in various locations in China.
Earnings upgrade a driver We raise our earnings forecasts for FY14-16 by 0.9%/6.7%/8.3% to factor in stronger growth for the 3PL business and better air freight forwarding volume over the next two years. Also, we have included the impact of the finance cost savings from the dim sum bond issue and higher interest income from the new share placement. Following our revisions and taking into account the increase in outstanding shares, we project EPS to grow at a 27% CAGR between FY14 and FY16. We see this earnings momentum as encouraging and our projections have not reflected the impact of any further asset injection from the parent, which means there is potential upside to earnings in the future.
Figure 46: Earnings revisions
Original forecast New forecast % change FYE Dec 2014F 2015F 2016F 2014F 2015F 2016F 2014F 2015F 2016F Operating Profit (CNYm) 1,285.2 1,624.2 1,866.1 1,292.7 1,727.3 2,021.1 0.6% 6.4% 8.3% Net Profit (CNYm) 1,185.9 1,492.0 1,755.4 1,196.7 1,592.3 1,901.1 0.9% 6.7% 8.3% EPS (CNY) 0.28 0.35 0.41 0.27 0.35 0.41 -2.5% -1.6% -0.1% Source: Maybank Kim Eng

July 23, 2014 31
Sinotrans
Figure 47: Profit by segment Division (CNY m) 2012 2013 2014F 2015F 2016F Freight forwarding 568.2 715.1 878.3 1,198.3 1,408.1 Shipping agency 278.8 277.2 273.1 289.0 293.5 Marine transportation -257.5 -37.6 -2.4 0.0 0.0 Storage and terminals 339.2 321.4 341.2 407.2 470.5 Others -3.6 14.5 23.2 37.0 49.9 Segment result 925.1 1,290.5 1,513.4 1,931.6 2,222.0 Other gains/(losses), net -18.5 -90.0 20.6 -14.6 -1.7 Corporate expenses -223.7 -172.0 -180.7 -189.6 -199.2 Finance expenses, net -196.2 -195.9 -180.6 -102.3 -36.9 Associates 746.5 653.8 776.2 862.2 931.4 Pre-tax profit 1,233.2 1,486.4 1,949.0 2,487.2 2,915.6 Taxation -322.4 -335.7 -428.8 -547.2 -641.4 Profit for continued operations 910.8 1,150.6 1,520.2 1,940.0 2,274.2 Minority interests -261.8 -306.2 -323.5 -347.7 -373.1 Net profit 649.1 844.5 1,196.7 1,592.3 1,901.1 % Change 1.0% 30.1% 41.7% 33.1% 19.4% Source: Company data, Maybank Kim Eng
On the back of our raised earnings forecasts and the dilution from the new shares, we maintain our target price at HKD6.20, which is based on the 12-month forward sum-of-the-parts value. Despite the sharp share price outperformance, Sinotrans now trades at 15.9x FY14F PER, but this will fall to 11.3x for FY15 which we think is inexpensive. The current PER valuation is well within its historical 4-33x range since listing in FY03 and as we project record earnings for FY15, we believe it is justified for the multiple to return to the high end of the range.
Figure 48: SOTP valuation
Basis for
FY14 Value FY14 Per Share % of FY15 Value FY15 Per Share % of
Business segment valuation Multiple (CNY m) value (CNY) total (CNY m) value (CNY) total Freight forwarding PER 15.0x 8,946.4 1.94 42.7% 9,347.7 2.03 40.7% Express services PER 12.0x 5,243.8 1.14 25.0% 5,480.9 1.19 23.8% Shipping agency PER 8.0x 1,750.9 0.38 8.4% 1,857.7 0.40 8.1% Storage and terminals PER 11.0x 2,641.8 0.57 12.6% 3,217.9 0.70 14.0% Trucking and others PER 9.0x 640.2 0.14 3.1% 887.1 0.19 3.9% Net cash/(debt) 1,718.7 0.37 8.2% 2,194.0 0.48 9.5% Total asset value
20,941.8 4.55 100.0% 22,985.3 4.99 100.0%
No. of shares outstanding (m)
4,606.5
4,606.5
Per share value (CNY)
4.55
4.99 Per share value (HKD)
5.73
6.34
Current share price (HKD)
4.90
4.90 Premium/(Discount) %
-14.5%
-22.7%
Source: Maybank Kim Eng

July 23, 2014 32
Sinotrans
Figure 49: 12-month forward PER band Figure 50: 12-month forward P/BV multiple
Source: Bloomberg, Maybank Kim Eng Source: Bloomberg, Maybank Kim Eng
Figure 51: Logistics peer valuation comparison
Closing Closing Market Cap. P/E P/BV Div Yield
Ticker Company Name Currency 07/22/2014 USD (m) 2014F 2015F 2014F 2015F 2014F 2015F UPS-US United Parcel Service Inc USD 104.48 73,782 20.6 17.7 14.1 13.3 2.5% 2.7% FDX-US Fedex Corp USD 153.29 43,752 17.4 14.4 2.7 2.3 0.5% 0.6% DPW-DE Deutsche Post AG EUR 25.285 41,192 15.0 13.4 2.8 2.6 3.4% 3.8% KNIN-CH Kuehne & Nagel Intl CHF 121.3 16,134 22.4 20.5 5.8 5.4 3.7% 3.9% CHRW-US C.H. Robinson Worldwide Inc USD 65.96 9,790 23.0 20.8 10.2 9.7 2.2% 2.3% TNTE-NL TNT Express NV EUR 6.43 4,728 19.9 14.1 1.4 1.3 1.9% 2.8% PWTN-CH Panalpina Welt AG CHF 132 3,475 29.8 21.7 4.2 3.7 1.9% 2.4% TOL-AU Toll Hldgs Ltd AUD 5.42 3,650 13.7 13.3 1.4 1.4 5.1% 5.3% 636-HK Kerry Logistics Network HKD 12.74 2,779 22.1 19.9 1.5 1.4 1.0% 1.1% 598 HK Sinotrans Limited HKD 4.90 1,130 15.9 11.3 1.4 1.2 1.7% 2.2% Average
20.0 16.7 4.6 4.2 2.4% 2.7%
Source: FactSet, Maybank Kim Eng
0
1
2
3
4
5
6
7
Jan 04 Sep 05 Jun 07 Mar 09 Nov 10 Aug 12 May 14
14x
6x
8x
10x 12x
16x
0.0
0.5
1.0
1.5
2.0
2.5
3.0
Jan 04 Jul 05 Jan 07 Jul 08 Jan 10 Jul 11 Jan 13 Jul 14
P/B Average +1SD -1SD

July 23, 2014 33
Sinotrans
FYE 31 Dec FY12A FY13A FY14E FY15E FY16EKey MetricsP/E (reported) (x) 25.7 19.7 14.4 11.3 9.5Core P/E (x) 25.7 19.7 15.2 11.3 9.5Core FD P/E (x) 25.7 19.7 15.9 11.3 9.5P/BV (x) 1.6 1.5 1.4 1.2 1.1P/NTA (x) na na na na naNet dividend yield (%) 0.5 1.3 1.7 2.2 2.6FCF yield (%) nm nm 0.3 1.4 3.2EV/EBITDA (x) 4.9 7.2 9.6 7.9 6.8EV/EBIT (x) 8.7 11.4 14.2 11.0 9.3
INCOME STATEMENT (CNY m)Revenue 47,630.2 47,930.0 46,278.1 54,964.2 62,145.6Gross profit 1,279.3 1,552.1 1,842.8 2,304.9 2,627.6EBITDA 1,222.0 1,611.9 1,901.3 2,403.2 2,764.3Depreciation (455.7) (489.0) (567.2) (632.4) (697.6)Amortisation (83.4) (94.4) (41.3) (43.4) (45.6)EBIT 682.9 1,028.4 1,292.7 1,727.3 2,021.1Net interest income /(exp) (196.2) (195.9) (180.6) (102.3) (36.9)Associates & JV 746.5 653.8 776.2 862.2 931.4Exceptionals 0.0 0.0 60.6 0.0 0.0Other pretax income 0.0 0.0 0.0 0.0 0.0Pretax profit 1,233.2 1,486.4 1,949.0 2,487.2 2,915.6Income tax (322.4) (335.7) (428.8) (547.2) (641.4)Minorities (261.8) (306.2) (323.5) (347.7) (373.1)Discontinued operations 0.0 0.0 0.0 0.0 0.0Reported net profit 649.1 844.5 1,196.7 1,592.3 1,901.1Core net profit 649.1 844.5 1,136.1 1,592.3 1,901.1
BALANCE SHEET (CNY m)Cash & Short Term Investments 6,372.5 6,281.3 7,063.3 4,413.2 4,072.7Accounts receivable 8,019.4 7,865.6 7,607.4 9,035.2 10,215.7Inventory 53.4 60.3 63.4 75.3 85.1Property, Plant & Equip (net) 6,367.4 7,106.6 8,667.8 9,685.4 10,637.8Intangible assets 97.0 109.8 89.5 68.1 45.6Investment in Associates & JVs 3,347.8 3,305.1 3,693.2 4,124.3 4,590.0Other assets 5,030.9 5,166.1 5,147.5 5,339.7 5,493.7Total assets 29,288.3 29,894.8 32,332.0 32,741.1 35,140.6ST interest bearing debt 2,832.0 1,402.4 125.4 38.7 38.7Accounts payable 7,619.3 7,855.2 7,607.4 9,035.2 10,215.7LT interest bearing debt 2,844.9 4,344.6 5,219.2 2,180.5 1,141.8Other liabilities 3,264.4 2,874.9 3,323.0 3,788.9 4,170.4Total Liabilities 16,560.6 16,477.1 16,275.0 15,043.3 15,566.6Shareholders Equity 10,362.2 10,925.0 13,240.8 14,534.0 16,037.0Minority Interest 2,365.5 2,492.7 2,816.2 3,163.9 3,537.0Total shareholder equity 12,727.7 13,417.7 16,057.0 17,697.9 19,574.0
CASH FLOW (CNY m)Pretax profit 1,233.2 1,486.4 1,949.0 2,487.2 2,915.6Depreciation & amortisation 539.1 583.5 608.5 675.8 743.2Adj net interest (income)/exp 216.9 219.5 164.1 84.0 16.7Change in working capital (264.7) 365.4 453.1 239.8 194.6Cash taxes paid (309.1) (352.2) (428.8) (547.2) (641.4)Other operating cash flow (1,034.3) (683.7) (452.7) (514.5) (558.3)Cash flow from operations 62.1 1,013.9 1,698.0 1,903.5 2,219.1Capex (1,316.3) (1,387.4) (1,650.0) (1,650.0) (1,650.0)Free cash flow (1,254.2) (373.5) 48.0 253.5 569.1Dividends paid (42.5) (127.5) (212.5) (299.2) (398.1)Equity raised / (purchased) 0.0 0.0 1,331.6 0.0 0.0Change in Debt 1,473.5 85.6 (402.4) (3,125.4) (1,038.7)Other invest/financing cash flow (96.0) 119.9 17.3 521.0 527.2Effect of exch rate changes (7.5) (23.2) 0.0 0.0 0.0Net cash flow 73.3 (318.7) 782.0 (2,650.1) (340.5)
July 23, 2014 34
Sinotrans
FYE 31 Dec FY12A FY13A FY14E FY15E FY16EKey RatiosGrowth ratios (%)Revenue growth 8.4 0.6 (3.4) 18.8 13.1EBITDA growth (11.3) 31.9 18.0 26.4 15.0EBIT growth (21.2) 50.6 25.7 33.6 17.0Pretax growth 4.5 20.5 31.1 27.6 17.2Reported net profit growth 1.0 30.1 41.7 33.1 19.4Core net profit growth 1.0 30.1 34.5 40.2 19.4
Profitability ratios (%)EBITDA margin 2.6 3.4 4.1 4.4 4.4EBIT margin 1.4 2.1 2.8 3.1 3.3Pretax profit margin 2.6 3.1 4.2 4.5 4.7Payout ratio 13.1 25.2 25.0 25.0 25.0
DuPont analysisNet profit margin (%) 1.4 1.8 2.6 2.9 3.1Revenue/Assets (x) 1.6 1.6 1.4 1.7 1.8Assets/Equity (x) 2.8 2.7 2.4 2.3 2.2ROAE (%) 6.4 7.9 9.4 11.5 12.4ROAA (%) 2.3 2.9 3.7 4.9 5.6
Liquidity & EfficiencyCash conversion cycle 2.8 0.0 (2.0) (1.9) (2.0)Days receivable outstanding 55.7 59.7 60.2 54.5 55.8Days inventory outstanding 0.5 0.4 0.5 0.5 0.5Days payables outstanding 53.4 60.1 62.6 56.9 58.2Dividend cover (x) 7.6 4.0 4.0 4.0 4.0Current ratio (x) 1.2 1.3 1.5 1.2 1.1
Leverage & Expense AnalysisAsset/Liability (x) 1.8 1.8 2.0 2.2 2.3Net debt/equity (%) net cash net cash net cash net cash net cashNet interest cover (x) 3.5 5.3 7.2 16.9 54.8Debt/EBITDA (x) 4.6 3.6 2.8 0.9 0.4Capex/revenue (%) 2.8 2.9 3.6 3.0 2.7Net debt/ (net cash) (695.5) (534.3) (1,718.7) (2,194.0) (2,892.2)

July 23, 2014
Com
pany
Upd
ate
COM
PAN
Y RE
SEA
RCH
|
SEE PAGE 54 FOR IMPORTANT DISCLOSURES AND ANALYST CERTIFICATIONS
China Merchants Holdings (144 HK)
An alternative logistics play Reiterate BUY, but lower TP to HKD29.80. CM has quality port
exposure and steady earnings but prefer COSCO Pacific for cheaper valuations and stronger growth.
CM’s logistics business is forecast to grow at a 19% CAGR in FY14-15 to account for 7.2% of its total EBIT next year.
We expect organic throughput to increase 3.6% in FY14 due to the heavy exposure to Shanghai and Shenzhen.
What’s New Driven by cold chain demand and the build-out of additional distribution centres, we expect strong momentum for CM’s logistics business in FY14-16. Coupled with contribution from bonded port zones, we forecast logistics earnings to grow at a 19% CAGR. However, this will be offset by slower growth in the port business due to market-share loss in Shenzhen and single-digit throughput improvement in Shanghai. Organic throughput growth in 1H14 is a mediocre 3.8%, slightly below management’s full-year guidance of 5%. We expect 14.7% total throughput growth in FY14 (driven by acquisitions last year, or 3.6% organically) and 5.9% in FY15.
What’s Our View We lower our earnings forecasts for CM by 4.3% for FY14, 4.5% for FY15 and 4.5% for FY16 to factor in the weaker-than-expected container throughput in western Shenzhen and we now expect core earnings to increase 7.9% in FY14 and 6.3% in FY15. We project its logistics business will experience solid growth but its contribution will still be small in the next two years. We lower our target price to HKD29.80 (from HKD33.3), based on 12-month forward NAV to reflect the impact of our new earnings forecasts and lower share prices of its holdings in listed equities (SIPG, Shenzhen Chiwan, CIMC etc). We reiterate BUY as we think the valuation is inexpensive (14.9x PER for FY14F, five-year range 11-27x) for this counter with good exposure to major ports in China and a growing overseas port portfolio but we prefer CP.
Key Data
Share Price Performance
Maybank vs Market
Share Price: HKD25.50 MCap (USD): 8.3B Hong Kong
Target Price: HKD29.80(+17%) ADTV (USD): 21M Transport (Unchanged)BUY52w high/low (HKD)
3m avg turnover (USDm)
Free float (%)
Issued shares (m)
Market capitalization
Major shareholders:
-China Merchants Group 54.8%
-Davis Selected Advisers LP 5.0%
-Capital Research & Management Co. 2.2%
29.75/22.75
2,527
44.9
HKD64.4B
20.9
75
80
85
90
95
100
105
110
115
120
21.0
22.0
23.0
24.0
25.0
26.0
27.0
28.0
29.0
30.0
Jul-12 Nov-12 Mar-13 Jul-13 Nov-13 Mar-14
China Merchants - (LHS, HKD) China Merchants / Hang Seng Index - (RHS, %)
1 Mth 3 Mth 12 Mth
Absolute(%) 5.6 1.4 9.4
Relative to index (%) 3.0 (3.1) (1.4)
Positive Neutral Negative
Market Recs 12 2 0
Maybank Consensus % +/-
Target Price (HKD) 29.80 31.20 (4.5)
'14 PATMI (HKDm) 4,551 4,651 (2.1)
'15 PATMI (HKDm) 4,837 5,244 (7.8)
Source: FactSet; Maybank
FYE Dec (HKD m) FY12A FY13A FY14E FY15E FY16ERevenue 11,022.1 7,758.0 7,202.1 8,016.2 8,668.4EBITDA 5,006.4 4,119.6 3,947.0 4,128.8 4,527.4Core net profit 3,372.3 4,007.2 4,325.5 4,588.8 5,373.5Core EPS (HKD) 1.35 1.59 1.71 1.82 2.13Core EPS growth (%) (14.6) 17.3 7.8 6.1 17.1Net DPS (HKD) 0.70 0.77 0.83 0.88 1.03Core P/E (x) 18.8 16.1 14.9 14.0 12.0P/BV (x) 1.4 1.3 1.3 1.2 1.1Net dividend yield (%) 2.7 3.0 3.2 3.5 4.0ROAE (%) 7.6 8.5 8.7 8.8 9.7ROAA (%) 4.1 4.8 4.7 4.7 5.3EV/EBITDA (x) 16.6 22.6 19.6 18.8 16.8Net debt/equity (%) 28.6 28.1 8.4 7.1 2.3
Osbert TK Tang, CFA(86) 21-5096 [email protected]
Tracy Liu(86) 21 5096 [email protected]

July 23, 2014 36
China Merchants Holdings
Growing earnings from logistics CM has been actively growing its logistics exposure over the last few years. Its logistics businesses include the bonded port zones in western Shenzhen, Qingdao and Tianjin and the cold chain JV with Americold. In western Shenzhen, it has 263,000 sqm of warehouse space and will add another 130,000 sqm in FY14. The bonded trade zones offer integrated value-added services to customers and provide platforms for them to set-up regional distribution centres.
The Americold JV is 51% owned by CM and 49% by Americold. The JV has a network of 13 temperature-controlled distribution centres in 11 cities. With total storage area of over 147,000 sqm, it provides services including deliveries for a wide range of temperature-sensitive goods (vegetables, meat, dairy produce, drugs, etc).
CM generated 5.6% of its EBIT in FY13 from its logistics business, and we expect this to grow 18% in FY14 and another 20% in FY15 on the back of the strong demand. The Americold JV plans to add new distribution centres in China to build up a nationwide logistics network. In our view, this should drive the medium-term earnings outlook for CM’s logistics division.
Figure 52: Location of Americold cold storages
Source: Company data
Port growth still expected to be slow We expect CM’s port earnings to account for 77% of the total in FY14 and 74% in FY15, meaning the port business will continue to be the most important driver for its profits. Overall container throughput increased 18.1% YoY in 1H14, or 3.8% on an organic basis; this is 2.2ppts below our full-year forecast growth rate of 6%. The weaker-than-expected throughput is due to a loss in market share in Shenzhen caused by adjustments in port calls by its shipping line customers and also a sharp decline in throughput at its domestic container ports at CMPS & Haixing in

July 23, 2014 37
China Merchants Holdings
western Shenzhen. Despite a pick-up in throughput in Shanghai, it is still unable to offset the 7.4% YoY drop in western Shenzhen in 1H14.
We forecast total overseas throughput to increase 130.9% YoY in FY14, thanks to the first full-year contribution from Terminal Link acquired last year and the completion of two additional berths in Colombo. However, we expect earnings contribution from overseas ports will be just 5% this year and 4.5% in FY15. In terms of geographical exposure, Shenzhen and Shanghai will still account for 55% of FY14F throughput on an attributable basis. It is because of such significant exposure to these mature ports that we expect organic throughput growth for FY14 and FY15 to be 3.6% and 5.9%, capping upside to overall earnings momentum.
Figure 53: Throughput performance
YoY
YoY
YoY
YoY
YoY
Container (m TEUs) FY12 % Change FY13 % Change FY14F % Change FY15F % Change FY16F % Change Mega SCT 4.52 10.8% 4.28 -5.2% 4.54 6.0% 4.67 3.0% 4.86 4.0% CCT and Mawan 5.31 -8.3% 5.35 0.6% 4.81 -10.0% 4.91 2.0% 5.05 3.0% CM Port Services and Haixing 1.76 8.3% 1.76 0.3% 1.32 -25.0% 1.34 1.6% 1.38 2.8% CM Port Services 1.34 11.7% 1.34 0.3% 1.01 -25.0% 1.04 3.0% 1.07 3.0% Haixing 0.42 -1.4% 0.42 0.3% 0.31 -25.0% 0.30 -3.0% 0.31 2.0% Western Shenzhen 11.59 0.8% 11.39 -1.7% 10.67 -6.3% 10.92 2.4% 11.29 3.4% CKRTT 1.12 23.0% 1.19 6.3% 1.25 5.0% 1.31 5.0% 1.38 5.0% Pearl River Delta ex-Hong Kong 12.70 2.4% 12.58 -1.0% 11.92 -5.2% 12.23 2.6% 12.67 3.6% Hong Kong ports 5.44 -10.6% 5.90 8.5% 6.51 10.3% 6.71 3.1% 6.92 3.1% Ningbo Daxie 1.92 9.9% 2.07 7.5% 2.37 15.0% 2.51 5.5% 2.61 4.0% SIPG 32.53 2.5% 33.62 3.3% 35.30 5.0% 37.06 5.0% 38.91 5.0% Yangtze River Delta 34.45 2.9% 35.68 3.6% 37.67 5.6% 39.57 5.0% 41.52 4.9% Tianjin 2.18 3.8% 2.30 5.6% 2.47 7.5% 2.55 3.0% 2.62 3.0% Qingdao 4.30 107.5% 5.23 21.5% 5.23 0.0% 5.60 7.0% 5.87 5.0% Zhanjiang 0.31 -1.9% 0.31 -0.2% 0.43 40.0% 0.46 5.0% 0.48 5.0% Zhangzhou 0.43 -2.7% 0.56 30.8% 0.45 -20.0% 0.49 10.0% 0.53 8.0% Other mainland ports 7.22 46.5% 8.40 16.3% 8.59 2.2% 9.09 5.9% 9.51 4.6%
Taiwan - Kaohsiung 0.00 N/A 1.17 N/A 1.35 15.0% 1.62 20.0% 1.86 15.0% Sir Lanka - Colombo 0.00 N/A 0.06 N/A 0.60 916.9% 1.20 100.0% 1.50 25.0% Nigeria - Lagos 0.40 4.5% 0.47 18.2% 0.47 1.0% 0.48 1.0% 0.48 1.0% Djibouti - Djibouti City 0.00 N/A 0.74 N/A 0.99 35.0% 1.07 8.0% 1.16 8.0% Terminal Link 0.00 N/A 3.65 N/A 10.63 191.4% 11.16 5.0% 11.72 5.0% Togo - Lome Container Terminal 0.00 N/A 0.00 N/A 0.00 N/A 0.20 N/A 0.50 N/A Overseas ports 0.40 4.5% 6.08 1439.2% 14.04 130.9% 15.72 12.0% 17.22 9.5%
Total for CMH ports 60.21 5.1% 68.64 14.0% 78.73 14.7% 83.33 5.9% 87.84 5.4%
YoY
YoY
YoY
YoY
YoY Bulk cargo (m tonnes) FY12 % Change FY13 % Change FY14F % Change FY15F % Change FY16F % Change CM Port Services and Haixing 26.1 0.1% 28.0 7.0% 19.6 -30.0% 20.5 5.0% 21.4 4.0% Chiwan 6.5 0.0% 7.1 8.0% 6.5 -8.0% 6.8 5.0% 7.2 5.0% Dongguan 4.2 53.2% 5.2 25.0% 9.1 75.0% 9.8 8.0% 10.4 6.0% CKRTT 0.7 6.4% 0.7 1.5% 0.5 -25.0% 0.5 2.0% 0.5 2.0% Western Shenzhen/PRD 37.5 4.2% 40.9 9.1% 35.7 -12.8% 37.7 5.7% 39.5 4.7%
SIPG 184.6 3.5% 204.0 10.5% 196.9 -3.5% 206.7 5.0% 217.1 5.0% Zhanjiang 68.3 -6.9% 68.1 -0.2% 77.9 14.4% 81.8 5.0% 85.9 5.0% Zhangzhou 8.7 2.8% 9.6 10.3% 9.9 3.0% 10.2 3.0% 10.5 3.0% Qingdao - QQCTU 28.0 -1.5% 22.4 -20.0% 14.5 -35.0% 15.4 6.0% 16.0 4.0% Qingdao - Dongjiakou 0.0 N/A 0.0 N/A 24.1 N/A 26.0 8.0% 27.8 7.0% Djibouti - Djibouti City 0.0 N/A 3.6 N/A 4.0 10.0% 4.4 10.0% 4.6 5.0% Other mainland ports 289.5 0.3% 307.8 6.3% 327.3 6.4% 344.6 5.3% 362.0 5.0%
Total for CM ports 327.0 0.8% 348.7 6.6% 363.0 4.1% 382.3 5.3% 401.4 5.0% Source: Company data, Maybank Kim Eng

July 23, 2014 38
China Merchants Holdings
Figure 54: Container throughput breakdown
Source: Maybank Kim Eng
EPS dilution will cap upside We lower our FY14-FY16 earnings to factor in the latest throughput performance and now expect core earnings growth of 7.9% for this year and 6.3% for next. While CM is growing earnings from its logistics business, particularly cold chain, we expect the momentum of its bottom line to still rely mostly on the port business, hence earnings growth will remain moderate in the next two years.
Figure 55: Earnings revisions
Original forecast New forecast % change FYE Dec 2014F 2015F 2016F 2014F 2015F 2016F 2014F 2015F 2016F Revenue (HKD m) 8,025.8 9,004.3 9,706.0 7,202.1 8,016.2 8,668.4 -10.3% -11.0% -10.7% Net Profit (HKD m) 4,754.3 5,066.4 5,909.9 4,551.0 4,836.8 5,646.4 -4.3% -4.5% -4.5% EPS (HKD) 1.88 2.01 2.34 1.80 1.91 2.23 -4.3% -4.5% -4.5% Source: Maybank Kim Eng
We lower our 12-month forward NAV-based target price to HKD29.80 (from HKD33.30) to reflect the impact of our earnings changes and lower share prices of its equity holdings (including SIPG, Shenzhen Chiwan, CIMC etc). The stock is trading at 14.9x PER for FY14, which is not stretched relative to its historical 11-27x trading range in our view. We maintain our BUY rating for this quality name which has exposure to major port areas in China. However, we are concerned about the dilution when the Mandatory Convertible Securities are converted in FY16. As such, we continue to prefer COSCO Pacific (1199.HK, BUY, TP 13.00) due to its cheap multiples, stronger EPS outlook and better financial position despite its lack of logistics angle following its disposal of a 49% stake in COSCO Logistics in 2010.
Western Shenzhen
24.6%
Hong Kong 7.2%
Yangtze River Delta 33.8%
Qingdao 9.1%
Tianjin 1.2%
PRD (ex-Shenzhen) &
Fujian 2.4%
Overseas 21.7%

July 23, 2014 39
China Merchants Holdings
Figure 56: Net asset value breakdown
Basis for FY14 Per share % of FY15 Per share % of
Asset Valuation NAV (HKDm) Value (HKD) Total NAV (HKDm) Value (HKD) Total Industrial manufacturing
10,402.9 4.12 14.1% 10,402.9 4.12 13.7%
25% stake in CIMC Market value 10,402.9 4.12 14.1% 10,402.9 4.12 13.7%
Cargo handling and container terminals
83,026.1 32.86 112.7% 85,005.8 33.64 111.7% 22% stake in MTL DCF 5,389.8 2.13 7.3% 5,406.6 2.14 7.1% 27.5% stake in China Nanshan Development DCF 1,613.1 0.64 2.2% 1,624.2 0.64 2.1% Shekou Container Terminals (Phase 1-3) DCF 10,675.2 4.22 14.5% 10,883.4 4.31 14.3% 14% stake in Tianjin Container Terminal DCF 442.2 0.18 0.6% 469.9 0.19 0.6% 45% stake in Ningbo Daxie Container Terminal DCF 2,298.9 0.91 3.1% 2,347.6 0.93 3.1% 50% stake in Qingdao Qianwan DCF 5,070.0 2.01 6.9% 5,102.3 2.02 6.7% 60% stake in Zhangzhou port DCF 108.6 0.04 0.1% 110.9 0.04 0.1% 70% stake in Mawan and 67% in Haixing Terminals DCF 2,645.7 1.05 3.6% 2,695.7 1.07 3.5% 100% stake in CM Shekou Port DCF 1,653.6 0.65 2.2% 1,668.7 0.66 2.2% 100% stakein China Merchants Container Services DCF 92.5 0.04 0.1% 94.4 0.04 0.1% 40% stake in Zhanjiang Port Group DCF 3,049.0 1.21 4.1% 3,109.8 1.23 4.1% 20% stake in Asia Airfreight Terminal 10x PER 178.4 0.07 0.2% 178.6 0.07 0.2% 4.4% stake in Ningbo Port Group Market value 1,616.8 0.64 2.2% 1,630.1 0.65 2.1% 24.48% stake in Shanghai International Port Group Market value 30,712.4 12.16 41.7% 30,964.2 12.25 40.7% 49% stake in Ben Dinh Sao Mai Deep Seaport, Vietnam At cost 227.9 0.09 0.3% 227.9 0.09 0.3% 20% stake in Chu Kong River Trade Terminal DCF 193.2 0.08 0.3% 196.8 0.08 0.3% 28.5% stake in Tin Can Terminal B, Lagos, Nigeria DCF 515.1 0.20 0.7% 462.7 0.18 0.6% 10% stake in Kao Ming Container Terminal DCF 744.6 0.29 1.0% 766.4 0.30 1.0% Bonded logistics and cold chain 15x PER 2,976.8 1.18 4.0% 3,125.6 1.24 4.1% 85% stake in Colombo International Terminal DCF 3,114.0 1.23 4.2% 3,492.6 1.38 4.6% 50% stake in Lome Container Terminal, Togo DCF 951.4 0.38 1.3% 1,463.0 0.58 1.9% 23.5% stake in Port of Djibouti SA, Djibouti DCF 1,299.0 0.51 1.8% 1,357.3 0.54 1.8% 49% stake in Terminal Link DCF 4,339.2 1.72 5.9% 4,508.8 1.78 5.9% 34% stake in Shenzhen Chiwan Market value 2,581.5 1.02 3.5% 2,581.5 1.02 3.4% 3.26% stake in Qingdao Port Group Market value 537.4 0.21 0.7% 537.0 0.21 0.7%
Property
4,375.0 1.73 5.9% 4,375.0 1.73 5.7% Four floors at Shun Tak Centre Market value 2,575.0 1.02 3.5% 2,575.0 1.02 3.4% Qianhaiwan land parcel Market value 1,800.0 0.71 2.4% 1,800.0 0.71 2.4%
Long term borrowings
-24,123.0 -9.55 -32.7% -23,667.1 -9.37 -31.1% Total Net Asset Value
73,681.0 29.16 100.0% 76,116.6 30.13 100.0%
Number of shares outstanding (m)
2,526.7
2,526.7 NAV/Share (HKD)
29.16
30.13
Share price (HKD)
25.50
25.50 Premium/(Discount) to NAV/Share
-12.6%
-15.4%
Source: Maybank Kim Eng
Figure 57: 12-month forward PER band Figure 58: 12-month forward P/BV multiple
Source: Bloomberg, Maybank Kim Eng Source: Bloomberg, Maybank Kim Eng
0
10
20
30
40
50
60
70
Jan 09 Sep 09May 10Jan 11 Sep 11May 12Jan 13 Sep 13May 14
13x
16x
19x
22x
25x
10x
0.0
0.5
1.0
1.5
2.0
2.5
Jan 09 Sep 09 May 10 Jan 11 Sep 11 May 12 Jan 13 Sep 13 May 14

July 23, 2014 40
China Merchants Holdings
Figure 59: Port peer valuation comparison Closing Market Cap. P/E P/BV Div Yield Ticker Company Name Closing Ccy 07/22/2014 USD (Mn) 2014F 2015F 2014F 2015F 2014F 2015F DPW-AE DP World USD 19.75 16,392.5 25.3 23.0 1.8 1.7 1.2% 1.3% 144-HK China Merchants Holdings HKD 25.50 8,395.8 14.9 14.0 1.3 1.2 3.2% 3.5% NS8U-SG Hutchison Port Hlgs USD 0.73 6,359.1 28.6 27.7 0.8 0.8 7.2% 7.3% 1199-HK COSCO Pacific HKD 10.92 4,103.5 12.3 11.0 0.9 0.8 3.2% 3.7% 2880-HK Dalian Port (PDA) HKD 2.04 1,917.4 10.5 9.8 0.6 0.5 3.6% 4.1% 3382-HK Tianjin Port Devel HKD 1.25 993.2 8.9 8.4 0.7 0.6 4.5% 4.7% 3378-HK Xiamen Intl Port HKD 1.20 152.8 8.7 7.9 0.6 0.6 5.1% 5.3% 3369-HK Qinhuangdao Port HKD 4.07 435.8 8.2 7.7 1.3 1.3 11.0% 8.1% Average 14.7 13.7 1.0 0.9 4.9% 4.7% Source: FactSet, Maybank Kim Eng

July 23, 2014 41
China Merchants Holdings
FYE 31 Dec FY12A FY13A FY14E FY15E FY16EKey MetricsP/E (reported) (x) 16.6 15.3 14.2 13.3 11.4Core P/E (x) 18.8 16.1 14.9 14.0 12.0P/BV (x) 1.4 1.3 1.3 1.2 1.1P/NTA (x) na na na na naNet dividend yield (%) 2.7 3.0 3.2 3.5 4.0FCF yield (%) 0.7 2.6 2.3 1.4 4.0EV/EBITDA (x) 16.6 22.6 19.6 18.8 16.8EV/EBIT (x) 22.3 33.4 30.2 28.9 25.1
INCOME STATEMENT (HKD m)Revenue 11,022.1 7,758.0 7,202.1 8,016.2 8,668.4Gross profit 3,722.4 2,784.3 2,558.2 2,684.5 3,025.3EBITDA 5,006.4 4,119.6 3,947.0 4,128.8 4,527.4Depreciation (1,284.0) (1,335.4) (1,388.8) (1,444.3) (1,502.1)Amortisation 0.0 0.0 0.0 0.0 0.0EBIT 3,722.4 2,784.3 2,558.2 2,684.5 3,025.3Net interest income /(exp) (1,166.0) (1,018.0) (1,063.4) (1,265.4) (987.3)Associates & JV 2,967.0 3,809.0 4,282.8 4,706.8 5,106.1Exceptionals 1,347.0 205.0 225.5 248.1 272.9Other pretax income 0.0 0.0 0.0 0.0 0.0Pretax profit 6,870.4 5,780.3 6,003.1 6,374.0 7,417.0Income tax (1,163.0) (842.0) (767.5) (805.3) (907.6)Minorities (1,890.0) (726.0) (684.6) (731.8) (863.0)Discontinued operations 0.0 0.0 0.0 0.0 0.0Reported net profit 3,817.3 4,212.2 4,551.0 4,836.8 5,646.4Core net profit 3,372.3 4,007.2 4,325.5 4,588.8 5,373.5
BALANCE SHEET (HKD m)Cash & Short Term Investments 4,192.0 3,203.8 4,234.4 4,446.3 6,388.4Accounts receivable 1,400.0 1,627.0 2,959.8 3,294.3 3,562.3Inventory 89.0 94.0 197.3 219.6 237.5Property, Plant & Equip (net) 16,863.0 19,034.0 21,126.9 22,817.3 23,085.1Intangible assets 16,035.0 16,559.0 16,559.0 16,559.0 16,559.0Investment in Associates & JVs 33,640.0 41,942.0 43,226.8 44,638.9 46,170.7Other assets 5,247.0 6,730.0 6,730.0 6,730.0 6,730.0Total assets 77,466.0 89,189.8 95,034.2 98,705.5 102,733.1ST interest bearing debt 6,035.0 2,339.0 244.0 592.3 592.3Accounts payable 1,641.0 2,126.0 3,946.4 4,392.4 4,749.8LT interest bearing debt 11,184.0 14,528.0 8,284.0 7,691.7 7,099.3Other liabilities 4,924.0 13,772.0 22,986.9 23,024.7 23,127.0Total Liabilities 23,784.0 32,765.0 35,461.2 35,701.2 35,568.4Shareholders Equity 45,542.0 48,597.9 51,061.4 53,760.9 57,058.2Minority Interest 8,140.0 7,827.0 8,511.6 9,243.4 10,106.4Total shareholder equity 53,682.0 56,424.9 59,573.0 63,004.3 67,164.6
CASH FLOW (HKD m)Pretax profit 6,870.4 5,780.3 6,003.1 6,374.0 7,417.0Depreciation & amortisation 1,284.0 1,335.4 1,388.8 1,444.3 1,502.1Adj net interest (income)/exp 1,166.0 1,018.0 1,063.4 1,265.4 987.3Change in working capital 706.0 (655.0) 747.3 89.2 71.5Cash taxes paid (882.0) (139.0) (209.0) (767.5) (805.3)Other operating cash flow (4,787.0) (1,774.0) (4,282.8) (4,706.8) (5,106.1)Cash flow from operations 4,357.4 5,565.6 4,710.7 3,698.6 4,066.4Capex (3,911.0) (3,919.0) (3,200.0) (2,800.0) (1,500.0)Free cash flow 446.4 1,646.6 1,510.7 898.6 2,566.4Dividends paid (2,670.0) (1,751.8) (2,087.5) (2,137.3) (2,349.1)Equity raised / (purchased) 19.0 0.0 0.0 0.0 0.0Change in Debt 3,188.0 5,640.0 (45.6) (244.0) (592.3)Other invest/financing cash flow (3,586.9) (6,522.7) 1,652.9 1,694.6 2,317.1Effect of exch rate changes (15.7) (0.3) 0.0 0.0 0.0Net cash flow (2,619.2) (988.1) 1,030.6 211.9 1,942.1

July 23, 2014 42
China Merchants Holdings
FYE 31 Dec FY12A FY13A FY14E FY15E FY16EKey RatiosGrowth ratios (%)Revenue growth 16.4 (29.6) (7.2) 11.3 8.1EBITDA growth 8.1 (17.7) (4.2) 4.6 9.7EBIT growth 15.7 (25.2) (8.1) 4.9 12.7Pretax growth (10.6) (15.9) 3.9 6.2 16.4Reported net profit growth (31.7) 10.3 8.0 6.3 16.7Core net profit growth (14.0) 18.8 7.9 6.1 17.1
Profitability ratios (%)EBITDA margin 45.4 53.1 54.8 51.5 52.2EBIT margin 33.8 35.9 35.5 33.5 34.9Pretax profit margin 62.3 74.5 83.4 79.5 85.6Payout ratio 45.7 46.1 46.0 46.0 46.0
DuPont analysisNet profit margin (%) 34.6 54.3 63.2 60.3 65.1Revenue/Assets (x) 0.1 0.1 0.1 0.1 0.1Assets/Equity (x) 1.7 1.8 1.9 1.8 1.8ROAE (%) 7.6 8.5 8.7 8.8 9.7ROAA (%) 4.1 4.8 4.7 4.7 5.3
Liquidity & EfficiencyCash conversion cycle (60.0) (59.5) (109.4) (127.0) (134.7)Days receivable outstanding 68.2 70.2 114.6 140.4 142.4Days inventory outstanding 8.1 6.6 11.3 14.1 14.6Days payables outstanding 136.3 136.3 235.4 281.5 291.6Dividend cover (x) 2.2 2.2 2.2 2.2 2.2Current ratio (x) 0.7 1.2 1.5 1.4 1.6
Leverage & Expense AnalysisAsset/Liability (x) 3.3 2.7 2.7 2.8 2.9Net debt/equity (%) 28.6 28.1 8.4 7.1 2.3Net interest cover (x) 3.2 2.7 2.4 2.1 3.1Debt/EBITDA (x) 3.4 4.1 2.2 2.0 1.7Capex/revenue (%) 35.5 50.5 44.4 34.9 17.3Net debt/ (net cash) 13,027.0 13,663.2 4,293.6 3,837.7 1,303.2

July 23, 2014
Init
iati
on
COM
PAN
Y RE
SEA
RCH
|
SEE PAGE 54 FOR IMPORTANT DISCLOSURES AND ANALYST CERTIFICATIONS
Kerry Logistics Network (636 HK)
A pricey choice; HOLD Initiate at HOLD as we believe Hong Kong warehouses will
drag down overall earnings – we project a 10.8% 3-year earnings CAGR.
We expect margin expansion will be a long-term story but see M&A contribution to FY15 limited to at best 9%.
Valuation of 19.9x for FY15 is a premium to peers and close to international logistics companies, leaving limited upside.
What’s New We find KLN a good play on the growing logistics demand in China and other Asian countries given that 83% of its FY14F revenue is derived from this region. Through more extensive services, an increase in its client portfolio and network expansion, we forecast margins for logistics operations to be 0.11ppt higher YoY in FY14 while international freight forwarding margin will grow 0.1ppt. However, given the lack of available warehouse space for growth in Hong Kong, we project earnings from this business to increase by 5-6% in the next two years. M&A is also unlikely to contribute enough to significantly boost its earnings growth.
What’s Our View We forecast a 43.2% earnings decline for FY14 and 10.8% growth for FY15. Excluding fair value changes in investment property and asset disposals, growth will be 9.7% and 11.5%, respectively. Based on a 12-month forward SOTP estimate, we value KLN at a target price of HKD12.80. The stock has rallied 25% from its IPO price of HKD10.20 and now trades at 19.9x PER for FY15F. In our view, despite its better geographical span and higher margins, the current premium valuations are a good reflection of the company’s strengths. The net cash from its IPO means that it will take time for KLN to return to its peak ROE of 10.2% achieved in FY10, as we project this to be 6.9% in FY14 and 7.2% in FY15.
Key Data
Share Price Performance
Maybank vs Market
Share Price: HKD12.74 MCap (USD): 2.8B Hong Kong
Target Price: HKD12.80(+0%) ADTV (USD): 3M Transport (New)HOLD52w high/low (HKD)
3m avg turnover (USDm)
Free float (%)
Issued shares (m)
Market capitalization
Major shareholders:
-Kerry Properties Ltd. 42.5%
-Kerry Group Ltd. 23.7%
-Baring Asset Management (Asia) Ltd. 0.9%
na/na
1,691
33.3
HKD21.5B
3.1
95
100
105
110
115
120
125
130
135
140
10.0
10.5
11.0
11.5
12.0
12.5
13.0
13.5
14.0
14.5
Dec-13 Feb-14 Apr-14 Jun-14
Kerry Logistics - (LHS, HKD) Kerry Logistics / Hang Seng Index - (RHS, %)
1 Mth 3 Mth 12 Mth
Absolute(%) 5.8 4.4 na
Relative to index (%) 3.2 (0.2) na
Positive Neutral Negative
Market Recs 6 0 0
Maybank Consensus % +/-
Target Price (HKD) 12.80 15.00 (14.7)
'14 PATMI (HKDm) 1,043 1,011 3.1
'15 PATMI (HKDm) 1,155 1,140 1.2
Source: FactSet; Maybank
FYE Dec (HKD m) FY12A FY13A FY14E FY15E FY16ERevenue 19,294.8 19,968.7 21,041.7 22,738.3 24,716.0EBITDA 1,647.7 2,213.8 2,008.2 2,200.3 2,414.1Core net profit 815.7 886.4 972.5 1,084.6 1,205.7Core FDEPS (HKD) 0.63 0.53 0.58 0.64 0.71Core FDEPS growth(%) 10.1 (15.1) 7.6 11.5 11.2Net DPS (HKD) 0.00 0.11 0.12 0.14 0.15Core FD P/E (x) 20.2 23.8 22.1 19.9 17.9P/BV (x) 2.0 1.6 1.5 1.4 1.3Net dividend yield (%) 0.0 0.9 1.0 1.1 1.2ROAE (%) 10.4 8.1 7.0 7.4 7.7ROAA (%) 3.9 3.7 3.8 4.1 4.3EV/EBITDA (x) na 7.7 11.8 10.7 9.5Net debt/equity (%) net cash net cash net cash net cash net cash
Osbert TK Tang, CFA(86) 21-5096 [email protected]
Tracy Liu(86) 21 5096 [email protected]

July 23, 2014 44
Kerry Logistics Network
Earnings not too exciting We expect KLN to post 9.7% core earnings growth in FY14 and 11.5% for FY15, primarily driven by earnings from its logistics operations (within integrated logistics division) and international freight forwarding businesses. However, we expect earnings from its Hong Kong warehouses to witness slower growth due to the lack of floor area for expansion. KLN has a presence in 36 countries, with China being the most important market, accounting for an estimated 44.6% of its total revenue in FY14F. Its strong regional exposure and diversified network are key strengths. Historically, it has relied on M&A to fuel its earnings performance. As its M&A activity has slowed down in the last two years, we project earnings growth from acquisitions will not be significant in FY15 as well. This places its earnings momentum behind its peers like Sinotrans (at an EPS CAGR of 27% over FY14-16). Given that the stock is now trading at the high-end of its global peers and at a 20% PER premium over the global average for FY15F, we believe there is limited upside from the current level and initiate our coverage with a HOLD.
Figure 60: KLN’s geographical footprint
Source: Company data
Growth to pick up later FY14 KLN’s organic earnings growth has been slow in the last three years (at a 10% CAGR for FY11-13), though reported earnings have been boosted by changes in fair value for investment properties and asset disposals. KLN believes the slow pace of earnings is primarily due to the slowdown in global trade activities which has hindered global logistics demand. Nonetheless, it is of the view that the global destocking trend has come to an end and it expects global manufacturing and consumption demand growth will come back in 4Q14 or 1Q15. In terms of operating performance, its overall business volume is roughly flat YoY in 1Q14. However, the company witnessed initial signs of demand improvement in April and May. We also observe a similar trend as China’s PMI has picked up in the last two months with positive indications of stronger new export orders. While more data-points are needed to conclude for a sustained uptrend, KLN sees the trough of the logistics industry behind us. In our view, this should bring

July 23, 2014 45
Kerry Logistics Network
about better earnings performance for both its integrated logistics and international freight forwarding operations over the next 18 months.
Figure 61: Revenue, gross margin and earnings
Source: Company data, Maybank Kim Eng
Steady HK warehouse contribution KLN currently has 10 warehouses in Hong Kong with a total GFA of 5m sq ft. Due to the limited supply of industrial land, the company is not expected to see much growth in its total warehouse space. It is also a result of the controlled supply that makes the unit rental of its warehouses on a continuous single-digit uptrend in the last three years. KLN has upgraded some of its facilities into cold chain storage, data centres and medical packaging facilities to improve their rental yield. This will remain as a key strategy to enhance the return on these properties in the future. In the long -term, we believe the upside on capital value will lie on their potential re-development into residential or commercial uses, as is the example of its disposal of Kerry D.G. Warehouse (Kowloon Bay) to its parent Kerry Property prior to listing.
Figure 62: List of KLN Logistics HK warehouses Name Location Interest GFA (sq. ft.) Kerry Cargo Centre Kwai Chung 100% 1,443,356 Kerry TC Warehouse 1 Kwai Chung 100% 659,783 Kerry TC Warehouse 2 Kwai Chung 100% 490,942 Kerry Warehouse (Tsuen Wan) Kwai Chung 100% 591,973 Kerry Warehouse (Chai Wan) Chai Wan 100% 535,037 Kerry Warehouse (Shatin) Shatin 100% 431,530 Kerry Warehouse (Sheung Shui) Sheung Shui 100% 356,253 Kerry Warehouse (Kwai Chung) Kwai Chung 100% 286,628 Kerry Warehouse (Fanling 1) Fanling 100% 283,580 Total
5,079,082
Source: Company data, Maybank Kim Eng
We expect the trend of steadily rising earnings from Hong Kong warehouses to continue. Margin for this business is already high at 90.7% for FY13, providing limited room for further efficiency improvement, in our view. We have factored in a 5% increase in average unit rental for each of FY14 and FY15, while margins will stay high at last year’s levels over the period. As such, we forecast the Hong Kong warehouse business will contribute 26.8% to KLN’s segment profit in FY15. But such a high proportion of steady earnings also means a drag on the fast-growing logistics operations and international freight forwarding business.
13.2%13.4%13.6%13.8%14.0%14.2%14.4%14.6%14.8%15.0%15.2%15.4%
0
5,000
10,000
15,000
20,000
25,000
30,000
2010 2011 2012 2013 2014F 2015F 2016F
HKDm Revenue (HKDm) profit (HKDm) Gross margin
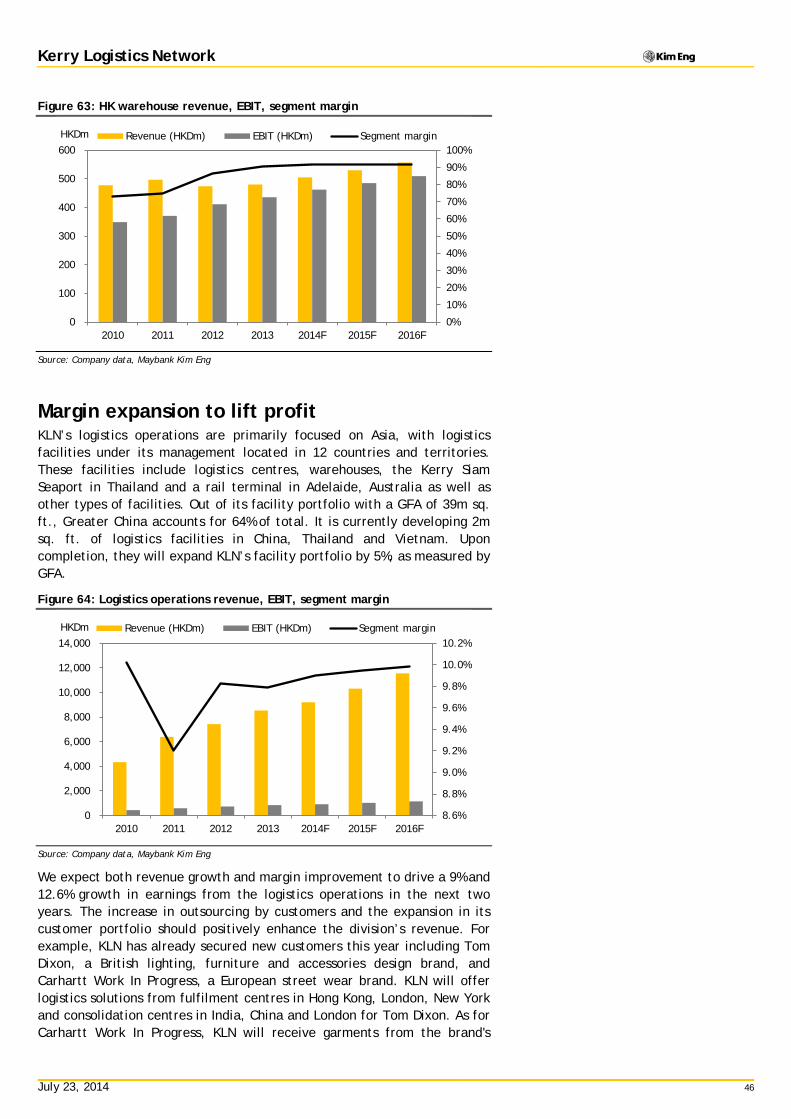
July 23, 2014 46
Kerry Logistics Network
Figure 63: HK warehouse revenue, EBIT, segment margin
Source: Company data, Maybank Kim Eng
Margin expansion to lift profit KLN’s logistics operations are primarily focused on Asia, with logistics facilities under its management located in 12 countries and territories. These facilities include logistics centres, warehouses, the Kerry Siam Seaport in Thailand and a rail terminal in Adelaide, Australia as well as other types of facilities. Out of its facility portfolio with a GFA of 39m sq. ft., Greater China accounts for 64% of total. It is currently developing 2m sq. ft. of logistics facilities in China, Thailand and Vietnam. Upon completion, they will expand KLN’s facility portfolio by 5%, as measured by GFA.
Figure 64: Logistics operations revenue, EBIT, segment margin
Source: Company data, Maybank Kim Eng
We expect both revenue growth and margin improvement to drive a 9% and 12.6% growth in earnings from the logistics operations in the next two years. The increase in outsourcing by customers and the expansion in its customer portfolio should positively enhance the division’s revenue. For example, KLN has already secured new customers this year including Tom Dixon, a British lighting, furniture and accessories design brand, and Carhartt Work In Progress, a European street wear brand. KLN will offer logistics solutions from fulfilment centres in Hong Kong, London, New York and consolidation centres in India, China and London for Tom Dixon. As for Carhartt Work In Progress, KLN will receive garments from the brand's
0%
10%
20%
30%
40%
50%
60%
70%
80%
90%
100%
0
100
200
300
400
500
600
2010 2011 2012 2013 2014F 2015F 2016F
HKDm Revenue (HKDm) EBIT (HKDm) Segment margin
8.6%
8.8%
9.0%
9.2%
9.4%
9.6%
9.8%
10.0%
10.2%
0
2,000
4,000
6,000
8,000
10,000
12,000
14,000
2010 2011 2012 2013 2014F 2015F 2016F
HKDm Revenue (HKDm) EBIT (HKDm) Segment margin

July 23, 2014 47
Kerry Logistics Network
Asian manufacturers at its warehouse facilities in Hong Kong, and distribute products around the Asia-Pacific region.
It also adopted the strategy to expand deeper (both forward and backward) into its customers’ supply chain; and this should capture more businesses and increase its margins. We forecast margins for logistics operations to increase by 0.11ppt to 9.9% in FY14 and 0.05ppt to 9.95% in FY15. The company’s target is for this to reach double-digit level in the long term. However, we do not expect this to be achievable within the next three years as its current margin is already at the high-end of the 3PL operators in China, which accounts for 44.6% of its FY14 revenue based on our projections.
We project KLN’s international freight forwarding profit to increase 6.9% in FY14 and 8.4% in FY15, thanks to the improvements in freight rate and also volume growth. It opened three more network coverage points this year, and this has a positive impact on volume growth. In order to expand its customer base, KLN will further enlarge its geographical focus, particularly in the US and Europe, to build a worldwide brand name. Another strategy is to reduce its reliance on agents and hence capture more direct customers and this should be good for its profitability. The company has started to realize the benefits from these moves, as its gross margin from international freight forwarding has expanded to 3% in 1Q14, from 2.8% in FY13.
Figure 65: Freight forwarding revenue, margin, EBIT
Source: Company data, Maybank Kim Eng
Acceleration in M&A Preparations for KLN’s IPO last year disrupted its M&A activity on which the company has relied over last few years to support its growth. Following the company’s successful listing at end-FY13, it has started to look at M&A again this year. KLN has over 20 M&A targets currently under study and expects to confirm three to four acquisitions by the interim results announcement in August. Outside of Asia, its acquisition focus is on international freight forwarding; and within Asia, it will consider both integrated logistics and international freight forwarding businesses as targets.
KLN’s key M&A criteria are that the target companies need to generate: 1.) enhancement to its ROE; and 2.) synergy with its existing businesses. KLN has historically made acquisitions mostly at single-digit PER levels and it
0.0%
0.5%
1.0%
1.5%
2.0%
2.5%
3.0%
3.5%
0
2,000
4,000
6,000
8,000
10,000
12,000
14,000
2010 2011 2012 2013 2014F 2015F 2016F
HKDm Revenue (HKDm) EBIT (HKDm) Segment margin

July 23, 2014 48
Kerry Logistics Network
requires that targets help it build a global logistics brand name. In many of its acquisitions, KLN retains the existing management of the acquired company by allowing them to take up minority stakes.
For FY14-15, it has budgeted HKD2-3b of capex for M&A and given the time needed for digesting these acquisitions, we think they will only provide earnings enhancement in FY15. By our estimate, assuming an execution of half of its FY14-15 M&A budget this year (or HKD1.5b), there will be a 9% earnings enhancement for next year. This is by using an average acquisition PER of 10x and average 50/50 debt/equity funding for the transactions. However, we believe this may not be easy to achieve as valuations of logistics assets have increased sharply over the last 12 months (our universe of logistics peers currently trade on an average 16.7x PER for FY15F) and it may also divert management attention and increase operating costs as the businesses integrate into KLN’s existing portfolio. As such, while we think M&A is positive in the long term, we will not be overly aggressive on their near-term enhancement to its bottom line. We estimate that KLN made HKD1b of acquisitions in FY12-13; but as suggested by its single-digit earnings growth in the period, the impact of M&A on KLN’s bottom line does not seem so significant.
Figure 66: Key assumptions Business 2012 2013 2014F 2015F 2016F Logistics operations
Turnover (HKD m) 7,423.7 8,541.7 9,206.8 10,311.6 11,549.0 % Change 16.1% 15.1% 7.8% 12.0% 12.0% Segment profit margin 9.83% 9.79% 9.90% 9.95% 9.98%
Hong Kong warehouses Turnover (HKD m) 474.2 480.2 505.0 530.3 556.8
% Change -4.6% 1.3% 5.2% 5.0% 5.0% Segment profit margin 86.68% 90.71% 91.50% 91.50% 91.50%
International freight forwarding Turnover (HKD m) 11,396.8 10,946.8 11,329.9 11,896.4 12,610.2
% Change 24.6% -3.9% 3.5% 5.0% 6.0% Segment profit margin 2.63% 3.00% 3.10% 3.20% 3.30% Source: Company data, Maybank Kim Eng
Figure 67: FY14F earnings breakdown
Source: Company data, Maybank Kim Eng
Logistics operations
49%
HK warehouses 25%
International freight
forwarding 19%
Associates 7%

July 23, 2014 49
Kerry Logistics Network
Valuation looks rich Following its IPO which raised HKD2.1b, we expect KLN to have net cash of HKD524m after factoring in the planned capex for this year. This represents an improvement from a gearing of 41.3% for FY12. With the enlarged capital base, we expect KLN’s recurrent ROE (excluding fair value changes on investment property) to be 6.9% in FY14 and 7.2% in FY15, down from 9.8% in FY12.
Figure 68: Net gearing
Source: Company data, Maybank Kim Eng
We value KLN by using a 12-month forward sum-of-the-parts valuation, which is similar to the methodology that we used to value Sinotrans, and we derive our target price as HKD12.80. The stock now trades at 22.1x FY14F PER, which is the high-end of its peers. We think KLN deserves to trade at a premium to Sinotrans given its more diversified geographical presence, higher margin for logistics business, more sophisticated service offerings and better management quality. However, as the stock’s current multiple is already ahead of the sector average of 16.7x for FY15, we think there is limited upside from current levels. In fact, its PER for FY14 is not too far from global peers like UPS (20.6x FY14F) and Kuehne & Nagel (22.4x FY14F) which have a longer history and stronger network presence and stronger business offerings.
Figure 69: Sum-of-the-parts valuation
FY14 FY14
FY15 FY15
Basis for
Value Per Share % of Value Per Share % of Business segment valuation Multiple (HKDm) value (HKD) total (HKDm) value (HKD) total Logistics operations PER 18.0x 9,051.5 5.41 45.9% 10,163.2 6.07 46.1% Hong Kong warehouses Yield 5.0% 6,749.6 4.03 34.2% 7,100.7 4.24 32.2% International freight forwarding PER 12.0x 2,325.3 1.39 11.8% 2,513.9 1.50 11.4% Associates PER 9.0x 1,059.1 0.63 5.4% 1,143.8 0.68 5.2% Net cash/(debt) 524.2 0.31 2.7% 1,326.2 0.79 6.0% Total asset value
19,709.7 11.77 100.0% 22,247.9 13.16 100.0%
No. of shares outstanding
1,674.0
1,690.7 Per share value (HKD)
11.77
13.16
Current share price (HKD)
12.74
12.74 Premium/(Discount) %
8.2%
-3.2%
Source: Company data, Maybank Kim Eng
-20%
-10%
0%
10%
20%
30%
40%
50%
2010 2011 2012 2013 2014F 2015F 2016F

July 23, 2014 50
Kerry Logistics Network
Figure 70: Logistics peer valuation comparisons
Closing Ccy Closing Market Cap. P/E P/BV Div Yield
Ticker Company Name
07/22/2014 USD (m) 2014F 2015F 2014F 2015F 2014F 2015F UPS-US United Parcel Service Inc USD 104.48 73,782 20.6 17.7 14.1 13.3 2.5% 2.7% FDX-US Fedex Corp USD 153.29 43,752 17.4 14.4 2.7 2.3 0.5% 0.6% DPW-DE Deutsche Post AG EUR 25.285 41,192 15.0 13.4 2.8 2.6 3.4% 3.8% KNIN-CH Kuehne & Nagel Intl CHF 121.3 16,134 22.4 20.5 5.8 5.4 3.7% 3.9% CHRW-US C.H. Robinson Worldwide Inc USD 65.96 9,790 23.0 20.8 10.2 9.7 2.2% 2.3% TNTE-NL TNT Express NV EUR 6.43 4,728 19.9 14.1 1.4 1.3 1.9% 2.8% PWTN-CH Panalpina Welt AG CHF 132 3,475 29.8 21.7 4.2 3.7 1.9% 2.4% TOL-AU Toll Hldgs Ltd AUD 5.42 3,650 13.7 13.3 1.4 1.4 5.1% 5.3% 636-HK Kerry Logistics Network HKD 12.74 2,779 22.1 19.9 1.5 1.4 1.0% 1.1% 598 HK Sinotrans Limited HKD 4.90 1,130 15.9 11.3 1.4 1.2 1.7% 2.2% Average 20.0 16.7 4.6 4.2 2.4% 2.7% Source: Company data, Maybank Kim Eng
KLN’s share price has gone up by 25% from its IPO price of HKD10.20, outperformed the market by 22.2ppts (Hang Seng Index up 2.8% over this period from 23,143). Despite this, KLN has underperformed Sinotrans (from HKD2.70) by a massive 51.6ppts YTD; and its multiples are still significantly higher than Sinotrans (15.9x for FY14F and 11.3x for FY15F). We continue to prefer Sinotrans given its stronger 3-year EPS CAGR, potential upside from further asset injection from its parent Sinotrans & CSC and undemanding valuation for next year.
Figure 71: 12-month forward PER band
Source: Company data, Maybank Kim Eng
Figure 72: 12-month forward P/BV multiple
Source: Company data, Maybank Kim Eng
0
2
4
6
8
10
12
14
16
18
Dec 13 Jan 14 Feb 14 Mar 14 Apr 14 May 14 Jun 14 Jul 14
HKD
24x
16x 18x 20x 22x
26x
0.8
0.9
1.0
1.1
1.2
1.3
1.4
1.5
1.6
1.7
1.8
Dec 13 Jan 14 Feb 14 Mar 14 Apr 14 May 14 Jun 14 Jul 14
P/B Average -1 SD +1 SD

July 23, 2014 51
Kerry Logistics Network
FYE 31 Dec FY12A FY13A FY14E FY15E FY16EKey MetricsP/E (reported) (x) 15.4 9.1 20.5 18.7 16.9Core P/E (x) 20.2 18.8 21.9 19.9 17.9Core FD P/E (x) 20.2 23.8 22.1 19.9 17.9P/BV (x) 2.0 1.6 1.5 1.4 1.3P/NTA (x) na na na na naNet dividend yield (%) 0.0 0.9 1.0 1.1 1.2FCF yield (%) nm 2.0 4.8 4.9 5.7EV/EBITDA (x) na 7.7 11.8 10.7 9.5EV/EBIT (x) na 9.5 15.1 13.6 12.1
INCOME STATEMENT (HKD m)Revenue 19,294.8 19,968.7 21,041.7 22,738.3 24,716.0Gross profit 2,693.3 2,878.0 3,051.7 3,285.0 3,540.1EBITDA 1,647.7 2,213.8 2,008.2 2,200.3 2,414.1Depreciation (329.3) (407.5) (437.3) (478.4) (520.8)Amortisation 0.0 0.0 0.0 0.0 0.0EBIT 1,318.3 1,806.3 1,570.9 1,721.9 1,893.3Net interest income /(exp) (63.1) (93.7) (102.6) (80.2) (64.3)Associates & JV 136.4 128.4 117.7 127.1 137.3Exceptionals 0.0 0.0 0.0 0.0 0.0Other pretax income 265.2 600.2 70.0 70.0 70.0Pretax profit 1,656.8 2,441.3 1,656.0 1,838.8 2,036.3Income tax (304.9) (304.8) (277.5) (309.5) (344.1)Minorities (282.5) (301.9) (335.9) (374.6) (416.5)Perpertual securities 0.0 0.0 0.0 0.0 0.0Discontinued operations 0.0 0.0 0.0 0.0 0.0Reported net profit 1,069.4 1,834.5 1,042.5 1,154.6 1,275.7Core net profit 815.7 886.4 972.5 1,084.6 1,205.7
BALANCE SHEET (HKD m)Cash & Short Term Investments 2,944.2 4,237.1 3,653.3 4,215.5 4,329.2Accounts receivable 4,325.3 4,660.6 4,900.1 5,295.2 5,755.8Inventory 109.9 164.0 172.9 186.9 203.1Property, Plant & Equip (net) 5,998.5 6,532.0 6,844.7 7,166.3 7,445.6Intangible assets 1,773.8 1,969.0 1,922.4 1,871.3 1,815.0Investment in Associates & JVs 938.9 1,122.6 1,240.3 1,367.3 1,504.6Other assets 6,377.3 6,988.5 7,058.5 7,128.5 7,198.5Total assets 22,467.9 25,673.6 25,792.2 27,231.0 28,251.7ST interest bearing debt 626.6 1,325.6 260.2 877.6 877.6Accounts payable 3,923.0 3,973.4 4,150.7 4,485.4 4,875.5LT interest bearing debt 1,364.6 2,864.3 2,624.5 1,767.4 910.2Other liabilities 5,428.0 1,294.5 1,415.1 1,447.1 1,481.6Total Liabilities 11,342.2 9,457.8 8,450.5 8,577.4 8,144.9Shareholders Equity 8,358.1 13,426.4 14,216.4 15,153.7 16,190.4Perpertual securities 0.0 0.0 0.0 0.0 0.0Minority Interest 2,767.7 2,789.4 3,125.3 3,500.0 3,916.5Total shareholder equity 11,125.7 16,215.8 17,341.7 18,653.7 20,106.8
CASH FLOW (HKD m)Pretax profit 1,656.8 2,441.3 1,656.0 1,838.8 2,036.3Depreciation & amortisation 329.3 407.5 437.3 478.4 520.8Adj net interest (income)/exp 0.0 0.0 0.0 0.0 0.0Change in working capital (557.0) (209.5) (71.2) (74.4) (86.7)Cash taxes paid (250.3) (246.4) (157.0) (277.5) (309.5)Other operating cash flow (250.4) (944.7) (82.6) (109.7) (134.3)Cash flow from operations 928.4 1,448.2 1,782.5 1,855.6 2,026.5Capex (1,468.0) (1,113.1) (750.0) (800.0) (800.0)Free cash flow (539.6) 335.1 1,032.5 1,055.6 1,226.5Dividends paid (80.1) (123.6) (252.5) (217.4) (239.0)Equity raised / (purchased) 0.0 2,079.3 0.0 0.0 0.0Perpertual securities 0.0 0.0 0.0 0.0 0.0Change in Debt 834.6 2,223.3 (1,305.2) (239.8) (857.2)Perpertual securities distribution 0.0 0.0 0.0 0.0 0.0Other invest/financing cash flow (226.5) (3,236.3) (58.5) (36.2) (16.6)Effect of exch rate changes 33.1 16.8 0.0 0.0 0.0Net cash flow 21.4 1,294.4 (583.8) 562.2 113.7

July 23, 2014 52
Kerry Logistics Network
FYE 31 Dec FY12A FY13A FY14E FY15E FY16EKey RatiosGrowth ratios (%)Revenue growth 20.3 3.5 5.4 8.1 8.7EBITDA growth 14.1 34.4 (9.3) 9.6 9.7EBIT growth 14.4 37.0 (13.0) 9.6 10.0Pretax growth 20.5 47.3 (32.2) 11.0 10.7Reported net profit growth 22.8 71.6 (43.2) 10.8 10.5Core net profit growth 10.1 8.7 9.7 11.5 11.2
Profitability ratios (%)EBITDA margin 8.5 11.1 9.5 9.7 9.8EBIT margin 6.8 9.0 7.5 7.6 7.7Pretax profit margin 8.6 12.2 7.9 8.1 8.2Payout ratio 0.5 7.8 20.0 20.0 20.0
DuPont analysisNet profit margin (%) 5.5 9.2 5.0 5.1 5.2Revenue/Assets (x) 0.9 0.8 0.8 0.8 0.9Assets/Equity (x) 2.7 1.9 1.8 1.8 1.7ROAE (%) 10.4 8.1 7.0 7.4 7.7ROAA (%) 3.9 3.7 3.8 4.1 4.3
Liquidity & EfficiencyCash conversion cycle (4.8) 0.7 3.9 4.1 4.2Days receivable outstanding 71.7 81.0 81.8 80.7 80.5Days inventory outstanding 2.4 2.9 3.4 3.3 3.3Days payables outstanding 78.9 83.2 81.3 79.9 79.6Dividend cover (x) nm 12.8 5.0 5.0 5.0Current ratio (x) 0.8 1.7 1.9 1.7 1.7
Leverage & Expense AnalysisAsset/Liability (x) 2.0 2.7 3.1 3.2 3.5Net debt/equity (%) net cash net cash net cash net cash net cashNet interest cover (x) 20.9 19.3 15.3 21.5 29.5Debt/EBITDA (x) 1.2 1.9 1.4 1.2 0.7Capex/revenue (%) 7.6 5.6 3.6 3.5 3.2Net debt/ (net cash) (953.0) (47.1) (768.6) (1,570.6) (2,541.4)

July 23, 2014 53
China Logistics
Research Offices
REGIONAL
WONG Chew Hann, CA Regional Head of Institutional Research (603) 2297 8686 [email protected]
ONG Seng Yeow Regional Head of Retail Research (65) 6432 1453 [email protected]
Alexander GARTHOFF Institutional Product Manager (852) 2268 0638 [email protected]
ECONOMICS
Suhaimi ILIAS Chief Economist Singapore | Malaysia (603) 2297 8682 [email protected]
Luz LORENZO Philippines (63) 2 849 8836 [email protected]
Tim LEELAHAPHAN Thailand (662) 658 1420 [email protected]
JUNIMAN Chief Economist, BII Indonesia (62) 21 29228888 ext 29682 [email protected]
Josua PARDEDE Economist / Industry Analyst, BII Indonesia (62) 21 29228888 ext 29695 [email protected]
MALAYSIA
WONG Chew Hann, CA Head of Research (603) 2297 8686 [email protected] • Strategy • Construction & Infrastructure
Desmond CH’NG, ACA (603) 2297 8680 [email protected] • Banking & Finance
LIAW Thong Jung (603) 2297 8688 [email protected] • Oil & Gas - Regional • Shipping
ONG Chee Ting, CA (603) 2297 8678 [email protected] • Plantations - Regional
Mohshin AZIZ (603) 2297 8692 [email protected] • Aviation - Regional • Petrochem
YIN Shao Yang, CPA (603) 2297 8916 [email protected] • Gaming – Regional • Media
TAN Chi Wei, CFA (603) 2297 8690 [email protected] • Power • Telcos
WONG Wei Sum, CFA (603) 2297 8679 [email protected] • Property & REITs
LEE Yen Ling (603) 2297 8691 [email protected] • Building Materials • Glove Producers
CHAI Li Shin (603) 2297 8684 [email protected] • Plantation • Construction & Infrastructure
Ivan YAP (603) 2297 8612 [email protected] • Automotive
LEE Cheng Hooi Regional Chartist (603) 2297 8694 [email protected]
Tee Sze Chiah Head of Retail Research (603) 2297 6858 [email protected]
HONG KONG / CHINA
Howard WONG Head of Research (852) 2268 0648 [email protected] • Oil & Gas - Regional
Alexander LATZER (852) 2268 0647 [email protected] • Metals & Mining - Regional
Jacqueline KO, CFA (852) 2268 0633 [email protected] • Consumer
Karen KWAN (852) 2268 0640 [email protected] • Property & REITs
Osbert TK TANG, CFA (86) 21 5096 8370 [email protected] • Transport & Industrials
Ricky WK NG, CFA (852) 2268 0689 [email protected] • Utilities & Renewable Energy
Simon QIAN, CFA (852) 2268 0634 [email protected] • Telecom & Internet
Steven ST CHAN (852) 2268 0645 [email protected] • Banking & Financials - Regional
Warren LAU (852) 2268 0644 [email protected] • Technology – Regional
William YANG (852) 2268 0675 [email protected] • Technology – Regional
INDIA
Jigar SHAH Head of Research (91) 22 6632 2632 [email protected] • Oil & Gas • Automobile • Cement
Anubhav GUPTA (91) 22 6623 2605 [email protected] • Metal & Mining • Capital Goods • Property
Urmil SHAH (91) 22 6623 2606 [email protected] • Technology • Media
SINGAPORE
NG Wee Siang Head of Research (65) 6432 1467 [email protected] • Banking & Finance
Gregory YAP (65) 6432 1450 [email protected] • SMID Caps – Regional • Technology & Manufacturing • Telcos • Consumer
ONG Kian Lin (65) 6432 1470 [email protected] • S-REITs
YEAK Chee Keong, CFA (65) 6432 1460 [email protected] • Offshore & Marine
Derrick HENG (65) 6432 1446 [email protected] • Transport (Land, Shipping & Aviation)
WEI Bin (65) 6432 1455 [email protected] • Commodity • Logistics • S-chips
John CHEONG (65) 6432 1461 [email protected] • Small & Mid Caps • Healthcare
TRUONG Thanh Hang (65) 6432 1451 [email protected] • Small & Mid Caps
INDONESIA
Wilianto IE Head of Research (62) 21 2557 1125 [email protected] • Strategy
Rahmi MARINA (62) 21 2557 1128 [email protected] • Banking & Finance
Aurellia SETIABUDI (62) 21 2953 0785 [email protected] • Property
Anthony YUNUS (62) 21 2557 1136 [email protected] • Consumer • Poultry
Isnaputra ISKANDAR (62) 21 2557 1129 [email protected] • Metals & Mining • Cement
Pandu ANUGRAH (62) 21 2557 1137 [email protected] • Infrastructure • Construction • Transport
Janni ASMAN (62) 21 2953 0784 [email protected] • Cigarette • Healthcare • Retail
PHILIPPINES
Luz LORENZO Head of Research (63) 2 849 8836 [email protected] • Strategy
Laura DY-LIACCO (63) 2 849 8840 [email protected] • Utilities • Conglomerates • Telcos
Lovell SARREAL (63) 2 849 8841 [email protected] • Consumer • Media • Cement
Rommel RODRIGO (63) 2 849 8839 [email protected] • Conglomerates • Property • Gaming • Ports/ Logistics
Katherine TAN (63) 2 849 8843 [email protected] • Banks • Construction
Ramon ADVIENTO (63) 2 849 8845 [email protected] • Mining
THAILAND
Maria LAPIZ Head of Institutional Research Dir (66) 2257 0250 | (66) 2658 6300 ext 1399 [email protected] • Consumer / Materials
Jesada TECHAHUSDIN, CFA (66) 2658 6300 ext 1394 [email protected] • Financial Services
Kittisorn PRUITIPAT, CFA, FRM (66) 2658 6300 ext 1395 [email protected] • Real Estate
Sittichai DUANGRATTANACHAYA (66) 2658 6300 ext 1393 [email protected] • Services Sector
Sukit UDOMSIRIKUL Head of Retail Research (66) 2658 6300 ext 5090 [email protected]
Mayuree CHOWVIKRAN (66) 2658 6300 ext 1440 [email protected] • Strategy
Padon VANNARAT (66) 2658 6300 ext 1450 [email protected] • Strategy
Surachai PRAMUALCHAROENKIT (66) 2658 6300 ext 1470 [email protected] • Auto • Conmat • Contractor • Steel
Suttatip PEERASUB (66) 2658 6300 ext 1430 [email protected] • Media • Commerce
Sutthichai KUMWORACHAI (66) 2658 6300 ext 1400 [email protected] • Energy • Petrochem
Termporn TANTIVIVAT (66) 2658 6300 ext 1520 [email protected] • Property
Woraphon WIROONSRI (66) 2658 6300 ext 1560 [email protected] • Banking & Finance
Jaroonpan WATTANAWONG (66) 2658 6300 ext 1404 [email protected] • Transportation • Small cap
Chatchai JINDARAT (66) 2658 6300 ext 1401 [email protected] • Electronics VIETNAM LE Hong Lien, ACCA Head of Institutional Research (84) 844 55 58 88 x 8181 [email protected] • Strategy • Consumer • Diversified • Utilities
THAI Quang Trung, CFA, Deputy Manager, Institutional Research (84) 844 55 58 88 x 8180 [email protected] • Real Estate • Construction • Materials
Le Nguyen Nhat Chuyen (84) 844 55 58 88 x 8082 [email protected] • Oil & Gas NGUYEN Thi Ngan Tuyen, Head of Retail Research (84) 8 44 555 888 x 8081 [email protected] • Food & Beverage • Oil&Gas • Banking
NGUYEN Trung Hoa, Dy Head of Retail Research (84) 8 44 555 888 x 8088 [email protected] • Macro • Steel • Real estate
TRINH Thi Ngoc Diep (84) 4 44 555 888 x 8208 [email protected] • Technology • Utilities • Construction
TRUONG Quang Binh (84) 4 44 555 888 x 8087 [email protected] • Rubber plantation • Tyres and Tubes • Oil&Gas
PHAM Nhat Bich (84) 8 44 555 888 x 8083 [email protected] • Consumer • Manufacturing • Fishery
NGUYEN Thi Sony Tra Mi (84) 8 44 555 888 x 8084 [email protected] • Port operation • Pharmaceutical • Food & Beverage

July 23, 2014 54
China Logistics
APPENDIX I: TERMS FOR PROVISION OF REPORT, DISCLAIMERS AND DISCLOSURES
DISCLAIMERS
This research report is prepared for general circulation and for information purposes only and under no circumstances should it be considered or intended as an offer to sell or a solicitation of an offer to buy the securities referred to herein. Investors should note that values of such securities, if any, may fluctuate and that each security’s price or value may rise or fall. Opinions or recommendations contained herein are in form of technical ratings and fundamental ratings. Technical ratings may differ from fundamental ratings as technical valuations apply different methodologies and are purely based on price and volume-related information extracted from the relevant jurisdiction’s stock exchange in the equity analysis. Accordingly, investors’ returns may be less than the original sum invested. Past performance is not necessarily a guide to future performance. This report is not intended to provide personal investment advice and does not take into account the specific investment objectives, the financial situation and the particular needs of persons who may receive or read this report. Investors should therefore seek financial, legal and other advice regarding the appropriateness of investing in any securities or the investment strategies discussed or recommended in this report.
The information contained herein has been obtained from sources believed to be reliable but such sources have not been independently verified by Maybank Investment Bank Berhad, its subsidiary and affiliates (collectively, “MKE”) and consequently no representation is made as to the accuracy or completeness of this report by MKE and it should not be relied upon as such. Accordingly, MKE and its officers, directors, associates, connected parties and/or employees (collectively, “Representatives”) shall not be liable for any direct, indirect or consequential losses or damages that may arise from the use or reliance of this report. Any information, opinions or recommendations contained herein are subject to change at any time, without prior notice.
This report may contain forward looking statements which are often but not always identified by the use of words such as “anticipate”, “believe”, “estimate”, “intend”, “plan”, “expect”, “forecast”, “predict” and “project” and statements that an event or result “may”, “will”, “can”, “should”, “could” or “might” occur or be achieved and other similar expressions. Such forward looking statements are based on assumptions made and information currently available to us and are subject to certain risks and uncertainties that could cause the actual results to differ materially from those expressed in any forward looking statements. Readers are cautioned not to place undue relevance on these forward-looking statements. MKE expressly disclaims any obligation to update or revise any such forward looking statements to reflect new information, events or circumstances after the date of this publication or to reflect the occurrence of unanticipated events.
MKE and its officers, directors and employees, including persons involved in the preparation or issuance of this report, may, to the extent permitted by law, from time to time participate or invest in financing transactions with the issuer(s) of the securities mentioned in this report, perform services for or solicit business from such issuers, and/or have a position or holding, or other material interest, or effect transactions, in such securities or options thereon, or other investments related thereto. In addition, it may make markets in the securities mentioned in the material presented in this report. MKE may, to the extent permitted by law, act upon or use the information presented herein, or the research or analysis on which they are based, before the material is published. One or more directors, officers and/or employees of MKE may be a director of the issuers of the securities mentioned in this report.
This report is prepared for the use of MKE’s clients and may not be reproduced, altered in any way, transmitted to, copied or distributed to any other party in whole or in part in any form or manner without the prior express written consent of MKE and MKE and its Representatives accepts no liability whatsoever for the actions of third parties in this respect.
This report is not directed to or intended for distribution to or use by any person or entity who is a citizen or resident of or located in any locality, state, country or other jurisdiction where such distribution, publication, availability or use would be contrary to law or regulation. This report is for distribution only under such circumstances as may be permitted by applicable law. The securities described herein may not be eligible for sale in all jurisdictions or to certain categories of investors. Without prejudice to the foregoing, the reader is to note that additional disclaimers, warnings or qualifications may apply based on geographical location of the person or entity receiving this report.
Malaysia
Opinions or recommendations contained herein are in the form of technical ratings and fundamental ratings. Technical ratings may differ from fundamental ratings as technical valuations apply different methodologies and are purely based on price and volume-related information extracted from Bursa Malaysia Securities Berhad in the equity analysis.
Singapore
This report has been produced as of the date hereof and the information herein may be subject to change. Maybank Kim Eng Research Pte. Ltd. (“Maybank KERPL”) in Singapore has no obligation to update such information for any recipient. For distribution in Singapore, recipients of this report are to contact Maybank KERPL in Singapore in respect of any matters arising from, or in connection with, this report. If the recipient of this report is not an accredited investor, expert investor or institutional investor (as defined under Section 4A of the Singapore Securities and Futures Act), Maybank KERPL shall be legally liable for the contents of this report, with such liability being limited to the extent (if any) as permitted by law.
Thailand
The disclosure of the survey result of the Thai Institute of Directors Association (“IOD”) regarding corporate governance is made pursuant to the policy of the Office of the Securities and Exchange Commission. The survey of the IOD is based on the information of a company listed on the Stock Exchange of Thailand and the market for Alternative Investment disclosed to the public and able to be accessed by a general public investor. The result, therefore, is from the perspective of a third party. It is not an evaluation of operation and is not based on inside information. The survey result is as of the date appearing in the Corporate Governance Report of Thai Listed Companies. As a result, the survey may be changed after that date. Maybank Kim Eng Securities (Thailand) Public Company Limited (“MBKET”) does not confirm nor certify the accuracy of such survey result.
Except as specifically permitted, no part of this presentation may be reproduced or distributed in any manner without the prior written permission of MBKET. MBKET accepts no liability whatsoever for the actions of third parties in this respect.
US
This research report prepared by MKE is distributed in the United States (“US”) to Major US Institutional Investors (as defined in Rule 15a-6 under the Securities Exchange Act of 1934, as amended) only by Maybank Kim Eng Securities USA Inc (“Maybank KESUSA”), a broker-dealer registered in the US (registered under Section 15 of the Securities Exchange Act of 1934, as amended). All responsibility for the distribution of this report by Maybank KESUSA in the US shall be borne by Maybank KESUSA. All resulting transactions by a US person or entity should be effected through a registered broker-dealer in the US. This report is not directed at you if MKE is prohibited or restricted by any legislation or regulation in any jurisdiction from making it available to you. You should satisfy yourself before reading it that Maybank KESUSA is permitted to provide research material concerning investments to you under relevant legislation and regulations.
UK
This document is being distributed by Maybank Kim Eng Securities (London) Ltd (“Maybank KESL”) which is authorized and regulated, by the Financial Services Authority and is for Informational Purposes only. This document is not intended for distribution to anyone defined as a Retail Client under the Financial Services and Markets Act 2000 within the UK. Any inclusion of a third party link is for the recipients convenience only, and that the firm does not take any responsibility for its comments or accuracy, and that access to such links is at the individuals own risk. Nothing in this report should be considered as constituting legal, accounting or tax advice, and that for accurate guidance recipients should consult with their own independent tax advisers.
July 23, 2014 55
China Logistics
Disclosure of Interest Malaysia: MKE and its Representatives may from time to time have positions or be materially interested in the securities referred to herein and may further act as market maker or may have assumed an underwriting commitment or deal with such securities and may also perform or seek to perform investment banking services, advisory and other services for or relating to those companies.
Singapore: As of 23 July 2014, Maybank KERPL and the covering analyst do not have any interest in any companies recommended in this research report.
Thailand: MBKET may have a business relationship with or may possibly be an issuer of derivative warrants on the securities /companies mentioned in the research report. Therefore, Investors should exercise their own judgment before making any investment decisions. MBKET, its associates, directors, connected parties and/or employees may from time to time have interests and/or underwriting commitments in the securities mentioned in this report.
Hong Kong: KESHK may have financial interests in relation to an issuer or a new listing applicant referred to as defined by the requirements under Paragraph 16.5(a) of the Hong Kong Code of Conduct for Persons Licensed by or Registered with the Securities and Futures Commission.
As of 23 July 2014, KESHK and the authoring analyst do not have any interest in any companies recommended in this research report.
MKE may have, within the last three years, served as manager or co-manager of a public offering of securities for, or currently may make a primary market in issues of, any or all of the entities mentioned in this report or may be providing, or have provided within the previous 12 months, significant advice or investment services in relation to the investment concerned or a related investment and may receive compensation for the services provided from the companies covered in this report.
OTHERS Analyst Certification of Independence The views expressed in this research report accurately reflect the analyst’s personal views about any and all of the subject securities or issuers; and no part of the research analyst’s compensation was, is or will be, directly or indirectly, related to the specific recommendations or views expressed in the report.
Reminder Structured securities are complex instruments, typically involve a high degree of risk and are intended for sale only to sophisticated investors who are capable of understanding and assuming the risks involved. The market value of any structured security may be affected by changes in economic, financial and political factors (including, but not limited to, spot and forward interest and exchange rates), time to maturity, market conditions and volatility and the credit quality of any issuer or reference issuer. Any investor interested in purchasing a structured product should conduct its own analysis of the product and consult with its own professional advisers as to the risks involved in making such a purchase.
No part of this material may be copied, photocopied or duplicated in any form by any means or redistributed without the prior consent of MKE.
Definition of Ratings
Maybank Kim Eng Research uses the following rating system BUY Return is expected to be above 10% in the next 12 months (excluding dividends) HOLD Return is expected to be between - 10% to +10% in the next 12 months (excluding dividends) SELL Return is expected to be below -10% in the next 12 months (excluding dividends)
Applicability of Ratings
The respective analyst maintains a coverage universe of stocks, the list of which may be adjusted according to needs. Investment ratings are only applicable to the stocks which form part of the coverage universe. Reports on companies which are not part of the coverage do not carry investment ratings as we do not actively follow developments in these companies.
DISCLOSURES Legal Entities Disclosures Malaysia: This report is issued and distributed in Malaysia by Maybank Investment Bank Berhad (15938-H) which is a Participating Organization of Bursa Malaysia Berhad and a holder of Capital Markets and Services License issued by the Securities Commission in Malaysia. Singapore: This material is issued and distributed in Singapore by Maybank KERPL (Co. Reg No 197201256N) which is regulated by the Monetary Authority of Singapore. Indonesia: PT Kim Eng Securities (“PTKES”) (Reg. No. KEP-251/PM/1992) is a member of the Indonesia Stock Exchange and is regulated by the BAPEPAM LK. Thailand: MBKET (Reg. No.0107545000314) is a member of the Stock Exchange of Thailand and is regulated by the Ministry of Finance and the Securities and Exchange Commission. Philippines: Maybank ATRKES (Reg. No.01-2004-00019) is a member of the Philippines Stock Exchange and is regulated by the Securities and Exchange Commission. Vietnam: Maybank Kim Eng Securities JSC (License Number: 71/UBCK-GP) is licensed under the State Securities Commission of Vietnam.Hong Kong: KESHK (Central Entity No AAD284) is regulated by the Securities and Futures Commission. India: Kim Eng Securities India Private Limited (“KESI”) is a participant of the National Stock Exchange of India Limited (Reg No: INF/INB 231452435) and the Bombay Stock Exchange (Reg. No. INF/INB 011452431) and is regulated by Securities and Exchange Board of India. KESI is also registered with SEBI as Category 1 Merchant Banker (Reg. No. INM 000011708) US: Maybank KESUSA is a member of/ and is authorized and regulated by the FINRA – Broker ID 27861. UK: Maybank KESL (Reg No 2377538) is authorized and regulated by the Financial Services Authority.

July 23, 2014 56
China Logistics
Malaysia Maybank Investment Bank Berhad (A Participating Organisation of Bursa Malaysia Securities Berhad) 33rd Floor, Menara Maybank, 100 Jalan Tun Perak, 50050 Kuala Lumpur Tel: (603) 2059 1888; Fax: (603) 2078 4194
Singapore Maybank Kim Eng Securities Pte Ltd Maybank Kim Eng Research Pte Ltd 9 Temasek Boulevard #39-00 Suntec Tower 2 Singapore 038989 Tel: (65) 6336 9090 Fax: (65) 6339 6003
London Maybank Kim Eng Securities (London) Ltd 5th Floor, Aldermary House 10-15 Queen Street London EC4N 1TX, UK Tel: (44) 20 7332 0221 Fax: (44) 20 7332 0302
New York Maybank Kim Eng Securities USA Inc 777 Third Avenue, 21st Floor New York, NY 10017, U.S.A. Tel: (212) 688 8886 Fax: (212) 688 3500
Stockbroking Business: Level 8, Tower C, Dataran Maybank, No.1, Jalan Maarof 59000 Kuala Lumpur Tel: (603) 2297 8888 Fax: (603) 2282 5136
Hong Kong Kim Eng Securities (HK) Ltd Level 30, Three Pacific Place, 1 Queen’s Road East, Hong Kong Tel: (852) 2268 0800 Fax: (852) 2877 0104
Indonesia PT Maybank Kim Eng Securities Plaza Bapindo Citibank Tower 17th Floor Jl Jend. Sudirman Kav. 54-55 Jakarta 12190, Indonesia Tel: (62) 21 2557 1188 Fax: (62) 21 2557 1189
India Kim Eng Securities India Pvt Ltd 2nd Floor, The International 16, Maharishi Karve Road, Churchgate Station, Mumbai City - 400 020, India Tel: (91).22.6623.2600 Fax: (91).22.6623.2604
Philippines Maybank ATR Kim Eng Securities Inc. 17/F, Tower One & Exchange Plaza Ayala Triangle, Ayala Avenue Makati City, Philippines 1200 Tel: (63) 2 849 8888 Fax: (63) 2 848 5738
Thailand Maybank Kim Eng Securities (Thailand) Public Company Limited 999/9 The Offices at Central World, 20th - 21st Floor, Rama 1 Road Pathumwan, Bangkok 10330, Thailand Tel: (66) 2 658 6817 (sales) Tel: (66) 2 658 6801 (research)
Vietnam Maybank Kim Eng Securities Limited 4A-15+16 Floor Vincom Center Dong Khoi, 72 Le Thanh Ton St. District 1 Ho Chi Minh City, Vietnam Tel : (84) 844 555 888 Fax : (84) 8 38 271 030
Saudi Arabia In association with Anfaal Capital Villa 47, Tujjar Jeddah Prince Mohammed bin Abdulaziz Street P.O. Box 126575 Jeddah 21352 Tel: (966) 2 6068686 Fax: (966) 26068787
South Asia Sales Trading Kevin FOY Regional Head Sales Trading [email protected] Tel: (65) 6336-5157 US Toll Free: 1-866-406-7447
North Asia Sales Trading Alex TSUN [email protected] Tel: (852) 2268 0228 US Toll Free: 1 877 837 7635
www.maybank-ke.com | www.maybank-keresearch.com