China Economic Issues - Hong Kong Monetary · PDF fileChina Economic Issues ... important...
40
Number 1/10, January 2010 China Economic Issues Monetary stance and policy objectives in China: a narrative approach Chang Shu and Brian Ng The paper undertakes the first study to examine China’s monetary stance using a narrative approach in the tradition of Romer and Romer (1989). Already widely applied for other economies, the narrative approach is conceivably particularly useful for China. The PBoC uses a wide range of monetary tools, including market- or non- market-based, quantity and price-based measures, for some of which information is not available. Therefore, conventional measures, most notably the interest rate, may not fully capture the changes in monetary stance. Based on two key official PBoC reports, this study compiles a number of indices to reflect the direction and intensity of monetary stance. These indices are shown to better gauge China’s monetary stance particularly in the early 2000s when market-based monetary tools were less used, but become increasingly correlated with the interest rate, a market-, price- based tool, in recent years. The indices are then used to investigate the PBoC’s policy response to macroeconomic developments through estimation of monetary reaction functions using ordered probit and logit models. The empirical analysis shows that the most important policy objectives are economic growth and inflation, which are in fact the PBoC’s dual legal mandate. Unemployment, and monetary and credit growth, for
Transcript of China Economic Issues - Hong Kong Monetary · PDF fileChina Economic Issues ... important...

Number 1/10, January 2010
China Economic Issues
Monetary stance and policy objectives in China:
a narrative approach
Chang Shu and Brian Ng
The paper undertakes the first study to examine China’s monetary stance using a
narrative approach in the tradition of Romer and Romer (1989). Already widely
applied for other economies, the narrative approach is conceivably particularly useful
for China. The PBoC uses a wide range of monetary tools, including market- or non-
market-based, quantity and price-based measures, for some of which information is
not available. Therefore, conventional measures, most notably the interest rate, may
not fully capture the changes in monetary stance. Based on two key official PBoC
reports, this study compiles a number of indices to reflect the direction and intensity
of monetary stance. These indices are shown to better gauge China’s monetary
stance particularly in the early 2000s when market-based monetary tools were less
used, but become increasingly correlated with the interest rate, a market-, price-
based tool, in recent years.
The indices are then used to investigate the PBoC’s policy response to
macroeconomic developments through estimation of monetary reaction functions
using ordered probit and logit models. The empirical analysis shows that the most
important policy objectives are economic growth and inflation, which are in fact the
PBoC’s dual legal mandate. Unemployment, and monetary and credit growth, for

2
China Economic Issues – Number 1/10, January 2010
which the Government also announces annual targets, do not have significant impact
on the PBoC’s monetary stance. In meeting their mandate, the PBoC appears to
follow a rule of thumb, using historical averages as targets rather than the officially
announced annual targets, and trend growth derived from the Hodrick-Prescott offers
little guidance on monetary stance.

3
I. Introduction
Mainland China’s (China) rising impact on global financial and economic
developments have attracted a growing number of the ‘People’s Bank of China (PBoC)
watchers’ in recent years and the increasing use of approaches employed for
monitoring other central banks. The more conventional approach for assessing
monetary stance is to analyse the data on macroeconomic indicators and observable
policy actions (such as open market operations (OMOs), changes in reserve
requirement and benchmark interest rates in China’s case). However, the PBoC
watchers, like other central bank watchers, are also increasingly paying attention to
official communications with the aim of discerning the PBoC’s monetary stance.
These official communications include meeting notes of the Monetary Policy
Committee (MPC), the quarterly Monetary Policy Reports, and speeches of the
PBoC’s senior officials and China’s top leaders such as Premier Wen.
The examination of official communications is in the tradition of the narrative
approach to studying monetary stance initiated by Romer and Romer (1989). It is
motivated by the observation that some of the often used monetary stance indicators,
which include monetary aggregates and short-term interest rates, may not best capture
changes in monetary stance as they can fluctuate due to factors not related to
monetary stance. Since Romer and Romer (1989), the narrative approach to studying
monetary stance has gained popularity, and been used in describing and assessing
monetary policymaking of many central banks.
Conceivably, the narrative approach to monetary stance can be particularly applicable
to China’s case. Taking into consideration factors not related to the domestic
economy and the inadequate development of financial markets for transmitting
monetary impulse, the PBoC uses a wide range of tools in cyclical management.
These include market- and non-market-based, as well as price- and quantity-based
measures. Some of the tools are observable with complete information released
through official channels, while only anecdotal reports can be found for others.

4
China Economic Issues – Number 1/10, January 2010
There has been no formal study following the narrative approach to studying the
PBoC’s monetary stance, despite the compelling case for using it in China’s case, and
the widespread, yet informal use of official communications by China watchers. The
best attempt to date at providing a measure of monetary stance alternative to
conventional measures is by He and Pauwels (2008) who compile an index based on a
set of observable policy actions such as changes in the interest rate and reserve
requirement and OMOs.
This paper represents the first formal analysis on the PBoC’s monetary stance using
the narrative approach. In compiling indices of the PBoC’s stance, information is
drawn from official records, most notably meeting notes of the MPC and the quarterly
Monetary Policy Reports. The PBoC’s assessment of economic developments, policy
actions and stated policy stance will be examined for deciphering the PBoC’s
underlying monetary stance. The underlying assumption in deriving these indices is
that the direction and intensity of policy actions are consistent with those of wording
in the reports.
The compiled indices will then be used in investigating the PBoC’s policy objectives.
The PBoC has the legal mandate to maintain stable economic growth and currency
stability. At the same time, the Mainland authorities officially announce a range of
economic targets annually, including economic growth, inflation, monetary and credit
growth and unemployment. The second part of the paper will estimate a monetary
reaction function of the PBoC in order to address the questions: what are the
important policy objectives of the PBoC? How much importance does the PBoC
attach to each objective? What best describes the PBoC’s targets for each economic
indicator?
The rest of the paper is arranged as follows. Section II reviews the literature on the
narrative approach in studying monetary stance, and the monetary reaction framework
which is typically used for evaluating policy responses of central banks. In
introducing monetary tools in China, Section III classifies them into a 2 X 2 matrix of
market- and non-market-based, and price- and quantity-based sets. This is followed
by a detailed account of macroeconomic developments in China and monetary policy
actions since 2001 when both meeting notes of the MPC and the quarterly Monetary
Policy Reports became available. Section IV explains the rationales for using the

5
narrative approach to studying monetary stance in China’s case and the methodology
for compiling monetary stance indicators for China. Section V presents the empirical
framework for studying the PBoC’s policy response using the compiled indicators.
The findings from estimating the PBoC policy reaction functions and the implications
are discussed in Section VI before reaching the concluding remarks in Section VII.
II. Literature review
This study draws from two strands of literature: the narrative approach to monetary
stance and monetary policy reaction functions.
The narrative approach to studying monetary stance is motivated by difficulties in
accurately identifying monetary policy impulses using the conventional measures
such as M2 and a short-term interest rate. As noted by King and Plosser (1984) and
Boschen and Mills (1995) among others, these monetary indicators can fluctuate for
reasons not related to changes in monetary policy. This motivated Romer and Romer
(1989) to build on Friedman and Schwartz (1963) – an influential study in the
narrative tradition, and to identify monetary shocks based on the Federal Open Market
Committee (FOMC) records. Brunner and Meltzer (1989) extended this approach by
compiling an indicator of monetary stance – a numerical index which facilitates the
study of the relationship between monetary stance and other economic variables by
econometric methods. Subsequently, a number of different monetary stance indices
have been compiled for the US (see, for example, Poole (1971), Uselton (1974), Potts
and Luckett (1978), Kimelman (1981), Boschen and Mills (1995), and Romer and
Romer (2004)). Later studies using the narrative approach have grown substantially,
and monetary stance indices have been compiled for many other central banks, such
as the European Central Bank (Berger, de Haan and Sturm, 2006, Rosa and Verga,
2005), and the Bank of England (Angelopoulou, 2007). For Asia, Shen and Chen
(1996), and Huang and Lin (2006) have applied the approach for Taiwan.
Many of monetary stance indicators take the discrete values of 1, 0, and -1 to indicate
the ‘tightening/contractionary, ‘neutral’ and ‘easing/expansionary’, e.g. Poole (1971),
Potts and Luckett (1978), and Kimelman (1981). Others including Uselton (1974)

6
China Economic Issues – Number 1/10, January 2010
and Boschen and Mills (1995), use a wider range of values to indicate the intensity of
monetary stance in either directions. For example, the index derived by Boschen and
Mills (1995) ranges from 2 to -2, with a value of 2 indicating monetary stance placing
a strong emphasis on promoting economic growth while a value of -2 a strong policy
emphasis on inflation reduction. There are also studies which derive an index by the
combined use of monetary policy records and conventional monetary stance measures.
Romer and Romer (2004) develop a new measure of monetary policy shocks in the
US for the period 1969 - 1996 by combining information on the Federal Reserve’s
expected funds rate and records of FOMC meetings.
The monetary stance indices have been used in a variety of ways. One is to examine
the impact of monetary policy on macroeconomic variables, e.g. Boschen and Mills
(1995) and Romer and Romer (2004) for the US and Angelopoulou (2007) for the UK.
Another use of monetary stance indicators is to examine the factors affecting a central
bank’s decision on monetary stance. The framework for the quantitative studyof the
determinants of monetary stance was initiated by Taylor (1993) in the form of a
regression of the federal funds rate on the output gap and inflation. Regressions of
this form are now known as monetary reaction functions, or the Taylor rule, an
important analytical tool of central banks. The monetary reaction function has been
estimated for many economies, both developed and developing, in many different
variants of the Taylor rule. More well known studies in this area include Nelson
(2000), and Batini and Nelson (2000) for the Bank of England, Judd and Rudebusch
(1998) for the Federal Reserve, Gerlach and Schnabel (2000) using pre-EMU data,
and Faust et al. (2001) for the European Central Bank. This analysis has also been
undertaken for a number of Asian central banks, such as Shen and Chen (1996) and
Huang and Lin (2006) for the Central Bank of China in Taiwan, and Liu and Zhang
(2007) and He and Pauwels (2008) for the PBoC. Central banks’ policy decisions in
response to changing economic conditions have been studied from both descriptive
and prescriptive perspectives (Svensson, 2003). A descriptive perspective study
focuses on how to best characterise a central bank’s behaviour, while from a
prescriptive approach, research examines what kind of rules are best at stabilising
output and inflation in different macroeconomic models.

7
III. Monetary tools, macroeconomic developments and monetary stance in China
since 2000
The PBoC, being responsible for monetary policy in China, has the dual legal
mandate of ‘maintaining the stability of the currency, and thereby promoting
economic growth’. It also has the responsibility of maintaining financial stability,
although not explicitly stated. The PBoC’s MPC was formed in 2000 and is charged
with the responsibility to discuss and propose (a) adjustments in monetary stance; (b)
aims of monetary policy; (c) use of monetary tools; and (d) macroeconomic policy co-
ordination measures. The Committee consists of 11 members including the Governor
and Deputy Governors of the PBoC, representatives from government
ministries/agencies1
, two governors of state-owned banks and an independent
financial professional. The MPC meeting is convened quarterly, with a short
statement released after the meeting to summarise the Committee’s views on
economic and financial developments and proposed monetary stance. The MPC
meeting reports will be submitted to the State Council when the PBoC seeks approval
on monetary policy decisions. As such, the MPC in China is largely a consultative
body, making it different from its counterparts in many other countries. However, its
views on economic developments and monetary stance represent the official position.
Separately, the PBoC also releases a quarterly Monetary Policy Report, which gives
more details on the PBoC’s review and assessment on macroeconomic and policy
developments, as well as its policy intentions.
In conducting monetary policy, the PBoC uses a range of tools, including both
quantity- and price-based, market based and non-market based measures (Table 1).
They broadly fall into a few categories.
� Open Market Operations (OMOs). These are market-based and conducted on a
regular, high frequency basis. In these operations, the PBoC controls the amount,
price, frequency and composition of central bank bill issuance, and repurchase
and reverse repurchase arrangements to influence liquidity in the banking system.
1 These institutions include the State Council, National Development and Reform Commission (NDRC),
Ministry of Finance (MoF), State Administration of Foreign Exchange (SAFE), National Bureau of
Statistics (NBS), China Banking Regulatory Commission (CBRC), China Securities Regulatory
Commission (CSRC) and China Insurance Regulatory Commission (CIRC).

8
China Economic Issues – Number 1/10, January 2010
� Selective transactions. These are used in some episodes of excess liquidity and
rapid credit expansion, including targeted bill issuance to selected banks, special
deposits from selected banks, and foreign currency swaps between the PBoC and
commercial banks.
� Reserve requirement. The required reserve ratio (RRR) is a quantity-based,
market tool often used in monetary easing and tightening cycles.
� Interest rates. The adjustment of benchmark lending and deposit rates is a
market-, price-based tool that has been used more in macroeconomic
management in recent years, although its use has been constrained at times by, for
example, concerns over capital inflows.
� Credit controls. The above more market-based tools often have to be
supplemented by the use of direct controls on credit expansion, which is a
quantity-, non-market based tool.
� Other regulatory means. Examples of these include adjustment in the proportion
of down payment in mortgage lending, and the permitted range for interest rates
to deviate from the benchmark interest rates.
Information on the more market-based means, including OMOs, reserve requirement,
and interest rates is released by the PBoC in a systematic way. Data on targeted bill
issuance, special deposits, foreign currency swaps and credit controls are generally
not available officially. Partial information may be reported by the media from time
to time.

9
Table 1. PBoC’s monetary tools
Market based Non-market based
Quantity based � Issuance size of central
bank bills
� Size of repurchase and
reverse repurchase
arrangements
� Reserve requirement
� Targeted central bank
bills
� Special deposits from
selected banks
� Foreign currency swap
� Control on credit
Price based � Issuance rate of central
bank bills
� Rate of repurchase and
reverse repurchase
arrangements
� Benchmark lending
and deposit interest
rates
� Some regulatory
changes aimed at
changing market
behaviour, e.g. varying
the floating band of
interest rates
Sources: Authors’ compilation.
Chronology of macroeconomic developments and monetary stance since 2000
Starting in 2001 when both the press releases and the quarterly Monetary Policy
Reports became available, China has undergone several phases of macroeconomic
developments (Charts 1-2): (a) an economic recovery from the Asian financial crisis
with broadly supportive monetary policy between 2001 and 2002; (b) a gradually
increasing tightening bias from the turn of 2003 which cumulated into a relatively
brief, strong tightening in the first half of 2004 upon signs of overheating; (c)
continuing robust economic growth under monetary policy with a tightening bias
during 2004 Q3 and 2007 Q1; (d) intensive tightening in 2007 Q2 – 2008 Q2 due to
high inflationary pressures and rapid investment growth; and (e) substantial monetary
easing against the background of a global financial crisis from 2008 Q3 to 2009 Q2.

10
China Economic Issues – Number 1/10, January 2010
Chart 1. Major macroeconomic indicators
a. GDP growth and inflation b. Investment and exports
5
7
9
11
13
15
2001Q1 2002Q1 2003Q1 2004Q1 2005Q1 2006Q1 2007Q1 2008Q1 2009Q1
-4
-2
0
2
4
6
8
10
CPI (RHS) GDP (LHS)
%YoY % YoY
Strong
tightening
Tightening
Strong
loosening
Loosening
-30
-20
-10
0
10
20
30
40
50
2001Q1 2002Q1 2003Q1 2004Q1 2005Q1 2006Q1 2007Q1 2008Q1 2009Q1
-30
-20
-10
0
10
20
30
40
50
Export
FAI
%YoY %YoY
Strong
tightening
Tightening
Strong
loosening
Loosening
Chart 2. Selective policy changes
a. OMO and RRR b. Interest rates
-8
-4
0
4
8
12
16
20
2001Q1 2002Q1 2003Q1 2004Q1 2005Q1 2006Q1 2007Q1 2008Q1 2009Q1
-400
-200
0
200
400
600
800
1000
Open market operations (RHS)Required reserve ratio (LHS)
% RMB bn
with
draw
alin
jectio
n
Strong
tightening
Tightening
Strong
loosening
Loosening
Sources: CEIC and authors’ estimates.
4
5
6
7
8
2001Q1 2002Q1 2003Q1 2004Q1 2005Q1 2006Q1 2007Q1 2008Q1 2009Q1
0
1
2
3
4
1-year lending rate (LHS)
3-month central bank bill issuance rate (RHS)
%, pa %, pa
Strong
tightening
Tightening
Strong
loosening
Loosening
2001 – 2002 Q3: policy support for economic recovery
During this period, the Mainland economy gradually recovered from the slowdown
caused by the Asian financial crisis. Externally, after a synchronised recession
following the September 11th
incident, the global economy began to pick up in 2002.
Upon the recovery of the global economy and positive impacts from the entry to the

11
WTO, China’s exports rose sharply in 2002 by 31.0%, compared with the average
10.6% between 1997 and 2001. Domestically, private consumption started to return.
As a result of the expansionary fiscal policy and accommodative monetary policy,
investment grew by 17.4%, the highest since the outbreak of the Asian financial crisis,
although still considered modest when compared with the figures for recent years.
Deflationary pressures persisted due to the impact on domestic prices of the WTO
entry and excess supply of consumer goods.
Throughout this period, monetary policy, while defined as ‘sound’ (穩健)2, had an
easing bias. With aggregate demand just starting to return and the existence of
deflationary risks, monetary policy was aimed at ‘preventing economic growth and
prices from further declines’ (PBoC, 2002 Q2). Notably, the PBoC lowered the 1-
year lending and deposit rates by 54 and 27 basis points respectively in January 2002.
2002 Q4 – 2004 Q2: gradual tightening cumulated into brief, forceful credit controls
The Mainland economy entered a period of rapid growth. The recovering world
economy and China’s continuing expanision in the global market contributed to a
rapid export growth at year-on-year rates above 30% throughout the period. Signs of
overheating in investment began to surface around the turn of 2003 (PBoC, 2002 Q4
and 2003 Q1), particularly in certain sectors such as the real estate sector, with
investment expanding by 28.4% in 2003 and surging by 47.8% in 2004 Q1. This was
supported by a surge in credit expansion, as credit growth rose from 15.8% in 2002 to
an average of 21.5% between 2003 Q1 and 2004 Q1. With rising international
commodity prices, a pick-up in food prices, and easy monetary conditions in the
previous years, China quickly shook off deflation that prevailed in 2002. Prices rose
sharply from 2003, with headline inflation increasing from 0.5% in 2003 Q1 to 4.4%
in 2004 Q2.
The accommodative stance began to be withdrawn from 2002 Q4. The wording
‘strengthen financial support to economic growth’ found in many previous PBoC
Monetary Policy Reports was removed from the report of 2002 Q4. While still
termed ‘sound’ (穩健), monetary policy turned to an increasing tightening bias in
2 These are the terms used in the official reports.

12
China Economic Issues – Number 1/10, January 2010
2003, with the PBoC highlighting the need to ‘control the quantity of money and
credit’ in the second half of 2003 (PBoC, 2003 Q4). Tightening was initially
achieved principally through quantitative means. OMOs were strengthened in 2003,
particularly with the introduction of issuance of central bank bills for sterilisation.
The RRR was raised by one percentage point in 2003 Q3 - the first time since the
Asian financial crisis, and then another 50 basis points in 2004 Q2. In 2004 Q1, the
surge in investment prompted a more forceful action from the PBoC. Monetary
stance was shifted from ‘sound’ (穩健) – a stance maintained since the availability of
the MPC record in 2000 – to ‘appropriately tight’ (適度從緊), and credit quotas were
implemented.
2004 Q3 – 2007 Q1: continuous, moderate tightening upon persistent overheating
pressures
Following the imposition of credit controls, investment plunged in 2004 Q2, with the
year-on-year growth halving to 24%, and thus leading to a slight ease of the monetary
policy compared with 2004 Q1. In the ensuing years, economic growth remained
robust, averaging 11.2% year on year between 2005 and 2007 Q1. During the period,
overheating risks of the domestic economy persisted and grew over time. With strong
growth impulses at the regional level, investment expanded at rates of close to 30%
during most of the period. This was supported by an acceleration of credit expansion,
particularly since 2006. Credit growth, having stayed low for most of 2004-2005,
accelerated between 2006 Q1 and 2007 Q1. External imbalances also began to mount.
Exports grew at much faster rates than imports, leading the trade surplus to jump by
more than 50% between 2004 and 2006. The large trade surpluses and large capital
inflows placed upward pressures on the exchange rate. After easing from the second
half of 2004, inflation stayed moderate in 2005-6, but began to rise in early 2007.
While dropping the phrase ‘appropriately tight’ (適度從緊) for monetary stance after
just one quarter and re-adopting that of ‘sound’ (穩健) in 2004 Q2, monetary policy in
fact had a tightening bias during the period. ‘Macroeconomic adjustment’ (宏觀調控)
was the constant tone in policymaking, although the intensity of tightening varied
during the period. In 2004 some strong tightening was still implemented, reflected by
a further hike of 50 basis points in the RRR in April 2004, and a rise of 27 basis

13
points 1-year benchmark interest rates in October 2004. The tightening stance was
eased in 2005 and early 2006 with reduced use of policy instruments. However, as
the credit growth and inflationary pressures started to pick up in 2006, the PBoC
stepped up tightening again. The more intensive tightening was set in train by an
increase in the 1-year benchmark lending rate in April 2006, and then followed by
successive hikes in required reserves and various interest rates. In particular, the RRR
was raised from 7.5% at the start of 2006 to 10% in 2007 Q1. Meanwhile, the 1-year
benchmark lending and deposit rates were increased by 81 and 54 basis points
respectively. The issuance rate on the 3-month central bank bills was also guided
upward by 85 basis points. These were supplemented by several targeted bill issuance,
regulations to tighten mortgage lending, and increasingly frequent window guidance
meetings.
2007 Q2 – 2008 Q2: intensive monetary tightening to curb overheating and high
inflation
The economy continued to grow rapidly despite a weakening in the global economy
during this period. Although economic growth in the major economies began to slow
when the sub-prime crisis started to unfold in the second half of 2007, growth in
China’s exports appeared unfettered and trade surpluses carried on ballooning.
Domestic demand was very strong. In particular, investment growth maintained a
30% growth during most of the period. There were signs of overheating in the
property market, as indicated by an acceleration in housing-price inflation and marked
increases in transactions. Due to a surge in food prices, inflation began to run away,
with headline inflation peaking at 8.0% in 2008 Q1.
This period saw the tightest use of monetary policy with frequent and strong actions
by the PBoC. The monetary stance was explicitly shifted from ‘sound’ (穩健) to
‘appropriately tight’ (適度從緊)’ in 2007 Q2, and then further to ‘tight’ (從緊) in the
first half of 2008. There was substantial liquidity withdrawal through OMOs. The
RRR was raised thirteen times by a total of 700 basis points within the period. The 1-
year benchmark lending and deposit rates were raised by 108 and 135 basis points
respectively between April and December 2007. In addition, the PBoC also
implemented a number of unconventional tools, including special transactions with

14
China Economic Issues – Number 1/10, January 2010
selected banks, the regulatory and administrative means. Apart from more frequent
use of targeted bills, some banks were also requested to place special deposits with the
PBoC for a term of three years, and the PBoC is also known to have conducted
foreign currency swaps with commercial banks. With the interest rate constrained by
concerns over attracting further capital inflows, credit controls were used as the
principal means at the later stage of monetary tightening. Reportedly, the annual and
quarterly credit quotas were set at the beginning of 2008 – the first time quarterly
quotas were used, reflecting the authorities’ determination to control credit expansion.
2008 Q3 – 2009 Q2: massive monetary easing to counter a sharp economic slowdown
The lagged impact of forceful macroeconomic tightening coincided with a collapse of
the world economy in the middle of 2008. As the major economies went into a
synchronised recession, external demand waned. China’s exports plunged, recording
a year-on-year decline of over 20 percent in the first eight months of 2009 – a stark
contrast with an expansion of over 20% in the same period in 2008. Domestic
production followed suit, and investment weakened. In particular, the year-on-year
growth of investment in real estate decelerated sharply from 37.5% in June 2008 to a
meagre 1.0% in January - February 2009, contributing significantly to the economic
downturn. The easing of domestic food prices, collapse of international commodity
prices and weak aggregate demand led consumer prices to decline in early 2009 upon
year-on-year comparisons.
Responding to the collapse in external demand and faltering domestic demand, the
change in monetary stance was dramatic. After dropping the ‘tight’ (從緊) stance in
2008 Q2, the PBoC stated that monetary policy was turned ‘appropriately loose’ (適
度寬鬆) in 2008 Q3. Unprecedented monetary loosening was undertaken from 2008
Q3. OMOs were dramatically scaled down, with the suspension of issuance of central
bank bills with maturities over one year and less frequent issuance of 3-month bills.
The RRR was reduced by 2.0 and 4.0 percentage points for big and small banks
respectively between September and December 2008. Special deposits by some
banks, which were arranged during 2007 Q4 as another means of locking in liquidity,
were allowed to be withdrawn early. Key policy rates were also slashed. Central

15
bank bill issuance rates were guided lower, with the 3-month central bank bill rate
falling from 3.40% at the end of June 2008 to 0.97% at the end of January 2009. The
1-year benchmark lending and deposit rates were slashed by 2.16 percentage points
and 1.89 percentage points to 5.31% and 2.25% respectively in less than four months.
Also, in view of the importance of the property market in the economy, the floor for
mortgage rates was lowered from 0.9 to 0.7 of the benchmark lending rate, allowing
greater freedom in mortgage pricing. As at the height of monetary tightening in the
second half of 2007 and the first half of 2008, administrative measures proved to be
useful in monetary easing. Most notably, credit ceilings, which were imposed in the
second half of 2007, were removed in November 2008. Then at the beginning of
2009, a target of RMB5 trillion was announced for new loan expansion for the year as
a whole, but the figure was soon explained as the floor (rather than the ceiling) by
official sources.
IV. An indicator of monetary stance
As the discussions in previous sections have shown, the use of the narrative approach
has been motivated by the difficulty in finding an appropriate measure for monetary
stance. Lack of a good indicator of monetary stance is a particularly acute problem
for China, an observation also made by He and Pauwels (2008). The benchmark
interest rate is sometimes not the chosen instrument in monetary control for a number
of reasons. First, it is generally recognised that in China, the transmission of policy
rate changes to the wider economy is not effective due to the under-developed
financial markets (see, for example, Peng et al. (2006), and Liu and Zhang (2007)).
Secondly, the use of the interest-rate tool is sometimes constrained by factors other
than domestic considerations such as concerns over capital inflows (Shu et al., 2008).
In addition, the discussion on China’s monetary tools in the earlier sections shows that
apart from market-based tools, non-market based tools are also used such as special
deposits, foreign currency swaps and more common credit controls. The problem of
measuring monetary policy stance is further exacerbated by the PBoC’s reliance on
the use of administrative controls, such as window guidance, which is unobservable
and not quantifiable in nature. Due to the limited availability of information, it is not
possible to directly measure the use of these tools. Despite these known issues,

16
China Economic Issues – Number 1/10, January 2010
China’s monetary policy is still typically measured by observable changes in the
interest rate and other tools. One exception is He and Pauwels (2008) who derive an
indicator of the PBoC’s monetary policy stance as a latent variable extracted from the
changes in a large number of economic variables.
In this paper, we follow the narrative approach to compile a monetary stance index of
the PBoC by drawing information from the quarterly release of the PBoC’s Monetary
Policy Report and the announcement of the quarterly meeting of the PBoC’s MPC.
Each issue of the Monetary Policy Report contains the PBoC assessments on the past
development of monetary conditions, the use of monetary policy tools, financial
market development and macroeconomic development, the prospect of the Mainland
economy and the tendency of monetary policy in the periods ahead. The
announcement of the quarterly meeting of the PBoC’s MPC also provides similar
information but with a much condensed content.
In constructing the monetary policy stance indicator, we take into account, apart from
the stated broad policy direction, information such as the PBoC’s assessments on the
near-term overall economic performance and the aims of macroeconomic adjustment.
As shown earlier, while the broad policy direction is often stated as ‘sound’ (穩健),
monetary stance could have a different bias according to economic conditions. For
example, under the ‘sound’ (穩健) policy direction, monetary stance was largely
accommodative during 2001-2002, which became more restrictive during 2004 Q2
and 2007 Q1. Thus the concerns emanating from these reports over the state of the
economy, inflationary pressures and monetary growth may also help in analysing the
direction and intensity of the PBoC’s policy actions.
We construct three monetary stance indices. The values of the first index range from
-2 (indicating strong loosening) to 2 (indicating strong tightening), with 0 being a
neutral policy stance for each period (Table 2a). Intensive tightening is taken as the
periods when the PBoC stated monetary stance to be ‘appropriately tight/tight’ (適度
從緊/從緊), while intensive loosening was given to stated stance of ‘appropriately
loose’ (適度寬鬆). For the majority of the periods, the officially stated stance is
‘sound’ (穩健). To code these periods, we further draw on the PBoC’s assessments of
economic developments, and assign values of 1 for the existence of greater upside

17
risks for growth and inflation, -1 for greater downside risks for growth and deflation,
and 0 for broadly balanced risks. We also attempt to further differentiate the degree
of intensity in monetary stance, and derive an index with values ranging from -3
(indicating highest degree of loosening) to 3 (indicating highest degree of tightening).
The statements of ‘appropriately tight/tight’ (適度從緊/從緊) and ‘appropriately
loose’ (適度寬鬆) take the value of 3 and -3 respectively. It is more challenging to
differentiate the intensity of tightening and loosening stance with the stated stance of
‘sound’ (穩健). Table 2b gives examples of the wording in the Monetary Policy
Report and the press release of the MPC meeting for the 7-value indicator. A third
index, with three values (-1, 0 and 1 for ‘easing’, ‘neutral’ and ‘tightening’
respectively), does not differentiate the intensity of the monetary stance.
One issue in applying the narrative approach is the divergence between ‘words’ and
‘deeds’. The divergence arises either when a central bank does not or is unable to
follow its stated policy stance, or when it undertakes measures which are not
disclosed to the public. Both types of divergence occur from time to time around the
world. The implementation of monetary policy is subject to many constraints, and
thus monetary stance inferred from a central bank’s stated stance may reflect the
desired rather the true policy stance. This makes it difficult to apply the narrative
approach to studying monetary stance. On the other hand, a central bank may employ
some monetary tools (e.g. credit controls, foreign currency swaps in the case of China)
which are not fully known by the public. This second type of divergence between
‘words’ and ‘deeds’ in fact strengthens the case for using the narrative approach for
China.

18
China Economic Issues – Number 1/10, January 2010
Table 2a. 5-value monetary stance: coding criteria
Criteria
2 (Strong tightening) � Tight (從緊)
� Appropriately tight (適度從緊)
1 (Tightening) � Sound (穩健) with a tightening bias
0 (Neutral) � Sound (穩健)
-1 (Loosening) � Sound (穩健) with a loosening bias
-2 (Strong loosening) � Appropriately loose (適度寬鬆)
Sources: Authors’ compilation.
The 5-value index shows that China’s monetary policy cycles since 2001 can
generally be categorised into three broad phases – an easing bias before 2002 Q4;
tightening between 2002 Q4 and 2008 Q2; and easing since 2008 Q3 (Chart 3a), with
more periods with a tightening bias. Chart 3b displays the 5-value monetary stance
index of the PBoC with the benchmark 1-year lending rate. The chart shows that this
index is better at picking up changes in monetary stance in the early 2000s. It points
to a reverse of monetary stance from loosening to tightening in 2003 with the use of
OMOs, required reserve and window guidance, even though there were no changes in
the benchmark interest rate. In more recent years, there are increasing co-movements
between the index and the interest rate, suggesting that market- and price-based tools,
although still supplemented by non-market-based means, are playing an increasing
role in China’s monetary policy.

19
Chart 3. Monetary stance indicators and interest rates
a. 3- and 7-value indicators b.5-value indicator and interest rate
-4
-3
-2
-1
0
1
2
3
4
2001Q1 2002Q1 2003Q1 2004Q1 2005Q1 2006Q1 2007Q1 2008Q1 2009Q1
-4
-3
-2
-1
0
1
2
3
4
3-value monetary stance indicator7-value monetary stance indicator
Tig
hte
nin
g
Strong
tightening
Tightening
Strong
loosening
Loosening
-4
-3
-2
-1
0
1
2
3
4
2001Q1 2002Q1 2003Q1 2004Q1 2005Q1 2006Q1 2007Q1 2008Q1 2009Q1
4
5
6
7
8
9
1-year lending rate (RHS)5-value monetary stance indicator (LHS)
Tig
hte
nin
g
%, pa
Strong
tightening
Tightening
Strong
loosening
Loosening
Sources: CEIC and authors’ estimates.
V. Monetary objectives: an empirical investigation
Empirical framework
Identifying factors that affect the PBoC’s monetary stance can shed light on what the
PBoC’s policy objectives are and how important they are. To this end, we can
estimate a monetary policy reaction function in which a monetary policy indicator is
regressed on factors affecting policy decisions in the spirit of Taylor (1993) who
suggests the formulation of monetary policy rule depends on the deviation of real
GDP growth and inflation from targets. Although short-term interest rates are often
employed as the dependent variable,3 the use of an index of monetary stance, i.e. a
discrete variable, as the dependent variable has become more common in recent
studies on monetary reactions. It is not just limited to those which follow the
narrative approach to derive indices of monetary stance, including Shen and Chen
(1996) and Huang and Shen (2002). As interest rates typically move in multiples of
25 basis points, some studies e.g. Vanderhart (2000) and Carstensen (2006), also
model interest-rate movements as discrete jumps.

20
China Economic Issues – Number 1/10, January 2010
In the benchmark model, we include economic growth and inflation – the two
objectives defined by the PBoC mandate – as explanatory variables for monetary
stance. Following examples of Taylor (1993) and the subsequent studies in this area,
the PBoC’s monetary reaction is thus specified as:
(1) tititititt yyMP εβββ +−+−+= −−−− )inf(inf)( *
2
*
10 .
In Equation (1), tMP is a monetary policy stance indicator derived from the narrative
approach, and the three indicators discussed above will be used as alternatives. The
factors considered to affect monetary stance are specified as deviations from a target.
Thus, yt-i and inft-i are actual real GDP growth and CPI inflation, while *
ity − and
*inf it− are growth and inflation targets respectively. Both 1β and 2β are expected to
be positive, implying that the central bank will tighten monetary stance if economic
growth and inflation are above their targets.
A number of targets are considered for estimation. One obvious choice in China’s
case is the announced annual targets. The economic targets announced every year
include those for economic growth, inflation, monetary and credit growth, and
unemployment.4 Among the announcements, figures for growth and inflation receive
the greatest attention (Chart 4a). It is also important to point out that the announced
figures are not targets, although often referred to as such. It is more accurate to
describe them as a floor for economic growth, and a ceiling for inflation. The target
setting has taken into account the performance of the economy. As China has largely
maintained robust economic growth since 2000, the growth target has been largely
stable, revised only once in 2005 from 7% to 8%. Price developments have been
more varied since 2000, with a period of deflation in the early 2000s, regular, at times
intensive, inflationary pressures from 2003 to the first half of 2008, and downward
pressures on prices from the second half of 2008 and for most of 2009. Accordingly,
3 See, for example, Taylor (1993) using the federal funds rate for the US, Carstensen (2006), and
Gerlach (2007) using the ECB main refinancing rate for the Euro-area. 4 The official targets are obtained from the National People’s Congress report on economic, social
development plan, and the PBoC Monetary Policy Reports.

21
the inflation target was adjusted downward from 1-2% in 2001-2002 to 1% in 2003,5
but has subsequently been revised upwards for a number of times. Chart 4b shows
that the economic growth target is generally conservatively set, as growth outturns
exceeded the target in all years. Even in 2009 when at the beginning of the year there
were doubts, consensus emerged later that the target would be met given the strength
of the rebound in the domestic economy. One reason for the conservative setting of
growth targets may be to restrain local governments from excessive investment.
There also have been deviations of actual inflation, in both directions, from the
announced ceiling.
Chart 4. Growth and inflation deviations from official targets
a. Official targets b. deviations from official targets
-6
-4
-2
0
2
4
6
8
10
2001Q1 2002Q1 2003Q1 2004Q1 2005Q1 2006Q1 2007Q1 2008Q1 2009Q1
-6
-4
-2
0
2
4
6
8
10
Series4Series5CPI - official targetGDP - official target
%YoY %YoY
Strong
tightening
Tightening
Strong
loosening
Loosening
Sources: NPC reports and Zhang and Liu (2007).
-6
-4
-2
0
2
4
6
2001Q1 2002Q1 2003Q1 2004Q1 2005Q1 2006Q1 2007Q1 2008Q1 2009Q1
-6
-4
-2
0
2
4
6
CPI - deviation from official target
GDP - deviation from official target
%YoY %YoY
Strong
tightening
Tightening
Strong
loosening
Loosening
Sources: CEIC and authors’ estimates.
In addition to the official targets, two measures of the trend development of an
economic indicator are considered as alternative measures of targets. Following a
common practice of the literature in the area, e.g. Huang and Lin (2006), the Hodrick-
Prescott filter is used to derive a trend line. A third measure of trend growth of an
economic variable is the historical average, taken as a 5-year moving average in this
study. Charts 5a and 5b show the deviations of growth and inflation from historical
5 For most years, the inflation target is specified as “not above” a particular figure. One exception is
2001-2002, when the inflation target was given as the range of 1 - 2%.

22
China Economic Issues – Number 1/10, January 2010
averages, and trend growth derived from the Hodrick-Prescott filter. Real GDP
growth and inflation have shown deviations in both directions from the targets taken
as historical averages and the Hodrick-Prescott filtered trend. Charts 5a and 5b show
that deviations from the official targets and historical averages tally well with the
economic cycles described earlier. However, deviations from the Hodrick-Prescott
filtered trend do not accord well with the swings in economic activity in China, as
discussed in the earlier sections. For example, these deviations show a more or less
continuous undershoot of economic growth for 2003 – 2006 when there were
overheating pressures particularly towards the end of the period.
Chart 5 Deviations of growth and inflation
a. From historical averages b. From trend
-6
-4
-2
0
2
4
6
2001Q1 2002Q1 2003Q1 2004Q1 2005Q1 2006Q1 2007Q1 2008Q1 2009Q1
-6
-4
-2
0
2
4
6
CPI - deviation from historical average
GDP - deviation from historical average
%YoY %YoY
Strong
tightening
Tightening
Strong
loosening
Loosening
-2
-1
0
1
2
3
2001Q1 2002Q1 2003Q1 2004Q1 2005Q1 2006Q1 2007Q1 2008Q1 2009Q1
-2
-1
0
1
2
3
CPI - deviation from HP filtered trend
GDP - deviation from potential output
ppt ppt
Strong
tightening
Tightening
Strong
loosening
Loosening
Sources: CEIC and authors’ estimates.
This equation can be extended to include other policy target variables. In China’s
case, we also test the significance of other economic targets including unemployment,
and monetary and credit growth, as these are included routinely as part of annual
announcements. The descriptive statistics of the key explanatory variables are given
in Table 3.

23
Estimation methodology
Equation 1 can be estimated by the ordered probit and logit model. Since the
application by Eichengreen, Watson, and Grossman (1985) on the monetary reaction
function of the Bank of England, the ordered probit and logit models have been
widely employed in this literature when the monetary stance indicator is a discrete
variable. In these models, the observed discrete dependent variable is modelled by a
latent variable *MP that has a linear relationship with the explanatory variables:
(2) ttt xMP εβ += '* .
In Equation 2, '
tx is a vector of k explanatory variables at time t, including economic
growth, inflation, monetary and credit growth, and unemployment, and β is a k x 1
vector of coefficients and tε is random errors distributed as N(0,1). In the case of the
monetary indicator with five values, for example, the latent variable *MP has the
following relationship with the observed variable tMP :
(3) =tMP
<
≤<
≤<
≤<−
≤−
*
4
4
*
3
3
*
2
2
*
1
1
*
2
1
0
1
2
t
t
t
t
t
MPif
MPif
MPif
MPif
MPif
λ
λλ
λλ
λλ
λ
,
and has the following probabilities:
)(),,2Pr( '
1 βλλβ ttt xxMP −Φ=−=
)()(),,1Pr( '
1
'
2 βλβλλβ tttt xxxMP −Φ−−Φ=−=
(4) )()(),,0Pr( '
2
'
3 βλβλλβ tttt xxxMP −Φ−−Φ==
)()(),,1Pr( '
3
'
4 βλβλλβ tttt xxxMP −Φ−−Φ==
)(1),,2Pr( '
4 βλλβ ttt xxMP −Φ−== ,

24
China Economic Issues – Number 1/10, January 2010
where Φ is the cumulative normal distribution in the case of a probit model, or the
cumulative logistic distribution in the case of a logit model. The threshold values
‘ λ ’s and the coefficients ‘ β ’s can then be estimated by maximising the following log
likelihood function:
(5) ∑∑= −=
=⋅==T
t j
iit jyxjMPl1
2
2
)(1)),,log(Pr(),( λβλβ ,
where j is the ordered category from -2 to 2, and )(1 jyi = is an indicator function
which takes 1 when jyi = , and 0 otherwise.
Using this procedure, Equation 1 will be estimated using quarterly data between 2001
Q1 and 2009 Q2. The dynamics of the model will be determined by a general-to-
specific search procedure.
VI. Findings and analysis
Benchmark results
We use the estimations for the indicator with five values (from -2 to 2) as the
benchmark results, presented in Table 4.6 In the basic specification with only growth
and inflation when the official targets are used (Column 1 of Table 4), the coefficients
on economic growth and inflation are highly significant, demonstrating the
importance that the PBoC attaches to its legal mandate of maintaining stable
economic growth and low inflation. Among the two targets, the policy response for
economic growth is stronger than that for inflation.7 This suggests that the PBoC
shows stronger reaction to each percentage-point deviation in economic growth from
the official target than that for inflation. The stronger policy response to economic
growth may suggest that real GDP growth is taken as a good summary indicator of
economic developments, and monetary policy is believed to have a strong impact on it.
6 This and all other specifications have been estimated by both the probit and logit models, and the
results are very similar. All the results presented are from the logit model estimation, which offers
slightly better fit of the data.

25
Monetary policy also influences inflation. However, some volatile items in the
consumer price index such as food may be influenced by non-monetary factors such
as weather conditions, while utility prices are still subject to administrative controls in
China. Under the circumstances, other means have been used to complement
monetary policy in controlling inflation, and monetary response to inflation
movements is thus milder. For example, in early 2008 when there were heightened
concerns about inflation, measures were announced by the National Development and
Reform Commission and State Council to stabilise prices.
The model has reasonable explanatory power. For 69.7% of the 33 observations, the
implied monetary stance based on the estimated model correctly signals the actual
stance.
Among the other economic objectives, monetary and credit growth, and
unemployment, are largely not statistically significant, and often carry a wrong sign
(Columns 2 - 4 of Table 4). The PBoC does not appear to directly react to changes in
monetary conditions, or the employment situation.8
The results are broadly similar to the estimation using historical averages as targets
(Columns 5 - 7 of Table 4). Both economic growth and inflation are important
determinants of monetary stance, with growth being a more significant factor. The
basic specification with only growth and inflation improves on the goodness of fit
compared with that using the official targets. Monetary stance is correctly signalled
in 75.8% of the cases. It is better at accurately signalling tightening stance, being
correct in 86.3% of the time (Table 5). The success rate drops to 62.5% for signalling
loosening stance, and one third for neutral stance.
The better predictive power of using historical averages in the estimation model may
suggest that a rule of thumb in policymaking using historical averages may be a better
description of the PBoC’s targets than the annual official announcements. This may
be explained by the way official targets are set which is discussed earlier. For
7 The size of policy response to one target is calculated as the coefficient on the target multiplied by the
standard deviation of the target. 8 It is possible the estimation is affected by poor unemployment data. They only take into account
urban residents who are registered as being unemployed at local employment service agencies. Given
the limited coverage, the statistics may not be representative of developments in the labour market.

26
China Economic Issues – Number 1/10, January 2010
example, with the Central Government’s intention to regulate the growth impulse on
the part of local governments, the growth target is typically set conservatively. As the
outturns of growth almost always exceed the official targets (with the exception of
2008 Q4 – 2009 Q2 amidst the severe global recession), the latter may not be
considered to be binding in policymaking. On the other hand, historical averages may
be perceived to be more representative of the underlying growth potential of the
economy, and thus be given more attention.
In contrast, the results from using the Hodrick-Prescott filtered trend growth as the
target are much weaker (Columns 8 - 10 of Table 4). The coefficient on the output
gap is not always highly significant, and that of the CPI fails to have any significance.
This perhaps is not surprising. As observed earlier, deviations of economic indicators
from the Hodrick-Prescott filtered trend do not capture China’s economic cycles well.
Indeed, this may explain our general finding of stronger policy reaction to GDP
growth which differs from that of He and Pauwels (2008). They show that the PBoC
reacts more strongly towards deviations of inflation from the target than the output
gap, where the output gap is derived from applying the Hodrick-Prescott filter.
Robustness check
We also undertake the estimation for the other two monetary stance indicators, one
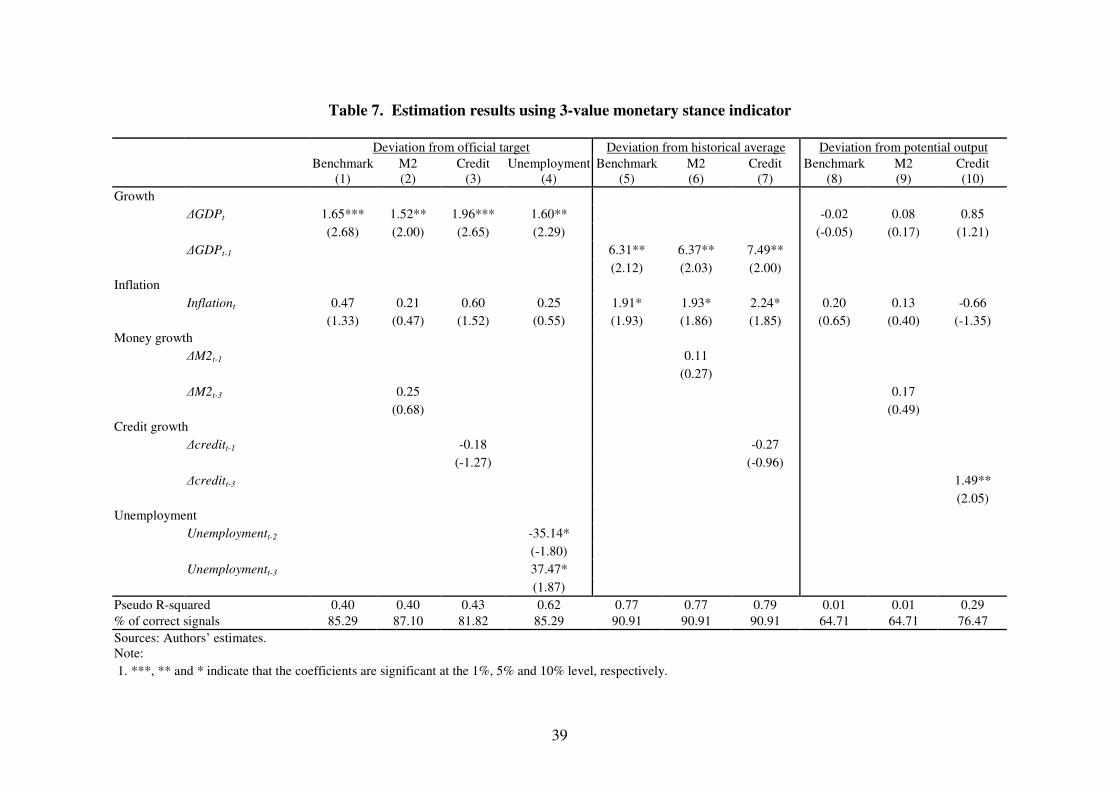
with seven values and the other three values (Tables 6 and 7). The major results from
the estimation of the 5-value indicator are broadly born out by those for the 7-value
and 3-value indicators. Importantly, real GDP growth and inflation are found to be
the most important policy objectives, with a strong policy response to real GDP
growth. Other policy objectives such as monetary and credit growth, and
unemployment do not have significant impacts on monetary policy. Among the
models using different sets of targets, the ones with historical averages as the target
have the best fit for the data, while those with the Hodrick-Prescott filtered trend
growth are the poorest.
Also we have experimented with eight and 10 years as the window for calculating
historical averages as monetary targets in estimating monetary reaction functions.

27
Again, the results are broadly similar as above. Most notably, using historical
averages stays the best way of describing the PBoC’s policy targets.
While the major findings are robust, the explanatory power varies among the three
different monetary stance indicators. The explanatory and predictive power rises as
the number of values in an index declines, probably reflecting difficulties in
differentiating the intensity of monetary stance. The model of the 7-value indicator
has the lowest predictive power, making correct predictions in 59.4% of the cases in
the benchmark specification with only growth and inflation included as policy
objectives, and historical averages as the target set. That rises to 75.8% for the model
of the 5-value indicator, and further to over 90.9% for the model of the 3-value
indicator. Most notably, the model of the 3-value indicator is 100% correct in
predicting tightening stance (Table 8). Also similar to the predictions of the model
using the 5-value indicator, the success rate is lower for predicting loosening stance
(87.5 percent), and the lowest for neutral stance (one third).
VI. Concluding remarks
The paper is the first attempt to follow a narrative approach to derive indicators of the
monetary stance of the PBoC. This is motivated by the observation that the PBoC
uses a wide range of monetary tools, including market- or non-market based, quantity-
and price-based measures. Under the circumstances, using the benchmark interest
rate – a measure of short-term policy rates often used to gauge central banks’
monetary stance – cannot fully capture monetary policy changes in China. Our
approach is to utilise public records, specifically the PBoC’s Monetary Policy Reports
and press releases of the MPC meeting to assess monetary stance. Based on the
PBoC’s stated policy stance, assessments of risks on growth and inflation, and policy
actions recorded in these official communications, a number of monetary stance
indices are compiled to indicate the direction and intensity of monetary policy. These
indices are particularly useful in capturing changes in monetary policy in the early
2000s when often non-market based monetary tools were used. In more recent years,
they show more co-movements with the benchmark interest rate, which suggests that

28
China Economic Issues – Number 1/10, January 2010
market-, price-based monetary tools are being increasingly used in macroeconomic
management.
Utilising these indicators, the determinants of the PBoC’s policy stance are
investigated. Our estimated monetary reaction functions for the PBoC’s show that the
key factors of monetary policy are economic growth and inflation, which are in fact
the PBoC’s stated mandate. Of the two main policy objectives, the PBoC appears to
react more strongly to deviations of growth from targets. Among the different targets
considered for the key economic variables (including the official targets, historical
averages, trend growth derived using the Hodrick-Prescott filter), historical averages
appear to best describe the PBoC’s targets, probably because it is more binding than
the conservatively set official targets and more transparent than targets derived purely
from statistical methods.
This first study using the narrative approach to study monetary stance in China opens
up a whole new perspective to macroeconomic and policy developments in China.
Conceivably, many aspects of China’s monetary economics can be usefully studied
afresh using this alternative way of measuring monetary stance. The most obvious
aspects are to examine the impact of monetary stance on macroeconomic
developments, tracing the transmission channels and effects on economic indicators
using these alternative monetary stance indicators.
About the Authors
Chang Shu is a Senior Manager and Brian Ng Assistant Manager in the External
Department of the Hong Kong Monetary Authority. The authors would like to thank
Li Cui and Dong He for helpful comments. The authors are grateful to Christina Li
for research assistance. The authors are responsible for the views expressed in this
article and any errors.
About the Series
China Economic Issues provide a concise analysis of current economic and financial
issues in China. The series is edited by the External Department of the Hong Kong
Monetary Authority.

29
References
Angelopoulou, Eleni (2007), “The narrative approach for the identification of
monetary policy shocks in a small open economy”, Bank of Greece Working Paper,
55.
Batini, Nicoletta and Edward Nelson (2000), “Optimal horizons for inflation
targeting”, Bank of England Working Paper, 119.
Berger, Helge, Jakob de Haan and Jan-Egbert Sturm (2006), “Does money matter in
the ECB strategy? New evidence based on ECB communication”, CESifo Working
Paper, 1652.
Boschen, John F. and Leonard O. Mills (1995), “The relation between narrative and
money market indicators of monetary policy”, Economic Inquiry, 33(1), 24-44.
Brunner, Karl and Allan H. Meltzer (1989), “The Federal Reserve’s attachment to the
free reserve concept”, reprinted in Monetary Economics, edited by Karl Brunner and
Allan H. Meltzer, Oxford: Basil Blackwell.
Carstensen, Kai (2006), “Estimating the ECB policy reaction function”, German
Economic Review, 7(1), 1-34.
Eichengreen, Barry, Mark W. Watson and Richard S. Grossman (1985), “Bank rate
policy under the interwar gold standard: a dynamic probit model”, Economic Journal,
95(379), 725-745.
Faust, Jon., John H. Rogers and Jonathan H. Wright (2001), “An empirical
comparison of Bundesbank and ECB monetary policy rules”, Board of Governors of
the Federal Reserve System International Finance Discussion Paper, 705.
Friedman, Milton and Anna Jacobson Schwartz (1963), A monetary history of the
United States, 1867-1960, Princeton: Princeton University Press.

30
China Economic Issues – Number 1/10, January 2010
Gerlach, Stefan (2007), “Interest rate setting by the ECB, 1999-2006: words and
deeds”, International Journal of Central Banking, 3, 1-45.
Gerlach, Stefan and Gert Schnabel (2000), “The Taylor rule and interest rates in the
EMU area”, Economics Letters, 67, 165-171.
He, Dong and Laurent L. Pauwels (2008), “What prompts the People's Bank of China
to change its monetary policy stance? Evidence from a discrete choice model”, Hong
Kong Monetary Authority Working Paper, 06/2008.
Huang, Ho-Chuan (River) and Chung-Hua Shen (2002), “Estimation of Taiwan’s
binary monetary policy reaction function”, Journal of Economic Studies, 29(3), 222-
239.
Huang, Ho-Chuan (River) and Shu-Chin Lin (2006), “Time varying discrete monetary
policy reaction functions”, Applied Economics, 38, 449-464.
Judd, John P. and Glenn D. Rudebusch (1998), “Taylor’s rule and the Fed: 1970-
1997”, Federal Reserve Bank of San Francisco Economic Review, 3, 3-16.
Kimelman, Nancy Jo (1981), “Post-war monetary policymaking in the US”, Ph.D.
dissertation, Brown University.
King, Robert G., and Charles I. Plosser (1984), “Money, credit and prices in a real
business cycle model”, American Economic Review, 74(3), 363-380.
Liu, Li-gang and Wenlang Zhang (2007), “A new Keynesian model for analysing
monetary policy in Mainland China”, Hong Kong Monetary Authority Working Paper,
18/2007.
Nelson, Edward (2000), “UK monetary policy 1972-97: a guide using Taylor rules”,
Bank of England Working Paper, 120.
PBoC, China Monetary Policy Report and meeting report of Monetary Policy
Committee, various issues.

31
Peng, Wensheng, Hongyi Chen and Weiwei Fan (2006), “Interest rate structure and
monetary policy implementation in Mainland China”, Hong Kong Monetary Authority
Working Paper, 1/06.
Poole, William (1971), “Rules-of-thumb for guiding monetary policy”, in Open Maket
Policies and Operating Procedures --- Staff Studies, Washington, D.C.: Board of
Governors of the Federal Reserve System, 135-189.
Potts, Glen T. and Dudley G. Luckett (1978), “Policy objectives of the Federal
Reserve System”, The Quarterly Journal of Economics, 92(3), 525-534.
Romer, Christina D. and David H. Romer (1989), “Does monetary policy matter? A
new test in the spirit of Friedman and Schwartz”, NBER Working Paper, 2966.
Romer, Christina D. and David H. Romer (2004), “A new measure of monetary
shocks: derivation and implications”, The American Economic Review, 94(4), 1055-
1084.
Rosa, Carlo and Giovanni Verga (2005), “Is ECB Communication Effective?”, Centre
for Economic Performance Discussion Paper, 682.
Shen, C.H. and H.R. Chen (1996), “Monetary policy index and policy reaction
function”, Academia Economic Papers, 24, 559-590.
Shu, Chang, Xiaojing Su, Jian Chang and Hui Miao (2008), “China’s monetary
regime in dealing with large BoP surpluses: framework, effectiveness and costs”,
Hong Kong Monetary Authority Working Paper, 3/08.
Svensson, Lars E.O. (2003), “What is wrong with Taylor rules? Using judgement in
monetary policy through targeting rules”, Journal of Economic Literature, 41(2), 426-
477.
Taylor, John B (1993), “Discretion vs policy rules in practice,” Carnegie-Rochester
Conference Series on Public Policy, 39, 195-214.

32
China Economic Issues – Number 1/10, January 2010
Uselton, Gene C. (1974), Lags in the effects of monetary policy: a nonparametric
analysis, New York: Marcel Dekker.
Vanderhart, Peter G. (2000), “The Federal Reserve’s reaction function under
Greenspan: an ordinal probit analysis”, Journal of Macroeconomics, 22(4), 631-644.

33
Table 2b. 7-value monetary stance indicator: coding examples
Degree Criteria\Examples of wording
3 (Strongest tightening) � Implement tight monetary stance (落實從緊的貨幣政策)
� Prevent rapid growth from turning into
overheating and prevent structural price rises
from turning into a generalised inflation
(‘雙防’ -- 防止經濟增長由偏快轉向過熱, 防止價格由結構性上漲演變為明顯通貨膨脹)
� Intensify macroeconomic adjustment (加强調控力度)
� Further strengthen liquidity management (進一步加强流動性管理)
2 (Strong tightening) � Continue sound monetary stance (繼續執行穩健的貨幣政策)
� Prevent rapid growth from turning into
overheating (防止經濟增長由偏快轉向過熱)
� Maintain price stability (保持物價基本穩定)
� Maintain the intensity of macroeconomic
adjustment (保持必要的調控力度)
� Strengthen liquidity management (加强流動性管理)
1 (Tightening) � Implement sound monetary stance (執行穩健貨幣政策)
� Guide reasonable investment growth (引導投資合理增長)/Prevent an investment rebound
(注意防止投資反彈)
� Maintain price stability (保持物價基本穩定)/Closely monitor development of various
price indices (密切關注各類價格指數的走勢)
� Maintain liquidity management (維持一定的流動性管理力度)

34
China Economic Issues – Number 1/10, January 2010
0 (Neutral) � Continue sound monetary stance (繼續執行穩健的貨幣政策)
� Maintain appropriate money growth (保持貨幣適度增長)
-1 (Loosening) � Continue sound monetary stance (繼續實施穩健的貨幣政策)
� Continue the policy of expand domestic
demand (繼續貫徹擴大內需為主的方針)
� Maintain appropriate money growth (保持貨幣適度增長)
-2 (Strong loosening) � Continue sound monetary stance (繼續實施穩健的貨幣政策)
� Intensify the support to economic
development (加大對經濟發展的支持力度)
� Prevent a further deceleration of economic
growth (防止經濟增長速度進一步減緩)
-3 (Strongest loosening) � Implement the moderately loose monetary
policy (執行適度寬鬆的貨幣政策)
� Further intensify financial support to
economic growth (進一步加大金融對經濟發展的支持力度)
� Adopt policy measures to expand domestic
demand and facilitate growth (採取擴大内需,促進增長的措施)
� Maintain ample liquidity (保持流動性充裕)
� Guide reasonable credit expansion (引導金融機構合理增加信貸投放)
Sources: PBoC and authors’ compilation.

Table 3. Descriptive statistics
%yoy Deviation from official target Deviation from historical average Deviation from potential output
GDP
Mean 10.05 2.52 0.73 -0.20
Standard deviation 1.78 1.67 1.94 0.96
CPI
Mean 2.17 -0.63 0.97 -0.18
Standard deviation 2.50 2.14 2.60 1.31
M2
Mean 17.19 1.55 1.15 -0.38
Standard deviation 3.18 2.91 3.11 2.42
Credit
Mean 15.68 1.96 0.88 -0.46
Standard deviation 5.17 4.95 5.26 3.60
Unemployment
Mean 4.03 -0.53
Standard deviation 0.29 0.26
Sources: CEIC and authors’ calculation.

36
China Economic Issues – Number 1/10, January 2010
Table 4. Estimation results using 5-value monetary stance indicator Deviation from official target Deviation from historical average Deviation from potential output
Benchmark
(1)
M2
(2)
Credit
(3)
Unemployment
(4)
Benchmark
(5)
M2
(6)
Credit
(7)
Benchmark
(8)
M2
(9)
Credit
(10)
Growth
∆GDPt 1.48*** 1.76*** 1.52*** 1.41*** 0.38 -0.03 1.83***
(3.80) (3.19) (3.76) (3.64) (0.99) (-0.06) (2.76)
∆GDPt-1 2.29*** 3.18** 3.09**
(3.35) (2.53) (2.54)
Inflation
inflationt 0.69** 1.09** 0.98 0.36 0.48 -0.79*
(2.41) (2.52) (2.39) (1.25) (1.30) (-1.81)
inflationt-1 0.73** 1.20*** 0.73** 0.80**
(2.42) (2.59) (2.31) (2.55)
Money growth
∆M2t -1.11**
(-2.50)
∆M2t-1 1.25**
(2.07)
∆M2t-4 -0.53* -0.34 -0.82*
(-1.65) (-1.00) (-1.79)
Credit growth
∆creditt -0.07 -0.53***
(-0.64) (-2.84)
∆creditt-2 1.15***
(3.62)
∆creditt-4 -0.07
(-0.45)
Unemployment
unemploymentt-1 2.24
(1.35)
Pseudo R-squared 0.37 0.43 0.37 0.39 0.54 0.58 0.57 0.04 0.14 0.27
% of correct signals 69.70 76.67 69.70 72.73 75.76 86.67 80.00 52.94 61.77 61.77
Sources: Authors’ estimates.
Note:
1. ***, ** and * indicate that the coefficients are significant at the 1%, 5% and 10% level, respectively.

Table 5. Correct signals for the 5-value monetary stance indicators Actual Strong
tightening Tightening Neutral Loosening
Strong
loosening % of correct signals
Estimated
Strong tightening 2 1 0 0 0 50.0%
Tightening 2 17 1 0 0 94.4%
Neutral 0 0 1 2 1 33.3%
Loosening 0 0 1 2 0 50.0%
Strong loosening 0 0 0 0 3 75.0%
Total 4 18 3 4 4 75.8%
Source: Authors’ estimates.

Table 6. Estimation results using 7-value monetary stance indicator
Deviation from official target Deviation from historical average Deviation from potential output
Benchmark
(1)
M2
(2)
Credit
(3)
Unemployment
(4)
Benchmark
(5)
M2
(6)
Credit
(7)
Benchmark
(8)
M2
(9)
Credit
(10)
Growth
∆GDPt 1.15*** 1.93*** 1.23*** 0.98*** 0.73** 1.28** 0.89** 0.66* 0.39 1.94***
(3.56) (3.68) (3.17) (3.02) (2.24) (2.50) (2.20) (1.78) (0.82) (3.40)
∆GDPt-2 0.84* 1.27** 1.15* 1.18*
(1.71) (2.25) (1.86) (1.93)
Inflation
Inflationt 0.79*** 0.88*** 0.54** 1.28*** 1.00*** 0.35 0.38 -0.59
(3.16) (3.33) (2.01) (2.87) (2.64) (1.34) (1.07) (-1.62)
Inflationt-1 1.44*** 0.49
(3.21) (1.53)
Money growth
∆M2t -1.15***
(-2.73)
∆M2t-1 1.14**
(2.00)
∆M2t-3 0.66** 1.29*
(2.00) (1.82)
∆M2t-4 -1.2*** -0.74** -1.91***
(-2.72) (-2.35) (-2.73)
Credit growth
∆Creditt 0.01 -0.48***
(0.16) (-2.81)
∆creditt-2 1.00***
(3.72)
∆creditt-4 -0.22*
(-1.70)
Unemployment 1.48*
Unemploymentt-4 (1.86)
Pseudo R-squared 0.33 0.45 0.36 0.36 0.41 0.50 0.46 0.05 0.18 0.22
% of correct signals 50.00 76.67 59.38 58.82 59.38 76.67 73.33 47.06 47.06 47.06
Sources: Authors’ estimates.
Note:
1. ***, ** and * indicate that the coefficients are significant at the 1%, 5% and 10% level, respectively.
39
Table 7. Estimation results using 3-value monetary stance indicator
Deviation from official target Deviation from historical average Deviation from potential output
Benchmark
(1)
M2
(2)
Credit
(3)
Unemployment
(4)
Benchmark
(5)
M2
(6)
Credit
(7)
Benchmark
(8)
M2
(9)
Credit
(10)
Growth
∆GDPt 1.65*** 1.52** 1.96*** 1.60** -0.02 0.08 0.85
(2.68) (2.00) (2.65) (2.29) (-0.05) (0.17) (1.21)
∆GDPt-1 6.31** 6.37** 7.49**
(2.12) (2.03) (2.00)
Inflation
Inflationt 0.47 0.21 0.60 0.25 1.91* 1.93* 2.24* 0.20 0.13 -0.66
(1.33) (0.47) (1.52) (0.55) (1.93) (1.86) (1.85) (0.65) (0.40) (-1.35)
Money growth
∆M2t-1 0.11
(0.27)
∆M2t-3 0.25 0.17
(0.68) (0.49)
Credit growth
∆creditt-1 -0.18 -0.27
(-1.27) (-0.96)
∆creditt-3 1.49**
(2.05)
Unemployment
Unemploymentt-2 -35.14*
(-1.80)
Unemploymentt-3 37.47*
(1.87)
Pseudo R-squared 0.40 0.40 0.43 0.62 0.77 0.77 0.79 0.01 0.01 0.29
% of correct signals 85.29 87.10 81.82 85.29 90.91 90.91 90.91 64.71 64.71 76.47
Sources: Authors’ estimates.
Note:
1. ***, ** and * indicate that the coefficients are significant at the 1%, 5% and 10% level, respectively.

40
China Economic Issues – Number 1/10, January 2010
Table 8. Correct signals for the 3-value monetary stance indicator Actual Tightening Neutral Loosening % of correct signals
Estimated
Tightening 22 1 0 100.0%
Neutral 0 1 1 33.3%
Loosening 0 1 7 87.5%
Total 22 3 8 90.9%
Sources: Authors’ estimates.