China Economic Issues - Hong Kong Monetary Authority demand (LHS) China's real export (RHS) yoy %...
28
1 Number 1/09, March 2009 China Economic Issues How Much Do Exports Matter for China’s Growth? Li Cui, Chang Shu and Xiaojing Su The sharp deceleration in China’s economic growth in recent months, as the economy has been weighed down by the collapse in external demand, brought to the fore yet again the question of how important exports are in affecting China’s economic performance. Using a provincial-level panel dataset, this paper seeks to quantify the impact of exports on China’s economic growth, focusing in particular on the often-neglected knock-on effects of exports on investment, employment, income and consumption. We find that a 10 percentage-point decline in export growth has been associated with a decline of about 2.5 percentage points in GDP growth on average. This is much higher than the estimated direct impact of exports on growth. The spill-over effects from exports to domestic demand and employment are found to be positive and statistically significant, and are particularly sizable in regions with greater trade exposures. Indeed, such secondary effects are found to increase rapidly with the size of exports relative to the economy.
Transcript of China Economic Issues - Hong Kong Monetary Authority demand (LHS) China's real export (RHS) yoy %...

1
Number 1/09, March 2009
China Economic Issues
How Much Do Exports Matter for China’s Growth?
Li Cui, Chang Shu and Xiaojing Su
The sharp deceleration in China’s economic growth in recent months, as the economy has
been weighed down by the collapse in external demand, brought to the fore yet again the
question of how important exports are in affecting China’s economic performance. Using a
provincial-level panel dataset, this paper seeks to quantify the impact of exports on China’s
economic growth, focusing in particular on the often-neglected knock-on effects of exports on
investment, employment, income and consumption. We find that a 10 percentage-point
decline in export growth has been associated with a decline of about 2.5 percentage points in
GDP growth on average. This is much higher than the estimated direct impact of exports on
growth. The spill-over effects from exports to domestic demand and employment are found to
be positive and statistically significant, and are particularly sizable in regions with greater
trade exposures. Indeed, such secondary effects are found to increase rapidly with the size of
exports relative to the economy.

2
I. Introduction
Economic activities in Mainland China
(henceforth China) took a sharp turn in
the second half of 2008, with the year-on-
year growth of real GDP slowing from
10.4 per cent in the first half of 2008 to
less than 7 per cent in the fourth quarter,
the lowest in seven years. The slowdown
occurred as the global economy slumped
and China’s export growth collapsed
(Chart 1), and the contribution of net
exports to growth fell considerably. In
recent months, news about spreading
factory closures and job losses has also emerged, raising concerns about further sliding in
economic activities. The degree of the recent slowdown has caught many by surprise,
especially those who had taken the “decoupling view” that China’s rapid economic growth
has had more to do with its expanding domestic market than with the strength of foreign
demand in recent years, and thus should not be too much affected by the cyclical fluctuations
in the global economy.
Indeed, the debate about the source of China’s growth and the role of foreign demand and
exports has frequently come to the centre of policy discussions. While few doubt that
outward orientation has played an important role in China’s economic growth, the channels
through which exports affect growth have remained controversial. The benefit of trade to
long-term economic growth is well recognised. By promoting factor specialisation based on
competitive advantages, enhancing competition in the domestic market, and enabling
knowledge transfer, trade helps to boost total factor productivity (TFP) and improve the
growth potential (He et al 2008). As productivity increases through these channels tend to be
incremental, short-term fluctuations in foreign demand and exports should not affect China’s
growth very much. That is, if the increase in TFP was the only or the dominant channel
through which trade affects China’s growth, China should be relatively insulated from the
development of the world demand in the short run.
Chart 1. World demand and China’s exports
0
1
2
3
4
5
6
7
1998 2000 2002 2004 2006 20080
5
10
15
20
25
30
35
World demand (LHS)China's real export (RHS)
yoy % yoy %
Sources: WEO, IMF and staff calculation.

3
At the same time, there are reasons to believe that exports have much broader impacts on
growth than solely through TFP, and foreign demand can be very important for China’s
growth performance even in the short term. First, foreign demand affects real growth directly
through the contribution of net exports. In fact, other work has found that such impact has
increased in recent years, reflecting the rise of value added in exports and the increased
sophistication of exported products which tend to be more responsive to demand
fluctuations.1 Second, exports, through job creation and the income effect, and increasing
economies of scale and encouraging investment, could have substantial spill-over effects on
the rest of the economy. For instance, investing on a machinery factory may be driven by the
need to export, even though the investment itself is recorded as construction and part of
domestic demand in the national accounts. In this light, trade balance, even if it has been
rising in recent years, still provides an incomplete and underestimated indicator of the
importance of exports to growth.
The empirical analyses in this paper attempts to shed light on the impact of exports (both
direct and indirect included) on China’s production growth. It also assesses the importance of
the often-overlooked spill-over effects from exports to domestic demand by examining the
key domestic demand indicators and employment, and argues that the consideration of the
impact on growth should take full account of such feedback. More specifically, we examine
the effects of exports on production as well as the important driving factors for domestic
demand including job growth, household income and expenditure, and investment. The
estimation is conducted based on panel datasets that include China’s 27 provinces. A panel
analysis is useful in this context because it allows us to control for factors that drive cyclical
movements at the national level or other relevant factors that affect growth and employment
for individual regions, while pinning down more precisely the impact of exports. Provincial
data help to provide insights about the spill-over as the effects of exports on employment,
investment and consumption should be the strongest locally.
Assessing the impact of exports is important at this juncture when the global economy is deep
in a synchronised recession. China’s exports are likely to remain sluggish, as we have seen in
recent months. From a policy standpoint, a better understanding of the magnitude of the
1 See Cui and Syed (2007).

4
influence and the channels through which exports affect the rest of the economy is needed to
inform policy decisions regarding the necessary strength of the counter-cyclical policies for
short-term demand management. It is also important to the region (including Hong Kong) and
many countries in the rest of the world that have relied on China’s import demand as a driver
for their own growth.
To anticipate the results, the empirical analyses find that the effects of export growth on the
growth rates of production, investment, household income and expenditure, and employment
are positive and statistically significant. The effects are non-linear – the larger the share of
exports in GDP, the greater the impact for each percentage-point change in export growth.
For the nation as a whole, we estimate that a 10 percentage-point decline in export growth
has been associated with an about 2.5 percentage-point decline in real GDP growth on
average, much larger than what could have been expected if only the direct impact of exports
is considered.
Our analysis is closely related to other work examining the role of exports in economic
growth. The standard export-led growth (ELG) literature typically relies on causality tests to
examine whether exports lead growth, and is often based on national data. Empirical studies
using this framework have been undertaken extensively to examine the experiences of many
economies, particularly those in Asia.2 Ljungwall (2006) examines the ELG hypothesis for
China’s using province data, and concluded that the hypothesis is validated in 13 of the 27
provinces, most of which are around export-oriented eastern coastal areas. He et al (2008)
examine the causality between consumption, investment and exports across provinces, and
found exports granger cause investment for coastal provinces. Another strand of literature
focuses on cross-country studies and evaluates whether and how trade contributes to growth.
Frankel and Romer (1999) find a statistically significantly and positive relationship between
trade volume and income level among countries. Kinkyo (2008) presents evidence that export
composition also matters, and countries with greater shares of manufacturing exports tend to
be associated with higher economic growth.
Using different frameworks, a number of studies have examined the quantitative impact of
exports on employment in China, relying on panel datasets. Fu and Balasubramanyam (2005)

5
explore how exports and FDI affect China’s employment growth, as a test of the “vent for
surplus” thesis which postulates that exports provide an effective channel of increasing the
demand for labour. Hua (2007) investigates the impact of real exchange rate movements on
China’s manufacturing employment, and concludes that a real appreciation, through affecting
export volume and increasing labour productivity (capital intensity and export penetration
ratio), tends to reduce employment. In contrast to these earlier works that have focused
exclusively on the job impact of exports, the present paper considers more broadly the impact
on production and domestic demand.
The rest of the paper is organised as follows. Section Two sets out the theoretical
underpinning to assess the impact of exports on growth and the transmission channels.
Section Three documents the stylised facts on China’s export and growth performance using
provincial data. The main empirical examinations are contained in Section Four, which
discusses the estimation framework and data, and presents the empirical results. Section Five
concludes.
II. the Determinants of China’s Growth
Our consideration of China’s growth determinants is based on the standard national account
identity where growth is determined by aggregate demand, decomposed according to the
sources of demand. That is,
(1) Yt = Ct + It + (Xt - Mt) ,
where tY , tC , tI , tG , tX , and tM represent output, consumption, investment, government
spending, exports, and imports, respectively. (Xt - Mt) is the net exports. This contrasts with
the alternative of modelling growth from the supply side as in a neo-classical setting where
growth is a function of factor inputs and TFP.
2 See, for example, Giles and Williams (2000) for a comprehensive survey of the empirical methodology and evidence.

6
We focus on the demand side of China’s
growth as in our view it is the strength of
the demand, rather than the potential to
supply, that has been the key to China’s
actual growth in recent years. While
factor inputs (in particular labour and
capital) and improvements in production
efficiency are important determinants of
China’s underlying long-term growth, the
supply factors have not constituted
constraints for China’s growth in the short term. The vast rural population has continued to
supply a steady flow of migrant workers to join the urban labour force since the start of the
economic reform. In recent years, the working-age population as a share of total population
has risen significantly because of the baby boom in the 1950s-70s. In terms of capital stock,
many have noted the fast investment growth and the rapid increase in production capacity
(Chart 2), owing in part to the relatively low production costs such as energy prices and cost
of capital. Indeed in many sectors there is vast under-used production capacity. For example,
the Government identified in 2006 industries including steel, aluminium, auto, coke as having
over-capacity, and noted a number of others in danger of doing so.
In contrast, the demand side has placed greater constraints on China’s growth. Consumption
growth has been limited by the relatively high precautionary savings and falling household
income as a share of GDP in recent years (Aziz and Cui (2007)). Investment growth has been
one of the main drivers of the economic growth, although it has been subject to policy
controls out of concerns for over-capacity in some manufacturing sectors.
Chart 2. Domestic production
0
50
100
150
200
250
300
350
400
450
500
2000 2001 2002 2003 2004 2005 2006 2007 20080
100
200
300
400
500
600
700
800Chemical Fiber (LHS)Steel (LHS)Plastics (LHS)Industrial Boilers (LHS)Semiconductors (RHS)
Index, 2000 = 100 Index, 2000 = 100
Sources: CEIC and staff calculation.
7
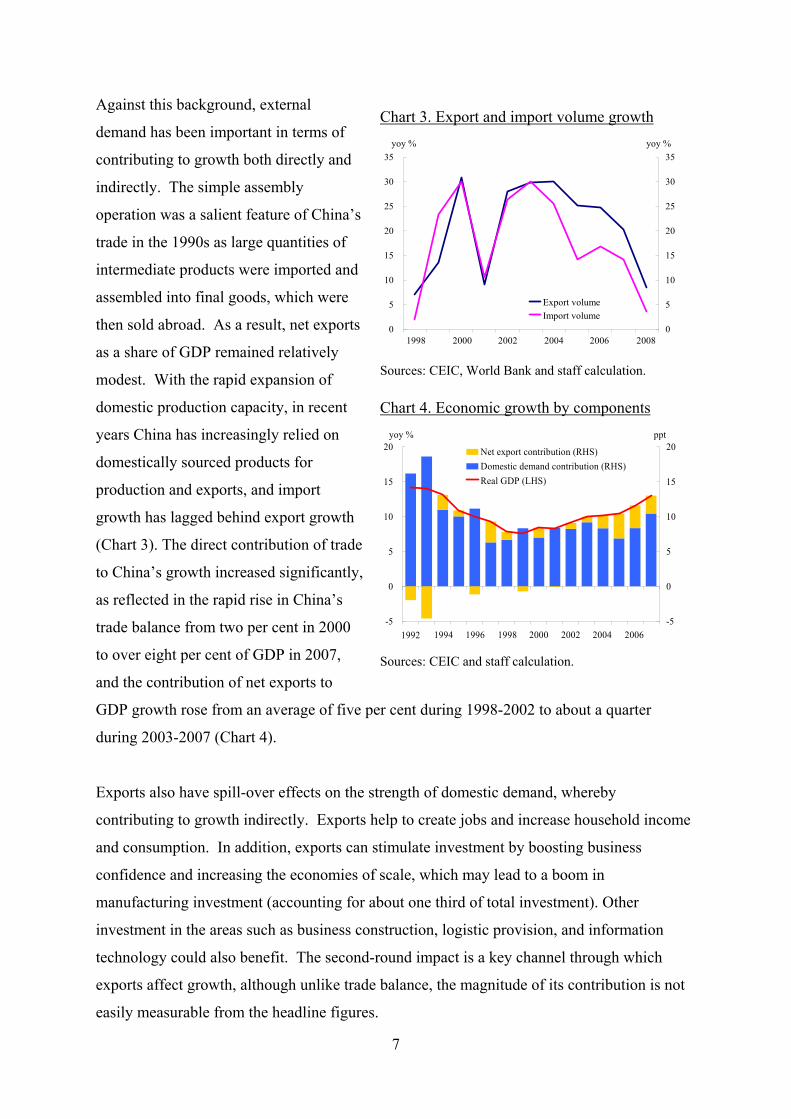
Against this background, external
demand has been important in terms of
contributing to growth both directly and
indirectly. The simple assembly
operation was a salient feature of China’s
trade in the 1990s as large quantities of
intermediate products were imported and
assembled into final goods, which were
then sold abroad. As a result, net exports
as a share of GDP remained relatively
modest. With the rapid expansion of
domestic production capacity, in recent
years China has increasingly relied on
domestically sourced products for
production and exports, and import
growth has lagged behind export growth
(Chart 3). The direct contribution of trade
to China’s growth increased significantly,
as reflected in the rapid rise in China’s
trade balance from two per cent in 2000
to over eight per cent of GDP in 2007,
and the contribution of net exports to
GDP growth rose from an average of five per cent during 1998-2002 to about a quarter
during 2003-2007 (Chart 4).
Exports also have spill-over effects on the strength of domestic demand, whereby
contributing to growth indirectly. Exports help to create jobs and increase household income
and consumption. In addition, exports can stimulate investment by boosting business
confidence and increasing the economies of scale, which may lead to a boom in
manufacturing investment (accounting for about one third of total investment). Other
investment in the areas such as business construction, logistic provision, and information
technology could also benefit. The second-round impact is a key channel through which
exports affect growth, although unlike trade balance, the magnitude of its contribution is not
easily measurable from the headline figures.
Chart 3. Export and import volume growth
0
5
10
15
20
25
30
35
0
5
10
15
20
25
30
35
Export volumeImport volume
yoy % yoy %
1998 2000 2002 2004 2006 2008 Sources: CEIC, World Bank and staff calculation.
Chart 4. Economic growth by components
-5
0
5
10
15
20
-5
0
5
10
15
20Net export contribution (RHS)Domestic demand contribution (RHS)Real GDP (LHS)
yoy % ppt
1992 1994 1996 1998 2000 2002 2004 2006 Sources: CEIC and staff calculation.

8
III. China’s Trade Growth and Regional Divergence
China has achieved phenomenal growth in external trade in the three decades since China
introduced the ‘open door’ policy in the late 1970s. Between 1980 and 2007, exports
expanded at an average annual rate of 25 per cent in the each year. The rapid expansion of
the external sector has coincided with equally impressive growth of the economy as a whole,
which grew annually at 10 per cent on average (Chart 5a). As noted earlier, the direct
contribution of trade to China’s growth increased significantly in recent years, as reflected in
the rapid rise in China’s trade balance and contribution of net exports to economic growth.
Chart 5. Major economic indicators
a. Industrial production and real GDP b. Exports and gross capital formation
3
6
9
12
15
18
21
24
6
7
8
9
10
11
12
13
14
15
Industrial production (LHS)Real GDP (RHS)
2002 2008
yoy % yoy %
2000 2004 20061994 1998199610
15
20
25
30
35
40
45
10
15
20
25
30
35
40
45
ExportsGross capital formation
1999 2001 2007
% of GDP% of GDP
2003 20051998 2000 2002 2004 2006
Sources: CEIC and staff calculation.
Other indicators of economic activities such as industrial production and investment have
also registered rapid growth, rising by an average of 17.5 per cent and 22.6 per cent
respectively each year (Chart 5b). In the meantime, income and expenditure have also been
growing consistently, albeit at slower paces than industrial production and investment.
Income per capita rose from around Rmb 500 in the early 1980s to close to RMB14,000 in
2007. Expenditure per capita also has also risen six-fold between 1990 and 2007, from
around RMB1,500 to almost RMB10,000. By comparison, employment has seen a much
more modest pace, rising around 2.3 per cent each year in the last three decades.

9
Notwithstanding the impressive national numbers, trade activities are quite uneven across
regions. Large exporting provinces, mostly in the Pearl River Delta and Yangtze River Delta
areas, account for around 90 percent of China’s total exports, while the remainder of export
activities is disbursed across the rest of the country. For comparison we divide the provinces
and municipalities directly controlled by the central government into two groups: the large
exporters and the small exporters. The large exporters include six provinces (Guangdong,
Jiangsu, Zhejiang, Fujian, Liaoning, and Shandong), and three municipalities (Shanghai,
Tianjin and Beijing). The rest of the provinces are included in small exporters group. The
average scale of exports of the big exporters is near 20 times of that of the small exporters
(Table 1), and accounts for half of their GDP, a much higher share than the small exporters.
Not surprisingly, Guangdong is the largest exporting province, with exports accounting for
near 90 per cent of its GDP.3
The large exporters tend to be more
affluent than other provinces (Table 1 and
Chart 6). Measured by GDP or industrial
production, the large exporters are about
2.5 to 3.5 times the average of other
regions. In fact, the nine large exporters
account for around 60 per cent of the
national output. Income per capita in the
large exporting provinces averaged
RMB14,075 in the last five years,
compared with that of RMB8,981 in the
rest of country. The gap between
expenditure per capita in the two groups is even greater, with the RMB9,545 for the large
exporting group, more than doubling that of RMB4,226 for other provinces.
3 It should be noted that there are often discrepancies between provincial data and national data.
Chart 6. Income and export by provinces
(average 1998 –2007 )
3.70
3.75
3.80
3.85
3.90
3.95
4.00
4.05
4.10
4.15
4.20
4.25
2.5 3.0 3.5 4.0 4.5 5.0 5.5 6.0 6.5Average export level in renminbi millions (log scale)
Ave
rage
per
cap
ita in
com
e in
renm
inbi
(log
scal
e)
Sources: CEIC and staff calculation.

10
When it comes to growth rates, however,
the comparison appears to be more mixed.
Although big exporters tend to enjoy
higher income, expenditure, and
employment growth than smaller
exporters, the investment and production
growth in the provinces that export less is
actually higher than those in the more
export-oriented provinces. Such an
inverse relationship could reflect the
differences of government spending
across regions, as public spending has
been tilted towards less developed regions to reduce the regional differences (Chart 7). Such
government support should have greater impact on investment and production growth than on
income growth, as infrastructure construction has been one key area of the public support.
Notably, for example, since the ‘Go West’ (「西部大開發」) programme started in 2000,
the average investment in these provinces have remained about 2 percentage points higher
than the national average.4
The above consideration suggests that
the drivers of investment and growth and
their links with exports in inland
provinces could be quite different from
those in the coastal provinces where
exports account for large shares of the
economic activities. Grouping the large
exporting regions together and
considering the average growth rates in
these regions, Chart 8 shows that the
fluctuations of exports, investment, and
production in these regions have been
4 The ‘Go West’ programme cover 11 provinces and autonomous regions and 1 municipality. They are Chongqing, Sichuan, Guizhou, Yunnan, Tibet, Shaanxi, Gansu, Qinghai, Ningxia, Xinjiang, Inner Mongolia and Guangxi.
Chart 7. Government expenditures in large vs
small exporting regions
8
9
10
11
12
13
14
15
16
17
18
1999 2000 2001 2002 2003 2004 2005 2006 20078
9
10
11
12
13
14
15
16
17
18
Small exporters
Large exporters
% of GDP % of GDP
Sources: CEIC and staff calculation.
Chart 8. Exports, FAI and industrial production
of large exporting regions
0
5
10
15
20
25
30
35
40
1998 1999 2000 2001 2002 2003 2004 2005 2006 20070
5
10
15
20
25
30
35
40
ExportsIndustrial productionFixed asset investment
yoy % yoy %
Sources: CEIC and staff calculation.

11
remarkably synchronised in recent years, corroborating the view that exports have important
spill-over effect to the rest of the economy particularly in these regions.
IV. Estimating the Impact of Exports on Growth and Domestic Demand
Using Provincial Data
A. Methodology and data
Our empirical framework considers the impact of exports on several key variables indicating
economic activities and demand, using a simple model of the following form:
(1) Activityit = f(Export it, Fiscal it, Monetaryt, other variables),
where the activity variable corresponds to industrial production, investment, household
income and expenditure, and employment respectively, in region i and year t. Rather than
using provincial level GDP that has been subject to various statistical issues and critiques in
recent years, we use the provincial industrial production to measure the strength of
production. Fixed-asset investment is used to measure investment, and urban per capita
income and expenditure are used to measure household income and expenditure respectively.
The estimations control for a number of key variables including fiscal and monetary policy
stance: Fiscal it, Monetaryt, Fiscal policy is measured by the provincial government spending,
stemming from the view that public expenditure measures are more effective than revenue
measures in affecting economic growth. 5 Monetary policy is measured by the real interest
rate – a variable at the national level. The one-year benchmark deposit rate is used.
The explanatory variable central to this study is export growth (Exportt). We also use several
methods to capture the possible nonlinear effects of trade on economic performance. One
way is to include the ratio of exports to GDP (Export/GDPi,t) in the regression. An
alternative approach is to include a dummy variable (Bigi) that corresponds to the large
exporting provinces. The interactive terms of (Export/GDPi,t) and (Bigi) with (Exportt) in the

12
respective specifications can then capture the variations in the impact of exports due to the
importance of trade in the economy..
The estimation employs real variables. Investment is deflated by the provincial level fixed-
asset investment deflator, and income and expenditure by the provincial consumer price
index (CPI). The deflators used for industrial production and exports are the producer price
index and GDP deflator respectively at the national level due to lack of data on corresponding
price indices for individual regions.
The sample covers annual data from 1992 to 2007. Of China’s 31 provinces and
municipalities, three provinces with very small export sectors, i.e. Tibet, Xinjiang and
Qinghai, are excluded. As Chongqing had been part of Sichuan before it became an
independent municipality directly reporting to the central government in 1997, we construct
consistent data series representing the total of the two. Thus 27 provinces and municipalities
are included in the panel. All the data are based on the official data release of the National
Bureau of Statistics and are obtained from CEIC.
B. Unit root tests
In order to formulate the empirical specification correctly, the time series properties of the
variables are tested. The Augmented Dickey-Fuller and Phillip-Perron tests are used for
national-wide data such as the real interest rate, while the Levin-Lin and Im-Peseran-Shin
tests are used for provincial level data, i.e. panel data. The panel unit root tests suggest that
all the activity indicators, Exportt and Fiscalt are I(1) series—that is, they are non-stationary
in levels but stationary in their first differences (Table 2). Thus we use growth rates of the
activity indicators and Exportt for the estimation. The Export/GDPt ratio is stationary in its
levels and directly enters the estimation.
5 In addition, the Government’s support to foster the growth of less-developed regions are largely reflected in provincial government spending, even though the funding may have come from the central government transfers. The aggregate provincial spending accounts for more than three quarters of total government spending.

13
C. Estimation procedure
The empirical models are specified in a dynamic form which includes a lagged dependent
variable, taking the following form:
(2) tiitittititititi fminteractgdpexexactact ,,54,3,2,11,, )/( εηβββββα ++Δ++++Δ+Δ=Δ − ,
where:
:,tiact logarithms of activities indicators (including industrial production,
fixed-asset investment, income per capita, expenditure per capita and
urban employment)
tiex , : logarithms of exports
tigdpex ,)/( : ratio of exports to GDP
tiinteract , : interactive term representing: (1) titi gdpexex ,, )/(*Δ
or (2) iti Bigex *,Δ where iBig =1 for big exporters and 0 otherwise.
:tm real interest rate
:tf provincial government expenditure.
In Equation 2, subscripts i and t represent province and time period respectively. The
parameter α reflects the degree of inertia in an activity indicator, and ‘β’s are the impacts of
explanatory variables. In specifications without interactive terms, the impact of exports on an
activity indicator is given by β1 and β1/(1-α) for the short and long run respectively. When
interactive terms are included, the respective short- and long-run elasticities are (β1+β2) and
(β1+β2)/(1-α).
We allow the error term to have two components: a time invariant province specific-effect iη ,
and a residual idiosyncratic error term ξi,t. Province specific effects are allowed in order to
take into account heterogeneity across provinces. However, the conventional fixed effect
estimator, which undertakes the estimation by first differencing (2) would introduce a bias
due to the correlation of ξi,t –ξi,t-1 with the lagged dependent variable. To overcome this

14
problem, we use the two-step GMM estimator proposed by Arellano and Bond (1991) in the
empirical work.6
D. Empirical results
Tables 3 - 7 present the estimation equations for the five activity indicators. For each activity
indicator, four specifications are reported. Starting with the most parsimonious, the first
model only contains the lagged dependent variable and export growth. The second adds a
number of control variables, including the export to GDP ratio, and fiscal and monetary
policy variables. The third and fourth specifications introduce the interactive term of Exportt
with the dummy variable for big exporters and with Export/GDPt respectively. The Sargan
test is undertaken for all the estimated equations. The results suggest the over-identification
instruments are valid, providing support to the specifications.
Table 3 shows that the average impact of export growth for the overall group on industrial
production growth is positive and statistically significant. Column (2) suggests that on
average, a one percentage-point increase in export growth is associated with a 0.1 percentage-
point increase in industrial production growth in the short run, implying a 0.12 percentage-
point increase in the long run (see Section IV C for the calculation of the long-run impact).
However, column (3) suggests that the impact is dramatically different for large exporters
group and small exporters group, with an average short-run elasticity of 0.4 for the big
exporters, and only 0.06 for the small exporters. As the national sample consists of many
more small exporters than big exporters, the relatively small average impact shown in column
(2) largely reflects the impact on the small exporters. With the large exporters comprising
one-third of the national sample while accounting for more than 60 per cent of the national
GDP and production, the impact of exports estimated from the national sample is an
underestimation as the estimation has given equal weights to all provinces, small and big
exporters alike. Taking into account the relative weights of these provinces in the national
economy, the results suggest that a 10 percentage-point decline in export growth is on
average associated with about three percentage-point decline in industrial production growth.
6 See Technical Appendix for further details on dynamic panel estimation.
15
The latter corresponds to an about 2.5 percentage-point decline in real GDP growth.7 This is
about at least twice as large as what could have been expected if only the direct impact of
exports is considered.8 Column (4) of Table 3 confirms further that the impact of exports on
production rise with the share of exports in GDP. For the largest exporters, a one percentage-
point increase in export growth is associated with a 0.64 percentage-point increase in the
growth rate of industrial production in the short-run and a 0.76 percentage-point increase in
the long-run (Table 8).
The estimated spill-over effects from exports to investment, income, expenditure, and urban
employment are all positive and statistically significant. The estimated impact of exports on
investment is somewhat smaller than that on industrial production (Table 4). Similar to that
of industrial production, while the average impact from the national sample is relatively small,
the elasticity of investment growth with respect to export growth for large exporters is much
more significant (a one percentage-point increase in export growth is associated with 0.18
percentage points increase in investment growth in the short run and 0.23 percentage points
increase in the long run, compared to statistically insignificant impact for the smaller
exporters). Among the big exporters, the estimated elasticity also varies quite markedly,
ranging from 0.12 to 0.46 in the short run (Table 8 and Chart 9b). For income and
expenditure, the estimated average elasticities from the national sample are both about 0.04
(Tables 5 and 6). The differences of the spill-over between the big exporters and small
exporters are not as large as for investment and production, and the range of the impact
among different provinces is marginally wider for income (0.02 – 0.06 in the short run) than
for expenditure (around 0.04 – 0.06) (Table 8 and Charts 9c-d).
The estimated average impact of exports on employment from the national sample is fairly
mild (Table 7), but again, the national sample masks the important regional differences
(Table 8 and Chart 9e). Among large exporters, a one percentage-point increase in export
growth is associated with a 0.05 to 0.32 percentage-point increase in employment growth in
the short run, depending on the provinces’ relative trade exposure. This is consistent with the
7 The official GDP growth rate is somewhat less volatile than that of the industrial production. We apply a coefficient of 0.8 (percentage point change in GDP growth for each percentage point change in industrial production growth), based on the historical relationship between the two variables. 8 Assuming the domestic value-added of China’s exports averaged about 40-50 per cent in the past decade, as many have calculated (see Koopman, Wang, Wei (2008) for a recent paper on this), and considering the average export share in GDP during the past decade, the direct impact of a 10 percentage-point decline in China’s export growth is about 1-1.3 percentage-point reduction of real GDP growth.

16
reported large job losses in the coastal provinces such as Guangdong in the wake of the
global economic downturn. As the large exporters have been the main drivers of job growth
in the last decades, accounting for three quarters of the total job growth in the country, the
fluctuations of export growth also have a substantial impact on the national job market. The
estimated impact on employment from this study is comparable to that by Fu and
Balasubramanyam (2005) for township and village enterprises (TVEs) at 0.28. However, it’s
lower than that obtained by Hua (2007) which suggests that a 10 percent increase in exports
can raise employment in the manufacturing sector by as much as 12.8 percent.
Among the other variables, real interest rates and government expenditures at the provincial
level carry the expected signs. The real interest rate is found to have highly robust and
dampening effects on most activity variables, with the biggest impacts on industrial
production and employment. Government expenditure is also found to boost industrial
production, and, to a smaller extent, income and expenditure. Its impact on investment is less
robust, and it does not appear to affect employment.9
It is also worth noting that the estimation may have understated the spill-over effects
particularly on job and consumption growth, owing to data issues. It is widely known that
China’s statistics provides a fairly extensive coverage on large and state-owned companies
but less well on small and non-state companies; the latter tend to be more dynamic and
responsive to market conditions. Another major omission is the migrant workers who have
been the most important workforce of the exporting firms. The actual impact of exports on
employment would therefore likely to be much larger than that estimated. Also, as noted
above, income and expenditure data are from the urban household survey, thus leaving out
the impact on migrant workers’ income and expenditure which could be larger.
9 To check the robustness of the results and consider the potentials economic activities generated from the import side, we also use total trade, i.e. exports plus imports, instead of exports as the main explanatory variable also yields similar results. The estimated impacts of total trade growth on activity indicators tend to be larger than that of exports in general.

17
V. Concluding Remarks
This paper demonstrates the importance of exports to China’s economic performance from a
demand side perspective. Our empirical analyses find the impact of exports on production
and employment and the spill-over to domestic demand are positive and statistically
significant, and are particularly sizeable for the more export-oriented regions. As these
regions account for a large share of the national economy (about 60 per cent), fluctuations in
export growth are likely to have a significant impact nation-wide. We find that a 10
percentage-point decline in export growth is likely to reduce the national industrial
production growth by around 3 percentage points. This will translate into around 2.5
percentage-point decline in real GDP growth, which is much larger than the direct impact of
exports on GDP growth alone. Among all the demand channels, the estimated response of
investment is particularly strong, especially for the main exporting regions. This suggests that
a significant part of fixed investments have been made to meet the exporting needs. The
impact on job growth, income and expenditure growth from the fluctuations in export growth
is also positive and statistically significant, although the statistical issues of data coverage
suggest that the actual impact could be much larger than that obtained from the estimation.
The substantial variations across regions in the impact of exports on production and spill-over
to domestic demand and employment growth also put the role of exports in China’s economic
performance in perspective. The results illustrate the importance of trade to the economy in
the more export-oriented regions (mostly coastal provinces) – not only do exports and
imports account for larger shares of economic activities in these areas, the impact of exports
on production and job growth and spillovers to investment and income are also more
powerful. These regions account for a substantial share of the national GDP, therefore
amplifying the impact of exports in the national economy. At the same time, the inland
regions have relied less on exports, both in terms of the size of the foreign trade and the links
of exports with other segments of the economy. It is important to note that in the inland areas,
public spending has been an important factor supporting growth, especially in recent years, as
reflected in the larger share of government expenditure in GDP in these regions than that in
coastal provinces. Therefore, the external orientation of the general Mainland economy
coexists with the fact that a vast area of inland regions has low export exposure, and other

18
factors including domestic policies (in particular government spending) may be more
important for the latter group.10
In light of the finding that the spill-over effects of exports tend to be non-linear and rise with
the relative size of trade, it is also easy to infer that such spill-over may have increased in
recent years. As exports as a share of GDP have risen very fast, from less than 20 per cent in
the 1990s to 35 per cent in 2008, the role of exports in directing resources in the economy has
become increasingly important. Along with the rise of the trade balance, this has increased
the economy’s dependence on foreign trade in recent years. In this context, we may expect a
larger impact from the external demand fluctuations on China’s domestic economy than in
the past. Macroeconomic management should take full account of the impact of the external
development on the domestic economy, and the counter-cyclical policies in dealing with the
current global economic downturn needs to be even more forceful than before.
10 Of course, even for these regions, there is still spill-over from exports through the income of migrant workers working in the large exporting regions.

19
References
Arellano, M. and S. Bond (1991), “Some tests of specification for panel data: Monte Carlo
evidence and an application to employment equations”, Review of Economic Studies, 58, 277-
297.
Aziz, J. and L. Cui (2007), “Explaining China's Low Consumption: The Neglected Role of
Household Income”, IMF Working Paper, WP 07/181.
Cui, L. and M. Syed (2007), “The shifting structure of China’s trade and production”, IMF
Working Paper, WP/07/214.
Frankel, J. A. and D. Romer (1999), “Does trade cause growth?”, The American Economic
Review, 89, 379-399.
Fu, X. and V. N. Balasubramanyam (2005), “Exports, foreign direct investment and
employment: the case of China”, The World Economy, 28, 607-625.
Giles, J.A. and C.L. Williams (2000), “Export-led growth: A survey of the empirical
literature and some non-causality results.” Journal of International Trade and Economic
Development, 9, 261-337 445-470.
He, D. and W. Zhang (2008), “How dependent is the Chinese economy on exports and in
what sense has its growth been export-led?”, Hong Kong Monetary Authority Working Paper,
14/2008.
Hua, P. (2007), “Real exchange rate and manufacturing employment in China”, China
Economic Review, 18, 335-353.
Kinkyo, T. (2008), “Do countries exporting more manufacturing products grow faster?”,
MIMEO, Graduate School of Economics, Kobe University.

20
Koopman, R., Z. Wang, and S. Wei (2008) “How Much of Chinese Exports is Really Made
In China? Assessing Domestic Value-Added When Processing Trade is Pervasive” NBER
Working Paper 14109
Ljungwall, C. (2006), “Export-led growth: application to China’s provinces, 1978 – 2001”,
Journal of Chinese Economic and Business Studies, 4, 109-126.
About the Author
Li Cui is a Division Head, Chang Shu a Senior Manager and Xiaojing Su a Manager in the External
Department of the Hong Kong Monetary Authority. The authors are grateful to Seth Lau and
Christina Li for research assistance. The authors are responsible for the views expressed in this article
and any errors.
About the Series
China Economic Issues provide a concise analysis of current economic and financial issues in China.
The series is edited by the External Department of the Hong Kong Monetary Authority.
Appendix: Dynamic panel estimation
A general dynamic panel model is specified as follows:
(A1) tiitititi Xyy ,,1,, εηβα +++= − .
In Equation A1, subscripts i and t represent province and time period respectively. Also in
the equation, yi,t is an activity indicator for province i at time t, while Xi,t includes the
explanatory described in earlier. The error term consists of a province specific effect ηi and a
stochastic error term ξi,t which is uncorrelated over all i and t.
In this dynamic panel data specification, the dependent variable is correlated with ηi and ξi,t.
The least squares dummy variables (LSDV) estimator of this model is inconsistent because
while the within transformation eliminates the individual effects ηi, Δξi,t is in the transformed
equation and correlates with the lagged dependent variable.

21
Arellano and Bond (1991) proposed a generalised method of moments (GMM) to estimate a
dynamic panel model, which consists of two steps. The first step estimator is obtained by
taking the difference of Equation A1, and utilising the following moment conditions:
(A2)
(A3) TtsforXE titisti ,.....,3;20)]([ 1,,, =≥=−⋅ −− εε
That is, all possible lags of the variables yi,t and Xi,t are used to generate orthogonality
conditions. In the second step, the estimator is constructed by utilising the residuals from the
first.
TtsforyE titisti ,.....,3;20)]([ 1,,, =≥=−⋅ −− εε

22
Table 1. Economic performance: big vs small exporters (1992 – 2007)
All Big exporters Small exportersLevelExport (USD, bn) 28.2 79.4 4.0 (% of GDP) (19.9) (47.4) (6.8)
GDP (RMB, bn) 709.9 1,213.5 471.4
Industrial production (RMB, bn) 265.3 511.3 148.8
Fixed assets investment (RMB, bn) 317.3 513.2 224.5
Income per capita (RMB) 10,618.9 14,075.2 8,981.7
Expenditure per capita (RMB) 5,935.9 9,545.5 4,226.1
Employment (person mn) 6.2 9.1 4.8
Growth (yoy%)Export 25.8 25.7 25.9
GDP 13.1 13.8 12.8
Industrial production 25.6 23.1 26.8
Fixed assets investment 22.8 20.3 23.9
Income per capita 9.4 10.1 9.1
Expenditure per capita 12.5 13.2 12.2
Employment 4.8 7.5 3.5 Sources: CEIC and staff calculation.

23
Table 2. Unit root test results
LLC test IPS testLevel
Exports 24.25(0.99)
23.91(0.99)
Industrial production 44.82(0.99)
44.88(0.99)
Fixed asset investment 39.92(0.99)
36.70(0.99)
Income per capita 16.37(0.99)
17.74(0.99)
Expenditure per capita 12.03(0.99)
16.09(0.99)
Urban employment 5.71(0.99)
3.55(0.99)
Government expenditure 50.16(0.99)
44.58(0.99)
Export / GDP ratio -2.12**(0.02)
-1.36*(0.09)
Growth
Exports -13.61***(0.00)
-12.38***(0.00)
Industrial production -2.42***(0.01)
-0.76(0.22)
Fixed asset investment -16.71***(0.00)
-8.80***(0.00)
Income per capita -10.25***(0.00)
-8.38***(0.00)
Expenditure per capita -16.17***(0.00)
-12.21***(0.00)
Urban employment -3.81***(0.00)
-3.21***(0.00)
Government expenditure -12.12***(0.00)
-8.75***(0.00)
ADF test PP testTime series
Real interest rate -2.37(0.17)
-1.75(0.39)
Source: staff estimates.

24
Table 3. Impacts of exports on industrial production
(1) (2) (3) (4)
Δip t-1 0.231 *** 0.122 *** 0.063 ** 0.166 ***(11.05) (4.04) (2.28) (5.96)
Δex t 0.051 *** 0.102 ** 0.062 *** 0.042(10.24) (2.31) (2.78) (0.81)
Δex t * Big 0.342 ***(9.26)
Δex t * (Ex / Ngdp) t 0.007 ***(3.54)
(Ex / Ngdp) t -0.106 0.263 -0.296(-0.19) (1.37) (-1.00)
rr t -0.604 *** 0.071 -1.124 ***(-6.38) (0.65) (-9.26)
Δ govt t 0.323 *** 0.448 *** 0.309 ***(2.68) (8.98) (5.36)
Number of observations 322 311 311 311Sargan statistic 26.50 [0.38] 24.32 [0.33] 24.61 [0.32] 25.26 [0.24]
Source: staff estimates.
Table 4. Impacts of exports on fixed-asset investment
(1) (2) (3) (4)
Δfai t-1 0.251 *** 0.167 *** 0.200 *** 0.141 ***(31.34) (5.78) (3.02) (2.68)
Δex t 0.052 *** 0.017 * 0.002 -0.028(6.69) (1.76) (0.08) (-0.79)
Δex t * Big 0.181 ***(4.32)
Δex t * (Ex / Ngdp) t 0.005 **(2.26)
(Ex / Ngdp) t 0.212 0.758 *** 1.280 **(1.05) (3.56) (2.27)
rr t -0.214 *** 0.132 -0.094(-3.47) (1.41) (-0.80)
Δ govt t 0.049 * 0.058 0.126(1.90) (0.59) (0.99)
Number of observations 334 317 317 317Sargan statistic 27.15 [0.46] 24.38 [0.33] 24.93 [ 0.25] 21.66 [0.42]
Source: staff estimates.

25
Table 5. Impacts of exports on income
(1) (2) (3) (4)
Δinc t-1 0.073 *** 0.032 ** 0.094 *** 0.081 ***(12.70) (2.12) (3.12) (2.84)
Δex t 0.042 *** 0.035 *** 0.021 ** 0.022 **(22.51) (5.17) (2.36) (1.99)
Δex t * Big 0.063 ***(5.84)
Δex t * (Ex / Ngdp) t 0.00046 **(2.49)
(Ex / Ngdp) t 0.062 ** 0.072 * 0.056(2.36) (1.84) (1.01)
rr t -0.190 *** -0.115 *** -0.156 ***(-7.76) (-3.32) (-5.20)
Δ govt t 0.125 *** 0.125 *** 0.107 ***(5.05) (4.86) (3.90)
Number of observations 349 332 332 332Sargan statistic 26.12 [0.40] 23.51 [0.43] 24.11 [0.34] 22.69 [0.36]
Source: staff estimates.
Table 6. Impacts of exports on expenditure
(1) (2) (3) (4)
Δexp t-1 -0.026 *** -0.110 *** -0.104 *** -0.107 ***(-7.98) (-9.57) (-5.76) (-7.03)
Δex t 0.061 *** 0.044 *** 0.034 *** 0.043 ***(51.28) (12.76) (6.33) (16.15)
Δex t * Big 0.047 ***(8.54)
Δex t * (Ex / Ngdp) t 0.0002 ***(2.84)
(Ex / Ngdp) t 0.071 *** 0.061 ** 0.072 **(4.24) (2.26) (2.45)
rr t -0.217 *** -0.182 *** -0.212 ***(-5.58) (-3.31) (-4.36)
Δ govt t 0.077 *** 0.081 ** 0.097 ***
(3.41) (2.50) (4.35)
Number of observations 349 332 332 332Sargan statistic 25.86 [0.42] 24.75 [0.31] 25.19 [0.24] 24.81 [0.26]
Source: staff estimates.

26
Table 7. Impacts of exports on employment
(1) (2) (3) (4)
Δem t-1 0.319 *** 0.059 *** 0.055 ** 0.037 *(229.03) (2.97) (2.30) (1.73)
Δex t 0.032 *** 0.008 * -0.016 *** -0.041 ***(44.05) (1.68) (-2.93) (-3.33)
Δex t * Big 0.120 ***(5.73)
Δex t * (Ex / Ngdp) t 0.004 ***(3.15)
(Ex / Ngdp) t 0.215 *** 0.274 *** 0.080(14.94) (4.39) (0.44)
rr t -0.711 *** -0.657 *** -0.689 ***(-18.79) (-23.64) (-36.91)
Δ govt t 0.030 0.023 0.024
(1.46) (1.04) (1.07)
Number of observations 322 311 311 311Sargan statistic 26.01 [0.41] 28.24 [0.21] 25.35 [0.23] 23.41 [0.32]
Source: staff estimates.

Table 8. Estimated impacts: short-run and long-run
Average Small group Big group Lowest Highest Average Small group Big group Lowest Highest
Industrial production 0.102 0.062 0.404 0.032 0.636 0.116 0.066 0.431 0.039 0.762
Fixed asset investment 0.017 0.000 0.181 0.023 0.454 0.020 0.000 0.226 0.027 0.529
Income per capita 0.035 0.021 0.084 0.024 0.064 0.036 0.023 0.093 0.026 0.069
Expenditure per capita 0.044 0.034 0.081 0.044 0.061 0.040 0.031 0.073 0.040 0.055
Urban employment 0.008 -0.016 0.104 -0.023 0.322 0.009 -0.017 0.110 -0.023 0.335
Short term Long term
Source: staff estimates.

Chart 9. Short-run impacts of exports on different provinces
a. Industrial production b. Fixed-asset investment
0.00
0.10
0.20
0.30
0.40
0.50
0.60
0.70
Gua
ngdo
ng
Shan
ghai
Jiang
su
Tian
jin
Zhej
iang
Fujia
n
Liao
ning
Beiji
ng
Shan
dong
0.00
0.10
0.20
0.30
0.40
0.50
0.60
0.70
0.00
0.05
0.10
0.15
0.20
0.25
0.30
0.35
0.40
0.45
0.50
Gua
ngdo
ng
Shan
ghai
Jiang
su
Tian
jin
Zhej
iang
Fujia
n
Liao
ning
Beiji
ng
Shan
dong
0.00
0.05
0.10
0.15
0.20
0.25
0.30
0.35
0.40
0.45
0.50
c. Income per capita d. Expenditure per capita
0.00
0.01
0.02
0.03
0.04
0.05
0.06
0.07
Gua
ngdo
ng
Shan
ghai
Jiang
su
Tian
jin
Zhej
iang
Fujia
n
Liao
ning
Beiji
ng
Shan
dong
0.00
0.01
0.02
0.03
0.04
0.05
0.06
0.07
0.00
0.01
0.02
0.03
0.04
0.05
0.06
0.07
Gua
ngdo
ng
Shan
ghai
Jiang
su
Tian
jin
Zhej
iang
Fujia
n
Liao
ning
Beiji
ng
Shan
dong
0.00
0.01
0.02
0.03
0.04
0.05
0.06
0.07
e. Urban employment
0.00
0.05
0.10
0.15
0.20
0.25
0.30
0.35
Gua
ngdo
ng
Shan
ghai
Jiang
su
Tian
jin
Zhej
iang
Fujia
n
Liao
ning
Beiji
ng
Shan
dong
0.00
0.05
0.10
0.15
0.20
0.25
0.30
0.35
Sources: CEIC and staff estimates.