China. *E-mail: [email protected] Their Halides with ...
18
1 Tetragonal-Structured Anisotropic 2D Metal Nitride Monolayers and Their Halides with Versatile Promises in Energy Storage and Conversion Xu Zhang, Zihe Zhang, Xudong Zhao, Dihua Wu, Xin Zhang, Zhen Zhou* Tianjin Key Laboratory of Metal and Molecule Based Material Chemistry, Computational Centre for Molecular Science, Institute of New Energy Material Chemistry, Collaborative Innovation Center of Chemical Science and Engineering (Tianjin), School of Materials Science and Engineering, National Institute for Advanced Materials, Nankai University, Tianjin 300350, P. R. China. *E-mail: [email protected] Electronic Supplementary Material (ESI) for Journal of Materials Chemistry A. This journal is © The Royal Society of Chemistry 2017
Transcript of China. *E-mail: [email protected] Their Halides with ...

1
Tetragonal-Structured Anisotropic 2D Metal Nitride Monolayers and
Their Halides with Versatile Promises in Energy Storage and Conversion
Xu Zhang, Zihe Zhang, Xudong Zhao, Dihua Wu, Xin Zhang, Zhen Zhou*
Tianjin Key Laboratory of Metal and Molecule Based Material Chemistry, Computational Centre
for Molecular Science, Institute of New Energy Material Chemistry, Collaborative Innovation
Center of Chemical Science and Engineering (Tianjin), School of Materials Science and
Engineering, National Institute for Advanced Materials, Nankai University, Tianjin 300350, P. R.
China. *E-mail: [email protected]
Electronic Supplementary Material (ESI) for Journal of Materials Chemistry A.This journal is © The Royal Society of Chemistry 2017

2
Fig. S1 Phonon band dispersion of (a) t-TiN; (b) t-ZrN and (c) t-HfN monolayer calculated through
DFPT as implemented in PHONOPY code.
Table S1. The bond length (Å) of Ti-N, Zr-N and Hf-N along the x and y direction, respectively.
Ti-N Zr-N Hf-N
x 2.00 2.15 2.12
y 2.04 2.22 2.16

3
Fig. S2 The snapshot of the equilibrium structure of (a) t-TiN; (b) t-ZrN and (c) t-HfN at 1500 K at
the end of 5 ps first-principles molecular dynamic (MD) simulation. A 3×3 supercell was adopted
to approximate the realistic stability.
The in-plane stiffness was calculated by C2D = (∂2Etotal/∂ε2)/S0, where Etotal, ε and S0 represent
the total energy per unit cell, uniaxial strain and the area of the optimized unit cell, respectively, and
the results are summarized in Table S2. The gravity induced out of plane deformation h can be
calculated by h/l ≈ (ρgl/C2D)1/3 1, where l is the length of the monolayer, ρ is the density (Table S2)
and g is the gravitational acceleration.
Through the elasticity theory, the gravity induced out of plane deformation h can be estimated.
Assuming the length of the monolayer to be 100 μm, the order of magnitude of h/l is ~10-4, which
indicates that the t-MN monolayers behave sufficient rigidity to form freestanding 2D monolayers
without substrates.

4
Table S2. The in-plane stiffness C2D (N/m) and density ρ (10-6 kg/m2) of MN (M = Ti, Zr, Hf).
TiN ZrN HfN
C2D(x) 46.4 30.5 44.2
C2D(y) 163.6 210.3 194.1
ρ 1.43 2.05 3.64

5
Table S3. The charge transfer c.t. (|e|) of t-MN (M = Ti, Zr, Hf).
TiN ZrN HfN
c.t. (M) 1.48 1.61 1.67
c.t. (N) 1.48 1.61 1.67
Fig. S3 The partial density of states (PDOS) of (a) t-TiN, (b) t-ZrN, and (c) t-HfN.

6
Fig. S4 Structure schematics of (a) t-TiNCl, (b) t-TiNBr, (c) t-TiNI, (d) t-ZrNCl, (e) t-ZrNBr, (f) t-
ZrNI, (g) t-HfNCl, (h) t-HfNBr, and (i) t-HfNI. Dashed rectangles represent the unit cell.

7
Table S4. The bond length (Å) of t-MNX (M = Ti, Zr, Hf, X = Cl, Br, I) monolayers.
TiNCl TiNBr TiNI ZrNCl ZrNBr ZrNI HfNCl HfNBr HfNI
M-N (x) 2.00 2.02 2.04 2.16 2.16 2.18 2.12 2.13 2.14
M-N (y) 2.01 2.01 2.01 2.16 2.16 2.16 2.13 2.13 2.13
M-X 2.45 2.60 2.80 2.62 2.76 2.96 2.59 2.74 2.94

8
Fig. S5 Phonon band dispersion of (a) t-TiNCl, (b) t-TiNBr, (c) t-TiNI, (d) t-ZrNCl, (e) t-ZrNBr, (f)
t-ZrNI, (g) t-HfNCl, (h) t-HfNBr, and (i) t-HfNI.
9
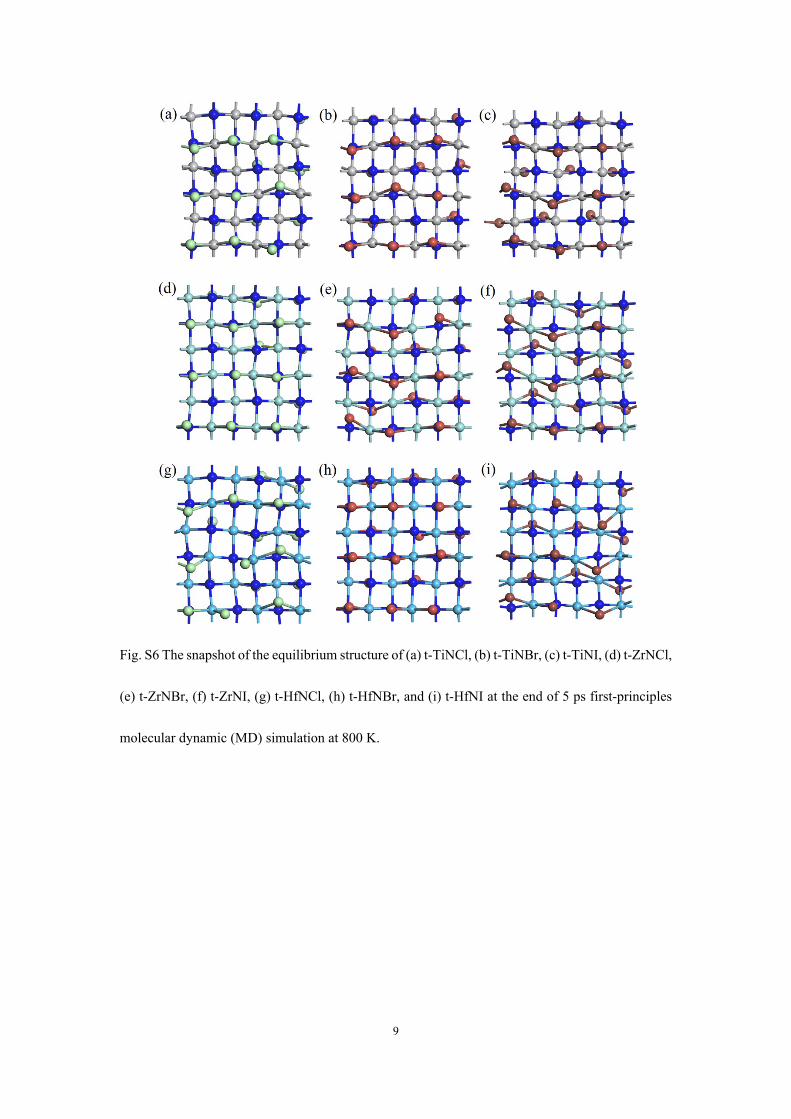
Fig. S6 The snapshot of the equilibrium structure of (a) t-TiNCl, (b) t-TiNBr, (c) t-TiNI, (d) t-ZrNCl,
(e) t-ZrNBr, (f) t-ZrNI, (g) t-HfNCl, (h) t-HfNBr, and (i) t-HfNI at the end of 5 ps first-principles
molecular dynamic (MD) simulation at 800 K.

10
Fig. S7 The snapshot of the equilibrium structure of (a) t-TiNCl, (b) t-TiNBr, (c) t-TiNI, (d) t-ZrNCl,
(e) t-ZrNBr, (f) t-ZrNI, (g) t-HfNCl, (h) t-HfNBr, and (i) t-HfNI at the end of 5 ps first-principles
molecular dynamic (MD) simulation at 1500 K.

11
Table S5. The band gaps G (eV) with and without SOC, position of VBM and CBM for t-MNX (M
= Ti, Zr, Hf, X = Cl, Br, I) monolayers.
TiNCl TiNBr TiNI ZrNCl ZrNBr ZrNI HfNCl HfNBr HfNI
G 1.42 1.40 0.41 2.80 2.77 2.25 3.26 3.22 2.68
G (SOC) 1.41 1.40 0.35 2.81 2.79 2.12 3.26 3.22 2.62
VBM Γ Γ Γ Γ Γ Γ Γ Γ Γ
CBM Γ Γ Γ Γ Γ Γ Γ Γ Γ
direct direct direct direct direct direct direct direct direct

12
Fig. S8 PDOS of (a) t-TiNCl, (b) t-TiNBr, (c) t-TiNI, (d) t-ZrNCl, (e) t-ZrNBr, (f) t-ZrNI, (g) t-
HfNCl, (h) t-HfNBr, and (i) t-HfNI.

13
For t-MNCl and t-MNBr monolayers, the hybridization of N-p and M-d orbitals dominantly
contributes to the states near Fermi level which reveals that their bonding states are mainly
contributed by the hybridization of N-p and M-d. However, for t-MNI, the states near VBM are
dominantly contributed by I-p and N-p while the states near CBM are mainly contributed by the
hybridization of N-p and M-d.
Table S6. The absolute value of effective mass |m*| (m0, the mass of free electrons). The subscript
e, h, x and y represent electron, hole, x and y directions, respectively.
TiNCl TiNBr TiNI ZrNCl ZrNBr ZrNI HfNCl HfNBr HfNI
|me*|x 0.52 0.44 0.36 0.56 0.47 0.38 0.67 0.50 0.38
|mh*|x 0.38 0.36 0.20 0.42 0.44 0.22 0.42 0.42 0.28
|me*|y 0.46 0.42 0.36 0.36 0.35 0.32 0.33 0.32 0.30
|mh*|y 0.24 0.28 1.33 0.51 0.62 1.89 0.35 0.43 2.12

14
Fig. S9 The CBM and VBM position of (a) t-TiNCl, (b) t-TiNBr, (c) t-TiNI, (d) t-ZrNCl, (e) t-
ZrNBr, (f) t-ZrNI, (g) t-HfNCl, (h) t-HfNBr, and (i) t-HfNI with respect to the vacuum level as a
function of the uniaxial strain ε along the x and y direction. The solid lines are the linear fitting to
the data.

15
Table S7. The absolute value of DP constant E1 (eV) of t-MNX.
TiNCl TiNBr TiNI ZrNCl ZrNBr ZrNI HfNCl HfNBr HfNI
|E1e|x 10.9 9.6 9.9 11.0 11.5 11.8 12.3 12.5 12.4
|E1h|x 8.9 8.7 16.2 8.3 8.8 12.3 7.9 8.7 12.9
|E1e|y 7.2 8.1 8.7 10.1 10.2 11.1 10.8 11.0 11.9
|E1h|y 4.0 4.1 2.7 2.5 1.8 3.4 4.9 3.6 3.4
Table S8. The in-plane stiffness C2D (N/m) of t-MNX along the x and y direction.
TiNCl TiNBr TiNI ZrNCl ZrNBr ZrNI HfNCl HfNBr HfNI
C2Dx 150.3 147.5 143.0 140.7 135.7 136.3 153.9 148.5 148.7
C2Dy 167.7 168.8 179.2 132.0 126.0 122.9 153.4 146.1 141.8
Fig. S10 Computed imaginary dielectric functions versus energy for t-MNX monolayers. The ε2(ω)
terms are the average of x, y and z directions, that is to say, ε2(ω) = 1/3(εxx(ω)+ εyy(ω)+εzz(ω)). The
area between the red and purple lines represents the visible range.

16
Table S9. Calculated carrier mobility μ (cm2 V-1 S-1) of t-MNX along the x and y directions.
TiNCl TiNBr TiNI ZrNCl ZrNBr ZrNI HfNCl HfNBr HfNI
μe (x) 65.3 118.6 158.6 52.9 66.4 96.4 31.9 54.4 93.3
μh (x) 186.3 211.8 200.2 163.8 126.6 272.0 197.1 156.4 162.5
μe (y) 218.1 210.7 261.6 139.4 138.6 135.1 167.1 161.1 153.2
μh (y) 2450.1 1759.8 197.8 1149.3 1326.7 40.8 739.7 851.4 38.8
Fig. S11 Cleavage energy Ecl (right longitudinal coordinates) and its derivative σ (left longitudinal
coordinates) as a function of the separation distance in β-TiNI, β-ZrNI and β-HfNBr bulk. Inset:
geometry of introduced fracture.

17
Table S10. The lattice parameters a, b and c (Å) of β-TiNI, β-ZrNI and β-HfNBr bulk. The numbers
in brackets are the experimental data.2, 3
a b c
β-TiNI 3.50 (3.51) 3.97 (3.94) 8.88 (8.95)
β-ZrNI 3.74 (3.72) 4.14 (4.11) 9.34 (9.43)
β-HfNBr 3.55 (3.56) 4.11 (4.12) 8.59 (8.64)

18
References
1. T. J. Booth, P. Blake, R. R. Nair, D. Jiang, E. W. Hill, U. Bangert, A. Bleloch, M. Gass, K.
S. Novoselov, M. I. Katsnelson and A. K. Geim, Nano Lett., 2008, 8, 2442-2446.
2. R. Juza and J. Heners, Z. Anorg. Allg. Chem., 1964, 332, 159-172.
3. J. Oró-Solé, M. Vlassov, D. Beltrán-Porter, M. T. Caldés, V. Primo and A. Fuertes, Solid
State Sci., 2002, 4, 475-480.