China China IPPs - Fuller Treacy Money the global power utility universe, China IPPs have the...
40
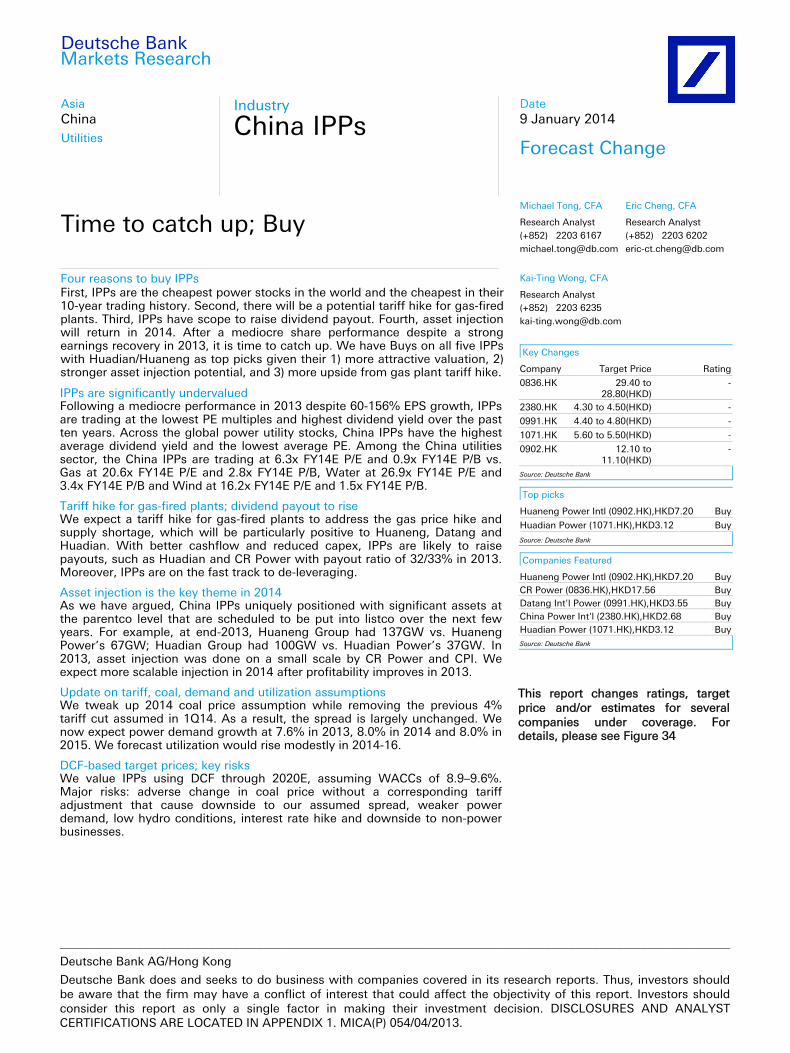
Deutsche Bank Markets Research Asia China Utilities Industry China IPPs Date 9 January 2014 Forecast Change Time to catch up; Buy Four reasons to buy IPPs ________________________________________________________________________________________________________________ Deutsche Bank AG/Hong Kong Deutsche Bank does and seeks to do business with companies covered in its research reports. Thus, investors should be aware that the firm may have a conflict of interest that could affect the objectivity of this report. Investors should consider this report as only a single factor in making their investment decision. DISCLOSURES AND ANALYST CERTIFICATIONS ARE LOCATED IN APPENDIX 1. MICA(P) 054/04/2013. Michael Tong, CFA Research Analyst (+852) 2203 6167 [email protected] Eric Cheng, CFA Research Analyst (+852) 2203 6202 [email protected] Kai-Ting Wong, CFA Research Analyst (+852) 2203 6235 [email protected] Key Changes Company Target Price Rating 0836.HK 29.40 to 28.80(HKD) - 2380.HK 4.30 to 4.50(HKD) - 0991.HK 4.40 to 4.80(HKD) - 1071.HK 5.60 to 5.50(HKD) - 0902.HK 12.10 to 11.10(HKD) - Source: Deutsche Bank Top picks Huaneng Power Intl (0902.HK),HKD7.20 Buy Huadian Power (1071.HK),HKD3.12 Buy Source: Deutsche Bank Companies Featured Huaneng Power Intl (0902.HK),HKD7.20 Buy CR Power (0836.HK),HKD17.56 Buy Datang Int'l Power (0991.HK),HKD3.55 Buy China Power Int'l (2380.HK),HKD2.68 Buy Huadian Power (1071.HK),HKD3.12 Buy Source: Deutsche Bank This report changes ratings, target price and/or estimates for several companies under coverage. For details, please see Figure 34 First, IPPs are the cheapest power stocks in the world and the cheapest in their 10-year trading history. Second, there will be a potential tariff hike for gas-fired plants. Third, IPPs have scope to raise dividend payout. Fourth, asset injection will return in 2014. After a mediocre share performance despite a strong earnings recovery in 2013, it is time to catch up. We have Buys on all five IPPs with Huadian/Huaneng as top picks given their 1) more attractive valuation, 2) stronger asset injection potential, and 3) more upside from gas plant tariff hike. IPPs are significantly undervalued Following a mediocre performance in 2013 despite 60-156% EPS growth, IPPs are trading at the lowest PE multiples and highest dividend yield over the past ten years. Across the global power utility stocks, China IPPs have the highest average dividend yield and the lowest average PE. Among the China utilities sector, the China IPPs are trading at 6.3x FY14E P/E and 0.9x FY14E P/B vs. Gas at 20.6x FY14E P/E and 2.8x FY14E P/B, Water at 26.9x FY14E P/E and 3.4x FY14E P/B and Wind at 16.2x FY14E P/E and 1.5x FY14E P/B. Tariff hike for gas-fired plants; dividend payout to rise We expect a tariff hike for gas-fired plants to address the gas price hike and supply shortage, which will be particularly positive to Huaneng, Datang and Huadian. With better cashflow and reduced capex, IPPs are likely to raise payouts, such as Huadian and CR Power with payout ratio of 32/33% in 2013. Moreover, IPPs are on the fast track to de-leveraging. Asset injection is the key theme in 2014 As we have argued, China IPPs uniquely positioned with significant assets at the parentco level that are scheduled to be put into listco over the next few years. For example, at end-2013, Huaneng Group had 137GW vs. Huaneng Power’s 67GW; Huadian Group had 100GW vs. Huadian Power’s 37GW. In 2013, asset injection was done on a small scale by CR Power and CPI. We expect more scalable injection in 2014 after profitability improves in 2013. Update on tariff, coal, demand and utilization assumptions We tweak up 2014 coal price assumption while removing the previous 4% tariff cut assumed in 1Q14. As a result, the spread is largely unchanged. We now expect power demand growth at 7.6% in 2013, 8.0% in 2014 and 8.0% in 2015. We forecast utilization would rise modestly in 2014-16. DCF-based target prices; key risks We value IPPs using DCF through 2020E, assuming WACCs of 8.9–9.6%. Major risks: adverse change in coal price without a corresponding tariff adjustment that cause downside to our assumed spread, weaker power demand, low hydro conditions, interest rate hike and downside to non-power businesses.
Transcript of China China IPPs - Fuller Treacy Money the global power utility universe, China IPPs have the...
Deutsche Bank Markets Research
Asia China Utilities
Industry
China IPPs
Date 9 January 2014
Forecast Change
Time to catch up; Buy
Four reasons to buy IPPs
________________________________________________________________________________________________________________
Deutsche Bank AG/Hong Kong
Deutsche Bank does and seeks to do business with companies covered in its research reports. Thus, investors should be aware that the firm may have a conflict of interest that could affect the objectivity of this report. Investors should consider this report as only a single factor in making their investment decision. DISCLOSURES AND ANALYST CERTIFICATIONS ARE LOCATED IN APPENDIX 1. MICA(P) 054/04/2013.
Michael Tong, CFA
Research Analyst (+852) 2203 6167 [email protected]
Eric Cheng, CFA
Research Analyst (+852) 2203 6202 [email protected]
Kai-Ting Wong, CFA
Research Analyst (+852) 2203 6235 [email protected]
Key Changes
Company Target Price Rating
0836.HK 29.40 to 28.80(HKD)
-
2380.HK 4.30 to 4.50(HKD) -
0991.HK 4.40 to 4.80(HKD) -
1071.HK 5.60 to 5.50(HKD) -
0902.HK 12.10 to 11.10(HKD)
-
Source: Deutsche Bank
Top picks
Huaneng Power Intl (0902.HK),HKD7.20 Buy
Huadian Power (1071.HK),HKD3.12 Buy
Source: Deutsche Bank
Companies Featured
Huaneng Power Intl (0902.HK),HKD7.20 BuyCR Power (0836.HK),HKD17.56 BuyDatang Int'l Power (0991.HK),HKD3.55 BuyChina Power Int'l (2380.HK),HKD2.68 BuyHuadian Power (1071.HK),HKD3.12 BuySource: Deutsche Bank
This report changes ratings, target price and/or estimates for several companies under coverage. For details, please see Figure 34
First, IPPs are the cheapest power stocks in the world and the cheapest in their 10-year trading history. Second, there will be a potential tariff hike for gas-fired plants. Third, IPPs have scope to raise dividend payout. Fourth, asset injection will return in 2014. After a mediocre share performance despite a strong earnings recovery in 2013, it is time to catch up. We have Buys on all five IPPs with Huadian/Huaneng as top picks given their 1) more attractive valuation, 2) stronger asset injection potential, and 3) more upside from gas plant tariff hike.
IPPs are significantly undervalued Following a mediocre performance in 2013 despite 60-156% EPS growth, IPPs are trading at the lowest PE multiples and highest dividend yield over the past ten years. Across the global power utility stocks, China IPPs have the highest average dividend yield and the lowest average PE. Among the China utilities sector, the China IPPs are trading at 6.3x FY14E P/E and 0.9x FY14E P/B vs. Gas at 20.6x FY14E P/E and 2.8x FY14E P/B, Water at 26.9x FY14E P/E and 3.4x FY14E P/B and Wind at 16.2x FY14E P/E and 1.5x FY14E P/B.
Tariff hike for gas-fired plants; dividend payout to rise We expect a tariff hike for gas-fired plants to address the gas price hike and supply shortage, which will be particularly positive to Huaneng, Datang and Huadian. With better cashflow and reduced capex, IPPs are likely to raise payouts, such as Huadian and CR Power with payout ratio of 32/33% in 2013. Moreover, IPPs are on the fast track to de-leveraging.
Asset injection is the key theme in 2014 As we have argued, China IPPs uniquely positioned with significant assets at the parentco level that are scheduled to be put into listco over the next few years. For example, at end-2013, Huaneng Group had 137GW vs. Huaneng Power’s 67GW; Huadian Group had 100GW vs. Huadian Power’s 37GW. In 2013, asset injection was done on a small scale by CR Power and CPI. We expect more scalable injection in 2014 after profitability improves in 2013.
Update on tariff, coal, demand and utilization assumptions We tweak up 2014 coal price assumption while removing the previous 4% tariff cut assumed in 1Q14. As a result, the spread is largely unchanged. We now expect power demand growth at 7.6% in 2013, 8.0% in 2014 and 8.0% in 2015. We forecast utilization would rise modestly in 2014-16.
DCF-based target prices; key risks We value IPPs using DCF through 2020E, assuming WACCs of 8.9–9.6%. Major risks: adverse change in coal price without a corresponding tariff adjustment that cause downside to our assumed spread, weaker power demand, low hydro conditions, interest rate hike and downside to non-power businesses.

9 January 2014
Utilities
China IPPs
Page 2 Deutsche Bank AG/Hong Kong
Table of contents
Four reasons to buy IPPs ..................................................... 3 Significantly undervalued: the cheapest power stocks in the world ................... 3 Potential tariff hike for gas-fired power plants .................................................... 6 Upside to dividend payout ................................................................................... 8 Asset injection is key story for the sector in 2014 ............................................. 10
Coal price and tariff update ............................................... 12 Big spike in QHD spot coal price in 4Q13 set to retreat .................................... 12 Build in 2014 spot coal price of Rmb580/ton with no tariff change in models . 13 IPPs are not making super normal profits .......................................................... 13
Power demand and supply update.................................... 15 Power consumption update ............................................................................... 15 Power generation update: wind growing at the fastest pace ............................ 16 Utilization hour update: wind saw the biggest improvement ............................ 16 New capacity update: thermal down and non-thermal up ................................ 17 Power demand and supply forecast................................................................... 17
Forecast changes, comps and earnings sensitivity ........... 20 Key changes across the sector ........................................................................... 20 Key operating assumptions ................................................................................ 20
Stock views: investment outlook, valuation methodology, risks ................................................................................... 24 CR Power (Buy, target price HK$28.8) ............................................................... 24 Huaneng Power (Buy, target price HK$11.1) ..................................................... 25 Datang Power (Buy, target price HK$4.8) .......................................................... 26 China Power International (Buy, target price HK$4.5) ....................................... 27 Huadian Power (Buy, target price HK$5.5) ........................................................ 28
9 January 2014
Utilities
China IPPs
Deutsche Bank AG/Hong Kong Page 3
Four reasons to buy IPPs
Significantly undervalued: the cheapest power stocks in the world
Key points Following a mediocre performance in 2013 despite 60-156% yoy EPS
growth, IPPs are trading at the lowest PE multiples and highest dividend yield over the last ten years.
Among the China utilities sector, the China IPPs are trading at significant valuation discounts to gas, wind, and water utilities.
Across the global power utility universe, China IPPs have the highest FY13E dividend yield and the lowest FY14E P/E.
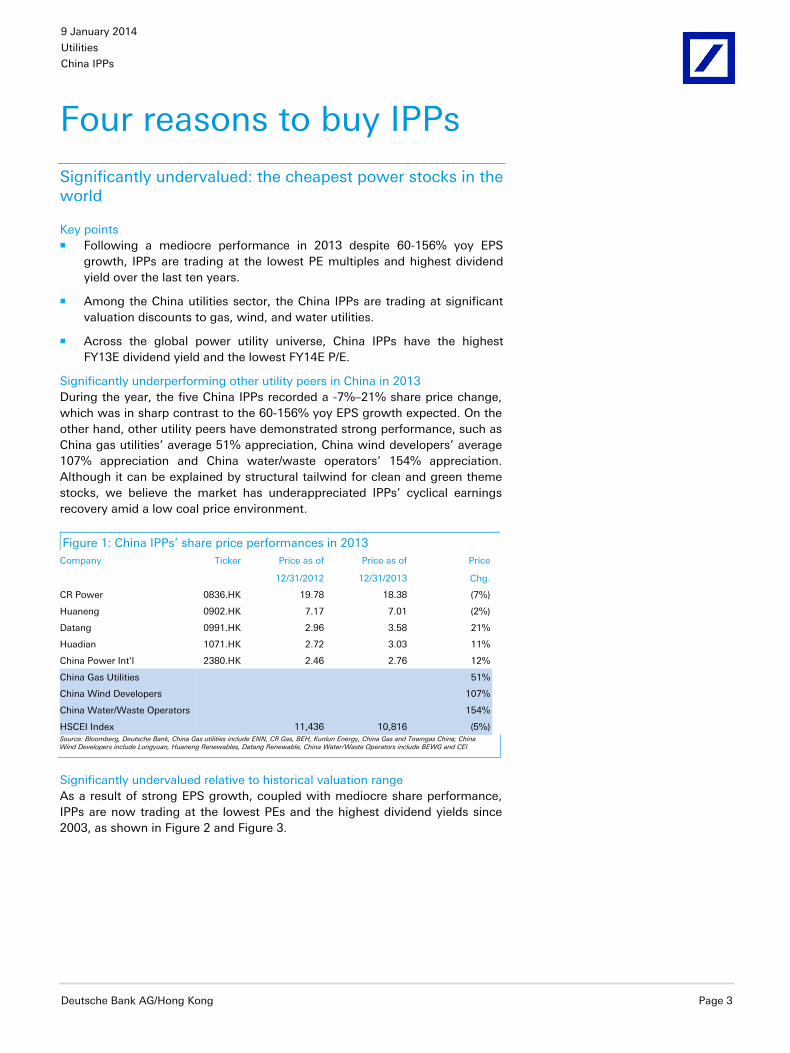
Significantly underperforming other utility peers in China in 2013 During the year, the five China IPPs recorded a -7%–21% share price change, which was in sharp contrast to the 60-156% yoy EPS growth expected. On the other hand, other utility peers have demonstrated strong performance, such as China gas utilities’ average 51% appreciation, China wind developers’ average 107% appreciation and China water/waste operators’ 154% appreciation. Although it can be explained by structural tailwind for clean and green theme stocks, we believe the market has underappreciated IPPs’ cyclical earnings recovery amid a low coal price environment.
Figure 1: China IPPs’ share price performances in 2013 Company Ticker Price as of Price as of Price
12/31/2012 12/31/2013 Chg.
CR Power 0836.HK 19.78 18.38 (7%)
Huaneng 0902.HK 7.17 7.01 (2%)
Datang 0991.HK 2.96 3.58 21%
Huadian 1071.HK 2.72 3.03 11%
China Power Int'l 2380.HK 2.46 2.76 12%
China Gas Utilities 51%
China Wind Developers 107%
China Water/Waste Operators 154%
HSCEI Index 11,436 10,816 (5%)Source: Bloomberg, Deutsche Bank, China Gas utilities include ENN, CR Gas, BEH, Kunlun Energy, China Gas and Towngas China; China Wind Developers include Longyuan, Huaneng Renewables, Datang Renewable, China Water/Waste Operators include BEWG and CEI
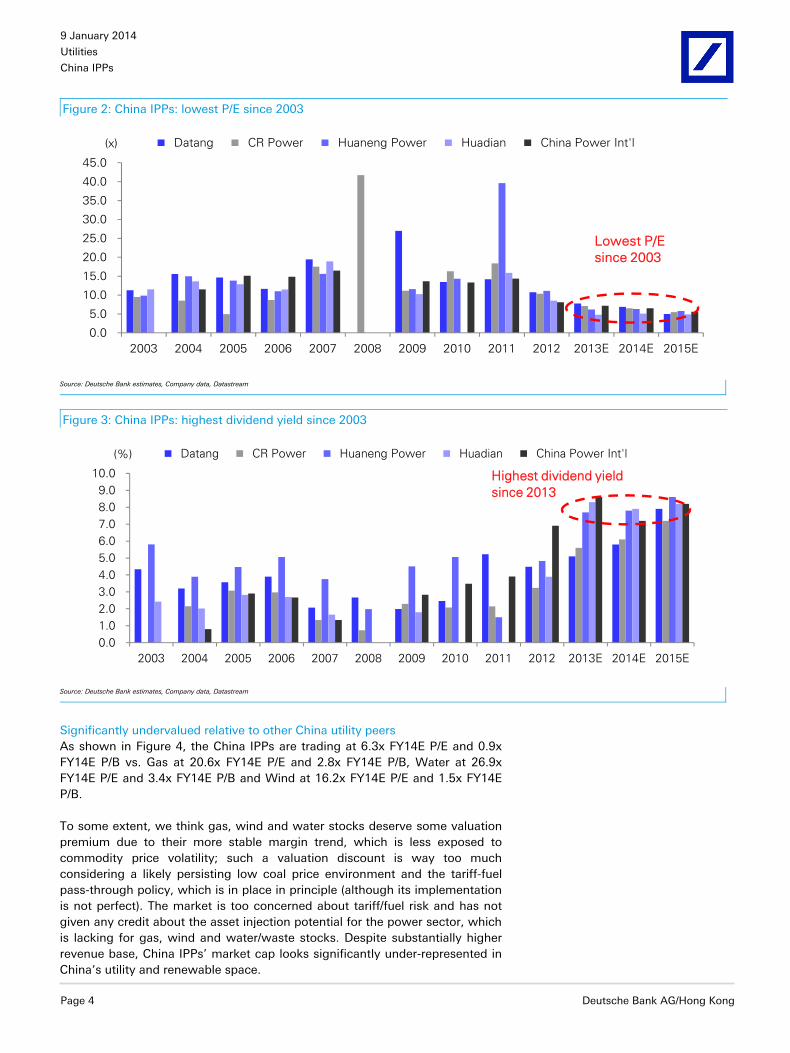
Significantly undervalued relative to historical valuation range As a result of strong EPS growth, coupled with mediocre share performance, IPPs are now trading at the lowest PEs and the highest dividend yields since 2003, as shown in Figure 2 and Figure 3.
9 January 2014
Utilities
China IPPs
Page 4 Deutsche Bank AG/Hong Kong
Figure 2: China IPPs: lowest P/E since 2003
0.0
5.0
10.0
15.0
20.0
25.0
30.0
35.0
40.0
45.0
2003 2004 2005 2006 2007 2008 2009 2010 2011 2012 2013E 2014E 2015E
(x) Datang CR Power Huaneng Power Huadian China Power Int'l
Lowest P/E since 2003
Source: Deutsche Bank estimates, Company data, Datastream
Figure 3: China IPPs: highest dividend yield since 2003
0.0 1.0 2.0 3.0 4.0 5.0 6.0 7.0 8.0 9.0
10.0
2003 2004 2005 2006 2007 2008 2009 2010 2011 2012 2013E 2014E 2015E
(%) Datang CR Power Huaneng Power Huadian China Power Int'l
Highest dividend yieldsince 2013
Source: Deutsche Bank estimates, Company data, Datastream
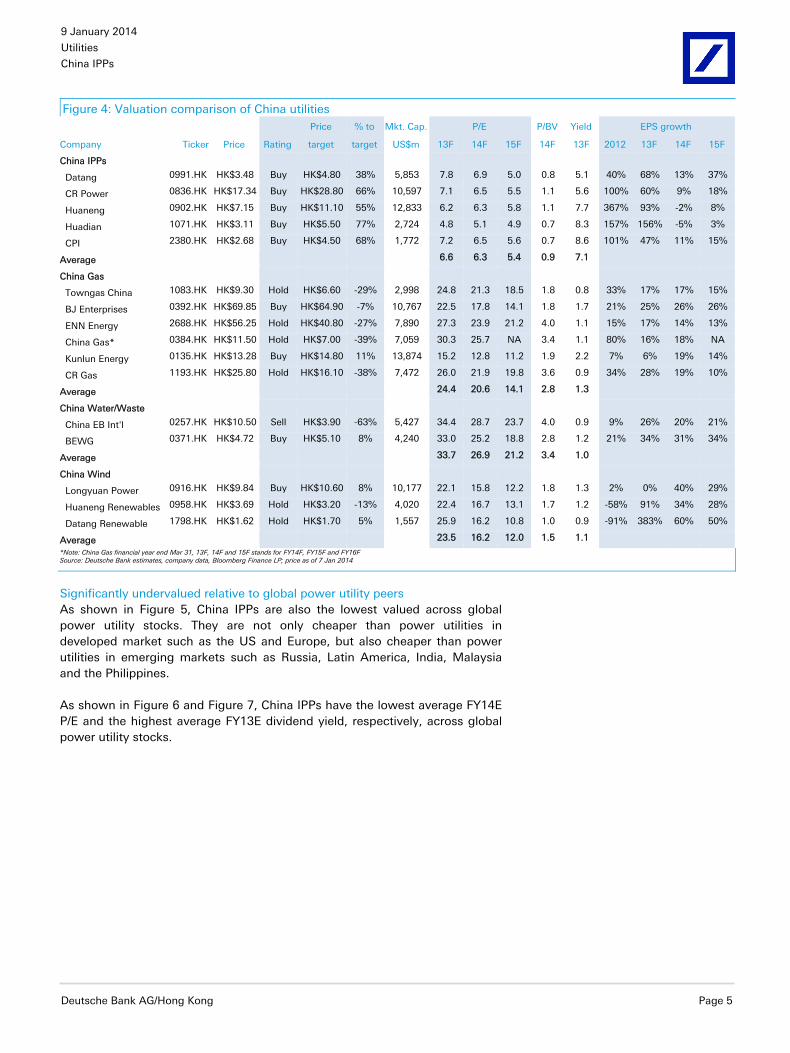
Significantly undervalued relative to other China utility peers As shown in Figure 4, the China IPPs are trading at 6.3x FY14E P/E and 0.9x FY14E P/B vs. Gas at 20.6x FY14E P/E and 2.8x FY14E P/B, Water at 26.9x FY14E P/E and 3.4x FY14E P/B and Wind at 16.2x FY14E P/E and 1.5x FY14E P/B.
To some extent, we think gas, wind and water stocks deserve some valuation premium due to their more stable margin trend, which is less exposed to commodity price volatility; such a valuation discount is way too much considering a likely persisting low coal price environment and the tariff-fuel pass-through policy, which is in place in principle (although its implementation is not perfect). The market is too concerned about tariff/fuel risk and has not given any credit about the asset injection potential for the power sector, which is lacking for gas, wind and water/waste stocks. Despite substantially higher revenue base, China IPPs’ market cap looks significantly under-represented in China‘s utility and renewable space.
9 January 2014
Utilities
China IPPs
Deutsche Bank AG/Hong Kong Page 5
Figure 4: Valuation comparison of China utilities Price % to Mkt. Cap. P/E P/BV Yield EPS growth
Company Ticker Price Rating target target US$m 13F 14F 15F 14F 13F 2012 13F 14F 15F
China IPPs
Datang 0991.HK HK$3.48 Buy HK$4.80 38% 5,853 7.8 6.9 5.0 0.8 5.1 40% 68% 13% 37%
CR Power 0836.HK HK$17.34 Buy HK$28.80 66% 10,597 7.1 6.5 5.5 1.1 5.6 100% 60% 9% 18%
Huaneng 0902.HK HK$7.15 Buy HK$11.10 55% 12,833 6.2 6.3 5.8 1.1 7.7 367% 93% -2% 8%
Huadian 1071.HK HK$3.11 Buy HK$5.50 77% 2,724 4.8 5.1 4.9 0.7 8.3 157% 156% -5% 3%
CPI 2380.HK HK$2.68 Buy HK$4.50 68% 1,772 7.2 6.5 5.6 0.7 8.6 101% 47% 11% 15%
Average 6.6 6.3 5.4 0.9 7.1
China Gas
Towngas China 1083.HK HK$9.30 Hold HK$6.60 -29% 2,998 24.8 21.3 18.5 1.8 0.8 33% 17% 17% 15%
BJ Enterprises 0392.HK HK$69.85 Buy HK$64.90 -7% 10,767 22.5 17.8 14.1 1.8 1.7 21% 25% 26% 26%
ENN Energy 2688.HK HK$56.25 Hold HK$40.80 -27% 7,890 27.3 23.9 21.2 4.0 1.1 15% 17% 14% 13%
China Gas* 0384.HK HK$11.50 Hold HK$7.00 -39% 7,059 30.3 25.7 NA 3.4 1.1 80% 16% 18% NA
Kunlun Energy 0135.HK HK$13.28 Buy HK$14.80 11% 13,874 15.2 12.8 11.2 1.9 2.2 7% 6% 19% 14%
CR Gas 1193.HK HK$25.80 Hold HK$16.10 -38% 7,472 26.0 21.9 19.8 3.6 0.9 34% 28% 19% 10%
Average 24.4 20.6 14.1 2.8 1.3
China Water/Waste
China EB Int'l 0257.HK HK$10.50 Sell HK$3.90 -63% 5,427 34.4 28.7 23.7 4.0 0.9 9% 26% 20% 21%
BEWG 0371.HK HK$4.72 Buy HK$5.10 8% 4,240 33.0 25.2 18.8 2.8 1.2 21% 34% 31% 34%
Average 33.7 26.9 21.2 3.4 1.0
China Wind
Longyuan Power 0916.HK HK$9.84 Buy HK$10.60 8% 10,177 22.1 15.8 12.2 1.8 1.3 2% 0% 40% 29%
Huaneng Renewables 0958.HK HK$3.69 Hold HK$3.20 -13% 4,020 22.4 16.7 13.1 1.7 1.2 -58% 91% 34% 28%
Datang Renewable 1798.HK HK$1.62 Hold HK$1.70 5% 1,557 25.9 16.2 10.8 1.0 0.9 -91% 383% 60% 50%
Average 23.5 16.2 12.0 1.5 1.1
*Note: China Gas financial year end Mar 31, 13F, 14F and 15F stands for FY14F, FY15F and FY16F Source: Deutsche Bank estimates, company data, Bloomberg Finance LP; price as of 7 Jan 2014
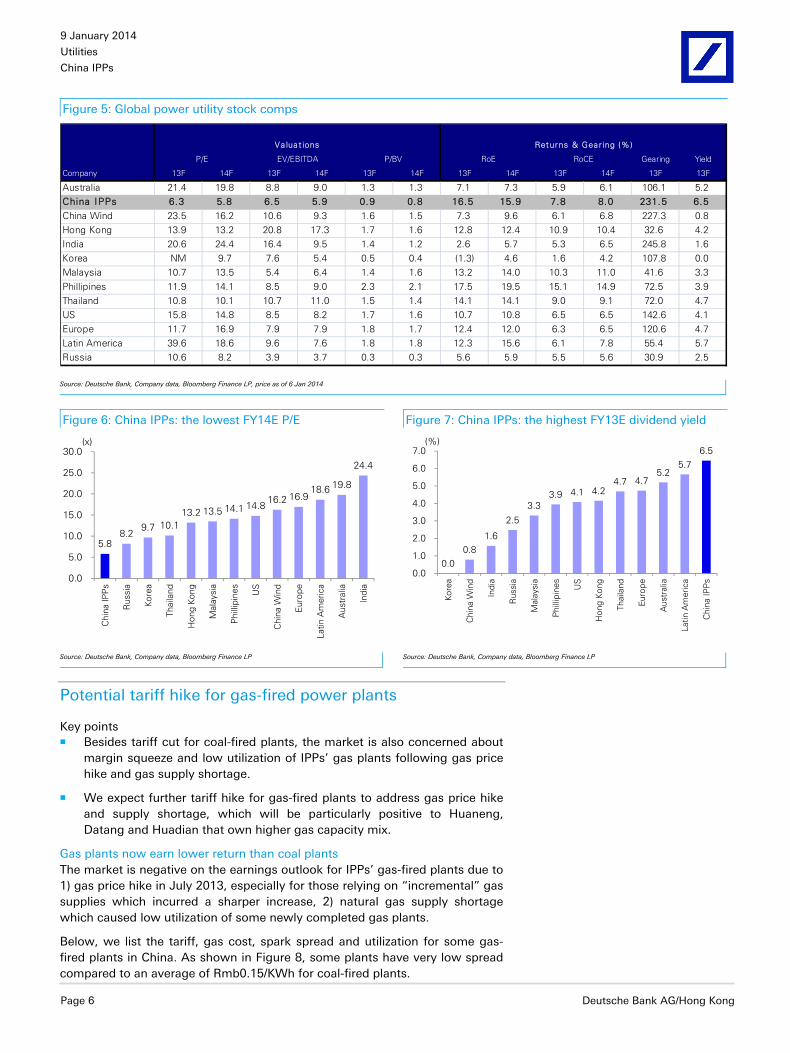
Significantly undervalued relative to global power utility peers As shown in Figure 5, China IPPs are also the lowest valued across global power utility stocks. They are not only cheaper than power utilities in developed market such as the US and Europe, but also cheaper than power utilities in emerging markets such as Russia, Latin America, India, Malaysia and the Philippines.
As shown in Figure 6 and Figure 7, China IPPs have the lowest average FY14E P/E and the highest average FY13E dividend yield, respectively, across global power utility stocks.
9 January 2014
Utilities
China IPPs
Page 6 Deutsche Bank AG/Hong Kong
Figure 5: Global power utility stock comps
Gearing Yield
Company 13F 14F 13F 14F 13F 14F 13F 14F 13F 14F 13F 13F
Australia 21.4 19.8 8.8 9.0 1.3 1.3 7.1 7.3 5.9 6.1 106.1 5.2China IPPs 6.3 5.8 6.5 5.9 0.9 0.8 16.5 15.9 7.8 8.0 231.5 6.5China Wind 23.5 16.2 10.6 9.3 1.6 1.5 7.3 9.6 6.1 6.8 227.3 0.8Hong Kong 13.9 13.2 20.8 17.3 1.7 1.6 12.8 12.4 10.9 10.4 32.6 4.2India 20.6 24.4 16.4 9.5 1.4 1.2 2.6 5.7 5.3 6.5 245.8 1.6Korea NM 9.7 7.6 5.4 0.5 0.4 (1.3) 4.6 1.6 4.2 107.8 0.0Malaysia 10.7 13.5 5.4 6.4 1.4 1.6 13.2 14.0 10.3 11.0 41.6 3.3Phillipines 11.9 14.1 8.5 9.0 2.3 2.1 17.5 19.5 15.1 14.9 72.5 3.9Thailand 10.8 10.1 10.7 11.0 1.5 1.4 14.1 14.1 9.0 9.1 72.0 4.7US 15.8 14.8 8.5 8.2 1.7 1.6 10.7 10.8 6.5 6.5 142.6 4.1Europe 11.7 16.9 7.9 7.9 1.8 1.7 12.4 12.0 6.3 6.5 120.6 4.7Latin America 39.6 18.6 9.6 7.6 1.8 1.8 12.3 15.6 6.1 7.8 55.4 5.7Russia 10.6 8.2 3.9 3.7 0.3 0.3 5.6 5.9 5.5 5.6 30.9 2.5
Va lua t ions Returns & Gea r ing (%)
P/E EV/EBITDA P/BV RoE RoCE
Source: Deutsche Bank, Company data, Bloomberg Finance LP, price as of 6 Jan 2014
Figure 6: China IPPs: the lowest FY14E P/E Figure 7: China IPPs: the highest FY13E dividend yield
5.8 8.2
9.7 10.1 13.2 13.5 14.1 14.8
16.2 16.9 18.6 19.8
24.4
0.0
5.0
10.0
15.0
20.0
25.0
30.0
Chi
na IP
Ps
Rus
sia
Kore
a
Thai
land
Hon
g Ko
ng
Mal
aysi
a
Phi
llipi
nes
US
Chi
na W
ind
Euro
pe
Latin
Am
eric
a
Aus
tral
ia
Indi
a
(x)
0.0 0.8
1.6
2.5
3.3 3.9 4.1 4.2
4.7 4.7 5.2
5.7 6.5
0.0
1.0
2.0
3.0
4.0
5.0
6.0
7.0 Ko
rea
Chi
na W
ind
Indi
a
Rus
sia
Mal
aysi
a
Phi
llipi
nes
US
Hon
g Ko
ng
Thai
land
Euro
pe
Aus
tral
ia
Latin
Am
eric
a
Chi
na IP
Ps
(%)
Source: Deutsche Bank, Company data, Bloomberg Finance LP Source: Deutsche Bank, Company data, Bloomberg Finance LP
Potential tariff hike for gas-fired power plants
Key points Besides tariff cut for coal-fired plants, the market is also concerned about
margin squeeze and low utilization of IPPs’ gas plants following gas price hike and gas supply shortage.
We expect further tariff hike for gas-fired plants to address gas price hike and supply shortage, which will be particularly positive to Huaneng, Datang and Huadian that own higher gas capacity mix.
Gas plants now earn lower return than coal plants The market is negative on the earnings outlook for IPPs’ gas-fired plants due to 1) gas price hike in July 2013, especially for those relying on “incremental” gas supplies which incurred a sharper increase, 2) natural gas supply shortage which caused low utilization of some newly completed gas plants.
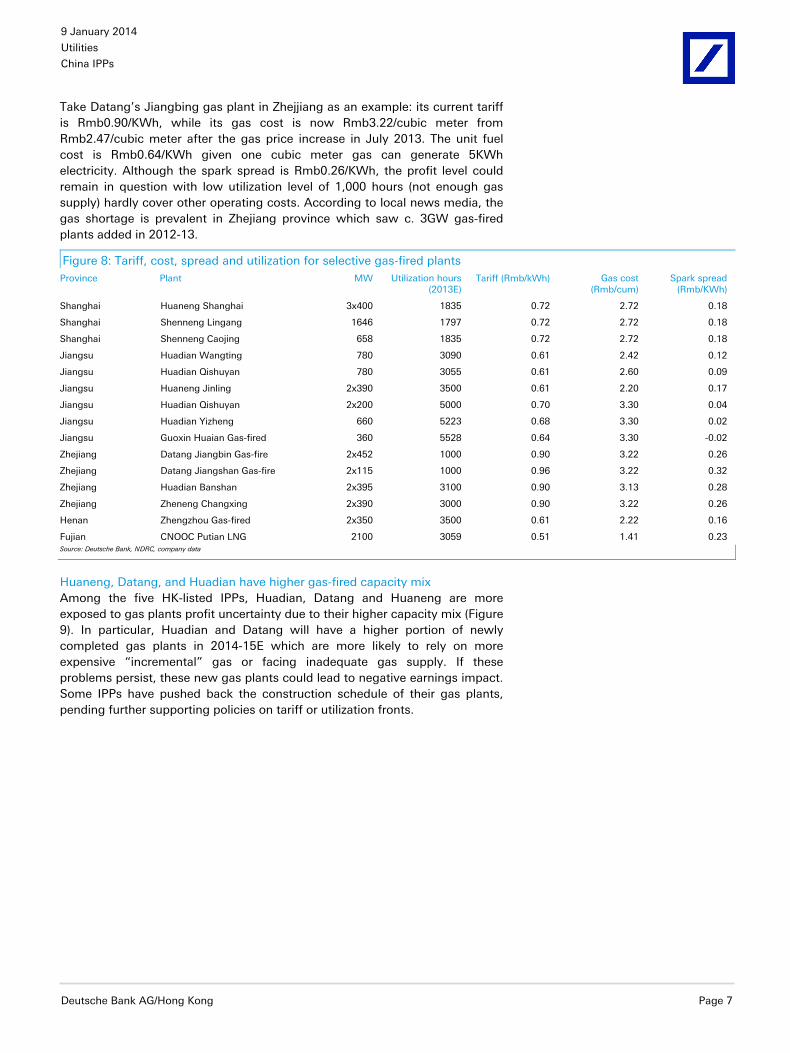
Below, we list the tariff, gas cost, spark spread and utilization for some gas-fired plants in China. As shown in Figure 8, some plants have very low spread compared to an average of Rmb0.15/KWh for coal-fired plants.
9 January 2014
Utilities
China IPPs
Deutsche Bank AG/Hong Kong Page 7
Take Datang’s Jiangbing gas plant in Zhejjiang as an example: its current tariff is Rmb0.90/KWh, while its gas cost is now Rmb3.22/cubic meter from Rmb2.47/cubic meter after the gas price increase in July 2013. The unit fuel cost is Rmb0.64/KWh given one cubic meter gas can generate 5KWh electricity. Although the spark spread is Rmb0.26/KWh, the profit level could remain in question with low utilization level of 1,000 hours (not enough gas supply) hardly cover other operating costs. According to local news media, the gas shortage is prevalent in Zhejiang province which saw c. 3GW gas-fired plants added in 2012-13.
Figure 8: Tariff, cost, spread and utilization for selective gas-fired plants Province Plant MW Utilization hours
(2013E)Tariff (Rmb/kWh) Gas cost
(Rmb/cum) Spark spread
(Rmb/KWh)
Shanghai Huaneng Shanghai 3x400 1835 0.72 2.72 0.18
Shanghai Shenneng Lingang 1646 1797 0.72 2.72 0.18
Shanghai Shenneng Caojing 658 1835 0.72 2.72 0.18
Jiangsu Huadian Wangting 780 3090 0.61 2.42 0.12
Jiangsu Huadian Qishuyan 780 3055 0.61 2.60 0.09
Jiangsu Huaneng Jinling 2x390 3500 0.61 2.20 0.17
Jiangsu Huadian Qishuyan 2x200 5000 0.70 3.30 0.04
Jiangsu Huadian Yizheng 660 5223 0.68 3.30 0.02
Jiangsu Guoxin Huaian Gas-fired 360 5528 0.64 3.30 -0.02
Zhejiang Datang Jiangbin Gas-fire 2x452 1000 0.90 3.22 0.26
Zhejiang Datang Jiangshan Gas-fire 2x115 1000 0.96 3.22 0.32
Zhejiang Huadian Banshan 2x395 3100 0.90 3.13 0.28
Zhejiang Zheneng Changxing 2x390 3000 0.90 3.22 0.26
Henan Zhengzhou Gas-fired 2x350 3500 0.61 2.22 0.16
Fujian CNOOC Putian LNG 2100 3059 0.51 1.41 0.23Source: Deutsche Bank, NDRC, company data
Huaneng, Datang, and Huadian have higher gas-fired capacity mix Among the five HK-listed IPPs, Huadian, Datang and Huaneng are more exposed to gas plants profit uncertainty due to their higher capacity mix (Figure 9). In particular, Huadian and Datang will have a higher portion of newly completed gas plants in 2014-15E which are more likely to rely on more expensive “incremental” gas or facing inadequate gas supply. If these problems persist, these new gas plants could lead to negative earnings impact. Some IPPs have pushed back the construction schedule of their gas plants, pending further supporting policies on tariff or utilization fronts.

9 January 2014
Utilities
China IPPs
Page 8 Deutsche Bank AG/Hong Kong
Figure 9: China IPPs’ gas capacity mix
6%
0% 0%
6%
4%
9%
0% 0%
7%7%
8%
0% 0%
12%
10%
0%
2%
4%
6%
8%
10%
12%
14%
Huaneng CR Power CPI Huadian Datang
2013E 2014E 2015E
Source: Company data, Deutsche Bank estimates
Further tariff hike in consideration According to our channel checks, the government is treating gas plant tariff issue as priority over tariffs for coal-fired plants. Besides calling for more local government subsidy, it is likely to see an on-grid tariff hike for gas-fired plants that will be passed through to end users.
Upside to dividend payout
Key points With better operating cashflow and reduced capex level, some IPPs are
likely to raise dividend payout ratio, such as Huadian and CR Power with payout ratio of 32/33% in 2013.
Moreover, IPPs are on the fast track of de-leveraging which should reduce the market aversion to the sector for fear of high-gearing.
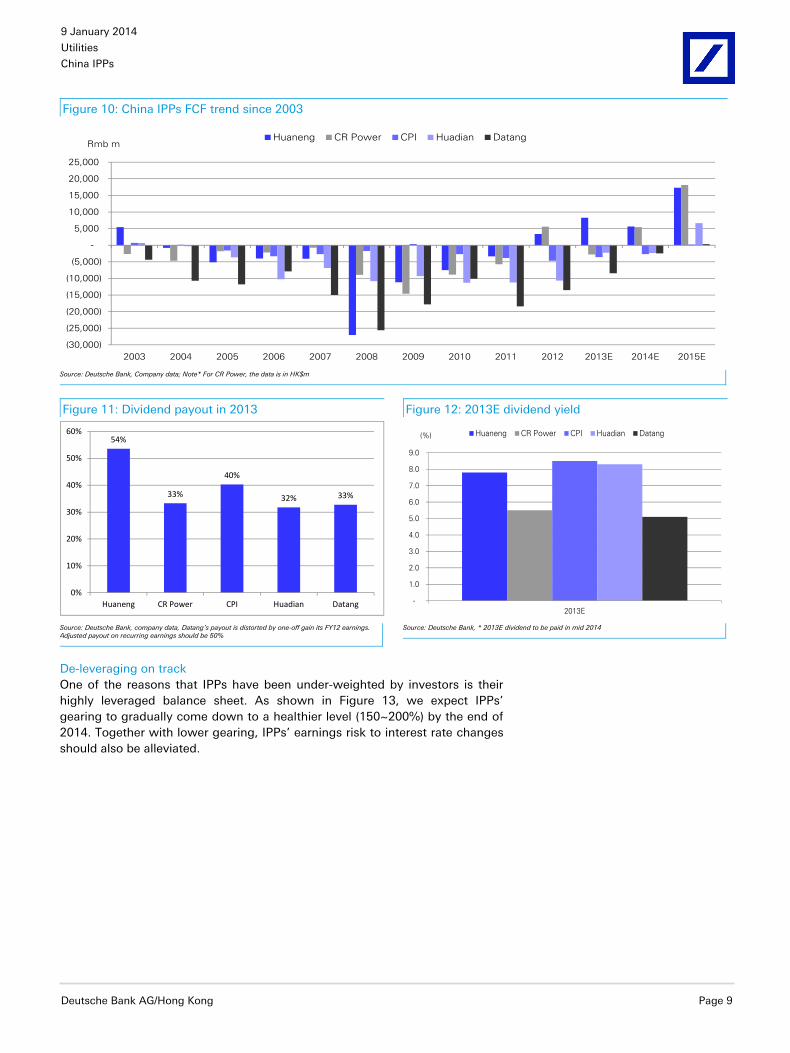
Improving operating and free cashflow Besides visible earnings recovery and stable margin ahead, we also see a return to free cashflow (FCF) as encouraging, especially given that it is the first time since 2003, and a long-desired outcome by investors. As Figure 10 shows, all five HK-listed IPPs experienced negative FCF in 2004-2011. In 2012, Huaneng and CR Power returned to FCF positive. Though Datang/Huadian/CPI are likely still FCF negative in 2014, the amount of negative FCF should be greatly reduced (Figure 10). We expect Huadian to turn FCF positive in 2015.
This, in turn, is likely to lead to higher dividend payout, especially Huadian and CR Power with payout ratio less than 40% in the past. Meanwhile, the ongoing economic reform in China is also calling for higher payout ratio for SOEs. The strong free cashflow and commitment to payout ratios will act as robust support for the forecast dividend payment.
9 January 2014
Utilities
China IPPs
Deutsche Bank AG/Hong Kong Page 9
Figure 10: China IPPs FCF trend since 2003
(30,000)
(25,000)
(20,000)
(15,000)
(10,000)
(5,000)
-
5,000
10,000
15,000
20,000
25,000
2003 2004 2005 2006 2007 2008 2009 2010 2011 2012 2013E 2014E 2015E
Rmb mHuaneng CR Power CPI Huadian Datang
Source: Deutsche Bank, Company data; Note* For CR Power, the data is in HK$m
Figure 11: Dividend payout in 2013 Figure 12: 2013E dividend yield
54%
33%
40%
32% 33%
0%
10%
20%
30%
40%
50%
60%
Huaneng CR Power CPI Huadian Datang
-
1.0
2.0
3.0
4.0
5.0
6.0
7.0
8.0
9.0
2013E
(%) Huaneng CR Power CPI Huadian Datang
Source: Deutsche Bank, company data, Datang’s payout is distorted by one-off gain its FY12 earnings. Adjusted payout on recurring earnings should be 50% Source: Deutsche Bank, * 2013E dividend to be paid in mid 2014
De-leveraging on track One of the reasons that IPPs have been under-weighted by investors is their highly leveraged balance sheet. As shown in Figure 13, we expect IPPs’ gearing to gradually come down to a healthier level (150~200%) by the end of 2014. Together with lower gearing, IPPs’ earnings risk to interest rate changes should also be alleviated.

9 January 2014
Utilities
China IPPs
Page 10 Deutsche Bank AG/Hong Kong
Figure 13: China IPPs net gearing trend since 2003
(50)
-
50
100
150
200
250
300
350
400
450
500
2003 2004 2005 2006 2007 2008 2009 2010 2011 2012 2013E 2014E 2015E
(%) Huaneng CR Power CPI Huadian Datang
Source: Deutsche Bank estimates, Company data
Asset injection is key story for the sector in 2014
Key points China IPPs stand uniquely with significant assets at the parentco level
which are scheduled to be put into listco over the next few years.
There is significant scope of asset injection considering the vast size of parentco. For example, at end-2013, Huaneng Group had 137GW vs. Huaneng Power’s 67GW; Huadian Group had 100GW vs. Huadian Power’s 37GW.
In 2013, asset injection was done on a small scale by CR Power (wind assets) and CPI (thermal asset). We expect more scalable asset injection in 2014, following a substantial profitability improvement in 2013.
Listed IPPs designated as platform for parentcos’ conventional power assets Of the key strategic sectors owned by the government, China IPPs stand out in terms of a potential asset injection to listed vehicles. IPPs, such as Huaneng Power, Datang Power, Huadian Power and China Power International, have said that their parent companies will continue to inject traditional coal-fired and hydro assets into the listcos in the next few years when the profitability of the assets improves and relevant conditions are met. Given the significant capacity retained at the parentco level (Figure 14), there is plenty of room for potential asset injections into the listcos.
Figure 14: Capacity of listcos and parentcos end-2013, GW Huaneng CPI Huadian Datang
Capacity of the group 137 80 100 120
Capacity of core HK listco 67 17 37 40Source: Deutsche Bank, Company data
Asset injection potential not priced in at all We believe the asset injection theme will act as a key driver for the sector in 2014-15, in view of 1) a conducive policy environment for SOE reform for which “whole group listing” is a key element, 2) improving asset quality following a sharp coal price decline in 2012-13, 3) slowing organic capacity growth and lack of margin expansion to drive fast earnings growth in 2014-15 and 4) the sheer size of available assets given the existence of large parentcos.

9 January 2014
Utilities
China IPPs
Deutsche Bank AG/Hong Kong Page 11
We highlight the potential acquisition targets below (Figure 15). Among IPPs, We believe Huaneng, Huadian and CPI offer the greater upside potential on this front.
Figure 15: Potential acquisition targets in 2014 Company Scale of asset injection (Deutsche Bank estimates) Potential targets (Deutsche Bank estimate)
Huaneng 5~10GW Thermal assets in Shandong, Xinjiang, Hainan and hydro assets
CPI 1-3GW Thermal assets in Shanghai, Jiangxi, Guizhou, Liaoning, hydro assets, nuclear assets
Huadian 3-5GW Thermal assets in Jiangsu, Xinjiang and hydro assetsSource: Deutsche Bank estimates, Company data
Case study: CPI’s Wuhu plant injection in 2013 In October 2013, CPI announced the acquisition of Wuhu coal-fired power (2x630MW) in Anhui Province from its parentco for Rmb1.45bn. 85% of the payment is settled through the issue of new shares and the remaining 15% (Rmb217.5m) through cash payment. The acquisition was approved by independent shareholders on 15 November 2013. Following the acquisition, CPI’s attributable capacity increased from 12.9GW to 14.3GW.
The acquisition price looks attractive as it is only 4.5x FY13E P/E based on annualized 1H13 earnings. Though P/B is at 1.9x, 1H13 annualized ROE was 43%. After accounting for a c.9% dilution from the share placement, we estimate 4% FY14 EPS accretion from the asset injection.
CPI’s announcement of the asset injection will be the first of many to come, in our view. It still has several other prospective candidates including Shanghai Power (600021 CH, non-rated), thermal plants in Guizhou, Jiangxi and Liaoning, Yellow River Upstream Hydro and Hongyanhe Nuclear Plant.
9 January 2014
Utilities
China IPPs
Page 12 Deutsche Bank AG/Hong Kong
Coal price and tariff update
Big spike in QHD spot coal price in 4Q13 set to retreat
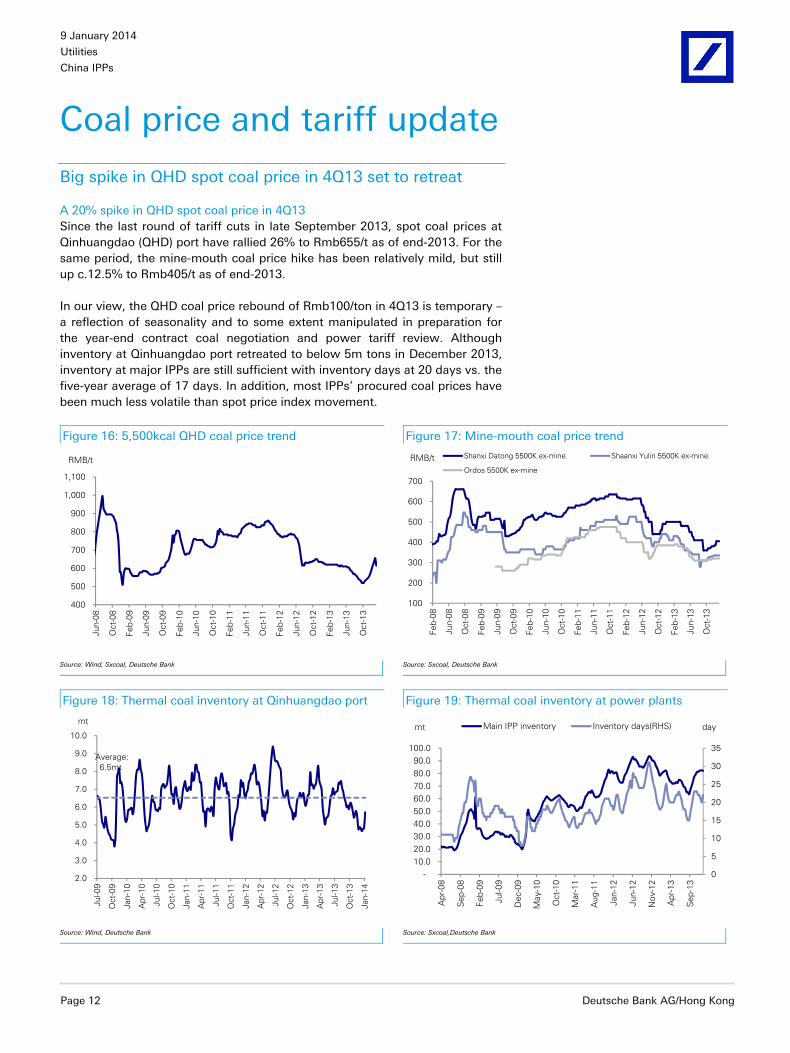
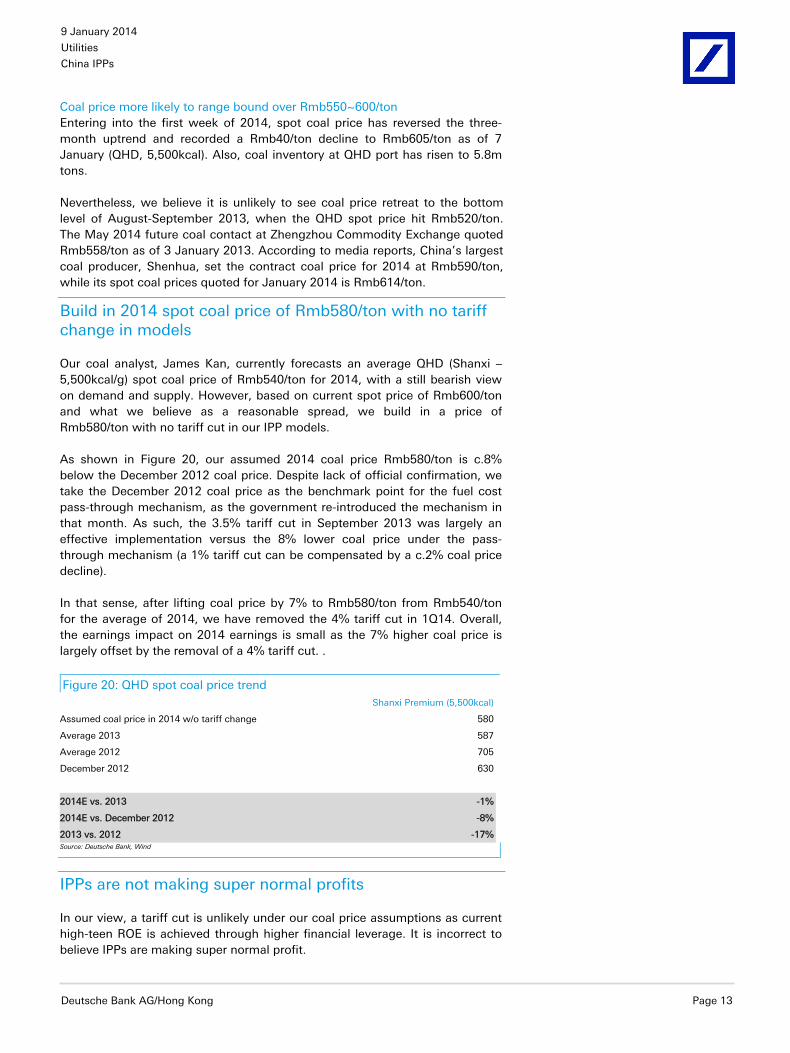
A 20% spike in QHD spot coal price in 4Q13 Since the last round of tariff cuts in late September 2013, spot coal prices at Qinhuangdao (QHD) port have rallied 26% to Rmb655/t as of end-2013. For the same period, the mine-mouth coal price hike has been relatively mild, but still up c.12.5% to Rmb405/t as of end-2013.
In our view, the QHD coal price rebound of Rmb100/ton in 4Q13 is temporary – a reflection of seasonality and to some extent manipulated in preparation for the year-end contract coal negotiation and power tariff review. Although inventory at Qinhuangdao port retreated to below 5m tons in December 2013, inventory at major IPPs are still sufficient with inventory days at 20 days vs. the five-year average of 17 days. In addition, most IPPs’ procured coal prices have been much less volatile than spot price index movement.
Figure 16: 5,500kcal QHD coal price trend Figure 17: Mine-mouth coal price trend
400
500
600
700
800
900
1,000
1,100
Jun-
08
Oct
-08
Feb-
09
Jun-
09
Oct
-09
Feb-
10
Jun-
10
Oct
-10
Feb-
11
Jun-
11
Oct
-11
Feb-
12
Jun-
12
Oct
-12
Feb-
13
Jun-
13
Oct
-13
RMB/t
100
200
300
400
500
600
700
Feb-
08
Jun-
08
Oct
-08
Feb-
09
Jun-
09
Oct
-09
Feb-
10
Jun-
10
Oct
-10
Feb-
11
Jun-
11
Oct
-11
Feb-
12
Jun-
12
Oct
-12
Feb-
13
Jun-
13
Oct
-13
Shanxi Datong 5500K ex-mine Shaanxi Yulin 5500K ex-mine
Ordos 5500K ex-mine
RMB/t
Source: Wind, Sxcoal, Deutsche Bank Source: Sxcoal, Deutsche Bank
Figure 18: Thermal coal inventory at Qinhuangdao port Figure 19: Thermal coal inventory at power plants
Average: 6.5mt
2.0
3.0
4.0
5.0
6.0
7.0
8.0
9.0
10.0
Jul-0
9
Oct
-09
Jan-
10
Apr
-10
Jul-1
0
Oct
-10
Jan-
11
Apr
-11
Jul-1
1
Oct
-11
Jan-
12
Apr
-12
Jul-1
2
Oct
-12
Jan-
13
Apr
-13
Jul-1
3
Oct
-13
Jan-
14
mt
0
5
10
15
20
25
30
35
-10.0 20.0 30.0 40.0 50.0 60.0 70.0 80.0 90.0
100.0
Apr
-08
Sep-
08
Feb-
09
Jul-0
9
Dec
-09
May
-10
Oct
-10
Mar
-11
Aug
-11
Jan-
12
Jun-
12
Nov
-12
Apr
-13
Sep-
13
Main IPP inventory Inventory days(RHS)mt day
Source: Wind, Deutsche Bank Source: Sxcoal,Deutsche Bank
9 January 2014
Utilities
China IPPs
Deutsche Bank AG/Hong Kong Page 13
Coal price more likely to range bound over Rmb550~600/ton Entering into the first week of 2014, spot coal price has reversed the three-month uptrend and recorded a Rmb40/ton decline to Rmb605/ton as of 7 January (QHD, 5,500kcal). Also, coal inventory at QHD port has risen to 5.8m tons.
Nevertheless, we believe it is unlikely to see coal price retreat to the bottom level of August-September 2013, when the QHD spot price hit Rmb520/ton. The May 2014 future coal contact at Zhengzhou Commodity Exchange quoted Rmb558/ton as of 3 January 2013. According to media reports, China’s largest coal producer, Shenhua, set the contract coal price for 2014 at Rmb590/ton, while its spot coal prices quoted for January 2014 is Rmb614/ton.
Build in 2014 spot coal price of Rmb580/ton with no tariff change in models
Our coal analyst, James Kan, currently forecasts an average QHD (Shanxi – 5,500kcal/g) spot coal price of Rmb540/ton for 2014, with a still bearish view on demand and supply. However, based on current spot price of Rmb600/ton and what we believe as a reasonable spread, we build in a price of Rmb580/ton with no tariff cut in our IPP models.
As shown in Figure 20, our assumed 2014 coal price Rmb580/ton is c.8% below the December 2012 coal price. Despite lack of official confirmation, we take the December 2012 coal price as the benchmark point for the fuel cost pass-through mechanism, as the government re-introduced the mechanism in that month. As such, the 3.5% tariff cut in September 2013 was largely an effective implementation versus the 8% lower coal price under the pass-through mechanism (a 1% tariff cut can be compensated by a c.2% coal price decline).
In that sense, after lifting coal price by 7% to Rmb580/ton from Rmb540/ton for the average of 2014, we have removed the 4% tariff cut in 1Q14. Overall, the earnings impact on 2014 earnings is small as the 7% higher coal price is largely offset by the removal of a 4% tariff cut. .
Figure 20: QHD spot coal price trend Shanxi Premium (5,500kcal)
Assumed coal price in 2014 w/o tariff change 580
Average 2013 587
Average 2012 705
December 2012
630
2014E vs. 2013 -1%
2014E vs. December 2012 -8%
2013 vs. 2012 -17%Source: Deutsche Bank, Wind
IPPs are not making super normal profits
In our view, a tariff cut is unlikely under our coal price assumptions as current high-teen ROE is achieved through higher financial leverage. It is incorrect to believe IPPs are making super normal profit.
9 January 2014
Utilities
China IPPs
Page 14 Deutsche Bank AG/Hong Kong
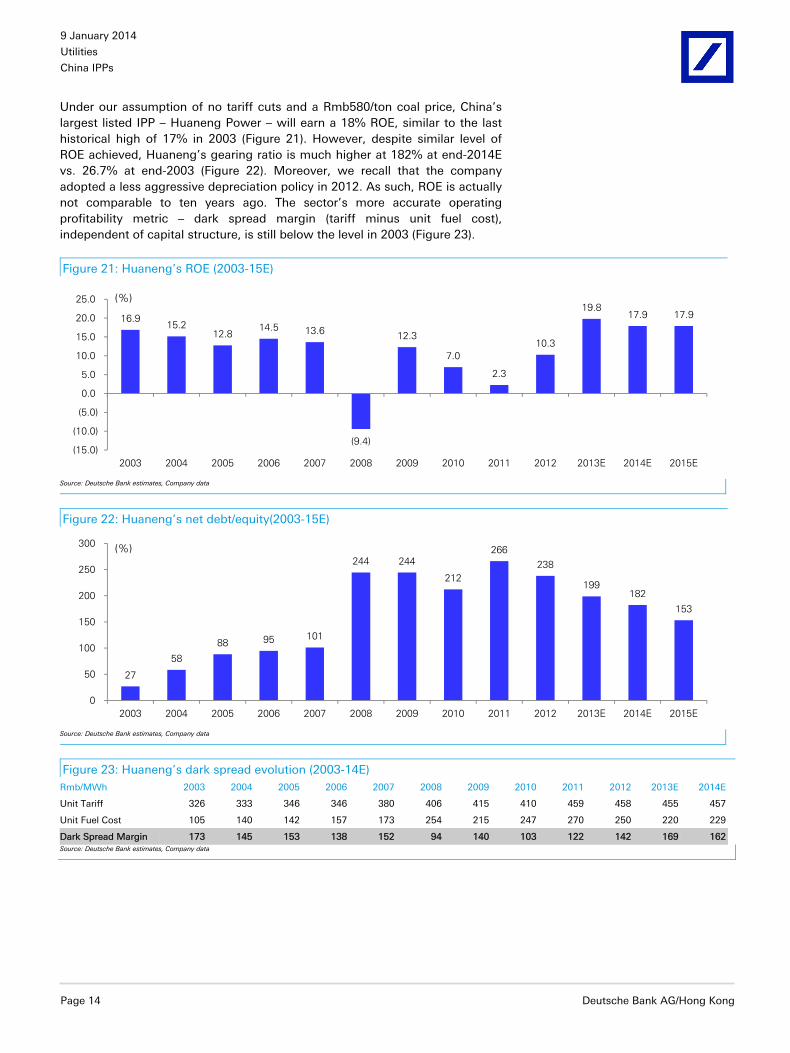
Under our assumption of no tariff cuts and a Rmb580/ton coal price, China’s largest listed IPP – Huaneng Power – will earn a 18% ROE, similar to the last historical high of 17% in 2003 (Figure 21). However, despite similar level of ROE achieved, Huaneng’s gearing ratio is much higher at 182% at end-2014E vs. 26.7% at end-2003 (Figure 22). Moreover, we recall that the company adopted a less aggressive depreciation policy in 2012. As such, ROE is actually not comparable to ten years ago. The sector’s more accurate operating profitability metric – dark spread margin (tariff minus unit fuel cost), independent of capital structure, is still below the level in 2003 (Figure 23).
Figure 21: Huaneng’s ROE (2003-15E)
16.9 15.2
12.8 14.5 13.6
(9.4)
12.3
7.0
2.3
10.3
19.8 17.9 17.9
(15.0)
(10.0)
(5.0)
0.0
5.0
10.0
15.0
20.0
25.0
2003 2004 2005 2006 2007 2008 2009 2010 2011 2012 2013E 2014E 2015E
(%)
Source: Deutsche Bank estimates, Company data
Figure 22: Huaneng’s net debt/equity(2003-15E)
27
58
88 95 101
244 244
212
266 238
199 182
153
0
50
100
150
200
250
300
2003 2004 2005 2006 2007 2008 2009 2010 2011 2012 2013E 2014E 2015E
(%)
Source: Deutsche Bank estimates, Company data
Figure 23: Huaneng’s dark spread evolution (2003-14E) Rmb/MWh 2003 2004 2005 2006 2007 2008 2009 2010 2011 2012 2013E 2014E
Unit Tariff 326 333 346 346 380 406 415 410 459 458 455 457
Unit Fuel Cost 105 140 142 157 173 254 215 247 270 250 220 229
Dark Spread Margin 173 145 153 138 152 94 140 103 122 142 169 162Source: Deutsche Bank estimates, Company data
9 January 2014
Utilities
China IPPs
Deutsche Bank AG/Hong Kong Page 15
Power demand and supply update
Power consumption update
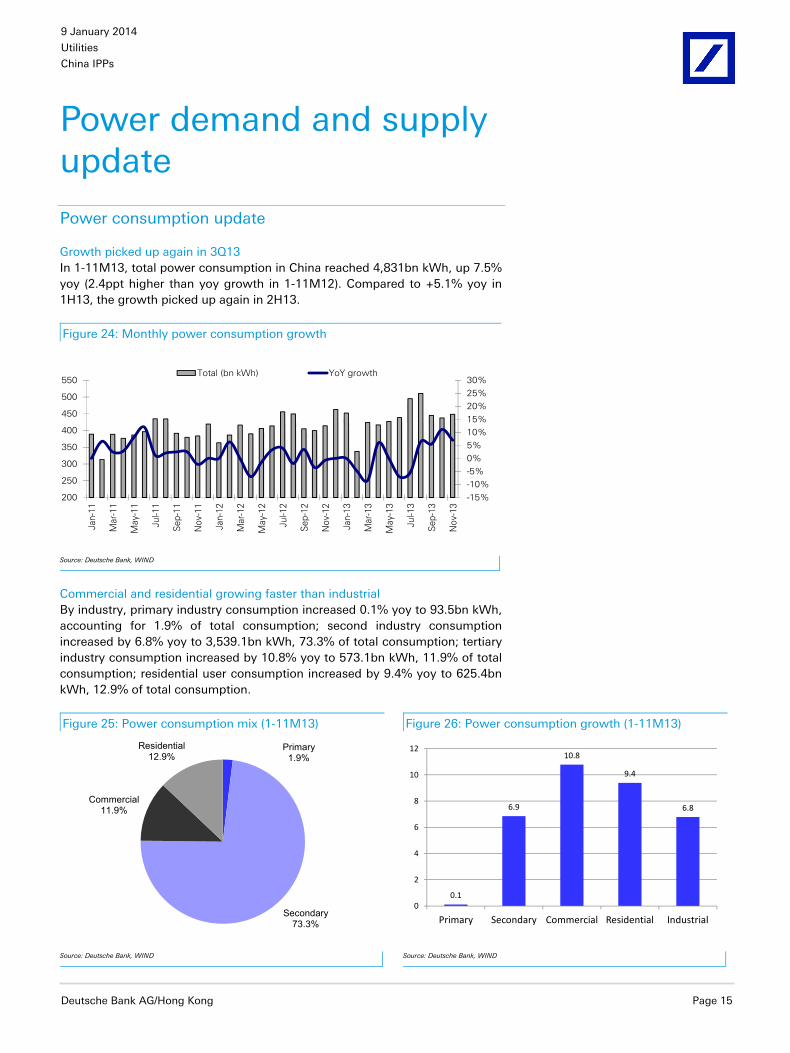
Growth picked up again in 3Q13 In 1-11M13, total power consumption in China reached 4,831bn kWh, up 7.5% yoy (2.4ppt higher than yoy growth in 1-11M12). Compared to +5.1% yoy in 1H13, the growth picked up again in 2H13.
Figure 24: Monthly power consumption growth
-15%-10%-5%0%5%10%15%20%25%30%
200
250
300
350
400
450
500
550
Jan-
11
Mar
-11
May
-11
Jul-1
1
Sep-
11
Nov
-11
Jan-
12
Mar
-12
May
-12
Jul-1
2
Sep-
12
Nov
-12
Jan-
13
Mar
-13
May
-13
Jul-1
3
Sep-
13
Nov
-13
Total (bn kWh) YoY growth
Source: Deutsche Bank, WIND
Commercial and residential growing faster than industrial By industry, primary industry consumption increased 0.1% yoy to 93.5bn kWh, accounting for 1.9% of total consumption; second industry consumption increased by 6.8% yoy to 3,539.1bn kWh, 73.3% of total consumption; tertiary industry consumption increased by 10.8% yoy to 573.1bn kWh, 11.9% of total consumption; residential user consumption increased by 9.4% yoy to 625.4bn kWh, 12.9% of total consumption.
Figure 25: Power consumption mix (1-11M13) Figure 26: Power consumption growth (1-11M13)
Primary1.9%
Secondary73.3%
Commercial11.9%
Residential12.9%
0.1
6.9
10.8
9.4
6.8
0
2
4
6
8
10
12
Primary Secondary Commercial Residential Industrial
Source: Deutsche Bank, WIND Source: Deutsche Bank, WIND
9 January 2014
Utilities
China IPPs
Page 16 Deutsche Bank AG/Hong Kong
Western provinces growing fastest and northeastern provinces slowest By region, in 1-11M13, 13 provinces recorded power consumption growth higher than the national average of 7.5%. Among which, five provinces saw yoy power consumption growth higher than 10%, including Xinjiang (32.4%), Chongqing (12.6%), Qinghai (12.5%), Anhui (12.5%) and Yunnan (10.6%). Provinces with lowest yoy power consumption growth are Heilongjiang (2.2%), Jilin (2.5%) and Shanxi (3.8%).
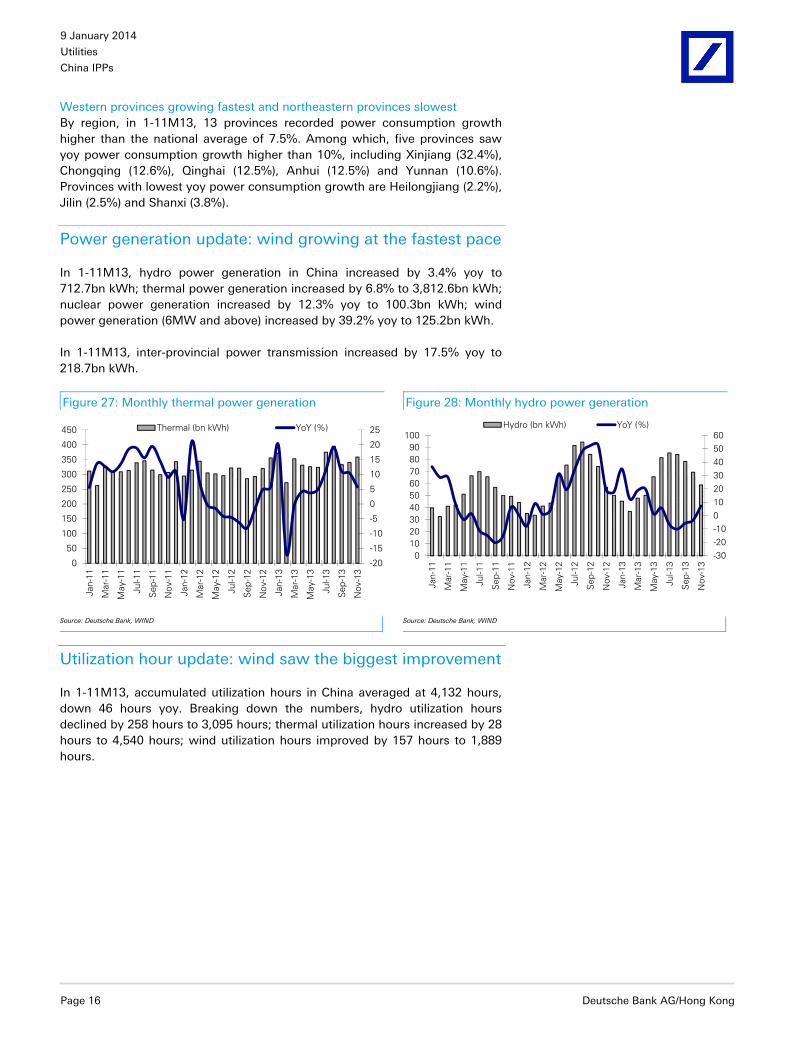
Power generation update: wind growing at the fastest pace
In 1-11M13, hydro power generation in China increased by 3.4% yoy to 712.7bn kWh; thermal power generation increased by 6.8% to 3,812.6bn kWh; nuclear power generation increased by 12.3% yoy to 100.3bn kWh; wind power generation (6MW and above) increased by 39.2% yoy to 125.2bn kWh.
In 1-11M13, inter-provincial power transmission increased by 17.5% yoy to 218.7bn kWh.
Figure 27: Monthly thermal power generation Figure 28: Monthly hydro power generation
-20
-15
-10
-5
0
5
10
15
20
25
0
50
100
150
200
250
300
350
400
450
Jan-
11
Mar
-11
May
-11
Jul-1
1
Sep-
11
Nov
-11
Jan-
12
Mar
-12
May
-12
Jul-1
2
Sep-
12
Nov
-12
Jan-
13
Mar
-13
May
-13
Jul-1
3
Sep-
13
Nov
-13
Thermal (bn kWh) YoY (%)
-30-20-100102030405060
0102030405060708090
100Ja
n-11
Mar
-11
May
-11
Jul-1
1
Sep
-11
Nov
-11
Jan-
12
Mar
-12
May
-12
Jul-1
2
Sep
-12
Nov
-12
Jan-
13
Mar
-13
May
-13
Jul-1
3
Sep
-13
Nov
-13
Hydro (bn kWh) YoY (%)
Source: Deutsche Bank, WIND Source: Deutsche Bank, WIND
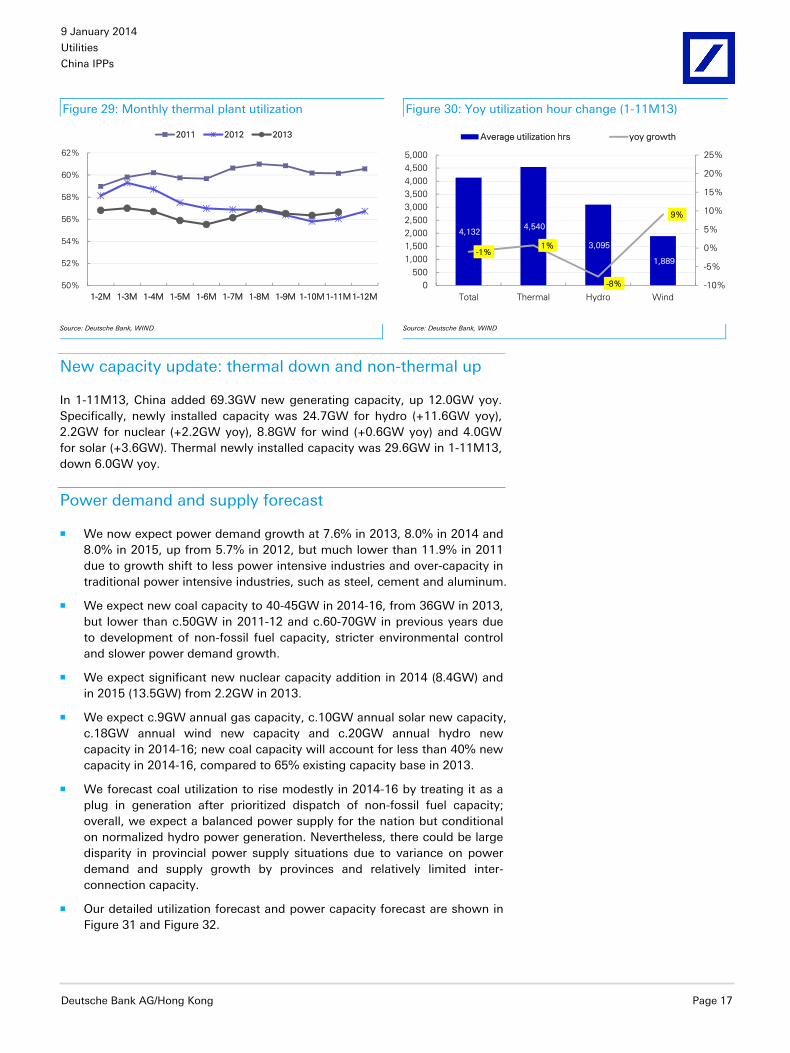
Utilization hour update: wind saw the biggest improvement
In 1-11M13, accumulated utilization hours in China averaged at 4,132 hours, down 46 hours yoy. Breaking down the numbers, hydro utilization hours declined by 258 hours to 3,095 hours; thermal utilization hours increased by 28 hours to 4,540 hours; wind utilization hours improved by 157 hours to 1,889 hours.
9 January 2014
Utilities
China IPPs
Deutsche Bank AG/Hong Kong Page 17
Figure 29: Monthly thermal plant utilization Figure 30: Yoy utilization hour change (1-11M13)
50%
52%
54%
56%
58%
60%
62%
1-2M 1-3M 1-4M 1-5M 1-6M 1-7M 1-8M 1-9M 1-10M 1-11M 1-12M
2011 2012 2013
4,132 4,540
3,095
1,889 -1%
1%
-8%
9%
-10%
-5%
0%
5%
10%
15%
20%
25%
0500
1,0001,5002,0002,5003,0003,5004,0004,5005,000
Total Thermal Hydro Wind
Average utilization hrs yoy growth
Source: Deutsche Bank, WIND Source: Deutsche Bank, WIND
New capacity update: thermal down and non-thermal up
In 1-11M13, China added 69.3GW new generating capacity, up 12.0GW yoy. Specifically, newly installed capacity was 24.7GW for hydro (+11.6GW yoy), 2.2GW for nuclear (+2.2GW yoy), 8.8GW for wind (+0.6GW yoy) and 4.0GW for solar (+3.6GW). Thermal newly installed capacity was 29.6GW in 1-11M13, down 6.0GW yoy.
Power demand and supply forecast
We now expect power demand growth at 7.6% in 2013, 8.0% in 2014 and 8.0% in 2015, up from 5.7% in 2012, but much lower than 11.9% in 2011 due to growth shift to less power intensive industries and over-capacity in traditional power intensive industries, such as steel, cement and aluminum.
We expect new coal capacity to 40-45GW in 2014-16, from 36GW in 2013, but lower than c.50GW in 2011-12 and c.60-70GW in previous years due to development of non-fossil fuel capacity, stricter environmental control and slower power demand growth.
We expect significant new nuclear capacity addition in 2014 (8.4GW) and in 2015 (13.5GW) from 2.2GW in 2013.
We expect c.9GW annual gas capacity, c.10GW annual solar new capacity, c.18GW annual wind new capacity and c.20GW annual hydro new capacity in 2014-16; new coal capacity will account for less than 40% new capacity in 2014-16, compared to 65% existing capacity base in 2013.
We forecast coal utilization to rise modestly in 2014-16 by treating it as a plug in generation after prioritized dispatch of non-fossil fuel capacity; overall, we expect a balanced power supply for the nation but conditional on normalized hydro power generation. Nevertheless, there could be large disparity in provincial power supply situations due to variance on power demand and supply growth by provinces and relatively limited inter-connection capacity.
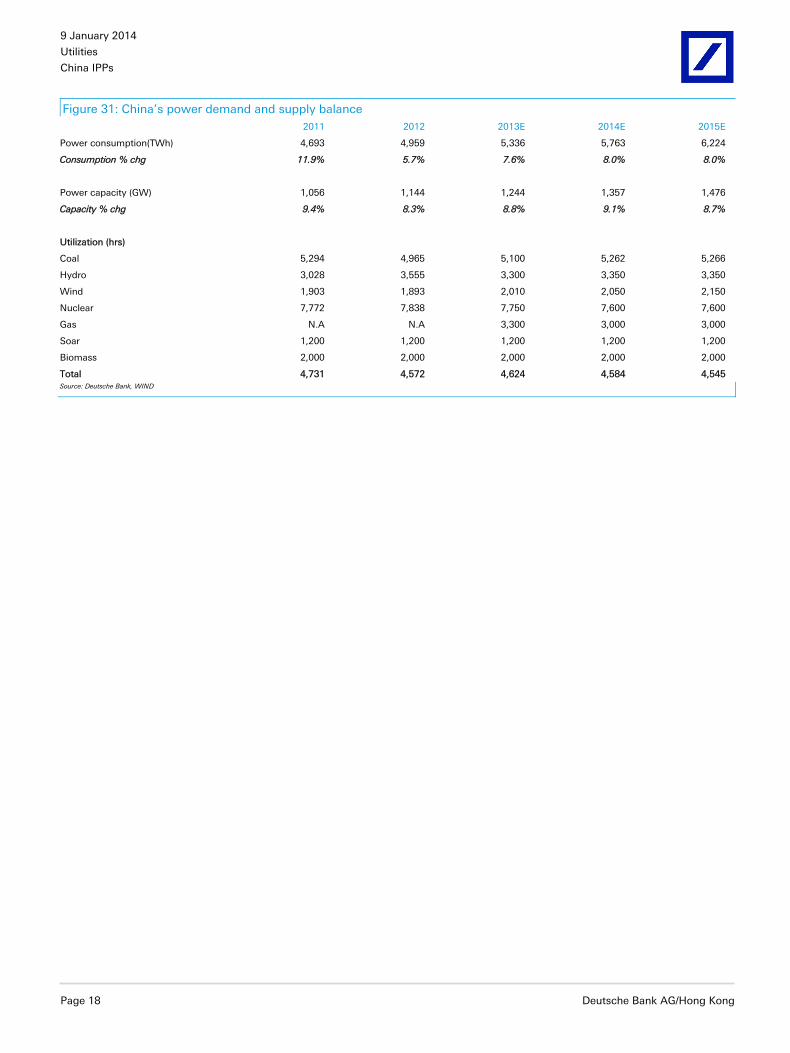
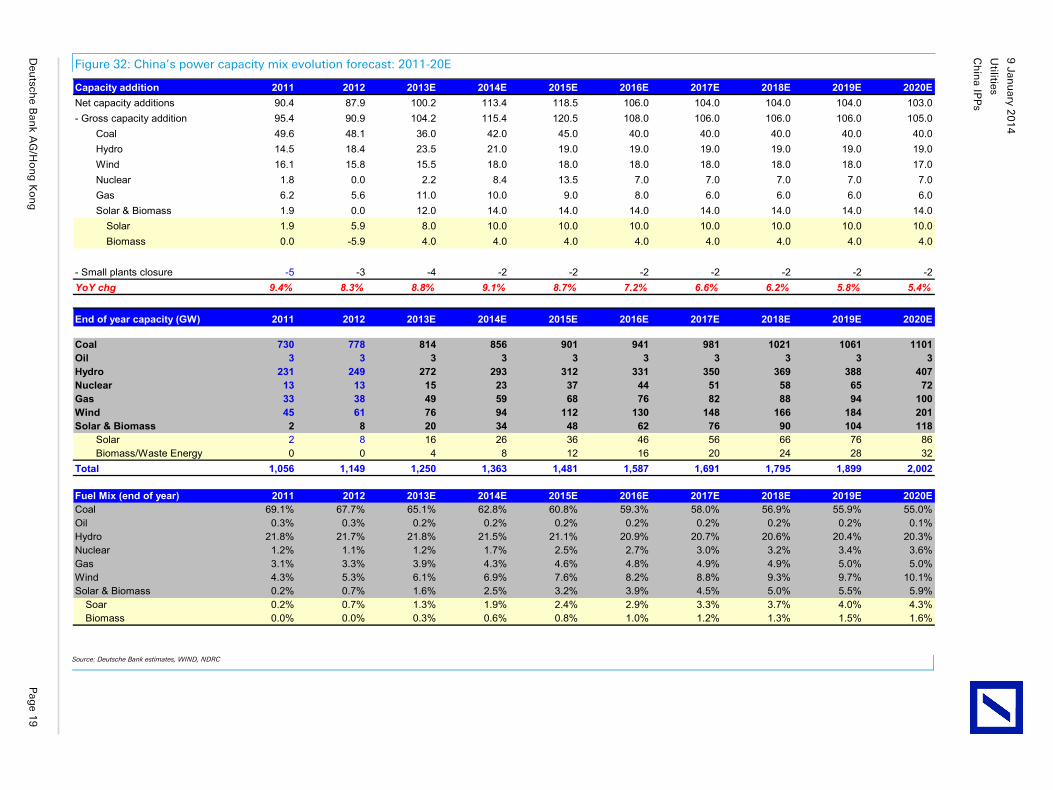
Our detailed utilization forecast and power capacity forecast are shown in Figure 31 and Figure 32.
9 January 2014
Utilities
China IPPs
Page 18 Deutsche Bank AG/Hong Kong
Figure 31: China’s power demand and supply balance 2011 2012 2013E 2014E 2015E
Power consumption(TWh) 4,693 4,959 5,336 5,763 6,224
Consumption % chg 11.9% 5.7% 7.6% 8.0% 8.0%
Power capacity (GW) 1,056 1,144 1,244 1,357 1,476
Capacity % chg 9.4% 8.3% 8.8% 9.1% 8.7%
Utilization (hrs)
Coal 5,294 4,965 5,100 5,262 5,266
Hydro 3,028 3,555 3,300 3,350 3,350
Wind 1,903 1,893 2,010 2,050 2,150
Nuclear 7,772 7,838 7,750 7,600 7,600
Gas N.A N.A 3,300 3,000 3,000
Soar 1,200 1,200 1,200 1,200 1,200
Biomass 2,000 2,000 2,000 2,000 2,000
Total 4,731 4,572 4,624 4,584 4,545Source: Deutsche Bank, WIND
Ch
ina IP
Ps
Utilities
9 Jan
uary 2
014
Deu
tsche B
ank A
G/H
on
g K
on
g
Pag
e 19
Figure 32: China’s power capacity mix evolution forecast: 2011-20E
Capacity addition 2011 2012 2013E 2014E 2015E 2016E 2017E 2018E 2019E 2020ENet capacity additions 90.4 87.9 100.2 113.4 118.5 106.0 104.0 104.0 104.0 103.0- Gross capacity addition 95.4 90.9 104.2 115.4 120.5 108.0 106.0 106.0 106.0 105.0
Coal 49.6 48.1 36.0 42.0 45.0 40.0 40.0 40.0 40.0 40.0Hydro 14.5 18.4 23.5 21.0 19.0 19.0 19.0 19.0 19.0 19.0Wind 16.1 15.8 15.5 18.0 18.0 18.0 18.0 18.0 18.0 17.0Nuclear 1.8 0.0 2.2 8.4 13.5 7.0 7.0 7.0 7.0 7.0Gas 6.2 5.6 11.0 10.0 9.0 8.0 6.0 6.0 6.0 6.0Solar & Biomass 1.9 0.0 12.0 14.0 14.0 14.0 14.0 14.0 14.0 14.0
Solar 1.9 5.9 8.0 10.0 10.0 10.0 10.0 10.0 10.0 10.0Biomass 0.0 -5.9 4.0 4.0 4.0 4.0 4.0 4.0 4.0 4.0
- Small plants closure -5 -3 -4 -2 -2 -2 -2 -2 -2 -2YoY chg 9.4% 8.3% 8.8% 9.1% 8.7% 7.2% 6.6% 6.2% 5.8% 5.4%
End of year capacity (GW) 2011 2012 2013E 2014E 2015E 2016E 2017E 2018E 2019E 2020E
Coal 730 778 814 856 901 941 981 1021 1061 1101Oil 3 3 3 3 3 3 3 3 3 3Hydro 231 249 272 293 312 331 350 369 388 407Nuclear 13 13 15 23 37 44 51 58 65 72Gas 33 38 49 59 68 76 82 88 94 100Wind 45 61 76 94 112 130 148 166 184 201Solar & Biomass 2 8 20 34 48 62 76 90 104 118
Solar 2 8 16 26 36 46 56 66 76 86Biomass/Waste Energy 0 0 4 8 12 16 20 24 28 32
Total 1,056 1,149 1,250 1,363 1,481 1,587 1,691 1,795 1,899 2,002
Fuel Mix (end of year) 2011 2012 2013E 2014E 2015E 2016E 2017E 2018E 2019E 2020ECoal 69.1% 67.7% 65.1% 62.8% 60.8% 59.3% 58.0% 56.9% 55.9% 55.0%Oil 0.3% 0.3% 0.2% 0.2% 0.2% 0.2% 0.2% 0.2% 0.2% 0.1%Hydro 21.8% 21.7% 21.8% 21.5% 21.1% 20.9% 20.7% 20.6% 20.4% 20.3%Nuclear 1.2% 1.1% 1.2% 1.7% 2.5% 2.7% 3.0% 3.2% 3.4% 3.6%Gas 3.1% 3.3% 3.9% 4.3% 4.6% 4.8% 4.9% 4.9% 5.0% 5.0%Wind 4.3% 5.3% 6.1% 6.9% 7.6% 8.2% 8.8% 9.3% 9.7% 10.1%Solar & Biomass 0.2% 0.7% 1.6% 2.5% 3.2% 3.9% 4.5% 5.0% 5.5% 5.9%
Soar 0.2% 0.7% 1.3% 1.9% 2.4% 2.9% 3.3% 3.7% 4.0% 4.3%Biomass 0.0% 0.0% 0.3% 0.6% 0.8% 1.0% 1.2% 1.3% 1.5% 1.6%
Source: Deutsche Bank estimates, WIND, NDRC
9 January 2014
Utilities
China IPPs
Page 20 Deutsche Bank AG/Hong Kong
Forecast changes, comps and earnings sensitivity
Key changes across the sector
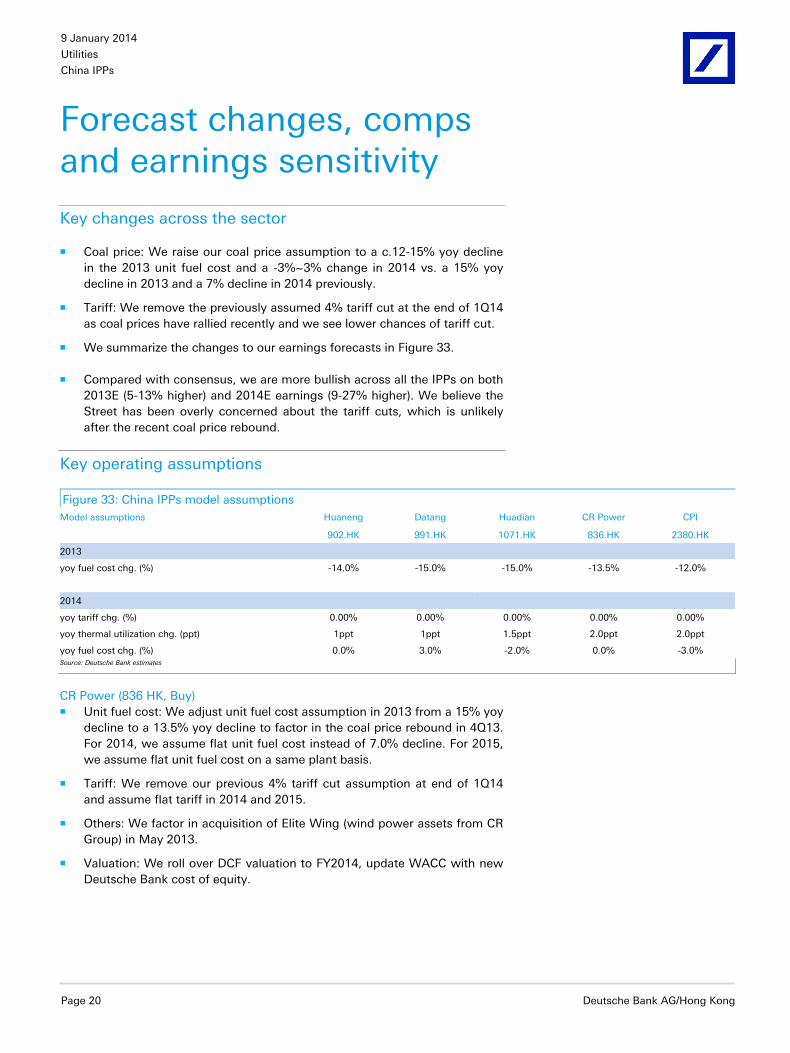
Coal price: We raise our coal price assumption to a c.12-15% yoy decline in the 2013 unit fuel cost and a -3%~3% change in 2014 vs. a 15% yoy decline in 2013 and a 7% decline in 2014 previously.
Tariff: We remove the previously assumed 4% tariff cut at the end of 1Q14 as coal prices have rallied recently and we see lower chances of tariff cut.
We summarize the changes to our earnings forecasts in Figure 33.
Compared with consensus, we are more bullish across all the IPPs on both 2013E (5-13% higher) and 2014E earnings (9-27% higher). We believe the Street has been overly concerned about the tariff cuts, which is unlikely after the recent coal price rebound.
Key operating assumptions
Figure 33: China IPPs model assumptions Model assumptions Huaneng Datang Huadian CR Power CPI
902.HK 991.HK 1071.HK 836.HK 2380.HK
2013
yoy fuel cost chg. (%) -14.0% -15.0% -15.0% -13.5% -12.0%
2014
yoy tariff chg. (%) 0.00% 0.00% 0.00% 0.00% 0.00%
yoy thermal utilization chg. (ppt) 1ppt 1ppt 1.5ppt 2.0ppt 2.0ppt
yoy fuel cost chg. (%) 0.0% 3.0% -2.0% 0.0% -3.0% Source: Deutsche Bank estimates
CR Power (836 HK, Buy) Unit fuel cost: We adjust unit fuel cost assumption in 2013 from a 15% yoy
decline to a 13.5% yoy decline to factor in the coal price rebound in 4Q13. For 2014, we assume flat unit fuel cost instead of 7.0% decline. For 2015, we assume flat unit fuel cost on a same plant basis.
Tariff: We remove our previous 4% tariff cut assumption at end of 1Q14 and assume flat tariff in 2014 and 2015.
Others: We factor in acquisition of Elite Wing (wind power assets from CR Group) in May 2013.
Valuation: We roll over DCF valuation to FY2014, update WACC with new Deutsche Bank cost of equity.
9 January 2014
Utilities
China IPPs
Deutsche Bank AG/Hong Kong Page 21
Huaneng Power (902 HK, Buy) Unit fuel cost: We adjust unit fuel cost assumption in 2013 from a 15% yoy
decline to a 14% yoy decline to factor in coal price rebound in 4Q13. For 2014, we assume flat unit fuel cost instead of a 7.0% decline. For 2015, we assume flat unit fuel cost on a same plant basis.
Tariff: We remove our previous 4% tariff cut assumption at end of 1Q14 and assume flat tariff in 2014 and 2015.
Utilization: We assume 1.5ppt decrease in thermal utilization rate in 2013 (from 2ppt decrease) to factor in the power demand pick up in 2H13; for 2014, assume 1ppt increase in utilization (from 2ppt).
We factor in goodwill impairment of Rmb900m in 2013 and Rmb400m in 2014 to reflect Rmb580m impairment in 3Q13 and likely further impairment from Tuas Power in 4Q13 and 2014.
Valuation: We roll over DCF valuation to FY2014, update WACC with new Deutsche Bank cost of equity.
Datang Power (991 HK, Buy) Unit fuel cost: We adjust unit fuel cost assumption in 2014 from a 7% yoy
decline to a 3% increase; for 2015, we assume flat unit fuel cost on same plant basis.
Tariff: We remove our previous 4% tariff cut assumption at end of 1Q14 and assume flat tariff in 2014 and 2015.
Utilization: We assume 3.5ppt decrease in thermal utilization rate in 2013 (from 2.0ppt decrease) to reconcile with its 1-9M13 results; for 2014, we assume 1ppt increase in utilization (from 3ppt).
Others: Factor in the impairment loss of Gaojing; factor in start-up of Keqi coal-to-gas from 2014 with newly set price of Rmb2.75/cum; fine-tune assumptions on other non-thermal power projects including Duolun coal chemistry, Fuxin coal-to-gas and Ningde nuclear.
Valuation: Roll over DCF valuation to FY2014, update WACC with new Deutsche Bank cost of equity.
Huadian Power (1071 HK, Buy) Unit fuel cost: We adjust unit fuel cost assumption in 2014 to 2% yoy
decline from 7.0% yoy decline; for 2015, we assume flat unit fuel cost on a same plant basis.
Tariff: We remove our previous 4% tariff cut assumption at the end of 1Q14 and assume flat tariff in 2014 and 2015.
Utilization: We assume 1.5ppt decrease in thermal utilization rate in 2013 (from 3ppt decrease) to reconcile with 1-9M13 output; for 2014, assume 1.5ppt increase in utilization (from 2ppt).
Others: We factor in newly approved power plants.
Valuation: We roll over DCF valuation to FY2014, update WACC with new Deutsche Bank cost of equity.
9 January 2014
Utilities
China IPPs
Page 22 Deutsche Bank AG/Hong Kong
China Power Int’l (2380 HK, Buy) Unit fuel cost: We adjust unit fuel cost assumption in 2013 to a 12% yoy
decline from a 15% yoy decline, in line with management guidance; for 2014, we assume a 3% yoy decrease in unit fuel cost instead of a 7% yoy decrease; for 2015, we assume flat unit fuel cost on a same plant basis.
Tariff: We remove our previous 4% tariff cut assumption at the end of 1Q14 and assume flat tariff in 2014 and 2015.
Utilization: We assume a 2ppt decrease in thermal utilization rate in 2013 (from 1.5ppt decrease) and assume a 2.5ppt decrease in hydro utilization rate from flat to factor in the hydro output incline in 2H13; for 2014, assume a 2ppt increase in thermal utilization (from 2.5ppt).
Others: We factor in Wuhu asset injection and corresponding share issuance; factor in Rmb771m pre-tax disposal gain in 2013 relating to Hemifeng pump hydro plant.
Valuation: We roll over DCF valuation to FY2014, update WACC with new Deutsche Bank cost of equity.
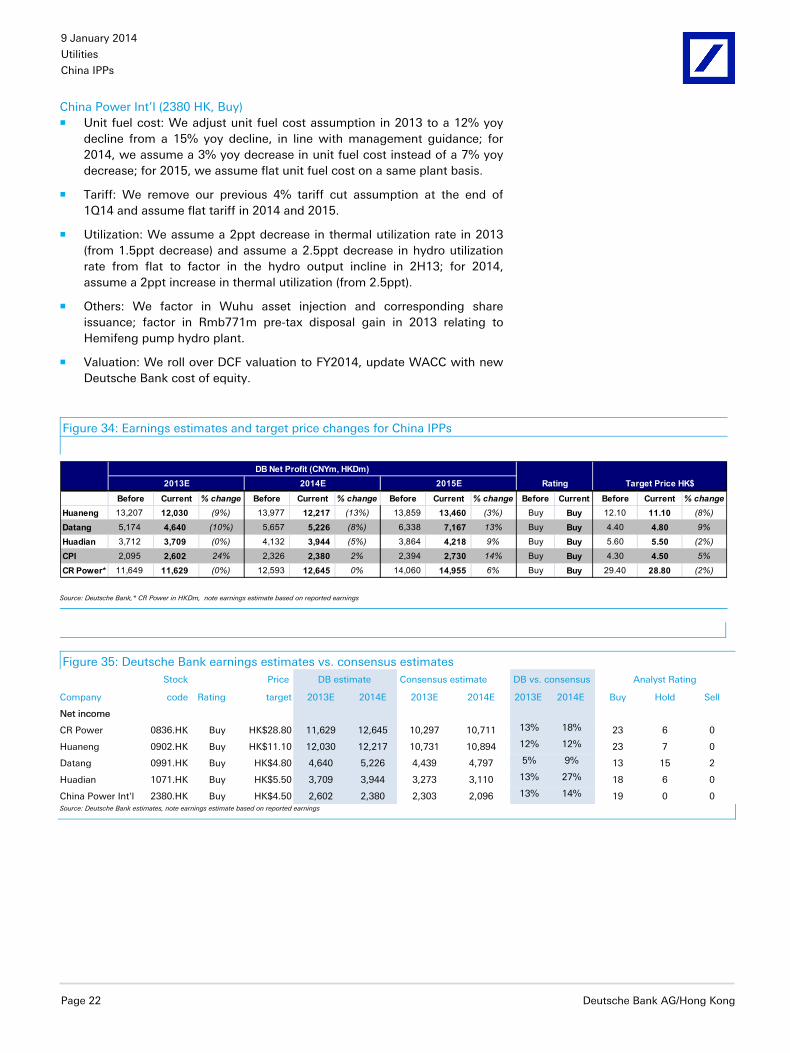
Figure 34: Earnings estimates and target price changes for China IPPs
Rating Target Price HK$
Before Current % change Before Current % change Before Current % change Before Current Before Current % changeHuaneng 13,207 12,030 (9%) 13,977 12,217 (13%) 13,859 13,460 (3%) Buy Buy 12.10 11.10 (8%)
Datang 5,174 4,640 (10%) 5,657 5,226 (8%) 6,338 7,167 13% Buy Buy 4.40 4.80 9%
Huadian 3,712 3,709 (0%) 4,132 3,944 (5%) 3,864 4,218 9% Buy Buy 5.60 5.50 (2%)
CPI 2,095 2,602 24% 2,326 2,380 2% 2,394 2,730 14% Buy Buy 4.30 4.50 5%
CR Power* 11,649 11,629 (0%) 12,593 12,645 0% 14,060 14,955 6% Buy Buy 29.40 28.80 (2%)
2013E 2014E 2015EDB Net Profit (CNYm, HKDm)
Source: Deutsche Bank,* CR Power in HKDm, note earnings estimate based on reported earnings
Figure 35: Deutsche Bank earnings estimates vs. consensus estimates Stock Price DB estimate Consensus estimate DB vs. consensus Analyst Rating
Company code Rating target 2013E 2014E 2013E 2014E 2013E 2014E Buy Hold Sell
Net income
CR Power 0836.HK Buy HK$28.80 11,629 12,645 10,297 10,711 13% 18% 23 6 0
Huaneng 0902.HK Buy HK$11.10 12,030 12,217 10,731 10,894 12% 12% 23 7 0
Datang 0991.HK Buy HK$4.80 4,640 5,226 4,439 4,797 5% 9% 13 15 2
Huadian 1071.HK Buy HK$5.50 3,709 3,944 3,273 3,110 13% 27% 18 6 0
China Power Int'l 2380.HK Buy HK$4.50 2,602 2,380 2,303 2,096 13% 14% 19 0 0 Source: Deutsche Bank estimates, note earnings estimate based on reported earnings
9 January 2014
Utilities
China IPPs
Deutsche Bank AG/Hong Kong Page 23
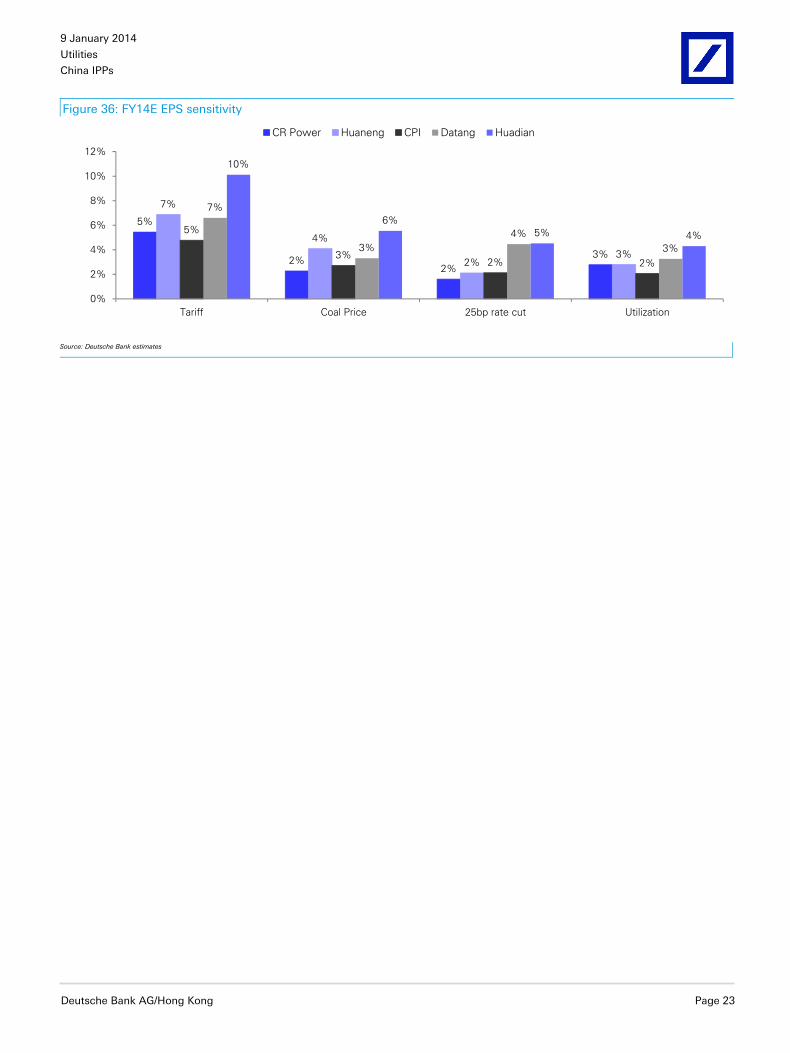
Figure 36: FY14E EPS sensitivity
5%
2%2%
3%
7%
4%
2%3%
5%
3%2% 2%
7%
3%4%
3%
10%
6%5% 4%
0%
2%
4%
6%
8%
10%
12%
Tariff Coal Price 25bp rate cut Utilization
CR Power Huaneng CPI Datang Huadian
Source: Deutsche Bank estimates
9 January 2014
Utilities
China IPPs
Page 24 Deutsche Bank AG/Hong Kong
Stock views: investment outlook, valuation methodology, risks
CR Power (Buy, target price HK$28.8)
We have a Buy rating on CR Power on several grounds:
We like the company for its stronger power volume growth in 2014-15 thanks to higher capacity growth. On our forecast, CR Power will record a 14% and 17% power output growth in 2014 and 2015 respectively, compared to 8% power consumption growth expected for China. In addition, we see scope of higher dividend payout from 33% in 2013 with a strong balance sheet and improving free cashflow. Although the ongoing lawsuit from small minority shareholders could be an overhang, the risk is fully aware by the market and we expect potential impact on the company to be limited. The stock valuation looks very attractive after a share price correction since May 2013. The tariff cut is less likely after recent coal price rally. The fuel tariff pass-through mechanism, although not perfect in implementation, is in place in principle. While the market demands a more transparent and credible fuel-tariff pass-through mechanism, current valuation has overly discounted such imperfection.
Valuation Our target price is based on a DCF analysis of operating cashflow through 2020E, assuming WACC of 9.2% (risk-free rate of 4.3%, market premium of 5.6%, after-tax cost of debt of 4.9% and beta of 1.45). We estimate that, on a full-year basis, a 1% higher-than-expected tariff cut would affect FY14E earnings by 5.4%, and a 1% lower-than-expected coal price decline would affect FY14E earnings by 2.3%.
Risk Key downside risks are adverse coal price change without a corresponding tariff adjustment, lack of clarity on tariff review polity, a lower-than-expected plant utilization rate, corporate governance risk associated with ongoing lawsuit by minority shareholders, and interest rate hike.

9 January 2014
Utilities
China IPPs
Deutsche Bank AG/Hong Kong Page 25
Figure 37: CR Power – 1-year forward P/B Figure 38: CR Power – ROE trend
0.8
1.8
2.8
3.8
4.8
5.8
Jan-
06
Jun-
06
Nov
-06
Apr
-07
Sep-
07
Feb-
08
Jul-0
8
Dec
-08
May
-09
Oct
-09
Mar
-10
Aug
-10
Jan-
11
Jun-
11
Nov
-11
Apr
-12
Sep-
12
Feb-
13
Jul-1
3
Dec
-13
F-P/B Avg P/B -1 Std Dev +1 Std Dev
0.0
5.0
10.0
15.0
20.0
25.0
30.0
2003
2004
2005
2006
2007
2008
2009
2010
2011
2012
2013
E
2014
E
2015
E
(%)
Source: Datastream, Deutsche Bank estimates Source: Company data, Deutsche Bank estimates
Huaneng Power (Buy, target price HK$11.1)
We have a Buy rating on Huaneng Power on several grounds:
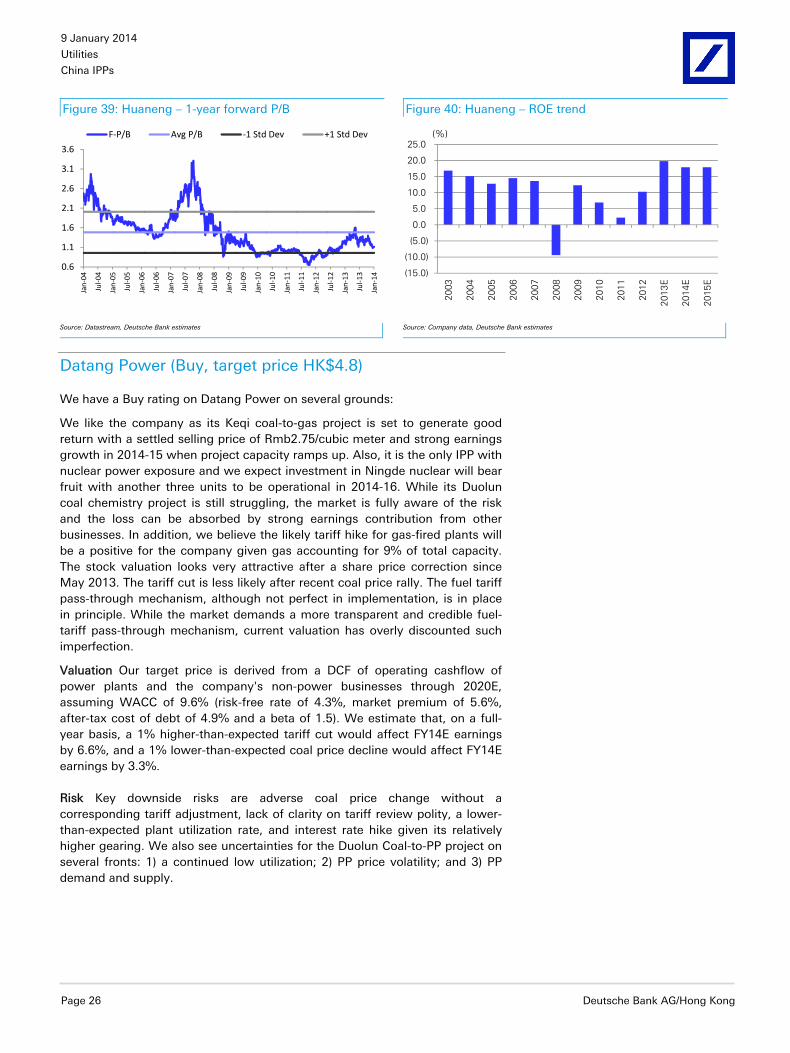
We like the company for its stronger asset injection potential given its parentco capacity size of 137GW, relative to 67GW of Huaneng Power. There is a high chance of thermal, hydro and nuclear (under construction) assets to be injected in 2014, which will drive further earnings growth on top of projected 12% organic output growth in 2014. Meanwhile, we believe the likely tariff hike for gas-fired plants will be a positive for the company given gas accounting for 9% total capacity. It also has a committed dividend payout of 50%. The stock valuation looks very attractive after a share price correction since May 2013. The tariff cut is less likely after recent coal price rally. The fuel tariff pass-through mechanism, although not perfect in implementation, is in place in principle. While the market demands a more transparent and credible fuel-tariff pass-through mechanism, current valuation has overly discounted such imperfection.
Valuation Our target price is based on a DCF of operating cashflow through 2020E, beyond which we assume zero terminal growth. We assume WACC of 8.9%, based on a 6.5% pre-tax cost of debt, a 4.3% risk-free rate, a 5.6% equity risk premium, a beta of 1.3 and a 40% target debt-to-capital ratio. We estimate that, on a full-year basis, a 1% higher-than-expected tariff cut would affect FY14E earnings by 6.9%, and a 1% lower-than-expected coal price decline would affect FY14E earnings by 4.1%.
Risk Key downside risks are adverse coal price change without a corresponding tariff adjustment, lack of clarity on tariff review polity, a lower-than-expected plant utilization rate, earnings downside or goodwill impairment of Tuas Power due to intensifying local market competition, and interest rate hike.
9 January 2014
Utilities
China IPPs
Page 26 Deutsche Bank AG/Hong Kong
Figure 39: Huaneng – 1-year forward P/B Figure 40: Huaneng – ROE trend
0.6
1.1
1.6
2.1
2.6
3.1
3.6
Jan-
04
Jul-0
4
Jan-
05
Jul-0
5
Jan-
06
Jul-0
6
Jan-
07
Jul-0
7
Jan-
08
Jul-0
8
Jan-
09
Jul-0
9
Jan-
10
Jul-1
0
Jan-
11
Jul-1
1
Jan-
12
Jul-1
2
Jan-
13
Jul-1
3
Jan-
14
F-P/B Avg P/B -1 Std Dev +1 Std Dev
(15.0)
(10.0)
(5.0)
0.0
5.0
10.0
15.0
20.0
25.0
2003
2004
2005
2006
2007
2008
2009
2010
2011
2012
2013
E
2014
E
2015
E
(%)
Source: Datastream, Deutsche Bank estimates Source: Company data, Deutsche Bank estimates
Datang Power (Buy, target price HK$4.8)
We have a Buy rating on Datang Power on several grounds:
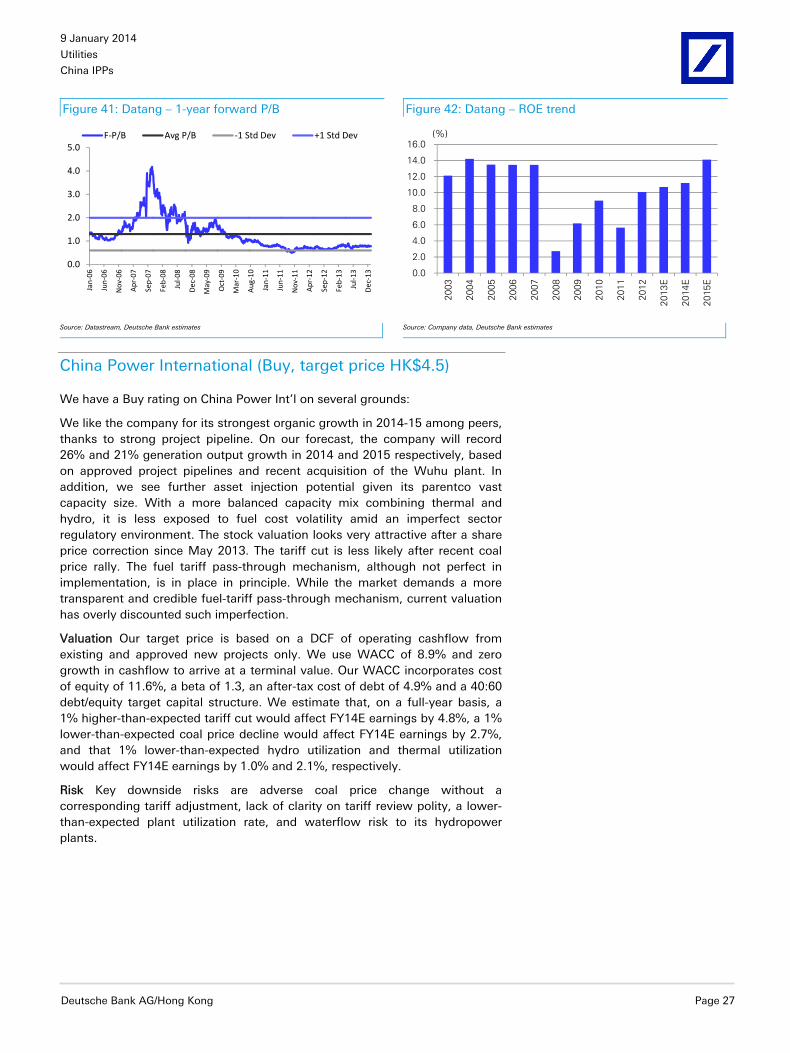
We like the company as its Keqi coal-to-gas project is set to generate good return with a settled selling price of Rmb2.75/cubic meter and strong earnings growth in 2014-15 when project capacity ramps up. Also, it is the only IPP with nuclear power exposure and we expect investment in Ningde nuclear will bear fruit with another three units to be operational in 2014-16. While its Duolun coal chemistry project is still struggling, the market is fully aware of the risk and the loss can be absorbed by strong earnings contribution from other businesses. In addition, we believe the likely tariff hike for gas-fired plants will be a positive for the company given gas accounting for 9% of total capacity. The stock valuation looks very attractive after a share price correction since May 2013. The tariff cut is less likely after recent coal price rally. The fuel tariff pass-through mechanism, although not perfect in implementation, is in place in principle. While the market demands a more transparent and credible fuel-tariff pass-through mechanism, current valuation has overly discounted such imperfection.
Valuation Our target price is derived from a DCF of operating cashflow of power plants and the company's non-power businesses through 2020E, assuming WACC of 9.6% (risk-free rate of 4.3%, market premium of 5.6%, after-tax cost of debt of 4.9% and a beta of 1.5). We estimate that, on a full-year basis, a 1% higher-than-expected tariff cut would affect FY14E earnings by 6.6%, and a 1% lower-than-expected coal price decline would affect FY14E earnings by 3.3%.
Risk Key downside risks are adverse coal price change without a corresponding tariff adjustment, lack of clarity on tariff review polity, a lower-than-expected plant utilization rate, and interest rate hike given its relatively higher gearing. We also see uncertainties for the Duolun Coal-to-PP project on several fronts: 1) a continued low utilization; 2) PP price volatility; and 3) PP demand and supply.
9 January 2014
Utilities
China IPPs
Deutsche Bank AG/Hong Kong Page 27
Figure 41: Datang – 1-year forward P/B Figure 42: Datang – ROE trend
0.0
1.0
2.0
3.0
4.0
5.0
Jan-
06
Jun-
06
Nov
-06
Apr
-07
Sep-
07
Feb-
08
Jul-0
8
Dec
-08
May
-09
Oct
-09
Mar
-10
Aug
-10
Jan-
11
Jun-
11
Nov
-11
Apr
-12
Sep-
12
Feb-
13
Jul-1
3
Dec
-13
F-P/B Avg P/B -1 Std Dev +1 Std Dev
0.0
2.0
4.0
6.0
8.0
10.0
12.0
14.0
16.0
2003
2004
2005
2006
2007
2008
2009
2010
2011
2012
2013
E
2014
E
2015
E
(%)
Source: Datastream, Deutsche Bank estimates Source: Company data, Deutsche Bank estimates
China Power International (Buy, target price HK$4.5)
We have a Buy rating on China Power Int’l on several grounds:
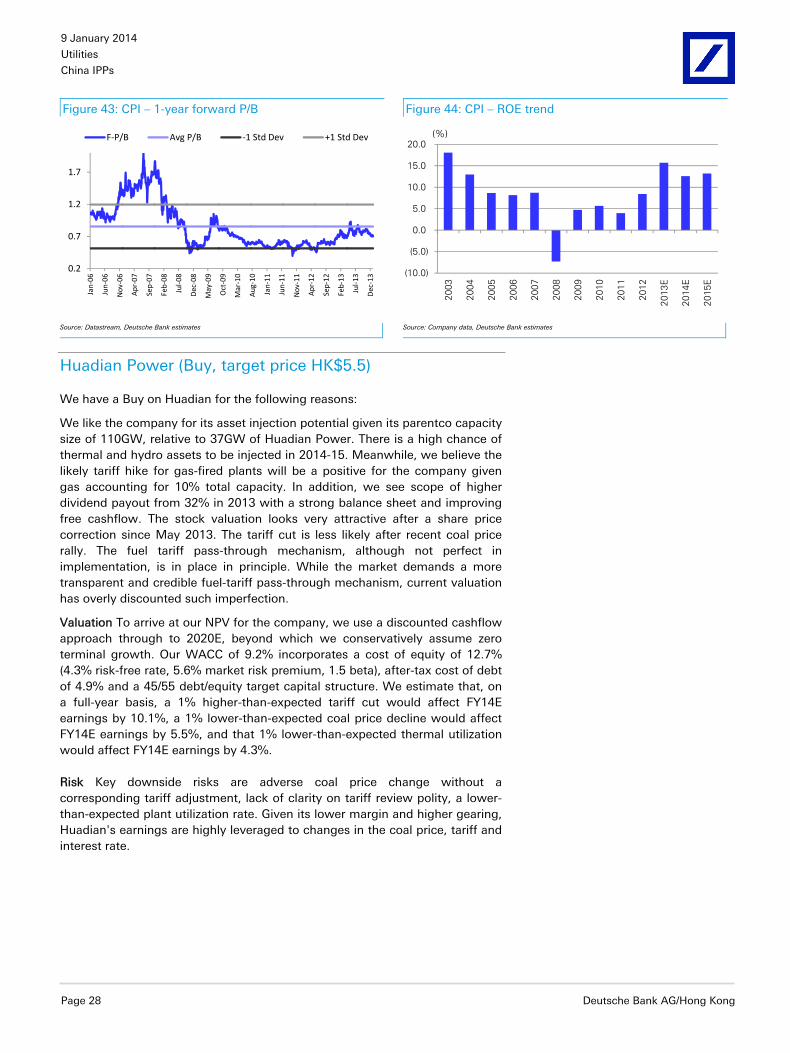
We like the company for its strongest organic growth in 2014-15 among peers, thanks to strong project pipeline. On our forecast, the company will record 26% and 21% generation output growth in 2014 and 2015 respectively, based on approved project pipelines and recent acquisition of the Wuhu plant. In addition, we see further asset injection potential given its parentco vast capacity size. With a more balanced capacity mix combining thermal and hydro, it is less exposed to fuel cost volatility amid an imperfect sector regulatory environment. The stock valuation looks very attractive after a share price correction since May 2013. The tariff cut is less likely after recent coal price rally. The fuel tariff pass-through mechanism, although not perfect in implementation, is in place in principle. While the market demands a more transparent and credible fuel-tariff pass-through mechanism, current valuation has overly discounted such imperfection.
Valuation Our target price is based on a DCF of operating cashflow from existing and approved new projects only. We use WACC of 8.9% and zero growth in cashflow to arrive at a terminal value. Our WACC incorporates cost of equity of 11.6%, a beta of 1.3, an after-tax cost of debt of 4.9% and a 40:60 debt/equity target capital structure. We estimate that, on a full-year basis, a 1% higher-than-expected tariff cut would affect FY14E earnings by 4.8%, a 1% lower-than-expected coal price decline would affect FY14E earnings by 2.7%, and that 1% lower-than-expected hydro utilization and thermal utilization would affect FY14E earnings by 1.0% and 2.1%, respectively.
Risk Key downside risks are adverse coal price change without a corresponding tariff adjustment, lack of clarity on tariff review polity, a lower-than-expected plant utilization rate, and waterflow risk to its hydropower plants.
9 January 2014
Utilities
China IPPs
Page 28 Deutsche Bank AG/Hong Kong
Figure 43: CPI – 1-year forward P/B Figure 44: CPI – ROE trend
0.2
0.7
1.2
1.7
Jan-
06
Jun-
06
Nov
-06
Apr
-07
Sep-
07
Feb-
08
Jul-0
8
Dec
-08
May
-09
Oct
-09
Mar
-10
Aug
-10
Jan-
11
Jun-
11
Nov
-11
Apr
-12
Sep-
12
Feb-
13
Jul-1
3
Dec
-13
F-P/B Avg P/B -1 Std Dev +1 Std Dev
(10.0)
(5.0)
0.0
5.0
10.0
15.0
20.0
2003
2004
2005
2006
2007
2008
2009
2010
2011
2012
2013
E
2014
E
2015
E
(%)
Source: Datastream, Deutsche Bank estimates Source: Company data, Deutsche Bank estimates
Huadian Power (Buy, target price HK$5.5)
We have a Buy on Huadian for the following reasons:
We like the company for its asset injection potential given its parentco capacity size of 110GW, relative to 37GW of Huadian Power. There is a high chance of thermal and hydro assets to be injected in 2014-15. Meanwhile, we believe the likely tariff hike for gas-fired plants will be a positive for the company given gas accounting for 10% total capacity. In addition, we see scope of higher dividend payout from 32% in 2013 with a strong balance sheet and improving free cashflow. The stock valuation looks very attractive after a share price correction since May 2013. The tariff cut is less likely after recent coal price rally. The fuel tariff pass-through mechanism, although not perfect in implementation, is in place in principle. While the market demands a more transparent and credible fuel-tariff pass-through mechanism, current valuation has overly discounted such imperfection.
Valuation To arrive at our NPV for the company, we use a discounted cashflow approach through to 2020E, beyond which we conservatively assume zero terminal growth. Our WACC of 9.2% incorporates a cost of equity of 12.7% (4.3% risk-free rate, 5.6% market risk premium, 1.5 beta), after-tax cost of debt of 4.9% and a 45/55 debt/equity target capital structure. We estimate that, on a full-year basis, a 1% higher-than-expected tariff cut would affect FY14E earnings by 10.1%, a 1% lower-than-expected coal price decline would affect FY14E earnings by 5.5%, and that 1% lower-than-expected thermal utilization would affect FY14E earnings by 4.3%.
Risk Key downside risks are adverse coal price change without a corresponding tariff adjustment, lack of clarity on tariff review polity, a lower-than-expected plant utilization rate. Given its lower margin and higher gearing, Huadian's earnings are highly leveraged to changes in the coal price, tariff and interest rate.
9 January 2014
Utilities
China IPPs
Deutsche Bank AG/Hong Kong Page 29
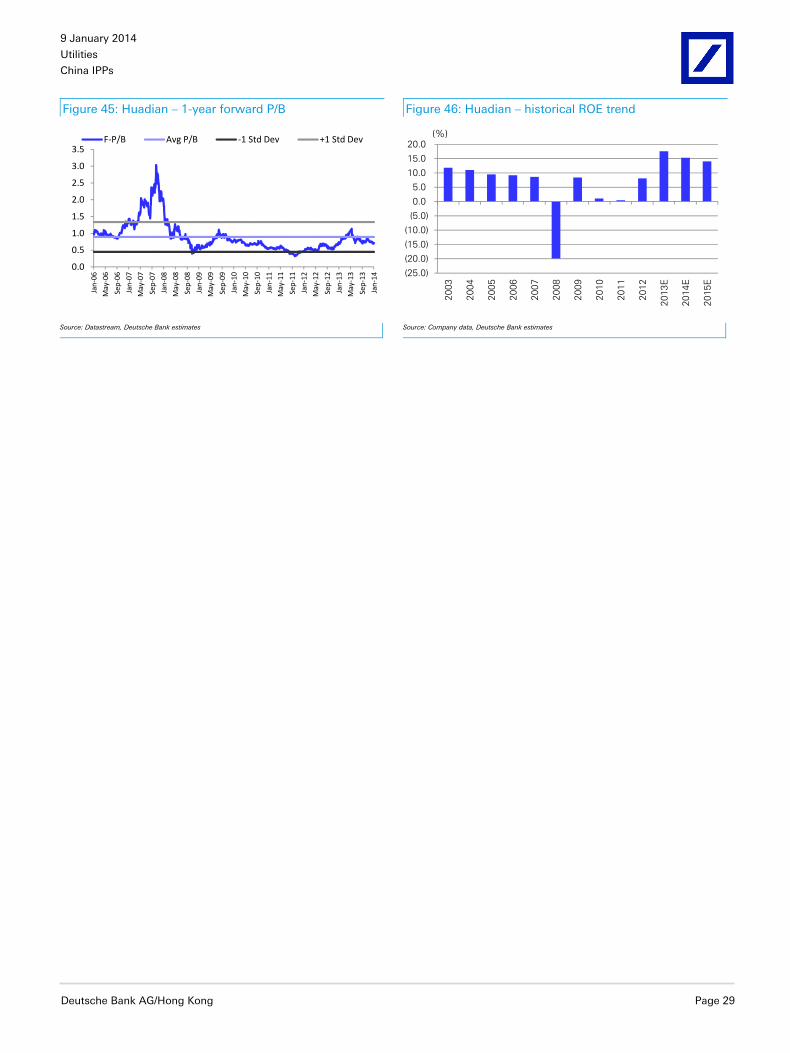
Figure 45: Huadian – 1-year forward P/B Figure 46: Huadian – historical ROE trend
0.0
0.5
1.0
1.5
2.0
2.5
3.0
3.5
Jan-
06M
ay-0
6
Sep-
06
Jan-
07M
ay-0
7
Sep-
07
Jan-
08
May
-08
Sep-
08
Jan-
09M
ay-0
9
Sep-
09
Jan-
10
May
-10
Sep-
10
Jan-
11M
ay-1
1
Sep-
11
Jan-
12
May
-12
Sep-
12
Jan-
13M
ay-1
3
Sep-
13
Jan-
14
F-P/B Avg P/B -1 Std Dev +1 Std Dev
(25.0)(20.0)(15.0)(10.0)(5.0)0.0 5.0
10.0 15.0 20.0
2003
2004
2005
2006
2007
2008
2009
2010
2011
2012
2013
E
2014
E
2015
E
(%)
Source: Datastream, Deutsche Bank estimates Source: Company data, Deutsche Bank estimates
9 January 2014
Utilities
China IPPs
Page 30 Deutsche Bank AG/Hong Kong
Model updated:03 January 2014
Running the numbers
Asia
China
Utilities
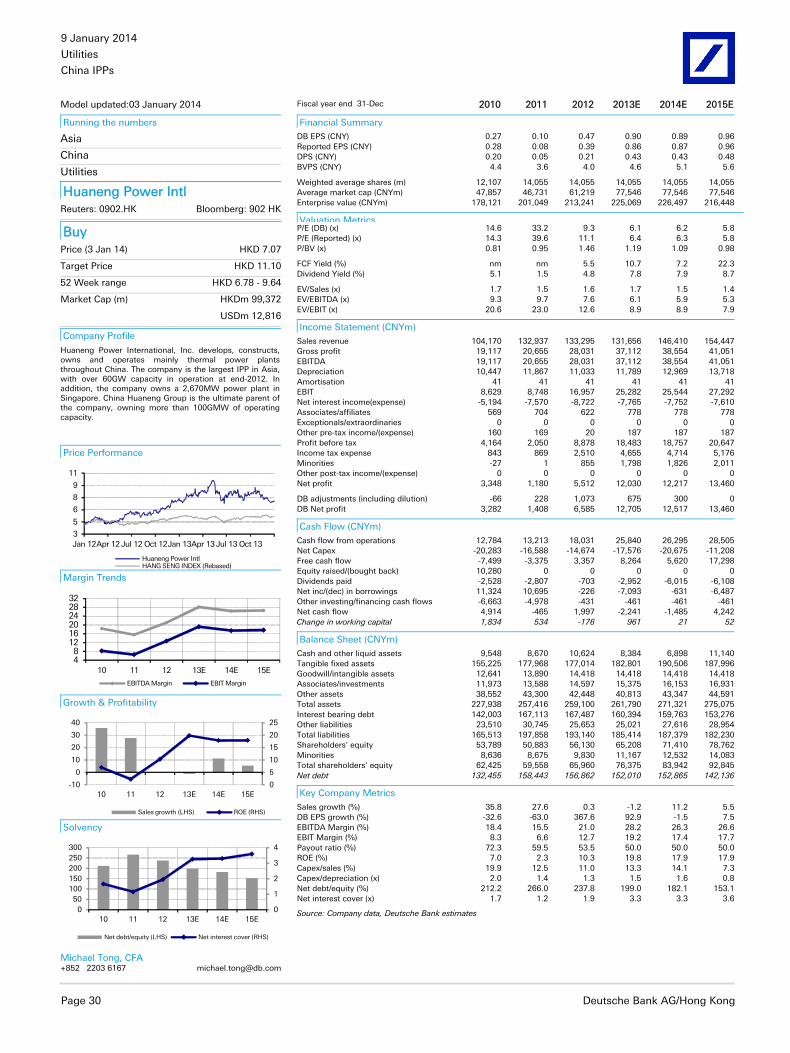
Huaneng Power Intl Reuters: 0902.HK Bloomberg: 902 HK
Buy Price (3 Jan 14) HKD 7.07
Target Price HKD 11.10
52 Week range HKD 6.78 - 9.64
Market Cap (m) HKDm 99,372
USDm 12,816
Company Profile
Huaneng Power International, Inc. develops, constructs, owns and operates mainly thermal power plants throughout China. The company is the largest IPP in Asia, with over 60GW capacity in operation at end-2012. In addition, the company owns a 2,670MW power plant in Singapore. China Huaneng Group is the ultimate parent of the company, owning more than 100GMW of operating capacity.
Price Performance
3
5
6
8
9
11
Jan 12Apr 12 Jul 12 Oct 12Jan 13Apr 13 Jul 13 Oct 13
Huaneng Power IntlHANG SENG INDEX (Rebased)
Margin Trends
48
121620242832
10 11 12 13E 14E 15E
EBITDA Margin EBIT Margin
Growth & Profitability
0
5
10
15
20
25
-10
0
10
20
30
40
10 11 12 13E 14E 15E
Sales growth (LHS) ROE (RHS)
Solvency
0
1
2
3
4
050
100150200250300
10 11 12 13E 14E 15E
Net debt/equity (LHS) Net interest cover (RHS)
Michael Tong, CFA +852 2203 6167 [email protected]
Fiscal year end 31-Dec 2010 2011 2012 2013E 2014E 2015E
Financial Summary
DB EPS (CNY) 0.27 0.10 0.47 0.90 0.89 0.96Reported EPS (CNY) 0.28 0.08 0.39 0.86 0.87 0.96DPS (CNY) 0.20 0.05 0.21 0.43 0.43 0.48BVPS (CNY) 4.4 3.6 4.0 4.6 5.1 5.6
Weighted average shares (m) 12,107 14,055 14,055 14,055 14,055 14,055Average market cap (CNYm) 47,857 46,731 61,219 77,546 77,546 77,546Enterprise value (CNYm) 178,121 201,049 213,241 225,069 226,497 216,448
Valuation MetricsP/E (DB) (x) 14.6 33.2 9.3 6.1 6.2 5.8P/E (Reported) (x) 14.3 39.6 11.1 6.4 6.3 5.8P/BV (x) 0.81 0.95 1.46 1.19 1.09 0.98
FCF Yield (%) nm nm 5.5 10.7 7.2 22.3Dividend Yield (%) 5.1 1.5 4.8 7.8 7.9 8.7
EV/Sales (x) 1.7 1.5 1.6 1.7 1.5 1.4EV/EBITDA (x) 9.3 9.7 7.6 6.1 5.9 5.3EV/EBIT (x) 20.6 23.0 12.6 8.9 8.9 7.9
Income Statement (CNYm)
Sales revenue 104,170 132,937 133,295 131,656 146,410 154,447Gross profit 19,117 20,655 28,031 37,112 38,554 41,051EBITDA 19,117 20,655 28,031 37,112 38,554 41,051Depreciation 10,447 11,867 11,033 11,789 12,969 13,718Amortisation 41 41 41 41 41 41EBIT 8,629 8,748 16,957 25,282 25,544 27,292Net interest income(expense) -5,194 -7,570 -8,722 -7,765 -7,752 -7,610Associates/affiliates 569 704 622 778 778 778Exceptionals/extraordinaries 0 0 0 0 0 0Other pre-tax income/(expense) 160 169 20 187 187 187Profit before tax 4,164 2,050 8,878 18,483 18,757 20,647Income tax expense 843 869 2,510 4,655 4,714 5,176Minorities -27 1 855 1,798 1,826 2,011Other post-tax income/(expense) 0 0 0 0 0 0Net profit 3,348 1,180 5,512 12,030 12,217 13,460
DB adjustments (including dilution) -66 228 1,073 675 300 0DB Net profit 3,282 1,408 6,585 12,705 12,517 13,460
Cash Flow (CNYm)
Cash flow from operations 12,784 13,213 18,031 25,840 26,295 28,505Net Capex -20,283 -16,588 -14,674 -17,576 -20,675 -11,208Free cash flow -7,499 -3,375 3,357 8,264 5,620 17,298Equity raised/(bought back) 10,280 0 0 0 0 0Dividends paid -2,528 -2,807 -703 -2,952 -6,015 -6,108Net inc/(dec) in borrowings 11,324 10,695 -226 -7,093 -631 -6,487Other investing/financing cash flows -6,663 -4,978 -431 -461 -461 -461Net cash flow 4,914 -465 1,997 -2,241 -1,485 4,242Change in working capital 1,834 534 -176 961 21 52
Balance Sheet (CNYm)
Cash and other liquid assets 9,548 8,670 10,624 8,384 6,898 11,140Tangible fixed assets 155,225 177,968 177,014 182,801 190,506 187,996Goodwill/intangible assets 12,641 13,890 14,418 14,418 14,418 14,418Associates/investments 11,973 13,588 14,597 15,375 16,153 16,931Other assets 38,552 43,300 42,448 40,813 43,347 44,591Total assets 227,938 257,416 259,100 261,790 271,321 275,075Interest bearing debt 142,003 167,113 167,487 160,394 159,763 153,276Other liabilities 23,510 30,745 25,653 25,021 27,616 28,954Total liabilities 165,513 197,858 193,140 185,414 187,379 182,230Shareholders' equity 53,789 50,883 56,130 65,208 71,410 78,762Minorities 8,636 8,675 9,830 11,167 12,532 14,083Total shareholders' equity 62,425 59,558 65,960 76,375 83,942 92,845Net debt 132,455 158,443 156,862 152,010 152,865 142,136
Key Company Metrics
Sales growth (%) 35.8 27.6 0.3 -1.2 11.2 5.5DB EPS growth (%) -32.6 -63.0 367.6 92.9 -1.5 7.5EBITDA Margin (%) 18.4 15.5 21.0 28.2 26.3 26.6EBIT Margin (%) 8.3 6.6 12.7 19.2 17.4 17.7Payout ratio (%) 72.3 59.5 53.5 50.0 50.0 50.0ROE (%) 7.0 2.3 10.3 19.8 17.9 17.9Capex/sales (%) 19.9 12.5 11.0 13.3 14.1 7.3Capex/depreciation (x) 2.0 1.4 1.3 1.5 1.6 0.8Net debt/equity (%) 212.2 266.0 237.8 199.0 182.1 153.1Net interest cover (x) 1.7 1.2 1.9 3.3 3.3 3.6
Source: Company data, Deutsche Bank estimates
9 January 2014
Utilities
China IPPs
Deutsche Bank AG/Hong Kong Page 31
Model updated:03 January 2014
Running the numbers
Asia
China
Utilities
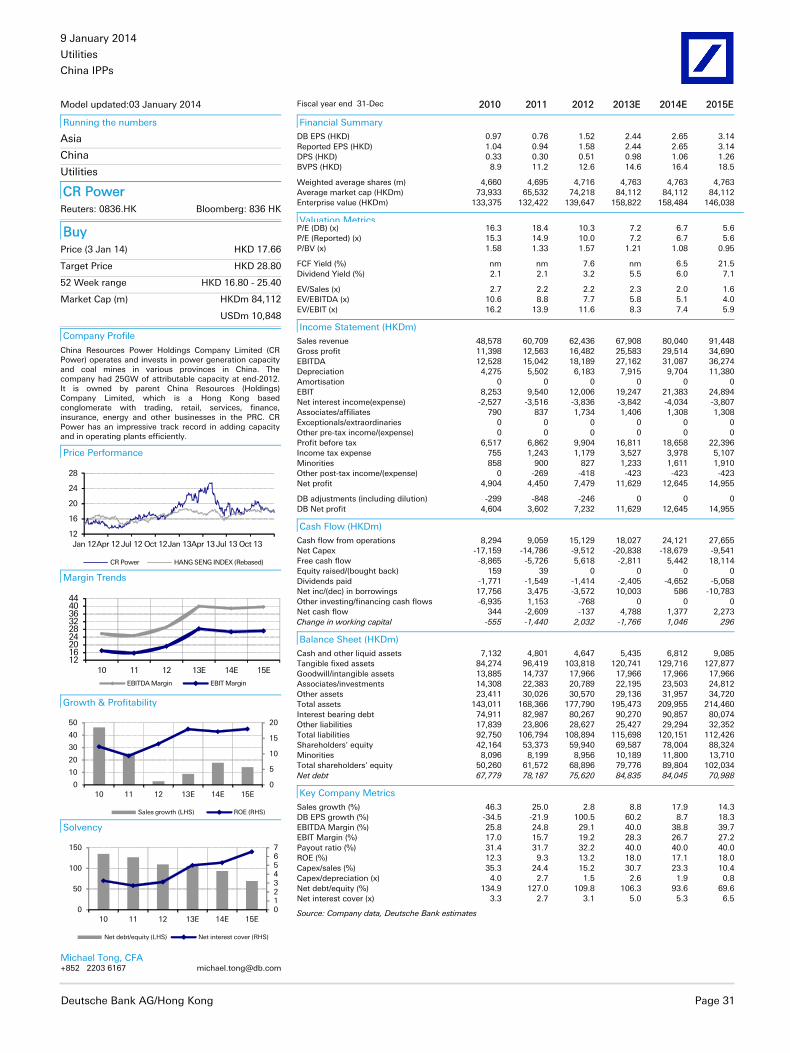
CR Power Reuters: 0836.HK Bloomberg: 836 HK
Buy Price (3 Jan 14) HKD 17.66
Target Price HKD 28.80
52 Week range HKD 16.80 - 25.40
Market Cap (m) HKDm 84,112
USDm 10,848
Company Profile
China Resources Power Holdings Company Limited (CR Power) operates and invests in power generation capacity and coal mines in various provinces in China. The company had 25GW of attributable capacity at end-2012. It is owned by parent China Resources (Holdings) Company Limited, which is a Hong Kong based conglomerate with trading, retail, services, finance, insurance, energy and other businesses in the PRC. CR Power has an impressive track record in adding capacity and in operating plants efficiently.
Price Performance
12
16
20
24
28
Jan 12Apr 12 Jul 12 Oct 12Jan 13Apr 13 Jul 13 Oct 13
CR Power HANG SENG INDEX (Rebased)
Margin Trends
121620242832364044
10 11 12 13E 14E 15E
EBITDA Margin EBIT Margin
Growth & Profitability
0
5
10
15
20
0
10
20
30
40
50
10 11 12 13E 14E 15E
Sales growth (LHS) ROE (RHS)
Solvency
01234567
0
50
100
150
10 11 12 13E 14E 15E
Net debt/equity (LHS) Net interest cover (RHS)
Michael Tong, CFA +852 2203 6167 [email protected]
Fiscal year end 31-Dec 2010 2011 2012 2013E 2014E 2015E
Financial Summary
DB EPS (HKD) 0.97 0.76 1.52 2.44 2.65 3.14Reported EPS (HKD) 1.04 0.94 1.58 2.44 2.65 3.14DPS (HKD) 0.33 0.30 0.51 0.98 1.06 1.26BVPS (HKD) 8.9 11.2 12.6 14.6 16.4 18.5
Weighted average shares (m) 4,660 4,695 4,716 4,763 4,763 4,763Average market cap (HKDm) 73,933 65,532 74,218 84,112 84,112 84,112Enterprise value (HKDm) 133,375 132,422 139,647 158,822 158,484 146,038
Valuation MetricsP/E (DB) (x) 16.3 18.4 10.3 7.2 6.7 5.6P/E (Reported) (x) 15.3 14.9 10.0 7.2 6.7 5.6P/BV (x) 1.58 1.33 1.57 1.21 1.08 0.95
FCF Yield (%) nm nm 7.6 nm 6.5 21.5Dividend Yield (%) 2.1 2.1 3.2 5.5 6.0 7.1
EV/Sales (x) 2.7 2.2 2.2 2.3 2.0 1.6EV/EBITDA (x) 10.6 8.8 7.7 5.8 5.1 4.0EV/EBIT (x) 16.2 13.9 11.6 8.3 7.4 5.9
Income Statement (HKDm)
Sales revenue 48,578 60,709 62,436 67,908 80,040 91,448Gross profit 11,398 12,563 16,482 25,583 29,514 34,690EBITDA 12,528 15,042 18,189 27,162 31,087 36,274Depreciation 4,275 5,502 6,183 7,915 9,704 11,380Amortisation 0 0 0 0 0 0EBIT 8,253 9,540 12,006 19,247 21,383 24,894Net interest income(expense) -2,527 -3,516 -3,836 -3,842 -4,034 -3,807Associates/affiliates 790 837 1,734 1,406 1,308 1,308Exceptionals/extraordinaries 0 0 0 0 0 0Other pre-tax income/(expense) 0 0 0 0 0 0Profit before tax 6,517 6,862 9,904 16,811 18,658 22,396Income tax expense 755 1,243 1,179 3,527 3,978 5,107Minorities 858 900 827 1,233 1,611 1,910Other post-tax income/(expense) 0 -269 -418 -423 -423 -423Net profit 4,904 4,450 7,479 11,629 12,645 14,955
DB adjustments (including dilution) -299 -848 -246 0 0 0DB Net profit 4,604 3,602 7,232 11,629 12,645 14,955
Cash Flow (HKDm)
Cash flow from operations 8,294 9,059 15,129 18,027 24,121 27,655Net Capex -17,159 -14,786 -9,512 -20,838 -18,679 -9,541Free cash flow -8,865 -5,726 5,618 -2,811 5,442 18,114Equity raised/(bought back) 159 39 0 0 0 0Dividends paid -1,771 -1,549 -1,414 -2,405 -4,652 -5,058Net inc/(dec) in borrowings 17,756 3,475 -3,572 10,003 586 -10,783Other investing/financing cash flows -6,935 1,153 -768 0 0 0Net cash flow 344 -2,609 -137 4,788 1,377 2,273Change in working capital -555 -1,440 2,032 -1,766 1,046 296
Balance Sheet (HKDm)
Cash and other liquid assets 7,132 4,801 4,647 5,435 6,812 9,085Tangible fixed assets 84,274 96,419 103,818 120,741 129,716 127,877Goodwill/intangible assets 13,885 14,737 17,966 17,966 17,966 17,966Associates/investments 14,308 22,383 20,789 22,195 23,503 24,812Other assets 23,411 30,026 30,570 29,136 31,957 34,720Total assets 143,011 168,366 177,790 195,473 209,955 214,460Interest bearing debt 74,911 82,987 80,267 90,270 90,857 80,074Other liabilities 17,839 23,806 28,627 25,427 29,294 32,352Total liabilities 92,750 106,794 108,894 115,698 120,151 112,426Shareholders' equity 42,164 53,373 59,940 69,587 78,004 88,324Minorities 8,096 8,199 8,956 10,189 11,800 13,710Total shareholders' equity 50,260 61,572 68,896 79,776 89,804 102,034Net debt 67,779 78,187 75,620 84,835 84,045 70,988
Key Company Metrics
Sales growth (%) 46.3 25.0 2.8 8.8 17.9 14.3DB EPS growth (%) -34.5 -21.9 100.5 60.2 8.7 18.3EBITDA Margin (%) 25.8 24.8 29.1 40.0 38.8 39.7EBIT Margin (%) 17.0 15.7 19.2 28.3 26.7 27.2Payout ratio (%) 31.4 31.7 32.2 40.0 40.0 40.0ROE (%) 12.3 9.3 13.2 18.0 17.1 18.0Capex/sales (%) 35.3 24.4 15.2 30.7 23.3 10.4Capex/depreciation (x) 4.0 2.7 1.5 2.6 1.9 0.8Net debt/equity (%) 134.9 127.0 109.8 106.3 93.6 69.6Net interest cover (x) 3.3 2.7 3.1 5.0 5.3 6.5
Source: Company data, Deutsche Bank estimates
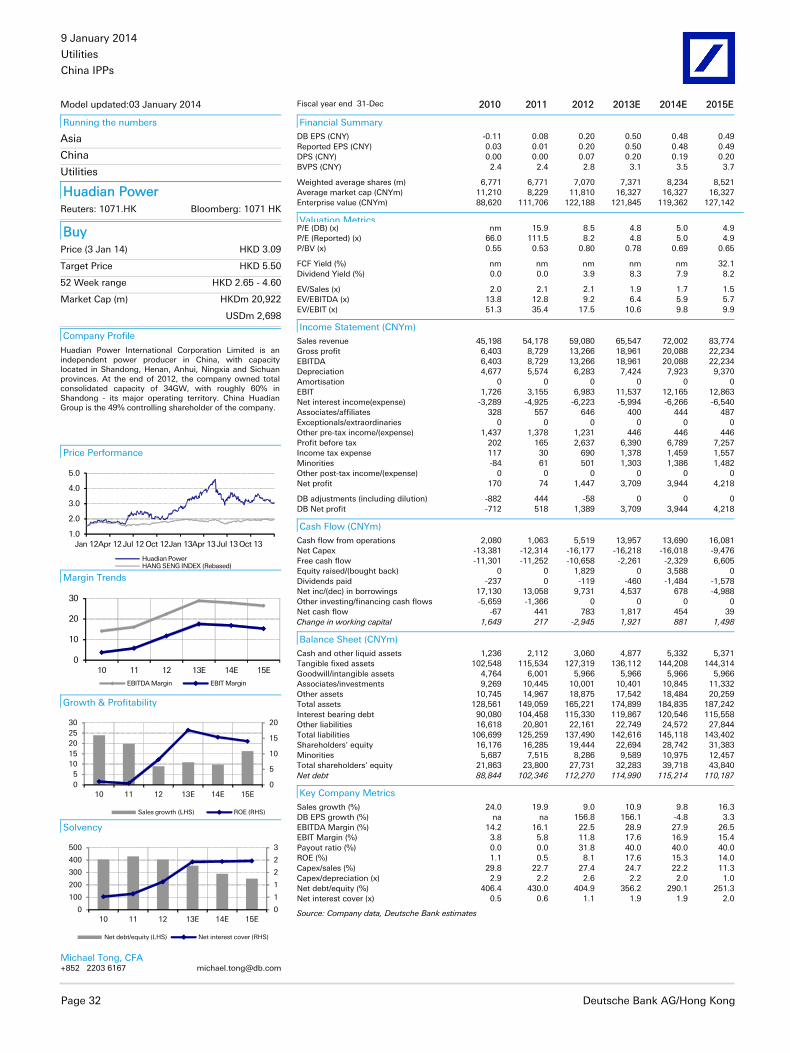
9 January 2014
Utilities
China IPPs
Page 32 Deutsche Bank AG/Hong Kong
Model updated:03 January 2014
Running the numbers
Asia
China
Utilities
Huadian Power Reuters: 1071.HK Bloomberg: 1071 HK
Buy Price (3 Jan 14) HKD 3.09
Target Price HKD 5.50
52 Week range HKD 2.65 - 4.60
Market Cap (m) HKDm 20,922
USDm 2,698
Company Profile
Huadian Power International Corporation Limited is an independent power producer in China, with capacity located in Shandong, Henan, Anhui, Ningxia and Sichuan provinces. At the end of 2012, the company owned total consolidated capacity of 34GW, with roughly 60% in Shandong - its major operating territory. China Huadian Group is the 49% controlling shareholder of the company.
Price Performance
1.0
2.0
3.0
4.0
5.0
Jan 12Apr 12Jul 12 Oct 12Jan 13Apr 13Jul 13 Oct 13
Huadian PowerHANG SENG INDEX (Rebased)
Margin Trends
0
10
20
30
10 11 12 13E 14E 15E
EBITDA Margin EBIT Margin
Growth & Profitability
0
5
10
15
20
05
1015202530
10 11 12 13E 14E 15E
Sales growth (LHS) ROE (RHS)
Solvency
0
1
1
2
2
3
0
100
200
300
400
500
10 11 12 13E 14E 15E
Net debt/equity (LHS) Net interest cover (RHS)
Michael Tong, CFA +852 2203 6167 [email protected]
Fiscal year end 31-Dec 2010 2011 2012 2013E 2014E 2015E
Financial Summary
DB EPS (CNY) -0.11 0.08 0.20 0.50 0.48 0.49Reported EPS (CNY) 0.03 0.01 0.20 0.50 0.48 0.49DPS (CNY) 0.00 0.00 0.07 0.20 0.19 0.20BVPS (CNY) 2.4 2.4 2.8 3.1 3.5 3.7
Weighted average shares (m) 6,771 6,771 7,070 7,371 8,234 8,521Average market cap (CNYm) 11,210 8,229 11,810 16,327 16,327 16,327Enterprise value (CNYm) 88,620 111,706 122,188 121,845 119,362 127,142
Valuation MetricsP/E (DB) (x) nm 15.9 8.5 4.8 5.0 4.9P/E (Reported) (x) 66.0 111.5 8.2 4.8 5.0 4.9P/BV (x) 0.55 0.53 0.80 0.78 0.69 0.65
FCF Yield (%) nm nm nm nm nm 32.1Dividend Yield (%) 0.0 0.0 3.9 8.3 7.9 8.2
EV/Sales (x) 2.0 2.1 2.1 1.9 1.7 1.5EV/EBITDA (x) 13.8 12.8 9.2 6.4 5.9 5.7EV/EBIT (x) 51.3 35.4 17.5 10.6 9.8 9.9
Income Statement (CNYm)
Sales revenue 45,198 54,178 59,080 65,547 72,002 83,774Gross profit 6,403 8,729 13,266 18,961 20,088 22,234EBITDA 6,403 8,729 13,266 18,961 20,088 22,234Depreciation 4,677 5,574 6,283 7,424 7,923 9,370Amortisation 0 0 0 0 0 0EBIT 1,726 3,155 6,983 11,537 12,165 12,863Net interest income(expense) -3,289 -4,925 -6,223 -5,994 -6,266 -6,540Associates/affiliates 328 557 646 400 444 487Exceptionals/extraordinaries 0 0 0 0 0 0Other pre-tax income/(expense) 1,437 1,378 1,231 446 446 446Profit before tax 202 165 2,637 6,390 6,789 7,257Income tax expense 117 30 690 1,378 1,459 1,557Minorities -84 61 501 1,303 1,386 1,482Other post-tax income/(expense) 0 0 0 0 0 0Net profit 170 74 1,447 3,709 3,944 4,218
DB adjustments (including dilution) -882 444 -58 0 0 0DB Net profit -712 518 1,389 3,709 3,944 4,218
Cash Flow (CNYm)
Cash flow from operations 2,080 1,063 5,519 13,957 13,690 16,081Net Capex -13,381 -12,314 -16,177 -16,218 -16,018 -9,476Free cash flow -11,301 -11,252 -10,658 -2,261 -2,329 6,605Equity raised/(bought back) 0 0 1,829 0 3,588 0Dividends paid -237 0 -119 -460 -1,484 -1,578Net inc/(dec) in borrowings 17,130 13,058 9,731 4,537 678 -4,988Other investing/financing cash flows -5,659 -1,366 0 0 0 0Net cash flow -67 441 783 1,817 454 39Change in working capital 1,649 217 -2,945 1,921 881 1,498
Balance Sheet (CNYm)
Cash and other liquid assets 1,236 2,112 3,060 4,877 5,332 5,371Tangible fixed assets 102,548 115,534 127,319 136,112 144,208 144,314Goodwill/intangible assets 4,764 6,001 5,966 5,966 5,966 5,966Associates/investments 9,269 10,445 10,001 10,401 10,845 11,332Other assets 10,745 14,967 18,875 17,542 18,484 20,259Total assets 128,561 149,059 165,221 174,899 184,835 187,242Interest bearing debt 90,080 104,458 115,330 119,867 120,546 115,558Other liabilities 16,618 20,801 22,161 22,749 24,572 27,844Total liabilities 106,699 125,259 137,490 142,616 145,118 143,402Shareholders' equity 16,176 16,285 19,444 22,694 28,742 31,383Minorities 5,687 7,515 8,286 9,589 10,975 12,457Total shareholders' equity 21,863 23,800 27,731 32,283 39,718 43,840Net debt 88,844 102,346 112,270 114,990 115,214 110,187
Key Company Metrics
Sales growth (%) 24.0 19.9 9.0 10.9 9.8 16.3DB EPS growth (%) na na 156.8 156.1 -4.8 3.3EBITDA Margin (%) 14.2 16.1 22.5 28.9 27.9 26.5EBIT Margin (%) 3.8 5.8 11.8 17.6 16.9 15.4Payout ratio (%) 0.0 0.0 31.8 40.0 40.0 40.0ROE (%) 1.1 0.5 8.1 17.6 15.3 14.0Capex/sales (%) 29.8 22.7 27.4 24.7 22.2 11.3Capex/depreciation (x) 2.9 2.2 2.6 2.2 2.0 1.0Net debt/equity (%) 406.4 430.0 404.9 356.2 290.1 251.3Net interest cover (x) 0.5 0.6 1.1 1.9 1.9 2.0
Source: Company data, Deutsche Bank estimates
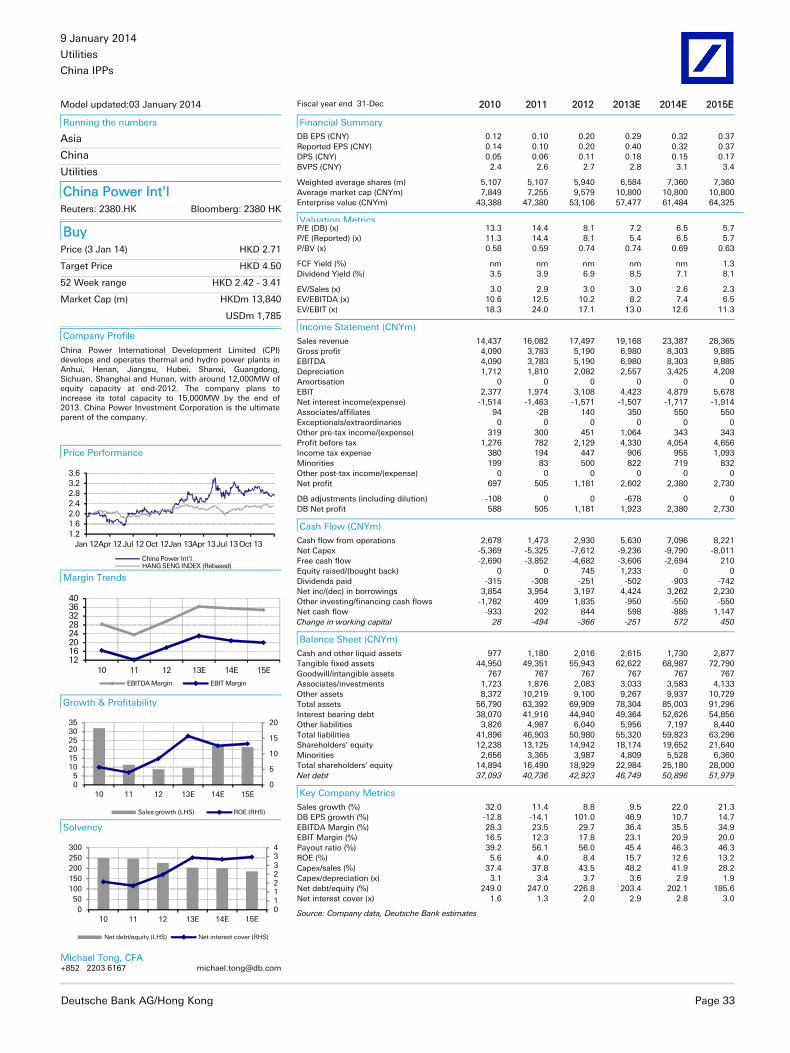
9 January 2014
Utilities
China IPPs
Deutsche Bank AG/Hong Kong Page 33
Model updated:03 January 2014
Running the numbers
Asia
China
Utilities
China Power Int'l Reuters: 2380.HK Bloomberg: 2380 HK
Buy Price (3 Jan 14) HKD 2.71
Target Price HKD 4.50
52 Week range HKD 2.42 - 3.41
Market Cap (m) HKDm 13,840
USDm 1,785
Company Profile
China Power International Development Limited (CPI) develops and operates thermal and hydro power plants in Anhui, Henan, Jiangsu, Hubei, Shanxi, Guangdong, Sichuan, Shanghai and Hunan, with around 12,000MW of equity capacity at end-2012. The company plans to increase its total capacity to 15,000MW by the end of 2013. China Power Investment Corporation is the ultimate parent of the company.
Price Performance
1.21.62.02.42.83.23.6
Jan 12Apr 12Jul 12 Oct 12Jan 13Apr 13Jul 13 Oct 13
China Power Int'lHANG SENG INDEX (Rebased)
Margin Trends
1216202428323640
10 11 12 13E 14E 15E
EBITDA Margin EBIT Margin
Growth & Profitability
0
5
10
15
20
05
101520253035
10 11 12 13E 14E 15E
Sales growth (LHS) ROE (RHS)
Solvency
01122334
050
100150200250300
10 11 12 13E 14E 15E
Net debt/equity (LHS) Net interest cover (RHS)
Michael Tong, CFA +852 2203 6167 [email protected]
Fiscal year end 31-Dec 2010 2011 2012 2013E 2014E 2015E
Financial Summary
DB EPS (CNY) 0.12 0.10 0.20 0.29 0.32 0.37Reported EPS (CNY) 0.14 0.10 0.20 0.40 0.32 0.37DPS (CNY) 0.05 0.06 0.11 0.18 0.15 0.17BVPS (CNY) 2.4 2.6 2.7 2.8 3.1 3.4
Weighted average shares (m) 5,107 5,107 5,940 6,584 7,360 7,360Average market cap (CNYm) 7,849 7,255 9,579 10,800 10,800 10,800Enterprise value (CNYm) 43,388 47,380 53,106 57,477 61,484 64,325
Valuation MetricsP/E (DB) (x) 13.3 14.4 8.1 7.2 6.5 5.7P/E (Reported) (x) 11.3 14.4 8.1 5.4 6.5 5.7P/BV (x) 0.58 0.59 0.74 0.74 0.69 0.63
FCF Yield (%) nm nm nm nm nm 1.3Dividend Yield (%) 3.5 3.9 6.9 8.5 7.1 8.1
EV/Sales (x) 3.0 2.9 3.0 3.0 2.6 2.3EV/EBITDA (x) 10.6 12.5 10.2 8.2 7.4 6.5EV/EBIT (x) 18.3 24.0 17.1 13.0 12.6 11.3
Income Statement (CNYm)
Sales revenue 14,437 16,082 17,497 19,168 23,387 28,365Gross profit 4,090 3,783 5,190 6,980 8,303 9,885EBITDA 4,090 3,783 5,190 6,980 8,303 9,885Depreciation 1,712 1,810 2,082 2,557 3,425 4,208Amortisation 0 0 0 0 0 0EBIT 2,377 1,974 3,108 4,423 4,879 5,678Net interest income(expense) -1,514 -1,463 -1,571 -1,507 -1,717 -1,914Associates/affiliates 94 -28 140 350 550 550Exceptionals/extraordinaries 0 0 0 0 0 0Other pre-tax income/(expense) 319 300 451 1,064 343 343Profit before tax 1,276 782 2,129 4,330 4,054 4,656Income tax expense 380 194 447 906 955 1,093Minorities 199 83 500 822 719 832Other post-tax income/(expense) 0 0 0 0 0 0Net profit 697 505 1,181 2,602 2,380 2,730
DB adjustments (including dilution) -108 0 0 -678 0 0DB Net profit 588 505 1,181 1,923 2,380 2,730
Cash Flow (CNYm)
Cash flow from operations 2,678 1,473 2,930 5,630 7,096 8,221Net Capex -5,369 -5,325 -7,612 -9,236 -9,790 -8,011Free cash flow -2,690 -3,852 -4,682 -3,606 -2,694 210Equity raised/(bought back) 0 0 745 1,233 0 0Dividends paid -315 -308 -251 -502 -903 -742Net inc/(dec) in borrowings 3,854 3,954 3,197 4,424 3,262 2,230Other investing/financing cash flows -1,782 409 1,835 -950 -550 -550Net cash flow -933 202 844 598 -885 1,147Change in working capital 28 -494 -366 -251 572 450
Balance Sheet (CNYm)
Cash and other liquid assets 977 1,180 2,016 2,615 1,730 2,877Tangible fixed assets 44,950 49,351 55,943 62,622 68,987 72,790Goodwill/intangible assets 767 767 767 767 767 767Associates/investments 1,723 1,876 2,083 3,033 3,583 4,133Other assets 8,372 10,219 9,100 9,267 9,937 10,729Total assets 56,790 63,392 69,909 78,304 85,003 91,296Interest bearing debt 38,070 41,916 44,940 49,364 52,626 54,856Other liabilities 3,826 4,987 6,040 5,956 7,197 8,440Total liabilities 41,896 46,903 50,980 55,320 59,823 63,296Shareholders' equity 12,238 13,125 14,942 18,174 19,652 21,640Minorities 2,656 3,365 3,987 4,809 5,528 6,360Total shareholders' equity 14,894 16,490 18,929 22,984 25,180 28,000Net debt 37,093 40,736 42,923 46,749 50,896 51,979
Key Company Metrics
Sales growth (%) 32.0 11.4 8.8 9.5 22.0 21.3DB EPS growth (%) -12.8 -14.1 101.0 46.9 10.7 14.7EBITDA Margin (%) 28.3 23.5 29.7 36.4 35.5 34.9EBIT Margin (%) 16.5 12.3 17.8 23.1 20.9 20.0Payout ratio (%) 39.2 56.1 56.0 45.4 46.3 46.3ROE (%) 5.6 4.0 8.4 15.7 12.6 13.2Capex/sales (%) 37.4 37.8 43.5 48.2 41.9 28.2Capex/depreciation (x) 3.1 3.4 3.7 3.6 2.9 1.9Net debt/equity (%) 249.0 247.0 226.8 203.4 202.1 185.6Net interest cover (x) 1.6 1.3 2.0 2.9 2.8 3.0
Source: Company data, Deutsche Bank estimates
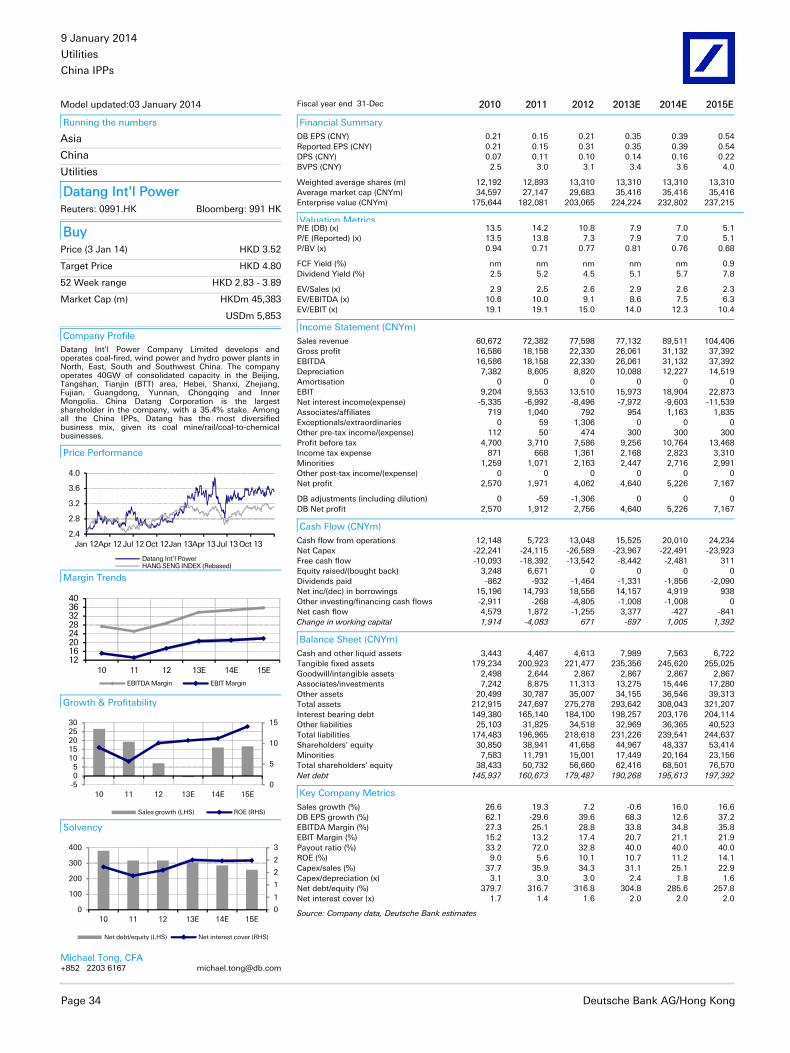
9 January 2014
Utilities
China IPPs
Page 34 Deutsche Bank AG/Hong Kong
Model updated:03 January 2014
Running the numbers
Asia
China
Utilities
Datang Int'l Power Reuters: 0991.HK Bloomberg: 991 HK
Buy Price (3 Jan 14) HKD 3.52
Target Price HKD 4.80
52 Week range HKD 2.83 - 3.89
Market Cap (m) HKDm 45,383
USDm 5,853
Company Profile Datang Int'l Power Company Limited develops and operates coal-fired, wind power and hydro power plants in North, East, South and Southwest China. The company operates 40GW of consolidated capacity in the Beijing, Tangshan, Tianjin (BTT) area, Hebei, Shanxi, Zhejiang, Fujian, Guangdong, Yunnan, Chongqing and Inner Mongolia. China Datang Corporation is the largest shareholder in the company, with a 35.4% stake. Among all the China IPPs, Datang has the most diversified business mix, given its coal mine/rail/coal-to-chemical businesses.
Price Performance
2.4
2.8
3.2
3.6
4.0
Jan 12Apr 12Jul 12 Oct 12Jan 13Apr 13Jul 13 Oct 13
Datang Int'l PowerHANG SENG INDEX (Rebased)
Margin Trends
1216202428323640
10 11 12 13E 14E 15E
EBITDA Margin EBIT Margin
Growth & Profitability
0
5
10
15
-505
1015202530
10 11 12 13E 14E 15E
Sales growth (LHS) ROE (RHS)
Solvency
0
1
1
2
2
3
0
100
200
300
400
10 11 12 13E 14E 15E
Net debt/equity (LHS) Net interest cover (RHS)
Michael Tong, CFA +852 2203 6167 [email protected]
Fiscal year end 31-Dec 2010 2011 2012 2013E 2014E 2015E
Financial Summary
DB EPS (CNY) 0.21 0.15 0.21 0.35 0.39 0.54Reported EPS (CNY) 0.21 0.15 0.31 0.35 0.39 0.54DPS (CNY) 0.07 0.11 0.10 0.14 0.16 0.22BVPS (CNY) 2.5 3.0 3.1 3.4 3.6 4.0
Weighted average shares (m) 12,192 12,893 13,310 13,310 13,310 13,310Average market cap (CNYm) 34,597 27,147 29,683 35,416 35,416 35,416Enterprise value (CNYm) 175,644 182,081 203,065 224,224 232,802 237,215
Valuation MetricsP/E (DB) (x) 13.5 14.2 10.8 7.9 7.0 5.1P/E (Reported) (x) 13.5 13.8 7.3 7.9 7.0 5.1P/BV (x) 0.94 0.71 0.77 0.81 0.76 0.68
FCF Yield (%) nm nm nm nm nm 0.9Dividend Yield (%) 2.5 5.2 4.5 5.1 5.7 7.8
EV/Sales (x) 2.9 2.5 2.6 2.9 2.6 2.3EV/EBITDA (x) 10.6 10.0 9.1 8.6 7.5 6.3EV/EBIT (x) 19.1 19.1 15.0 14.0 12.3 10.4
Income Statement (CNYm)
Sales revenue 60,672 72,382 77,598 77,132 89,511 104,406Gross profit 16,586 18,158 22,330 26,061 31,132 37,392EBITDA 16,586 18,158 22,330 26,061 31,132 37,392Depreciation 7,382 8,605 8,820 10,088 12,227 14,519Amortisation 0 0 0 0 0 0EBIT 9,204 9,553 13,510 15,973 18,904 22,873Net interest income(expense) -5,335 -6,992 -8,496 -7,972 -9,603 -11,539Associates/affiliates 719 1,040 792 954 1,163 1,835Exceptionals/extraordinaries 0 59 1,306 0 0 0Other pre-tax income/(expense) 112 50 474 300 300 300Profit before tax 4,700 3,710 7,586 9,256 10,764 13,468Income tax expense 871 668 1,361 2,168 2,823 3,310Minorities 1,259 1,071 2,163 2,447 2,716 2,991Other post-tax income/(expense) 0 0 0 0 0 0Net profit 2,570 1,971 4,062 4,640 5,226 7,167
DB adjustments (including dilution) 0 -59 -1,306 0 0 0DB Net profit 2,570 1,912 2,756 4,640 5,226 7,167
Cash Flow (CNYm)
Cash flow from operations 12,148 5,723 13,048 15,525 20,010 24,234Net Capex -22,241 -24,115 -26,589 -23,967 -22,491 -23,923Free cash flow -10,093 -18,392 -13,542 -8,442 -2,481 311Equity raised/(bought back) 3,248 6,671 0 0 0 0Dividends paid -862 -932 -1,464 -1,331 -1,856 -2,090Net inc/(dec) in borrowings 15,196 14,793 18,556 14,157 4,919 938Other investing/financing cash flows -2,911 -268 -4,805 -1,008 -1,008 0Net cash flow 4,579 1,872 -1,255 3,377 -427 -841Change in working capital 1,914 -4,083 671 -697 1,005 1,392
Balance Sheet (CNYm)
Cash and other liquid assets 3,443 4,467 4,613 7,989 7,563 6,722Tangible fixed assets 179,234 200,923 221,477 235,356 245,620 255,025Goodwill/intangible assets 2,498 2,644 2,867 2,867 2,867 2,867Associates/investments 7,242 8,875 11,313 13,275 15,446 17,280Other assets 20,499 30,787 35,007 34,155 36,546 39,313Total assets 212,915 247,697 275,278 293,642 308,043 321,207Interest bearing debt 149,380 165,140 184,100 198,257 203,176 204,114Other liabilities 25,103 31,825 34,518 32,969 36,365 40,523Total liabilities 174,483 196,965 218,618 231,226 239,541 244,637Shareholders' equity 30,850 38,941 41,658 44,967 48,337 53,414Minorities 7,583 11,791 15,001 17,449 20,164 23,156Total shareholders' equity 38,433 50,732 56,660 62,416 68,501 76,570Net debt 145,937 160,673 179,487 190,268 195,613 197,392
Key Company Metrics
Sales growth (%) 26.6 19.3 7.2 -0.6 16.0 16.6DB EPS growth (%) 62.1 -29.6 39.6 68.3 12.6 37.2EBITDA Margin (%) 27.3 25.1 28.8 33.8 34.8 35.8EBIT Margin (%) 15.2 13.2 17.4 20.7 21.1 21.9Payout ratio (%) 33.2 72.0 32.8 40.0 40.0 40.0ROE (%) 9.0 5.6 10.1 10.7 11.2 14.1Capex/sales (%) 37.7 35.9 34.3 31.1 25.1 22.9Capex/depreciation (x) 3.1 3.0 3.0 2.4 1.8 1.6Net debt/equity (%) 379.7 316.7 316.8 304.8 285.6 257.8Net interest cover (x) 1.7 1.4 1.6 2.0 2.0 2.0
Source: Company data, Deutsche Bank estimates
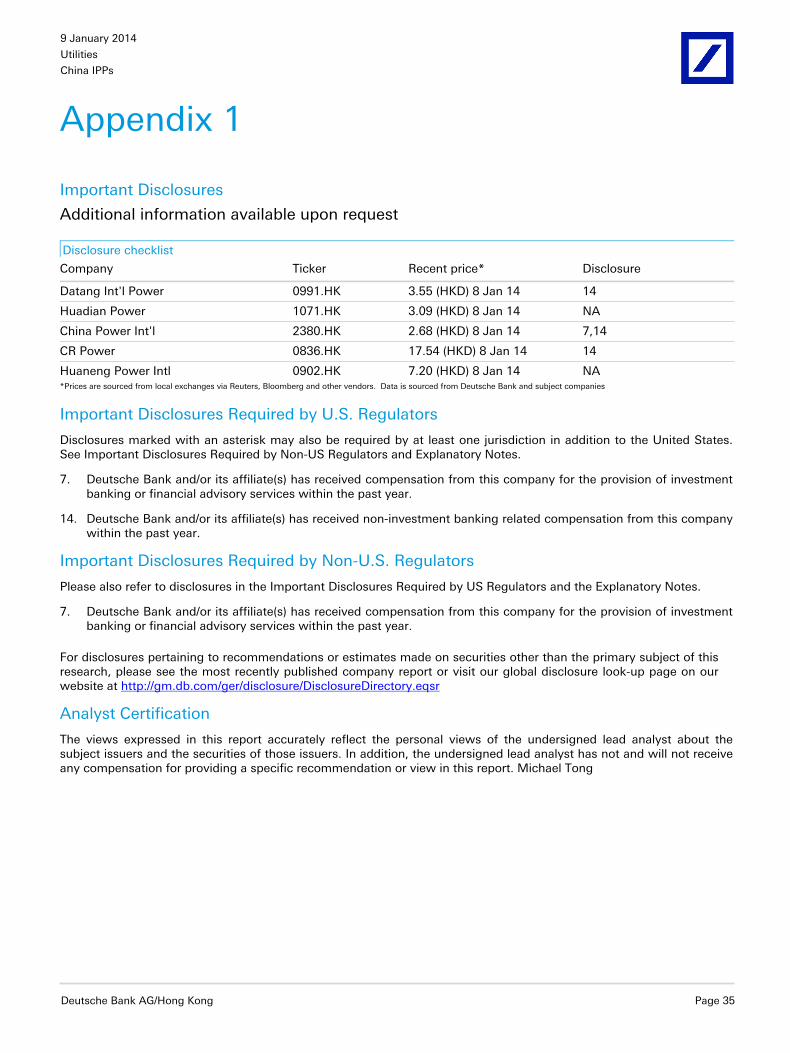
9 January 2014
Utilities
China IPPs
Deutsche Bank AG/Hong Kong Page 35
Appendix 1
Important Disclosures Additional information available upon request Disclosure checklist
Company Ticker Recent price* Disclosure
Datang Int'l Power 0991.HK 3.55 (HKD) 8 Jan 14 14
Huadian Power 1071.HK 3.09 (HKD) 8 Jan 14 NA
China Power Int'l 2380.HK 2.68 (HKD) 8 Jan 14 7,14
CR Power 0836.HK 17.54 (HKD) 8 Jan 14 14
Huaneng Power Intl 0902.HK 7.20 (HKD) 8 Jan 14 NA *Prices are sourced from local exchanges via Reuters, Bloomberg and other vendors. Data is sourced from Deutsche Bank and subject companies
Important Disclosures Required by U.S. Regulators
Disclosures marked with an asterisk may also be required by at least one jurisdiction in addition to the United States. See Important Disclosures Required by Non-US Regulators and Explanatory Notes.
7. Deutsche Bank and/or its affiliate(s) has received compensation from this company for the provision of investment banking or financial advisory services within the past year.
14. Deutsche Bank and/or its affiliate(s) has received non-investment banking related compensation from this company within the past year.
Important Disclosures Required by Non-U.S. Regulators
Please also refer to disclosures in the Important Disclosures Required by US Regulators and the Explanatory Notes.
7. Deutsche Bank and/or its affiliate(s) has received compensation from this company for the provision of investment banking or financial advisory services within the past year.
For disclosures pertaining to recommendations or estimates made on securities other than the primary subject of this research, please see the most recently published company report or visit our global disclosure look-up page on our website at http://gm.db.com/ger/disclosure/DisclosureDirectory.eqsr Analyst Certification
The views expressed in this report accurately reflect the personal views of the undersigned lead analyst about the subject issuers and the securities of those issuers. In addition, the undersigned lead analyst has not and will not receive any compensation for providing a specific recommendation or view in this report. Michael Tong
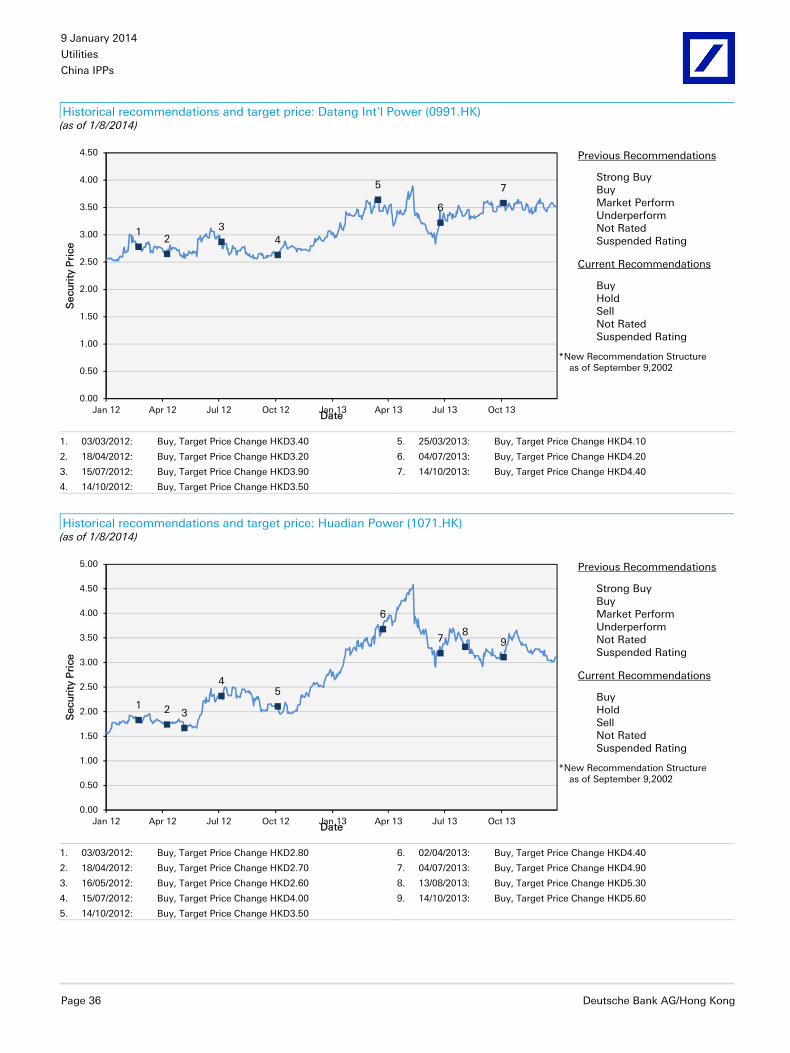
9 January 2014
Utilities
China IPPs
Page 36 Deutsche Bank AG/Hong Kong
Historical recommendations and target price: Datang Int'l Power (0991.HK) (as of 1/8/2014)
12
34
5
6
7
0.00
0.50
1.00
1.50
2.00
2.50
3.00
3.50
4.00
4.50
Jan 12 Apr 12 Jul 12 Oct 12 Jan 13 Apr 13 Jul 13 Oct 13
Sec
uri
ty P
rice
Date
Previous Recommendations
Strong Buy Buy Market Perform Underperform Not Rated Suspended Rating
Current Recommendations
Buy Hold Sell Not Rated Suspended Rating
*New Recommendation Structure as of September 9,2002
1. 03/03/2012: Buy, Target Price Change HKD3.40 5. 25/03/2013: Buy, Target Price Change HKD4.10
2. 18/04/2012: Buy, Target Price Change HKD3.20 6. 04/07/2013: Buy, Target Price Change HKD4.20
3. 15/07/2012: Buy, Target Price Change HKD3.90 7. 14/10/2013: Buy, Target Price Change HKD4.40
4. 14/10/2012: Buy, Target Price Change HKD3.50
Historical recommendations and target price: Huadian Power (1071.HK) (as of 1/8/2014)
1 2 3
45
6
78
9
0.00
0.50
1.00
1.50
2.00
2.50
3.00
3.50
4.00
4.50
5.00
Jan 12 Apr 12 Jul 12 Oct 12 Jan 13 Apr 13 Jul 13 Oct 13
Sec
uri
ty P
rice
Date
Previous Recommendations
Strong Buy Buy Market Perform Underperform Not Rated Suspended Rating
Current Recommendations
Buy Hold Sell Not Rated Suspended Rating
*New Recommendation Structure as of September 9,2002
1. 03/03/2012: Buy, Target Price Change HKD2.80 6. 02/04/2013: Buy, Target Price Change HKD4.40
2. 18/04/2012: Buy, Target Price Change HKD2.70 7. 04/07/2013: Buy, Target Price Change HKD4.90
3. 16/05/2012: Buy, Target Price Change HKD2.60 8. 13/08/2013: Buy, Target Price Change HKD5.30
4. 15/07/2012: Buy, Target Price Change HKD4.00 9. 14/10/2013: Buy, Target Price Change HKD5.60
5. 14/10/2012: Buy, Target Price Change HKD3.50
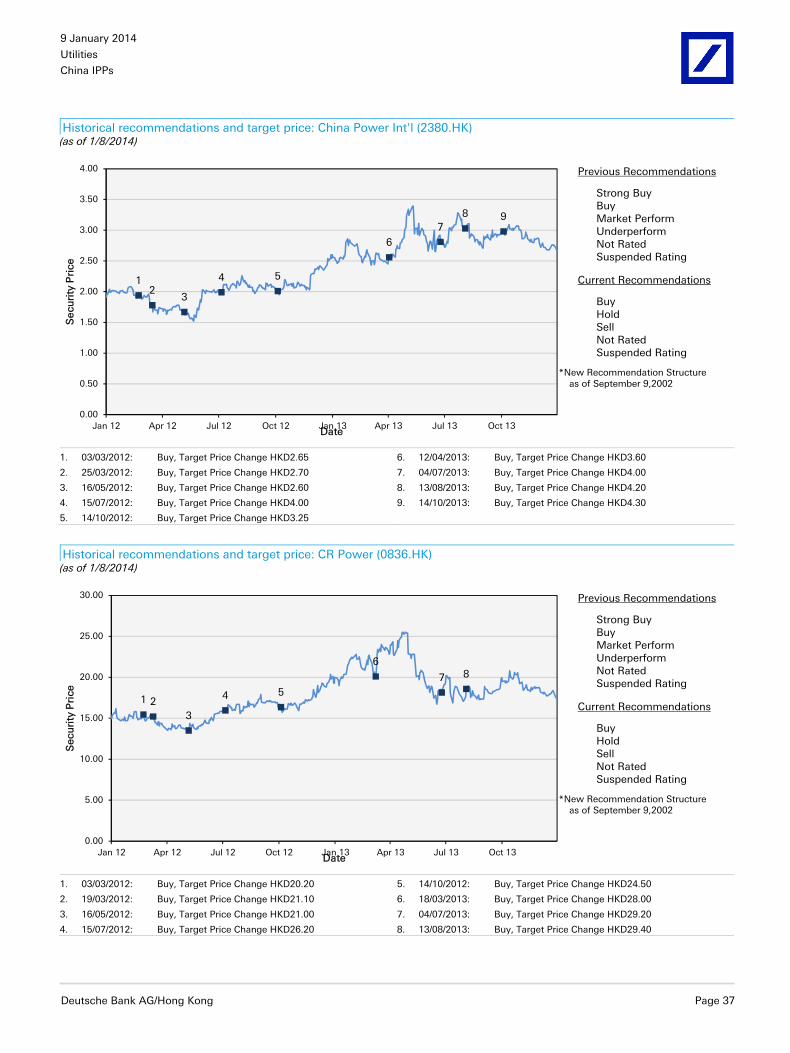
9 January 2014
Utilities
China IPPs
Deutsche Bank AG/Hong Kong Page 37
Historical recommendations and target price: China Power Int'l (2380.HK) (as of 1/8/2014)
12
3
4 5
6
78 9
0.00
0.50
1.00
1.50
2.00
2.50
3.00
3.50
4.00
Jan 12 Apr 12 Jul 12 Oct 12 Jan 13 Apr 13 Jul 13 Oct 13
Sec
uri
ty P
rice
Date
Previous Recommendations
Strong Buy Buy Market Perform Underperform Not Rated Suspended Rating
Current Recommendations
Buy Hold Sell Not Rated Suspended Rating
*New Recommendation Structure as of September 9,2002
1. 03/03/2012: Buy, Target Price Change HKD2.65 6. 12/04/2013: Buy, Target Price Change HKD3.60
2. 25/03/2012: Buy, Target Price Change HKD2.70 7. 04/07/2013: Buy, Target Price Change HKD4.00
3. 16/05/2012: Buy, Target Price Change HKD2.60 8. 13/08/2013: Buy, Target Price Change HKD4.20
4. 15/07/2012: Buy, Target Price Change HKD4.00 9. 14/10/2013: Buy, Target Price Change HKD4.30
5. 14/10/2012: Buy, Target Price Change HKD3.25
Historical recommendations and target price: CR Power (0836.HK) (as of 1/8/2014)
1 23
4 5
6
7 8
0.00
5.00
10.00
15.00
20.00
25.00
30.00
Jan 12 Apr 12 Jul 12 Oct 12 Jan 13 Apr 13 Jul 13 Oct 13
Sec
uri
ty P
rice
Date
Previous Recommendations
Strong Buy Buy Market Perform Underperform Not Rated Suspended Rating
Current Recommendations
Buy Hold Sell Not Rated Suspended Rating
*New Recommendation Structure as of September 9,2002
1. 03/03/2012: Buy, Target Price Change HKD20.20 5. 14/10/2012: Buy, Target Price Change HKD24.50
2. 19/03/2012: Buy, Target Price Change HKD21.10 6. 18/03/2013: Buy, Target Price Change HKD28.00
3. 16/05/2012: Buy, Target Price Change HKD21.00 7. 04/07/2013: Buy, Target Price Change HKD29.20
4. 15/07/2012: Buy, Target Price Change HKD26.20 8. 13/08/2013: Buy, Target Price Change HKD29.40

9 January 2014
Utilities
China IPPs
Page 38 Deutsche Bank AG/Hong Kong
Historical recommendations and target price: Huaneng Power Intl (0902.HK) (as of 1/8/2014)
12
3 4
5 67 8
0.00
2.00
4.00
6.00
8.00
10.00
12.00
Jan 12 Apr 12 Jul 12 Oct 12 Jan 13 Apr 13 Jul 13 Oct 13
Sec
uri
ty P
rice
Date
Previous Recommendations
Strong Buy Buy Market Perform Underperform Not Rated Suspended Rating
Current Recommendations
Buy Hold Sell Not Rated Suspended Rating
*New Recommendation Structure as of September 9,2002
1. 03/03/2012: Buy, Target Price Change HKD6.30 5. 19/03/2013: Buy, Target Price Change HKD9.70
2. 18/04/2012: Buy, Target Price Change HKD6.20 6. 04/07/2013: Buy, Target Price Change HKD10.60
3. 15/07/2012: Buy, Target Price Change HKD8.80 7. 13/08/2013: Buy, Target Price Change HKD10.90
4. 14/10/2012: Buy, Target Price Change HKD8.60 8. 14/10/2013: Buy, Target Price Change HKD12.10
Equity rating key Equity rating dispersion and banking relationships
Buy: Based on a current 12- month view of total share-holder return (TSR = percentage change in share price from current price to projected target price plus pro-jected dividend yield ) , we recommend that investors buy the stock. Sell: Based on a current 12-month view of total share-holder return, we recommend that investors sell the stock Hold: We take a neutral view on the stock 12-months out and, based on this time horizon, do not recommend either a Buy or Sell. Notes:
1. Newly issued research recommendations and target prices always supersede previously published research. 2. Ratings definitions prior to 27 January, 2007 were:
Buy: Expected total return (including dividends) of 10% or more over a 12-month period Hold: Expected total return (including dividends) between -10% and 10% over a 12-month period Sell: Expected total return (including dividends) of -10% or worse over a 12-month period
56 %
37 %
8 %27 %
22 %12 %
050
100150200250300350400450
Buy Hold Sell
Asia-Pacific Universe
Companies Covered Cos. w/ Banking Relationship

9 January 2014
Utilities
China IPPs
Deutsche Bank AG/Hong Kong Page 39
Regulatory Disclosures
1. Important Additional Conflict Disclosures
Aside from within this report, important conflict disclosures can also be found at https://gm.db.com/equities under the "Disclosures Lookup" and "Legal" tabs. Investors are strongly encouraged to review this information before investing.
2. Short-Term Trade Ideas
Deutsche Bank equity research analysts sometimes have shorter-term trade ideas (known as SOLAR ideas) that are consistent or inconsistent with Deutsche Bank's existing longer term ratings. These trade ideas can be found at the SOLAR link at http://gm.db.com.
3. Country-Specific Disclosures
Australia and New Zealand: This research, and any access to it, is intended only for "wholesale clients" within the meaning of the Australian Corporations Act and New Zealand Financial Advisors Act respectively. Brazil: The views expressed above accurately reflect personal views of the authors about the subject company(ies) and its(their) securities, including in relation to Deutsche Bank. The compensation of the equity research analyst(s) is indirectly affected by revenues deriving from the business and financial transactions of Deutsche Bank. In cases where at least one Brazil based analyst (identified by a phone number starting with +55 country code) has taken part in the preparation of this research report, the Brazil based analyst whose name appears first assumes primary responsibility for its content from a Brazilian regulatory perspective and for its compliance with CVM Instruction # 483. EU countries: Disclosures relating to our obligations under MiFiD can be found at http://www.globalmarkets.db.com/riskdisclosures. Japan: Disclosures under the Financial Instruments and Exchange Law: Company name - Deutsche Securities Inc. Registration number - Registered as a financial instruments dealer by the Head of the Kanto Local Finance Bureau (Kinsho) No. 117. Member of associations: JSDA, Type II Financial Instruments Firms Association, The Financial Futures Association of Japan, Japan Investment Advisers Association. Commissions and risks involved in stock transactions - for stock transactions, we charge stock commissions and consumption tax by multiplying the transaction amount by the commission rate agreed with each customer. Stock transactions can lead to losses as a result of share price fluctuations and other factors. Transactions in foreign stocks can lead to additional losses stemming from foreign exchange fluctuations. "Moody's", "Standard & Poor's", and "Fitch" mentioned in this report are not registered credit rating agencies in Japan unless “Japan” or "Nippon" is specifically designated in the name of the entity. Reports on Japanese listed companies not written by analysts of Deutsche Securities Inc. (DSI) are written by Deutsche Bank Group's analysts with the coverage companies specified by DSI. Russia: This information, interpretation and opinions submitted herein are not in the context of, and do not constitute, any appraisal or evaluation activity requiring a license in the Russian Federation.
GRCM2014PROD031107
David Folkerts-Landau
Group Chief Economist Member of the Group Executive Committee
Guy Ashton
Global Chief Operating Officer Research
Marcel Cassard Global Head
FICC Research & Global Macro Economics
Richard Smith and Steve Pollard Co-Global Heads Equity Research
Michael Spencer Regional Head
Asia Pacific Research
Ralf Hoffmann Regional Head
Deutsche Bank Research, Germany
Andreas Neubauer Regional Head
Equity Research, Germany
Steve Pollard Regional Head
Americas Research
International locations
Deutsche Bank AG Deutsche Bank Place Level 16 Corner of Hunter & Phillip Streets Sydney, NSW 2000 Australia Tel: (61) 2 8258 1234
Deutsche Bank AG Große Gallusstraße 10-14 60272 Frankfurt am Main Germany Tel: (49) 69 910 00
Deutsche Bank AG Filiale Hongkong International Commerce Centre, 1 Austin Road West,Kowloon, Hong Kong Tel: (852) 2203 8888
Deutsche Securities Inc. 2-11-1 Nagatacho Sanno Park Tower Chiyoda-ku, Tokyo 100-6171 Japan Tel: (81) 3 5156 6770
Deutsche Bank AG London 1 Great Winchester Street London EC2N 2EQ United Kingdom Tel: (44) 20 7545 8000
Deutsche Bank Securities Inc. 60 Wall Street New York, NY 10005 United States of America Tel: (1) 212 250 2500
Global Disclaimer The information and opinions in this report were prepared by Deutsche Bank AG or one of its affiliates (collectively "Deutsche Bank"). The information herein is believed to be reliable and has been obtained from public sources believed to be reliable. Deutsche Bank makes no representation as to the accuracy or completeness of such information.
Deutsche Bank may engage in securities transactions, on a proprietary basis or otherwise, in a manner inconsistent with the view taken in this research report. In addition, others within Deutsche Bank, including strategists and sales staff, may take a view that is inconsistent with that taken in this research report.
Opinions, estimates and projections in this report constitute the current judgement of the author as of the date of this report. They do not necessarily reflect the opinions of Deutsche Bank and are subject to change without notice. Deutsche Bank has no obligation to update, modify or amend this report or to otherwise notify a recipient thereof in the event that any opinion, forecast or estimate set forth herein, changes or subsequently becomes inaccurate. Prices and availability of financial instruments are subject to change without notice. This report is provided for informational purposes only. It is not an offer or a solicitation of an offer to buy or sell any financial instruments or to participate in any particular trading strategy. Target prices are inherently imprecise and a product of the analyst judgement.
As a result of Deutsche Bank’s March 2010 acquisition of BHF-Bank AG, a security may be covered by more than one analyst within the Deutsche Bank group. Each of these analysts may use differing methodologies to value the security; as a result, the recommendations may differ and the price targets and estimates of each may vary widely.
In August 2009, Deutsche Bank instituted a new policy whereby analysts may choose not to set or maintain a target price of certain issuers under coverage with a Hold rating. In particular, this will typically occur for "Hold" rated stocks having a market cap smaller than most other companies in its sector or region. We believe that such policy will allow us to make best use of our resources. Please visit our website at http://gm.db.com to determine the target price of any stock.
The financial instruments discussed in this report may not be suitable for all investors and investors must make their own informed investment decisions. Stock transactions can lead to losses as a result of price fluctuations and other factors. If a financial instrument is denominated in a currency other than an investor's currency, a change in exchange rates may adversely affect the investment. Past performance is not necessarily indicative of future results. Deutsche Bank may with respect to securities covered by this report, sell to or buy from customers on a principal basis, and consider this report in deciding to trade on a proprietary basis.
Unless governing law provides otherwise, all transactions should be executed through the Deutsche Bank entity in the investor's home jurisdiction. In the U.S. this report is approved and/or distributed by Deutsche Bank Securities Inc., a member of the NYSE, the NASD, NFA and SIPC. In Germany this report is approved and/or communicated by Deutsche Bank AG Frankfurt authorized by the BaFin. In the United Kingdom this report is approved and/or communicated by Deutsche Bank AG London, a member of the London Stock Exchange and regulated by the Financial Conduct Authority for the conduct of investment business in the UK and authorized by the BaFin. This report is distributed in Hong Kong by Deutsche Bank AG, Hong Kong Branch, in Korea by Deutsche Securities Korea Co. This report is distributed in Singapore by Deutsche Bank AG, Singapore Branch or Deutsche Securities Asia Limited, Singapore Branch (One Raffles Quay #18-00 South Tower Singapore 048583, +65 6423 8001), and recipients in Singapore of this report are to contact Deutsche Bank AG, Singapore Branch or Deutsche Securities Asia Limited, Singapore Branch in respect of any matters arising from, or in connection with, this report. Where this report is issued or promulgated in Singapore to a person who is not an accredited investor, expert investor or institutional investor (as defined in the applicable Singapore laws and regulations), Deutsche Bank AG, Singapore Branch or Deutsche Securities Asia Limited, Singapore Branch accepts legal responsibility to such person for the contents of this report. In Japan this report is approved and/or distributed by Deutsche Securities Inc. The information contained in this report does not constitute the provision of investment advice. In Australia, retail clients should obtain a copy of a Product Disclosure Statement (PDS) relating to any financial product referred to in this report and consider the PDS before making any decision about whether to acquire the product. Deutsche Bank AG Johannesburg is incorporated in the Federal Republic of Germany (Branch Register Number in South Africa: 1998/003298/10). Additional information relative to securities, other financial products or issuers discussed in this report is available upon request. This report may not be reproduced, distributed or published by any person for any purpose without Deutsche Bank's prior written consent. Please cite source when quoting.
Copyright © 2014 Deutsche Bank AG