China 2020: The Birth of a Financial Superpower · China into a financial superpower by 2020...
14
China 2020: The Birth of a Financial Superpower October 2015 From the plunge in the stock market to the unprecedented government intervention, China has rarely been out of the headlines over the past six months. This paper will look beyond the headlines and examine the fundamentals and expected reforms that we believe will propel China into a financial superpower by 2020 including the liberalization of the renminbi, opening up of the onshore bond market and greater accessibility and foreign participation in the country’s stock markets.
Transcript of China 2020: The Birth of a Financial Superpower · China into a financial superpower by 2020...

China 2020: The Birth of a Financial Superpower
October 2015
From the plunge in the stock market to the unprecedented government intervention, China has rarely been out of the headlines over the past six months. This paper will look beyond the headlines and examine the fundamentals and expected reforms that we believe will propel China into a financial superpower by 2020 including the liberalization of the renminbi, opening up of the onshore bond market and greater accessibility and foreign participation in the country’s stock markets.
2 PINEBRIDGE INVESTMENTS
For many international money managers, investing in China is a risky proposition. The recent plunge in the country’s stock market, along with the government’s subsequent heavy intervention, both serve to support this attitude. Furthermore, foreign investors still enjoy limited access to the local markets.
However, we believe it is important, to see past the immediate noise and look at China with a more long-term perspective. At PineBridge Investments, we believe that the pace and trajectory of Beijing’s reform program, if maintained, puts the country on track to become a financial superpower by 2020. The process might not be a smooth one, but at the end of the decade Shanghai could rival London and New York as one of the world’s preeminent financial hubs.
Arthur Lau, CFA, CMA, CPA
Managing Director,
Co-Head of Emerging Markets Fixed
Income,
Head of Asia ex Japan Fixed Income
PineBridge Investments, Hong Kong
Desmond Tjiang, CFA
Portfolio Manager,
Hong Kong & Greater China Equities
PineBridge Investments, Hong Kong
Andy Suen, CFA, FRM
Senior Credit Analyst,
Assistant Portfolio Manager,
Emerging Markets Fixed Income
PineBridge Investments, Hong Kong
Dennis Lam, CFA, FRM
Senior Investment Analyst,
Assistant Porfolio Manager,
Hong Kong & China Equities
PineBridge Investments, Hong Kong
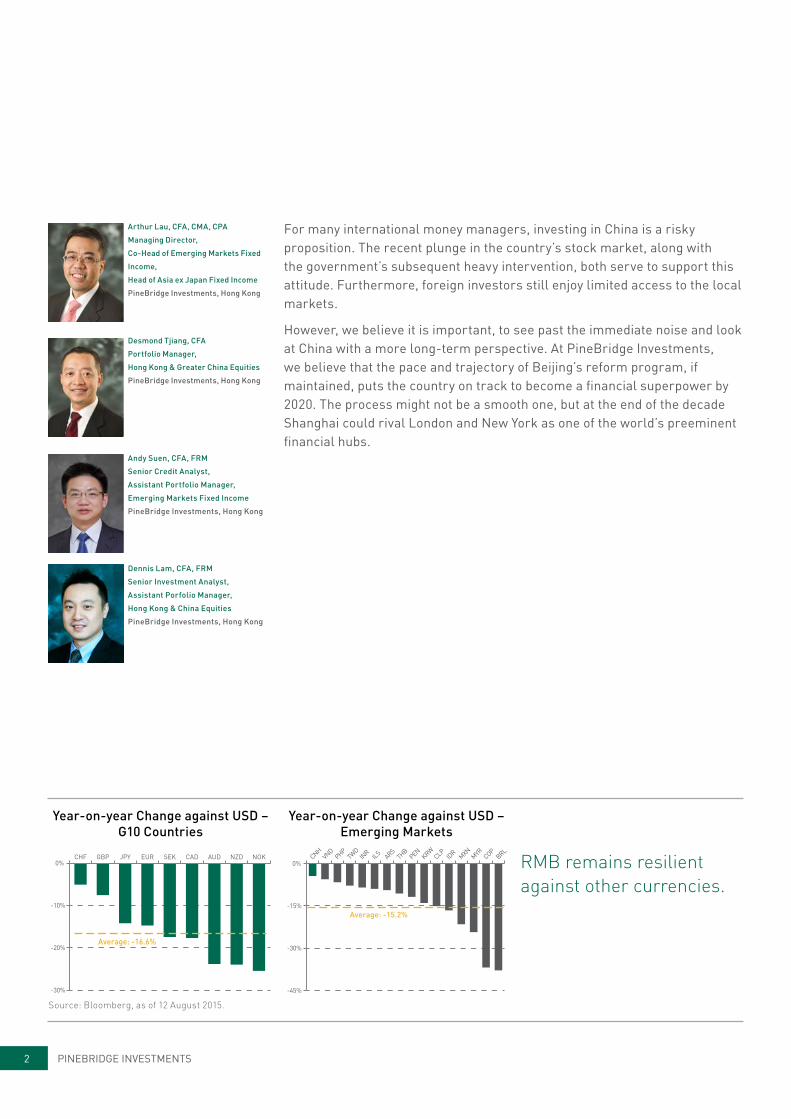
RMB remains resilient against other currencies.
Year-on-year Change against USD – Emerging Markets
Source: Bloomberg, as of 12 August 2015.
Year-on-year Change against USD – G10 Countries
0%
50%
100%
150%
200%
US Japan Taiwan China
% M
arke
t cap
to G
DP 145%
90%
182%
64%
USD
bill
ion
59%34%
15%
40% 36%2% 44% 38% 31%
20% 43% 24%10% 38%
0
20
40
60
80
100
120
140
160
MXN BRL KRW PLN TRY CNY% of outstanding government bonds
MYR IDR ZAR THB HUF RUB PHP PEN
0%
10%
20%
30%
40%
50%
60%
70%
80%
90%
100%
Q12011
Q22011
Q32011
Q42011
Q12012
Q22012
Q32012
Q42012
Q12013
Q22013
Q32013
Q42013
Q12014
Q22014
Q32014
Q42014
OthersCHFAUDCADGBPJPYEURUSD
Others, 3%,with RMBestimated toaccount forless than 1%
EUR, 22%
USD, 63%
-0.5
0.0
0.5
1.0
1.5
2.0
2.5
3.0
3.5
4.0
4.5
0 5 10 15 20 25 30 35
Yiel
d (%
)
Maturity (Years)
CGB
UST
JGBBUND
GILT
-30%
-25%
-20%
-15%
-10%
-5%
0%CHF GBP JPY EUR SEK CAD AUD NZD NOK
Average: -16.6%
Average: -15.2%
-45%
-40%
-35%
-30%
-25%
-20%
-15%
-10%
-5%
0% KRWPENTHBARSILSINRTWD BRL
COPMYR
MXNIDRCLPPHP
VNDCNH
-30%
-20%
-10%
0%CHF GBP JPY EUR SEK CAD AUD NZD NOK
Average: -16.6%
CNH VND PHP TWD INR ILS ARS THB PEN KRW CLP IDR MXN MYR COP BRL
-45%
-30%
-15%
0%
Average: -15.2%
-30%
-20%
-10%
0%CHF GBP JPY EUR SEK CAD AUD NZD NOK
Average: -16.6%
CNHVN
DPHP
TWD
INR
ILS ARSTH
BPEN
KRWCLP
IDR MXN MYR COPBRL
-45%
-30%
-15%
0%
Average: -15.2%
AAA
CGB
AA
Yiel
d (%
)
Maturity (Years)
0
1
2
3
4
5
6
0 2 4 6 8 10 12
10%
20%
30%
40%
50%
60%
70%61%
39%
0.3%0%
AAA AA A+ or below
0%
50%
100%
150%
200%
US Japan Taiwan China
% M
arke
t cap
to G
DP 145%
90%
182%
64%
USD
bill
ion
59%34%
15%
40% 36%2% 44% 38% 31%
20% 43% 24%10% 38%
0
20
40
60
80
100
120
140
160
MXN BRL KRW PLN TRY CNY% of outstanding government bonds
MYR IDR ZAR THB HUF RUB PHP PEN
0%
10%
20%
30%
40%
50%
60%
70%
80%
90%
100%
Q12011
Q22011
Q32011
Q42011
Q12012
Q22012
Q32012
Q42012
Q12013
Q22013
Q32013
Q42013
Q12014
Q22014
Q32014
Q42014
OthersCHFAUDCADGBPJPYEURUSD
Others, 3%,with RMBestimated toaccount forless than 1%
EUR, 22%
USD, 63%
-0.5
0.0
0.5
1.0
1.5
2.0
2.5
3.0
3.5
4.0
4.5
0 5 10 15 20 25 30 35
Yiel
d (%
)
Maturity (Years)
CGB
UST
JGBBUND
GILT
-30%
-25%
-20%
-15%
-10%
-5%
0%CHF GBP JPY EUR SEK CAD AUD NZD NOK
Average: -16.6%
Average: -15.2%
-45%
-40%
-35%
-30%
-25%
-20%
-15%
-10%
-5%
0% KRWPENTHBARSILSINRTWD BRL
COPMYR
MXNIDRCLPPHP
VNDCNH
-30%
-20%
-10%
0%CHF GBP JPY EUR SEK CAD AUD NZD NOK
Average: -16.6%
CNH VND PHP TWD INR ILS ARS THB PEN KRW CLP IDR MXN MYR COP BRL
-45%
-30%
-15%
0%
Average: -15.2%
-30%
-20%
-10%
0%CHF GBP JPY EUR SEK CAD AUD NZD NOK
Average: -16.6%
CNHVN
DPHP
TWD
INR
ILS ARSTH
BPEN
KRWCLP
IDR MXN MYR COPBRL
-45%
-30%
-15%
0%
Average: -15.2%
AAA
CGB
AA
Yiel
d (%
)
Maturity (Years)
0
1
2
3
4
5
6
0 2 4 6 8 10 12
10%
20%
30%
40%
50%
60%
70%61%
39%
0.3%0%
AAA AA A+ or below

3CHINA 2020
2020: Renminbi becomes a reserve currency The process to internationalize the renminbi (RMB) has come a long way since an offshore market was created for the currency in 2003. Its use overseas has accelerated in recent years, with the balance of offshore RMB deposits reaching RMB2.0trn (US$320bn) at the end of 2014, according to the People’s Bank of China (PBoC).
The growing importance of the RMB reflects China’s increased significance in global trade: it is now the fifth most used currency in trade payments, as well as the ninth most actively traded currency according to data from SWIFT1 and the Bank for International Settlements2.
The PBoC is also guiding the currency towards a more market-oriented pricing mechanism. Some commentators have viewed the recent volatility in the daily fixing of the RMB as the prelude to a potential structural devaluation. We do not think this is the case, since the RMB still remains very resilient against other currencies. It depreciated just 4.6% against the US dollar in the year ending August 31st, while G10 currencies on average fell 17% against the dollar over the same period. Emerging markets currencies lost an average of 15% against the dollar3.
While a market-based mechanism necessarily implies higher volatility in the short-term, we believe the RMB will be supported over the medium term by China’s above-average economic growth rate and a strong current account position.
In addition, China is bidding for the RMB to be included in the International Monetary Fund’s Special Drawing Rights (SDR) – an international reserve asset, the value of which is derived from four major currencies4. Beijing is actively pressing for the RMB’s inclusion into the SDR basket, and the current Premier Li Keqiang, as well as his predecessors, have made it abundantly clear that China will accelerate financial reforms in order to meet the inclusion criteria.
The RMB could achieve reserve currency status as soon as 2016, and this would likely result in a further relaxation of China’s capital account, which would in turn pave the way for increased foreign investment into its domestic stock and bond markets.
1 Source: SWIFT. The Renminbi is the second most used currency for cross border payments with China and Hong Kong. As of June 2014.
2 Source: Bank for International Settlements. Foreign Exchange Turnover in April 2013: Preliminary Global Results (page 5). As of September 2013.
3 Source: Bloomberg data as of 31 August 2015.4 Source: International Monetary Fund. Factsheet
– Special Drawing Rights (SDRS). As of 31 August 2015.
China’s domestic stock market is the largest in the world.
http://www.swift.com/assets/swift_com/documents/products_services/RMB_tracker_June2014_SDC_final.pdf
http://www.swift.com/assets/swift_com/documents/products_services/RMB_tracker_June2014_SDC_final.pdf

4 PINEBRIDGE INVESTMENTS
2020: Chinese equities – The world’s most liquid asset class China’s domestic stock market, known as the A-share market, is the second largest equity market in the world and the largest by turnover5. While Hong Kong’s H-share market is already a popular venue for foreign investors to gain exposure to China, the A-share market is in many ways more attractive since it has more listed companies in a wider range of industries – especially with regards to privately-owned companies in high-growth sectors such as healthcare, media, and information technology.
Access to the A-share market has traditionally been limited to a group of foreign investors who participate in the Qualified Foreign Institutional Investors (QFII) program. The situation changed late last year, when China launched the Shanghai–Hong Kong Stock Connect program, which gave all international investors access to a selection of Shanghai-listed A-shares through Hong Kong-based brokers and clearing houses.
Senior government officials have repeatedly emphasized that the quotas for the Stock Connect program could be relaxed and eventually eliminated altogether, which could allow for foreign investors to invest even more into local stocks.
The next step in China’s opening of its capital account recently came in the form of the Mainland–Hong Kong Mutual Recognition of Funds Program (MRF), which was announced in May by the Hong Kong Securities and Futures Commission (SFC) and the China Securities Regulatory Commission (CSRC). The MRF program allows Hong Kong-domiciled offshore funds to be distributed directly to investors in China, and qualifying Chinese funds to be distributed in Hong Kong. Qualifying funds are expected to include general equity funds, bond funds, mixed funds, unlisted index funds, and physical index-tracking ETFs.
Initially, the MRF program is capped by a RMB300bn (US$47bn) quota in both Hong Kong and China. We consider the program as a major milestone as it offers overseas investors, especially retail investors, an additional investment channel into the China onshore markets through lower-risk fund and ETF products, which could nurture experience and greater familiarity of the A-share market for international investors, paving the way for the full liberalization of China’s financial markets in the future.
Another landmark for Chinese stocks would be the inclusion of A-shares into major indices. At the June 2015 review and following much speculation, MSCI opted not to include A-shares in its benchmarks. However, the China Securities Regulatory Commission and MSCI have set up a working group to resolve together the outstanding issues for the inclusion of A-shares – which includes quota allocation, beneficial ownership, and capital mobility restrictions.
5 Source: Bloomberg, calculation based on 2015 YTD until 31st August.
6 Source: Goldman Sachs estimates.
5CHINA 2020
Chinese regulators have already taken meaningful steps to improve foreign investors’ accessibility to the A-share market, and given the effort and willingness shown by both MSCI and CSRC, we believe the inclusion of A-shares into MSCI indices could happen as early as 2017. While there is no precise way to gauge the potential impact that this would have on A-share flows, we expect to see at least US$100bn of net inflows into the A-share market in the decade following MSCI index inclusion. We believe this will happen as a result of large global funds – many of which currently have no exposure in the A-share market – are required to take a stake when A-shares form part of the MSCI indices.
More importantly, MSCI’s inclusion of A-shares could trigger greater understanding and broader foreign participation into the largest and most liquid RMB asset class in the world, especially as the RMB is expected to concurrently achieve the status of a major investable reserve currency.
While foreign investors only hold around 2.8% of the total A-share market cap as at March 20156, we believe it will gradually increase to a level between 20% and 30%, which would put it on a par with foreign ownership seen in other Asian markets – such as Korea, Taiwan and India.
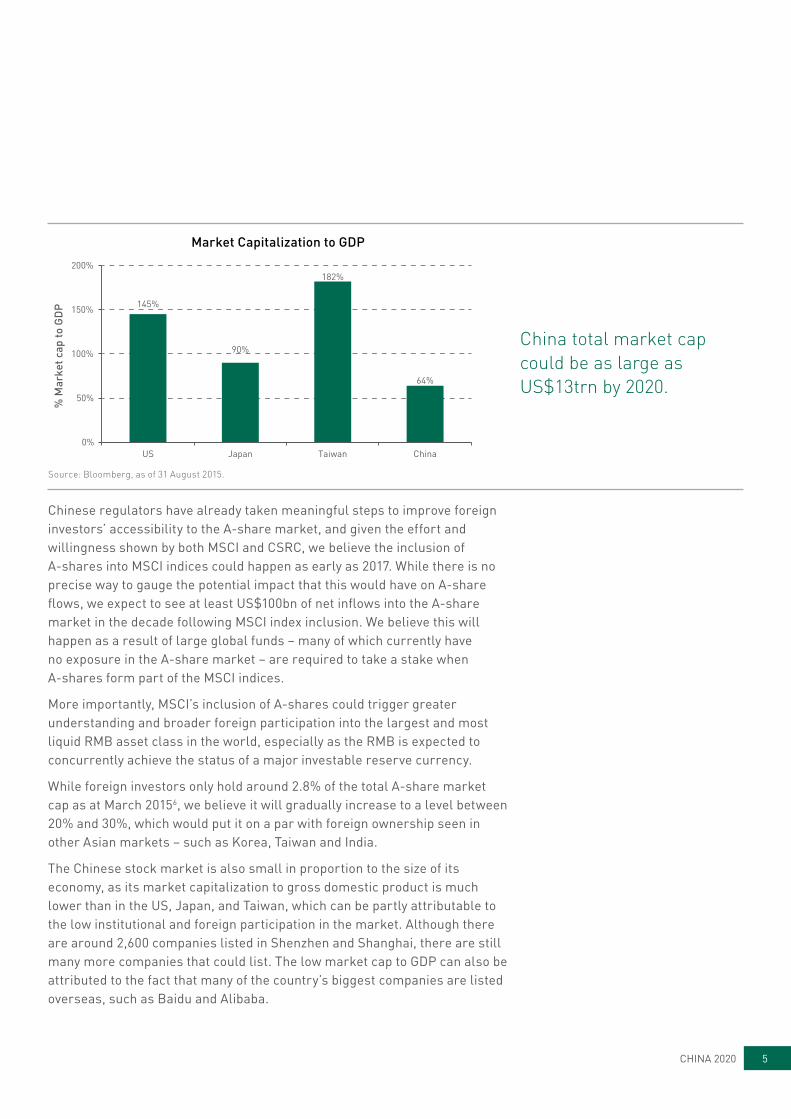
The Chinese stock market is also small in proportion to the size of its economy, as its market capitalization to gross domestic product is much lower than in the US, Japan, and Taiwan, which can be partly attributable to the low institutional and foreign participation in the market. Although there are around 2,600 companies listed in Shenzhen and Shanghai, there are still many more companies that could list. The low market cap to GDP can also be attributed to the fact that many of the country’s biggest companies are listed overseas, such as Baidu and Alibaba.
Market Capitalization to GDP
0%
50%
100%
150%
200%
US Japan Taiwan China
% M
arke
t cap
to G
DP 145%
90%
182%
64%
USD
bill
ion
59%34%
15%
40% 36%2% 44% 38% 31%
20% 43% 24%10% 38%
0
20
40
60
80
100
120
140
160
MXN BRL KRW PLN TRY CNY% of outstanding government bonds
MYR IDR ZAR THB HUF RUB PHP PEN
0%
10%
20%
30%
40%
50%
60%
70%
80%
90%
100%
Q12011
Q22011
Q32011
Q42011
Q12012
Q22012
Q32012
Q42012
Q12013
Q22013
Q32013
Q42013
Q12014
Q22014
Q32014
Q42014
OthersCHFAUDCADGBPJPYEURUSD
Others, 3%,with RMBestimated toaccount forless than 1%
EUR, 22%
USD, 63%
-0.5
0.0
0.5
1.0
1.5
2.0
2.5
3.0
3.5
4.0
4.5
0 5 10 15 20 25 30 35
Yiel
d (%
)
Maturity (Years)
CGB
UST
JGBBUND
GILT
-30%
-25%
-20%
-15%
-10%
-5%
0%CHF GBP JPY EUR SEK CAD AUD NZD NOK
Average: -16.6%
Average: -15.2%
-45%
-40%
-35%
-30%
-25%
-20%
-15%
-10%
-5%
0% KRWPENTHBARSILSINRTWD BRL
COPMYR
MXNIDRCLPPHP
VNDCNH
-30%
-20%
-10%
0%CHF GBP JPY EUR SEK CAD AUD NZD NOK
Average: -16.6%
CNH VND PHP TWD INR ILS ARS THB PEN KRW CLP IDR MXN MYR COP BRL
-45%
-30%
-15%
0%
Average: -15.2%
-30%
-20%
-10%
0%CHF GBP JPY EUR SEK CAD AUD NZD NOK
Average: -16.6%
CNHVN
DPHP
TWD
INR
ILS ARSTH
BPEN
KRWCLP
IDR MXN MYR COPBRL
-45%
-30%
-15%
0%
Average: -15.2%
AAA
CGB
AA
Yiel
d (%
)
Maturity (Years)
0
1
2
3
4
5
6
0 2 4 6 8 10 12
10%
20%
30%
40%
50%
60%
70%61%
39%
0.3%0%
AAA AA A+ or below
Source: Bloomberg, as of 31 August 2015.
China total market cap could be as large as US$13trn by 2020.

6 PINEBRIDGE INVESTMENTS
With greater accessibility and increased foreign participation, we believe China’s total market cap could increase further towards US$13trn by 2020. By then, the A-share market could also become an important source of RMB financing for foreign companies, which could potentially make Shanghai an alternative to London and New York for companies looking to raise capital.
On the economic front, many foreign investors remain concerned that China could suffer a hard landing, although our view remains that a sharp slowdown of the Chinese economy is unlikely. President Xi Jinping’s administration has already rolled out a number of policy initiatives to stabilize the economy and reduce the chance of tail risks as it shifts away from its traditional investment-driven growth model, towards one where services and consumption takes a greater role. The transition is evident in data that shows slowing credit growth and fixed asset investment. Monetary easing is also helping to reduce the overall interest burden on the economy.
The One Belt One Road strategy also has the potential to export some of China’s overcapacity to other countries – especially in the materials and machinery sectors – while increasing the awareness and demand for Chinese brands and products. The “Made in China 2025” and “Internet+” initiatives provide a roadmap for the next leg of economic growth over the medium term.
So while China’s GDP growth is expected to decelerate, all of these policy initiatives should reduce the overall risk in the economy. This will lead to more sustainable growth over the medium term, which will make Chinese stocks a more attractive investment.

7CHINA 2020
2020: Foreign ownership of onshore bonds to doubleChina’s onshore bond market has grown dramatically over the past decade, at a compound annual growth rate of 21%, to reach RMB39.5trn (US$6.4trn) as of June 2015 according to the PBoC – making it the world’s third largest, trailing only the US and Japan7.
While large in absolute size, China’s bond market is like its equity market in that it is small compared to its economy - equivalent to only a modest 56% of national GDP. The markets in the US and Japan are equal to more than twice the size of their respective economies. We expect the growth in China to remain fast-paced and that the total market size will more than double to RMB90trn (US$14trn8) by 2020.
The bond market has played a critical role in the implementation of the government’s macroeconomic policies and financial reforms – one notable example is the ongoing local government debt swap program that was launched in March 2015. We believe policymakers will continue to develop a deeper and more efficient market, which will provide numerous economic benefits. A healthy bond market will reduce the current overreliance on the banking system for credit, it will improve the pricing of credit risk, while at the same time it will impose discipline on local governments and state-owned companies.
We believe the easiest way for global investors to get RMB bond exposure is via the offshore RMB (i.e., CNH) bond market, which had a size of RMB672bn (US$108bn) as of end-2014. We believe the momentum of RMB internationalization will continue to fuel the growth of the CNH bond market as more multinationals issue RMB bonds and Chinese firms diversify their investor base.
7 Source: Bank for International Settlements data.8 The estimate is based on assumptions of
1.5% annual fiscal deficit funded by Chinese Government Bonds, RMB14trn (US$2.2trn) municipal bond issuances and credit bond issuance to grow at 20%+ p.a. in the next five years.
Source: Standard Chartered as of end 2014.
Foreign ownership of EM government bondsAs end of 2014, USD bn, % of outstanding government bonds
0%
50%
100%
150%
200%
US Japan Taiwan China
% M
arke
t cap
to G
DP 145%
90%
182%
64%
USD
bill
ion
59%34%
15%
40% 36%2% 44% 38% 31%
20% 43% 24%10% 38%
0
20
40
60
80
100
120
140
160
MXN BRL KRW PLN TRY CNY% of outstanding government bonds
MYR IDR ZAR THB HUF RUB PHP PEN
0%
10%
20%
30%
40%
50%
60%
70%
80%
90%
100%
Q12011
Q22011
Q32011
Q42011
Q12012
Q22012
Q32012
Q42012
Q12013
Q22013
Q32013
Q42013
Q12014
Q22014
Q32014
Q42014
OthersCHFAUDCADGBPJPYEURUSD
Others, 3%,with RMBestimated toaccount forless than 1%
EUR, 22%
USD, 63%
-0.5
0.0
0.5
1.0
1.5
2.0
2.5
3.0
3.5
4.0
4.5
0 5 10 15 20 25 30 35
Yiel
d (%
)
Maturity (Years)
CGB
UST
JGBBUND
GILT
-30%
-25%
-20%
-15%
-10%
-5%
0%CHF GBP JPY EUR SEK CAD AUD NZD NOK
Average: -16.6%
Average: -15.2%
-45%
-40%
-35%
-30%
-25%
-20%
-15%
-10%
-5%
0% KRWPENTHBARSILSINRTWD BRL
COPMYR
MXNIDRCLPPHP
VNDCNH
-30%
-20%
-10%
0%CHF GBP JPY EUR SEK CAD AUD NZD NOK
Average: -16.6%
CNH VND PHP TWD INR ILS ARS THB PEN KRW CLP IDR MXN MYR COP BRL
-45%
-30%
-15%
0%
Average: -15.2%
-30%
-20%
-10%
0%CHF GBP JPY EUR SEK CAD AUD NZD NOK
Average: -16.6%
CNHVN
DPHP
TWD
INR
ILS ARSTH
BPEN
KRWCLP
IDR MXN MYR COPBRL
-45%
-30%
-15%
0%
Average: -15.2%
AAA
CGB
AA
Yiel
d (%
)
Maturity (Years)
0
1
2
3
4
5
6
0 2 4 6 8 10 12
10%
20%
30%
40%
50%
60%
70%61%
39%
0.3%0%
AAA AA A+ or below
Foreign ownership of China onshore bonds to double by 2020.

8 PINEBRIDGE INVESTMENTS
Nevertheless, the size of the onshore bond market dwarfs the offshore one and the further opening up of the onshore market is an essential step for RMB internationalization. Currently, foreign investors can access the onshore bond market via two schemes: firstly the QFII program launched in 2002 and its extension RMB QFII (RQFII) launched in 2011; and secondly, the PBoC’s interbank bond market program launched in 2010 that is applicable to six different kinds of investors – central banks, sovereign wealth funds, clearing banks, settlement banks, multinationals and insurance companies.
Since the launch of these programs, accessibility has gradually increased, as quotas on both the QFII and RQFII programs have grown in size. In July 2015, the PBoC significantly increased flexibility in the interbank bond market program by allowing participants to make investments via a filing process, instead of a pre-approval process. Over the long-term, we believe that the quota system is a temporary arrangement that will exist until the RMB reaches full convertibility. We also expect that the PBoC’s interbank bond market program will be expanded to cover a broader range of investors over time.
Essentially, our view is that the current restrictions to access will be substantially loosened over the coming years, in line with the fast pace of RMB internationalization.
As of the first quarter of 2015, foreign investors owned RMB713bn9 (US$111bn) worth of onshore bonds, of which RMB235bn10 (US$38bn) was in Chinese government bonds (CGBs). This is small in percentage terms, with foreign ownership merely 2.0% of the onshore bond market and 2.8% of CGBs. This percentage is low when compared to other major economies – for example, foreign bond ownership in Malaysia and Indonesia is 44% and 38% respectively.
Source: IMF, PineBridge Investments as of 22 September 2015
Currency Composition of Global Official Foreign Exchange Reserves
0%
50%
100%
150%
200%
US Japan Taiwan China
% M
arke
t cap
to G
DP 145%
90%
182%
64%
USD
bill
ion
59%34%
15%
40% 36%2% 44% 38% 31%
20% 43% 24%10% 38%
0
20
40
60
80
100
120
140
160
MXN BRL KRW PLN TRY CNY% of outstanding government bonds
MYR IDR ZAR THB HUF RUB PHP PEN
0%
10%
20%
30%
40%
50%
60%
70%
80%
90%
100%
Q12011
Q22011
Q32011
Q42011
Q12012
Q22012
Q32012
Q42012
Q12013
Q22013
Q32013
Q42013
Q12014
Q22014
Q32014
Q42014
OthersCHFAUDCADGBPJPYEURUSD
Others, 3%,with RMBestimated toaccount forless than 1%
EUR, 22%
USD, 63%
-0.5
0.0
0.5
1.0
1.5
2.0
2.5
3.0
3.5
4.0
4.5
0 5 10 15 20 25 30 35
Yiel
d (%
)
Maturity (Years)
CGB
UST
JGBBUND
GILT
-30%
-25%
-20%
-15%
-10%
-5%
0%CHF GBP JPY EUR SEK CAD AUD NZD NOK
Average: -16.6%
Average: -15.2%
-45%
-40%
-35%
-30%
-25%
-20%
-15%
-10%
-5%
0% KRWPENTHBARSILSINRTWD BRL
COPMYR
MXNIDRCLPPHP
VNDCNH
-30%
-20%
-10%
0%CHF GBP JPY EUR SEK CAD AUD NZD NOK
Average: -16.6%
CNH VND PHP TWD INR ILS ARS THB PEN KRW CLP IDR MXN MYR COP BRL
-45%
-30%
-15%
0%
Average: -15.2%
-30%
-20%
-10%
0%CHF GBP JPY EUR SEK CAD AUD NZD NOK
Average: -16.6%
CNHVN
DPHP
TWD
INR
ILS ARSTH
BPEN
KRWCLP
IDR MXN MYR COPBRL
-45%
-30%
-15%
0%
Average: -15.2%
AAA
CGB
AA
Yiel
d (%
)
Maturity (Years)
0
1
2
3
4
5
6
0 2 4 6 8 10 12
10%
20%
30%
40%
50%
60%
70%61%
39%
0.3%0%
AAA AA A+ or below
China has the potential to reach 10% index weightings.
9 Source: PBoC. Data as of 31 March 2015.10 Source: http://www.chinabond.com.cn/
9CHINA 2020
We expect foreign ownership percentage in the onshore bond market to double (to 4%) by 2020 and that it could reach 15% over the long term. This 2% increase translates into RMB2.9trn (US$450bn) in additional net foreign purchase over the next five years.
We expect foreign central banks and sovereign wealth funds will be major investors as they increase reserve allocation to RMB assets – which currently accounts for less than 1% of global foreign exchange reserves according to IMF data. Considering that China is the world’s largest exporter (13.3% of global trade) and its second largest economy (13.4% of global GDP), this suggests that RMB assets are very much under-owned11. Regardless of the timing of SDR inclusion, we believe that the RMB will account for an increasing share of global foreign exchange reserves in the coming years.
In addition, we also expect CGBs to be included in major government bond benchmark indices in the next couple of years. For example, China could potentially reach an index weighting of 10% if it is included in the widely followed GBI-EM Global Diversified index. The index is tracked by funds with US$180bn assets under management, according to J.P. Morgan, implying a potential US$18bn allocation to the Chinese market from these funds alone.
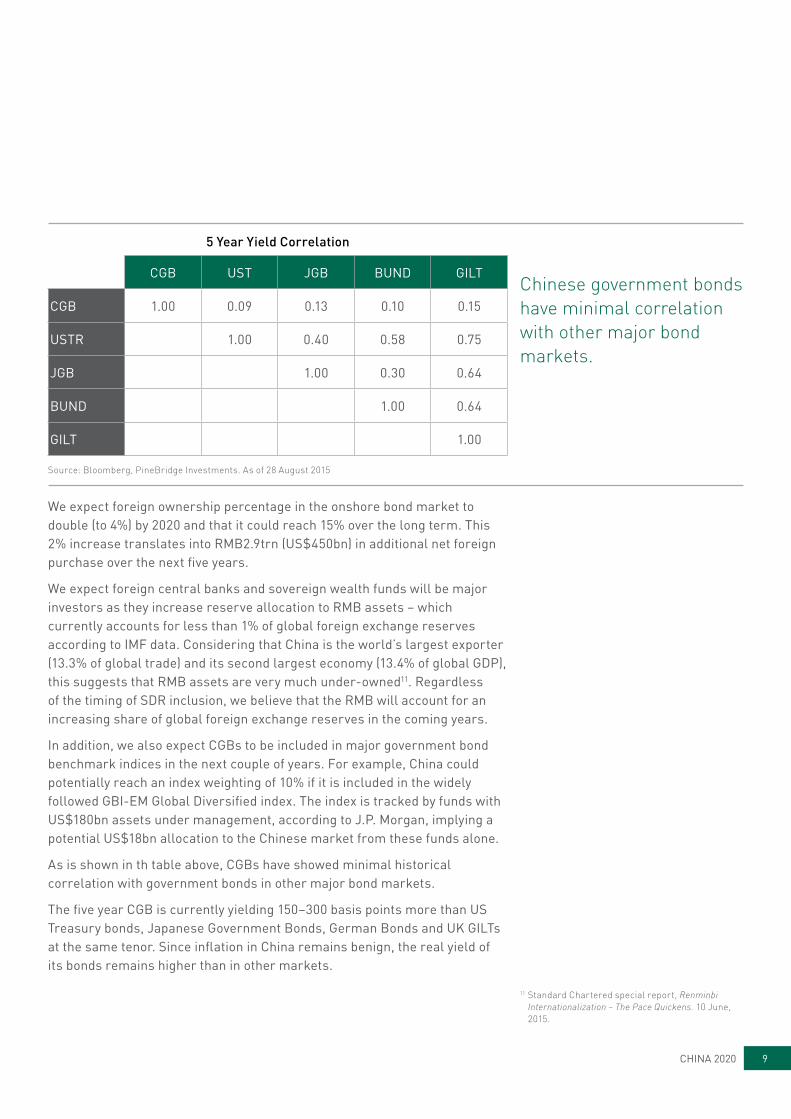
As is shown in th table above, CGBs have showed minimal historical correlation with government bonds in other major bond markets.
The five year CGB is currently yielding 150–300 basis points more than US Treasury bonds, Japanese Government Bonds, German Bonds and UK GILTs at the same tenor. Since inflation in China remains benign, the real yield of its bonds remains higher than in other markets.
11 Standard Chartered special report, Renminbi Internationalization – The Pace Quickens. 10 June, 2015.
5 Year Yield Correlation
CGB UST JGB BUND GILT
CGB 1.00 0.09 0.13 0.10 0.15
USTR 1.00 0.40 0.58 0.75
JGB 1.00 0.30 0.64
BUND 1.00 0.64
GILT 1.00
Source: Bloomberg, PineBridge Investments. As of 28 August 2015
Chinese government bonds have minimal correlation with other major bond markets.

10 PINEBRIDGE INVESTMENTS
We believe the macroeconomic backdrop is also supportive for the Chinese bond market in the near future. The PBoC has cut the benchmark lending rate five times since November 2014 as the economy decelerates. As the rate of economic growth moderates and interest rates remain higher than in other major economies, China is likely to maintain an easing stance in the near future, which will prove a further support to the bond market. With the Federal Reserve expected to raise interest rates in the near future, the outlook for total returns in developed economies is not as promising, since the rates in these markets tend to be highly correlated. Last but not least, as reflected in the AA- sovereign credit rating, China has strong sovereign fundamentals with a healthy fiscal profile and a robust external position.
CGBs and agency bonds account for 55% of China’s bond market12. We expect the proportion of non-central government bonds to increase, as the government relaxes policies relating to the issuance of bonds by corporates and local governments.
The pace of liberalization has quickened over the last year. In the first half of 2015, we saw the first bond by an unlisted corporate in the exchange market, the first local government bond under the debt swap program, and the first bond by a red-chip property developer. We expect more milestones in the future.
In terms of foreign ownership, foreign investors have 88% of their exposure in CGBs and agency bonds and only 12% in credit bonds13. This also means foreign investors own less than 1% of the total credit bonds outstanding. We believe this is mainly because there is not sufficient differentiation in the pricing and local ratings of credit bonds. As of June 2015, according to Wind data, 61% of credit bonds were rated “AAA” by domestic rating agencies, 39% in “AA-” to “AA+” and 0.3% in “A+” or below.
12 Source: Wind. Data as of 30 June 2015.13 Chinabond.com.cn. Data as of 30 June 2015.
Source: Standard Chartered as of end 2014
Foreign ownership of EM government bonds
0%
50%
100%
150%
200%
US Japan Taiwan China
% M
arke
t cap
to G
DP 145%
90%
182%
64%
USD
bill
ion
59%34%
15%
40% 36%2% 44% 38% 31%
20% 43% 24%10% 38%
0
20
40
60
80
100
120
140
160
MXN BRL KRW PLN TRY CNY% of outstanding government bonds
MYR IDR ZAR THB HUF RUB PHP PEN
0%
10%
20%
30%
40%
50%
60%
70%
80%
90%
100%
Q12011
Q22011
Q32011
Q42011
Q12012
Q22012
Q32012
Q42012
Q12013
Q22013
Q32013
Q42013
Q12014
Q22014
Q32014
Q42014
OthersCHFAUDCADGBPJPYEURUSD
Others, 3%,with RMBestimated toaccount forless than 1%
EUR, 22%
USD, 63%
-0.5
0.0
0.5
1.0
1.5
2.0
2.5
3.0
3.5
4.0
4.5
0 5 10 15 20 25 30 35
Yiel
d (%
)
Maturity (Years)
CGB
UST
JGBBUND
GILT
-30%
-25%
-20%
-15%
-10%
-5%
0%CHF GBP JPY EUR SEK CAD AUD NZD NOK
Average: -16.6%
Average: -15.2%
-45%
-40%
-35%
-30%
-25%
-20%
-15%
-10%
-5%
0% KRWPENTHBARSILSINRTWD BRL
COPMYR
MXNIDRCLPPHP
VNDCNH
-30%
-20%
-10%
0%CHF GBP JPY EUR SEK CAD AUD NZD NOK
Average: -16.6%
CNH VND PHP TWD INR ILS ARS THB PEN KRW CLP IDR MXN MYR COP BRL
-45%
-30%
-15%
0%
Average: -15.2%
-30%
-20%
-10%
0%CHF GBP JPY EUR SEK CAD AUD NZD NOK
Average: -16.6%
CNHVN
DPHP
TWD
INR
ILS ARSTH
BPEN
KRWCLP
IDR MXN MYR COPBRL
-45%
-30%
-15%
0%
Average: -15.2%
AAA
CGB
AA
Yiel
d (%
)
Maturity (Years)
0
1
2
3
4
5
6
0 2 4 6 8 10 12
10%
20%
30%
40%
50%
60%
70%61%
39%
0.3%0%
AAA AA A+ or below
China has strong sovereign fundmentals and healthy fiscal profile.

11CHINA 2020
We notice that within the same rating category, there is a wide range of credit quality. Some companies with a high yield international credit rating, for example, have the same rating as solid quasi-sovereigns at the “AAA” category by domestic rating agencies. This means that until we see risk priced more efficiently, as well as a better local rating framework, in-house credit analysis will remain extremely important.
In the coming years, we expect to see gradual improvements in both these areas. We anticipate more defaults in coming years, which will help encourage the development of proper credit ratings and risk pricing. In addition, the government could potentially open the doors to international rating agencies to rate local government securities, according to a joint statement in June from the China-US Strategic and Economic Dialogue.
By 2020, we expect CGBs and agency bonds will still account for a major portion of the foreign investor portfolio, but the proportion of non-central government/agency bonds, particularly those of strong SOEs and local governments, should increase from the current levels.

12 PINEBRIDGE INVESTMENTS
2020: Rocky road aheadAfter decades of strong growth, China is now embedded into the global economy. Its financial system however, remains largely closed off to foreign investors. It is clear though, that the Chinese government wants to grant more access and is determined to integrate its markets into the international financial system. This is not going to be a smooth journey.
The main issue is that Chinese policymakers are mindful of striking a balance between introducing further market reforms, while at the same time maintaining both economic growth and social stability.
The government’s recent heavy intervention in the stock market, an attempt to stabilize plummeting share prices, is a case in point – as it clearly demonstrates the tensions that Beijing faces. While we do not think the recent market correction in stocks will create systemic risks, it is likely to delay, if not derail, some market reforms in near term, such as the Shenzhen–Hong Kong Stock Connect Scheme which has been put on hold.
The intervention also suggests that the current supervisory know-how may not be strong enough to achieve effective oversight over domestic markets that are becoming increasingly more complicated and integrated into the international financial system. Policymakers will likely be under pressure if they allow the local markets to open up and liberalize too fast.
It should be no surprise that the recent events on the stock market have had an impact on the perceptions of foreign investors. Concerns over policy transparency, corporate governance, and investor protection, have all contributed to a more cautious stance towards investing in China. We think this will result in higher risk premiums in China over the near term, but at the same time we believe it will also create opportunities to those investors that have stronger in-depth, on-the-ground knowledge about the country and the direction of policy.
There is still lots of work that needs to be done: for example, international rating agencies need to operate locally, there needs to be a more transparent taxation system for foreign investors, and investor-friendly default procedures need to be put in place.
These are just some of the things that need to be introduced, in order to help restore confidence among international investors towards China and to get them to regard its assets as core long-term holdings.
Chinese policymakers must strike balance between reforms, economic growth and stability.

13CHINA 2020
2020: Closing thoughtsBy the end of the decade, we expect China to have a financial system worthy of the world’s second largest economy. Its stocks and bonds will become ever more accessible to foreign investors as Beijing continues to liberalize its domestic markets. While this process may increase volatility and uncertainty, it could at the same time present outsized investment opportunities to those who have a strong understanding of the country’s unique challenges.

Assets under management as of 30 June 2015.This information is for educational purposes only and is not intended to serve as investment advice. This is not an offer to sell or solicitation of an offer to purchase any investment product or security. Any opinions provided should not be relied upon for investment decisions. Any opinions, projections, forecasts and forward-looking statements are speculative in nature; valid only as of the date hereof and are subject to change. PineBridge Investments is not soliciting or recommending any action based on this information.Disclosure Statement PineBridge Investments is a group of international companies that provides investment advice and markets asset management products and services to clients around the world. PineBridge Investments is a registered trademark proprietary to PineBridge Investments IP Holding Company Limited.Opinions are the personal views of the authors and do not necessarily reflect the views of PineBridge Investments and there is no undertaking to advise any person of any changes in such views. In addition, the views expressed do not necessarily reflect the opinions of any other investment professional at PineBridge Investments, and may not be reflected in the strategies and products that PineBridge offers. It should not be assumed PineBridge will make investment recommendations in the future that are consistent with the views expressed herein, or use any or all of the techniques or methods of analysis described herein. PineBridge Investments and its affiliates may have positions (long or short) or engage in securities transactions that are not consistent with the information and views expressed in this document. Information from third party sources has not been independently verified.For purposes of complying with the Global Investment Performance Standards (GIPS®), the firm is defined as PineBridge Investments Global. Under the firm definition for the purposes of GIPS, PineBridge Investments Global excludes some alternative asset groups and regional legal entities that may be represented in this presentation, such as the assets of PineBridge Investments.Readership: This document is intended solely for the addressee(s) and may not be redistributed without the prior permission of PineBridge Investments. Its content may be confidential. PineBridge Investments and its subsidiaries are not responsible for any unlawful distribution of this document to any third parties, in whole or in part.Opinions: Any opinions expressed in this document may be subject to change without notice. We are not soliciting or recommending any action based on this material.Risk Warning: All investments involve risk, including possible loss of principal. Past performance is not indicative of future results. If applicable, the offering document should be read for further details including the risk factors. Our investment management services relate to a variety of investments, each of which can fluctuate in value. The investment risks vary between different types of instruments.
For example, for investments involving exposure to a currency other than that in which the portfolio is denominated, changes in the rate of exchange may cause the value of investments, and consequently the value of the portfolio, to go up or down. In the case of a higher volatility portfolio, the loss on realization or cancellation may be very high (including total loss of investment), as the value of such an investment may fall suddenly and substantially. In making an investment decision, prospective investors must rely on their own examination of the merits and risks involved.Information is unaudited, unless otherwise indicated, and any information from third party sources is believed to be reliable, but PineBridge Investments cannot guarantee its accuracy or completeness.PineBridge Investments Europe Limited is authorised and regulated by the Financial Conduct Authority (“FCA”). In the UK this communication is a financial promotion solely intended for professional clients as defined in the FCA Handbook and has been approved by PineBridge Investments Europe Limited. Should you like to request a different classification, please contact your PineBridge representative.Approved by PineBridge Investments Ireland Limited. This entity is authorised and regulated by the Central Bank of Ireland.In Australia, this document is intended for a limited number of wholesale clients as such term is defined in chapter 7 of the Corporations Act 2001 (CTH). The entity receiving this document represents that if it is in Australia, it is a wholesale client and it will not distribute this document to any other person whether in or outside of Australia. In Hong Kong, the issuer of this document is PineBridge Investments Asia Limited, licensed and regulated by the Securities and Futures Commission (“SFC”). This document has not been reviewed by the SFC. PineBridge Investments Asia Limited holds a Representative Office license issued by the Central Bank of the UAE and conducts its activities in the UAE under the trade name PineBridge Investments Asia Limited– Abu Dhabi. This document has not been reviewed by the Central Bank of the UAE nor the SFC. In the UAE, this document is issued by PineBridge Investments Asia Limited – Abu Dhabi Representative Office. PineBridge Investments Singapore Limited is licensed and regulated by the Monetary Authority of Singapore (the ”MAS”). In Singapore, this material may not be suitable to a retail investor and is not reviewed or endorsed by the MAS. PineBridge Investments Middle East B.S.C.(c) is regulated by the Central Bank of Bahrain as a Category 1 investment firm. This document and the financial products and services to which it relates will only be made available to accredited investors of PineBridge Investments Middle East B.S.C. (c ) and no other person should act upon it. The Central Bank of Bahrain takes no responsibility for the accuracy of the statements and information contained in this document or the performance of the financial products and services, nor shall it have any liability to any person, an investor or otherwise, for any loss or damage resulting from reliance on any statement or information contained therein.Last updated 16 June 2014.
PineBridge Investments provides solutions for investors, spanning the full spectrum of asset classes and geographies around the globe. We manage more than US $38 billion in fixed income assets across developed, emerging and leveraged finance markets. Our investment professionals focus on delivering compelling results for our clients, and the global interconnectivity among our teams allow us to remain at the forefront of opportunity. Explore our comprehensive suite of innovative core and specialized alpha-oriented solutions at pinebridge.com
MULTI-ASSET | FIXED INCOME | EQUITIES | ALTERNATIVES
About PineBridge
Investments