Children of the new century - Centre for Mental Health
52
REPORT Mental health findings from the Millennium Cohort Study Leslie Morrison Gutman, Heather Joshi, Michael Parsonage and Ingrid Schoon Children of the new century
Transcript of Children of the new century - Centre for Mental Health

REPORT
Mental health findings from the Millennium Cohort Study
Leslie Morrison Gutman, Heather Joshi, Michael Parsonage and Ingrid Schoon
Children of the new century

Centre for Mental H
ealth REPORT Children of the new century
2
Acknowledgements
We are very grateful to members of our Expert Reference Group for helpful advice and support:
Dr Naomi Eisenstadt
Professor Barbara Maughan
Professor Lord Richard Layard
Contents
Executive summary 3
1 Introduction 6
2 Data sources and methods 7
3 Prevalence of mental health problems 10
4 Socio-demographic differences 13
5 Recent trends 21
6 Incidence and persistence 25
References 28
Appendix tables 29
3
Centre for Mental H
ealth REPORT Children of the new century
This report sets out early findings from a three-year project on children’s mental health being undertaken by the Institute of Education at UCL and Centre for Mental Health, with funding from the Economic and Social Research Council.
The findings relate mainly to the mental health of children around the age of 11 as recorded in the Millennium Cohort Study (MCS), a multi-purpose longitudinal study which is following a large sample of children born in the UK at the start of the 21st century. The data were collected mainly in 2012.
Children’s mental health is assessed in the MCS using the Strengths and Difficulties Questionnaire (SDQ), a widely used screening instrument in which parents and teachers report on a child’s mental health in the previous six months.
The SDQ distinguishes between four broad groups or “subscales” of mental health difficulties (conduct problems, hyperactivity/inattention, emotional problems and peer problems). A combined score across all four subscales which is above a defined cut-off is indicative of a clinically diagnosable disorder.
Children with scores at a level where a disorder is likely to be present are described in this report as having “severe” mental health problems.
Prevalence
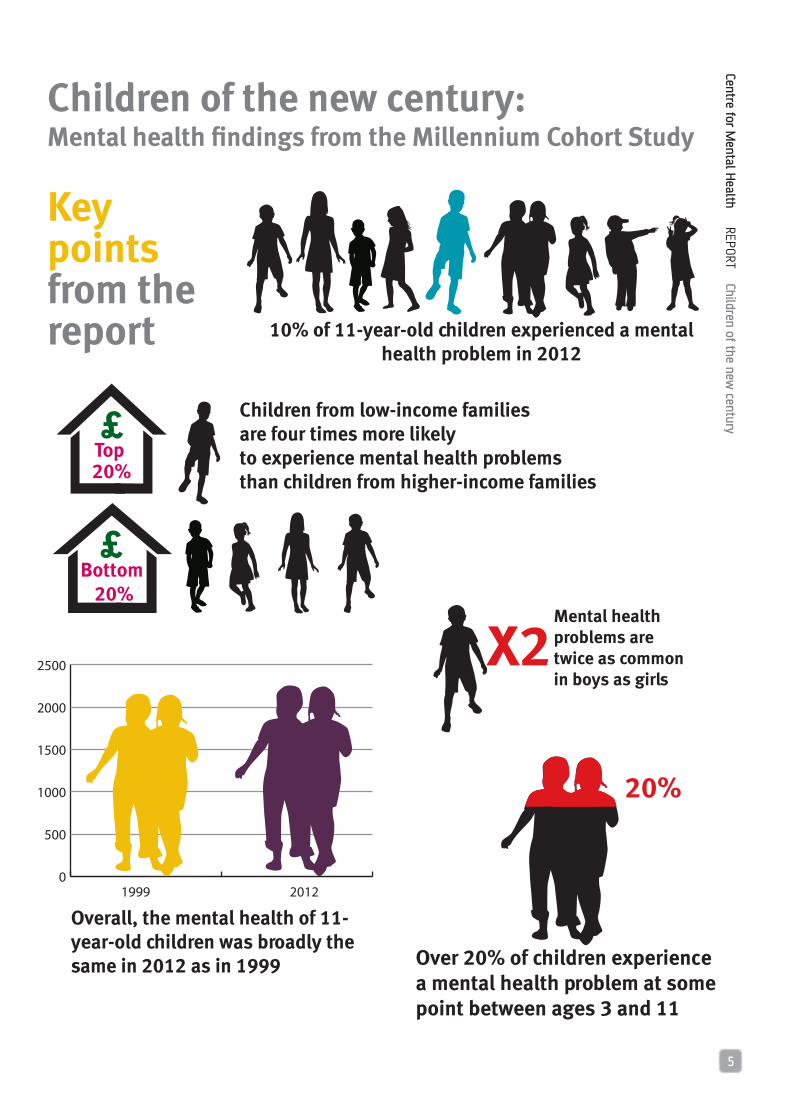
Based on the SDQ scores reported by parents, the proportion of 11-year-old children in the UK with severe mental health problems in 2012 was just over 10%.
There were markedly more boys reported as having severe problems than girls (13% vs 8%). There were also some differences by gender in the nature of problems: among boys ‘externalising’ problems (conduct problems and hyperactivity/inattention) were relatively more common than ‘internalising’ problems (emotional and peer problems), while among girls the opposite was the case.
The level of severe mental health problems
among 11-year-olds as rated by teachers was somewhat lower at 8%, with an even wider gap between boys and girls than suggested by the parents’ scores.
As many as 28% of all 11-year-old children were assessed by parents as having severe difficulties on at least one of the four individual SDQ subscales.
Social and demographic differences
The prevalence of severe mental health problems in children is strongly related to parental education, parental occupation and family income. For example, 17% of 11-year-olds from families in the bottom fifth of the income distribution were identified as having severe mental health problems in 2012, compared with only 4% among those from families in the top fifth. This income-related gradient in prevalence appears to have become steeper in recent years and to be much steeper among children than it is among adults.
Looking at 11-year-old-children living in the four countries of the UK, the main feature is that Scotland showed a somewhat lower prevalence of severe mental health problems in 2012 than England, Wales or Northern Ireland.
Comparisons of ethnic groups suggest that severe problems were most common in 11-year-old children of Mixed ethnic background (particularly girls), followed by those classified as White (particularly boys). Prevalence was lowest among children of Indian origin.
When we look at the type of family, the prevalence of severe mental health problems among 11-year-old children living with both their natural parents was well under half the level found among children in other family types (single-parent families, step-families etc.).
Recent trends
Recent changes have been assessed by comparing data on the mental health of children as recorded in the 2012 sweep of the MCS with similar data on the mental health of 10- and 11-
Executive Summary

Centre for Mental H
ealth REPORT Children of the new century
4
year-old children in the national Child and Adolescent Mental Health Surveys carried out in 1999 and 2004.
Overall, the analysis suggests that the mental health of children in this age group improved slightly between 1999 and 2012. The picture is however somewhat mixed and findings vary between boys and girls, by the type of problem concerned and whether the rating is made by parents or teachers.
As reported by parents, there appears, if anything, to have been a small increase between 1999 and 2012 in the overall prevalence of severe mental health problems in this age group. In contrast, teachers’ ratings suggest somewhat larger changes going in the opposite direction. The improvements noted by teachers applied in broadly equal measure to both boys and girls.
Incidence and persistence
The Millennium Cohort Study has so far collected information on the mental health of children in the sample at four different ages (3, 5, 7 and 11). This can be analysed to show how many children ever recorded severe mental health problems between the ages of 3 and 11 (incidence) and how many with severe problems at age 11 had these problems repeatedly (persistence).
Just over a fifth of all children in the MCS were assessed with severe mental health problems at one or more of the four ages surveyed. This implies that the incidence of severe problems at some point during childhood is roughly twice as high as the prevalence of these problems at any single age. On the other hand, only 1.5% of children had severe problems at all four ages.
Defining persistent cases as those children who had severe problems at three or four surveys including at age 11, it is estimated that 3.6% of all 11-year-old children fall into this category. Persistence is nearly three times as common among boys as among girls.
Looking ahead
We are charting the extent of mental health problems in children of the new century as they
face adolescence, particularly in the context of assessing the need for mental health services. It is beyond the purpose of this report to explain the causes of these problems or how they might be prevented. These important questions require further exploration of the evidence, something we intend to do next.
5
Centre for Mental H
ealth REPORT Children of the new century
Children of the new century:Mental health findings from the Millennium Cohort Study
Key points from the report
Mental health problems are twice as common in boys as girls
X2
Over 20% of children experience a mental health problem at some point between ages 3 and 11
20%
Overall, the mental health of 11-year-old children was broadly the same in 2012 as in 1999
0
500
1000
1500
2000
2500
1999 2012
Bottom 20%
Top 20%
Children from low-income families are four times more likely to experience mental health problems than children from higher-income families
10% of 11-year-old children experienced a mental health problem in 2012

Centre for Mental H
ealth REPORT Children of the new century
6
1. Introduction
on four main topics:
• The prevalence of mental health problems among 11-year-old children in the UK, including analysis of the extent to which children may be displaying two or more problems at the same time.
• Socio-demographic differences in the prevalence of mental health problems among 11-year-olds, examining the extent of variation in prevalence according to a range of factors such as country of residence within the UK, ethnicity, family type, parental education, parental occupation and family income.
• Trends in the prevalence of mental health problems among 10- and 11-year-old children between 1999 and 2012, based on a comparison of findings in the 1999 and 2004 BCAMHS and the MCS.
• Finally, information on patterns of incidence and recurrence in mental health problems within the same children, drawing on data collected in successive surveys of the MCS at child ages 3, 5, 7 and 11.
The report is written with a general readership in mind and, wherever possible, quantitative information is illustrated by relatively simple diagrams rather than detailed tabular presentations. For those with a more specialist interest, detailed supporting information, including sample numbers and statistical significance tests, is provided in a series of appendix tables at the end of the report.
This report sets out some early findings from a three-year project on children’s mental health being undertaken jointly by the Institute of Education, now part of University College London, and Centre for Mental Health, with funding from the Economic and Social Research Council1.
The primary aim of the joint project is to analyse trajectories of mental health problems during childhood using data from the Millennium Cohort Study (MCS), a multi-purpose longitudinal study which is following a large sample of children born in the UK in 2000/01. Early work on the project entailed the extraction of substantial amounts of data on the mental health of children in the MCS from successive surveys carried out at child ages 3, 5, 7 and 11.
This was a necessary first step in the analysis of trajectories, but the work has also generated much information on overall levels of mental health in children born at the start of the 21st century which may be of wider interest and relevance. For example, it is now more than ten years since the last official British Child and Adolescent Mental Health Survey (BCAMHS) was in the field, implying that decisions on policy or service planning which rely on this source are using information which is increasingly out of date. In contrast, the most recent survey of children in the MCS was carried out mainly in 2012 and so provides data of a more contemporary nature, albeit confined to children born in a specific year. Another advantage of the MCS is that it is based on a substantially larger sample of children than the BCAMHS, allowing more scope for detailed sub-group analysis, for example by ethnicity.
The main, though not exclusive, focus of this report is on the mental health of children around the age of 11, which reflects experiences at the onset of adolescence and at an important time of transition for most children because of the move from primary to secondary education. Following a short review of data sources and methods, we present and discuss information
1 Research grant ES/L0008211/1 to Leslie Morrison Gutman.

7
Centre for Mental H
ealth REPORT Children of the new century
Chapter 2: Data sources and methods
Data
The Millennium Cohort Study (MCS) is a longitudinal study following a sample of children born in all four countries of the United Kingdom between September 2000 and January 2002. Unlike previous national birth cohort studies, which attempted to recruit all children born in a particular week, this survey drew on a sample using a complex clustered and stratified design, with deliberate over-sampling of children in areas of high child poverty, minority ethnic populations and the three smaller countries of the UK (Plewis, 2007).
There have so far been five rounds of interviews completed with MCS families. The first survey, MCS1, was in the field in 2001 and 2002, at about nine months after birth of the sampled children; MCS2 (child age 3) was mainly undertaken during 2004, MCS3 (child age 5) mainly during 2006 and MCS4 (child age 7) mainly during 2008, while the most recent completed survey, MCS5, at child age 11, collected data mainly in 2012. A sixth survey is in the field in 2015, and another one planned for 2018.
The number of families who have been interviewed at least once is 19,244, which includes some 692 families in England who were not interviewed until MCS2. If these cases are included, the initial response rate to the survey out of all those eligible was 71%. As is typical of longitudinal studies, there has been some loss to follow-up, or ‘attrition’. Including some former drop-outs who had re-joined, the number of families interviewed at MCS5 in 2012 was 13,287, corresponding to 69% of those ever interviewed (Mostafa, 2014). Finally, the number of families interviewed at all five surveys undertaken to date was 10,448.
The fifth survey is referred to as the ‘age 11’ survey and the children it surveys as (for convenience) ‘11-year-olds’, although interviewing took place at ages around, rather than necessarily after, the 11th birthday. One third were still 10, though approaching 11, and most of the rest were closer to their 11th than 12th birthday.
Note also that parents and teachers were asked to rate problems over the last six months, which would have included time before the 11th birthday for most of those who had already reached that birthday.
Cases studied
In our analyses we examined one child per family present at age 11, excluding 182 children in MCS5 who were the second or third in sets of twins or triplets. (There were not enough of these to analyse separately.) Our sample was further reduced because about 4% of parents in MCS5 were not able to provide usable information on their child’s mental health, leaving a total of 12,798 cases for analysis. Almost all of the parental informants were mothers. They used computer-assisted self-completion to answer the questions on children’s mental health.
We also drew on responses from teachers in England and Wales who answered a postal paper questionnaire including questions on children’s mental health in the 2012 survey. (The questionnaire was not sent out in Scotland or Northern Ireland). Teachers provided usable information on mental health for 7,085 children.
Weighting procedures were used to correct for the over-sampling of certain groups of children in the MCS and for sample attrition, aiming to ensure that the socio-demographic profile of the whole cohort is nationally representative.
Measurement of mental health
As in the earlier surveys of children aged 3, 5 and 7 years, children’s mental health around age 11 was assessed using the Strengths and Difficulties Questionnaire (SDQ) (Goodman, 1997 and 2001). This is a widely tested and validated screening questionnaire in which parents and/or teachers report on a child’s mental health in the previous six months.
The SDQ includes 25 items divided into five groups or subscales relating to:
• conduct problems (e.g. often has temper

Centre for Mental H
ealth REPORT Children of the new century
8
• tantrums…often fights with other children…steals from home, school or elsewhere);
• hyperactivity/inattention (e.g. restless, overactive…constantly fidgeting or squirming…easily distracted, concentration wanders);
• emotional problems (e.g. many worries…often unhappy, downhearted…nervous or clingy in new situations);
• peer problems (e.g. rather solitary, tends to play alone…picked on or bullied…gets on better with adults than other children); and
• pro-social (e.g. considerate of other people’s feelings…shares readily with other children…kind to younger children).
Each item is marked on a three-point scoring system in which 0 = not true, 1 = somewhat true and 2 = very true. The five items in each group or subscale are then totalled, giving scores potentially ranging from 0 to 10. A total difficulties (or total problems) score is calculated as the sum of the scores of the conduct, hyperactivity/inattention, emotional and peer problem subscales; the pro-social subscale is not used in this calculation.
A distinction is sometimes drawn between ‘externalising’ and ‘internalising’ scores, where ‘externalising’ is the sum of the conduct and hyperactivity/inattention subscales, and ‘internalising’ is the sum of the emotional and peer problem subscales. There is some evidence that using these two combined scales may be preferable to using the four separate subscales in whole-population samples, whereas the four separate subscales may provide better discrimination in high-risk samples (Goodman et al., 2010).
Although SDQ scores can be treated as reflecting a continuum, it is often convenient to categorise or group the scores. The original groupings presented for the SDQ scores were ‘normal’, ‘borderline’ and ‘abnormal’. These bandings were established in a population-based national survey, attempting to choose cut-off points such that 80% of children scored ‘normal’, 10% ‘borderline’ and 10% ‘abnormal’. Cut-off points are somewhat different based on the reporter and age of the child. (The cut-offs
are to an extent arbitrary, a point particularly relevant to the analysis in Chapter 6 of the persistence and recurrence of mental health problems during childhood, where some apparent discontinuities may simply reflect children being rated just above a cut-off point on one occasion and just below on another.)
To illustrate with actual numbers, ‘normal’ corresponds to a parent-rated total difficulties score which is in the range 0-13, ‘borderline’ corresponds to a score in the range 14-16 and ‘abnormal’ to a score in the range 17-40. An ‘abnormal’ score for total difficulties – but not necessarily for the individual subscales – is understood to be indicative of a clinically diagnosable mental disorder (Goodman and Goodman, 2009). It is in practice very rare for a child’s total difficulties score to exceed 20, but quite common for the total to be zero, where absolutely no difficulties are reported.
We retain this grouping system but modify the terminology such that children in the three bands are described as having ‘no problems’, ‘moderate problems’ and ‘severe problems’ respectively.
Assessments by parents and teachers
As noted above, the Millennium Cohort Study has collected SDQ reports from teachers as well as parents, and findings from both sets of assessments are presented at various points in this report, sometimes with apparently discrepant results.
The use of multiple informants is common practice in studies of child mental health, whatever specific instrument or measure is used, and it has been widely observed that informants often disagree about the presence or absence of symptoms (De Los Reyes et al., 2015). The SDQ is no exception to this. While it has been found that agreement between informants using this measure is “moderate”, it is also “substantially higher than the average reported for other measures of child psychopathology” (Collishaw et al., 2009).
Various factors may contribute to divergence of parent and teacher reports, but particular importance attaches to contextual differences, partly in the sense that children may behave
9
Centre for Mental H
ealth REPORT Children of the new century
differently in different contexts (e.g. home v. school) and partly because some sorts of difficulties may be more observable in some contexts than others. To this extent, each reporter is providing useful and complementary information and no single informant’s reports are sufficient for a comprehensive assessment.
Statistical significance
Although the MCS is a large-scale survey, there always remains the possibility, particularly in the detailed analysis of sub-groups or trends over time, that apparent variations in the prevalence of severe mental health problems may simply be the result of chance rather than a genuine underlying difference or change. On the basis of statistical significance tests, this report particularly highlights findings which have a likelihood of 95% or more that they represent genuine differences.
Centre for Mental H
ealth REPORT Children of the new century
10
Chapter 3: Prevalence of mental health problems
Prevalence based on parent ratings
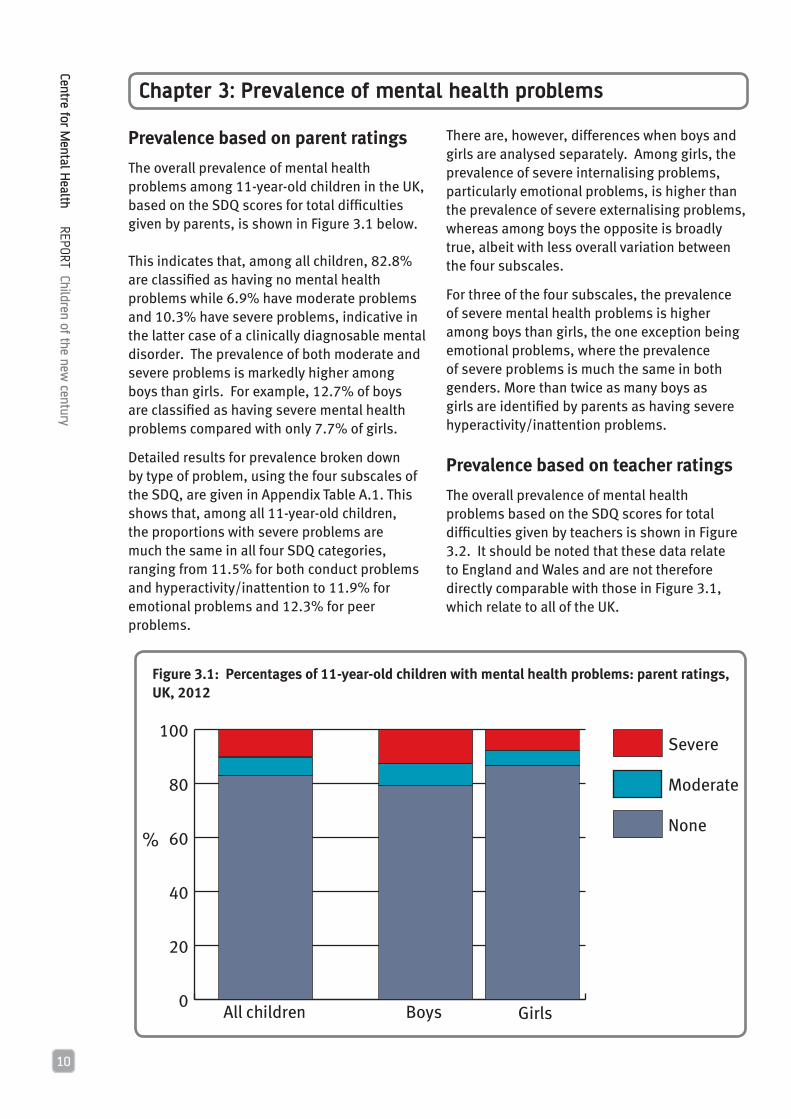
The overall prevalence of mental health problems among 11-year-old children in the UK, based on the SDQ scores for total difficulties given by parents, is shown in Figure 3.1 below.
This indicates that, among all children, 82.8% are classified as having no mental health problems while 6.9% have moderate problems and 10.3% have severe problems, indicative in the latter case of a clinically diagnosable mental disorder. The prevalence of both moderate and severe problems is markedly higher among boys than girls. For example, 12.7% of boys are classified as having severe mental health problems compared with only 7.7% of girls.
Detailed results for prevalence broken down by type of problem, using the four subscales of the SDQ, are given in Appendix Table A.1. This shows that, among all 11-year-old children, the proportions with severe problems are much the same in all four SDQ categories, ranging from 11.5% for both conduct problems and hyperactivity/inattention to 11.9% for emotional problems and 12.3% for peer problems.
There are, however, differences when boys and girls are analysed separately. Among girls, the prevalence of severe internalising problems, particularly emotional problems, is higher than the prevalence of severe externalising problems, whereas among boys the opposite is broadly true, albeit with less overall variation between the four subscales.
For three of the four subscales, the prevalence of severe mental health problems is higher among boys than girls, the one exception being emotional problems, where the prevalence of severe problems is much the same in both genders. More than twice as many boys as girls are identified by parents as having severe hyperactivity/inattention problems.
Prevalence based on teacher ratings
The overall prevalence of mental health problems based on the SDQ scores for total difficulties given by teachers is shown in Figure 3.2. It should be noted that these data relate to England and Wales and are not therefore directly comparable with those in Figure 3.1, which relate to all of the UK.
Figure 3.1: Percentages of 11-year-old children with mental health problems: parent ratings, UK, 2012
0
20
40
60
80
100Severe
Moderate
None
GirlsBoysAll children
%

11
Centre for Mental H
ealth REPORT Children of the new century
Figure 3.2: Percentages of 11-year-old children with mental health problems: teacher ratings, England and Wales, 2012
0
20
40
60
80
100Severe
Moderate
None
All children GirlsBoys
%
On the teacher ratings, 84.2% of all children in England and Wales have no mental health problems, 7.8% have moderate problems and 8.0% have severe problems. The proportion with severe problems is thus somewhat lower than the corresponding estimate for the UK based on parent ratings; on the other hand, the proportion with moderate problems is slightly higher. More strikingly, the teachers identify well over twice as many severe problems among boys as girls, a noticeably wider gender difference than in the parents’ scores.
A detailed breakdown of the teacher-rated scores by type of problem is given in Appendix Table A.2. In line with the parent data, this shows that among girls the prevalence of severe internalising problems is higher than the prevalence of severe externalising problems, whereas among boys the opposite is the case. But there are also differences. For example, the teacher ratings show that the prevalence of severe conduct problems is three times as high in boys as in girls, while the prevalence of severe hyperactivity/inattention problems is nearly five times as high. These are much wider gender differences than in the parent reports.
Combinations of mental health problems
This section provides information on the extent to which some children exhibit two or more severe mental health problems at the same time. Findings based on parent ratings are given in Figure 3.3.
This shows that 28.1% of all children have severe difficulties in at least one of the SDQ subscales. The total breaks down as follows: 15.7% of children are classified as having one severe problem, 7.2% have two such problems, 3.6% have three and 1.6% have severe ratings in all four subscales.
There are also gender differences in the extent to which types of problem are combined. For 11-year-old boys, 31.4% are classified with one or more severe problems, including 16.4% with just one problem, 8.5% with two, 4.3% with three and 2.2% with severe ratings in all four subscales. All of these rates are lower for girls, with 24.6% having at least one problem, including 15.0% with one problem only, 5.8% with two problems, 2.5% with three and 1.0% with four.

Centre for Mental H
ealth REPORT Children of the new century
12
Detailed information on all possible combinations of problems is given in Appendix Table A.3. This shows, for example, that for children classified as having severe problems in two separate subscales, the most common grouping is emotional problems + peer problems (i.e. the two internalising conditions), followed by conduct problems + hyperactivity/inattention (i.e. the two externalising conditions). The internalising grouping is more common among girls than boys and vice versa for the externalising grouping. Among all children, 8.9% have at least one problem in both internalising and externalising groups.
Figure 3.3: Percentages of 11-year-old children with different numbers of severe mental health problems: parent ratings, UK, 2012
Four problems
Three problems
Two problems
No problems
All children
Boys Girls
One problem

13
Centre for Mental H
ealth REPORT Children of the new century
Chapter 4: Socio-demographic differences
Introduction
This chapter explores differences in the proportions of 11-year-old children with severe mental health problems according to a range of socio-demographic factors such as ethnicity and family income. All the findings are based on SDQ scores provided by parents. It is important to note that the associations shown below do not necessarily imply causation, as many other factors may also be at play and further analysis is needed to disentangle their separate effects.
Country of residence within the UK
The relative proportions of 11-year-old children in the four constituent countries of the UK who have severe mental health problems, as measured by their SDQ scores for total difficulties, are given in Figure 4.1.
The main feature of Figure 4.1 is the lower prevalence of severe mental health problems in Scotland compared with the rest of the UK; thus the relative numbers in Scotland with severe problems are below those elsewhere by about a quarter among both boys and girls. It should, however, be noted that this difference falls just short of statistical significance. In the UK as a whole the prevalence of severe problems among boys is highest in Wales, while among girls it is highest in England. Prevalence in Northern Ireland is virtually identical to the UK average, both for children taken together and for boys and girls separately.
Detailed information on the proportions with severe problems in each of the four SDQ subscales is given by country in Appendix Table A.4. Among other things this suggests that the lower prevalence of severe problems in Scotland is somewhat more pronounced for internalising problems than it is for externalising problems. Within the UK as a whole, the prevalence of severe problems is highest in England for conduct problems and peer problems, in Wales for hyperactivity/inattention, and in Northern Ireland for emotional problems.
Ethnicity
A breakdown by ethnicity of the prevalence of severe mental health problems, based on SDQ scores for total difficulties, is given in Figure 4.2 (overleaf).
Figure 4.1: Percentages of 11-year-old children with severe mental health problems (total difficulties) by country of residence: parent ratings, UK, 2012
0
3
6
9
12
15
N. IrelandScotlandWalesEngland
0
3
6
9
12
15
N. IrelandScotlandWalesEngland
0
3
6
9
12
15
N. IrelandScotlandWalesEngland
All children
Girls
Boys
%
%
%

Centre for Mental H
ealth REPORT Children of the new century
14
Figure 4.2: Percentages of 11-year-old children with severe mental health problems (total difficulties) by ethnicity: parent ratings, UK, 2012
0
3
6
9
12
15
OtherBlack Pakistani/Bangladeshi
IndianMixedWhite
0
3
6
9
12
15
OtherBlack Pakistani/Bangladeshi
IndianMixedWhite
0
3
6
9
12
15
OtherBlack Pakistani/Bangladeshi
IndianMixedWhite
All children
Girls
Boys
%
%
%

15
Centre for Mental H
ealth REPORT Children of the new century
This shows that, among all children, prevalence is highest in the Mixed group, followed by those classified as White. In all the other four ethnic groups for which information is given, the prevalence of severe problems is below the national average and is particularly low among children of Indian origin. These differences are not, however, at a level which reaches statistical significance.
Patterns for boys and girls within ethnic groups are broadly similar but with some exceptions. In particular, the prevalence of severe problems among boys in the Mixed group is below rather than above the national average, meaning that the high overall prevalence of severe problems in this group is fully explained by an extremely high level of problems among girls. Severe mental health problems are most common among White boys, closely followed by those classified as Black. Among both boys and girls, prevalence is lowest in Indians, with the rate for boys being particularly low.
Detailed information on severe problems in each of the four SDQ subscales by ethnicity is given in Appendix Table A.5. Features of note include: very low levels of conduct problems - but not hyperactivity/inattention - among Indian children; high levels of emotional problems among children in the Mixed group, particularly girls; exceptionally low levels of conduct problems among girls in the Black and Other groups; and very high levels of peer problems among boys in the small and heterogeneous Other group.
The pattern of severe problems across ethnic groups just described contrasts with earlier waves of the survey, where Indians and Mixed had similar total difficulties scores to Whites, while Pakistanis and Bangladeshis, particularly the former, had significantly higher levels of problems (George et al., 2006). The earlier surveys show a contrast between a high level of problems among Black Caribbeans and a particularly low one for Black Africans.
Partnership status of parents
The prevalence of severe mental health problems on the total difficulties measure according to parents’ partnership status is given in Figure 4.3, with matching information
for each of the four SDQ subscales given in Appendix Table A. 6.
The prevalence of severe mental health problems among children living with both their natural parents is about a half to a third of the level found among children in other family types (single-parent families, step-families etc.). The differential is broadly the same among boys as among girls and is also observed across all four
0
5
10
15
20
25
Both natural parents
Lone natural parent
Step and otherfamily types
0
3
6
9
12
15
Step and otherfamily types
Lone natural parent
Both natural parents
0
5
10
15
20
Step and otherfamily types
Lone natural parent
Both natural parents
All children
Girls
Boys
%
%
%
Figure 4.3: Percentages of 11-year-old children with severe mental health problems (total difficulties) by partnership status of parents: parent ratings, UK

Centre for Mental H
ealth REPORT Children of the new century
16
higher the prevalence of severe mental health problems in their children. For example, using SDQ scores for total difficulties, the children of parents with no or very low qualifications are about three times as likely to exhibit severe mental health problems as those children whose parents have a university education up to first-degree level and about four times as likely as those whose parents have higher-degree qualifications.
The inverse association appears to be somewhat stronger among girls than among boys, while the detailed analysis by SDQ subscale given in the appendix table suggests that the relationship is more pronounced for externalising problems than it is for internalising problems.
types of mental health problems, although to a more pronounced degree for externalising as opposed to internalising problems.
Parental education
Figure 4.4 below shows the proportions of children with severe mental health problems analysed according to highest academic qualification held by the parents (or parent if only one present). Appendix Table A.7 provides detailed information relating to each of the four SDQ subscales.
All the plots show a very strong inverse association between parental education and child mental health problems, i.e. the lower the level of parents’ educational qualifications, the
Figure 4.4: Percentages of 11-year-old children with severe mental health problems (total difficulties, parent ratings) by highest parent academic qualification: UK, 2012
All children
%
0
5
10
15
20
25
Higherdegree
Degree/Diploma
AS/A-level
GCSE A-CLow qual.
No academic
qualifications
Boys
%
0
5
10
15
20
25
Higherdegree
Degree/Diploma
AS/A-level
GCSE A-CLow
qual.No
academic qualifications
Girls
%
0
5
10
15
20
25
Higherdegree
Degree/Diploma
AS/A-level
GCSE A-CLow qual.
No academic
qualifications

17
Centre for Mental H
ealth REPORT Children of the new century
Parental occupation
Figure 4.5 below shows the proportions of children with severe mental health problems according to the occupational status of their
parents, taking the highest ranked current occupation of a couple, where there are two parents present at child age 11. Detailed supporting information relating to the four SDQ subscales is given in Appendix Table A.8.
Figure 4.5: Percentages of 11-year-old children with severe mental health problems (total difficulties) by parental occupation at child age 11: parent ratings, UK, 2012
0
5
10
15
20
25
30
0
5
10
15
20
25
30
0
5
10
15
20
25
30
All Children
Girls
Boys
%
%
%
Professional/Managerial
IntermediateSmall EmployerLower Supervisory
Routine/
Semi-RoutineWorkless
Professional/Managerial
IntermediateSmall EmployerLower Supervisory
Routine/
Semi-RoutineWorkless
Professional/Managerial
IntermediateSmall EmployerLower Supervisory
Routine/ Semi-Routine
Workless

Centre for Mental H
ealth REPORT Children of the new century
18
Given the close links between education and occupation, it is perhaps not surprising to find that the inverse association identified above between child mental health problems and parental education is repeated in the case of the highest ranked occupation of any parent who was working at child age 11. As before, the gap in prevalence is strikingly wide, with the prevalence of severe mental health problems based on the SDQ total difficulties score being about five times as high among the children of workless parents as it is among the children of parents in the professional/managerial group. Measured in relative terms, the difference in prevalence between children with parents at opposite ends of the occupational scale is much the same among boys as it is among girls, but it is larger among boys when measured in absolute percentage points, reflecting the higher overall prevalence of severe mental health problems in this group. Thus the prevalence of parent-reported severe mental health problems among boys with workless parents is 27.2% compared with 5.8% among boys whose parents are in the occupational/managerial group, whereas the corresponding rates among girls are 15.2% and 2.9% respectively. Analysed by SDQ subscale, the prevalence gap is somewhat wider for externalising problems, particularly conduct problems, than it is for internalising problems.
Family income
Figure 4.6 shows the prevalence of severe mental health problems on the total difficulties measure analysed according to family income, with detailed information relating to the four SDQ subscales given in Appendix Table A.9.
In line with the strong links between occupational status and income, these figures again show a steep gradient in prevalence across the income scale. For example, 17.0% of all children from families in the bottom fifth of the income distribution are identified by their parents as having severe mental health problems, compared with only 4.1% among those from families in the top fifth. The proportions of children with severe problems in
the middle quintile are twice as large as among those in the top quintile and half as large as among those in the bottom quintile. As before, the slope of the gradient is broadly the same among boys as it is among girls and, analysed according to the four SDQ subscales, is most pronounced among children with conduct problems, irrespective of gender.
The fact that the risks of severe problems are greater for the lower income groups does not mean that they are totally absent from other groups in the population. As can be seen in the figures, there are some children in the middle and upper income groups who display severe problems. If we consider how many of those with severe problems are in each income group (rather than the proportion in each income group who have problems), it turns out that around two-thirds of the problems are found in the bottom two-fifths of the income range. Targeting the bottom two quintiles would miss the one third of cases spread (in diminishing proportion) over the top three bands. Targeting services at the lowest quintile only would miss two-thirds of the cases.
This illustrates Rose’s Paradox (Rose, 1992) that the highest risk group in a population does not necessarily account for the majority of the risk, which calls for a strategy of prevention in the population as a whole, as well as or instead of a concentration of effort on high risk groups. The pattern of risk concentration in total difficulties is similar in girls and boys, and fairly similar for the subscales. Conduct problems are more concentrated in the bottom two income groups (70%) and the others less so; hyperactivity/inattention and peer problems both have 60% of the cases from the bottom 40% of income, and emotional problems have 50%.
Information on the relationship between childhood mental health problems and family income is also given in the 2004 Child and Adolescent Mental Health Survey (Green et al., 2005), although income is measured in ranges of £ per week rather than quintiles. Converting the data to quintiles on the basis of interpolation, the figures suggest that in

19
Centre for Mental H
ealth REPORT Children of the new century
2004 the prevalence of severe mental health problems in children aged 11-16 was about three times as high among those in the bottom quintile of family income as among those in the
top quintile. This compares with a more than fourfold difference among 11-year-olds in 2012, suggesting that the income-related gradient in the prevalence of severe mental health
Figure 4.6: Percentages of 11-year-old children with severe mental health problems (total difficulties) by quintile of family income: parent ratings, UK, 2012
0
4
8
12
16
20
0
4
8
12
16
20
0
4
8
12
16
20
All children
Third
20%Top 20%
Fourth 20%
Bottom 20%
Second 20%
Girls
Boys
%
%
%
Third 20%
Top 20%
Fourth
20%Bottom
20%Second 20%
Third 20%
Top 20%
Fourth 20%
Bottom 20%
Second 20%

Centre for Mental H
ealth REPORT Children of the new century
20
problems has become somewhat steeper in recent years.
There is also evidence that an income gradient in externalising and emotional problems observed for 11-year-olds in MCS, 2012, was steeper than for similar mental health measures in 10-year-olds in 1980 (Goodman et al., 2015). This is based on preliminary analysis comparing the 1970 national birth cohort with MCS using a somewhat different approach to measuring mental health, based on a continuous score rather than the cut-off for severe problems adopted here.
Finally, it also appears that the income-related gradient in prevalence is much steeper among children than it is among adults. Evidence relating to the latter is given in the 2007 national Adult Psychiatric Morbidity Survey (McManus et al., 2009) and this shows that the combined prevalence of all clinically diagnosable mental health problems is about 1.5 times higher among adults in the bottom 20% of the income distribution than it is among those in the top 20%. This contrasts with the four-fold difference we have found among 11-year-old children. The reasons for this large difference between children and adults have not been widely noted or discussed in the literature and merit further research.

21
Centre for Mental H
ealth REPORT Children of the new century
Chapter 5: Recent trends
Introduction
This chapter examines recent changes over time in children’s mental health using parent and teacher reports from three nationally representative data sets: the British Child and Adolescent Mental Health Survey of 1999 (Meltzer et al., 2000), the repeat of this survey undertaken in 2004 (Green et al., 2005) and the survey of the MCS sample carried out in 2012. Because the 1999 and 2004 surveys did not cover Northern Ireland, parent reports relate to children living in Great Britain. Furthermore, as the 2012 teacher survey did not cover Scotland, teacher reports relate to children living in England and Wales.
More importantly, because the 1999 and 2004 surveys covered children of all ages between 5 and 16, the numbers of 11-year-olds in these surveys are relatively small, reducing the likelihood that observed changes over time will be found to be statistically significant. To address this, the samples of children from the 1999 and 2004 surveys have been expanded to cover 10-year-olds as well as 11-year-olds, taking advantage of the fact that about a third of all children in the MCS sample were aged 10 at the time they were surveyed in 2012. To minimise the extent of possible age bias, additional weights were applied to the SDQ
data in the MCS in order to have an equal representation of 10- and 11-year-olds. Socio-demographic characteristics of the three samples are given in Appendix Table A.10. The profiles are fairly similar, though they also reflect a general trend for fewer two-parent families to be married rather than cohabiting and for a decline in owner occupation.
Changes in mental health at a population level
The analyses presented so far in this report have focused mainly on children with severe mental health difficulties. However, in looking at trends over time, there may also be interest in taking a wider perspective, using SDQ scores averaged across the whole population of 10- and 11-year-olds in each of the three samples, in order to identify whether there has been any general improvement or deterioration in the mental health of children in this age group.
Average SDQ scores for total difficulties in 1999, 2004 and 2012 are shown in Figure 5.1 (parent ratings) and Figure 5.2 (teacher ratings). Detailed information relating to the four SDQ subscales is given in Appendix Tables A.11 and A.12. In all cases, higher scores represent worse mental health.
Figure 5.1: Average SDQ scores for total difficulties among 10- and 11-year-old children: parent ratings, Great Britain
0
2
4
6
8
10
MCS 2012
BCAMHS 2004
BCAMHS 1999
GirlsBoysAll children
SDQ scores

Centre for Mental H
ealth REPORT Children of the new century
22
Looking first at the data for total difficulties, the reports by parents suggest little change comparing 1999 and 2012. There was a statistically significant improvement in average SDQ scores for total difficulties, particularly among girls, between 1999 and 2004, but much of this was lost by 2012.
The reports by teachers paint a more optimistic picture, showing statistically significant improvements in the average score of total difficulties for all children, and for both boys and girls considered separately, between 1999 and 2012. For all children, and for girls but not boys on their own, there were also statistically significant improvements in the sub-period 2004 to 2012.
Detailed data on the four SDQ subscales also show contrasting results between parents and teachers. On parent reports, the only significant change between 1999 and 2012 was an improvement in scores for hyperactivity/inattention among boys. While parent reports show a decrease in hyperactivity/inattention and peer problems from 1999 to 2004 for girls, these improvements were lost by 2012. In fact, there was a statistically significant increase in girls’ hyperactivity/inattention from 2004.
Teacher reports, on the other hand, show improvements among both boys and girls in most areas of mental health, the main exception being emotional problems.
Changes in the prevalence of severe mental health problems
Returning to a focus on the group of children showing the worst SDQ symptoms, changes in the prevalence of severe mental health problems between 1999 and 2012 are shown in Figure 5.3 (parent ratings) and Figure 5.4 (teacher ratings.) Detailed data on the four SDQ subscales is given in Appendix Tables A.13 and A.14.
Figure 5.2: Average SDQ scores for total difficulties among 10- and 11-year-old children: teacher ratings, England and Wales
0
2
4
6
8
10
MCS 2012
BCAMHS 2004
BCAMHS 1999
GirlsBoysAll children
SDQ scores

23
Centre for Mental H
ealth REPORT Children of the new century
Figure 5.3: Percentages of 10- and 11-year-old children with severe mental health problems (total difficulties) in 1999, 2004 and 2012: parent ratings, Great Britain
0
4
8
12
16
MCS 2012
BCAMHS 2004
BCAMHS 1999
GirlsBoysAll children
%
0
4
8
12
16
MCS 2012
BCAMHS 2004
BCAMHS 1999
GirlsBoysAll children
%
Figure 5.4: Percentages of 10- and 11-year-old children with severe mental health problems (total difficulties) in 1999, 2004 and 2012: teacher ratings, England and Wales

Centre for Mental H
ealth REPORT Children of the new century
24
Looking first at the data on total difficulties, we again find conflicting results depending on whether the ratings are made by parents or teachers. According to parents’ reports, the proportion of 10- and 11-year-old children with severe problems increased somewhat between 1999 and 2012, but not enough to reach statistical significance, whether among all children combined or among boys or girls taken separately.
In contrast, teacher reports suggest that the prevalence of severe mental health problems fell significantly between 1999 and 2012. This applies to children as a whole and also to boys on their own but not to girls. In addition, there were significant falls in prevalence in all groupings including girls in the sub-period 2004 to 2012.
Turning to the individual SDQ subscales, the only significant change in parent reports between 1999 and 2012 was a decline in the prevalence of severe problems relating to hyperactivity and inattention, particularly among boys. There was also an increase in the prevalence of severe peer problems for girls from 2004. In contrast, the assessments by teachers again show more widespread improvements, covering conduct problems as well as hyperactivity/inattention among both boys and girls and also a decline in the prevalence of emotional problems among girls between 2004 and 2012.
Discussion
Overall, the findings set out in this chapter suggest that the mental health of 10- and 11-year-old children in this country improved slightly rather than deteriorated between 1999 and 2012. The picture is, however, somewhat mixed and it is also apparent that perceptions vary according to the gender of the child, the type of mental health problem concerned and whether assessments are provided by parents or teachers.
The last of these points is particularly important. For example, reports by parents identify only one area of consistent improvement between 1999 and 2012, whether this relates to average SDQ scores or the prevalence of severe
problems, namely hyperactivity/inattention among boys. In contrast, the assessments by teachers suggest improvements on a wider front, including conduct problems as well as hyperactivity/inattention and applying to girls as well as boys. The parents’ scores for total difficulties suggest a small and non-significant increase in the prevalence of severe problems, whereas teachers’ ratings indicate a significant fall in prevalence, particularly among boys as well as girls from 2004.
The mixed nature of these findings is in contrast to those reported in an earlier study which compared the mental health of children in the MCS when they were 7 years old with that of children of the same age in the 1999 and 2004 BCAMHS (Sellers et al., 2014). This found strong evidence of improving mental health over the period studied (1999-2008), including both a decline in average problem scores among all 7-year-olds and a fall in the relative numbers with severe problems for all symptom types. These improvements were observed in both parent and teacher reports and were more marked for boys than girls.
Various factors might explain the more varied picture found among 10- and 11-year-old children, including for example the impact on families of the economic recession which followed the financial crash of 2008/09. Another factor may be an increased focus on behaviour management in the classroom, which may further explain the differences between parent and teacher reports. It may also be the case that 10- and 11-year-old children show fewer mental health problems in the classroom than at home. Age 10 to 11 marks the beginning of puberty, and early adolescents might demonstrate different behaviours in front of their parents, as opposed to their teachers and peers. It will be of interest to assess whether or not the earlier and more clear-cut trend towards improving mental health among children has been maintained when data from the most recent sweep of the MCS (at child age 14) become available for comparison with the earlier surveys.

25
Centre for Mental H
ealth REPORT Children of the new century
Chapter 6: Incidence and persistence
Introduction
This chapter provides an analysis of severe mental health problems among those children in the MCS for whom valid data on mental health are available at all four of the surveys undertaken when the child was aged 3, 5, 7 and 11. We describe this data set as the longitudinal sample. From these records we can see how many children ever recorded a particular type of severe problem between the ages of 3 and 11 (incidence) and also how many with severe problems at age 11 also had these problems repeatedly before that (persistence). This is the sort of picture that can only be provided by longitudinal data.
A drawback with our longitudinal sample is that the picture has some pieces missing, in the form of nearly three thousand cases with incomplete records. We can tell that these exclusions have a somewhat different profile from those who are observed on all occasions, because the longitudinal sample understates the prevalence of severe mental health problems at age 11
compared with the estimates given elsewhere in this report. For example, the prevalence of severe problems at age 11 on the total difficulties score is 10.3% in the full sample but only 8.9% in the longitudinal sample. For the purpose of plotting the longitudinal results in graphs, we have made a crude adjustment for the missing cases, distributing them pro rata over those with and without severe problems at age 11 according to the information we have about them at that point. It is likely that children with recurrent severe problems are still under-represented after this adjustment.
Incidence
Figure 6.1 provides information on the number of different ages at which children in the longitudinal sample were assessed as having severe mental health problems based on the total difficulties score on parent's reports. A more detailed but unadjusted breakdown of the longitudinal sample is given in Appendix Table A.15.
Figure 6.1: Percentages of children with severe mental health problems (total difficulties) at different ages: parent ratings, UK
Problems at four ages
Problems at three ages
Problems at two ages
Problems at one age
No problems
All Children
Boys Girls

Centre for Mental H
ealth REPORT Children of the new century
26
Figure 6.1 indicates that among all children in the longitudinal sample just over a fifth (21.9%) were assessed with severe mental health problems in at least one of the four MCS surveys undertaken at child ages 3, 5, 7 and 11. One implication of this is that the incidence of severe problems during the course of childhood is considerably higher than the prevalence of these problems at any single age. For example, it was noted above that the prevalence of severe problems at age 11 was 10.3%. This is less than half the figure of 21.9% for incidence between ages 3 and 11. A major reason for the excess of incidence over prevalence is that as many as 7% of all children in the MCS were classified as having severe problems at age 3 only.
The estimate of 21.9% for incidence breaks down as follows: 12.7% of children had severe mental health problems at one age only, 5.1% had these problems at two different ages, 2.7% had problems at three ages and just 1.5% had severe problems at all four ages.
There was a higher incidence of severe mental health problems among boys than girls on all measures. For example, 26.0% of boys in the longitudinal sample are estimated to have experienced severe problems at least once, compared with 17.8% of girls. Twice as many boys as girls were assessed with severe problems at three different ages between 3 and 11, and over three times as many had severe problems at all four ages.
These features broadly apply to each of the four SDQ subscales, as shown in Appendix Tables A.16-19. Incidence is somewhat higher for externalising problems (conduct problems and hyperactivity/inattention) than it is for internalising problems (emotional problems and peer problems) but is always at least twice as high as prevalence. With the exception of emotional problems, where the pattern is very similar by gender, incidence is higher among boys than among girls on all measures.
Persistence
Appendix Tables A.15-19 provide a good deal of detailed information on patterns of persistence and recurrence in severe mental health problems during childhood. Because the main focus of this report is on the mental health of 11-year-old children, we look here at persistence and recurrence specifically among those in the longitudinal sample who were assessed with severe problems at this age. We have also chosen to present as ‘persistent’ cases all children who had severe problems at three or four surveys including at age 11. For these with severe problems at three surveys, it remains to be checked how far the apparently problem-free year had a score close to the threshold, as we suggested above might be the case.
The persistence of severe problems using the total difficulties score is summarised in Figure 6.2 below.
Figure 6.2: Incidence of severe mental health problems (total difficulties) by age 11: parent ratings, UK
0
5
10
15
20
25
3011 and 2 or 3 other ages
11 alone or + one other
Some but not age 11
GirlsBoysAll children
%

27
Centre for Mental H
ealth REPORT Children of the new century
This shows that 3.6% of all 11-year-old children are classified as having persistent problems, while a further 6.7% may be described as intermittent cases, referring to those who had severe problems at age 11 only or at age 11 and one other age. A further 11.6% of the sample had a severe rating at least once but not at age 11, while 78.1% had no severe problems at any age. Persistence as we have defined it is nearly three times as common among boys as among girls (5.1% against 1.8%). The numbers of intermittent cases are also higher among boys than girls although the difference is less pronounced (7.6% against 5.9%).
The percentages of 11-year-old children with persistent severe problems for each of the four SDQ subscales are as follows:
These estimates, based on data adjusted for prevalence in incomplete cases, show that a substantial proportion, but not all, of those with severe problems at age 11 have these problems persistently, and that rates of persistence are noticeably higher for externalising problems than they are for internalising problems. They are also roughly twice as high among boys as they are among girls except in the case of emotional problems.
Boys Girls All Children
Conduct Problems
6.3 3.4 4.9
Hyperactivity/inattention
8.1 3.0 5.6
Emotional Problems
2.1 2.0 2.1
Peer Problems 4.2 2.3 3.2

Centre for Mental H
ealth REPORT Children of the new century
28
T. and Goodman, R. (2005) Mental health of children and young people in Great Britain, 2004. London: Palgrave Macmillan.
McManus, S., Meltzer, H., Brugha, T., Bebbington, P. and Jenkins, R. (eds.) (2009) Adult psychiatry morbidity in England, 2007. London: NHS Information Centre for Health and Social Care.
Meltzer, H., Gatward, R., Goodman, R. and Ford, T. (2000) The mental health of children and adolescents in Great Britain. London: TSO.
Mostafa, T. (2014) Millennium Cohort Study: technical report on response in sweep 5 (age 11). London: Centre for Longitudinal Studies.
Plewis, I. (ed.) (2007 The Millennium Cohort Study: technical report on sampling (4th edition). London: Centre for Longitudinal Studies.
Rose, G. (1992). The strategy of preventive medicine. Oxford: Oxford Medical publications.
Sellers, R., Maughan, B., Pickles, A., Thapar, A. and Collishaw,S. (2014) Trends in parent- and teacher-rated emotional, conduct and ADHD problems and their impact in prepubertal children in Great Britain: 1999-2008. Journal of Child Psychology and Psychiatry, 56(1), 49-57.
Collishaw, S., Goodman, R., Ford, T., Rabe-Hesketh, S. and Pickles, A. (2009) How far are associations between child, family and community factors and child psychopathology informant-specific and informant-general? Journal of Child Psychology and Psychiatry, 50(5), 571-580.
De Los Reyes, A., Augenstein, T., Wang, M. et al. (2015) The validity of the multi-informant approach to assessing child and adolescent mental health. Psychological Bulletin, 141(4), 858-900.
George, A., Hansen, K., Schoon, I. (2006). Child Development. In: S. Dex & H. Joshi (Eds.). Millennium Cohort Study Second Survey. Descriptive Report. London: Centre for Longitudinal Studies.
Goodman, Alissa, Joshi, H., Nasim, B. and Tyler, C. (2015) Social and emotional skills in childhood and the long-term effects on adult life. Early Intervention Foundation Review, March 2015. London: UCL Institute of Education.
Goodman, Anna, Lamping, D. and Ploubidis, G. (2010) When to use broader internalising and externalising subscales instead of the hypothesised five subscales on the Strengths and Difficulties Questionnaire (SDQ): data from British parents, teachers and children. Journal of Abnormal Child Psychology, 38, 1179-1191.
Goodman, Anna, and Goodman, R. (2009) Strengths and Difficulties Questionnaire as a dimensional measure of child mental health. Journal of the American Academy of Child and Adolescent Psychiatry, 48(4), 400-403.
Goodman, R. (1997) The Strengths and Difficulties Questionnaire: a research note. Journal of Child Psychology and Psychiatry, 38(5), 581-586.
Goodman, R. (2001) Psychometric properties of the Strengths and Difficulties Questionnaire. Journal of the American Academy of Child and Adolescent Psychiatry, 40(11), 1337-1345.
Green, H., McGinnity, A., Meltzer, H., Ford,
References

29
Centre for Mental H
ealth REPORT Children of the new century
Boy
sG
irls
All C
hild
ren
SD
QN
one
Mod
erat
eS
ever
en
Non
eM
oder
ate
Sev
ere
nN
one
Mod
erat
eS
ever
eN
*χ2
p-va
lue
Cond
uct
Prob
lem
s74
.711
.4
13.9
6,45
881
.49.
78.
96,
340
77.9
10.6
11.5
12,7
9898
.01
p<.0
01
Hyp
er-
acti
vity
/ in
atte
ntio
n
76.4
8.1
15.5
6,43
987
.45.
57.
16,
322
81.7
6.8
11.5
12,7
6127
3.14
p<.0
01
Emot
iona
l Pr
oble
ms
81.1
7.2
11.7
6,44
980
.47.
512
.16,
333
80.8
7.3
11.9
12,7
82
1.1
7p
= .3
9
Peer
Pr
oble
ms
76.4
9.4
14.2
6,45
480
.98.
310
.86,
336
78.6
8.9
12.5
12,7
9045
.39
p <.
001
Tota
l Pr
oble
ms
79.3
8.0
12.7
6,43
186
.55.
77.
86,
320
82.8
6.9
10.3
12,7
5111
8.18
p<.0
01
Sam
ple
size
unw
eigh
ted.
Sta
tist
ical
test
s us
e co
rrec
tion
s fo
r sam
ple
desi
gn.
* Li
kelih
ood
rati
o χ2
test
pro
babi
lity
for c
ompa
riso
n of
boy
s an
d gi
rls.
App
endi
x Ta
ble
A.1
.Pe
rcen
tage
s of
11-
year
-old
chi
ldre
n w
ith
men
tal
heal
th p
robl
ems
(par
ent-
rate
d)
by S
DQ
subs
cale
: Un
ited
Kin
gdom
, 20
12

Centre for Mental H
ealth REPORT Children of the new century
30
Boy
sG
irls
All C
hild
ren
SD
QN
one
Mod
erat
eS
ever
en
Non
eM
oder
ate
Sev
ere
nN
one
Mod
erat
eS
ever
eN
*χ2
p-va
lue
Cond
uct
Prob
lem
s83
.75.
8 10
.53,
538
94.5
2.0
3.5
3,54
789
.04.
07.
07,
085
208.
52P<
.001
Hyp
er-
acti
vity
/ in
atte
ntio
n
78.6
6.6
14.8
3,53
894
.62.
13.
33,
547
86.5
4.4
9.1
7,08
538
8.70
P<.0
01
Emot
iona
l Pr
oble
ms
90.8
4.4
4.8
3,53
891
.54.
24.
33,
547
91.1
4.3
4.6
7,08
51.
34P<
.47
Peer
Pr
oble
ms
85.9
5.6
8.5
3,53
891
.13.
65.
33,
547
88.5
4.6
6.9
7,08
548
.00
P<.0
01
Tota
l Pr
oble
ms
78.2
10.5
11.3
3,53
890
.45.
14.
53,
547
84.2
7.8
8.0
7,08
520
0.25
p<
.001
Sam
ple
size
unw
eigh
ted.
Sta
tist
ical
test
s us
e co
rrec
tion
s fo
r sam
ple
desi
gn.
* Li
kelih
ood
rati
o χ2
test
pro
babi
lity
for c
ompa
riso
n of
boy
s an
d gi
rls.
App
endi
x Ta
ble
A.2
. Pe
rcen
tage
s of
11-
year
-old
chi
ldre
n w
ith
men
tal
heal
th p
robl
ems
(tea
cher
-rat
ed)
by S
DQ
subs
cale
: Eng
land
and
Wal
es, 2
012

31
Centre for Mental H
ealth REPORT Children of the new century
Boys Girls All Children
None 68.6 75.4 71.9
Conduct 3.8 3.3 3.6
Hyperactivity 5.0 2.4 3.7
Emotional 3.2 5.2 4.1
Peer 4.4 4.1 4.3
Hyper/Conduct 2.5 0.8 1.7
Emotional/Peer 1.6 2.1 1.8
Emotional/Hyper 1.0 0.6 0.8
Emotional/Conduct 0.8 0.9 0.9
Hyper/Peer 1.3 0.7 1.0
Conduct/Peer 1.3 0.7 1.0
Emotional/Hyper/Conduct 1.0 0.7 0.8
Emotional/Conduct/Peer 0.8 0.9 0.9
Emotional/Hyper/Peer 1.0 0.7 0.9
Conduct/Hyper/Peer 1.5 0.5 1.0
Emotional/Hyper/Conduct/Peer 2.2 1.0 1.6
N 6,431 6,320 12,751
Note: unweighted valid numbers of observations are presented.
Appendix Table A.3. Percentages of 11-year-old children with severe problems (parent-rated) in combinations of SDQ subscales: United Kingdom, 2012

Centre for Mental H
ealth REPORT Children of the new century
32
Conduct Problems
Hyperactivity/ Inattention
Emotional Problems
Peer Problems
Total Problems
All Children
England 11.6(12,987)
11.7(12,952)
12.2 (12,972)
13.0 (12,981)
10.6 (12,941)
Wales 11.3(771)
12.8 (769)
11.3(769)
12.2 (770)
10.6 (768)
Scotland 10.2(1,376)
9.1(1,376)
9.0(1,376)
9.0(1,376)
7.9(1,376)
N. Ireland 11.4(636)
11.9(634)
13.0(636)
11.5(636)
10.4(634)
χ² difference 3.66 5.90* 5.80 12.27** 5.31
Unweighted N 12,798 12,761 12,782 12,790 12,751
Boys
England 14.2(6,677)
15.6(6,654)
11.9(6,688)
14.9(6,673)
12.9(6,644)
Wales 13.3(414)
17.2(413)
11.4(413)
13.7(414)
13.7(413)
Scotland 11.9(686)
13.5(686)
9.4(686)
9.1(686)
10.1(686)
N. Ireland 12.5(342)
16.3(341)
12.3(342)
12.8(342)
12.8(341)
χ² difference 2.98 2.51 3.08 14.13*** 3.92
Unweighted N 6,458 6,439 6,449 6,454 6,431
Girls
England 8.8(6,261)
7.5(6,249)
12.5(6,255)
11.1(6,259)
8.1(6,248)
Wales 10.6(378)
8.0(378)
11.3(377)
10.6(378)
7.2(377)
Scotland 8.6(704)
4.7(704)
8.6(704)
8.9(704)
5.7(704)
N. Ireland 10.3(308)
7.2(307)
13.7(308)
10.0(308)
7.7(307)
χ² difference 1.94 6.27* 8.46* 2.78 4.26
Unweighted N 6,340 6,322 6,333 6,336 6,320
Note: the numbers in brackets are the weighted sample sizes for each cell; they should form the base for any aggregation across subgroups that may be required. The sum of these cell sizes exceeds the total unweighted sample size since the Wave 5 attrition weights gross up the unweighted numbers to reflect sample losses (Mostafa, 2014).
Appendix Table A.4. Percentages of 11-year-old children with severe problems (parent-rated) by country of residence at MCS5 and SDQ subscale: United Kingdom, 2012

33
Centre for Mental H
ealth REPORT Children of the new century
Conduct Problems
Hyperactivity/ Inattention
Emotional Problems
Peer Problems
Total Problems
All Children
White 12.0(13,521)
11.9 (13,486)
12.0(13,481)
12.4 (13,495)
10.6 (13,476)
Mixed 12.7(553)
12.9(551)
15.9(553)
13.9(553)
12.3(551)
Indian 3.7(287)
12.5(285)
8.2(287)
10.6(287)
5.0(285)
Pakistani/ Bangladeshi
8.2(712)
7.3(697)
11.4(706)
14.0(710)
7.8(695)
Black 7.5(519)
7.8(505)
8.4(517)
13.2(517)
10.1 (502)
Other 5.0(202)
7.4(201)
13.2(202)
17.9(202)
7.9(201)
χ² difference 38.45** 56.31*** 16.09 8.27 15.43
Unweighted N 12,798 12,761 12,782 12,790 12,751
Boys
White 14.7(6,916)
16.2 (6,912)
11.8(6,910)
14.1(6,914)
13.2(6,906)
Mixed 12.0(297)
14.1(296)
12.5(296)
12.7(296)
10.9(296)
Indian 3.6(162)
16.9(162)
9.5(162)
12.8(162)
4.5(162)
Pakistani/ Bangladeshi
9.2(352)
10.8(344)
10.8(349)
15.6(352)
9.3(342)
Black 10.9(286)
8.4(273)
8.8(284)
15.8(284)
12.9(271)
Other 8.4(104)
10.6(104)
14.0(104)
20.8(104)
9.6(104)
χ² difference 29.90** 22.09* 3.61 4.92 13.75
Unweighted N 6,458 6,439 6,449 6,454 6,431
Appendix Table A.5. Percentages of 11-year-old children with severe problems (parent-rated) by child ethnicity and SDQ subscale: United Kingdom

Centre for Mental H
ealth REPORT Children of the new century
34
Girls
White 9.2(6,574)
7.3(6,572)
12.1(6,572)
10.6(6,573)
7.8(6,571)
Mixed 13.6(256)
11.6(255)
19.9(256)
15.4(256)
13.8(255)
Indian 3.9(126)
6.7(124)
6.5(125)
7.7(126)
5.5(124)
Pakistani/ Bangladeshi
7.3(360)
4.9(354)
11.9(357)
12.5(359)
6.3(354)
Black 3.4(234)
6.1(231)
7.9(232)
10.0(232)
6.9(231)
Other 1.4(98)
4.6(98)
12.4(98)
14.8(98)
6.1(98)
χ² difference 23.88* 60.71*** 18.66 8.73 13.15
Unweighted N 6,340 6,322 6,333 6,336 6,320
Conduct Problems
Hyperactive/ Inattention
Emotional Problems
Peer Problems
Total Problems
Note: the numbers in brackets are the weighted sample sizes for each cell; they should form the base for any aggregation across subgroups that may be required. The sum of these cell sizes exceeds the total unweighted sample size since the Wave 5 attrition weights gross up the unweighted numbers to reflect sample losses (Mostafa, 2014).
Appendix Table A.5. continued

35
Centre for Mental H
ealth REPORT Children of the new century
Girls
White 9.2(6,574)
7.3(6,572)
12.1(6,572)
10.6(6,573)
7.8(6,571)
Mixed 13.6(256)
11.6(255)
19.9(256)
15.4(256)
13.8(255)
Indian 3.9(126)
6.7(124)
6.5(125)
7.7(126)
5.5(124)
Pakistani/ Bangladeshi
7.3(360)
4.9(354)
11.9(357)
12.5(359)
6.3(354)
Black 3.4(234)
6.1(231)
7.9(232)
10.0(232)
6.9(231)
Other 1.4(98)
4.6(98)
12.4(98)
14.8(98)
6.1(98)
χ² difference 23.88* 60.71*** 18.66 8.73 13.15
Unweighted N 6,340 6,322 6,333 6,336 6,320
Conduct Problems
Hyperactivity/Inattention
EmotionalProblems
Peer Problems
Total Problems
All children
Both naturalparents
7.1(9,530)
8.0(9,511)
9.9(9,520)
9.9(9,528)
6.6(9,506)
Lone natural parent
17.4(4,130)
15.4(4,122)
15.1(4,124)
15.9(4,127)
15.0(4,116)
Step and other family types
19.5(2,110)
20.0(2,099)
14.8(2,110)
17.9(2,109)
18.1(2,097)
χ2difference 366.13*** 264.10*** 78.55*** 129.17*** 303.00***
Unweighted N 12,798 12,761 12,782 12,790 12,751
Boys
Both naturalparents
8.6(4,844)
11.0(4,833)
9.8(4,837)
11.0(4,843)
8.2(4,828)
Lone natural parent
20.5(2,157)
20.0(2,154)
13.9(2,153)
18.0(2,155)
17.9(2,149)
Step and other family types
24.0(1,118)
26.7(1,107)
15.7(1,118)
21.1(1,116)
22.5(1,106)
χ2difference 228.15*** 168.29*** 35.86*** 87.97*** 186.55***
Unweighted N 6,458 6,439 6,449 6,454 6,431
Girls
Both naturalparents
5.6(4,686)
4.8(4,678)
9.9(4,683)
8.8(4,685)
5.0(4,678)
Lone natural parent
14.0(1,973)
10.4(1,968)
16.5(1,970)
13.7(1,972)
11.9(1,967)
Step and other family types
14.3(992)
12.6(992)
13.8(992)
14.4(992)
13.1(992)
χ2difference 133.97*** 91.85*** 49.23*** 40.74*** 113.20***
Unweighted N 6,340 6,322 6,333 6,336 6,320
Note: the numbers in brackets are the weighted sample sizes for each cell; they should form the base for any aggregation across subgroups that may be required. The sum of these cell sizes exceeds the total unweighted sample size since the Wave 5 attrition weights gross up the unweighted numbers to reflect sample losses (Mostafa, 2014).
Appendix Table A.6. Percentages of 11-year-old children with severe problems (parent-rated) by parents’ partnership status at MCS5 and SDQ subscale: United Kingdom, 2012

Centre for Mental H
ealth REPORT Children of the new century
36
Conduct Problems
Hyperactivity/Inattention
Emotional Problems Peer Problems Total Problems
All children
GCSE at gradeD-G
18.5(847)
18.7(846)
16.7(846)
18.0(846)
17.5(846)
GCSE at gradeA*-C
11.8(3,721)
12.8(3,719)
12.0(3,718)
12.8(3,721)
10.6(3,717)
AS and A-level
9.7(1,079)
11.7(1,078)
12.0(1,078)
9.7(1,079)
9.2(1,078)
Degree/diploma 6.7(4,067)
7.3(4,065)
8.1(4,064)
8.1(4,066)
5.5(4,062)
Higher degree 2.9(1,614)
5.4(1,614)
7.7(1,614)
8.4(1,614)
3.9(1,614)
Other overseas qualifications
14.8(597)
11.5(595)
12.6(595)
13.7(596)
11.0(593)
No academic qualifications
18.6 (3,139)
15.0 (3,111)
16.4 (3,133)
18.7 (3,136)
16.3 (3,106)
χ2difference 346.11*** 179.47*** 134.63*** 196.81*** 288.08***
Unweighted N 12,346 12,311 12,330 12,338 12,301
Boys
GCSE at gradeD-G
19.1(435)
23.0(435)
11.2(435)
16.0(435)
16.4(435)
GCSE at gradeA*-C
14.4(1,943)
17.4(1,942)
11.3(1,940)
14.7(1,943)
12.8(1,940)
AS and A-level
12.0(537)
16.2(537)
12.3(537)
11.5(537)
12.1(537)
Degree/diploma 8.1(2,126)
10.5(2,125)
7.8(2,124)
8.9(2,124)
6.9(2,122)
Higher degree 2.6(821)
7.6(821)
7.9(821)
10.7(821)
5.5(821)
Other overseas qualifications
19.0(312)
15.8(312)
13.7(310)
16.7(311)
15.2(310)
No academic qualifications
22.7 (1,570)
20.5 (1,549)
17.7 (1,566)
21.7 (1,568)
20.8 (1,544)
χ2difference 219.77*** 108.07*** 81.78*** 109.50*** 166.47***
Unweighted N 6,222 6,204 6,213 6,218 6,196
Appendix Table A.7. Percentages of 11-year-old children with severe problems (parent-rated) by highest parent academic qualification and SDQ subscale: United Kingdom, 2012

37
Centre for Mental H
ealth REPORT Children of the new century
Conduct Problems
Hyperactivity/Inattention
Emotional Problems
Peer Problems
Total Problems
Girls
GCSE at gradeD-G
17.7(412)
14.1(411)
22.6(411)
20.2(411)
18.6(411)
GCSE at gradeA*-C
8.8(1,978)
7.8(1,977)
12.8(1,977)
10.7(1,978)
8.2(1,977)
AS and A-level
7.4(542)
7.3(541)
11.7(541)
7.9(542)
6.3(541)
Degree/di-ploma
5.1(1,941)
3.7(1,941)
8.5(1,941)
7.1(1,941)
4.0(1,940)
Higher degree 3.2(793)
3.2(793)
7.4(793)
6.1(793)
2.2(793)
Other overseas qualifications
10.2(285)
6.8(284)
11.4(285)
10.4(285)
6.3(284)
No academic qualifications
14.4 (1,570)
9.5 (1,562)
15.0 (1,567)
15.6 (1,569)
11.8 (1,561)
2difference 140.27*** 83.16*** 81.44*** 106.44*** 153.27***
Unweighted N 6,124 6,107 6,117 6,120 6,105
Notes:
(i) The numbers in brackets are the weighted sample sizes for each cell; they should form the base for any aggregation across subgroups that may be required. The sum of these cell sizes exceeds the total unweighted sample size since the Wave 5 attrition weights gross up the unweighted numbers to reflect sample losses (Mostafa, 2014).
(ii) ‘Other overseas qualifications’ are included with ‘GCSE at grade D-G’ as ‘Low qualifications’ in Figure 4.4.

Centre for Mental H
ealth REPORT Children of the new century
38
Conduct Problems
Hyperactivity/Inattention
EmotionalProblems
PeerProblems
TotalProblems
All children
Professional/Managerial
5.3(3,383)
6.8(3,382)
7.7(3,382)
7.9(3,382)
4.4(3,381)
Intermediate 7.3(1,939)
8.9(1,937)
8.4(1,937)
9.6(1,939)
6.3(1,937)
Small Employer
6.5(1930)
8.4(1927)
9.3(1928)
9.8(1930)
5.7(1926)
LowerSupervisory
12.5(873)
10.1(871)
12.5(873)
13.2(872)
11.0(871)
Routine/Semi-Routine
11.1(3,772)
11.4(3,756)
12.5(3,769)
11.8(3,770)
10.7(3,753)
Workless 24.8 (2,575)
20.6 (2,564)
19.5 (2,567)
22.7 (2,573)
21.5 (2,558)
χ2difference 553.42*** 264.38*** 194.54*** 281.72*** 468.97***
Unweighted N 11,843 11,811 11,829 11,835 11,801
Boys
Professional/Managerial
6.0(1,741)
9.6(1,740)
7.4(1,740)
9.3(1,740)
5.8(1,739)
Intermediate 8.3(979)
11.9(979)
8.7(979)
11.6(979)
7.2(979)
Small Employer
9.4(992)
11.4(992)
9.0(992)
11.7(992)
7.6(991)
LowerSupervisory
15.5(455)
14.5(454)
12.8(455)
15.4(455)
13.4(454)
Routine/Semi-Routine
12.5(1,936)
15.7(1,922)
12.4(1,934)
13.0(1,934)
12.6(1,919)
Workless 30.3 (1,354)
27.6 (1,349)
18.8 (1,348)
25.3 (1,353)
27.2 (1,344)
χ2difference 363.35*** 179.01*** 92.95*** 148.74*** 312.32***
Unweighted N 5,979 5,964 5,972 5,975 5,956
Appendix Table A.8. Percentages of 11-year-old children with severe problems (parent-rated) by highest occupation held by parents at MCS5 (if working) and SDQ subscale: United Kingdom, 2012

39
Centre for Mental H
ealth REPORT Children of the new century
Conduct Problems
Hyperactivity/Inattention
EmotionalProblems
PeerProblems
TotalProblems
All children
Professional/Managerial
5.3(3,383)
6.8(3,382)
7.7(3,382)
7.9(3,382)
4.4(3,381)
Intermediate 7.3(1,939)
8.9(1,937)
8.4(1,937)
9.6(1,939)
6.3(1,937)
Small Employer
6.5(1930)
8.4(1927)
9.3(1928)
9.8(1930)
5.7(1926)
LowerSupervisory
12.5(873)
10.1(871)
12.5(873)
13.2(872)
11.0(871)
Routine/Semi-Routine
11.1(3,772)
11.4(3,756)
12.5(3,769)
11.8(3,770)
10.7(3,753)
Workless 24.8 (2,575)
20.6 (2,564)
19.5 (2,567)
22.7 (2,573)
21.5 (2,558)
χ2difference 553.42*** 264.38*** 194.54*** 281.72*** 468.97***
Unweighted N 11,843 11,811 11,829 11,835 11,801
Boys
Professional/Managerial
6.0(1,741)
9.6(1,740)
7.4(1,740)
9.3(1,740)
5.8(1,739)
Intermediate 8.3(979)
11.9(979)
8.7(979)
11.6(979)
7.2(979)
Small Employer
9.4(992)
11.4(992)
9.0(992)
11.7(992)
7.6(991)
LowerSupervisory
15.5(455)
14.5(454)
12.8(455)
15.4(455)
13.4(454)
Routine/Semi-Routine
12.5(1,936)
15.7(1,922)
12.4(1,934)
13.0(1,934)
12.6(1,919)
Workless 30.3 (1,354)
27.6 (1,349)
18.8 (1,348)
25.3 (1,353)
27.2 (1,344)
χ2difference 363.35*** 179.01*** 92.95*** 148.74*** 312.32***
Unweighted N 5,979 5,964 5,972 5,975 5,956
Girls
Professional/Managerial
4.5(1,642)
3.8(1,642)
8.1(1,642)
6.4(1,642)
2.9(1,642)
Intermediate 6.3(960)
5.9(959)
8.0(959)
7.5(960)
5.3(958)
Small Employer
3.5(938)
5.2(935)
9.5(936)
7.9(938)
3.6(935)
LowerSupervisory
9.2(418)
5.3(417)
12.3(418)
10.8(417)
8.6(417)
Routine/Semi-Routine
9.6(1,837)
7.0(1,834)
12.5(1,835)
10.5(1,836)
8.8(1,834)
Workless 18.7 (1,221)
12.9(1,215)
20.2(1,218)
19.9 (1,219)
15.2 (1,214)
χ2difference 194.38*** 83.69*** 103.11*** 132.95*** 158.20***
Unweighted N 5,864 5,847 5,857 5,860 5,845
Conduct Problems
Hyperactivity/Inattention
EmotionalProblems
PeerProblems
TotalProblems
Notes:
(i) The numbers in brackets are the weighted sample sizes for each cell; they should form the base for any aggregation across subgroups that may be required. The sum of these cell sizes exceeds the total unweighted sample size since the Wave 5 attrition weights gross up the unweighted numbers to reflect sample losses (Mostafa, 2014).
(ii) This is not a standard social class variable as the workless are not classified to their previous occupation.

Centre for Mental H
ealth REPORT Children of the new century
40
Conduct Problems
Hyperactivity/Inattention
EmotionalProblems
Peer Problems TotalProblems
All children
Bottom 20.8 (3,282)
17.2(3,262)
17.0 (3,269)
19.0 (3,279)
17.0 (3,255)
Second 17.0(3,407)
15.6(3,404)
13.9(3,405)
16.8(3,404)
15.6(3,399)
Third 8.9(3,110)
9.9(3,097)
11.2(3,109)
9.8(3,110)
8.3(3,097)
Fourth 5.4(3,003)
7.9(3,000)
9.5(3,002)
8.6(3,003)
5.5(3,000)
Top 3.7 (2,969)
6.1(2,969)
7.1 (2,969)
7.5 (2,969)
4.1(2,969)
χ2difference 561.01*** 234.05*** 145.35*** 252.31*** 379.78***
Unweighted N 12,798 12,761 12,782 12,790 12,751
Boys
Bottom 25.5(1,678)
23.8(1,667)
17.0(1,670)
21.3(1,678)
21.8(1,661)
Second 20.3(1,748)
19.8(1,747)
14.2(1,746)
19.6(1,745)
18.7(1,743)
Third 10.9(1,599)
13.2(1,588)
9.7(1,598)
9.6(1,599)
9.6(1,588)
Fourth 6.5(1,581)
10.1(1,578)
9.6(1,581)
10.7(1,581)
6.6(1,578)
Top 4.6(1,513)
9.7(1,513)
7.2(1,513)
8.6(1,513)
5.6(1,513)
χ2difference 352.36*** 152.83*** 77.95*** 154.09*** 251.29***
Unweighted N 6,458 6,439 6,449 6,454 6,431
Girls
Bottom 15.9(1,604)
10.2(1,595)
17.1(1,599)
16.5(1,601)
12.0(1,594)
Second 13.5(1,660)
11.1(1,657)
13.6(1,659)
13.8(1,659)
12.2(1,657)
Third 6.7(1,511)
6.4(1,509)
12.8(1,511)
10.0(1,511)
6.9(1,509)
Fourth 4.2(1,422)
5.4(1,422)
9.4(1,421)
6.2(1,422)
4.3(1,421)
Top 2.7(1,456)
2.4(1,456)
6.9(1,456)
6.4(1,456)
2.6(1,456)
χ2difference 212.48*** 96.69*** 72.95*** 17.82*** 135.71***
Unweighted N 6,340 6,322 6,333 6,336 6,320
Note: the numbers in brackets are the weighted sample sizes for each cell; they should form the base for any aggregation across subgroups that may be required. The sum of these cell sizes exceeds the total unweighted sample size since the Wave 5 attrition weights gross up the unweighted numbers to reflect sample losses (Mostafa, 2014).
Appendix Table A.9. Percentages of 11-year-old children with severe problems (parent-rated) by equivalised income quintiles at MCS5 and SDQ subscale: United Kingdom, 2012
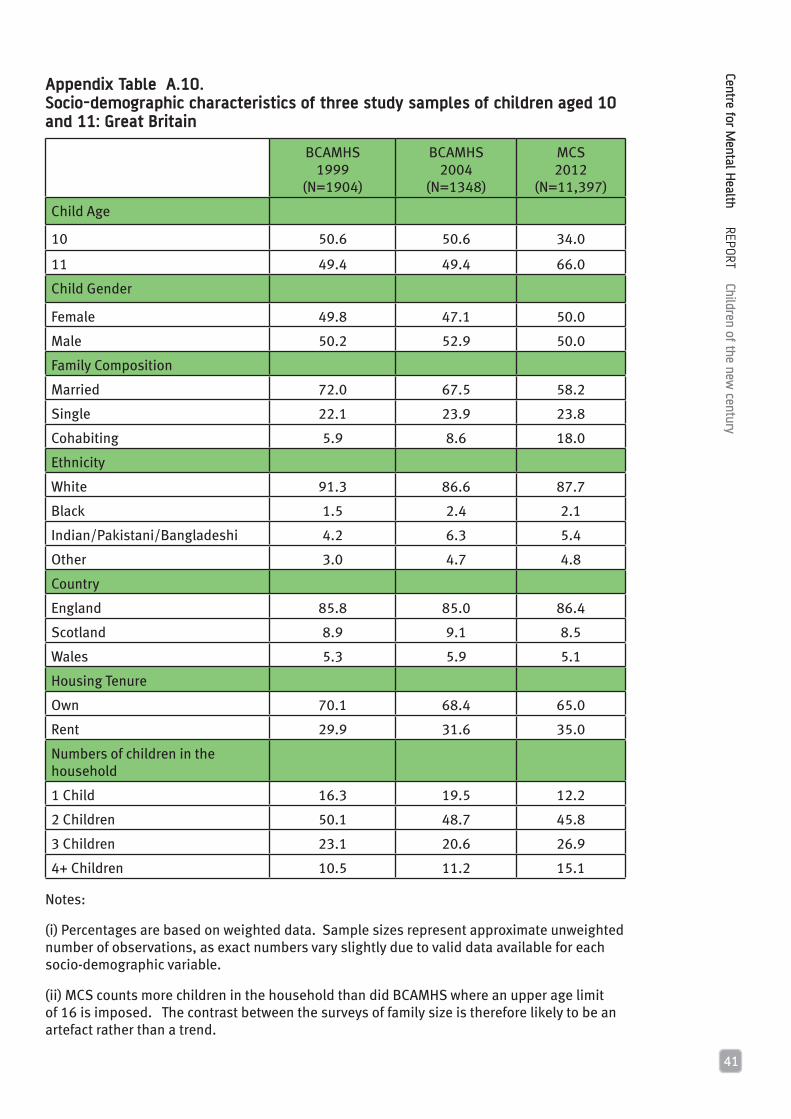
41
Centre for Mental H
ealth REPORT Children of the new century
BCAMHS 1999
(N=1904)
BCAMHS2004
(N=1348)
MCS2012
(N=11,397)
Child Age
10 50.6 50.6 34.0
11 49.4 49.4 66.0
Child Gender
Female 49.8 47.1 50.0
Male 50.2 52.9 50.0
Family Composition
Married 72.0 67.5 58.2
Single 22.1 23.9 23.8
Cohabiting 5.9 8.6 18.0
Ethnicity
White 91.3 86.6 87.7
Black 1.5 2.4 2.1
Indian/Pakistani/Bangladeshi 4.2 6.3 5.4
Other 3.0 4.7 4.8
Country
England 85.8 85.0 86.4
Scotland 8.9 9.1 8.5
Wales 5.3 5.9 5.1
Housing Tenure
Own 70.1 68.4 65.0
Rent 29.9 31.6 35.0
Numbers of children in the household
1 Child 16.3 19.5 12.2
2 Children 50.1 48.7 45.8
3 Children 23.1 20.6 26.9
4+ Children 10.5 11.2 15.1
Notes:
(i) Percentages are based on weighted data. Sample sizes represent approximate unweighted number of observations, as exact numbers vary slightly due to valid data available for each socio-demographic variable.
(ii) MCS counts more children in the household than did BCAMHS where an upper age limit of 16 is imposed. The contrast between the surveys of family size is therefore likely to be an artefact rather than a trend.
Appendix Table A.10. Socio-demographic characteristics of three study samples of children aged 10 and 11: Great Britain

Centre for Mental H
ealth REPORT Children of the new century
42
SD
QB
CAM
HS
1999
Mea
n(S
D)
Confi
denc
e In
terv
alB
CAM
HS
2004
Mea
n(S
D)
Confi
denc
e In
terv
alM
CS20
12M
ean(
SD
)
Confi
denc
eIn
terv
alCo
hort
Diff
eren
ce(p
< .0
5)*
Cohe
n’s
d*
Cond
uct P
robl
ems
Boy
s1.
66(1
.75)
1.54
-1.7
71.
59(1
.87)
1.45
-1.7
31.
69(1
.82)
1.63
-1.7
6
Gir
ls1.
30(1
.55)
1.20
-1.4
01.
25(1
.53)
1.13
-1.3
71.
33(1
.50)
1.27
-1.3
9
Tota
l1.
48(1
.66)
1.40
-1.5
51.
43(1
.72)
1.34
-1.5
21.
52(1
.68)
1.47
-1.5
7
Hyp
erac
tivi
ty/
inat
tent
ion
Boy
s3.
96(2
.72)
3.79
-4.1
33.
65(2
.71)
3.45
-3.8
53.
76(2
.61)
3.67
-3.8
61>
2, 3
.1
2, .0
8
Gir
ls2.
85(2
.41)
2.70
-3.0
12.
55(2
.36)
2.36
-2.7
32.
79(2
.30)
2.69
-2.8
91,
3 >2
.13,
.09
Tota
l3.
41(2
.62)
3.29
-3.5
33.
12(2
.61)
2.98
-3.2
63.
29(2
.51)
3.22
-3.3
61>
2 .1
1
Emot
iona
l Pro
blem
s
Boy
s1.
86(2
.01)
1.73
-1.9
81.
98(2
.00)
1.82
-2.1
41.
90(2
.03)
1.83
-1.9
7
Gir
ls2.
13(2
.09)
1.99
-2.2
61.
96(1
.99)
1.82
-2.0
71.
99(2
.03)
1.90
-2.0
6
Tota
l1.
99(2
.05)
1.90
-2.0
81.
98(2
.05)
1.87
-2.0
91.
94(2
.02)
1.88
-1.9
9
Peer
Pro
blem
s
Boy
s1.
59(1
.80)
1.47
-1.7
01.
55(1
.80)
1.42
-1.6
91.
57(1
.86)
1.50
-1.6
3
Gir
ls1.
44(1
.61)
1.34
-1.5
41.
24(1
.45)
1.13
-1.3
61.
35(1
.65)
1.28
-1.4
11>
2 .1
2
Tota
l1.
51(1
.71)
1.44
-1.5
91.
41(1
.65)
1.32
-1.4
91.
47(1
.77)
1.42
-1.5
2
Tota
l Pro
blem
s
Boy
s9.
06(5
.97)
8.68
-9.4
48.
76(6
.37)
8.29
-9.2
38.
93(6
.45)
8.69
-9.1
6
Gir
ls7.
72(5
.44)
7.37
-8.0
77.
02(5
.52)
6.59
-7.4
57.
45(5
.66)
7.22
-7.6
81>
2 .1
3
Tota
l8.
39(5
.75)
8.14
-8.6
57.
93(6
.04)
7.61
-8.2
68.
21(6
.13)
8.03
-8.3
91>
2 .0
8N
ote:
the
appr
oxim
ate
sam
ple
size
s ar
e 95
7 =
boy
s, 9
47 =
gir
ls fo
r 199
9; 7
06 =
boy
s, 6
42 =
gir
ls fo
r 200
4; a
nd 5
,748
= b
oys,
5,6
49 =
gir
ls fo
r 201
2.
MCS
SD
Q d
ata
wer
e w
eigh
ted
so th
at 1
0- a
nd 1
1-ye
ar-o
ld c
hild
ren
repr
esen
ted
equi
vale
nt p
ropo
rtio
ns in
all
anal
yses
. *
Sig
nific
ant e
ffec
ts o
nly.
Coh
en’s
d is
an
effe
ct s
ize
used
to in
dica
te th
e st
anda
rdis
ed d
iffer
ence
bet
wee
n tw
o m
eans
.
App
endi
x Ta
ble
A 1
1.
Pare
nt-r
ated
mea
ns a
nd s
tand
ard
devi
atio
ns o
f SD
Q sc
ores
for
10
- an
d 11
-yea
r-ol
ds in
199
9, 2
00
4 a
nd 2
012
: Gr
eat
Brit
ain
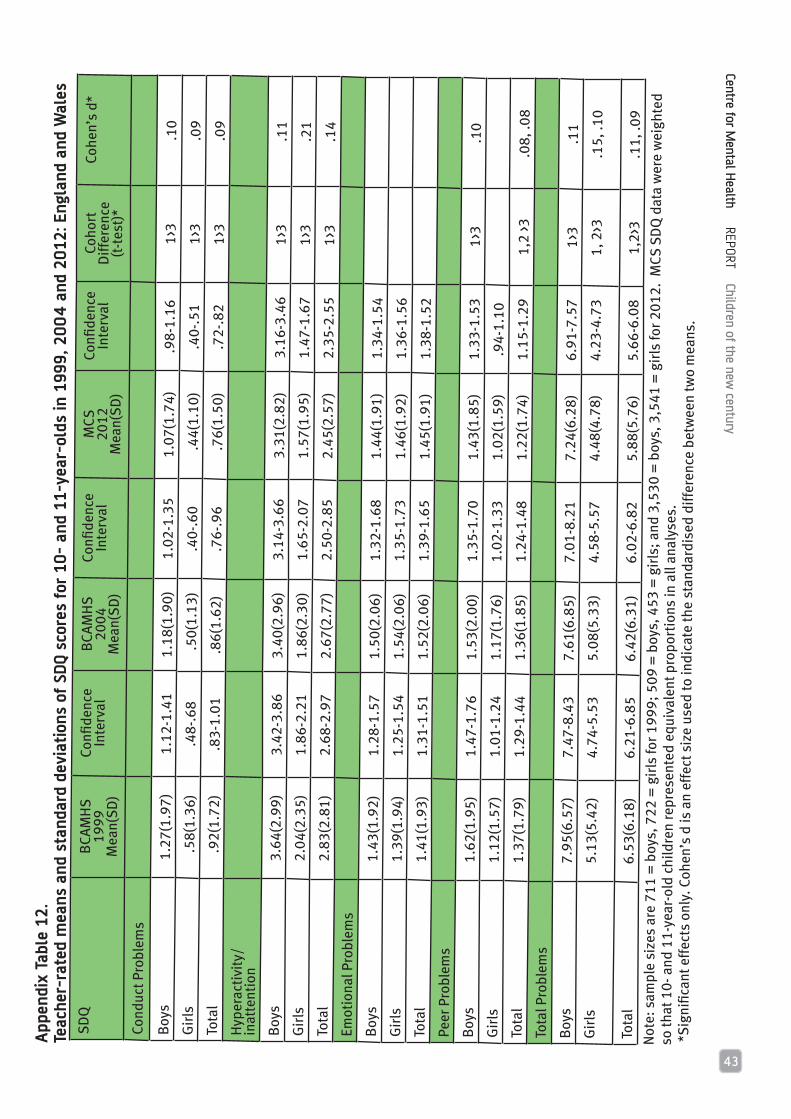
43
Centre for Mental H
ealth REPORT Children of the new century
SD
QB
CAM
HS
1999
Mea
n(S
D)
Confi
denc
e In
terv
alB
CAM
HS
2004
Mea
n(S
D)
Confi
denc
e In
terv
alM
CS20
12M
ean(
SD
)
Confi
denc
eIn
terv
alCo
hort
Diff
eren
ce(p
< .0
5)*
Cohe
n’s
d*
Cond
uct P
robl
ems
Boy
s1.
66(1
.75)
1.54
-1.7
71.
59(1
.87)
1.45
-1.7
31.
69(1
.82)
1.63
-1.7
6
Gir
ls1.
30(1
.55)
1.20
-1.4
01.
25(1
.53)
1.13
-1.3
71.
33(1
.50)
1.27
-1.3
9
Tota
l1.
48(1
.66)
1.40
-1.5
51.
43(1
.72)
1.34
-1.5
21.
52(1
.68)
1.47
-1.5
7
Hyp
erac
tivi
ty/
inat
tent
ion
Boy
s3.
96(2
.72)
3.79
-4.1
33.
65(2
.71)
3.45
-3.8
53.
76(2
.61)
3.67
-3.8
61>
2, 3
.1
2, .0
8
Gir
ls2.
85(2
.41)
2.70
-3.0
12.
55(2
.36)
2.36
-2.7
32.
79(2
.30)
2.69
-2.8
91,
3 >2
.13,
.09
Tota
l3.
41(2
.62)
3.29
-3.5
33.
12(2
.61)
2.98
-3.2
63.
29(2
.51)
3.22
-3.3
61>
2 .1
1
Emot
iona
l Pro
blem
s
Boy
s1.
86(2
.01)
1.73
-1.9
81.
98(2
.00)
1.82
-2.1
41.
90(2
.03)
1.83
-1.9
7
Gir
ls2.
13(2
.09)
1.99
-2.2
61.
96(1
.99)
1.82
-2.0
71.
99(2
.03)
1.90
-2.0
6
Tota
l1.
99(2
.05)
1.90
-2.0
81.
98(2
.05)
1.87
-2.0
91.
94(2
.02)
1.88
-1.9
9
Peer
Pro
blem
s
Boy
s1.
59(1
.80)
1.47
-1.7
01.
55(1
.80)
1.42
-1.6
91.
57(1
.86)
1.50
-1.6
3
Gir
ls1.
44(1
.61)
1.34
-1.5
41.
24(1
.45)
1.13
-1.3
61.
35(1
.65)
1.28
-1.4
11>
2 .1
2
Tota
l1.
51(1
.71)
1.44
-1.5
91.
41(1
.65)
1.32
-1.4
91.
47(1
.77)
1.42
-1.5
2
Tota
l Pro
blem
s
Boy
s9.
06(5
.97)
8.68
-9.4
48.
76(6
.37)
8.29
-9.2
38.
93(6
.45)
8.69
-9.1
6
Gir
ls7.
72(5
.44)
7.37
-8.0
77.
02(5
.52)
6.59
-7.4
57.
45(5
.66)
7.22
-7.6
81>
2 .1
3
Tota
l8.
39(5
.75)
8.14
-8.6
57.
93(6
.04)
7.61
-8.2
68.
21(6
.13)
8.03
-8.3
91>
2 .0
8N
ote:
the
appr
oxim
ate
sam
ple
size
s ar
e 95
7 =
boy
s, 9
47 =
gir
ls fo
r 199
9; 7
06 =
boy
s, 6
42 =
gir
ls fo
r 200
4; a
nd 5
,748
= b
oys,
5,6
49 =
gir
ls fo
r 201
2.
MCS
SD
Q d
ata
wer
e w
eigh
ted
so th
at 1
0- a
nd 1
1-ye
ar-o
ld c
hild
ren
repr
esen
ted
equi
vale
nt p
ropo
rtio
ns in
all
anal
yses
. *
Sig
nific
ant e
ffec
ts o
nly.
Coh
en’s
d is
an
effe
ct s
ize
used
to in
dica
te th
e st
anda
rdis
ed d
iffer
ence
bet
wee
n tw
o m
eans
.
SD
QB
CAM
HS
1999
Mea
n(S
D)
Confi
denc
eIn
terv
alB
CAM
HS
2004
Mea
n(S
D)
Confi
denc
eIn
terv
alM
CS20
12M
ean(
SD
)
Confi
denc
eIn
terv
alCo
hort
Diff
eren
ce(t
-tes
t)*
Cohe
n’s
d*
Cond
uct P
robl
ems
Boy
s1.
27(1
.97)
1.12
-1.4
11.
18(1
.90)
1.02
-1.3
51.
07(1
.74)
.98-
1.16
1>3
.10
Gir
ls .
58(1
.36)
.48-
.68
.50
(1.1
3).4
0-.6
0 .
44(1
.10)
.40-
.51
1>3
.09
Tota
l .
92(1
.72)
.83-
1.01
.86(
1.62
).7
6-.9
6 .
76(1
.50)
.72-
.82
1>3
.09
Hyp
erac
tivi
ty/
inat
tent
ion
Boy
s3.
64(2
.99)
3.42
-3.8
63.
40(2
.96)
3.14
-3.6
63.
31(2
.82)
3.16
-3.4
61>
3.1
1G
irls
2.04
(2.3
5)1.
86-2
.21
1.86
(2.3
0)1.
65-2
.07
1.57
(1.9
5)1.
47-1
.67
1>3
.21
Tota
l2.
83(2
.81)
2.68
-2.9
72.
67(2
.77)
2.50
-2.8
52.
45(2
.57)
2.35
-2.5
51>
3 .1
4Em
otio
nal P
robl
ems
Boy
s1.
43(1
.92)
1.28
-1.5
71.
50(2
.06)
1.32
-1.6
81.
44(1
.91)
1.34
-1.5
4G
irls
1.39
(1.9
4)1.
25-1
.54
1.54
(2.0
6)1.
35-1
.73
1.46
(1.9
2)1.
36-1
.56
Tota
l1.
41(1
.93)
1.31
-1.5
11.
52(2
.06)
1.39
-1.6
51.
45(1
.91)
1.38
-1.5
2Pe
er P
robl
ems
Boy
s1.
62(1
.95)
1.47
-1.7
61.
53(2
.00)
1.35
-1.7
01.
43(1
.85)
1.33
-1.5
31>
3.1
0G
irls
1.12
(1.5
7)1.
01-1
.24
1.17
(1.7
6)1.
02-1
.33
1.02
(1.5
9).9
4-1.
10To
tal
1.37
(1.7
9)1.
29-1
.44
1.36
(1.8
5)1.
24-1
.48
1.22
(1.7
4)1.
15-1
.29
1,2
>3
.08,
.08
Tota
l Pro
blem
s
Boy
s7.
95(6
.57)
7.47
-8.4
37.
61(6
.85)
7.01
-8.2
17.
24(6
.28)
6.91
-7.5
71>
3 .1
1G
irls
5.13
(5.4
2)4.
74-5
.53
5.08
(5.3
3)4.
58-5
.57
4.48
(4.7
8)4.
23-4
.73
1, 2
>3.1
5, .1
0
Tota
l6.
53(6
.18)
6.21
-6.8
56.
42(6
.31)
6.02
-6.8
25.
88(5
.76)
5.66
-6.0
81,
2>3
.11,
.09
Not
e: s
ampl
e si
zes
are
711
= b
oys,
722
= g
irls
for 1
999;
509
= b
oys,
453
= g
irls
; and
3,5
30 =
boy
s, 3
,541
= g
irls
for 2
012.
MCS
SD
Q d
ata
wer
e w
eigh
ted
so th
at 1
0- a
nd 1
1-ye
ar-o
ld c
hild
ren
repr
esen
ted
equi
vale
nt p
ropo
rtio
ns in
all
anal
yses
. *
Sig
nific
ant e
ffec
ts o
nly.
Coh
en’s
d is
an
effe
ct s
ize
used
to in
dica
te th
e st
anda
rdis
ed d
iffer
ence
bet
wee
n tw
o m
eans
.
App
endi
x Ta
ble
12.
Teac
her-
rate
d m
eans
and
sta
ndar
d de
viat
ions
of
SDQ
scor
es f
or 1
0-
and
11-y
ear-
olds
in 1
999,
20
04
and
20
12: E
ngla
nd a
nd W
ales

Centre for Mental H
ealth REPORT Children of the new century
44
SDQ BCAMHS1999
BCAMHS 2004
MCS2012
CohortDifference
(p < .05)
Conduct Problems
Boys 13.7 15.6 14.3
Girls 8.6 8.5 8.9
Total 11.2 12.2 11.7
Hyperactivity/ inattention
Boys 19.2 15.7 15.4 1>3
Girls 9.4 7.3 7.7
Total 14.4 11.7 11.8 1>2, 3
Emotional Problems
Boys 11.1 12.4 11.6
Girls 13.5 11.4 12.0
Total 12.3 11.9 11.9
Peer Problems
Boys 14.9 14.6 13.9
Girls 10.9 8.3 10.9 2<3
Total 12.9 11.6 12.8
Total Problems
Boys 11.9 13.0 13.1
Girls 6.9 6.2 8.0
Total 9.4 9.8 10.6
Note: the approximate sample sizes are 957 = boys, 947 = girls for 1999; 706 = boys, 642 = girls for 2004; and 5,748 = boys, 5,649 = girls for 2012. MCS SDQ data were weighted so that 10- and 11-year-old children represented equivalent proportions in all analyses.
Appendix Table A.13. Percentages of 10- and 11-year-olds with severe parent-rated SDQ scores in 1999, 2004 and 2012: Great Britain
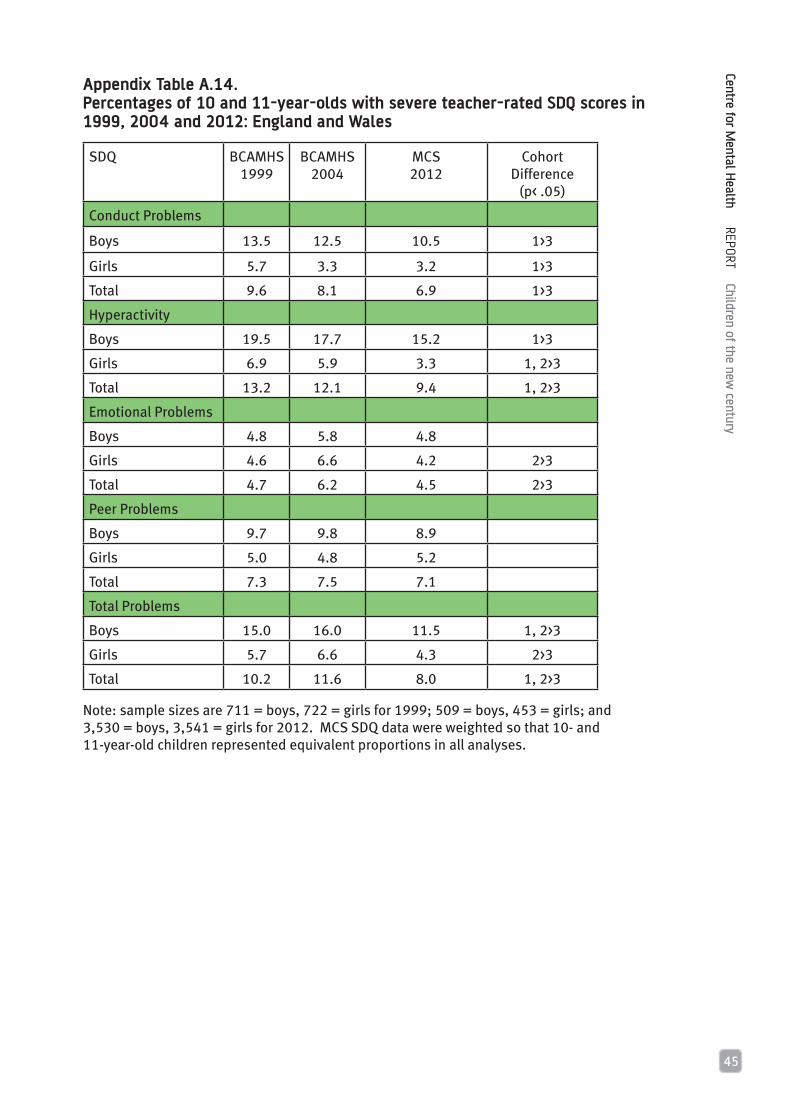
45
Centre for Mental H
ealth REPORT Children of the new century
Appendix Table A.14. Percentages of 10 and 11-year-olds with severe teacher-rated SDQ scores in 1999, 2004 and 2012: England and Wales
SDQ BCAMHS1999
BCAMHS2004
MCS2012
Cohort Difference
(p< .05)
Conduct Problems
Boys 13.5 12.5 10.5 1>3
Girls 5.7 3.3 3.2 1>3
Total 9.6 8.1 6.9 1>3
Hyperactivity
Boys 19.5 17.7 15.2 1>3
Girls 6.9 5.9 3.3 1, 2>3
Total 13.2 12.1 9.4 1, 2>3
Emotional Problems
Boys 4.8 5.8 4.8
Girls 4.6 6.6 4.2 2>3
Total 4.7 6.2 4.5 2>3
Peer Problems
Boys 9.7 9.8 8.9
Girls 5.0 4.8 5.2
Total 7.3 7.5 7.1
Total Problems
Boys 15.0 16.0 11.5 1, 2>3
Girls 5.7 6.6 4.3 2>3
Total 10.2 11.6 8.0 1, 2>3
Note: sample sizes are 711 = boys, 722 = girls for 1999; 509 = boys, 453 = girls; and 3,530 = boys, 3,541 = girls for 2012. MCS SDQ data were weighted so that 10- and 11-year-old children represented equivalent proportions in all analyses.

Centre for Mental H
ealth REPORT Children of the new century
46
Boys Girls All children
None 75.4 83.1 79.3
Age 3 7.7 6.5 7.1
Age 5 0.8 0.6 0.7
Age 7 1.8 0.6 1.2
Age 11 3.5 3.1 3.3
Age 3/Age 5 1.2 0.7 0.9
Age 7/Age 11 1.3 0.8 1.0
Age 5/Age 7 0.3 0.2 0.3
Age 5/Age 11 0.5 0.2 0.4
Age 3/Age 7 1.0 1.0 1.0
Age 3/Age 11 1.3 1.0 1.1
Age 3/Age 5/Age 7 0.7 0.6 0.6
Age 3/Age 5/Age 11 0.5 0.2 0.4
Age 3/Age 7/Age 11 1.0 0.5 0.8
Age 5/Age 7/Age 11 1.0 0.3 0.6
Age 3/Age 5/Age 7/Age 11 2.0 0.6 1.3
N(5,758)4,797
(5,586)4,798
(11,344)9,595
Note: this table is based on cases with valid data in the longitudinal sample. Weighted counts are presented in brackets, showing the data on which each percentage is based; the unweighted number of observations is given below this.
Appendix Table A.15. Percentages of MCS children with severe problems (total difficulties, parent ratings) at ages 3 to 11: United Kingdom

47
Centre for Mental H
ealth REPORT Children of the new century
Boys Girls All children
None 66.7 74.1 70.3
Age 3 9.4 10.7 10.0
Age 5 2.9 1.5 2.2
Age 7 2.1 1.5 1.8
Age 11 3.2 2.4 2.8
Age 3/Age 5 1.9 1.7 1.8
Age 7/Age 11 1.4 .7 1.1
Age 5/Age 7 1.1 .7 .9
Age 5/Age 11 .7 .3 .5
Age 3/Age 7 1.7 1.3 1.5
Age 3/Age 11 1.7 1.3 1.5
Age 3/Age 5/Age 7 1.4 .9 1.2
Age 3/Age 5/Age 11 .7 .7 .7
Age 3/Age 7/Age 11 1.4 .7 1.0
Age 5/Age 7/Age 11 1.0 .3 .7
Age 3/Age 5/Age 7/Age 11 2.7 1.2 2.0
N (5,941)4,959
(5,739)4,932
(11,680)9,891
Note: this table is based on cases with valid data in the longitudinal sample. Weighted counts are presented in brackets, showing the data on which each percentage is based; the unweighted number of observations is given below this.
Appendix Table A.16. Percentages of MCS children with severe conduct problems (parent ratings) at ages 3 to 11: United Kingdom

Centre for Mental H
ealth REPORT Children of the new century
48
Boys Girls All children
None 66.9 79.1 72.9
Age 3 7.0 5.9 6.4
Age 5 2.2 1.9 2.0
Age 7 3.9 2.3 3.1
Age 11 3.5 2.4 3.0
Age 3/Age 5 1.9 1.3 1.6
Age 7/Age 11 1.9 .9 1.4
Age 5/Age 7 1.2 1.2 1.2
Age 5/Age 11 .7 .2 .5
Age 3/Age 7 1.1 1.0 1.1
Age 3/Age 11 .7 .3 .5
Age 3/Age 5/Age 7 1.6 .8 1.2
Age 3/Age 5/Age 11 .5 .3 .4
Age 3/Age 7/Age 11 1.3 .5 .9
Age 5/Age 7/Age 11 2.1 .8 1.5
Age 3/Age 5/Age 7/Age 11 3.5 1.1 2.3
N (5,872)4,891
(5,667)4,869
(11,539)9,760
Note: this table is based on cases with valid data in the longitudinal sample. Weighted counts are presented in brackets, showing the data on which each percentage is based; the unweighted number of observations is given below this.
Appendix Table A.17. Percentages of MCS children with severe hyperactivity/inattention problems (parent ratings) at ages 3 to 11: United Kingdom

49
Centre for Mental H
ealth REPORT Children of the new century
Boys Girls All children
None 78.0 78.2 78.1
Age 3 4.4 3.9 4.1
Age 5 1.4 1.8 1.6
Age 7 3.1 1.8 2.5
Age 11 5.6 6.9 6.3
Age 3/Age 5 .6 .6 .6
Age 7/Age 11 1.7 1.7 1.7
Age 5/Age 7 .7 .6 .6
Age 5/Age 11 .5 .4 .4
Age 3/Age 7 .5 .8 .7
Age 3/Age 11 1.1 .9 1.0
Age 3/Age 5/Age 7 .4 .4 .4
Age 3/Age 5/Age 11 .2 .5 .3
Age 3/Age 7/Age 11 .3 .5 .4
Age 5/Age 7/Age 11 .9 .5 .7
Age 3/Age 5/Age 7/Age 11 .6 .5 .6
N (5,913)4,933
(5,709)4,908
(11,622)9,841
Note: this table is based on cases with valid data in the longitudinal sample. Weighted counts are presented in brackets, showing the data on which each percentage is based; the unweighted number of observations is given below this.
Appendix Table A.18. Percentages of MCS children with severe emotional problems (parent ratings) at ages 3 to 11: United Kingdom

Centre for Mental H
ealth REPORT Children of the new century
50
Boys Girls All children
None 71.3 77.3 74.2
Age 3 7.1 5.7 6.4
Age 5 2.2 1.7 1.9
Age 7 3.1 2.6 2.9
Age 11 5.3 5.0 5.2
Age 3/Age 5 1.0 1.0 1.0
Age 7/Age 11 2.0 1.2 1.6
Age 5/Age 7 .7 .7 .7
Age 5/Age 11 .7 .3 .5
Age 3/Age 7 .8 .8 .8
Age 3/Age 11 1.2 1.3 1.2
Age 3/Age 5/Age 7 .8 .3 .6
Age 3/Age 5/Age 11 .4 .4 .4
Age 3/Age 7/Age 11 .6 .6 .6
Age 5/Age 7/Age 11 1.3 .6 1.0
Age 3/Age 5/Age 7/Age 11 1.5 .5 1.0
N (5,881)4,896
(5,698)4,899
(11,579)9,795
Note: this table is based on cases with valid data in the longitudinal sample. Weighted counts are presented in brackets, showing the data on which each percentage is based; the unweighted number of observations is given below this.
Appendix Table A.19. Percentages of MCS children with severe peer problems (parent ratings) at ages 3 to 11: United Kingdom

51
Centre for Mental H
ealth REPORT Children of the new century

Children of the new century
Published November 2015
Photograph: istockphoto.com/OJO_Images
£10 where sold
© Centre for Mental Health, 2015
Recipients (journals excepted) are free to copy or use the material from this paper, provided that the source is appropriately acknowledged.
Register for our emails at www.centreformentalhealth.org.uk
Centre for Mental Health
134-138 Borough High Street, London SE1 1LB
Tel 020 7827 8300
Fax 020 7827 8369
www.centreformentalhealth.org.uk
Charity registration no. 1091156. A company
limited by guarantee registered in England and
Wales no. 4373019.