
Children in each of 11 classrooms before they process ... · An Evaluation of Elementary Science...
120
DOCUMENT RESUME ED 027 217 SE 006 2139 By-Nicodem0s, Robert B. An Evaluation of Elementary Science Study as Science A Process Approach. District of Columbia Council of Engineering and Architectural Societies, Washington, D.C.; Montgomery County Public Schools, Rockville, Md.; Washington Academy of Sciences, Washington, D.C. Spons AgencY-National Science Foundation, Washington, D.C. Pub Date Sep 68 Note- 119p. EDRS 'Price MF-$0.50 HC-$6.05 Descriptors-Achievement, Behavioral Objectives, *Elementary School Science, *Evaluation, Tests Identifiers-Elementary Science Study; Science-A Process Approach The science curriculuin model developed for the American Association for the Advancement of Science (AAAS) as Science A Process Approach is used to analyze two units of Elementary Science Study (ESS). An "ESS hierarchy" was developed from an analysis of the ESS units, and the resulting behavioral statements were organized into seven levels according to criteria used in Science -A Process Approach. This effort also resulted in the development of an experimental process measure for ESS. Twenty-one teachers administered the revised process measure and content test to their classes during the year 1966-67. The process measure was administered to five Children in each of 11 classrooms before they studied the ESS units. This same process measure was again administered toward the end of the year in 16 classrooms ;.o different students 'also randomly selected. A content test was also administered at this time to these same students. An improvement in performance after studying the ESS units is indicated as measured in terms of transfer to another context and as transfer within the behavioral hierarchy or between learning sets. Gains on the content test were not significant. (BC) -
-
Upload
truonghanh -
Category
Documents
-
view
213 -
download
0
Transcript of Children in each of 11 classrooms before they process ... · An Evaluation of Elementary Science...

DOCUMENT RESUMEED 027 217 SE 006 2139
By-Nicodem0s, Robert B.An Evaluation of Elementary Science Study as Science A Process Approach.District of Columbia Council of Engineering and Architectural Societies, Washington, D.C.; Montgomery CountyPublic Schools, Rockville, Md.; Washington Academy of Sciences, Washington, D.C.
Spons AgencY-National Science Foundation, Washington, D.C.Pub Date Sep 68Note- 119p.EDRS 'Price MF-$0.50 HC-$6.05Descriptors-Achievement, Behavioral Objectives, *Elementary School Science, *Evaluation, TestsIdentifiers-Elementary Science Study; Science-A Process Approach
The science curriculuin model developed for the American Association for theAdvancement of Science (AAAS) as Science A Process Approach is used to analyzetwo units of Elementary Science Study (ESS). An "ESS hierarchy" was developed froman analysis of the ESS units, and the resulting behavioral statements were organizedinto seven levels according to criteria used in Science -A Process Approach. Thiseffort also resulted in the development of an experimental process measure for ESS.Twenty-one teachers administered the revised process measure and content test totheir classes during the year 1966-67. The process measure was administered to fiveChildren in each of 11 classrooms before they studied the ESS units. This sameprocess measure was again administered toward the end of the year in 16classrooms ;.o different students 'also randomly selected. A content test was alsoadministered at this time to these same students. An improvement in performanceafter studying the ESS units is indicated as measured in terms of transfer to anothercontext and as transfer within the behavioral hierarchy or between learning sets.Gains on the content test were not significant. (BC)
-
AN EVALUATION OF ELEMENTARY SCIENCE STUDY AS
SCIENCE- A PROCESS APPROACH*
by
Robert B. Nicodemus
September 1968
U.S. DEPARTMENI OF HEALTH, EDUCATION & WELFARE
OFFICE OF EDUCATION
THIS DOCUMENT HAS BEEN REPRODUCED EXACTLY AS RECEIVED FROM THE
PERSON OR ORGANIZATION ORIGINATING IT. POINTS OF VIEW OR OPINIONS
STATED DO NOT NECESSARILY REPRESENT OFFICIAL OFFICE OF EDUCATION
POSITION OR POLICY.
The Joint Board on Science Educationof the Washington Academy of Sciencesand the D. C. Council of Engineeringand Architectural Societies. Washington,D C
and
Montgomery County Public SchoolsRockville, Maryland
*Supportedin part by a grant from the
National Science Foundation

5E004 .219
ABSTRACT
The science curriculum model developed under the American
Association for the Advancement of Srience (AAAS) and published
by XEROX Corporation as Science- A Process Approach is used to
analyze two uuits of Elementary Science Study (ESS). An evaluation
instrument based on the AAAS Process Measure and derived from the
ESS analysis was administered to two groups of elementary school
students. An improvement in performance after studying the ESS
units is indicated. The improvement is measured as transfer to
another context and as transfer within the behavioral hierarchy
or between learning sets. A content test based on one ESS unit
showed little effect of studying the unit and no relation to
equivalent levels of the hierarchy, The importance of this
analysis and evaluation is discussed with respect to use in
the classroom and different levels of behavioral description.

sr.
I.
Introduction
This work was begun early in 1966 and completed almost threeyears later. The inttial analysis of two Elementary Science Studyunits was completed before the summer of 1966.
The "ESS hierarchy" was developed by the analysis of th SS
units through the use of AAAS action words and the organization ofthe resulting specific behavioral statements into seven levels accord-ing to criteria used in "Science-A Process Approach."
This effort, which also resulted in an experimental "processmeasure for ESS", is indebted to the support and encouragement ofDr. Edwin Kurtz, Professor of Botany, University of Arizona andDr. Henry Walbesser, Assistant Director, American Assodiation forthe Advancement of Science.
In the summer of 1966 ninety-four elementary teachers from theWashington metropolitan area completed a three week full-time programintroducing them to new science curricula at the elementary level.*Two units of Elementary Science Study (ESS) were emphasized-SmallThings and Kitchen Physics. During this time the "ESS process measure"and content test were given to teachers and a small group of students..The results were discussed with the teachers who had also been intro-duced to "Science-A Process Approach."
Twenty-one teachers volunteered to give the revised processmeasure and content test to their classes during the academic year1966-67. The process measure was administered to about five childrenin each of eleven classrooms before they studied one or two ESS units.The process measure was given again toward the end of the year insixteen classrooms to different individuals also randomly selected.At the end of the year a content test was given to most of the aboveindividuals and also to additional groups who became available throughcooperation of teachers. Because of this voluntary situation, com-parison of group results is limited. In addition to the analysis, twoquestions asked in this study are (1) Does the process measure and con-tent test measure any effect of ESS being taught and (2) Does the pro-cess instrument represent a valid hierarchy of interdependent behaviors?
The analysis of data and writing were accomplished at intervals follow-ing the summer of 1967. I am indebted to Dr. John Wasik, Department ofExperimental Statistics, North Carolina State University, for his crtticismof.the data. Finally I wish to thank Dr. RobertM. Gagra, Professor ofeducation, University of California, Berkeley and Dr. Elizabeth C. Wilson,Director, Department of Supervision and Curriculum.Development,MDntgomeryCounty Public Schools, for their encouragement and support.
* described in ERIC REPORT ED 013 216 "Cooperative College-School ScienceProject" by Robert B. Nicodemus,.July. 1967. 120 pages

CONTENTS
AnAnalysis of ESS Small Thingssequence of behaviorshierarchy of Small Things behaviorsgeneral hierarchyaction words
II Teacher Adoption of "Objectives"analysis of teacher activityopinion questionnaire on. objectivesopinion questionnaire on classroom activity"assumed" small things objectives
III Preliminary Analysis of Kitchen Physics
IV A Process Measure for ESSthe process instrumentdefinition of acceptable laarning set
V Process Measure Results
teachers participatingvalidation of the hierarchy
VI Content Test
final fifth versionscoring key for final versiontypical answersthird versionfourth version
.12 24
25 28
29 44
45..51
52..69
VII Interaction of Students and Teacher 70 - 73
VIII Summary
transfer between process measure'itransfer within the process measurefrequency of action wordsaction words within action wordsaction words in processesrole of contentlevel of describing ESSlearning sets and process measure
74.84

IIIIIIVV
VIVII
VIII
IXX
XIXII
XIIIXIVXVXVI
XVII
XVIIIXIXXX
KKIXXIIXXIII
Pages
Charts 85-107
Process Measure. BeforeProcess Measure. AfterBaltimore Subgroup. Before and AfterProcess Measure. Before Group divided into thirdsProcess Measure. After Group divided into thirdsProcess Measure. Grades four and five combinedProcess Measure. Grade sixProcess Measure. After Group. Small Things and
Kitchen Physics minus Small Things Only StudiedPercent differences for charts I, II, III, VIIIProportion Consistent with Positive Transfer. BeforeProportion Consistent with Positive Transfer. AfterMediated Transfer. BeforeMediated Transfer. AfterProportion of Learning Sets with Ambiguious ScorePatterns of Learning Set Responses. BeforePatterns of Learning Set Responses. AfterSummary of Pass-Fail Relationships Between Non-
Adjacent Learning Sets. After GroupProportion of Acceptable Learning SetsVerbal I.Q.'s of Groups Taking Content TestPercentage of Acceptable Responses to Content TestContent Test Results for Subjects Also Taking Process MeasureProfile on Content TestNumber Correct for Content Test and Process Measure
Graphs 108-114
Process Measure. Before ane, AfterII Process Measure. Baltimore SubgroupIII Process Measure. Upper ThirdIV Process Measure. Middle ThirdV Process Measure. Lower Thikd
VI Process Measure. Grades four and fiveVII Process Measure. Grade six

1
AN ANALYSIS OF ESS SMALL THINGS
A characteristic of many new science programs is the emphasis upon inquiry
or investigation rather than information or facts. Although it is readilyrecognized that inquiry is experienced through subject matter, the importantoutcomes are identified is attitudes. Science is valued through its powerin finding answers but the answers are viewed as a temporary outcome of the
main activity of science - inquiry. In the subtle and elusive responsesbetween studeut and teacher inquiry proves very ephemeral. Until instrumentsare developed to provide some reliable measures and description of inquiry,it will remain difficult to communicate its strategies.
One beginning point concerns the question of organizing the factual part ofthe lesson in science taught as inquiry. Two of the more prominent curric-ulum projects in the Pnited States offer an interesting contrast in answerto this.
In the AAAS project -"Science - A Process Approach" (1) science conceptsare presented within the context of what the child does i.e. behavioral
objecttves. Whether or not the child can exhibit the stated objectiveis assessed at the end of each exercise by a competency measure. Forexample, in Observing 1 "Perception of Color" the child should be ableto 1. Identify the following colors: yellow, orange, red, purple, blueand green 2. Name the three principal colors - yellow, red, and blue3. Identify other colors as being like one of the colors yellow, red, andblue. The underlined words are three of the ten action words used to beginevery behavioral statement. The three objectives above are restated as amore general component skill - "Identifying and naming the primary and
secondary colors." This component skill is only one of thirty-six whichare arranged in a hierarchy in which the earlier skills such as in Observing 1
are necessary for the acquisition of later or "higher" skills such as Observing
2 - "Identifying and naming two or more characteristics of an object such ascolor, size, shape, and texture." The thirty-six component skills constitutethe process skill of Observing. The theoretical background and practical useof organizing behaviors into such processes'is discussed elsewhere (2). Byutilizing a structure based on processes of inquiry, the AAAS materials avoidthe dilemma of other projects which attempt to stress inquiry within anorganizing structure based on content.
Another.well known curriculum project, Elementary Science Study (3), stressesinquiry in science without providing any obvious structure to the content.One of the earlier units "Small Things" (4) unintentionally provides a structurethat emphasizes content by a worksheet format. An analysis will show at leasttwenty-five worksheet questions immediately preceded in "Information for teachers"
- 2 -
by an answer which could easily be construed by the teacher as a content objective.For example, "What do you see inside the cell? ." "The nucleus,which is located inside the cell, is its major control center." This contextmakes it very easy for the insecure teacher to have the "answer" right at handif the child flounders in his inquiry thereby canceling out the ESS "open-ended"approach.
Is there any structure in this unit which would assist a teacher to effectivelyplan a lesson so as to be able to assist the learner in ways consistent withthe ESS philosophy? An answer to this question and the problems it implieswas sought by applying the discipline of the AAAS approach to ESS. The firsttask was to list the sequence of behaviors in the Small Things Unit in terms .
of the AAAS action words.

- 3
Sequence of Behaviors in the Small Things Unit
1. Demonstrating ways to make things look larger2. Describing characteristics of lenses3, Demonstrating use of a simple microscope4. Identifying size of microscope field5. Demonstrating preparation of a microscope slide6. Describing size of an object by reference to "hair widths"7. Identifying Leeuwenhoek as a "great lens maker"8. Demonstrating use of a compound microscope9. Identifying reversing of field
10. Identifying effects of magnification on field of view11. Describing layers of an onion bulb by inference and observation12. Identifying drawing which looks most like onion skin observed through
a microscope13. Describing "blocks" making up onion skin14. Naming "little units" cells15. Describing the interior of cells16. Identifying effects of three stains on different parts of cell17. Distinguishing stain to study "little spots" inside onion cells18. Describing similarities and differences between epithelial and
onion bulb cells19. Demonstrating whether an epithelial or onion bulb cell is bigger20. Constructing a drawing on onion skin cells from the outside and
inside layers of an onion bulb21. Applying a rule to identify whether a "mystery slide" from an
onion bulb came from an inside or outside layer22. Constructing a drawing of a root tip and describing similarities
and differences of onion root tip cells and onion bulb cells23. Describing similarities and differences of cells from different
parts of the root24. Demonstrating validity of conclusions or "ideas" of cell differences
by looking at another slide25. Describing similarities and differences of cells in an onion leaf26. Applying a rule to identify where a "mystery slide" came from on
the onion27. Interpreting why cells are different in different parts of the onion28. Describing cells in an elodea leaf29. Stating a rule where green cells are found30. Describing a root system and cells of a root31. Describing general characteristics of microscopic pond animals32. Naming animals on basis of movement or shape33. Naming non-moving objects on slide34. Describing a paramecium - appearance, behavior (response, eating)35. Identifying whether or not a paramecium contains cells36. Describing euglena it's green plant color and animal movement37. Applying a rule to classify euglena as a plant or an animal or both

4
38. Constructing a definition of a plant and animal
39. Describing differences between an amoeba, paramecium and euglena
40. Describing similarity or difference between the outside of an
amoeba and the outside of an onion cell
41. Ordering small things on the basis of whether or not they contain cells
42. Describing the arrangement of salt crystals compared to onion cells
43. Applying a rule to predict whether onion cells dissolve in hot water
like salt
44. Interpreting why "units" (crystals) stop growing
45. Describing inside of sugar crystals
46. Describing dissolving of iodine crystals
47. Applying a rule to classify crystals as a kind of cell or not a cell
48. Demonstrating use of a balance to measure loss of water
49. Describing cells as containing mostly water
50. Describing living things as being made up of cells
51. Stating a rule that living things have more water in them than
non-living things52. Describing growth of yeast cell (size and geometric progression)
53. Distinguishing whether onion cells and skin cells grow by budding
as do yeast cells (use of film loop)
54. Applying a rule to predict how many divisions are required to obtain
150 cells from 1055. Describing how rapidly yeast cells divide by comparision of average
increase per unit time
77,5,7,7.1M7.7 - Mx-

The behaviors were then analyzed and arranged in a hierarchy analogous to theordering of objectives in the AAAS materials. (insert Hierarchy of SmallThings Behaviors) The first ten behaviors were not included in the hierarchyas they represent more of a set of skills for using a microscope which are, ofcourse, prerequisite to the remaining forty-five. The remaining behavioralobjectives are organized under three concept areas:
1. Pond life - identification and naming of characteristics ofdifferent organisms
2. Cells - describing characteristics of cells, and3. Living - describing characteristics of living things
The ordering of behaviors thus facilitates analysis of Small Things. One mayidentify how a concept such as "life" is supported by behaviors under anotherconcept such as "cells". Also, under one concept one may more readily seethe interrelations of its "component skills".
For example', behaviors 27 and 29 form a transition between concepts. Upthrough 27 the description of cells has been extensively developed and leadsinto ideas of classification of pond life into plants and animals accordingto cell characteristics. A second transition between behaviors 43 and 44identifies a possible weakness since there are no behaviors to help thechild interpret why crystals stop growing. Under one concept such as Cellsbehavior 24 - "demenstrating validity of conclusions or 'ideas' of celldifferences by looking at another slide" would require that the child mouldhave acquired some prior behaviors such as -
Describing root protective cells as elliptical in shape and havinga waxy outer covering, or
Describing root cells as longer and thinner than bulb cells
Examination of activities preceding behavior 24 reveals very little experiencecontributing to this knowledge by the "child discovering for himself". Theproblem is inescapable. Either the child is not necessarily expected toattain certain behaviors or, if he is, it is quite likely that the necessarybehaviors will not have been attained.
A second structure other than content was sought in which to organize thebehaviors in Small Things. For this purpose the AAAS philosophy was againemployed. The "Process Measure" is an instrument which assesses the child'sskill in the hierarchy within a slightly different context than originallypresented. This situation is similar to studies on "near-transfer" (5)and supports one of the conditions of learning identified by Gagne in whicha concept must be generalized through a variety of stimulus situations. (6)To avoid the danger of verbal superficiality, a variety of concrete stimulussituations is essential. Through this repetition, the concept acquire3anoperational meaning which enables the student to do something. Thus, thetest of a concept is where generalization is not limited by physical resemblance.
^

- 6
Hierarchy of Small Things Behaviors
Pond Life Cells Living
22
El20
-

Consequently, the list of snall things behaviors were classified into asimpler and general hierarchy more analogous to the ordering of AAAS
component skills. After considerable analysis the Small Things behaviors
were classified into seven levels going from simple to complex in a logical
ordering. The hierarchy also reflects a belief about the psychology oflearning in that the child must be able to identify essential features ofan objective or solution to a problem before it is presented. The result-
ing recognition is believed to be an important source of reinforcement.For this reason, the hierarchy begins with the behaviors of identifying
and naming. The hierarchy in general has a structure which could besubjected to empirical verificatIon through procedures used by AAAS. It
should be mentioned that this is a controversial area. (7) (insert
General Hierarchy)
The General Hierarchy could also be used for another level of analysis.
For example, behaviors 22.and 23 are classified at level III and behavior
24 at level VII. Unless the learner has ample experience at the interveningfour levels-of III, IV, V, VI it would seem less:likely he could be success-full in attaining behavior 24.
In summary, the analysis of an ESS unit by the AAAS discipline provides astructure which may be put to a number of uses. The sequential development
of content may be examined. The expression of content through behaviors
may be generalized into a less specific hierarchy in which the developmentof more general skills may be studied. This discipline would prove useful
in the initial development of a unit. Of greatest value is its use byteachers in planning the teaching of a unit. The child's knowledge andskills may be evaluated in relation to a hierarchy (8) and the instructionalprogram planned to avoid repetition but assuring the possession of behaviors
necessary for more complex tasks. The relation of content, behaviors andskills may be readily ascertained and organized in ways useful to the immediateand numerous decisions which constitute a strategy of teaching. (9) Withinthis total context we may meaningfully talk of learning science as inquiry.

- 8
Classification of Behavioi in Small Things into theSeven Levels of the General Hierarchy
Hierarchy als.l'Smrhins
VII Demonstrating Validity 24
VI Interpreting Relationships 27, 44
V Apply Rule 21, 26, 37, 47, 54
IV Ordering 29, 41, 43, 44, 51
III Describe Similarities 16, 17, 18, 19, 20, 22, 23,
and Differences 25, 28, 30, 39, 40, 42, 50,
52, 53, 55
II Describe Properties 1, 2, 3, 4, 5, 6, 8, 9, 10,
11, 13, 15, 31, 34, 36, 38,
45, 46, 48, 49, 52, 54
I Identify,Name 12, 14, 32, 33, 35, 49

VII
VI
V
IV A,B
III
II
General Hierarchy
Demonstrating validity ofmodel to other objects orevents
I--
Interpret relationship ofobjects or events in termsof causes or a model
Applying a rule to predict
1or explain
Ordering objects orevents consistentwith a rule
Stating a ruleexplaining relationsof objects and events
Describingproperties ofan object orevent by use ofan instrument
Describing similaritiesand differences in oneobject or event orbetween a group ofobjects or events
MIEQG
Describing propertiesof an object or event
Identifying propertiesof an object or event

- 10-
Summary of Action Words
Identifying - Selecting correct (named) object of a class.Identifying object properties and kinds ofchanges.
Distinguishing - Identifying objects (events) that are confusableor when two contrasting identifications areinvolved.
Constructing - Representing (model, drawing) a particularobject or set of conditions.
Naming - Supplying the correct name for an object (class)or event.
Ordering - Arranging objects (events) in an order consistentwith a rule or category.
Descritilla - Naming categories or properties of objects andevents appropriate to a designated situation.
Stating a Rule - A verbal statement conveying a rule or principleincluding names of proper classes of objects orevents in their correct order.
Auly_imaLtule - Deriving an answer based on a rule.
Demonstrating - Performing an operation necessary to the applicationof a rule or principle.
Interpreting - Identify (describe) objects (events) in terms oftheir consequences (always associated with a rule.)

11
Bibliography
(1) Xerox Education Division. Science - A Process A roach: Description. of the Program, Parts A, B, and C. New York 1967.
(2) Gagng, Robert M. "Elementary Science: A New Scheme of Instruction"SCIENCE Vol. 151, No. 3706, January 7, 1966. pp. 49-53
(3) ESS is now part of the Educational Development Center.
(4) Teachers Guide for Small Things. Experimental Edition published for ESSby Houghton Mifflin Co. Boston 1965. Although this article is based onthe experimental edition, there has been very little change in the finaledition published by Webster Division of McGraw Hill.
(5) For a recent bibliography on this see: Worthen, Blair "Discovery and- Expository Task Presentation in Elementary Mathematics". Journal of
Psychology Vol. 59, No. 1 part 2.February 1968.
(6) Gagng, Robert14. The Conditions of LearninR. Holt, Rinehart andWinston, New York 1965.
(7) See for example the letter in SCIENCE Vol. 151, March 4, 1966 p. 1033.
(8) Walbesser, H. H. and Carter, H. "Some Methodological Considerations. of Curriculum Evaluation Research" Educational Leadership., Vol. 26,
No. 1, October 1968. pp. 53-64. .
(9) For a discussion of interaction analysis see Mirrors for Behavior:A n Anthology of Classroom Observation Instruments. Ed. byA. Simon,E. G. Boyer. Research for Better Schools Inc., Philadelphia, Pennsylvania1967.
z

12
II Teacher Adoption of "Objectives"
Because teaching is usually directed toward some goal,the content or factual part of the Small Things unit may begiven more priority than the authors intended. This outcomeis a function of the relationship of worksheet questions toinformation for teachers and the absence of unambiguiousguidelines which the teacher may use for evaluation. In the"open-ended" approach", any outcome may be valid but theteacher must .have some basis to evaluate where the individualstudent is and on this basis determine how the learningsituation may be structured to increase the probability ofachieving desired outcomes. In the open-ended approachrepresented by ESS there is a dichotomy inherent between theone goal of accepting what the child experiences and at thesame time encourage accuracy.and precision in observation anddescription.
To determine how teachers view relation between contentobjectives and inquiry teaching, two questionnaires were given.At the end of the 1966 summer training session the "Analysisof Teacher Activity" was responded to by all participants.Their responses demonstrated that the majority differentiatedthe one model of inquiry teaching represented.
In the spring of 1967, a second questionnaire was givento the twenty-one teachers who were Tarticipating in theevaluation phase of the project. Items on the "Opinion Questionnaireon Objectives" were derived from the analysis titled "AssumedSmall Things Objectives" of the worksheet questions and informationfor teachers. The results show that the majority of teachersaccepted the majority of twenty-five factual statements as validobjectives of the unit. It was interesting to note that the onlydissention came from the master teacher from Baltimore who hadconsiderable experience with Elementary Science Study. He stated-
"I cannot accept three category answers on this forthe following reasons: (1) Those I noted A were inmost cases simply teacher background information whichfrom the ESS point of view may or may not be deamedunderstandable to pupils, depending on many things.2. I do not like them stated as objectives...notunless the child was able to couch his belief in wordsmore carefully chosen in some cases, evidence citedgenerally, or sources provided. 3. Many I listed as Acould well be B depending on mode of learning, provisionfor learning in greater depth, perceptual level offifth grade, etc."

13
A second part of the 1967 questionnaire "Opinion Questionnaire
on Classroom Activity" support the conclusion that teachersunderstand the idea of inquiry teaching. Of the twelve items
four are associated with expository teaching. Cut of twentyfour teachers an average of less than one checked items seven,eighttnineland twelve. The majority of responses under item
twelve reflects some ambiguity about not directing a childbut encouraging him to seek answers in many ways. This objectiveis definitely one ESS encourages but fails to point out thedifferences in directing a student by the questions you ask.
Items four and five are ambiguous to a lesser extent. Descriptionsof inquiry teaching in some other projects discourage the sharingof findings or answers between students. It is felt that eachindividual child should discover "for himself". ESS has a much
more social outlook and encourages the children to examine thebasis for differences in observations. The child would become
aware of the fact that the diff)rences are attributed both todifferences in individuals and differences in procedures. Thisnaturally leads ESS in encouraging statement _twelve which also
had a relatively low response level," The relation between itemsfour and twelve is to be expected. Item five is also related to
the above. Since ESS encourages the use of many methods and thesharing of results, it would be expected that for every answerselected there would be some rejected. However, ESS leads theteacher to recognize the "right" is a relative thing, as in item
ten, and all answers are tentative. Therefore the idea of discardmay seem a strong statement when these answers may be laterrevived on further evidence.

14
Analysis of Teacher Activity*
Two teachers were observed for fifteen minutes and the followingforms completed by the observers. If these observations werefairly characteristic of the classroom, could you make any gen-eralizations about each teacher's philosophy of classroom man-agement: How successful would you think each one is in creatingan atmosphere of inquiry?
Number of Times ObservedTeacner A .1.-eacner m
of-ten
sel-dom none
of-ten
sel-dom none
V v."
v'
v/
./
.
,/*
/
Vv/
I/,
P/ V10/' V/
, - .
Behaviora. Teacher encourages student to
try his idea.b. Teacher expresses agreement or
disagreement with student's ideabefore student tries the idea.
c. Teacher tells the student whatto look for before activity be-gins.
d. Teacher leads students to thedesired conclusions based onone experience.
e. Teacher responds to students'explanation with non-committalcomment such as "How do youknow?"
f. Teacher agrees or disagreeswith student explanation.
g. Teacher guides student observa-tion or thinking by using "Don'tfit" situations.
h. Teacher performs the activity.1. Teacher paces the activity to
match student progress.j. Teacher poses questions to secure
specific answers.k. Teacher poses questions to secure
ideas from students.1. Teacher probes basis for inappro-
priate responses.m. Teacher accepts responses of chil-
dren and when appropriate probeschild to extend responses.
* Adopted from Teaching Observation check list (unpublished),"Role of Tectcher Atmosphere of Inquiry," Science - A ProcessApproach. Commission on Science Education of. the AmericanAssociation for Vile Advancement of Science.

15
Representative Responses of Teachers to"Analysis of Teacher Activity"
Of the two teaching characteristics described above, I wouldthink Teacher A would be the better science teacher He orshe seems to encourage the student to satisfy his curiosityon certain matters rather than giving him an evasive answer.He seems to channel questions to instill an inquiring manner.Teacher A also instructs the student by giving him hints onwhat to look for.
Teacher Bits students should be working in a good atmosphereof inquiry since the teacher has not designated a fixed ans-wer for everything nor has a limit been set as to the amountof thinking and conclusion.
Teacher A seems more content than process oriented, has asomewhat structured program, assumes more of the leadershipto achieve getting content across. I think both A and Bmight successfully cTeate an atmosphere of inquiry, but Bprobably will do it more effectively and more thoroughly.
This is a fantastic amount of information to be gleaned in
15 minutes. But I suppose it shows that Teacher A has a moreteacher-centered classroom rather than child-centered. Teach-er B turns the spotlight on the child's own activity and rea-soning ability, leading him on, encouraging, prdbing, etc.He would, therefore, be more successful in creating an atmos-phere of inquiry.
Teacher A probably feels that because she is carrying on mostof the action and/or talking that she is teaching *Has notyet realized that there is no teaching without learning. Usesmuch effort but weak in management and skills as well as know-ledge of how people learn. Teacher B is the better teacher --she guides the children, makes suggestions, etc. This is achild-centered room...This teacher's philosophy is that whatthe child discovers for himself is more meaningful and satisfy-ing than being told what questions he should wonder about andwhat the answers are, as Teacher A did. Teacher B's class isprobably more highly motivated, more industrious and has fewerdiscipline problems than A. B has provided for individualdifferences.
Teacher A seems to like a more structured situation in theclassroom. He leads the student to form his own conclusions;
16
however, he allows no one to become misled by doing their ownthinking. He sets specific goals and aims to accomplish thetfiith no time wasting by coming up with incorrect conclusions.'He keeps the class under control by doing most of the activi-ties himself. This also insures him of appropriate resultswith no deviation from the desired ones. His activities seemto be for the sake of demonstration of principles rather thanfor experimentation and discovery of principles. Teacher Byhowever, seems to promote an atmosphete of discovery. Theclass is probably less regimented. There seems to be moreopportunity to discuss results of activities and for the chil-dren to draw their own conclusions. The classroom of Teacher13 is probably a far better atmosphere for inquiry. After awhile students of Teacher A probably discover that he will tellthem the answer presently so they might as well wait to hearit. They will be more reluctant to express their ideas if theteacher disapproves of their responses. Eventually they mightbecome a passive audience merely listening to a dialogue be-tween the teachers and a couple of the "smart kids".

17
Opinion Questionnaire on Objectives*
Please place one of the following three letters corresponding
to your opinion of the statements below:
A. An objective of the Small Things Unit that may be
attained by most fifth graders
B. An objective of the Small Things Unit that will not
be attained by many fifth graders
C. Not an objective of the Small Things Unit but an out..
come that may be observed
N=21A B C In the Small Things Unit the child learns that:
21 0 0 1. There are much smaller levels of organizationthan can be seen with the un-aided eye.
21 0 0 2. Living things are made of fundamental unitscalled cells.
14 1 6 3. Living things possess some characteristics in
common with non-living things.
16 0 5 4. Staining cells helps to see them better.
20 0 1 5. Cells from the same organism will differ in
Si22 and shape.
16 2 3 6, Magnification decreases the field of view.
14 2 5 7. Clear curved objects make things look bigger
or smaller.
10 8 3 8. Thickness of a cell wall varies with thecation of the cell.
16 2 2, 9. The nucleus is the major control center of
the cell.
7 7 7 10. The shape of a cell is related to its function.
9 7 5 11. The shape of a cell is related to its location.
19 2 0 12. Plant and animal cells are similar in some ways.
13 3 5 13. Plant cells have a thick non-living cell wall.

18
A B C
17 0 4 14. Plants need a green substance to make food.
12 3 6 15. Cells of an onion root are longer and thinnerthan cells in the onion bulb.
13 0 7. 16. Root cells are specialized for absorption ofwater and minerals and for their transport toleaves.
14 1 6 17. Roots hive specialized outer cells called roothairs.
13 6 2 18. Protozoa are very complex single cells.
8 5 8 19..Euglena are attracted to light.
,4 9 8 20. Cells that store food may have starch granules.
11 7 3 21. Only things which have cells are living or wereonce alive
18 0 3 22. Living things are made of cells or materialsproduced by cells.
7 6 6 23. Cells do not dissolve.
6 6 9 24. Living thinga are made of more ttomplex partsthan non-living things.
5 4 11 25. Living things have more water in them thannon 4-living things.
*A fact, understanding or ability intended that the studentwill achieve as a result of a planned experience.

19
Opinion Questionnaire on Classroont,Activity
In classrooms studying Elementary Science Study units which ofthe following behaviors would you expect to observe more readily?Check those behaviors you would expect to be more common with anESS unit such as Small Things, Mealworms or Kitchen Physics. Leaveblank those behaviors you would not expect to observe as readily.
Nmmber ofteacherschecking
22 1. The child learns how to measure with increasingaccuracy.
22 2. The child evaluates evidence to confirm or revisegeneralizations,
21 3. The child tolerates more uncertainty as a result ofbasing conclusions on his own evidence rather thanan outside authority.
7 4. The child bases generalizations only on his ownresults.
3 5. The child selects from a number of possible answersjust one right answer and discards the rest.
21 6. The child asks questions in a way that he is moreable to answer himself.
0 7. The child relies more on the teacher in classroomactivity.
7 8. The teacher guides the child toward objectives thatare determined before the lesson.
1 9. The teacher readily gives explanations and answersto the class.
21 10. The teacher does not grade responses as right or wrong.
24 11. The teacher lets the child see the need for keepingrecords rather than telling him to do so.
14 12. The teacher suggests as few methods as possible forthe children to use in acquiring specific knowledge.
. 20
"Assumed" Small Things Objectives
Relation of Worksheet Questions to Information for Teachers inthe Small Things Teachers Guide
Worksheet Questions
1. Axe the blocks allexactly the same size?Are they all exactlythe same shape? p.37
2. What wou1J be a goodname for these blocks?p.37"These pores or cellswere not very deep,but consisted of agreat many littleboxes." (Quotationfrom Hooke p.39)Even today we call thelittle units you haveseen in the onion skin
p.39
3. What do you see insidethe cell? p.44
4. If you were studyingjust the little spotswhich you see insidesome of the onioncells, which stainwould you use? p.45
5. How are epithelialcells like onion bulbcells? p.50
/nformation for Teachers
1. The difference between lengthand width may have to bepointed out to some of thechildren. p.32These cells are about 1/2 hairwidth and 2 hair widths long.p.33
2. Let the children come upon itindependently. /t is includedin the quotation from RobertHooke. p.33
3. The nucleus, which is locatedinside the cell, is its majorcontrol center. p.43
4. Methylene blue and Lugoltsiodine stain the cell walland nucleus darker than therest of the cell. p.43
5. Both types of cells have anucleus. Cell membranes arethe living outer boundariesof plant and animal cells. Inplants such living membranesare usually closely surroundedby cell walls and cannot be
:
21
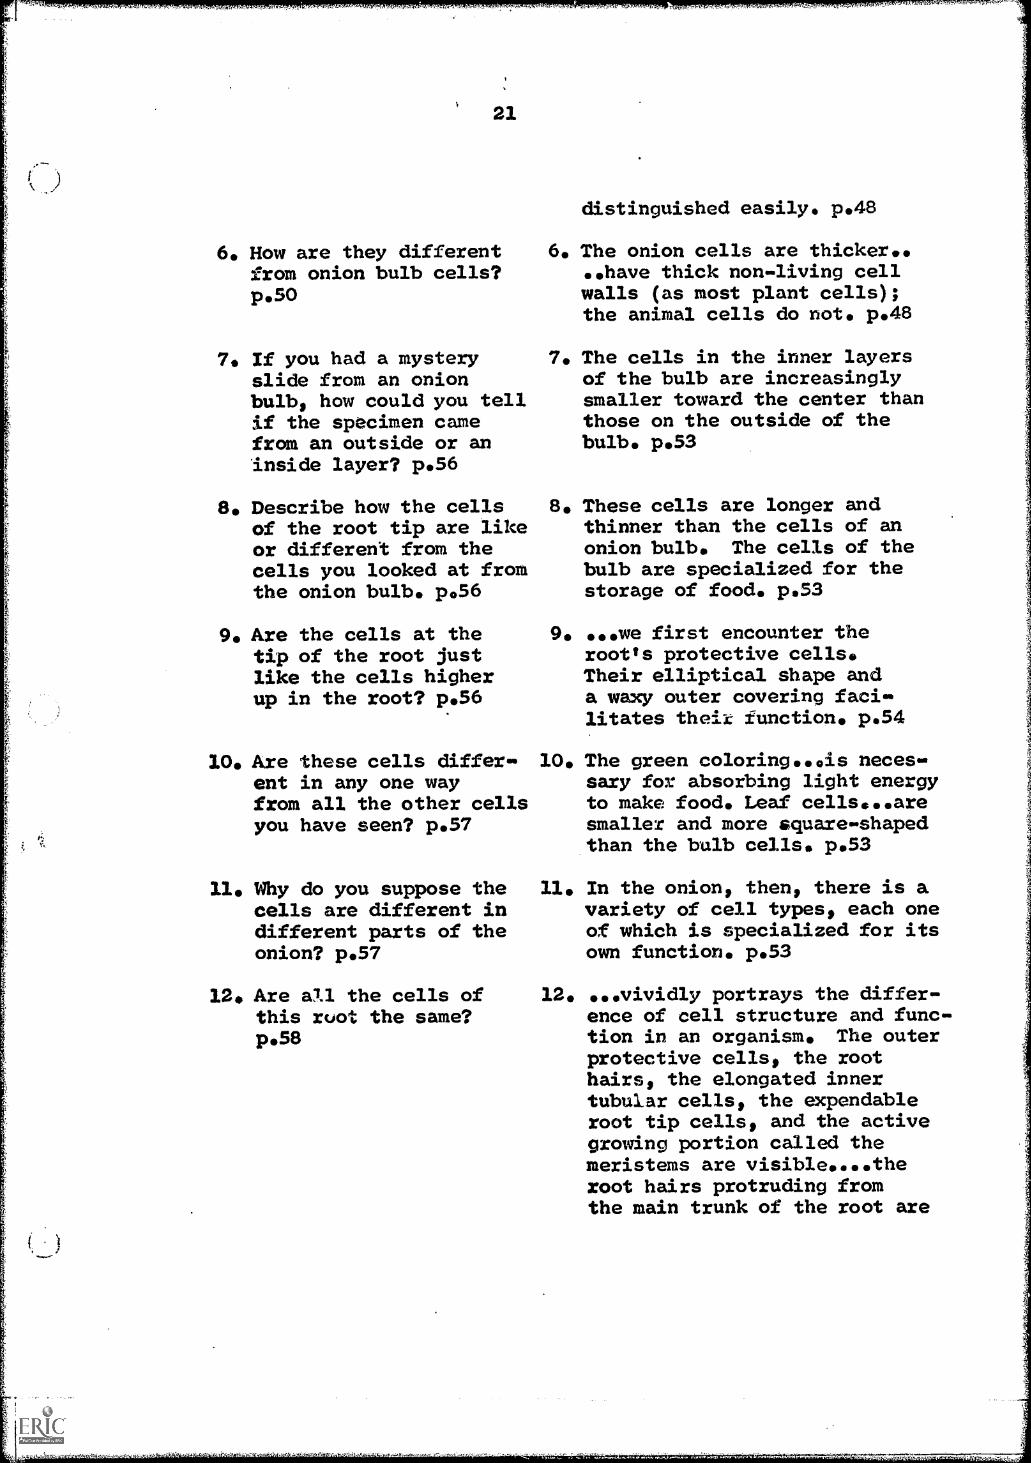
6. How are they differentfrom onion bulb cells?p.S0
7. If you had a mysteryslide from an onionbulb, how could you tellif the specimen camefrom an outside or anInside layer? p.56
8. Describe how the cellsof the root tip are likeor different from thecells you looked at fromthe onion bulb. p.56
9. Are the cells at thetip of the root justlike the cells higherup in the root? p.56
10. Axe these cells differ-ent in any one wayfrom all the other cellsyou have seen? p.57
11. Why do you suppose thecells are different indifferent parts of theonion? p.57
12. Axe all the cells ofthis ruot the same?p.58
distinguished easily. p.48
6. The onion cells are thicker...Aave thick non-living cellwalls (as most plant cells);the animal cells do not. p.48
7. The cells in the inner layersof the bulb are increasinglysmaller toward the center thanthose on the outside of thebulb. p.53
8. These cells are longer andthinner than the cells of anonion bulb. The cells of thebulb are specialized for thestorage of food. p.53
9. ...we first encounter theroot's protective cells.Their elliptical shape anda waxy outer covering faci-litates theik function. p.54
10. The green coloring...is necesi.sary for absorbing light energyto make food. Leaf cells...aresmaller and more square-shapedthan the bulb cells. p.53
11. In the onion, then, there is avariety of cell types, each oneof which is specialized for itsown function. p.53
12. ...vividly portrays the differ-ence of cell structure and func-tion in an organism. The outerprotective cells, the roothairs, the elongated innertubular cells, the expendableroot tip cells, and the activegrowing portion called themeristems are visible....theroot hairs protruding fromthe main trunk of the root are

13. If you have seen aparamecium when youthought it was goingbackwards, what doyou think made it backup? p.81
14. What would you guessthe paramecium eats?p. 81
15. Can you see cells inparamecium? p.8I
16. Could it be that eu-glena is not either aplant or an animal butin SDMO ways is likeboth? p.83
17. How does your amoebamove? p.85
18. Were there some ma-terials in which youfound units thatlooked like cells,
7but which may not becells? p.95
absorbing moisture and nourish-ment... p.54
13. The fact that paramecia bumpinto things tends to indicatethat they cannot see. p.
14. Paramecium eat bacteria andsmall particles. p.74
15. "Protozoa" is a name given toone-celled animals. p.63A protozoan...is a remarkablycomplex single cell. p.64A rotifer...is smaller thansome of the one-celled proto-zoa, p.73As one food vacuole becomesfilled, it moves to anotherpart of the cello,. p.74
16. Euglena also collects in lightpatches. p.71Thus, the organism is somewhatlike a plant, since animals donot contain chlorophyll. How-ever, its other structures andhabits are clearly animals.For these reasons, the eualenais considered as a borderlineorganism, part plant and partanimal. p.74
17. Locomotion is provided by thepseudopods (false feet), whichbulge out and carry the orga-nism along. p.75
18. Some of the children will thinkthat the grains of chalk, dustand sugar are cells...it wouldbe a good idea to ask why...Inthe discussion we would hopethat the idea of a cell wallor a dark dot in the centerwould be brought up. p.90
,

23
19. Did you find more cells 19. The hoped-for generalizationin living or in non- from this investigation isliving things? p.95 that the only things which
have cells are either livingor were once alive. If thisgeneralization does not arisespontaneously, do not makeit yourself for the children.p.90
20. Do you think that theunits you saw in saltare cells? p.95
21. Do you think that theunits you saw in saltare cells? p.95
20. The matter of whether salt,sugar or other crystals arecellular because they looklike cells is an importantpoint. It suggests that onecannot make a decision on thispoint by appearance alone. Itis necessary to make a varietyof tests before one can becertain (In the case of saltand sugar, they both dissolvein water; chalk dust wilibubble and disappear in vine-gar. Neither onion cells norhamburger meat cells willdisappear in either). p.91
21. Wood, sawdust, and paper aremade from materials whichonce were living and there-fore were made of cells;whether a cellular structureis still visible or not de-pends on the state of thematerials. Sugar does not haveany cell structure largelybecause it has been processed.Cells are not found in eggsbecause an egg is one largecell. p.91
22. What substance had the 22. ...they are ready to be intro-greatest amount of duced to the problem of whe-water? p.119 ther there is water in various
materials...you might well be-gin the discussion by askingwhat the children think cellsare made of..00ne way toelicit this idea is to.p.108
24
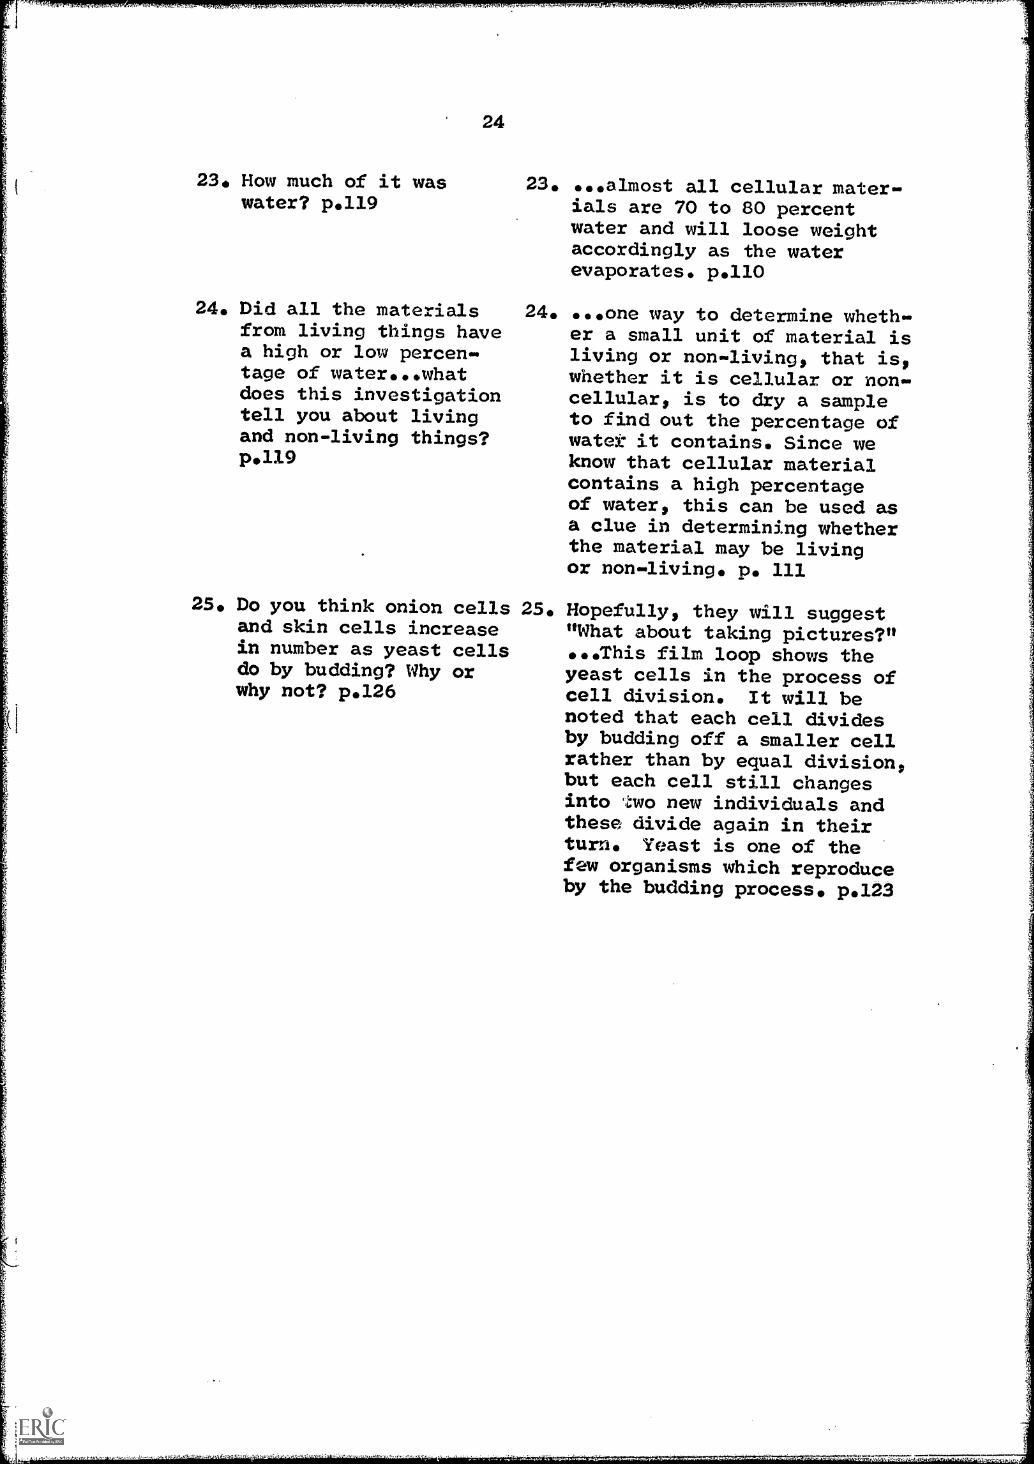
23. How much of it waswater? p.119
23. ...almost all cellular mater-ials are 70 to 80 percentwater and will loose weightaccordingly as the waterevaporates. p.110
24. Did all the materials 24.from living things havea high or low percen-tage of water...whatdoes this investigationtell you about livingand non-living things?p.119
25. Do you think onion cells 25.and skin cells increasein number as yeast cellsdo by budding? Why orwhy not? p.126
...one way to determine wheth-er a small unit of material isliving or non-living, that is,whether it is cellular or non-cellular, is to dry a sampleto find out the percentage ofwater it contains. Since weknow that cellular materialcontains a high percentageof water, this can be used asa clue in determining whetherthe material may be livingor non-living. p. 111
Hopefully, they will suggest"What about taking pictures?"..This film loop shows theyeast cells in the process ofcell division. It will benoted that each cell dividesby budding off a smaller cellrather than by equal division,but each cell still changesinto two new individuals andthese divide again in theirturn. Yeast is one of thefew organisms which reproduceby the budding process* p.123

- 25 -
III Preliminary Analysis of Kitchen Physics
.Time to Empty
1. Identifying water emptying from a bottle p.8
2. Stating rule relating emptying time and size of hole inontainer p.10
3. Demonstrating emptying time for five different size
holes p.11
4. Identifying variation in results and average values p 12
5. Applying a rule to predict emptying time from hypotheticalsize holes p.12
6. Ordering results in a chart p.12
7. Applying a rule to predict size of hole for a specified
time p.12
8. Constructing aninference predicting emptying time of soapywater and other liquids p.12,13
.Beading of Water Columns
9. Identifying the beading effect of water columns p.116
10. Consiiiicting an inference relating length of unbroken watercolumn to hole size p.17
11. Demonstrating length of unbroken water column for fivedifferent size holes p.18
12. Applying a rule to predict relation between hole size andbeading effect p.18
13. Ordering results in a graph p.18
14. Applying a rule to predict beading of soapy water p.19
15. Interpreting results of demonstrations in terms of causes-stating a rule p.19

.Heaping and Drops
16. Identifying heaping behavior of water p.23
17. Applying a rule to predict heaping behavior of soapy water
p. 24
18. Demonstrating validity of rule by testing soapy water
p.24,25
19. Applying a rule to predict heaping behavior of other liquids
p.26
20. Demonstrating validity of rule p.26
21. Applying a rule to predict size of drops of plain and
soapy water p.26
22. Demonstrating validity of rule p.26
23. Describing dops of various liquids on various surfaces
p. 27
.Balances - A Way to Measure "Heaviness" and Grabbiness"
24. Demonstrating use of balance p.32
25. Demonstrating "heaviness" and grabbiness"
26. Ordering results into graphs p.36
27. Interpreting results in terms of "grabbiness" p.39
.Tugs of War and the Skinlike Effect
28. Applying a rule to predict behavior of a loop of thread
when soap is added to water p.41
29. Describing effect of adding soap p.41
30. Interpreting results in terms of stated or revised rule
p.41
31. Constructing aninference to predict what happens when
alcohol is added to water p.42
32. Demonstrating validity of model p.42

1
I1
fti
-27 -
33. Applying a rule to predict effect of adding soap to powderfloating on water p.43
34. Demonstrating validity of model p.43
35. Applying a rule to predict effect of adding soap to oilfloating on water p.44
36. Demonstrating validity of model p.44
37. Applying a rule to predict success of floating paper clipson water p.44
38. Interpreting relationship of sinklmg paper clip to model p.45
Absorption and Evaluation
39. Describing evaporation of water from a paper towel p.50
40. Applying a rule to change rate of evaporation p.52
41. Demonstrating validity of rule p.52
42. Describing rate of absorption p.52
43. Describing variable affecting rate of absorption p.53
44. Applying a rule to predict rate of absorption of soapy water,alcohol and oil p.54
45. Interpreting relation of results to model p.55
46. Demonstrating validity of model in capillary tubes p.53
47. Demonstrating validity of model by use of two glass platesof varying distance apart p.56
48. Demonstrating validity of model with blotter paper stripsof varying width p.58,59

28
Classification of Behavior in Kitchen Physics
into the Seven Levels of the General Hierarchy
Hierarchy Behaviors
VII Demonstrating Validity 3, 11, 18, 20, 22, 32, 34,
36, 41, 46, 47, 48
VI Interpreting Relationships 4, 15, 27, 30, 38, 45
V Apply Rule 5, 7, 10, 12, 14, 17, 19,21, 28, 33, 35, 37, 40, 44
IV Ordering 2, 6, 8, 13, 26, 31
III Describe Similaritiesand Differences
29, 43
II Describe Properties 23, 24, 25, 39, 42
I Identify Name 1, 9, 16

It
29
IV A Process Measure for ESS
The AAAS Process Measure is based on the answers to two
questions. First, is there a sevence of behaviors which can
be identified as prerequisite to a final task? Second, can a
sequence of skills be identified that are necessary for
efficient progression through a hierarchy of behaviors? Affirm-
ative answers based on the work of Gagn1 (1) led to the develop-
ment of the AAAS Processes (2). For example, the Observing Pro-
cess has a numberof terminal tasks such as "Ordering the germina-
tion rates of various seeds and seedlings from fastest to slowest"
(3). Behaviors prerequisite to this are analyzed into sixteen
lower levels under the Observing Process and supplemented by
behaviors from three of the remaining eleven processes. This
one terminal task in the Observing Process, while specific to
a particular content, is at a much more complex level than
behaviors at the beginning of the Process. The terminal task
reprerents a learning set which includes many of the classes of
tasks in the subordinate learning sets. By the time the child
has completed the Observing Process between kindergarten and grade
three, he has demonstrated the competencies necessary or basic to
the behavior of observing.
,J Just how generalizable are the processes? The skill obtained
can be viewed as accumulated learning of content and as more abstract
behavior- "Previous learning, acquired through a number of encounters
with similar problems, can establish a kind of capacity." (4) Accord-
ing to Gagnd, mediation (positive transfer) occurs between learningsets because of elements shared in common- specific content or-abilities
acquired in practice. That the learning of skills in one context can
facilitate the acquisition of skills in a different context has been
recently demonstrated in a science program (5).
The "ESS Process Measure" derived from the General Hierarchy is
based on the assumption that behaviors learned in one context can be
measured in a much different one. For example at level IIB of the
General Hierarchy (page 9), the child studying Small Things engages in
a class of behaviors- "Describing properties of an object or event."
According to the ESS philosophy, what the teacher encourages the child
to do is to describe what he sees as fully as possible rather than give
an accurate description of a cell. In this case the stimulus really does
not matter because what he is learning is a rule which could be stated as:
"Adequate" descriptions use a Variety of senses and are quantitative
wherever possible. In the first case, the rule is to state a certain
class of facts. In the second case, the rule concerns how to go about
describing. The facts can be complex as in concept learning but the
"how to" is of a different order of learning more similar to Gagne's
tL,L,
30
level 8- problem solving (6). At higher levels of the General Hierarchythe same analysis applies except facts are increasingly at more complexlevels of principle learning. Thus for an ESS General Hierarchy, theanswer to the first question asked in the AAAS Process Measure is aboutcriteria of performance. If the child is able to describe an object orevent adequately, it is more_likely that he will be able to describesimilarities and differences in a satisfactory manner. The answer tothe second question concerning efficient progression involves the com-plex problem of inquiry or discovery teaching. It is suggested herethat the General Hierarchy may provide a useful structure in the analysisof this topic.
The Process Measure developed for the ESS material may be discussedin terms of the S-R. model. When the child is presented with a geometricshape and requested to describe it, there are many stimuli present. Theshape has little to do with the context of the original learning situationwhere the child used a microscope examining cells. However, it is notentirely different. A person brings habits of describing with him whichmay or may not be changed in the learning situation. Also the descriptionof geometric shapes shares a few elements in common with describing somegeometric structures observed in cells or tissues. The significantstimulus is the question for it elicits the behavior of describing accord-ing to the rule previously mentioned. The stimulus is only the occasionfor the response to be exhibited. Certainly if the stimulus has nothingto do with the response, the appropriate responses will probably not beelicited. In summary, the stimuli in the ESS Process Measure have elementsin common with stimuli in the ESS units-Small Things and Kitchen Physics.The elements are not facts related to the discipline of biology or physicsbut are of a more operational level found in learning behavios: classifiedunder problem solving.
A curious aspect of this is the role of content. If contentobjectives are "assumed" to the detriment of learning rules fordescribing, the amount of transfer would be lower. The questions wewould like to answer is what is the role of the content in learninginquiry and at what point does emphasis of the content become detri-mental to learning how to describe, compare, apply a rule, constructand demonstrate?
Following are the process test materials given to teachers.

31
Process Measure e. Comments for Teachers
The enclosed process measure is a continuation of the evalua-
tion we discussed this summer. It is more objective and ab-
stract than before to provide a sensitive indicator of science
learned as a process rather than a body of facts. What we
gain from this process measure may assist all of us in class-
room evaluation. Participation in this is strictly voluntary
and is just one of the follow-up activities being offered.
Because of the large number of teachers and administrators
interested in this evaluation, you are requested to return all
of the enclosed forms within one week. Please give.the measure
to five or six students by selecting every fifth student as
they occur in your roll book, When you finish teaching the ESS
unit(s), return the enclosed post card with your name and ad-
dress and request the process measure to be returned so you
may give it to a second group of different students (every
fourth on the roll). These general results will be related
to a final brief written evaluation that everyone may take in
the spring. In the final report, all of the results will be
coded to protect the anonymity of all those participating.
In order to standardize as many factors as possible, the pro-
cess measure should be given orally to one student at a time
between 9:30 - 11 a.m. on any day except Friday. The teacher
should be seated opposite the child at a table cleared of any

32
other objectz. The table should be away from the main activity
of the class so the student is not distracted.
All of the instructions to the child are spoken by you as they
are written in capital letters on the direction sheet. You
begin the measure by saying I AM GOING TO ASK YOU SOME QUESTIONS
BUT I AM NOT GOING TO SAY IF YOUR ANSWER IS RIGHT OR WRONG. DO
AS WELL AS YOU CAN AND TELL ME WHEN YOU ARE FINISHED ANSWERING.
WHEN YOU TELL ME YOU ARE FINISHED, I WILL ASK YOU THE NWT
QUESTION. YOU WILL NOT BE GRADED ON THIS. You then ask ques-
tion #1 and when the child indicates the answer is finished,
you respond with O.K. or All Right and proceed to the next
question. It is important to avoid indicating through any ex-
pression whether the answer is classified as "complete" or
"incomplete". If the child asks what you mean by a question,
just say ANSWER WHAT YOU THINK I MEAN. Repeat the question
if asked but do not interpret what you think it means to the
child. In other words, it is important to limit your conver-
sation to the statements written in capital letters.
There are eighteen boxes on the answer sheet. Place a 1 in
the box if the corresponding question is "complete". An
answer is "complete" if all the items listed after alphabet
letters are given. Some questions have only one answer, some
have two and three that must be given to be scored as 1 or
"complete". If the child has given all but one of the items
4
33
required for a "complete" answer, do not pause or ask for more
information but continue giving the process measure at your
normal rate. If the child asks if you want more, just say JUST
TELL ME WHEN YOUR ANSWER IS rINISHED AND I WILL ASK YOU THE Nmrr
QUESTION. When the answer is "incomplete" (one or more items
missing), place an 0 in the corresponding box. The answer given
by the child does not have to be exactly like the one listed
under albsc but must be a reasonable equivalent. Keep the
answer sheet out of the child's sight so he will not see if
there is a change in scoring. Some of the children will miss
some of the answers. It is important for you to practice giv-
ing the measure prior to its use.

34
Process Measure Evaluation Instructions
Instructions to the Teacher
Place on tablered plain trianglered triangle with x upblue square
To the side place envelope(with #2 up) and paperclip
Hand the red triangle withthe x to the child.
Hand paperclip to child.Place to side when finished
Place plain piece of 81/2 by11" paper on table and re-move when answer is finished
Hand red triangle (plain)to child
SPOINSN INSTRUCTIONS
1. WaNT TO THE OBJECT WITH THEBLACK MARKa. points to the xWHICH OBJECT IS THE BIGGEST?b. points to the square (mark
box #1 with a 1 if both aand b are answered.)
2. POINT TO AN OBJECT WITH THREESIDESa. points to the trianglePOINT TO THE LONGEST SIDE OFANY OBJECTb. points to long side of
triangle
3. CAN YOU DESCRIBE THIS TO ME.YOU MAY HOLD ITa. mentions at le-st four
characteristics such astexture, color, markings,shape, flexibility, smell,etc.
4. DESCRIBE THIS TO MEa. mentions at least four
characteristics as above
5. HOW MANY PAPERCLIPS WIDE ISTHIS PAPER?a. uses paperclip to measure
and then says how long orwide it is in terms ofupaperclipsn (length orwidth)
6. WHAT COULD YOU DO OR USE TODESCRIBE THIS MORE ACCURATELYOR IN MORE DETAIL?a. mentions the use of some
quantative measure such asa balance or ruler or somearbitrary unit (as paper-clipsn)
35
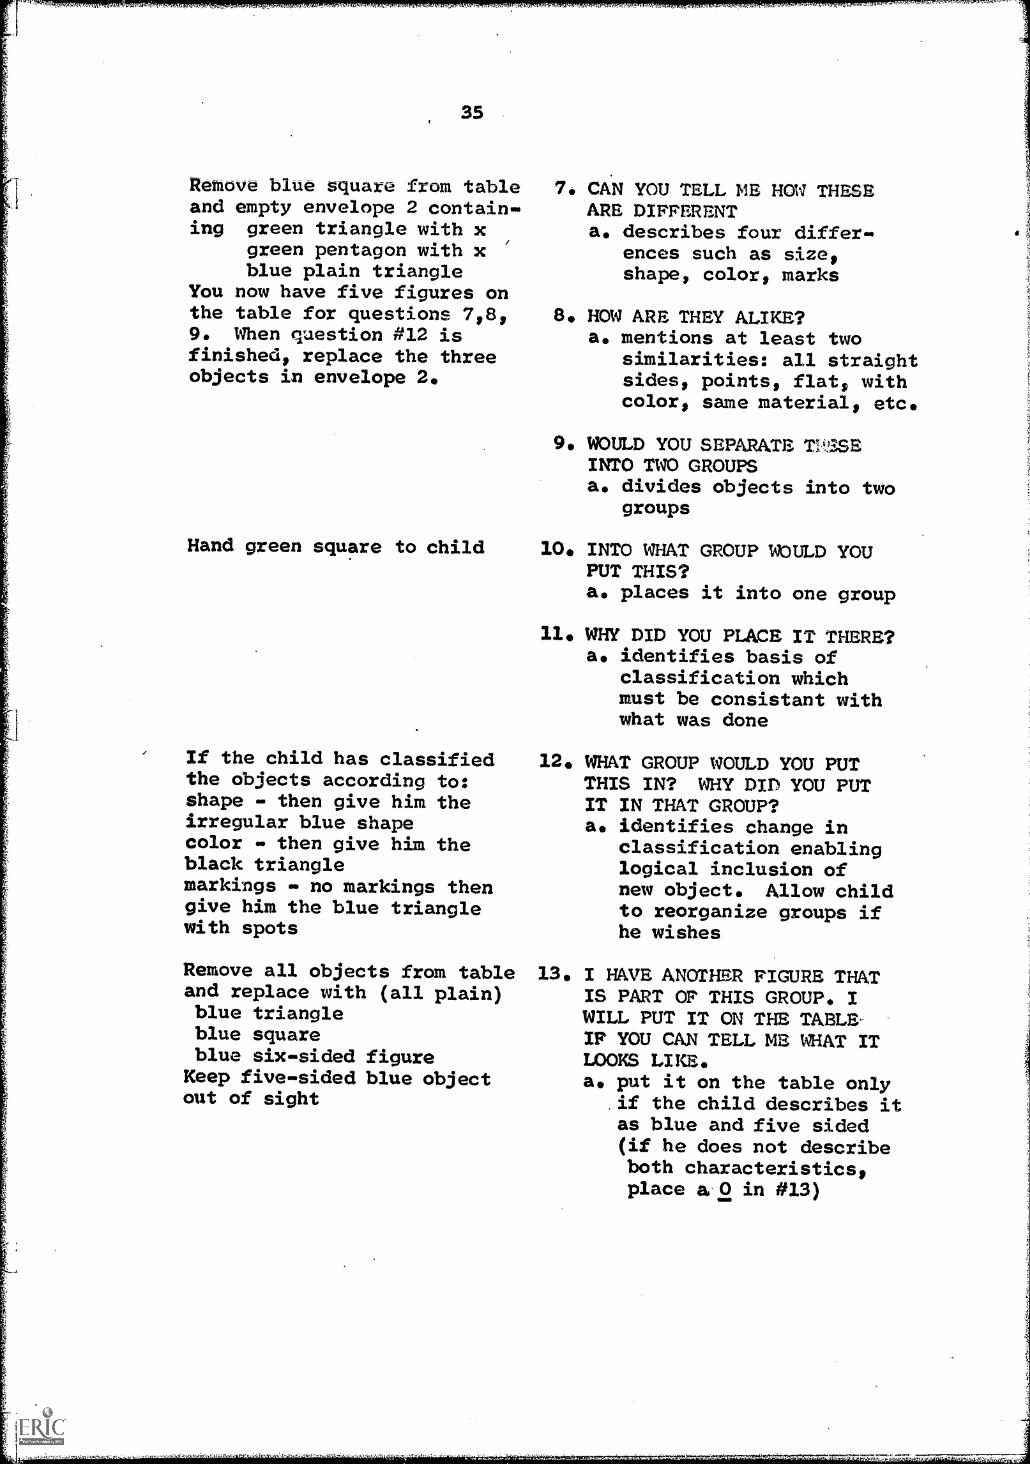
Remove blue square from tableand empty envelope 2 contain-ing green triangle with x
green pentagon with xblue plain triangle
You now have five figures onthe table for questions 718,9. When question #12 isfinished, replace the threeobjects in envelope 2.
Hand green square to child
If the child has classifiedthe objects according to:shape - then give him theirregular blue shapecolor - then give him theblack trianglemarkings is no markings thengive him the blue trianglewith spots
7. CAN YOU TELL ME HOW THESEARE DIFFERENTa. describes four differ-
ences such as size,shape, color, marks
8. HOW ARE THEY ALIKE?a. mentions at least two
similarities: all straightsides, points, flat, withcolor, same material, etc.
9. WOULD YOU SEPARATE MSSEINTO TWO GROUPSa. divides Objects into two
groups
10. INTO WHAT GROUP WOULD YOUPUT THIS?a. places it into one group
11. WHY DID YOU PLACE IT THERE?a. identifies basis of
classification whichmust be consistant withwhat was done
12. WHAT GROUP WCULD YOU PUTTHIS IN? WHY DID YOU PUTIT IN THAT GROUP?a. identifies change in
classification enablinglogical inclusion ofnew object. Allow childto reorganize groups ifhe wishes
Remove all objects from table 13.and replace with (all plain)blue triangleblue squareblue six-sided figure
Keep five-sided blue objectout of sight
I HAVE ANUTHER FIGURE THATIS PART OP THIS GROUP. IWILL PUT IT ON THE TM:31,E-n' YOU CAN TELL ME WHAT ITLOOKS LIKE.a. put it on the table only
if the child describes itas blue and five sided(if he does not describeboth characteristics,place a 2 in #13)

36
Push the group of blue objects 14.to one side and place in frontof child the green triangle,green square and green five-sided figure. Do not arrange.
Push group of green objects toother side except the five-sided one. To the green five-sided one add a blue triangleand a black six-sided figure.
Remove all objects from table 15.and place paper with sevenfigures in front of childso he may easily read thewords "group one" "group two"
THIS GROUP IS LIKE THE FIRST.CAN YOU TELL ME WHAT FIGUREIS MISSING?a. describes it as green and
six ore more sided. placeit on table even if he:getsa 2
WHAT FIGURE IS MISSING FROMTHIS GROUP?b. describes it as red and
four-sided (or square).place on table only if hegets a 1
THERE ARE TWO GROUPS OFFIGURES ON THE PAPER. EACHGROUP HAS FOUR FIGURES. ISANY ONE FIGURE IN BOTHGROUPS?a. identifies three-sided
figure
HOW MANY FIGURES ARE THERE?ALL TCGETHER?b. seven
HOW ARE THE TM GROUPS DIFFER-ENT? HOW ARE THEY THE SAME?c. mentions at least one
similarity such as bothgroups have same shapesand one difference suchas one group gets biggerthan the other
16. CAN YOU TELL ME ABOUT JUSTONE CHARACTE1USTIC OF THEFIGURES THAT ST&YS THE SAMEIN ONE GROUP AND CHANGES INTHE OTHER?a. identifies length of
sides or center linesstay the same in onegroup and change in theother
17. HOW COULD YOU SHOW THAT YOUARE CORRECT?a. indicates some way such
as measuring
37
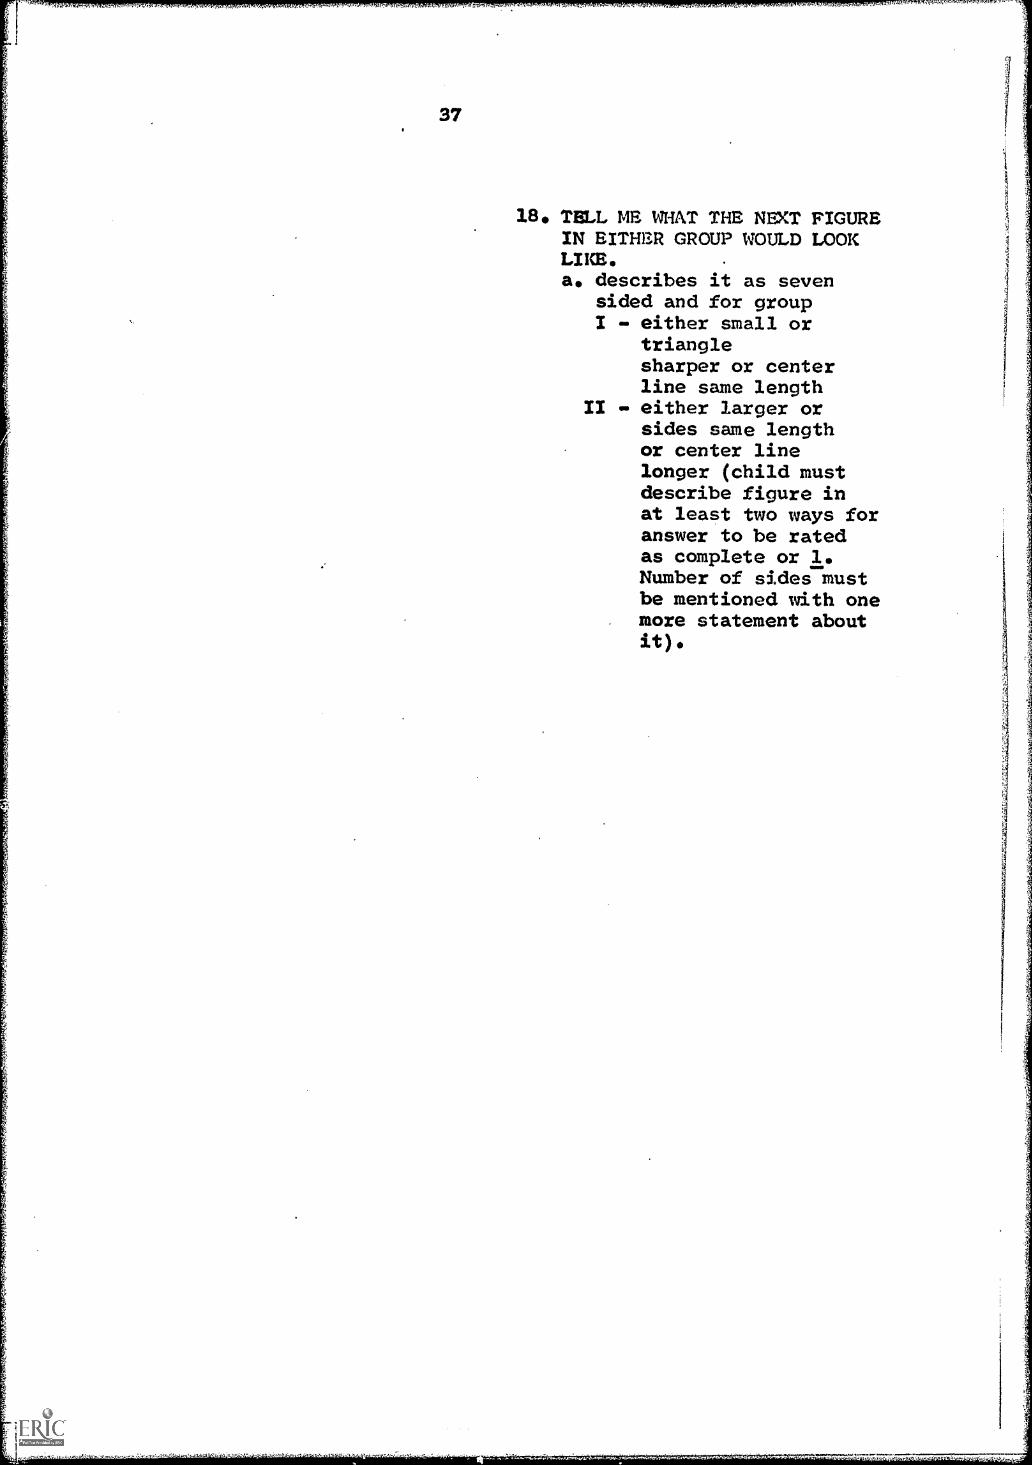
18. TELL ME WHAT THE NEXT FIGUREIN EITHER GROUP WOULD LOOKLIKE.a. describes it as seven
sided and for groupI - either small or
trianglesharper or centerline same length
II - either larger orsides same lengthor center linelonger (child mustdescribe figure inat least two ways foranswer to be ratedas complete or 1.Number of sides mustbe mentioned with onemore statement about
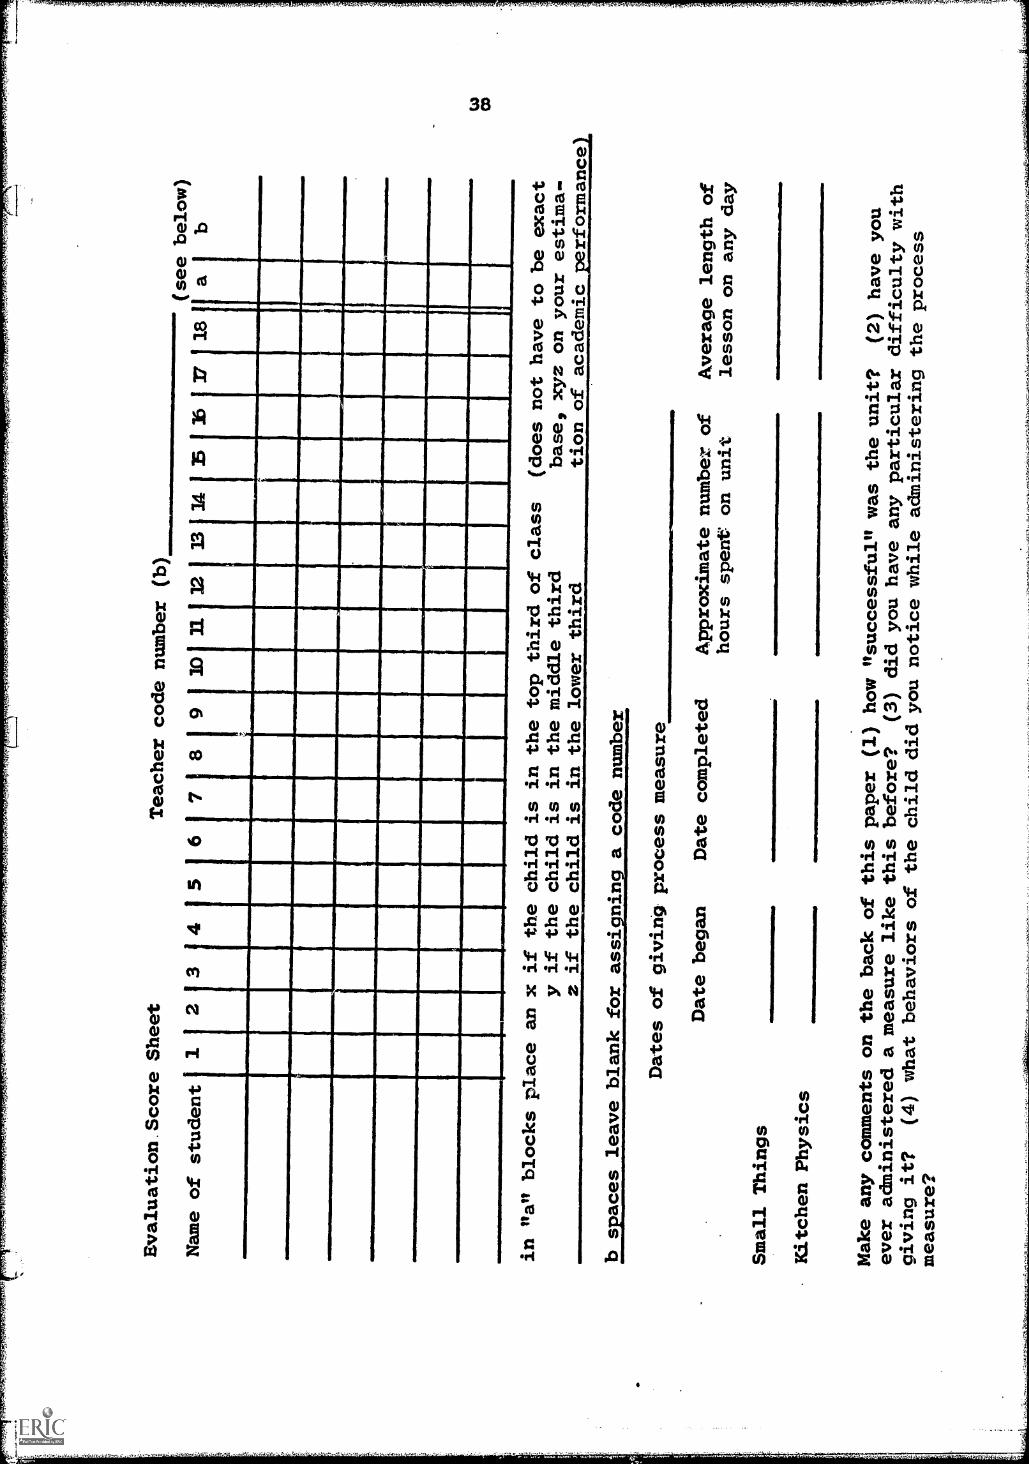
Evaluation.Score Sheet
Teacher code number (b)
(see below
Name of student
12
45
67
8I 9
I
10
11
1 12
13
34
35
36
ra
b
...
.
,
,
in "a" blocks place an
x if the child is in the top third of class
(does not have to be exact
y if the child is in the middle third
base, xyz on your estima-
z if the child is in the lower third
tion of academic performance
b spaces leave blank for assigning
a code number,
Small Things
Kitchen Physics
Dates of giving processmeasure
Date began
Date completed
Approximate number of
Average length of
hours spent on unit
lesson on any day
Make any comments on the back of thispaper (1) how "successful" was the unit?
(2) have you
ever administered a measure like this before?
(3) did you have any particular
difficulty with
oiving it?
(4) what behaviors of the childdid you notice while administering
the process
measure?
39
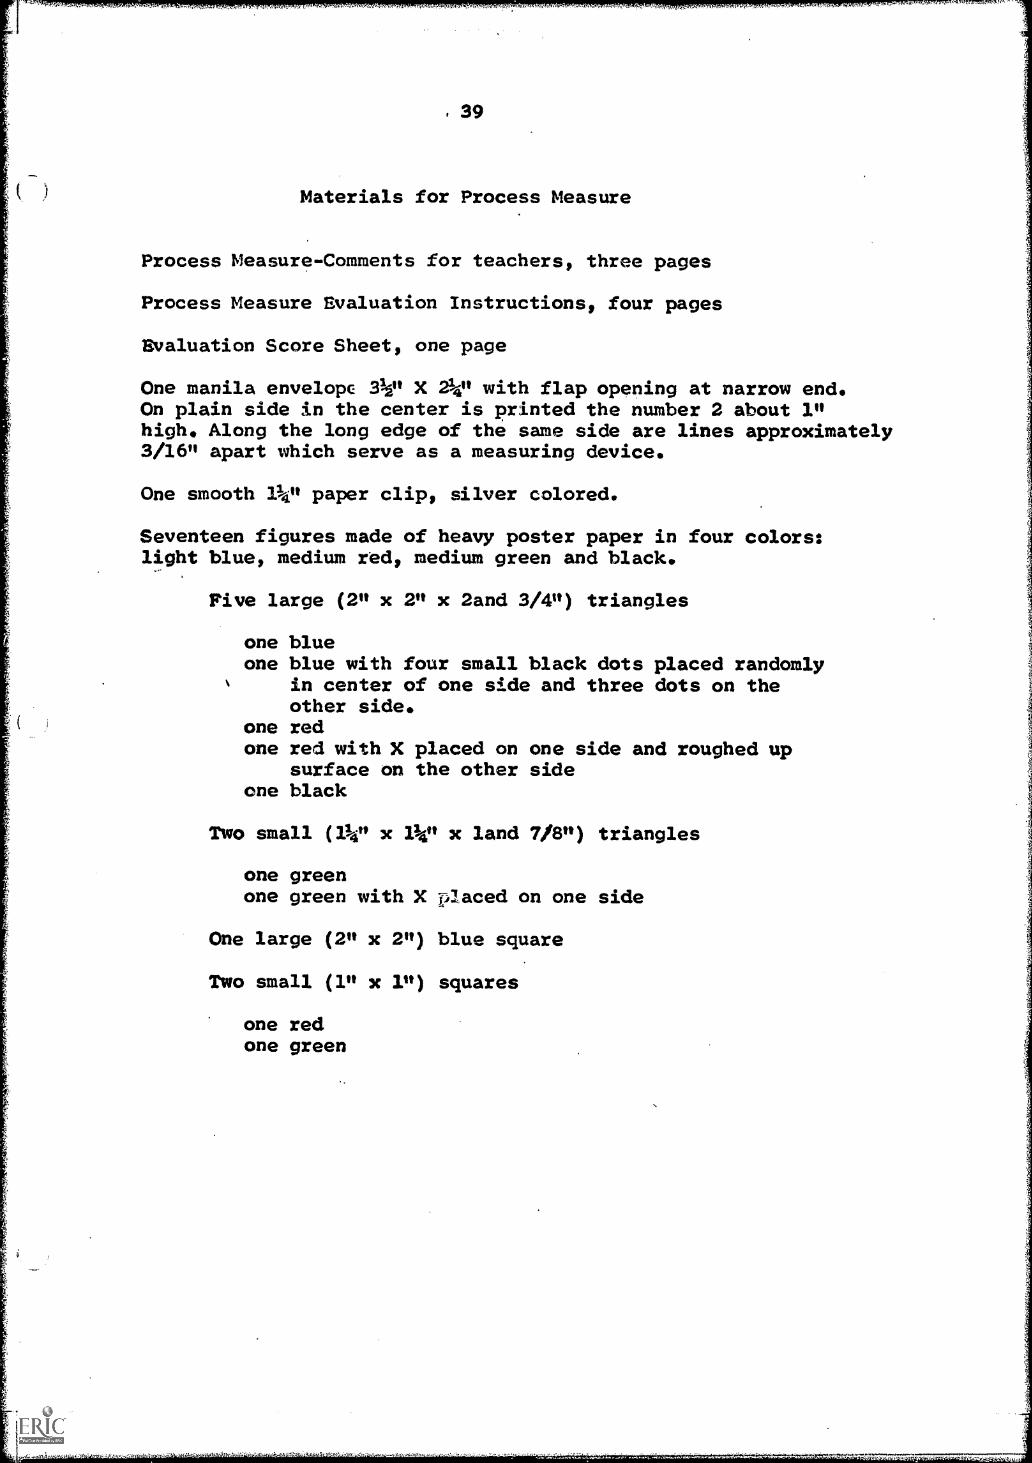
Materials for Process Measure
Process Measure-Comments for teachers, three pages
Process Measure Evaluation Instructions, four pages
Evaluation Score Sheet, one page
Cme manila envelopc 31/2" X 24" with flap opening at narrow end.On plain side in the center is printed the number 2 about 1"high. Along the long edge of the same side are lines approximately3/16" apart which serve as a measuring device.
One smooth 14" paper clip, silver colored.
Seventeen figures made of heavy poster paper in four colors:light blue, medium red, medium green and black.
Five large (2" x 2" x 2and 3/4") triangles
one blueone blue with four small black dots placed randomly
in center of one side and three dots on theother side.
one redone red with X placed on one side and roughed up
surface on the other sideone black
Two small (114" x 11/4" x land VS") triangles
one greenone green with X placed on one side
One large (2" x 2") blue square
Two small (1" x 1") squares
one redone green
Vftmwe.cr.P.

40
Three pentagons
one green (1 and 1/8" on each side)one green (1 and 1/8" on each side) with X placed on one sideone blue (1" on each side)
Three hexagons
one blue (1" on each side)one green (3/4" on each side)one black (3/4" on each side)
One irregular-shaped figure in blue
One AP x 11" sheet of paper on which there is printedseven figures divided into two groups.

(1

42
Definition of Acceptable Learning Set for Analysis of TransferBetween Learning Sets
An acceptable learning set is represented by a plus (+) sign and
is defined by the following combinations of acceptable (1) and
unacceptable (0) responses to the paired questions in each learn-
ing set.
011011
Transfer between single learning sets has the following possi-
ble combinations consistant with positive transfer (lower to
higher)
010101101010111111
011011011011011011
00 004.
011000
a.
00
Transfer to a higher learning set when a subordinate learning
set is unacceptable (-) is contradictory to the hierarchy as
in the following combinations (lower to higher)
00 0100 1000 11

43
Transfer from two learning sets together occurs once in the
"BSS 3ehavior Hierarchy"
IV A IV B V9,10 11,12 13,14
An acceptable double learning set (+) is defined by the following
combinations:
01 0101 1001 1110 0110 1010 1111 0111 1011 11
An unacceptable learning set (-) is defined by the following
combinations:
01 0010 0011 0000 0100 1000 1100 00
Transfer from the double learning set to the single learning
set would then be analyzed by all possible combinations found
within the four types of transfer (1) + to + (2) us to us
(3) + to and (4) - to +
The above analysis is based on reference (6)
44
Bibliography
1. Gaga:, R.M. and Paradise, N.E. "Abilities and Learning Sets
in Knowledge Acquisition" Psychological Monographs. No. 518
Vol. 75 No. 14 1961
2. Gagng, R.M. "Elementary Science: A New Scheme of Instruction"SCIENCE Vol. 151. No. 3706 January 7, 1966 pp 49-53
3. AAAS Process Chart. Xerox Educational Division, N.Y.
4. Gagn6, R.M. "Science-A. Process Approach: Puropses, AccomplishmentsExpectations" (draft AAAS)
5. Raven, R. and Strubing, H. "The Effect of Visual Perception Unitson Achievement in a Science Unit: Aptitudinal and SubstantiveTransfer in Second Grade Children" American Educational ResearchJournal. Vol 5 No. 3 May 1968 333-342
6. Gagne, R.M. Conditions of Learning. Holt, Rinehart and Winston,New York 1965
- 45 -
V. PROCESS MEASURE RESULTS
During the 1966-67 year, twenty-one teachers from the Washington metropolitanarea voluntarily participated in the evaluation. As is seen in the summaryof "Teachers Participating in Evaluation" they represented a wide variety ofsituations. They taught in rural and suburban areas of four counties. Theyincluded three grade levels 4, 5, and 6. Five teachers gave only a "before"test to their students which was intended as a control before being exposedto the ESS units. Ten teachers gave only an "after" test after studying oneor two ESS units. Only four gave both "before" and "after" tests that wereincluded in the final calculation. Three results we omitted because of latereturn or other errors. The "after" tests given shortly after completingthe units were spread over a five month period between November 1966 andApril 1967. The Baltimore subgroup, teacher number 21, was a special case.Of the fourteen teachers giving the after test, five taught both Small Thingsand Kitchen Physics, one taught Kitchen Physics only and the remaining eighttaught only Small Things. Of the twenty-one teachers participating insome part of the Process Measure, fifteen also gave a content test to bediscussed in the next section.
Needless to say, many selection factors could be operating to influencethe results. There is enough data however to help one decide whether anexperiment under carefully controlled conditions is of value.

7,7 ,
Teachers Participating in Evaluation
Teacher County. Grade
Number ofTest SubjectsBefore After
Month ESSUnits
CompletedST KP
ContentTest
1 Mrs, T A 6 14 11/66 2/67 Yes
2 Mrs. P A 4 5 12/66 2/67 No
3 Mrs. G A. 5 5 (7) 2/67 4/67 Yes
4 Miss W A 4 5 No
5 Mrs. G A 4 6 7 10/66 3/67 Yes
6 Miss M M 5 6 3/67 Yes
7 Mrs. R M 6 6 1/67 Yes
8 Mrs. A M 5 6 11/66 Yes
9 Mrs, B M 6 5 2/67 6/67 Yes
10 Miss B M 6 6 12 12/66 4/67 Yes
11 Mrs. H I* $ 6 12/66 Yes
12 Mrs. F M 5 5 (5) 3/67 Yes
13 Mr. H M 6 13 11/66 No
14 Mrs. J M 5 5 (6) 12/66 No
15 Mrs. C P 4 6 5 12/66 Yes
16 Mrs. T P 5 7 No
17 Mrs. B P 6 6 1/67 Yes
18 Mrs, L P. 6 7 1/67 Yes
19 Mr. Y P.
4 7 6/67 5/67 Yes
20 Mr. H P 6 7 3/67 3/67 Yes
21 Mr. S B 4&5 34 36 11/67 No
County: AwArlington, WiMontgomery, P*Prince George's, B-Ealtimore
ESS Units: ST-Small Things, KP-Kitchen Physics
Numbers in ( ) not included in /BM data

71r
-47-,
VII ,
Do the students improve in behavioral skills as a result of studying the ESS
units? Eighteen items in the process measure assess the nine learning sets.By the criteria that one correct response out of two define an acceptablelearning set, then all learning sets reflect an improvement
Learning Set
ProcessQuestions
AverageImprovement*
I 1, 2 +0.1II A 5, 6 +10 . 3
II B 3, 4 +9.0III 7, 8 +20. 7
IV A 9, 10 +1 . 0
IV B 11, 12 49 .5
V 13, 14 +4.3VT 15, 16
VII 17, 18 +17.0
The average correct response before studying ESS was 60% (Chart I) and afterstudying ESS it increased to 68% (Chart II).
Such an over-all description is not very meaningful for reasons of validity,reliability and purpose of the.measura. lele do not know for example howequivalent the "before" and "after" groups are on any other factor. Thefact that some teachers who gave the "after" test were knowledgeable aboutit compared to others who did not also give a "before" test quite likelyhad some influence.
Of greater interest is the improvament or possible transfer on individualitems. The profile of a subgroup from Baltimore (graph II) closely agreesin the area of improvement with the other groups (graph I). Over-all theBaltimore group had twice the improvement. This might be explained by thefact that the Baltimore teacher (#21) was highly experienced with ESSmaterials and had conducted many programs for teachers in using ESS units -especially Small Things. This assumption would have to be tested undercontrolled conditions before it could state with much reliability. Astrong support comes from examining the items of improvement. Gains ofover 207 occur in eight items of the Baltimore group. Gains of over 10%occur also in eight items of the earlier group and five of the eight arethe same items. On six items of least improvement the groups also closelyagree. (Chart IX)
*calculated from Chart IX
r-fC V , rVn
- 48 -
Another subgroup (excluding Baltimore) was examined to see if there wasany differential performance on the "after" test between children whostudied Small Things only compared with those who also studied KitchenPhysics. This second unit was not examined separately since only 13children studied it alone. The earlier analyses of Small Things behaviorsinto the seven levels of the General Hierarchy (page 8) demonstrated mostof the activities in the first three levels. For Kitchen Physics, mostof the activities are in the upper three levels V, VI, VII (p. 28). Thegroup doing both units had a greater number of acceptable responses. Thiseffect does not appear to be a function of grade level (graph VI and VII)but may very well be a result of the fact that brighter groups do morework. We can still examine where the greater performance appeared. Withthe additirm of Kitchen Physics with its strength at the upper levels wewould expect a large part of the improvement to be at levels V, VI, andVII compared to I, 113 III. This appears to be the case .(Chart IX).
Levels Percent Differences Totaled
I, II, III - 3.9IV + 32.3
V, VI, VII + 48.2
Teachers also classified their students into three groups of academicability, although only one-fifth of their students were placed in thelower third. The verbal I.Q. was obtained for thirty-six children withthe following results:
Group Number of Children Average I.Q. Range of I.Q.
X 14 122.4 98 - 137Y 11 109.8 93 - 129Z 11 96.2 73 - 125
Graph profiles show that the lower third did not improve in performance afterstudying the ESS units (graph V). Final performance of fhe middle and upperthird were very similar although "before" performance of the upper third wassuperior (graph III). The greatest increase in performance therefore waswith the middle third (graph IV).
*

IA . b! , TiFwre,
- 49 -
Validation of the Hierarchy
e-OVI,Ob
Examination of eighteen individual items in the Process Measure allowscomparison of difficulty level between question pairs in each learning
set. For example, in the Before test (chart I) questions one and twounder learning set I are evidently equally difficult while this is nottrue of questions three and four under learning set II B. Note thatlearning set II A has not been included in the final calculations sinceit is quite different from the others in a manner to be described later.
Although 3.6% of the responses for questions one and two were "unacceptable"(see page 42) all"of the responses for learning set I were "satisfactory"since there were no occurrences of both questions being missed by the
same individual. In other words,.an acceptable learning set is defined
as one or both questions being "acceptable."
Pobitive transfer between learning sets is identified as occurring whenbehavioral competencies in the lower learning set "mediate" or increasethe probability that the learner will be competent in performing be-haviors at the next higher learning set. When the higher learning taskis not attained, then learning experience background Is inadequate -the learner lacks prerequisite behavioral competences. Given tenindividuals one will have ten different patterns of behavioral competenciespossessed. This is one description of "individual differences."
It is quite possible that a higher learning set will be satisfactorywhen the lower learning set is not. This can be explained in two ways.Either the task used to assess the lower learning set is too difficultor it is not necessary for performance of the higher level task. Both
cases are a problem of proper definition of tasks necessary for "mediation"**
between learning sets. It is also a problem of language. A higher learn-ing set will not possess all of the behaviors found in the lower learningset. The behaviors not possessed in the lower learning set may not allbe necessary for the higher task. One result of an instructional program
is to reduce individual differences. As a result of a success program,we should see a higher proportion of terminal tasks attained as well as
an increase in "acceptable" learning sets subordinate to the terminal task.The proportion of instances consistent with positive transfer should there-fore increase.
* All but one.** This problem is discussed further in the summary.

st1,2-7,-q,70,W ,
50
The percentage of learning sets (L.S.) acceptable increased from 69%
in the before group (chart XV) to 80% in the after group (chart XVI). This
11% increase was larger than the 6% average increase observed in the eighteen
individual items of the Process Measure - from 60% to 68% (chart I, II). The
higher percentage values of learning sets is due to the definition of accept-
able L.S. as one or both questions in the Process Measure being satisfactory
(31 or 10). All of the learning sets reflect an improvement comparable to
the averaged of paired individual questions (page 47) with the exception of
L.S. VI and questions 15, 16. This is a result of a large reduction in
ambigious answers (01 or 10 or 11 or 00) for the learning set (chart XIV).
The two most obvious differences between before and after groups are the
twofold increases in individuals achieving terminal learning sets and achieving
all learnings sets.
The following results are summarized from charts XV and XVI.
40111
Percentage of Satisfactory ResponsesI Before Group After Group
Achieved terminal Learning Set 1 32% 56%
Achieved all Learning Sets 16% 30%
Missed only terminal L. S. 9% 9%
Missed a subordinate L. S.and all hi:her ones 12% 11%
Missed a subordinate L. S.and achieved a higher L. S. 63% 52%
.A
51
WV,P.
The proportion of transfers within the hierarchy increased from an
average of .85 in the before group (chart X) to .88 in the after group
(chart XI). The impvovement appears to be in the first four levels of the
seven levels of the General Hierarchy (page 9) but a differential effect of
the two ESS units has been suggested on page 48 (chart IX column 3).
An increase in acceptable responses does not necessarily result in
an increase of instances consistant with positive transfer. For example,
the number of students that could not respond satisfactorily to questions 3
and 4 (L,S. IIB) decreased considerably but the proportion of instances
consistant with positive transfer changed very little. The increase in
satisfactory IIB learning sets is reflected in the increased proportion
of instances consistent with mediated transfer (chart XIII) compared to
the before group (chart XII). There was also a slight increase in instancesinconsistant with mediated transfer (4. - 4) as would be expected from the
stability of instances consistant with positive transfer. Thus the difference
in proportion of .60 in the after group is due largely to an increase in
acceptable learning sets (f).
A measure of reliability is offered in the idea of ambiguity. In
this sitdation a learning set is scored acceptable with only one question
correct. This follows the criteria used by AAAS in scoring their competency
measure but differed from Gagne who used a definition of both answers
required to be correct. His definition of ambiguity was thus based on
missed learning sets. In this paper little change was found in ambiguity
between before and after groups. The respective values of .32 and .30(chart XIV) are ten times higher than the value of .03 reported by Gagne.
The General Hierarchy model assumes an increasing order of difficulty.
Consequently, with an increasing number of intervening learning sets, the
frequency of pass to fail relationships should increase. This pattern is
observed in chart XVII with the exception of four learning sets. This
result is due to the high percentage (71.3) of acceptable responses forquestion 15 (chart II) which caused a large number of Learning Sets VI
to be satisfactory.

VI. Content Test Rosults
At the end of the 1966-67 academic year, the content test was made availableto six different groups of teachers (chart XX). Each of the seven contentquestions was tentatively identified with one of the seven levels of thegeneral hierarchy. There was no relation between scores on the contenttest (chart XXI) and the process "after" measure (chart XVIII) for thosesubjects taking both tests.
The only content test item that children who studied the Small Things unitwere more successful with was number one. According to the "criteria foracceptable response" (p.53) they were able to draw a "recognizable" celland label two or more structures_ With the exception of this item, allfifth grades had similar profiles for the remainder of the test. On thebasis of partial verbal I.Q. 's available (chart XIX) the groups wereequivalent. The biggest factor in both content and process test per-formance seems to be in the "academic" category identifed by the teacher.-Those classified as in the upper third performed much better than themiddle and lower third (chart XXIII). This analysis does not show muchrelation between performance on the separate items.
Although the fourth graders appeared to hlve the highest I.Q. as a group(although too few were available to say conclusively) they did not do wellon the content test. This did not appear to be true of their performanceon the Process Measure which was all oral and manipulative. Thus, onwritten tests, the fifth grade appears to be the minimum level to obtainan evaluation more consistent with an oral test.

53
Scoring Key for "Questions on Small Things"Content Test
Criteria for Acce1121212222.20.2t
Construct a "recognizable" cell and label twoor more structures - nucleus, interior, cellwall or outer part, storage, etc.
Order ofBACDonly
Identify second choice only
IdentifyIdea
Idea
one of the.following ideasof function - some cells or parts do-
different thingsof environment - cells are affected
by more water (roots),sun (leaves)
IS OM
Identify one of the following ideasIdea of movement - if they move, they are
aliveIdea of response - if they eat, or move
when stimulatedIf they look like a plant, animal or cell
OS
Describing four or more characteristics
7 Identify an appropriate shape with function

54
Questions on Small Things Name
1. Draw a cell and name its parts.
2. These four objects - atb,c0d - are seen through amicroscope and a magnifying glass. Arrange themin order of their real size by writing the letterof the object below.
MONEMINIMNIIIMI
frammoissImill
UMWEINININm1111011.
is the smallest
is a little bigger
is next to the biggest
is the biggest really
A HAIR
3. A boy has a small magnifying glass. He finds aseed that is just as wide as the magnifying glass.When he looks at the seed through the glass, theseed looks bigger and (check one)
he sees all of the seed at one time1:3 he cannot see all of the seed at one time
4. Why do you suppose the cells are different indifferent parts of the plant?
01..11.rn awn
110011..011
aammeryINI.0
410.0. Mallima.... Ime,awMIIIMAMOolliallyamg
..............00MMfflow.NIN0001111111111

V.14)15z,-2..4.rr
SS
,
50 Here is a picture of some small objects.If someone gives them to you and asks youif they are alive, describe what you willdo to the objects to find emt f they are alive.
'SMALLOaTECTS
1.
UMW .1111MIM1111W
6. How many differences can you see between the objectsbelow. List all the differences you see.
7. Place a circle around the cell that would be best forprotecting the plant.
Why did you pick that one?
%.1.111111111011.

56
XYPICAL ANSWERS TO "QUESTIONS ON SMALL THINGS"
1. Answers marked correct generally were similar to this one.
Most children labeled the cell well and nucleus; many also
labeled protoplasm. A few labeled extensively, even including
mitochondria and endoplasmic reticulum.
Most incorrect answers were blank, or had the cell but had no,
or not enough, labels. In Group I many children copied the
illustration for question 2. Groups I and II generally had no
basic understanding of the structure of the cell. Group V had
correct answers, but they were not detailed. These cells were
labeled "inside", "outside", etc. Group VI answers were gen-
erally correct but not detailed, although some showed knowledge
of the division process of cells. In Group IV two classes
showed a very good understanding of cell structure, while five
other classes showed a very poor understanding. Group III
labeled more parts to the cell more specifically. Labels in
this group included protoplasm or cytoplasm, nucleolus and
chloroplast.
4. Most children answered this question by saying that each cell
has a different job to do. Some said because the plant looked
different in different parts, and some noted difference in
environment. Some typical answers were:

57
"Oe. would bring in water and food. One would bring in
sunlight. One would bring in air."
"flAtfeent parts of the plant need different cells to, do
different things like ..."
nnecause not all the plant looks alid- and the cell takes
GI.. shape of the part of the plant it's in."
P'6Jme parts get more sunlight. Some parts have different 1
'ture. ...grow under the ground,...carry water,
minerals,...have different color.".
Generally, wrong answers compared different plants instead of
parts within the plant, compared plants to animals, or said the
cells wire different because the plant has different cells. A
few tw-, d that cells are different in different parts of humans
and sv they must be different in plants, too.
5. The veA)Ft typical correct answer for this question was:
"You can put them under a microscope and see if they move."
Others Nere:
"Give at. come food and see if it eats."
"Find wt if there are any cells in the body. Can it produce?"
"Fi 't t I might do would be to look at them through a
micrscope to see if they look like cells or small animals. I
would also look for movement."

58
A widespread misunderstanding of either the question or the basic
concept of characteristics of living things was evident. A
number of the wrong answers can be represented by "Look in a
microscope and see if they are alive," They'exhibited extensive
knowledge of the procedure for using a magnifying glass, a
microscope, and a miniscope. Some gave ,9.xplicit, detailed answers
on preparation of a slide. But they all failed to cite those
characteristics which would indicate that the objects were
living matter.
6. In comparing the two objects illustrated, some children could
contrast opposing characteristics, whereas some only listed the
characteristics of each object separately. The differences most
often noted were:
ovaldotssingle nucleusposition of nucleusthin walllargeclearsmooth outlinehas a tailanimal cellliving cellnucleus clear(dot inside)eye
rectanglelinesdouble nucleus
thick wallsmallshadedfuzzy outline
plant ceilcrystalnucleus solid(dot outside)
TV screen
A typical answer would list four or five of the above differences.
A few children noted only one difference:
"One has dots, one has lines."
round---s-quare"

59
A number of children listed as many as seven differences.
The younger children and those who have not studied the unit
described the objects in more general terms than those who
have studied it. The Seminar classes (particularly Group III)
gave more descriptive and detailed answers. They referred to
"cell walls" and "nucleus" where other children used "outside"
and "blotches".
7. Most children chose the heavy walled cell to protect the plant
best. They said it looked the strongest. Some chose the
biggest. A few chose the pointed one because it looked sharp.
Typical wrong answers were:
"Because it looked like a leaf."
"Because it looked like a seed."
Group III showed a definite superiority in basic comprehension
of the principles tested. Groups I, II,,and V showed generally
poor understanding of the structure of a cell. In Group IV, two
classes exhibited good understanding, while iwo classes exhibited
very poor underste- Ling.
One class which did not sign their names gave extremely poor
'answers.
A:, r

-60-
Third version of content test
The content test that was finally given on Small Things at the end of the 1966-67academic year was the fifth version to be developed. Two earlier versions areincluded here to show some of the development and responses given by children.As every test maker inevitably finds out, the responses to a question oftensample a much larger universe of possibilities than is originally thought.
Summary of responses fram one class on the third version of the Small Things test:
1. first choice 9
second choice 0
third choice 14
first choice 0second choice 18
third choice 2
fourth choice 3
3. D C -- A 8 (B and E were accepted in either order)E D -- A 4C D -- A 3others 8
4. first ob'ect second object third ob ectnucleus 17 cell wall (skin, etc.) 14 food vacuole 4cells 2 outside cell 1 protoplasm 4
particles 3
Mbst named it cell because "it looked like one"
5. Number of Number Frequency of termsdifferences of used to describenamed Students differences
round 8
thin wall 7
more protoplasm 2
size 1size of nucleus 1
no vacuole 1
0 9
1 2
2 9
3 3
5. (duplicate number)All answers but two were correct
6. Characteristics of cells drawnstorage cells - more dots in cell, thinprotection cell - square, small, dark, sharp end
Number giving some response as above 9

' ;';
-61
Typical answers"useful for different things""thicker wall"IIone is round, other like a wall"
8. No 13
Yes 7
"sometimes it has things inside""made up of sides""If it were sugar it would be part of the sugar cane plant."
9. softer to chew 4makes It tendercells get weaker
10. Number drawing a recognizable animal 13Drawing did not match name of animal 3
11. Gave some valid reason 14Invalid 2'
Examples: must be from creek or laketap water is purified, it has chlorine
12. Most common response "in living things" (8)
13. True Falsea 19 4b 22 1
c 15 8
d 3 20
14. Twenty picked Johnny because it was complicated (probably had cells) orit moved most. Three picked Jeanne, two gave reason that water might havemoved the object.
15. Eighteen picked Anne because it didn't move or dissolve when water was added,did not increase in size.Five picked Peter because living things react, got bigger.
16. Twenty picked Johnny because of complicated parts and most movement.
17. Is it moving? 9
Does it have cells? 4Is it eating? 4
18. Unanimous yes

vvr-,Z5
62.
Third version of Small Things Test
QUESTIONS ON SMALL THINGS name
1. A boy is looking at a seed through a piece of glass. He looks throughthree different pieces. Circle the one that will make the seed lookbigger.
itz=>ki
2. A seed is just a/wide as a magnifying glass whenthey are next to each other. When the alass isheld over the seed, what do you think you will see?Circle the picture below that you think you will see. Sea
ct14.SS
3. There are five pieces of an onion bulb drawn below. Although theyare really different sizes, they are alJ drawn the same size. Arrangethem in order of their real size, from smallest to biggest, bywriting the number of the picture'below.
The smallest is
A little bigger is
Even bisger is
Next to the biggest is
The biggest really is
piebea
4 Give a name for the different parts of the thing below.
Give the thing above a name
Why did you name it that?
5. In what ways is this thing different fromihe one above? Write below as many differencesyou can see between the two things.
Give this thing a name
Why did you name it that? ,1

( -)
63
5. The five kinds of plants below have cells in them. Draw a linebetween the parts of the plants that you think would have cellsthat look most alike.
celery leaf *tomato root *fern stem *
11.11111.,
* celery stem* onion root* carrot leaf
6. Draw a cell that would be good forstoring food in a plant.
gamoslm.
Draw a cell that would.be goodfor protecting a plant.
411111P fiVOWN. wommolliftersonoilm7. Why do the cells you drew above look different?
8. Is a crystal a cell? Why do you think so?
9. Why does cooking food make it easier to chew?
10 Draw a picture of one of these animals- Amoba, Paramecium, Euglena.Circle the name of the one you drew. If you cannot draw one of these,draw another one you saw in the microscope and put its name here
11 When you are looking for living things in water, what differencedoes it make where you get the water?
12. Where can you find cells?
70-1,
64
e
13. Write true or false after each of these statements. If you writefalse, then write a correct statevent after it.
All livina things move.
Small things to us may be large thingsto some other forms of life
Living things have more water in themthan non-living things.
Some parts of living things may not haveany cells
14. Johnny watched an object under his microscope. It moved aroundslowly. It looked very complicated with many little parts.Jeanne looked at another object under her microscope. It movedaround. After a little while it stopped moving
Who probably had a living object?
Why do.you think so?
15. Peter watched an object under his microscope. It slowly got bigger.He added some water and it dissolved (went away). Anne watchedanother object under her microscope. It stayed the same size.She added some water but nothing happened.
Who do you think had a living object?
Why do you think so?
16. Of all the objects the four boys and girls watched, who probablyhad a living object for sure?
Why do you think so?
17. What kinds of questions could you ask to find out if one of theobjects above was really alive? Number your questions..[
18. Did you enjoy studying small things with a microscope?
What other things would you like to do with a microscope?
/10111111., NM,
- 65 -
Fourth version of Small Things Test
The quotations listed below are taken from a tape recording of a 5th grade
class discussion on the test. The quotes represent typical interpretations
of questions.
1. first choice 6
second choice 23
"I have a coin collection batk home and when I get the magnifyingglass far away I can see it all and it still looks bigger."
"I say you wouldn't be able to see all of it because if you lookthrough a magnifying glass aad the seed is just as big and looksbigger you wouldn't be able to see it all."
first object - nucleus 3 responsessecond object - outside, crust, skin 12 responsesthird object - inside, 4 responses
Nipe children identified it as a cell
3. Number of differencesEight children named one differenceEight children named two differencesSeven children named three differencesFour children named four differencesOne child named five differences
Terms most frequently usedRound - 20Not as thick, edge, noBigger - 10No hole, space - 8Bigger ball inside - 5Ball is oval - 4More dots inside - 3
4. CDBA - 9
DCBA - 8
BACD - 5DBCA - 3BDCA - 2
ABCD - 1
to describe differences
wall - 12

- 66 -
Bruce: "I think the smallest is picture D because it shows all the cells."
Mark: "Picture C because it shows only one cell."
Bruce: "Picture C is the next biggest because it has only one cell."
Mark: "I think the little bit bigger one is D because instead of justone cell it has many cells."
"Picture B is the second biggest because its a slice of the onion."
Bruce: 'Well I change my mind about D and C because one cell is smallerthan a bunch of cells."
Teacher: "How do you know?"
Bruce: "Cause it's different magnification...ah...It looks like the...one cell and there's a whole bunch of them so a whole bunch wouldbe much more than...ah... how many ever more cells there are thanone.
5. No - 28Yes - 1
"I say it's a cell because when I was looking under my microscope atsalt and sugar you could see all the cell."
"I say it is not a cell because a cell is not a solid I don't think anda crystal does not have all the cell parts like a nucleus and wall."
"Well I think so because sugar lives in the beginning and then its takenoff...it sort of dies."
"Well I don't think a crystal is a cell because you can't see a cell withyour eyes. You need a microscope to see a cell and you can see a crystalof sugar withoet needing a microscope."
6. Identify±la.first cellsecond cellthird cellfourth cell
For protection For food2 35 162 720 3
For protection"I say the second object because it's right in the middle of the foodcell, or whatever you want to call it, it's right in the middle."
"I think it's the third one because I think it can move fast."
"I think it's the last one because it's got such a big thick wall."
It

- 67 -
For food"The second one because it's fat and can probably carry a lot."
"The last one because it's circular and is able to change it's formand surround the food."
"I think it's the third one because it doesn't have as thick a cellwall and the nucleus is close to the cell wall."
"The second one because it's larger and would be more of an appetitefor an animal."
"The second ore because the nucleus is in the middle and its got moreprotection there...more vitamins or something."
7. Five selected PeterTwenty-four selected Anne
"Anne because living objects don't disappear."
"I say Peter because his got bigger and when he added water itdiSappeared and there might have been some chemical in the water."
"Peter because it got bigger and when water was added it might havegotten frightened."
"We used to put salt on snails and they would dissolve."
Number of Responses8. See if it moved 12
See if it looks like an animal 4Can any living thing dissolve 2
See if it grows 1
What mixture Peter used 1
See if it eats 1
Reacts to stimuli 1
If it has cells or cell parts 4Where it came from 2
Did it drink? 1
Ten children asked two questions:iFive children asked three questions.Two children asked one question.Two children asked four questions.
9. Eleven children identified some way to answer all the questions asked in #8.Seven children identified one way less than the number of questions asked.One child identified two ways less than the number of questions asked.Seven children-did not identify any way to answer their questions in #8.

68
Fourth version of Smal Things Test
QUESTIMS ON SMALL THINGS Name.
1. A boy has a small magnifying glass. He finds a seed that isjust as wide as the magnifying glass. When he looks at theseed through the glass, the seed looks bigger and (check one)rp be sees all of the seed at one timeE3 he cannot see all of the seed at one time
2. Give a name for the different parts of tiv aling
Give the thing a name.
3. In what ways is this thing different fromthe one above? Write as many differencesas you can see.
4. There are four pieces of an onion bulb drawn below. Althoughthey are really different sizes, they are all drawn the samesize as each other. Arrange them in order of their real size,by writing the number of the picture below.
01111111011111.111111111.is the smallest
is a little bigger
is next to the biggest
is the biggest really
5. Is a crystal a cell? Why do you think so?
p%co3rut C--
/1111.11 11,
6. A number of different kinds of cells from one plant are drawnbelow. Which cell would be best for protecting the plant? Placea circle around the cell. Which cell would be best for makingor getting food? Place an X over that cell.
69
7. Peter watched an object under his microscope. It slowly gotbigger. He added som water and it dissolved (went away).Anne watched another object under her microscope. It stayedthe same size. She added some water but nothing happened.Check which one had a living object
0 Peter0 Anne
Why do you think so?
111111aNanaaaa, amaamalla
8. What kinds or questions could you ask to find out if one ofthe objects above was really alive. Number your questions.
a
9. Write just the numbers of your question abOve and after thenumber of each question tell how you would find an answer.
10. Did you enjoy studing the small things unit?What did you enjoy about it?

.....
70 -
VII Interaction of Students and Teacher
A classification of teacher and student behaviors one would expect to observein a classroom were tentatively identified. Nine categories of teacher behaviorsgo from extraneous activity (00) to one of eliciting attitudes (09). Studentbehaviors that would be expected to result from teacher activities are arrangedin the same nine categories (10 to 19). Statements from three ESS units to theteacher are then placed under the categories of behaviors one would expect toobserve if teachers followed ehe suggestions.
One possible use of such an analysis is the prediction of /evels one wouldexpect to see more frequently in different units. Thus, the analysis belowshows that a higher proportion of teacher "closed" "control" and "provoking"behavior" occurs in Small Things and a relatively greater proportion of higherlevel behaviors occurs in Mealworms. This reflects a fundamental differencein units where Mealworms allows a higher degree of experimentation than SmallThings which is more of an observing unit.
Relative Proportion of Interaction levels
711,4
Mealworms LAP:IL:WM.119 xx 1918 xxxx 1817 xxxxxli x 17 x16 xxxxxxxx 16 x15 xxxxxxxxxxx 15 x14 xxxxxxxxxxxxxxxxxx 14 xx13 xxxxxxxxxx 13 xxxxxxxxxxxxxxxxxxxxxx12 x xx 12 xxxxxxxxxxxxxxxxxxxxxxxxxxxxxxxxxxxxxxxxxxxxx11 xx 11 XXXXXXXXXXxxxXXXXXX .

- 71 -
Teacher and Student Interaction Profile - Key-
Teacher Behavior
00 Extraneous- not related to lesson,routine, disciplining
01 Closed- requesting specific response,informing
02 Control- directing series of activities,'gives vocabulary to be learned, givingapproval or value judgment
03 Provoking- stimulates questions oranswers, provides open-endedanswers
04 Develop- encourages (verbal or non-verbal) further inquiry, questioning,qualitative information, continuityfrom previous lessons
05 Invastigate- enables experiment forquantitative data
06 Recording- questions lead students torecord results by which variation andtrends may be readily observed
07 Evaluate- allaws answers to remain partlyambiguous or unresolved
08 Relate- leads student(s) togeneralize experience, askingquestion that might be answeredon basis of previous experience
09 Attitude- elicits feelings aboutlesson, how child relates to it,meaning
Student Behavior
10 slouching, random attention
11 performing a specific task
12 asks non-operational, closed-ended questions
13 freely exchanging information,expressing opinion, attentiveposture, questions determineactivity
14 asks operational questions(data relating to cause-effect)
15 use of instruments, identifyand control variables
16 classifies data, records in avariety of ways
17 generalizes on experience andconsensus (average), identifiesvariation in results, does notrequire adult approval or con-firmation
19 takes work home, involvesparents, expresses like ordislike (explicit or implicit)

- 72 -
Teacher and Student Interaction Profile- representative behaviors from three ESSunits- Kitchen Physics (K), Small Things (S), Behavior of Mealworms (B)Numbers ( ) refer to pages
Teacher Behaviors Student Behaviors
01 "This shouldlead them to discoverthat..." (S 9)
"The onion Cells have thick, non-living cell walls..." (S 44)
02 "...the following demonstrationwill help direct their ..." (K 15)
"A few questions could be askedwhich would point out..." (S 38)
"You can suggest a procedurefor tabulating..." (B 13)
03 "...ask the class to predict howlong it will take... (K 8)
"If situations like this do notarise spontaneously, you may beable to create them." (B 6)
04 "...some of fhe questions raisedwill have no clear-cut answers.But this should not prevent thechildren from wrestling..." (K 2)
1Many times one can ask the child,'How could we find out'?" (S 5)
"This undirected activity providesa background for fhe more refinedobservations..."(B 3)
05 "It is the method rather than thememorized facts we hope thechildren will retain and use." (K 1)
"In this quantitative investigationthe children learn..." (S 107)
11 "This circle represents the sizeof your microscope field." (S 19)
"Suggestions for the proper care ofmealworms at home should be ... (B 3)
12 "Assembling the Balance" (K 33)
"Place your slide..." (S 16)
13 "...ask the child to observe..." (K 16)
"What do you see..." (S 31)
"Does he spend most of his time ..."(B 12)
14 "Ask them to try placing your strips onone of their ordered graphs. This typeof activity should contribute much tothe children's appreciation of logicallyarranged data." (K 18)
"Let your children try to vfork out..."(K 15)
15 "Let them test their predictionsthemselves by experimenting..." (K 10)
"This exercise allows children to designand make equipment to test..." (B 16)

M7.0.1imt,Tkok,'!"'T
06 "Keeping a question list forfuture discussion and referenceavoids side tracking and loss ofcontinuity." (K 2)
07 "You will have to tolerate(and help the children toaccept) uncertainty..." (K 2)
08 "If the children have not yetinquired about other substances
" (K 12)
"...provides the children withanother tool for revealiag thedifferences and similaritiesbetween living and non-living..." (S 91)
"You may want to call thechildren's attention to thenotion that similar reactionsto the same situations ..."
(B 9)
- 73 -
09 "...to give the child an awarenessof the world of science and a wayof approaching it and enjoying it."(K 1)
16 "Hopefully, they will think ofkeeping careful records..." (K 10)
Small Things Worksheets
"You can suggest a procedure fortabulating..." (B 13)
17 "...he begins to see the need torevise and correct his earliermisconceptions." (K 1)
18 "In trying to explain their iaeas,the children should be urged tobase their statements on theirown experience..." (K 19)
19 "What does this invcItigation tellyou about ..."(S 104

VIII Summary
-74 -
Transfer Between Process Measures
Science - A Process Approach is an exercise in pushing back the limits ofgeneralizing experience by practice in a wide variety of situations. Itssuccess must be largely attributed to attention given the conditions oflearning as explained by RDbertM. Gagne. The basic feature of theseconditions are 1) the use of verbal directions to stimulate recall and2) the use of verbal directions to guide instruction. Th- verbal directioncan be described at three levels as they relate to the transfer of training.
First, behaviors as represented by action words basic to any -knquiry arepracticed within a wide variety of contexts - drawing from mathematics,physical and biological sciences. This variety assists the "lateral"transfer of behaviors from one context to another.
Second, the behaviors are arranged in a most obvious display of Processessuch as CLASSIFYING to emphasize, I would judge, that the stress is noton some fixed content to be conveyed in an absolute sense but on a broadbase of observable behaviors. This arrangement or hierarchy of behaviorsbeginning with the action words assist the teacher in determining whatis being learned and to guide instruction accordingly. In this way, thelearning sets represent a broad grouping of behaviors that have a practicaluse in the classroom and may be, most important, communicated to the teacher.Although this is important in lateral transfer, it fits mDre specificallythe situation of vertical transfer where ideas are put together in increas-ing levels of complexity.
Third, specific activities of each unit provide a concrete model for strategiesof teaching. This is precisely the point of interest in applying the AAASdiscipline to an analysis of ESS. The question was "can suggestions for stepsin thinking be placed in a structure analogous to fhe Processes?" This certainlymight assist the task of communicating to the teacher. The analysis of the ESSunits suggest a cycling back sequence in which the repetition of thought pro-cesses in an explicit logical ordering is basic to the putting of ideas togetherin going from simple concepts to complex principles
Transfer Within the Process Measure
In his 1962 study,* Gagne offers three kinds of evidence in discussing transferamong learning sets. Reliability of his measure is indicated by a very low
* Gagn#,R.M.., Mayor, J.R., Garstens, H. L. and Paradise, N.E. "Factors inAcquiring Knowledge of a Mathematical Task" Psychological MonographsNo. 526 Vol. 76, No. 7, 1962. American Psychology Association.
Mr."3,01.0177
J
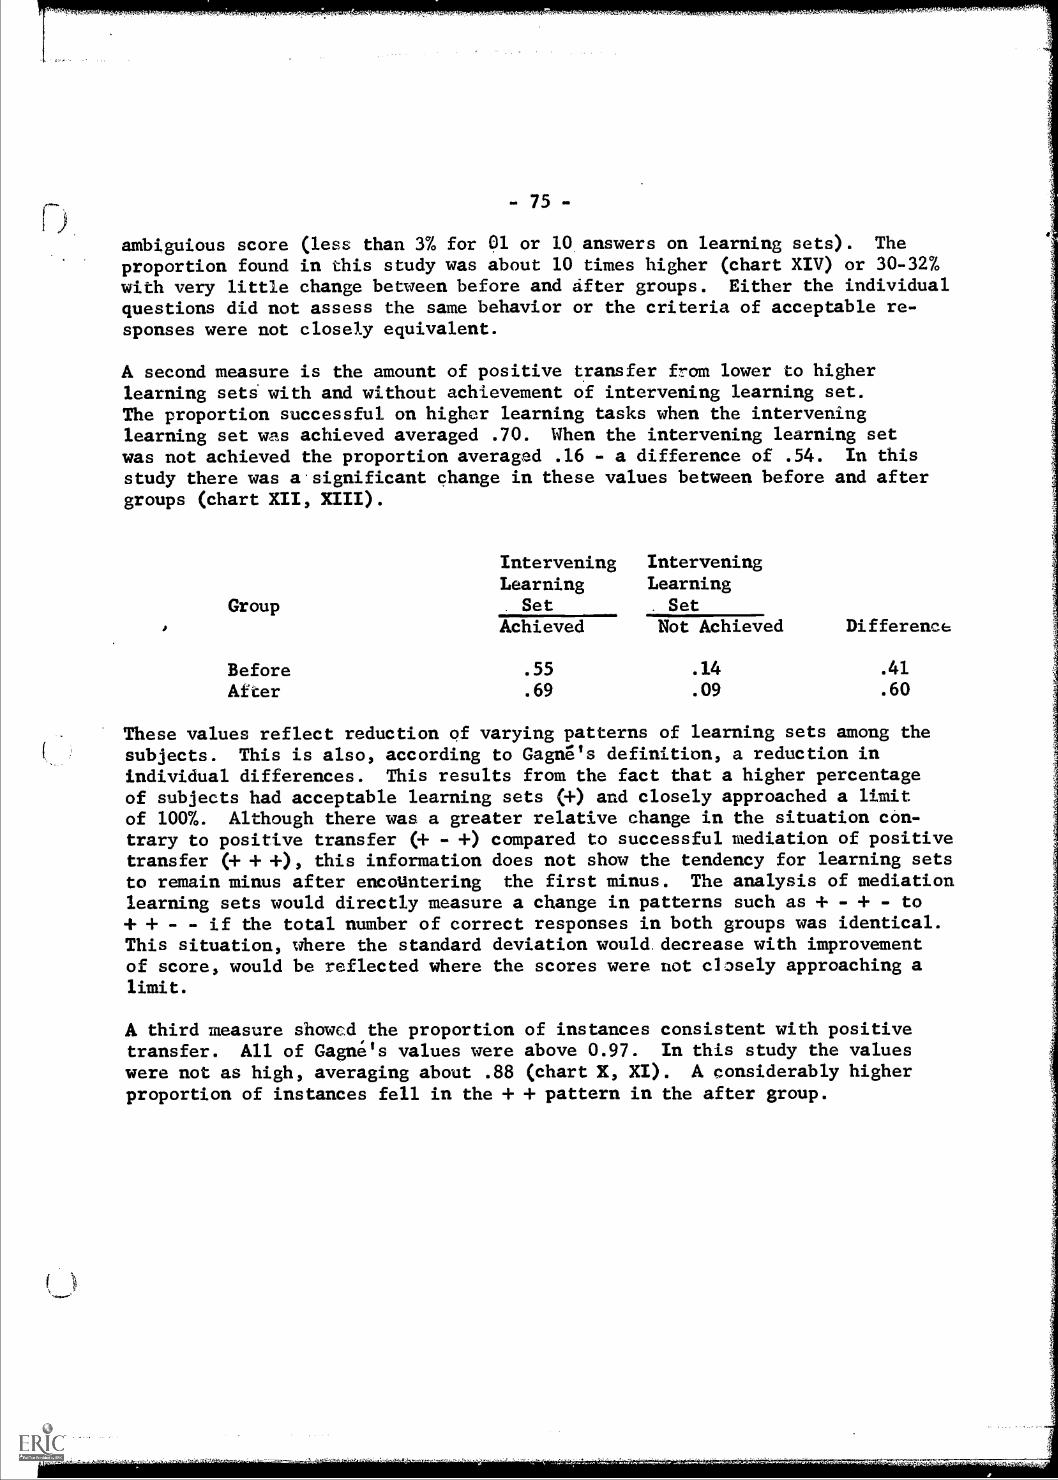
- 75 -
ambiguious score (less than 3% for 01 or 10 answers on learning sets). Theproportion found in this study was about 10 times higher (chart XIV) or 30-32%with very little change between before and after groups. Either the individualquestions did not assess the same behavior or the criteria of acceptable re-sponses were not closely equivalent.
A second measure is the amount of positive transfer from lower to higherlearning sets with and without achievement of intervening learning set.The proportion successful on higher learning tasks when the interveninglearning set was achieved averaged .70. When the intervening learning setwas not achieved the proportion averaged .16 - a difference of .54. In thisstudy there was a significant change in these values between before and aftergroups (chart XII, XIII).
InterveningLearning
InterveningLearning
Group Set Set
Achieved Not Achieved Difference
Before .55 .14 .41
After .69 .09 .60
These values reflect reduction of varying patterns of learning sets among thesubjects. This is also, according to Gagne's definition, a reduction inindividual differences. This results from the fact that a higher percentageof subjects had acceptable learning sets (+) and closely approached a limitof 100%. Although there was a greater relative change in the situation con-trary to positive transfer (+ - +) compared to successful mediation of positivetransfer (4- + +), this information does not show the tendency for learning setsto remain minus after encoUntering the first minus. The analysis of mediationlearning sets would directly measure a change in patterns such as + - + - to+ + - if the total number of correct responses in both groups was identical.This situation, where the standard deviation would decrease with improvementof score, would be reflected where the scores were not clasely approaching alimit.
A third measure showed the proportiontransfer. All of Gagne's values werewere not as high, averaging about .88proportion of instances fell in the +
of instances consistent with positiveabove 0.97. In this study the values(chartX, XI). A considerably higher+ pattern in the after group.

- ,76 -
Table 1
Change ir Proportion of Pass-Fail Patterns *
+ + - - + - - +
I to IIB +.11 -.01 -.12 .00
II B to III +.22 -.14 -.11 +.03
III to IV A +.20 -.09 +.05 -.13
III to IV B +.21 -.14 +.03 -.10
IV AA to V +.13 -.10 -.02 .00
,
V to VI +.07 -.08 +.03 +.03
VI to VII +.21 -.06 -.15 +.01
Total +1.15 -.62 -.29 -.16
* Before group minus after group (Chart X-XI)

- 77 -
This is a second type of reduction in pattern of acquired learning sets whichresults simply from more sets being satisfactory (+). The relatively littlechange in values reflects the stability of the General Hierarchy.
Over-all the evidence suggests a reduction in individual differences betweenstudents as a result of studying the ESS units.
4.14 V" V.974 7.7........04?
a

- 78 -
Frequency of Action Words
One of the assumptions of this study is that the nine action words can beordered into a hierarchy of simple to complex. One may ask are the actionwords used in this way in the AAAS program? The analysis below shows noclear pattern except for "identifying and naming" occurring more frequentlyat the lower levels of the simple processes. These two action words occurtwice as frequently as any others - making up 29.4% of the component skillbehavioral statements. This supports the contention that "identifying andnaming" are fundamental to performance of subsequent component skills orlearning sets. The twenty three levels were grouped to give a total of20-30 statements under each column.
Table 2
Frequency of Action Words Occurring at the Twenty Three Levels*of the Eight Simple Processes
Demonstrating
:Constructing
Applying a ruleStating a rule
Ordering
Distinguishing
Describing
Identifying,Naming
Total
Levels(1) (2) (3) (4) (5) (6) (7) (8)
1- - 8-9 10-11 12- - -
3 1 6 6 5 5 2 1 30
1 2 5 3 7 2 4 12 36
0 0 0 3 3 3 3 0 12
2 1 2 3 0 0 3 0 11
6 4 3 3 2 2 2 1 23
1 0 4 7 7 4 7 7 37
17 15 7 6 1 4 4 8 62
30 24 27 31 25 20 25 29 211
* from Science - A Process Approach Chart 1967

- 79 -
Action Words Within Action Words
One problem of examining the component skill statements on the Hierarchy Chartis that these behaviors are very general and are based upon a greater numberof specific behavioral objectives upon which the competency measure is based.Consequently, the component skill statements encompass a greater number ofaction words than are represented on the Hierarchy Chart. For example, theexercise classim9 is based on a component skill statement that beginswith "Demonstrating" but also includes behavioral objectives beginning with"state and demonstrate", "order" and "demonstrate". Other exercises provideexamples of wider discrepancy between action words in component skill state-ments and specific behavioral objectives within the component skills.
On examining the individual activities of an exercise even more action wordsare encountered. Thus, in classifying 9 children "order" and "distinguish"as well as "demonstrate" illustrates the impossibility of performing anyof the actions of the action words without involving some other action words.In one respect, the action word chosen to represent a component skill state-ment is arbitrary.
Action Words in Processes
Another question is - Do any action words occur more frequently in any ofthe simple processes? Table 3 shows that the most characteristic behaviorof the OBSERVING process is "identifying". The CLASSIFYING process ischaracterized more by "constructing" behaviors. In the COMMUNICATING process,"describing" behaviors are more frequent. All this goes to show is that someprocesses of science, as described by AAAS, are characterized more by certainbehaviors.

Demonstrating
Constructing
Stating a Rule
Applying a Rule
Ordering
Distinguishing
Describing
Naming
Identifying,naming
Total
* ProcessColumnColumnColumnColumnColumnColumnColumnColumn
A
-80-
Table 3
Frequency of Action Words Beginning Component SkillStatements of the Eight Simple Processes
Process* A
3 6 7 8 4 0 0
0 4 0 4 9 4 5
2 0 _1
0 5 1 0 0 0 1
a
0 1 4 0 0 0
8 8 4) 4 2 2 2
6 3 2 5 0 13 0
0 2 3 0 0 0 0
16 /3 10 5 1 5 0
361 43 23 32 16 24 8
- ObservingUsing Space/Time
- Using Numbers- Measuring- Classifying- Communicating- Predicting- Inferring
Relations
1
3
0
0
1
2
2
0
2
11

- 81 -
The action words have an additional distinction based on the human operations
they seem to emphasize. Three of them are more verbal, two are more psycho-motor and three can more often be characterized by mental operations although
it may easily be claimed at this level that the mental operation may be asymbolic representation of a specific motor activity. It is interesting tonote the frequency of occurrence of these words so classified (from table 2)
"Naming and identifying" are classified together since they occur so fre-quently in the same statement.
Operation Frequency
Verbal Naming and identifying 29.4
Describing 17.5
Motor Constructing 17.0
Demonstrating 14.2
Mental Distinguishing 10.9
Applying a rule * 5.7
Ordering 5.2 11,
(* includes a very small incidence of "stating a rule")
This analysis does offer some support for claiming that the general behavioralstatements represented by component skills or learning sets might be arrangedinto a more general hierarchy dissociated from a specific content and associatedonly through two dimensions. One dimension is complexity. The other is logical.In a logical ordering terminal tasksrequire the performance of certain subordinate
tasks. The terminal behavior being made up of elements of a number of subordinateskills mai be thought of as a more complex ordering although this concept seemsnot as useful.
Role of Content
In this way we see it is not so much the nature of the task of "identifying" or"describing" that allows us to rank the action words into a hierarchy. Rather,it is the specific context within which the action word is being used over alimited number of learning sets. The limitation is inescapable because1) the context of learning sets becomes increasingly more irrevelant withthe increase of intervening learning sets and 2) the interdependence of learningsets becomes increasingly difficult to measure over time because of theassociation of "uncontrolled" experience.
This function of content as forming a fundamental basis for the associationof learning sets may help to explain some dissatisfaction with a particularProcess of Science such as OBSERVING. In a way, OBSERVING may be describedas fundamental to all of the other seven processes in the same way that
"identifying" may be fundamental to the other eight action words. The context
or content of a program may be arranged to give precisely this outcome - as is
illustrated by application of this model to the ESS units. The contexts used

- 82 -
in the AAAS OBSERVING process are, however, a finite sampling from an almost
infinite universe. The OBSERVING Process is only exemplary of a model which
says "given adequate instruction in certain areas the learner should be able
to exhibit these behaviors in slightly different contents and possession of
the skills will facilitate the acquisition of subsequent ones."
Wow"
Level of Describing of ESS
In the same way that learning sets or component skills are the most obvious
basis or organization in each Process of the AAAS material, the list of
Small Things behaviors (p.3) were based on what seemed most obvious. In
both cases, as seen in the above discussion of AAAS, this is aaoversimplification.
In the Small Things unit, behaviors beginning with the action word "describing"
may differ considerably in complexity. For example, behavior #2 (p.3) is more
difficult than behavior #6. Behavior #13 could be even more complex .
This situation suggests that the general hierarchy could represent many levels
of complexity at the same time. In other words, arriving at level VII of the
hierarchy for a relatively simple behavior may require the "cycling back" to
the,beginning of the hierarchy at level I to account for the further develop-
ment of a behavior. This is similiar to the kind of "phenomenological com-
pression" discussed by Max Black in "Rules and Routines" (p.100 The Concept
of Education R. S. Peters ed. The Humanities Press N.Y..1967)
The level of complexity which we focus upon depends largely on its usefulness
in attaining the objective. The objective of this paper was specifically to
make an initial analysis of ESS units based on the discipline perceived in
the AAAS materials. It has been shown that the level of organization here
is not the only one and it is rea'ily admitted that for other purposes a more
detailed analysis may be appropriate. It is claimed however, that a more
general description of behaviors as represented by the General Hierarchy
would not be meaningful.
Learning Sets and Process Measure
The weakest point in this study concerns the degree to which the general
behaviors of the "ESS Process Measure" may be related to the behavioral
statements of a specific unit such as Small Things. The basis assumption
of the process measure is that students studying Small Things will become
better at certain skills measured within au context. For example:
Learning_Set I. Identifying properties of an object or event. To communicate,
the student must possess relevant descriptive words. In Small Things and the
Process Measure he is asked to point to or name certain objects or characteristics
to determine if he possesses terms prerequisite to subsequent behaviors.

- 83 -
Describing properties of an ob'ect or event. In the Small Thingsunit, the student learns a "rule of describing" if the teacher follows the ESSphilosophy of "pushing back."
"...you can be continually encouraging accuracy,.precision in description and observation, andrefinement of other detail wherever possible."(p. 2 Teachers Guide for Small Things)
From studying fhe Small Things unit the student will more likely describe objectsin a greater variety of ways and a higher proportion will meet the criteria ofitems 3 and 4 of the process measure in the "after" condition.
Learning Set III. Describing similarities and differences. In the Small Thingsunit, detailed comparison is encouraged to the same degree as describing inLearning Set II. If the student meets the criteria of Learning Set III it ishighly probable that he meets those of Learning Set II.. Question 5 and 6attempted to assess the tendency to describe by use of an inatrument but thiswould have little relation to the fact that a microscope was used or thatstudents were at one point encouraged to describe by use of arbitrary quantita-tive units.
Questions 7, 8 of the process measure are directly related to the content inthe first two learning sets. It was determined if the child could describea minimum number of characteristics of geometric figures, he is then askedto compare and contrast them in a minimum number of ways. This is anotherrule controlled behavior which in the content of the unit was practiced bycomparing cells from different parts of a plant and from different plants.However, the analysis on Chart VIII does not reflect a superior performanceof the group only studying Small Things compared to ones studying bothSmall Things and Kitchen Physics. Any difference was very likely obscuredby uncontrolled variables such as the probability that better classes studiedmore units.
Learning Set III was high on four measures. It had one of the highest per-centages for acceptable responses for individual process measure questions(p.47). It had the largest decrease of instances inconsistent with positivetransfer (chart XXIV). It had the highest value as a "mediator" of transfer(chart XIII) and it had one of the lower values of ambiguity (chart XIV).
Learning Set IV. Ordering ob'ects or events. Questions 9 through 12 of theProcess Measure assess whether the child can order the geometric objects hehas previously described according to some rule.
In the unit children were encouraged to group objects according to observedcharacteristics. This activity became obscure when they were asked to generalizetheir observations in distinguishing between living and non-living.

- 84 -
Learning Set V. Applying a rule. Questions 13 and 14 require that the childapplies two rules to identify the missing figure. One rule is a variable -
the number of sides increases by one. The other rule is constant - all figuresare blue.
LeaviiinajlLyE. ItItertig_nelatishis_. In question 15, the childindentifies constants and variables in terms he is familiar with - such aslonger-shorter. In 16, he interprets a change or relationship in terms ofa constant or variable.
Learning Set VII. Demonstration validity. In 17, the child demonstrateshow he could prove his point in 16. Question 18 attempted to have the childdemonstrate the application of rules learned about the ordering of geometricobjects but this item resembles more closely the predicting behavior.

Chart 1
Process
85
Measure Administered to Children Before Studying
ESS Units
Question
N=56Acceptable
Pespolla.a.Percentage
1 54 96.4
2 54 96,4
3 40 71.4
4 31 55.4
33 58.9
6 24 42.9
7 37 664
8 29 51.8
9 51 91.1
10 51 91.1
11 42 75.0
12 41 73.2
13 16 28.6
14 13 23.2
15 42 75.0
16 15 26.8
17 14 25.0
18 13 23.2
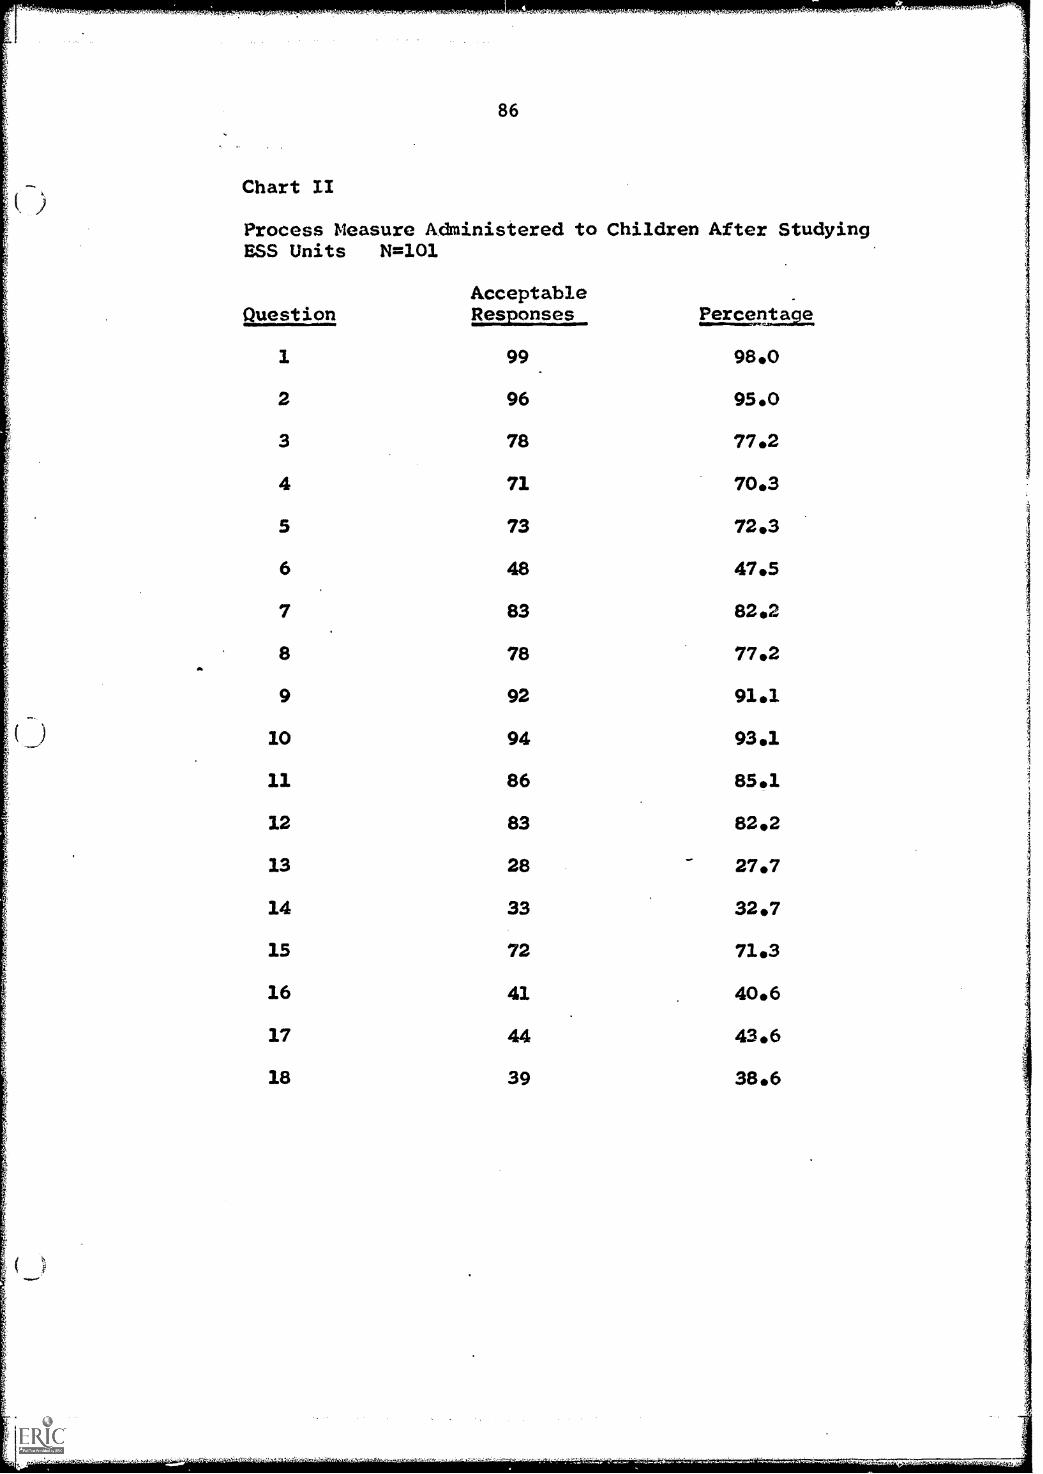
.
86
Chart II
Process Measure Administered to Children After StudyingESS Units N=101
QuestionAcceptableResponses Percel.tage
1 99 98.0
2 96 95.0
3 78 77.2
4 71 70.3
5 73 72.3
6 48 47.5
7 83 82.2
8 78 77.23
9 92 91.1A
10 94 93.1
11 86 85.1
12 83 82.2
13 28_
27.7
14 33 32.7
15 72 71.3
16 41 40.6
17 44 43.6
18 39 38.6

87
Chart III
Process Measure Administered to Children Before and AfterStudying ESS Units - Baltimore Sub Groups
Before N=34 After 11=36
Acceptable AcceptableQuestion Responses Percentage R1122M21 Percentno
1 33 97.1 35 97.2
2 33 97.1 32 88.9
3 20 58.8 33 91.7
4 18 52.9 30 83.3
5 16 47.1 29 80.6
6 10 29.4 14 38.9
7 23 67.6 34 94.4
8 24 70.6 33 91.7
9 33 97.1 35 97.2
10 32 94.1 36 100.0
11 26 76.5 31 86.1
22 19 55.9 30 83.3
13 1 2.9 5 1369
14 1 2.9 4 11.1
15 22 64.7 32 88.9
16 1 2.9 5 13.9
17 1 2.9 13 36.1
18 1 2.9 4 11.1

4
Chart XV88
,
Process Measure Administered to Children Before StudyingESS Units. Divided into upper, middle and lower thirdas ranked by their teachers.
Question
Upper ThirdN=18
Acc.Essam. Perc.
Middle ThirdN=22
Acc.Res . Perc.
Lower ThirdN=11
AccResp. Perc.
1 17 94.4 21 95.5 11 100.0
2 16 88.9 22 100.0 11 100.0
3 15 83.3 13 59.1 7. 63.6
4 11 61.1 10 45.5 5 45.5
5 14 77.8 11 50.0 6 54.5
6 12 66.7 6 27.3 2 184
7 14 77.8 10 45.5 8 72.7
8 12 66.7 6 27.3 6 54.5
9 18 100.0 17 77.3 11 100.0
10 18 100.0 17 77.3 11 100.0
11 16 88.9 14 63.6 7 63.6
12 15 83.3 12 54.5 9 81.8
13 7 38.9 5 22.7 3 27.3
14 5 27.8 3 13.6 3 27.3
15 14 77.8 15 68.2 8 72.7
16 6 33.3 5 22.7 4 36.4
17 6 33.3 6 27.3 2 18.2
18 5 27.8 5 22.7 2 18.2

89
Chart V.
Process Measure Administered to Children After StudyingESS Units. Divided into upper, middle and lower thirdof class as ranked by their teachers.
Upper ThirdN=41
AccQuestion Bela.rerc.
Middle ThirdN=37
Acc.
ElEaEIKEz
41 100.0 36 97.3
2 38 92.7 36 97.3
3 37 90.2 31 83.8
4 35 85.4 31 83.8
5 31 75.6 27 73.0
6 23 56.1 16 43.2
7 38 92.7 30 81.1
8 35 85.4 30 81.1
9 38 92.7 36 97.3
10 39 95.1 35 94.6
11 36 87.8 32 86.5
12 38 92.7 29 78.4
13 15 36.6 8 21.6
14 18 43.9 12 32.4
15 37 90.2 20 54.1
16 19 46.3 14 37.8
17 22 53.7 15 40.5
18 23 56.1 10 27.0
Lower ThirdN=23
AccResp. Perc.
22 95.7
22 95.7
10 43.5
5 21.7
15 65.2
9 39.1
15 654
13 56.5
18 78.3
20 87.0
18 78.3
16 69.6
5 21.7
3 13.0
15 65.2
8 34.8
7 30.4
6 264
,
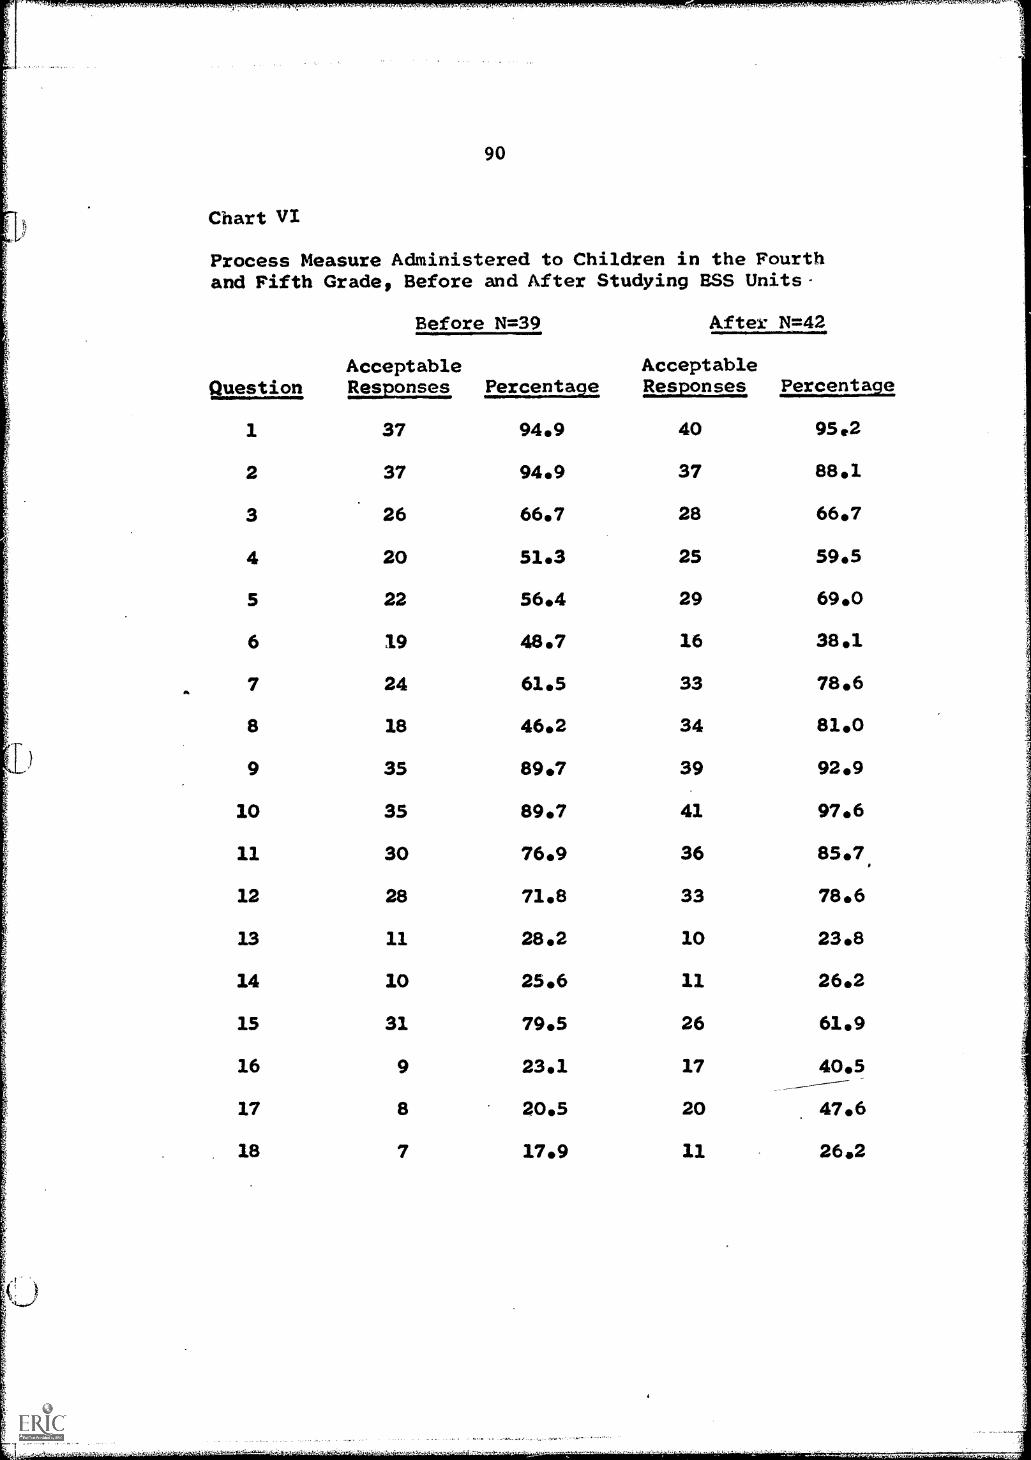
90
Chart VI
Process Measure Administered to Children in the Fourthand Fifth Grade, Before and After Studying ESS Units-
Before N=39 After N=42
Acceptable AcceptableQuestion 12222.22222 Percentaae Responses Percentage
1 37 94.9 40 95.2
2 37 94.9 37 88.1
3 26 66.7 28 66.7
4 20 51.3 25 59.5
5 22 56.4 29 69.0
6 19 48.7 16 38.1
7 24 61.5 33 78.6
8 18 46.2 34 81.0
9 35 89.7 39 92.9
10 35 89.7 41 97.6
11 30 76.9 36 85.7,
12 28 71.8 33 78.6
13 11 28.2 10 23.8
14 10 25.6 11 26.2
15 31 79.5 26 61.9
16 9 23.1 17 40.5
17 8 20.5 20 47.6
18 7 17.9 11 26.2
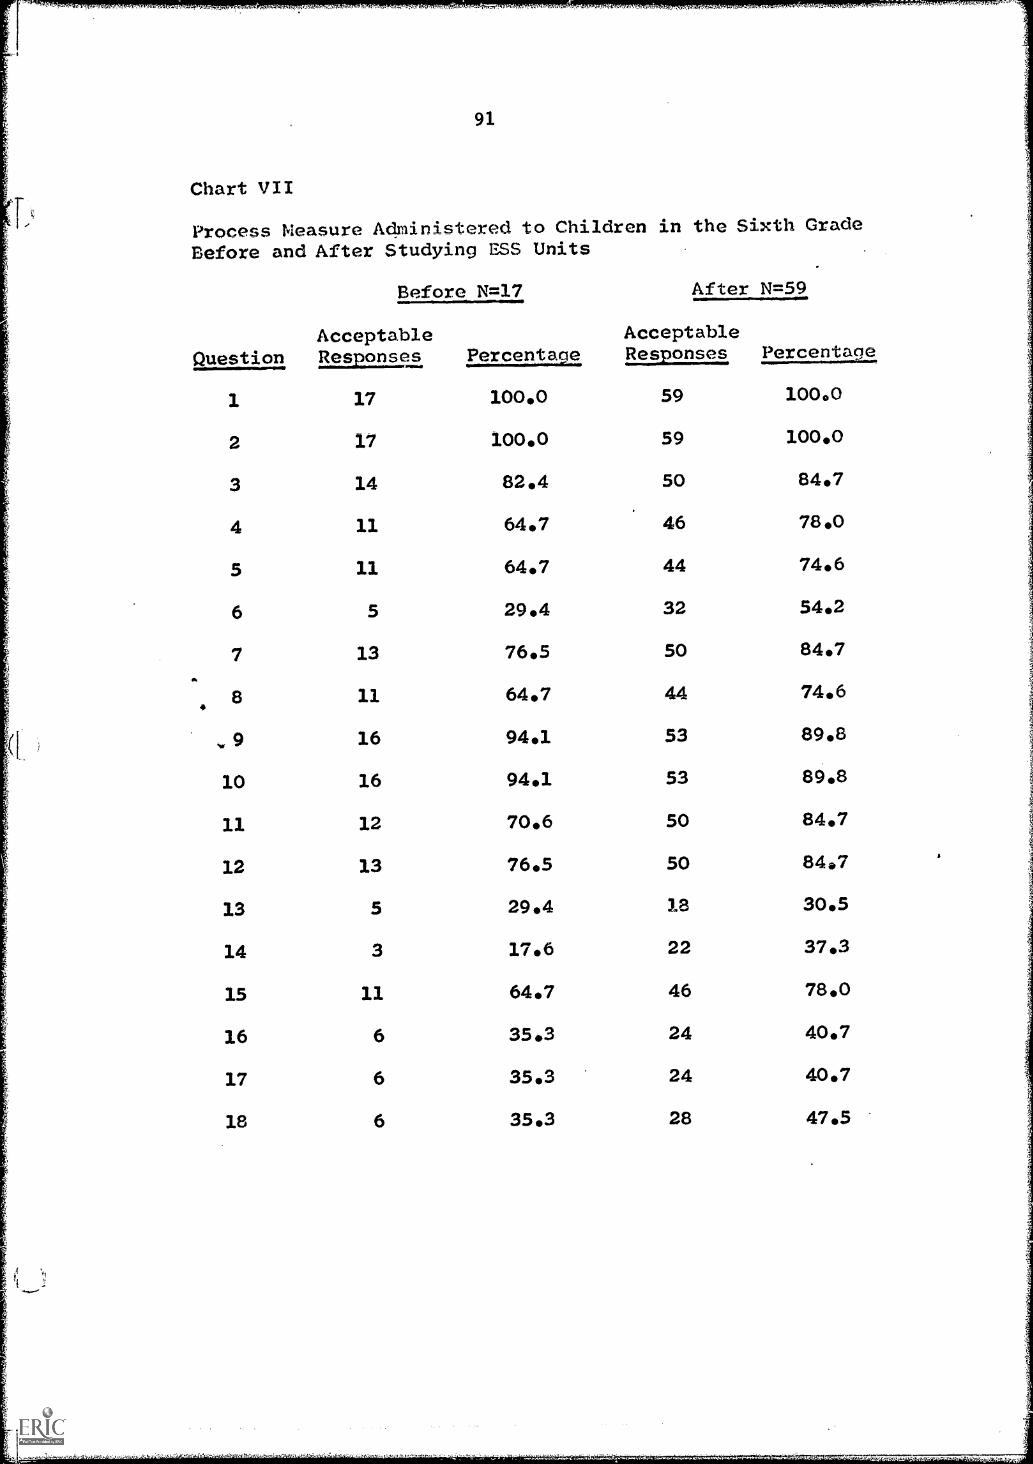
91
Chart VII
-
Process Measure Administered to Children in the Sixth GradeBefore and After Studying ESS Units
Before N=17 After N=59
Acceptable AcceptableQuestion 12.2222.2ses Percentaae Responses Percentage
1 17 100.0 59 100.0
2 17 100.0 59 100.0
3 14 82.4 50 84.7
4 11 64.7 46 78.0
5 11 64.7 44 74.6
6 5 29.4 32 54.2
7 13 76.5 50 84.7a
8 11 64.7 44 74.64
, 9 16 9401 53 89.8
10 16 94.1 53 89.8
11 12 70.6 SO 84.7
12 13 76.5 50 8407
13 5 29.4 18 30.5
14 3 17.6 22 37.3
15 11 64.7 46 78.0
16 6 35.3 24 40.7
17 6 35.3 24 40.7
18 6 35.3 28 47.5
vr-
I

92
Chart VIII
Acceptable Responses for after test for group doing only SmallThings and group doing both Small Things and Kitchen Physics
QuestionSmall Things Only
(N=48)f 07
Both Units(N=35)
1 47 97.9 34 97.1
2 45 93.8 33 )4.2
3 36 75.0 29 82.8
4 37 77.1 22 62,8
5 34 70.8 25 71.4
6 21 43,8 20 57.1
7 41 8504 30 85.7
8 41 85.4 26 74.2
9 43 89.6 32 . 91.4
10 42 87.5 34 97.1
11 37 77.1 34 97.1
12 38 79.1 28 80.0
13 17 35.4 8 .22.8
14 16 33.3 14' 40.0
15 32 66.7 27 77.1
16 18 37.5 20 57.1
17 19 39.6 23 65.7
18 14 29.2 18 27.2

93
Chart IX
Percentage Difference Between Acceptable Responses for Three Groups
Question Group Percent Differences1 2 , 3
1 + 1.6 + 0.1 - 0.8
2 - 1.4 - 8.2 + 0.4
3 + 5.8 +32.9 + 7.8
4 +14.9 +30.4 -14.3
5 +13.4 +33.5 + 0.6
6 + 4.6 + 9.5 +13.3
7. +16.1 +26.8 + 0.3
8 +25.4 421.1 -11.2
9 0.0 - 0.9 + 1.8
10 + 2.0 + 5.9 + 9.6
11 +10.1 + 9.6 +20.0
12 + 9.0 +27.4 + 0.9
13 - 0.9 +11.0 -12.6
14 + 9.5 + 8.2 + 6.7
15 - 3.7 +24.2 +10.4
16 +25.8 +11.0 +19.6
17 +18.6 +33.2 +26.1
18 +15.4 + 8.2 - 2.0
Total +152.2 +293.0 +76.6
Column 1 - "After" group minus "before" group. Chart II - Chart I.Column 2 - As above but with Baltimore subgroup. Chart IIIColumn 3 - Group doing both units minus group doing only one unit -
Small Things. ChartITIII
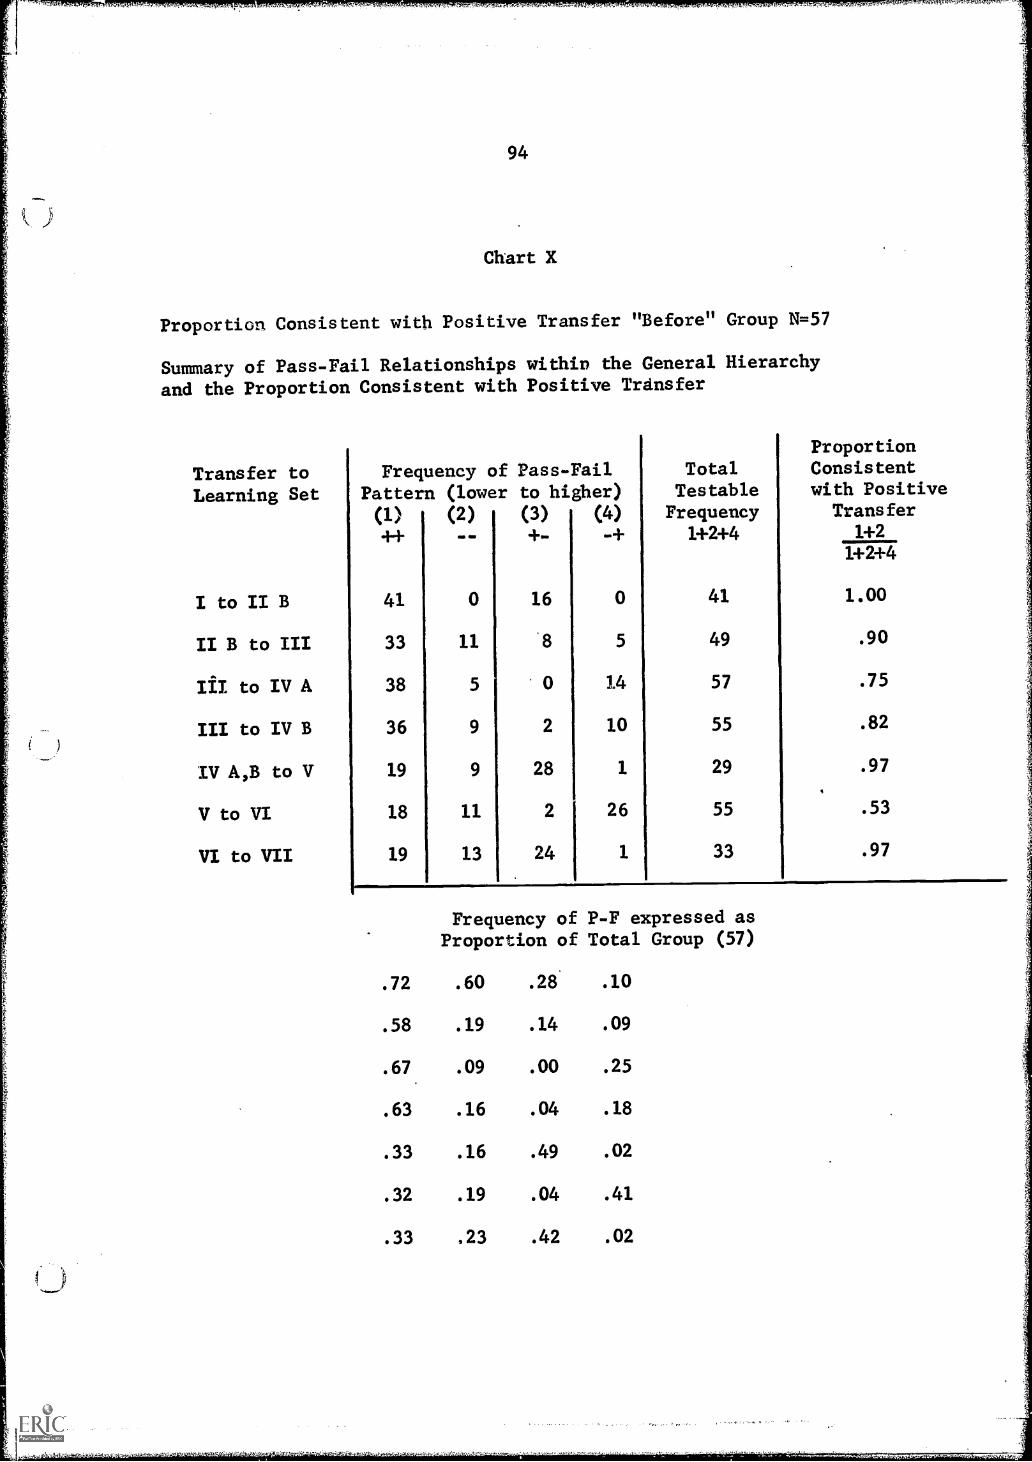
94
Chart X
Proportion Consistent with Positive Transfer "Before" Group N=57
Summary of Pass-Fail Relationships within the General Hierarchy
and the Proportion Consistent with Positive Transfer
Proportion
Transfer to Frequency of Pass-Fail Total Consistent
Learning Set Pattern (lower to higher) Testable with Positive
(1) (2) (3) (4) Frequency Transfer
++ +- -+ 1+2+4 1+2
1+2+4
I to II B 41 0 16 0 41 1.00
II B to III 33 11 8 5 49 .90
IiI to IV A 38 5 0 14 57 .75
III to IV B 36 9 2 10 55 .82
IV ,A,B to V 19 9 28 1 29 .97
V to VI 18 11 2 26 55 .53
VI to VII 19 13 24 1 33 .97
Frequency of P-F expressed asProportion of Total Group (57)
.72 .60 .28 .10
.58 .19 .14 .09
.67. .09 .00 .25
.63 .16 .04 .18
.33 .16 .49 .02
.32 .19 .04 .41
.33 .23 .42 .02

95
Chart XI
Proportion Consistent with Positive Transfer "After" Group N=101
Transfer toLearning Set
Frequency of Pass-FailPattern (lower to higher)(1) (2) (3) (4)
++ +-
I to II B 84 1 16 0
II B to III 81 5 3 12
III to IV A 88 0 5 8
III to IV B 85 2 7 7
IV A,B to V 46 6 47 2
V to VI 39 11 7 44
VI to VII 54 17 27 3
I
TotalTestableFrequency
1+2+4
ProportionConsistentwith PositiveTransfer
1+21+2+4
85 1,00
98 .88
96 .92
94 .93
54 .96
94 .53
74 .96
P-F frequency expressed asproportion of total group (101)
.83 .01 .16 .00
.80 .05 .03 .12
.87 .00 .05 .08
.84 .02 .07 .07
.46 .06 .47 .02
.39 .11 .07 .44
.54 .17 .27 .03

96
Chart XII
Mediated Transfer. Amount of Positive Transfer from Lower to
Higher Learning Set with and without Successful Achievement
of Intervening
(1)
TransferExmLned
Learning
(2)
Set.
(3)MediationLearningSet (W.L.S)
"Before" Group N=57
(4) (5)Not
Achieving Achieving
M.L.S. M.L.S
(6)
Proportion(4)/ (5)/
44+ +-+ (2) (2)
I to III 57 II B 33 5 .57 .09
II B to IV A 41 III 32 6 .78 .15
II B to IV B 41 III 30 6 .73 .15
III to V 38 IV A,B 15 0 .40 00
IV A,B to VI 47 V 18 20 .38 .43
V to VII 20 VI 9 0 .45 00
(2) Number achieving Learning Set immediately subordinate to Mediation Learning
Set. For example, M.L.S. III has 57 in original sample minus 16 who missed
II B gives 41 - the number to be examined.
(6) Proportion successful on higher learning task when intervening learning set
was achieved (4)/(2) Achieving Mediation L.S.IN and not achieved (5)/(2)

97
Chart XIII
Mediated
(1)
Transfer.
(2)
"After" group N=101
(3) (4)
Mediation(5)Not
(6)
Transfer Learning Achieving Achieving Proportion
Examined +1? Set (M.L.S) M.L.S. M.L.S. 4/25/2
+ - +
I to III 100 II B 81 11 .81 .il
II B to IV A 85 III 79 2 .93 .02
II B to IV B 85 III ri 2 .91 .02
III to V 92 IV, A,B 46 1 .50 .01
IV A,B to VI 98 V 41 35 .42 .36
V to VII 51 VI 29 2 .57 .04

98
Chart XIV
Proportion of Leaming Sets with Ambiguious Score
(1) (2) (3) (4)
Proportion of
Learning Frequency of Frequency of identical (2) /
Set Ambiguious Score positive score
"before" "after" before after before
2 5 57 94 .35
II B 11 16 41 84 .27
9 25 38 93 .24
IV A 0 6 52 96 .00
IV B 8 15 47 92 .17
V 10 30 20 46 .50
VI 31 49 44 83 .70
VII 9 28 18 56 .50
(5)
Reduction of
(3) Ambiguityafter
.05 + .30
.19 + .08
.27 - .03
.06 - .06
.16 + .01
.65 - .15
.59 + .11
.56 - .06
(2) An ambiguious score is an acceptable learning set with 1,0 or 0,1 combination.
(3) An identical score is an acceptable learning set with 1,1 combination.
Unacceptable learning sets are also identical (0,0) but are not included here.

151.4
It; It;Ks) ito I VI
0 D3Om 0
zr
0 44 44 44 44 44 44 44 44 44 A. to to to to LO to to to to to to r) h) h) b) h) h) h) h) h) Pa Fa Pa pa Pa Pa Pa Pa i".a 0 CO %4 cr 0 44 to N) FA Pf
C) Co -4 CO tn to N) Pa C) MD CO %a Cr tn 0. to Oa Pa C) V) CO %.) Cr 0 0. to h) Pa C) co'%a 0 it. to ha Pa C)
I 1 1 1 1 1 I I I
HCD
I-4 307 Ia.
t-i
1 1 1 1 1 1 1 111+ 1111 1 + 4- I
+ 4- + 4- + 4- + 41' 1 I 1 + 11- 4- I 4- + + + +(1)
1-4
1 + + + + + + I t 1+44 1 I 1 1 + + 4: to
1 oil 1 1 lairs4. 4- 4-11 o 114. 11111111 I I Io <:
I o 4- 4. 4- 4- 4- 4- i 4- 4 + + 1 + 41- 1+1 1+11 o+1 4- 4r + + + + 4r + 1-4
oil+ 4. 4. 4. 4.14.s000sosolo.l. 4. 4- 4.toossolosols4.1114. +11111i <4
1,-.-41
Io
tn tn tn 0 la*4 a ln ix to N, p4
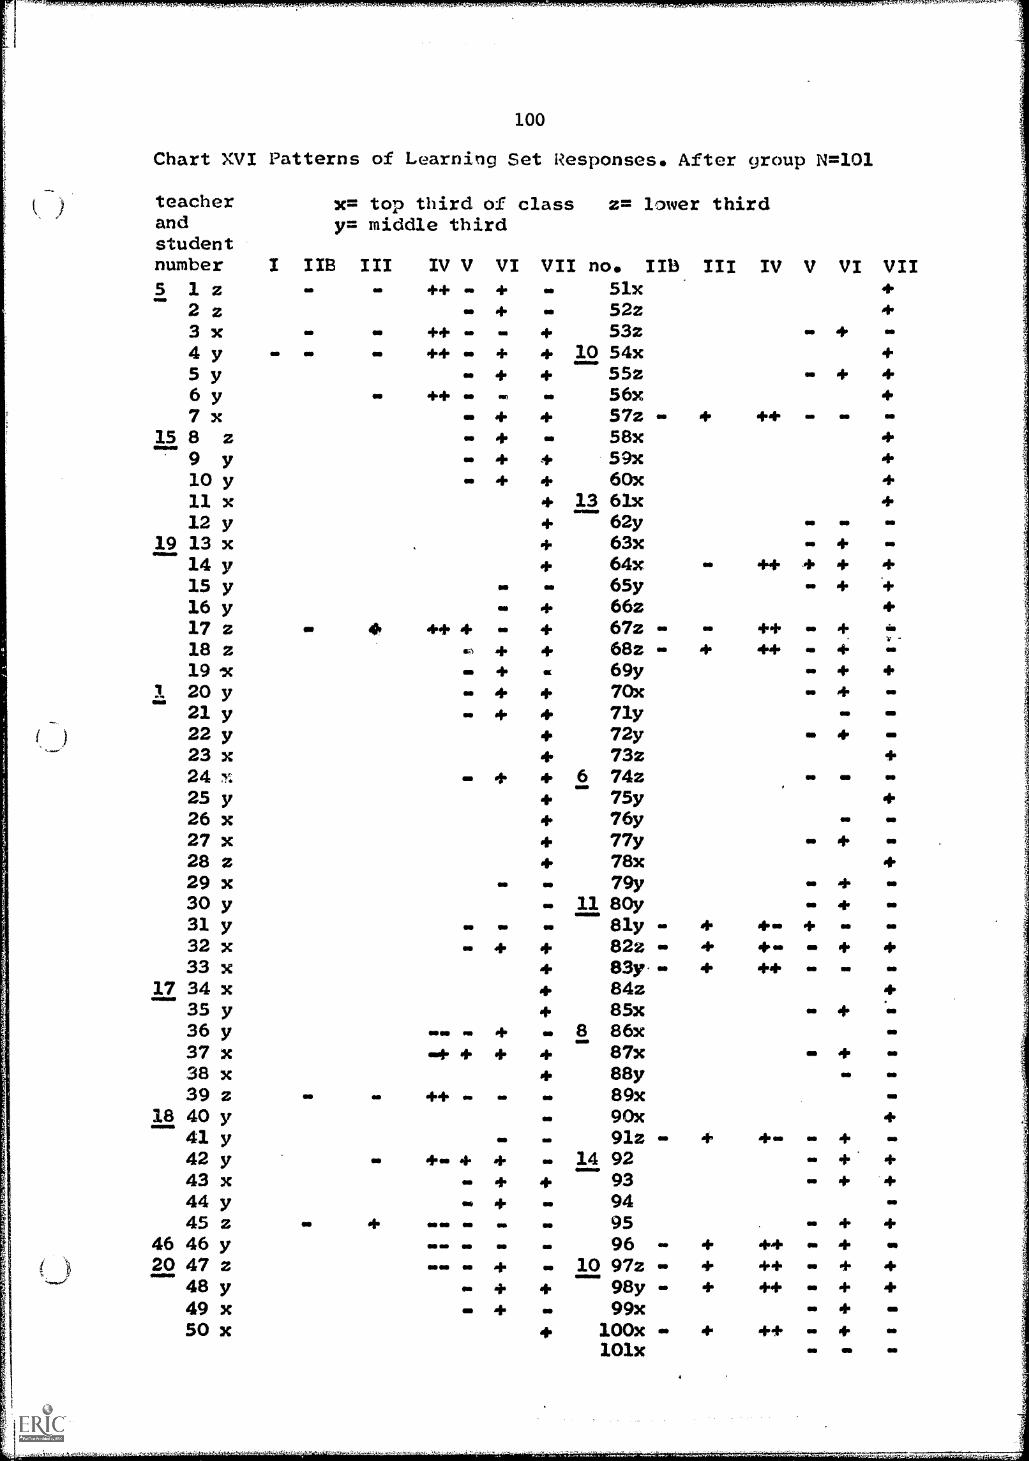
'vs
> +
+1+
++
1++
++
11+.+
+.1A
+111+
1+11+
111+1+
,11111+1+
+1+
1++
1111-4
wt,
)4(1)rCr-i
1-41'4
4IIII
+1
+1
11I
111+1
+ +
++
+ +
++
11+
++
1+1
++
1+
+ +
+ +
+ +
+ +
11111
11
111+
111
1111
1111111+
+1
* + +
++
+* +
+.+
+ +
+
* + +
aa
IS
SI
IS
Ia
it4 1 i l
cle 1 4 A I '
t tz 'I I X
8.4 A
. A 4 A
1t ts: Po
g t 8 A l i 1 44A
%.t g 1 &
8 % A
t A A
b s4 1 A I ce : ctig 8 A
c 4 c n v u 1 .0g
c t tX
X X
NU
l Ul U
1 in tr) tri in in tr) 4:) Cs %
0 C) 4) 0 %
0 %0 %
0 %0
t%t
t%.
a) co c0 03 c0 c0 co co co co cA at 0%
o% (3%
at at crt Ch 0%
0 00
r4 6-4
211:21I
%.01
illO
Mov21 I
::-)11
C
V)
r-tcr)ea
(1)
010 1-1
Cri
riT
j 4C)-4
14cl
::(1)
3)4-1 ri
.-I'0
a, rO4-1
0 -14o
4..) E
41r,24
1--)
>1-q
>18118111111
>1-1
1-4in-i1--I
)-41-4
1.4
11
+ +
++
+ +
+ 1 +
1 + +
+ +
+ +
1
I + +
I + +
+ *
1
4 ++
+ +
+
eI
e
II
+ +
+ v +
+ +
+ +
+ +
+ +
1
14. 4 4 4
+1
+ill 1
I
++
111I
+ +
+ +
1 + +
1
*+
+1
I1
4.I
I t1:
11
1 + 1
11
1 + 1 +
1++
+11+
++
4.1
11
11
a1
11
+S
SS
Xk
4)N
>t X
. X>
. N 1%
S. X
>-*:
XX
NX
>t X
X X
% >
tX X
iv >%
>.>
.X >
tts) >its) >
.3C X
c)-INN
X>
.>,>
,X4)
.c(1)
0 r4C
f)U
1 V.) t C
O C
% 0 1.4 C
Vin 43 C
.. co o 0 1-4 cl cf) 1,43 t C
O C
% 0 1.4 C
I Ct/ '41 U
lt%
, CO
0% 0
140
'0 XI
r-icf)
int co C
h 1-4r4 r-1
r-18-1
r40.1 C
1 NN
C1 C
s) N01 C
't)C
rl Ce1 C
el C41 C
s) 01 di 'itcr
'0 tr V'
Ul
g4-)
in I.
ItI
co 1(,)
4-)C
Iti) C
tr)1-:1
6-11r-11
NI' C
4
,

101
Chart XVII
Summary of Pass-Fail Relationships Within the "ESS Behavior Hierarchy"
Between Non-Adjacent Learning Sets (N=101)
Transfer to Frequency of Pass Fail
Learning Set Pattern (lower to higher)(1) (2) (3) (4) _
+ + - + 1 - +
I HA 83 0 17 1
I III 97 1 7 0
I IVA 96 0 4 1
I IVB 92 0 8 1
I V 46 1 54 0
I VI 81 0 19 1
I VII 56 0 44 1
IIB IVA 80 1 4 16
IIB IVB 79 4 5 13
IIB V 44 15 40 2
IIB VI 61 7 13 10
IIB VII 50 11 34 6
III V 44 6 49 2
III VI 76 3 17 5
III VII 53 5 40 3
IVA IVB VI 74 3 17 7
IVA IVB VII 54 8 37 2
V VI 53 17 28 3
Frequency of Pass-Fail Relationships to -)
Listed underNumber of Intervening Learning Sets
0 1 2 3 4 5
1
5
1 7
8 5 10
49 49 40 54
9 17 17 13 19
17 28 37 40 34 44
Average 13 21 26 36 26 44
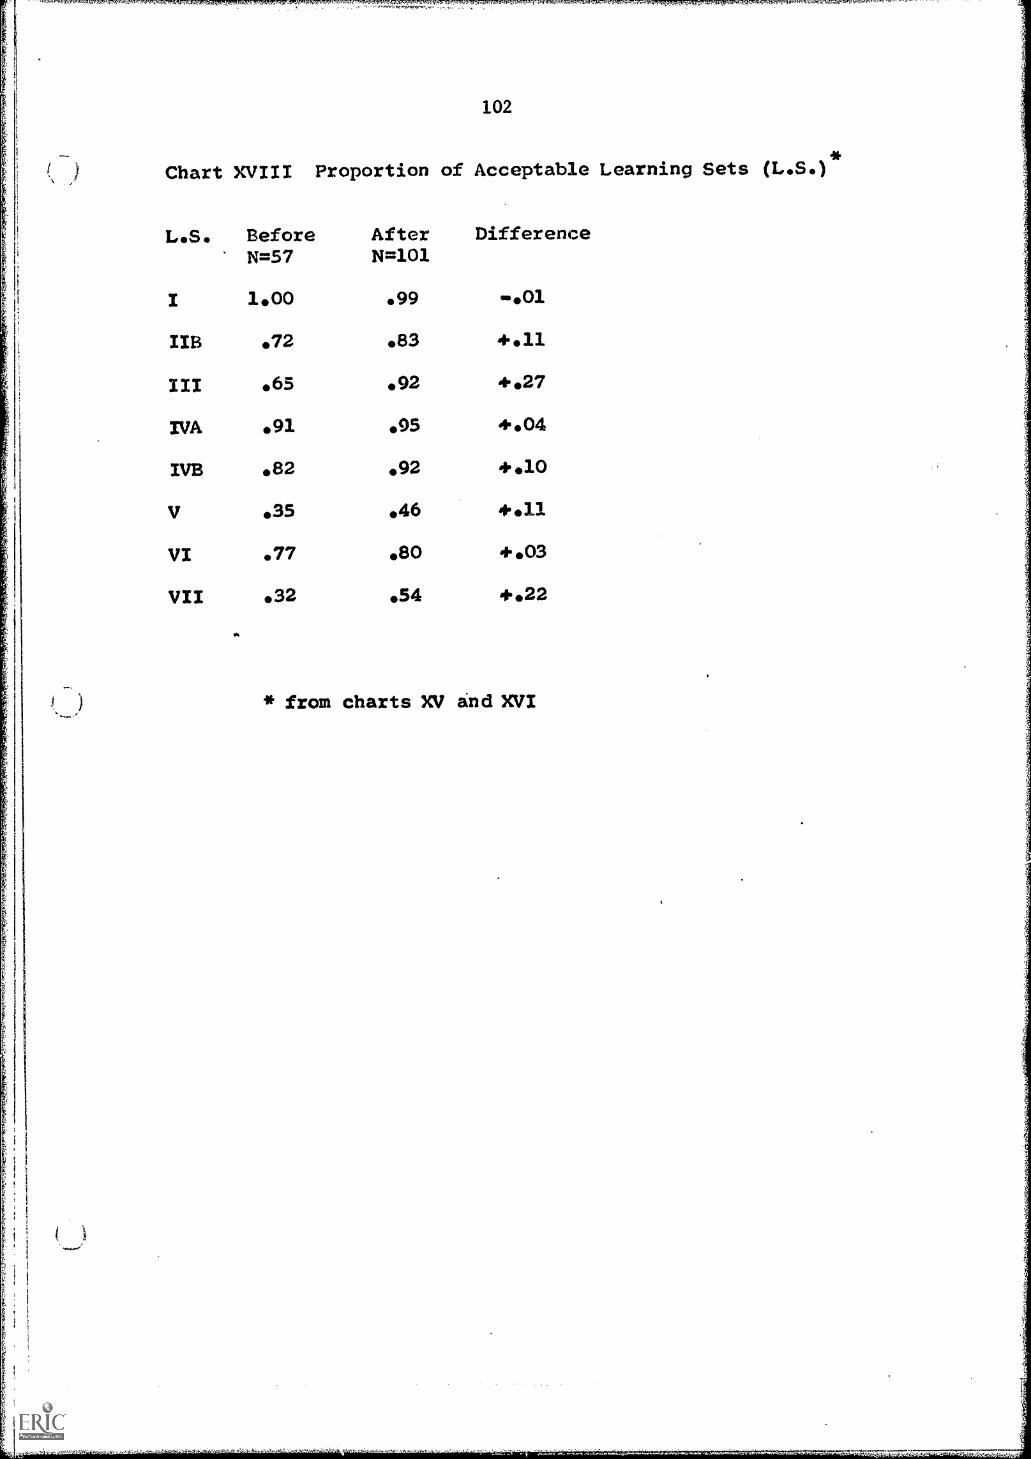
102
Chart XVIII Proportion of Acceptable Learning Sets (L.S.)
a
BeforeN=57
AfterN=101
Difference
1.00 .99 -.01
72 83 +.11
.65 .92 +.27
.91 .95 +.04
.82 .92 +.10
.35 46 +.11
.77 .80 +.03
32 .54 +.22
* from charts XV and XVI
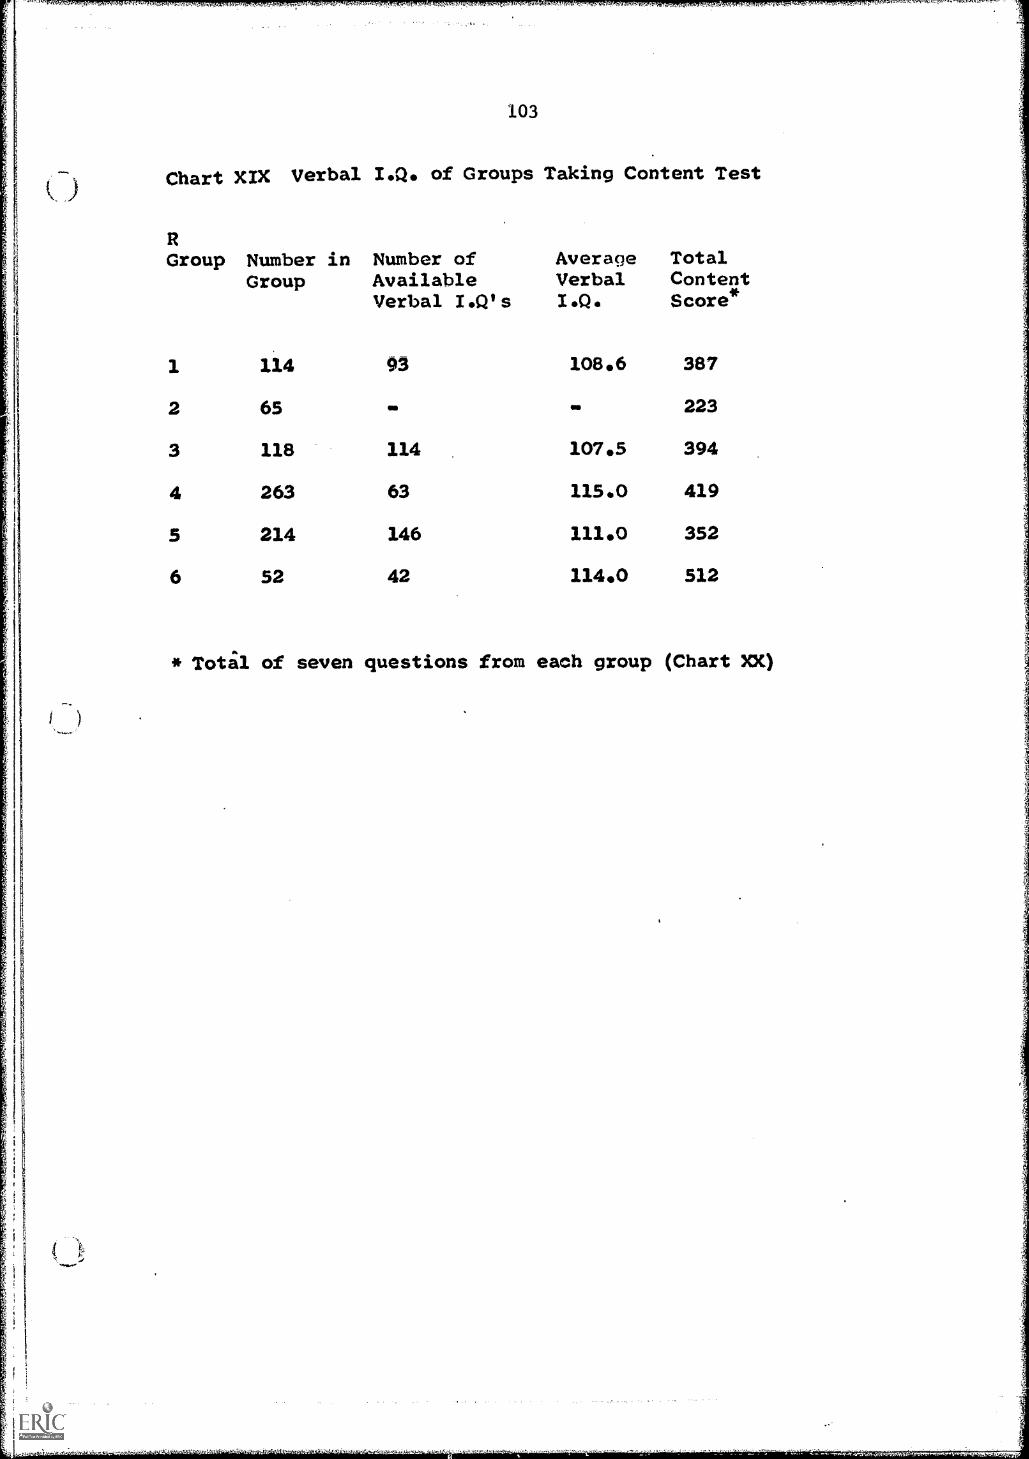
Chart XIX Verbal I.Q. of Groups Taking Content Test
Group Number inGroup
Number ofAvailableVerbal I.Q's
AverageVerbalI.Q.
TotalContentScore*
1 114 93 108.6 387
2 65 . . 223
3 118 114 107.5 394
4 263 63 115.0 419
5 214 146 111.0 352
6 52 42 114.0 512
* Total of seven questions from each group (Chart )N1

104
Chart )0C
Percentage of Acceptable Response's to Content Test
Positionon
HierarchyQuest.
No.
1Did Not'StudyESS (5)N=114
3 83.3
II 1 35.1
6 54.5
IV 2 22.8
V 7 76.6
VI 4 45.6
VII 5 69.3
a
2 3 4Seminar Teachers
(4) (5) (6)
N=65 I N=118 N=263
84.61 76.3 82.5
1.5
24.6
7.7
41.5
26.2
36.9
66.1
44.0
19.4
89.9
38.1
60.2
40.7
58.4
31.5
76.4
56.3
73.8
5 6Non-Seminar
Studied ESS(5) Last Year(6)
N=214 N=52
81.3
50.5
33.1
28.1
70.5
33.6
55.5
86.5
73.1
67.3
40.4
88.5
73.1
82.7
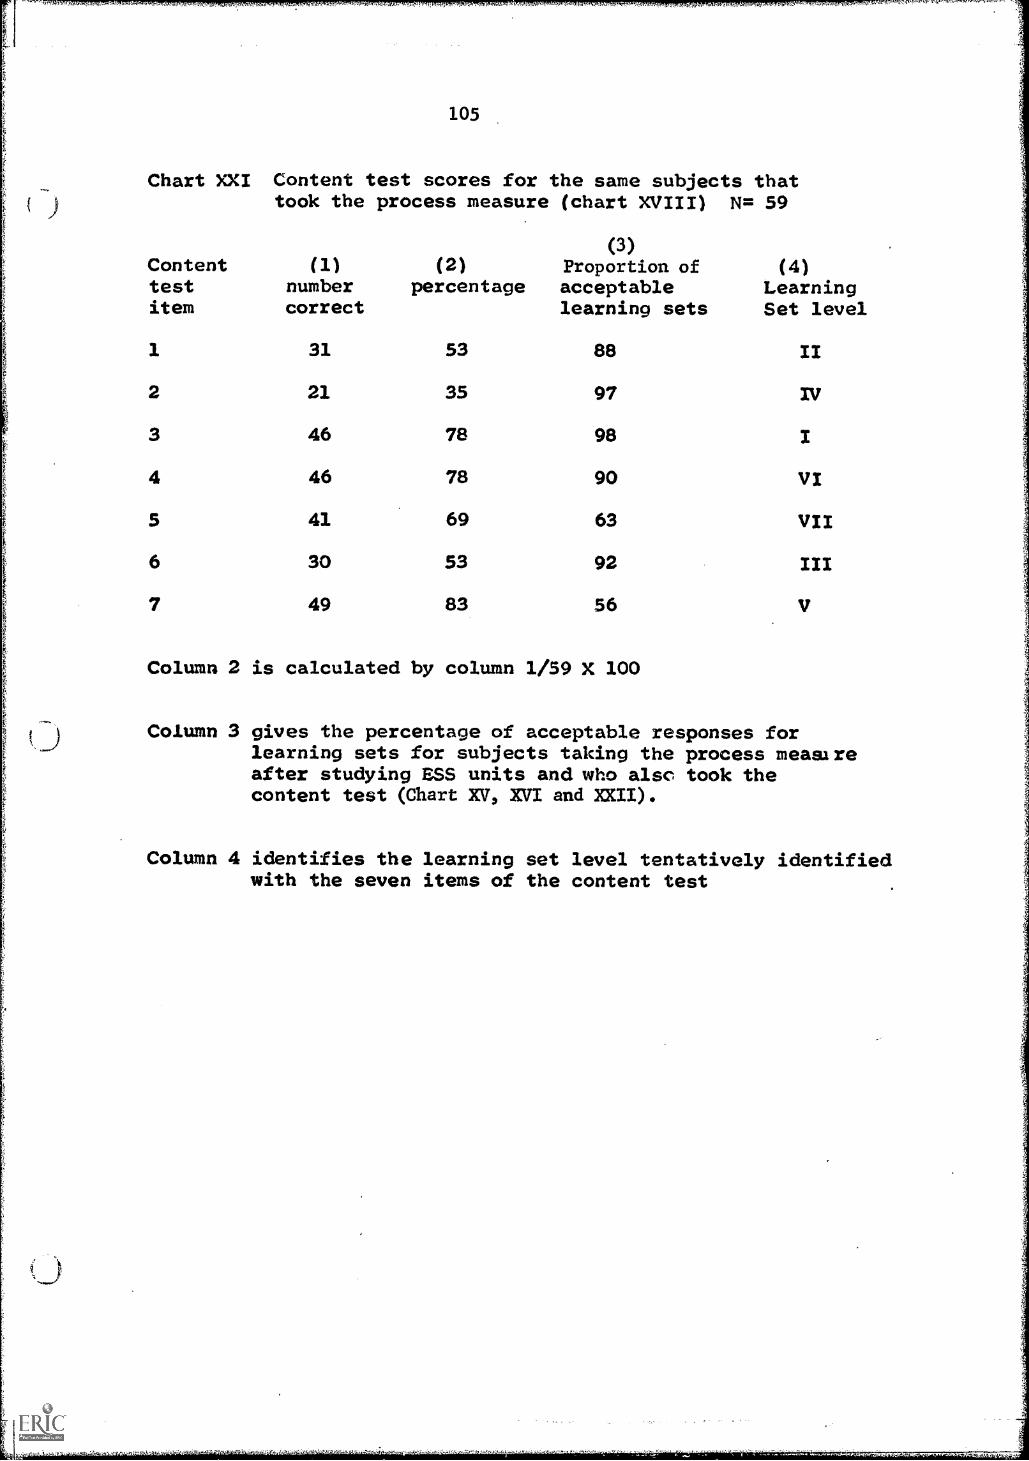
Chart XXI Content test scores for the same subjects thattook the process measure (chart XVIII) N= 59
(3)Content (1) (2) Proportion of (4)test number percentage acceptable Learningitem correct learning sets Set level
1 31 53 88 I/
2 21 35 97 IV
3 46 78 98 I
4 46 78 90 VI
5 41 69 63 VII
6 30 53 92 III
7 49 83 56 V
Column 2 is calculated by column 1/59 X 100
Column 3 gives the percentage of acceptable responses forlearning sets for subjects taking the process measareafter studying ESS units and who also took thecontent test (Chart XV, XVI and XXII).
Column 4 identifies the learning set level tentatively identifiedwith the seven items of the content test
7.7t r.51.

106
.Chart XXII Profile on Content Test of After Group
Student Question numbernumber 1234567
1 0000100 54 00111112 0011111 55 00011113 0010001 56 01111114 0001100 57 0001000
0010010 58 11111116 0011001 59 11110117 0011111 60 01111118 0010101 74 10111019 0011001 75 101010110 0011001 76 101000111 0011101 77 101110120 0111101 78 101101121 1011101 79 101110122 1111111 80 001010123 0011101 82 001011124 0011111 84 111101125 1001111 85 001111126 0101111 86 101100027 0111101 87 100110128 1011110 88 101110129 1111011 89 110111130 0111111 91 100111131 001111132 011101133 010101134 111111135 001011036 111100137 1011111 student numbers refer to chart XVI3e 1111111 1 means question was answered40 0011001 "satisfactorillef (page 53)41 1011111 0 means is was not satisfactory42 100110143 111111144 101111145 001010046 001010147 000011149 111111150 111111151 111110152 100000053 0011000
f

.1.07
Chart XXIII Number Correct for Content test and Process Measure
lower third middle third upper thirdN=20 N=25content process content process
N=14content process
1 41 41 82 12 83 43 64 54 75 45 55 65 86 8
2 1 2 42 4 3 63 3 4 83 4 4 83 6 4 83 6 5 63 7 5 73 7 5 73 7 5 73 8 5 84 5 5 84 8 5 85 4 6 65 5 6 75 6 6 8
3.3^ 5.6 5 6 6 85 6 6 a
)5 7 6 8
f
5 7 7 6'.
55 a 7 77 8
3.8 5.8 7 87 87 a
v 7 8
5.4 7.3
This chart is calculated from chart XVI and XXII. The aboveitems represent the number of correct responses on the contenttest compared to the number of correct responses on the processmeasure for each individual taking both tests.

100
80
".7^
'!",V
7,.
108
Graph I
Process Measure Before and After ESS Units
....N\
/\
/\,
l/
I/ .,
.I
1.
I._
.-n
lI
tti
I
%I
\/
I
\/
1
siI
1
V
60
40
20
Before N=56
(Chart I)
Alter
N=101
(Chart II)
I
R,
13
4Number of Question
10
11
12
13
14
15
16
37
18

100
80.
60
109
Graph II
Baltimore Sub Group Before and After ESS Units
r#'
It
40_
20__
Before N=36 (Chart III)
ell
4111After
N=34 (Chart III)
14
5Number of Question
i
10
11
12
13
14
15
16
17
18

100
110
Graph III
Process Measure Before and After ESS Units
Upper Third" of Class
-...
4,
..
14
....
/.,
t1
i\
%
80
/1
/ 1
/I I
I
/
/1
//
i
\\
\1
/\
.
II
% 1\I
60
I1
1I I
%.-
-I
I zz
Ite
i
/40
de
20
Before N=18 (Chart IV)
.... After
N=41 (Chart V)
11
1.
11
1
12
3a
56
78
910
11
12
13
14
15
16
17
18
Number of Question
_

100
80
60
40
11_
Graph IV
Process Measure Before and After ESS Units
Middle "Third,' of Class
20
Before N=22
(Chart ry)
After
N=37
(Chart V)
71
23
45
Number of Question
30
11
12
13
14
.M11
15
16
17
18
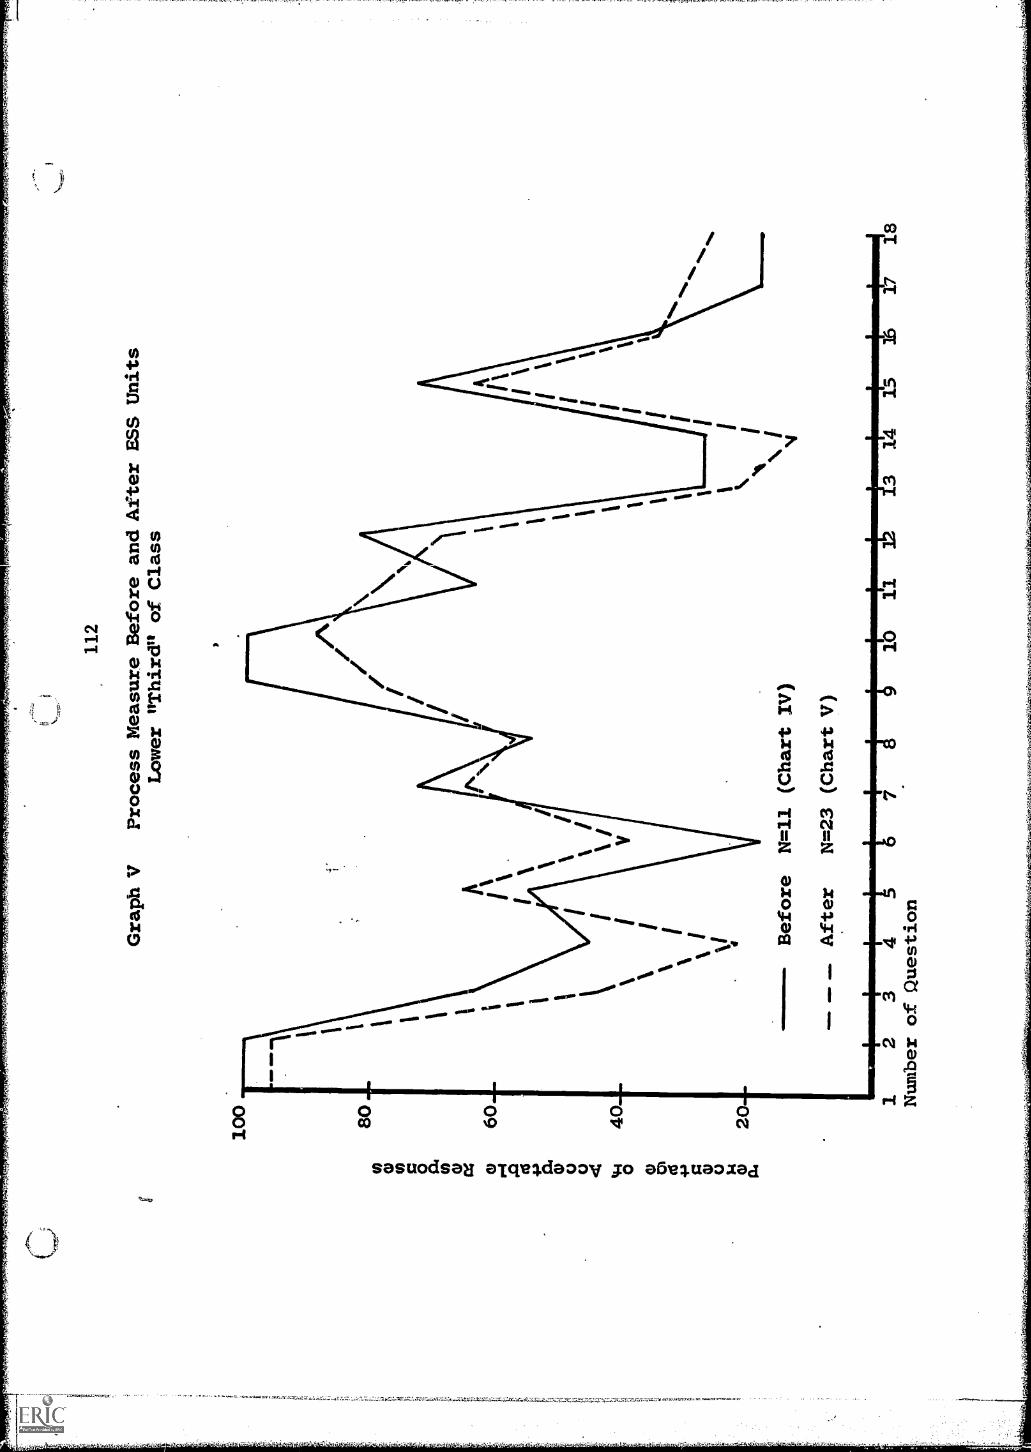
100
I1 1
80
1
Gra
ph V
Proc
ess
Mea
sure
Bef
ore
and
Aft
er E
SS U
nits
Low
er ',
Thi
rd"
of C
lass
Bef
ore
N=
11 (
Cha
rt I
V)
Aft
erN
=23
(C
hart
V)
12
34
Num
ber
of Q
uest
ion
1011
314
1517
18

100
113
Graph VI
Process Measure Before
and After ESS Units
Fourth and Fifth GradesCombined
"\
\/
\\ \
/\
\/
\\
/\ \
80
\...
\r"
"1 I
60 40 20
Before N=39
(Chart VI)
=.
41.1
11M
,After
N=42
(Chart VI) -'"wimmnimilmill1111
I.
12
34
56
78
910
11
12
13
14
15
16
17
18
Number of Question

I
Percentage of Acceptable Responses
co 0 0
co
Z II II
111.
*%1
41,0 Aga gni,.