Childhood Health and Lifecycle Human Capital … Health and Lifecycle Human Capital Formation...
49
Childhood Health and Lifecycle Human Capital Formation * Hiroaki Mori † December, 2016 Abstract A growing body of literature emphasizes the role of childhood health in shap- ing labor market outcomes. Little is yet known whether poor health during childhood influences later outcomes by restricting skill formation, or by mainly affecting future health. To address this issue, this paper formulates and es- timates a model of the joint dynamics of skills and health over the lifecycle. The estimated model is used to quantify the relative importance of the channels through which childhood health conditions affect labor market outcomes. In the model, individuals are endowed with a multi-dimensional human capital bundle that consists of skills and health. The human capital bundle evolves over time according to a production technology, with influences from endogenous decisions regarding schooling, labor supply, and occupations. The results indicate that the most important channel accounting for mental health-related earnings gaps is the skill channel. About 60-65% of the earnings gaps can be explained by the effects of childhood mental health conditions on skill formation. The effects of childhood health status on health formation are also found to play important roles. Keywords: childhood health, earnings inequality, dynamic factor analysis, skill- health complementarities, task-based approach JEL Classification: I14, I24, J24, J31 * I am deeply grateful to my advisors Chris Robinson and Todd Stinebrickner, and especially Audra Bowlus for their invaluable encouragement, guidance and support. An earlier version of this paper has been presented at the UM-MSU-UWO Annual Labor Day Conference at the University of Michigan and the 2015 Canadian Economic Association Annual Meeting. I thank the participants, especially Charles Brown, Todd Elder, Logan McLeod, and Jeffrey Smith, for helpful comments and discussions. All errors are mine. † Department of Economics, Hitotsubashi University, Naka 2-1, Kunitachi, Tokyo, Japan. Email: [email protected]. 1
Transcript of Childhood Health and Lifecycle Human Capital … Health and Lifecycle Human Capital Formation...

Childhood Health and Lifecycle Human Capital Formation∗
Hiroaki Mori†
December, 2016
Abstract
A growing body of literature emphasizes the role of childhood health in shap-ing labor market outcomes. Little is yet known whether poor health duringchildhood influences later outcomes by restricting skill formation, or by mainlyaffecting future health. To address this issue, this paper formulates and es-timates a model of the joint dynamics of skills and health over the lifecycle.The estimated model is used to quantify the relative importance of the channelsthrough which childhood health conditions affect labor market outcomes. In themodel, individuals are endowed with a multi-dimensional human capital bundlethat consists of skills and health. The human capital bundle evolves over timeaccording to a production technology, with influences from endogenous decisionsregarding schooling, labor supply, and occupations. The results indicate thatthe most important channel accounting for mental health-related earnings gapsis the skill channel. About 60-65% of the earnings gaps can be explained by theeffects of childhood mental health conditions on skill formation. The effects ofchildhood health status on health formation are also found to play importantroles.
Keywords: childhood health, earnings inequality, dynamic factor analysis, skill-health complementarities, task-based approachJEL Classification: I14, I24, J24, J31
∗I am deeply grateful to my advisors Chris Robinson and Todd Stinebrickner, and especially AudraBowlus for their invaluable encouragement, guidance and support. An earlier version of this paper hasbeen presented at the UM-MSU-UWO Annual Labor Day Conference at the University of Michiganand the 2015 Canadian Economic Association Annual Meeting. I thank the participants, especiallyCharles Brown, Todd Elder, Logan McLeod, and Jeffrey Smith, for helpful comments and discussions.All errors are mine.†Department of Economics, Hitotsubashi University, Naka 2-1, Kunitachi, Tokyo, Japan. Email:
1

1 Introduction
Inequality in lifetime earnings depends critically on the dynamic process of human
capital formation. A substantial share of lifetime earnings can be explained by skills
developed before labor market entry (Keane and Wolpin, 1997). However, a grow-
ing body of literature also emphasizes the importance of childhood health status as
a determinant of adult earnings.1 The economic model of human capital formation
suggests two main channels through which childhood health conditions may affect la-
bor market outcomes.2 First, childhood health may have a direct influence on adult
health, which in turn may affect labor market outcomes. Second, past adverse health
conditions may slow down skill formation due to the complementaries between skills
and health in producing future skills. To the extent that the second channel operates,
skill promoting policies may work as well as health interventions to alleviate the nega-
tive effects of childhood health conditions. Empirically, however, little is known about
the magnitude of the two channels.3
Prior research has established the long-term effects of childhood health on various
outcomes other than earnings such as adult health status, labor supply, and schooling
outcomes.4 As long as schooling and labor market experience increase skills, these
results suggest that both channels contribute to the link between the childhood health
conditions and adult earnings. Nonetheless, these results do not reveal the relative
1For example, Lundborg et al. (2014) show that major health conditions at age 18 have long-runeffects on labor income using Danish administrative data. They find the strongest effects with mentalhealth conditions. Smith and Smith (2010) estimate that childhood mental health conditions perma-nently lower individual labor earnings on average by $4,094 per year using retrospective childhoodhealth data from the Panel Study of Income Dynamics. Fletcher (2014) reports using the Add Healthdata that childhood attention deficit/hyperactivity disorder (ADHD) reduces earnings at around age30 by approximately 33%.
2Heckman (2007) provides a model of child development in which skills and health interact inproducing future skills and health.
3A recent survey of the literature conclude that “while it is clear that shocks to health have long-term effects on domains such as education and earnings, it is not clear whether health shocks havedirect effect on cognition or learning, or whether they act mainly by affecting future health (Almondand Currie, 2011a, p. 1468).”
4Empirical results on the lifecycle consequences of childhood health conditions are surveyed byCurrie (2009), Case and Paxson (2010), and Almond and Currie (2011a,b).
2
importance of the two channels for two reasons. First, schooling and labor market
choices are likely to affect not only skills but also health.5 Separating these effects
is necessary in order to quantify the sizes of each channel. Second, individuals may
make schooling and labor market decisions based not only on their skills and health
but also on other unobserved factors such as preferences. Childhood health conditions
may affect both what individuals can do and what they want to do. To the extent
that childhood health conditions affect preferences for schooling and work, the earnings
gap associated with childhood health conditions may reflect taste-based compensating
differentials. Ignoring the endogeneity of schooling and labor market decisions, there-
fore, may lead to biased estimates of the magnitude of the skill channel and the health
channel.
In addition, accumulating evidence suggests that childhood mental disorders tend
to have a substantially larger negative effect on schooling outcomes and adult earnings
than physical disorders (Currie et al., 2010; Lundborg et al., 2014). Less is, however,
known why specific childhood health conditions are more detrimental than others on
those outcomes. This is potentially because health conditions are heterogeneous regard-
ing how they limit individuals’ ability to perform specific tasks. For example, mental
health conditions may limit performing cognitive tasks such as reading documents and
solving complex problems, while physical health conditions may limit performing man-
ual tasks such as lifting heavy objects and using hands/fingers for production. The
magnitude of the negative effects of specific childhood health conditions may differ de-
pending on how the health conditions affect task-specific performance and how those
tasks are related to the outcomes.
To examine the nature of specific childhood health conditions, this paper takes
advantage of insights from the relatively new literature on multi-dimensional skills.
5Conti et al. (2010) among others estimate the causal effects of education on health outcomes. Theeffects of labor supply on health outcomes are studied for example by Sickles and Yazbeck (1998) andGilleskie (1998). Fletcher et al. (2011) show that work experience in physically demanding occupationshave negative effects on subjective health status among older male workers.
3

In particular, I apply a task-based approach to estimate how childhood health condi-
tions affect the characteristics of tasks performed by the individuals. Past experience
in specific tasks likely produces skills related to the tasks. The task-based approach
is, therefore, useful for analyzing how childhood health conditions affect task-specific
skills. For that purpose, I augment career histories obtained from National Child De-
velopment Study (NCDS) with task information provided by the UK Skills Survey. The
NCDS follows all individuals born in the second week in March 1958 in Great Britain
throughout their life courses. Most importantly, the NCDS contains the results of
medical examinations conducted at ages 7 and 16, which are used to diagnose major
health conditions during childhood. Thus, I do not need to rely on subjective reports
of childhood health status. In Section 2, I show clear evidence that workers sort into
different kinds of occupations depending on their childhood health conditions. In par-
ticular, individuals with childhood mental health conditions tend to select occupations
that command less intensive cognitive tasks. In contrast, individuals with physical
health conditions are less likely to choose occupations that require intensive manual
tasks. Overall, the evidence from the task-based approach supports the view that dif-
ferent childhood health conditions affect occupational choice and, therefore, likely the
accumulation of skills needed to perform tasks in those occupations. However, occupa-
tions are determined by individuals’ choice like schooling and labor supply. Therefore
as long as the choices are driven by unobserved factors other than skills, disregarding
those factors may result in biased estimates of skills.6
To address all of these issues, Section 3 develops a lifecycle model of human cap-
ital formation, which features both the health channel and the skill channel through
which childhood health conditions may operate to generate the long-term effects. The
model builds on Yamaguchi (2012) which provides a framework within which one can
6Direct health measures are provided by medical examinations or by self-reports. Childhood skillscan be measured through cognitive or psychological assessments. In contrast, such direct measuresare not often available to measure adult skills so that researchers are forced to resort to inferring adultskills based on endogenous schooling choices and labor market choices.
4
estimate latent skills from observed task histories. I extend his framework to include
health conditions as well as schooling choices and labor supply decisions. In my model,
individuals are endowed with a bundle of human capital that consists of cognitive skill,
manual skill, mental health, and physical health. The human capital bundle evolves
according to a technology that captures two key aspects of the joint dynamics between
skills and health: i) cross-productivity between skills and health in shaping future skills
and ii) the influences of schooling and labor market choices on future skills and health.
By modeling own-productivity and cross-productivity of the human capital bundle,
it is possible to quantify how past health conditions affect both future skills and fu-
ture health. To isolate the skill channel from the health channel, this paper estimates
how schooling and labor market choices affect skills and health stocks separately. The
model also allows childhood health conditions to affect preferences for schooling and
working, which allows for inferring skills from endogenous schooling and labor market
choices without relying on the assumption that those choices are driven only by skills.
The likelihood function for the model is constructed by combining the Kalman filter
algorithm and simulations. The model parameters are then estimated by maximizing
the likelihood using the longitudinal cohort data from the NCDS.
The estimation results, including the model fit, are presented in Section 4. The
model can account for the salient features of the data including the gaps in employ-
ment, occupation choices, and earnings across individuals with different types of child-
hood health conditions. The results display large and significant monetary returns
to cognitive skills. Returns to manual skills, physical health and mental health are
substantially smaller. I find that skills grow faster when individuals work longer and
perform cognitive and manual tasks more intensively. These results are consistent
with skill formation via “learning-by-doing”. The parameter estimates suggest that
individuals with childhood health conditions bring lower levels of skills into the labor
market. The estimates also suggest that they experience slower skill growth and faster
5

health depreciations. These results imply that both the skill channel and the health
channel are operative in generating the observed health-related gaps in earnings. In
addition, I find that performing intensive manual tasks leads to faster deterioration
of physical health. This implies that working in an occupation that commands high
levels of manual tasks is costly for maintaining physical health. Further, the estimates
suggest that both physical and mental health tend to improve with the allocation of
time for non-labor activities.
Section 5 quantifies the relative importance of the channels through which child-
hood health conditions affect earnings. To disentangle the alternative channels, the
estimated model is simulated under the restrictions that individuals with different
childhood health conditions are homogeneous in terms of (1) preferences, (2) skill for-
mation, and (3) health formation. Outcomes from the counterfactual experiments
reveal that the effect of childhood health on skill formation plays the greatest role in
accounting for the observed earnings gaps between individuals with childhood mental
health conditions and their healthy counterparts. The skill channel is also the main
factor behind the observed earnings losses at younger ages among individuals with
childhood physical health conditions. The role of the skill channel diminishes over
time for childhood physical health conditions. The differences in tastes and health
formation also play significant roles for both types of health conditions, especially at
older ages. They account for about a quarter to one third of the earnings gaps at
age 42. These results indicate the importance of accounting for complementarities be-
tween health and skills in shaping future skills and earnings. Section 6 provides some
concluding remarks.
2 The Long Reach of Childhood Health
This section provides descriptive evidence regarding the link between childhood health
and lifecycle skills among individuals who participated in the National Child Devel-
6
opment Study (NCDS). The first subsection explains the data sources and sample
selection criteria. The second subsection presents descriptive statistics and analyses
using the NCDS.
2.1 Data Sources
The NCDS follows a cohort of individuals born in Great Britain between March 3rd
and March 9th in 1958 until they die or permanently emigrate out of Great Britain.7
The NCDS provides career histories up to age 50 with detailed occupation codes.
Monthly earnings for first jobs and those for main jobs at ages 23, 33, 42, 46 and 50
are available. The NCDS conducted medical examinations when the cohort members
were at ages 7 and 16. The NCDS is the data source for the influential analysis of
Case et al. (2005) on the long-lasting effects of childhood health conditions on labor
market outcomes. They used observations up to age 33. I extend their analysis by
incorporating observations up to age 50. I focus on male individuals who took the
medical examinations both at ages 7 and 16. To construct career histories, I eliminate
individuals who did not respond to the survey at ages 23 and 33. These criteria yield
a sample of 3,665 males.
I augment the occupation histories in the NCDS dataset with task measures that
characterize how workers use their skills at various tasks conducted in their jobs. The
task measures are obtained from the UK Skills Survey, which is a series of surveys
that aim to investigate skills used by the employed workforce in Great Britain.8 Us-
ing the 1997-2012 UK Skills Survey, I derive task measures using employee ratings
of job-specific task characteristics. At each wave, respondents are asked how much a
particular task is important for his/her job on a 5-point scale ranging from 1 (“not
at all/does not apply”) to 5 (“essential”). Following Yamaguchi (2012), I group tasks
into two broad categories: the first group consists of cognitive skills/tasks and the
7More details of the NCDS can be found online (Last accessed: 05/22/15).8See, e.g., Felstead et al. (2007) for details of the UK Skills Survey.
7

second comprises manual skills/tasks.9 Examples of cognitive tasks include problem
solving, analysing complex problems in depth, and doing calculations using advanced
mathematical or statistical procedures. Examples of manual tasks include working for
long periods on physical activities or carrying, pushing, and pulling heavy objects.
For each type of task, a principal component analysis is performed to construct the
coordinate-system to assign each four-digit occupation in the 2000 UK Standard Occu-
pation Classification into the two dimensional task space (cognitive and manual task).
Following Autor et al. (2003), the task indices are converted into percentile scores.
Statistics from the joint distribution of the constructed task measures are given in Ta-
ble 1. The cognitive skill requirements and the manual skill requirements of the jobs
are highly negatively correlated.
Table 1: Distribution of Task Measures
Mean Std. Dev.Cognitive 0.592 0.184Manual 0.538 0.244
Corr. -0.477
Note: The sample consists of all working individuals in the 1997-2012 Skills Surveys. Thesample size is 17,424. The task measures are calculated as percentile scores divided by 100.
Health conditions are often grouped into two broad types: “mental” conditions
and “physical” conditions.10 To facilitate the analysis, I follow this convention and use
the 10th revision of the International Statistical Classification of Diseases (ICD-10) to
categorize health conditions into the two types. Through the medical examinations
conducted for the NCDS, medical experts diagnose major childhood health condi-
tions. Mental health conditions include emotional and behavioural disorders (EBD)
and speech disorders. Physical health conditions cover a wider range of conditions, in-
9The subsets of task characteristics taken from the UK Skills Survey are presented in AppendixA.
10See, for example, Conti and Heckman (2013).
8

cluding vision defects, hearing defects, limb defects, nervous system disorders such as
migraine and epilepsy, respiratory system problems such as asthma, heart conditions,
and other physical abnormalities. A list of the subsets of health conditions taken from
the NCDS is provided in Appendix B. Using the diagnoses, a particular health condi-
tion at ages 7 and 16 can be defined to be either “handicapping”, “non-handicapping”,
or “non-existent”. Following Goodman, Joyce and Smith (2011), I aggregate health
conditions diagnosed at ages 7 and 16, and do not count non-handicapping physical
health conditions.11 Table 2 reports the fraction of individuals diagnosed with men-
tal and physical conditions by age 16. About 24% of the sample has been diagnosed
with either a mental or a physical condition. Physical health conditions appear to be
relatively less prevalent than mental conditions partly because I do not count non-
handicapping physical health conditions. It is noteworthy that the overlap between
the two types of the health conditions is fairly small as only about 2% of the sample
was diagnosed with both types of the health conditions. Accordingly, in what fol-
lows, I assume that individuals have physical conditions only when they have physical
conditions but not mental conditions.
Table 2: Fraction of individuals ever diagnosed with mental and physical health con-ditions by age 16
Physical No physical TotalMental 0.022 0.124 0.147No mental 0.091 0.762Total 0.114
Note: The data source is the NCDS. The sample consists of 3,665 men. Appendix B providesa list of mental and physical health conditions.
11The non-handicapping physical conditions are highly common as about 41% of the male samplewas diagnosed to have such conditions before age 16. Not surprisingly, those non-handicapping phys-ical conditions during childhood do not have statistically significant correlations with labor earnings.In contrast, non-handicapping mental health conditions are correlated significantly and negativelywith labor earnings. See Appendix B.
9

2.2 Descriptive Analysis
Earnings Table 3 demonstrates how the two types of health conditions are related to
lifecycle earnings by regressing log-transformed annual labor earnings at each age on
dummy variables that indicate the presence of each type of childhood health conditions.
The estimation results suggest that both types of childhood health conditions have
long-run negative effects on earnings. The negative effects appear to be greater with
the physical conditions than the mental conditions in the early years after labor market
entry. Interestingly, this pattern is reversed in later years. The health-related earnings
gaps grow over the lifecycle with the mental conditions while they lessen with the
physical conditions.
Table 3: Gaps in log annual earnings by childhood health conditions
Age 23 Age 33 Age 42 Age 50Mental -0.089 -0.124 -0.133 -0.131
(0.017) (0.023) (0.033) (0.039)Physical -0.121 -0.064 -0.049 -0.043
(0.026) (0.031) (0.042) (0.048)
Note: Standard errors are in parentheses. The data source is the NCDS. The sample consistsof 3,665 men.
Labor Supply Labor supply histories are often used as measures of worker skills. Fig-
ure 1 shows fraction of individuals working fulltime at each age.12 Labor supply tends
to fall as individuals get older. Throughout the lifecyle, individuals with childhood
health conditions tend to work less than their healthy counterparts. During 20’s, the
fulltime employment rates are about 2%-4% points lower among those with childhood
health conditions. These patterns becomes more evident in later years, especially for
those with childhood mental conditions. The fulltime employment rates among indi-
12I define individuals work fulltime during a year if they work 40 hours per week for more than 43weeks. In the data, I observe if an individual work either parttime or fulltime in a month. I regardfulltime work within a month as working 40 hours per week for each week in the month. Therefore,in the data, individuals work fulltime within a year if they work fulltime at least for 10 months. Icount parttime work during a month as working 20 hours per week for each week in the month.
10

viduals with childhood health conditions are about 4%-8% points lower at age 50 than
that of their healthy counter parts. The results suggest that individuals with childhood
health conditions tend to experience slower accumulation of labor market experience.
Nevertheless, most individuals (at least more than 80%) work fulltime regardless of
their childhood health conditions.
20 30 40 50Age
0.80
0.85
0.90
0.95
1.00
Full-
tim
e e
mplo
ym
ent
rate
Mental
Physical
No conditions
Figure 1: Fulltime employment rates at each age among individuals with differentchildhood health conditions. Source: the NCDS.
Task Selections Task measures characterize the portfolio of skills used to conduct
the tasks in the workplace. Figure 2 plots the levels of cognitive tasks and manual
tasks used in jobs at each age. The cognitive task profiles exhibit an increasing con-
cave shape, which is similar to the shape of the lifecycle human capital profile found
in Ben-Porath (1967).13 The cognitive task profiles show a relatively fast increase ini-
tially, followed by a slowing down to a flat spot and possible decline thereafter. It is
noteworthy that individuals with childhood mental health conditions select into occu-
pations that command less intensive cognitive tasks throughout the lifecycle compared
13Bowlus and Robinson (2012) identify and estimate human capital prices and profiles from earningsdata and find that empirical lifecycle human capital profiles exhibit the Ben-Porath concave shape.
11

20 30 40 50Age
0.45
0.50
0.55
0.60
0.65
Cognit
ive t
ask
level
Mental
Physical
No conditions
20 30 40 50Age
0.45
0.50
0.55
0.60
0.65
0.70
0.75
Manual ta
sk level
Mental
Physical
No conditions
Figure 2: Cognitive and manual task levels at each age among individuals with differentchildhood health conditions. Source: the NCDS augmented with the UK Skills Survey.
to their healthy counterparts. The average cognitive task level of the occupations at
age 35 for those with childhood mental health conditions only reach the average level
of the occupations at age 22 for those without such conditions. While the individuals
with childhood physical health conditions also tend to select less cognitive skill de-
12

manding occupations, the magnitude of the deviations from their healthy counterparts
is relatively small.
Unlike the cognitive task profiles, the manual task profiles exhibit decreasing pat-
terns. Individuals tend to move away from manual skill demanding occupations over
the lifecycle. Individuals with childhood physical health conditions tend to have no-
tably less manual skill demanding occupations compared to their healthy counterparts.
In contrast, those with childhood mental conditions tend to have more manual skill
demanding occupations.
Overall the task-based skill portfolio measures are able to capture differential labor
market sorting patterns across individuals with heterogeneous childhood health condi-
tions. Specific childhood health conditions appear to trigger sorting into particular skill
directions. This implies that different types of health conditions may affect different
components of skills. In particular, mental health conditions during childhood appear
to have greater negative effects on cognitive skills than physical health conditions.
Educational Outcomes In parallel to the results from the task-based skill portfo-
lio measures, childhood mental conditions appear to have greater negative effects on
schooling decisions. As shown in Table 4 individuals with childhood mental conditions
are notably less likely to proceed to higher education than their healthy counterparts.
Such a pattern cannot be found among individuals with childhood physical conditions.
Table 4: Schooling probabilities by childhood health conditions
Mental Physical No conditionsCompulsory 0.672 0.543 0.488High-school 0.253 0.293 0.352University 0.075 0.164 0.160
Note: The data source is the NCDS. The sample consists of 3,665 men.
Table 5 shows the associations between childhood health conditions and math test
13

scores obtained at age 16. Both types of health conditions are negatively correlated
with the test scores. Mental health conditions appear to have a stronger negative
association with the test scores than physical health conditions. This implies that
childhood health conditions may affect endowment of cognitive skills before labour
market entry.
Table 5: Gaps in math test scores by childhood health conditions
Mental PhysicalMath test scores at age 16 -0.491 -0.157
(0.046) (0.057)
Note: The math test scores are normalized to have a unit standard deviation. Standarderrors are in parentheses. The data source is the NCDS. The sample consists of 3,665 men.
3 Model and Estimation Strategy
Health conditions during childhood may influence skill endowments, preferences, the
technology of human capital formation, or all three. To juxtapose the alternative
channels through which childhood health affects labor market outcomes, this section
builds a lifecycle model of joint dynamics of skills and health.
3.1 Model Setup
Each individual has a finite decision horizon ending in an exogenous retirement age T .
I start tracking individuals from age 16 with a one-shot schooling choice. Upon leaving
school, individuals make annual choices over time allocation and job tasks.
Human Capital Bundle An individual at age t is endowed with a latent bundle
of human capital (θt), which consists of skills (θSt ) and health (θHt ). Following Ya-
maguchi (2012), the skills are assumed to be task-specific: they are either cognitive(θS1t
)or manual
(θS2t
). I consider two types of health capital; mental
(θH1t
)and physi-
14

cal(θH2t
). The human capital bundle at age t is thus defined as a 4-dimensional vector:
θt ≡(θSt , θ
Ht
)′where θSt ≡
(θS1t , θ
S2t
)′and θHt ≡
(θH1t , θH2
t
)′. The human capital evolves
according to a technology of human capital formation, as I discuss in a following section.
Post-schooling Choices During the post-schooling periods, the human capital bun-
dle is affected by the choices regarding time allocation and job tasks. Individuals are
endowed with a fixed amount of time at each age t and they split the time endowment
between two types of activities: “labor” and “resting”. Time allocated for labor may
promote skills and is denoted by lt.14 The remaining time is used for a non-labor activ-
ity, called resting, which may promote health.15 The labor activities are characterized
by two kinds of tasks (τt) to be performed by the workers; cognitive (τ 1t ) and manual
(τ 2t ). The labor market choices in a post-schooling period are thus defined as a vector
(xt) with three components:
xt ≡ [lt, τt]′
where τt ≡ (τ 1t , τ2t )′.
Health conditions during post-schooling periods are measured with self-reports.
Individuals are allowed to report their health status at the beginning of each post-
schooling age t. The health reports are defined as a M -dimensional vector of reporting
choices rt.
Post-schooling Utilities During the post-schooling periods, instantaneous utilities
from the labor market choices are derived from the earnings (et) and the tastes for work
14As in the framework of Heckman and MaCurdy (1980), individuals are allowed to desire negativeworking time in my model.
15My framework is closely related to the model of Sickles and Yazbeck (1998) in which leisuretime is an input of health production. In the framework of Gilleskie (1998), individuals are allowed toallocate their time in a day for three activities: work, leisure, and medical care access. Like her model,I allow leisure activities to affect health. I do not explicitly model medical care access decisions asmy dataset does not allow me to separate the amount of time spent for purely leisure activities andthat used to access medical care services in each year.
15

(gt). To model health reporting behaviour, I assume that individuals derive utilities
(vt) from their health reporting in addition to earnings and tastes for work. In sum,
the instantaneous utilities during a post-schooling period are the sum of the three
components described above:
ut = ln et + gt + vt (1)
Individuals consume their earnings from labor and resting activities. I assume that
non-labor income does not vary with the human capital bundle nor with the amount of
resting time. labor is the only production factor in this economy and the labor activities
offer heterogeneous monetary returns to the human capital bundles depending on the
nature of the tasks performed by the worker, similarly to the task selection model of
Heckman and Sedlacek (1985, 1990).
Total earnings are represented as a product of the output prices p(τt), the marginal
output of the human capital bundle q(xt, θt) and an unobserved idiosyncratic shock to
earnings ηt:
et ≡ p(τt)q(xt, θt) exp(ηt) (2)
The human capital price is parameterized as
p(τt) = exp(p0 + p′1τt) (3)
where the scaler component p0 includes non-labor income and the inner product p′1τt
represents the price of labor output. The marginal output of the human capital bundle
is defined as
q(xt, θt) = exp(q0lt) exp[(q1 +Q′2τt)
′θt]
(4)
where q0 is a scaler, q1 is a 4-dimensional vector, and Q2 is a 2×4-dimensional matrix.
The skills are productive only in a relevant task. The health capital components
are coupled with the task-specific skills in determining labor output. In particular, I
assume that the productivity at cognitive tasks may vary depending on the cognitive
16
skill and the mental health, while the manual skill and the physical health affect
worker productivity to perform manual tasks. On the other hand, the productivity
of the human capital bundle does not depend on the amount of labor time. Besides
the returns to the human capital bundles, the labor market choices are affected also
by individual tastes for work. Tastes at age t depend on the observed individual
characteristics ζ1, the human capital θt, the past labor market choices xt−1 and choice-
specific taste shocks νt as in the following quadratic function:
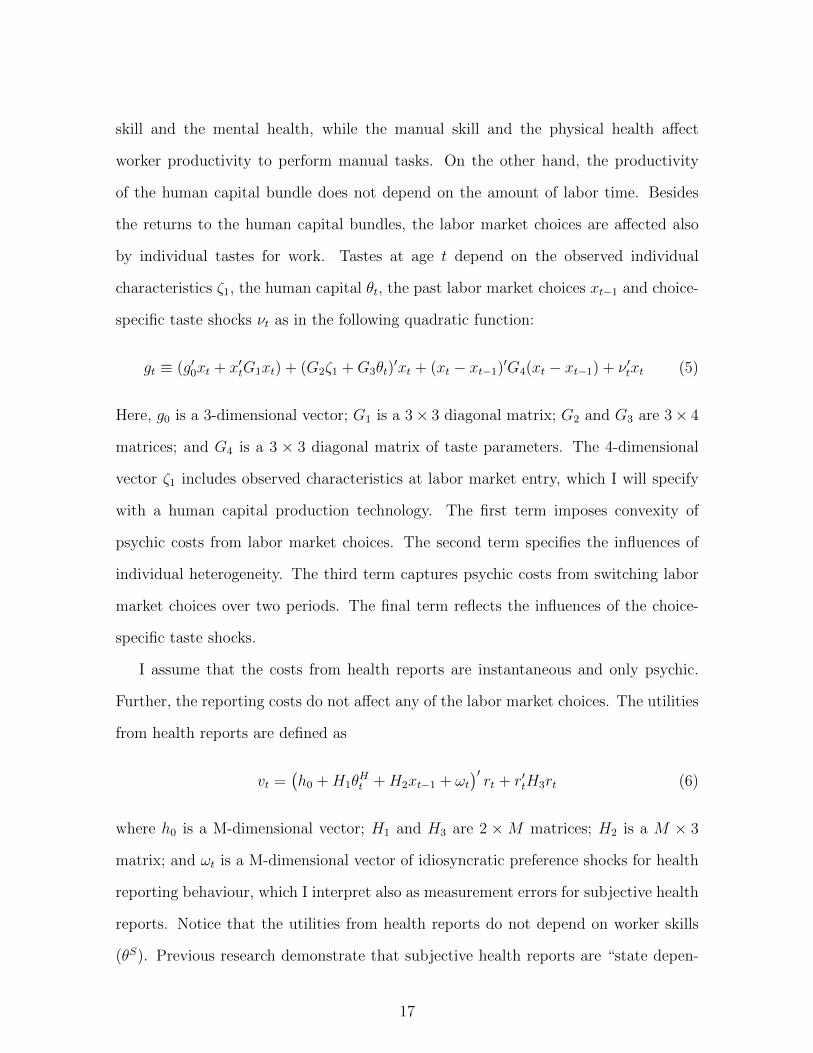
gt ≡ (g′0xt + x′tG1xt) + (G2ζ1 +G3θt)′xt + (xt − xt−1)′G4(xt − xt−1) + ν ′txt (5)
Here, g0 is a 3-dimensional vector; G1 is a 3× 3 diagonal matrix; G2 and G3 are 3× 4
matrices; and G4 is a 3 × 3 diagonal matrix of taste parameters. The 4-dimensional
vector ζ1 includes observed characteristics at labor market entry, which I will specify
with a human capital production technology. The first term imposes convexity of
psychic costs from labor market choices. The second term specifies the influences of
individual heterogeneity. The third term captures psychic costs from switching labor
market choices over two periods. The final term reflects the influences of the choice-
specific taste shocks.
I assume that the costs from health reports are instantaneous and only psychic.
Further, the reporting costs do not affect any of the labor market choices. The utilities
from health reports are defined as
vt =(h0 +H1θ
Ht +H2xt−1 + ωt
)′rt + r′tH3rt (6)
where h0 is a M-dimensional vector; H1 and H3 are 2 ×M matrices; H2 is a M × 3
matrix; and ωt is a M-dimensional vector of idiosyncratic preference shocks for health
reporting behaviour, which I interpret also as measurement errors for subjective health
reports. Notice that the utilities from health reports do not depend on worker skills
(θS). Previous research demonstrate that subjective health reports are “state depen-
17

dent”. For example, Lindeboom and Kerkhofs (2009) find that non-working individuals
tend to understate their health status. This may be because individuals have incen-
tives to report health problems to justify their inactivity (Bound, 1991). In this light,
I allow the utilities from reporting general health status to depend on past labour time
allocation (lt−1), which is a part of the state vector at age t. However, I assume that
self-reports on specific health conditions do not depend on past labour time allocation
(lt−1).
Schooling Choices and Utilities Balancing expected returns and realized costs,
individuals make a one-shot schooling choice at age 16 between three alternatives:
secondary (the compulsory education), high school (A-level or similar) and university.
The schooling options are defined as a vector of two indicator functions for each of the
schooling levels above the compulsory education:
s ≡ (s1, s2)′
I assume that entrance to the labor force occurs at age 17 for secondary school
graduates, age 19 for high school graduates, and age 22 for university graduates. During
the schooling period, individuals consume the constant non-labor income. Besides
the opportunity costs due to foregone earnings opportunities, the schooling choice is
affected by the instantaneous psychic utility from schooling. Without loss of generality,
I normalize the instantaneous utilities from the compulsory schooling level to be 1. The
utilities from the other two schooling options are defined as:
u0 = (k0 +K1ζ0 + ν0)′s (7)
where K0 is a 2-dimensional vector and K1 is a 2× 4 matrix of preference parameters;
and ν0 is a vector of choice-specific taste shocks. I specify the vector of initial observed
characteristics (ζ0) below.
18

Human Capital Formation Following Cunha and Heckman (2008) and Yamaguchi
(2012), I assume that the human capital bundle evolves according to linear production
technologies. The human capital bundle at labor market entry is affected by the
observed characteristics (ζ0), the schooling choice (s), and a vector of production shocks
ε1 that prevail after the schooling choice:
θts = a0 + A1ζ0 + A2s+ ε1 (8)
where a0 is a 4-dimensional vector; A1 is a 4×4 matrix; A2 is a 4×2 matrix; and ε1 is a
vector of idiosyncratic shocks on human capital production during the schooling period.
The initial observed characteristics (ζ0) include family income at age 16, arithmetic
test scores obtained at age 7, as well as mental and physical health conditions that are
recorded in the medical examinations.
During the post-schooling periods, the human capital bundle evolves according to
the following technology:
θt+1 = b0 +B1ζ1 +B2xt +B3θt + εt+1 (9)
where b0 is a 4-dimensional vector; B1 and B3 are 4 × 4 matrices; B2 is a 4 × 3
matrix; and εt+1 is a vector of idiosyncratic shocks on human capital production. The
initial observed characteristics (ζ1) include mental and physical health conditions that
are recorded in the medical examinations and two indicator variables for schooling
choices. Schooling choices, therefore, may affect not only human capital levels at labor
market entry but also the speed of human capita formation in the labor market. The
tasks performed in the labor market τt may affect future skills through “leaning-by-
doing”. Due to the task-specific nature of skills and health, cognitive tasks may affect
only cognitive skills and mental health, while manual tasks may affect only manual
tasks and physical health. Labor time (lt) may affect all the components of the human
19
capital bundle.
In my model, I allow skills and health to be cross-productive in shaping future skills.
In particular, cognitive skills and mental health interact in producing future cognitive
skills. Further, manual skills and physical health interact in producing future manual
skills. However, I assume that skills do not directly affect health productions.
It is widely documented that health outcomes are highly correlated with socio-
economic variables, such as education, income and wealth. Smith (2007) argues that
those correlations are primarily driven by the effects of education on health outcomes
and that financial resources do not have significant influences on health outcomes. My
specification of the production technology is motivated by his findings. In particular, I
allow education to affect both health endowments and the health formation technology.
While I allow family income at age 16 to affect health endowments at labor market
entry, I assume that earnings do not directly affect health formation. In my model,
however, earnings and health can be correlated as a result of individuals’ schooling and
labor market choices.
3.2 Model Solution and Estimation
The model described above yields the following Bellman equation for a post-schooling
age t ∈ {ts, · · · , T}:
Vt(σt, ηt) = maxxt,rt{ut(xt, rt, σt, ηt) + βEVt+1(σt+1, ηt+1)}
where σt = (θ′t, ζ′1, x′t−1, ν
′t, ω′t)′ denotes the vector of state variables. The state transi-
tions are constrained by the human capital formation technology. Since the dynamic
programming problem has a quadratic objective function and linear constraints, the
optimal post-schooling polities (x∗t , r∗t ) are linear in the state vector.16 This implies
that the post-schooling dynamic programming problem permits a linear state space
16Hansen and Sargent (2013) prove this statement for a generic class of linear-quadratic dynamicprogramming models.
20

representation. The optimal choice of schooling is given by
s∗ = arg maxs{u0(s, σ0) + βEVts(σts , ηts)} (10)
where ts denotes the age of entry into the labor force and σ0 = (ζ ′0, ν′0)′ is the initial
state vector.
As discussed above, optimal post-schooling policies have a closed-form expression.
In particular, optimal labor time policy (l∗t ) can be expressed as:
l∗t = Φltσt (11)
where Φlt is a matrix of composite model parameters that affect labor time decisions.
This provides a threshold crossing rule to link the model solutions and the data on
labor force participation, as in the framework of Heckman and MaCurdy (1980). In
particular, I assume the following mapping rule:
LFPt =
1 if l∗t ≥ 1
0 if l∗t < 1(12)
where LFPt denotes an indicator variable for labor force participation. In the NCDS
data, I observe how many months individuals worked full-time or part-time each year.
Similarly to Keane and Wolpin (1997), an individual is considered to have participated
in the labor force during the year if the individual was employed full-time or part-time
in at least two-thirds of months in the year.
Similar to the post-schooling policies, optimal health reporting policies (r∗t ), which
are specified as a M -dimensional vector, have the following linear relationship with the
state vector (σt):
r∗t = Φrtσt (13)
where Φrt is a matrix of composite model parameters that affect health reports. At
ages t ∈ {23, 33, 46, 50}, I observe binary health reports (Rt) for mental and physical
21

health conditions. The health indicators and latent health reports are linked by the
following mapping rule: for each m = 1, · · · ,M ,
Rmt =
1 if r∗m,t ≤ cm
0 if r∗m,t > cm
(14)
where cm is a threshold parameter.
For each post-schooling period the econometrician observes error-driven measure-
ments of labor income, time allocations, tasks and health status. The measurements in
the schooling periods consist of a set of observed characteristics and schooling choices. I
denote the vector of measurements obtained in the post-schooling age t ∈ {ts, · · · , T}
by yt and measurements obtained in the schooling period by y1. The data provide
measurements up to age Td ≤ T .17
To estimate the model parameters, it is convenient to work with the following
likelihood function:
f(y1, yts , · · · , yTd) = f(y1)f(yts , · · · , yTd|y1)
= f(y1)
Td∏t=ts
f(yt|y1:t−1) (15)
where y1:t−1 ≡ (y1, yts , · · · , yt−1) is the history of measurements up to period t − 1.
The conditional distribution f(yt|y1:t−1) of measurements is derived from the condi-
tional distribution of latent human capital bundles f(θt|y1:t−1). Provided that all the
distributions of the idiosyncratic errors and the measurement errors are Gaussian, the
conditional distribution of latent human capital bundle f(θt|y1:t−1) also follows a Gaus-
sian distribution so that it is characterized solely by its mean E(θt|y1:t−1) and variance
Var(θt|y1:t−1). The Kalman filter algorithm calculates these moments given the linear
state representation of the model and the mapping rules to link discrete measurements
and the latent factors of the model. I assume that labor earnings and tasks are ob-
17I set the exogenous retirement age as 60. The terminal values are set to be zero. The NCDSprovides data up to age 50. Measurements after age 50 are assumed to be missing at random.
22
servable only when individuals work fulltime. When an other type of measurement
is missing in the data, it is integrated out when constructing the likelihood. I com-
pute the initial likelihood f(y1) by simulating the schooling choice probabilities with
the model.18 Notice that the rest of the likelihood f(yts , · · · , yTd |y1) can be computed
without simulations, which substantially lessens computational costs. The model pa-
rameters are estimated by maximizing the constructed likelihood. Standard errors are
obtained from an inverted Hessian matrix.
3.3 Identification
Both skills and health are latent in the model. They do not have natural units. High
earnings can always be rationalized either by high returns to the human capital bundle
or by high levels of the human capital components. Normalizing the units of the
human capital bundle is, therefore, necessary to identify the model parameters from
the data. Following Yamaguchi (2012), this paper normalizes the skill distributions
at labour market entry to have zero means and unit variances. Similarly, I normalize
the health distributions at labour market entry to have zero means and unit variances.
Due to the discrete nature of measures for labour time and health, I need to further
restrict the distributions of idiosyncratic taste shocks for labor time allocation and the
distributions of health production shocks. I assume that those distributions follow a
standard Gaussian distribution. That is, I impose probit specifications both for latent
labor time allocation and health reports.
In the model, current tasks (τt) directly affect only the growth of task-specific skills
(θSt+1) and health (θHt+1). The effects of current tasks on health production can be
identified by observing how future health indicators (Rt+1) depends on the current
tasks. Similarly, the effects of current tasks on skill production can be identified by
18Schooling choices are simulated 5,000 times for each individual in the sample. I do not need tosimulate post-schooling choices for each simulation as the value functions at labour market entry Vtsare known once I fix the model parameters up to idiosyncratic shocks drawn at labour market entry.
23

observing how future earnings (et+1) vary with current tasks conditional on the health
reports. The own-productivity of health can be identified by the correlation between
current or past health indicators and the future health indicators. If current or past
health indicators affect future earnings conditional on future health indicators, this
must be because health affected production of skills. Once the own-productivity and
the cross-productivity of health are identified, the own-productivity of skills can be
pinned down by observing how past tasks (τt−1) affect future earnings (conditional on
future health indicators). In sum, the own-productivity and the cross-productivity of
health as well as the own-productivity of skills can be identified by observing correla-
tions between health indicators, earnings, and human capital shifters. By contrasting
those correlations across individuals based on labor time (lt), the model identifies the
effects of the labor time on skill formation and health formation. The human capital
production parameters during the schooling period can be identified by observing how
schooling choices affect the levels and evolutions of earnings and health indicators.
Further, the variance of skill shocks εt+1 are distinguished from the variance of
earnings shocks ηt+1 by observing how the variance of earnings vary depending on
the human capital shifters τt.19 The earnings equation parameters are identified from
mean labor earnings. The variance of earnings then provides tells the variance of
the measurement error of earnings. Finally, by observing sequential labor market
choices xt, the remaining preference parameters during the post-schooling periods can
be identified. Observed schooling choices inform schooling preferences.
4 Estimation Results
4.1 Parameter Estimates
Skill Formation Technologies Parameter estimates for the skill formation technol-
19Recall that I assume that the distribution of health shocks to have a bivariate standard Gaussiandistribution. The model, therefore, only identifies the relative size of skill shock variances.
24
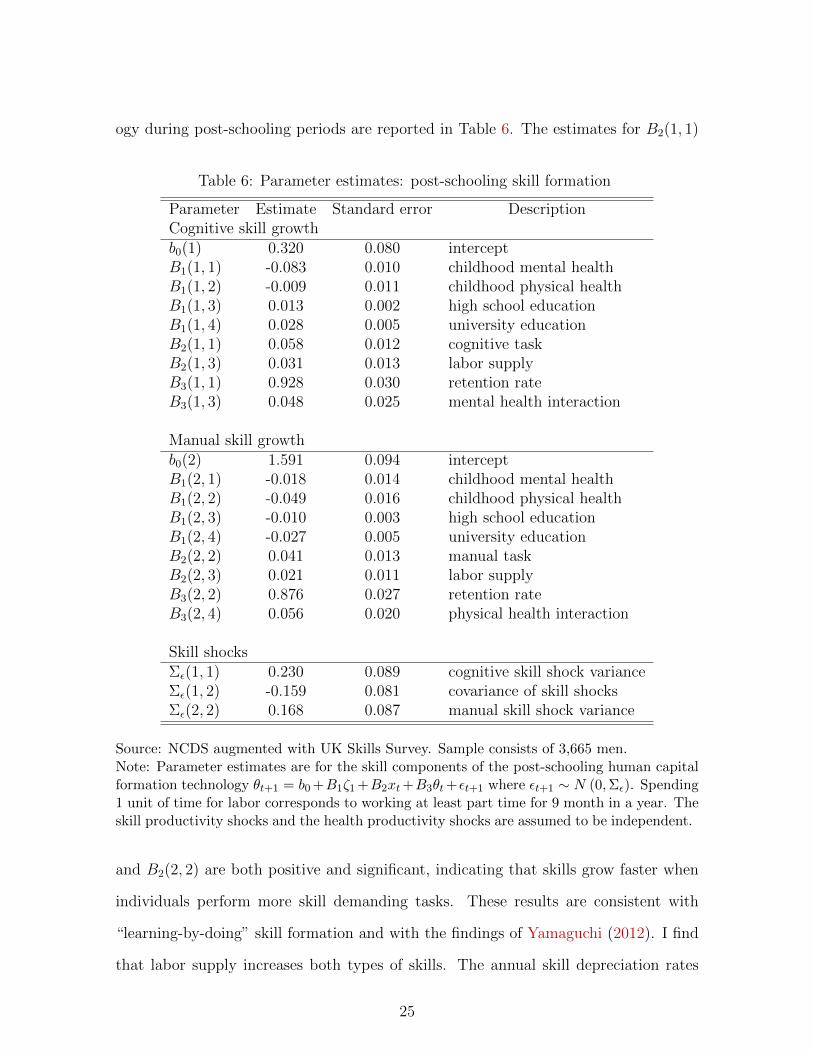
ogy during post-schooling periods are reported in Table 6. The estimates for B2(1, 1)
Table 6: Parameter estimates: post-schooling skill formation
Parameter Estimate Standard error DescriptionCognitive skill growthb0(1) 0.320 0.080 interceptB1(1, 1) -0.083 0.010 childhood mental healthB1(1, 2) -0.009 0.011 childhood physical healthB1(1, 3) 0.013 0.002 high school educationB1(1, 4) 0.028 0.005 university educationB2(1, 1) 0.058 0.012 cognitive taskB2(1, 3) 0.031 0.013 labor supplyB3(1, 1) 0.928 0.030 retention rateB3(1, 3) 0.048 0.025 mental health interaction
Manual skill growthb0(2) 1.591 0.094 interceptB1(2, 1) -0.018 0.014 childhood mental healthB1(2, 2) -0.049 0.016 childhood physical healthB1(2, 3) -0.010 0.003 high school educationB1(2, 4) -0.027 0.005 university educationB2(2, 2) 0.041 0.013 manual taskB2(2, 3) 0.021 0.011 labor supplyB3(2, 2) 0.876 0.027 retention rateB3(2, 4) 0.056 0.020 physical health interaction
Skill shocksΣε(1, 1) 0.230 0.089 cognitive skill shock varianceΣε(1, 2) -0.159 0.081 covariance of skill shocksΣε(2, 2) 0.168 0.087 manual skill shock variance
Source: NCDS augmented with UK Skills Survey. Sample consists of 3,665 men.Note: Parameter estimates are for the skill components of the post-schooling human capitalformation technology θt+1 = b0 +B1ζ1 +B2xt+B3θt+εt+1 where εt+1 ∼ N (0,Σε). Spending1 unit of time for labor corresponds to working at least part time for 9 month in a year. Theskill productivity shocks and the health productivity shocks are assumed to be independent.
and B2(2, 2) are both positive and significant, indicating that skills grow faster when
individuals perform more skill demanding tasks. These results are consistent with
“learning-by-doing” skill formation and with the findings of Yamaguchi (2012). I find
that labor supply increases both types of skills. The annual skill depreciation rates
25

for cognitive and manual skills are about 8% and 12%, respectively, which implies
that skills are highly persistent over time and that manual skills depreciate faster than
cognitive skills. Skill shocks are negatively correlated with a correlation coefficient of
-0.80. Mental health conditions during childhood are associated with slower growth
of cognitive skills. Physical health conditions during childhood induce slower manual
skill growth. Individuals with higher education experience faster cognitive skill growth,
while they experience slower manual skill growth. The cross productivities between
current skills and current health conditions are found to be positive and significant.
These result imply that skills and health are complementary in producing skills.
Table 7 shows parameter estimates for the skills production technology in the
schooling period. Childhood health conditions are again found to have negative ef-
fects on skills. Advanced schooling implies higher cognitive skills. Family income at
age 16 is positively associated with cognitive skill level and negatively associated with
manual skill level at labour market entry. Not surprisingly, math test scores at age 7
predicts higher cognitive skills and lower manual skills.
Health Formation Technologies Table 8 presents parameter estimates for the
health components of the post-schooling human capital formation technology. Esti-
mates suggest that childhood health conditions affect the technology of health for-
mation. In particular, the estimates imply that individuals with childhood health
conditions experience faster health deteriorations during the post-schooling periods.
Higher educated individuals experience slower health deteriorations. These results are
consistent with the findings of Conti et al. (2010). Working individuals experience
faster health deteriorations than non-working individuals. The negative effect of labor
supply is found to be larger for physical health than for mental health. These effects
help me to explain deteriorating health patterns over the lifecycle. The estimates in-
dicate that individuals performing high levels of manual tasks tend to depreciate their
26
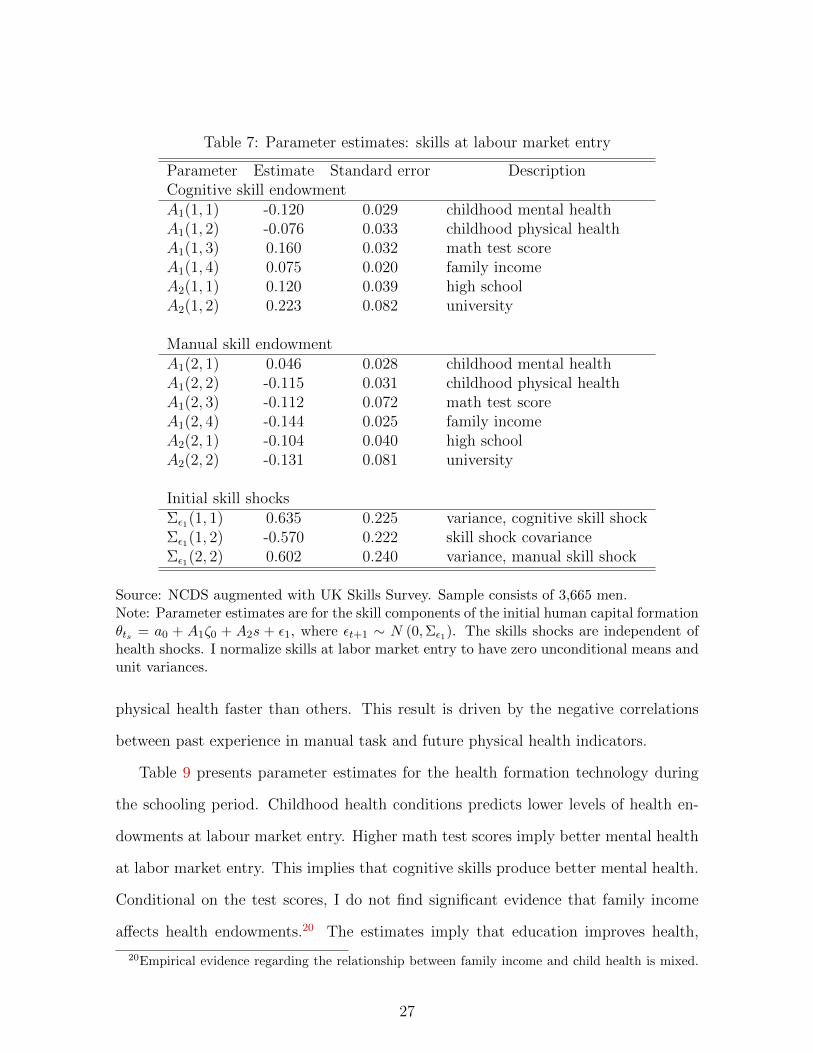
Table 7: Parameter estimates: skills at labour market entry
Parameter Estimate Standard error DescriptionCognitive skill endowmentA1(1, 1) -0.120 0.029 childhood mental healthA1(1, 2) -0.076 0.033 childhood physical healthA1(1, 3) 0.160 0.032 math test scoreA1(1, 4) 0.075 0.020 family incomeA2(1, 1) 0.120 0.039 high schoolA2(1, 2) 0.223 0.082 university
Manual skill endowmentA1(2, 1) 0.046 0.028 childhood mental healthA1(2, 2) -0.115 0.031 childhood physical healthA1(2, 3) -0.112 0.072 math test scoreA1(2, 4) -0.144 0.025 family incomeA2(2, 1) -0.104 0.040 high schoolA2(2, 2) -0.131 0.081 university
Initial skill shocksΣε1(1, 1) 0.635 0.225 variance, cognitive skill shockΣε1(1, 2) -0.570 0.222 skill shock covarianceΣε1(2, 2) 0.602 0.240 variance, manual skill shock
Source: NCDS augmented with UK Skills Survey. Sample consists of 3,665 men.Note: Parameter estimates are for the skill components of the initial human capital formationθts = a0 + A1ζ0 + A2s + ε1, where εt+1 ∼ N (0,Σε1). The skills shocks are independent ofhealth shocks. I normalize skills at labor market entry to have zero unconditional means andunit variances.
physical health faster than others. This result is driven by the negative correlations
between past experience in manual task and future physical health indicators.
Table 9 presents parameter estimates for the health formation technology during
the schooling period. Childhood health conditions predicts lower levels of health en-
dowments at labour market entry. Higher math test scores imply better mental health
at labor market entry. This implies that cognitive skills produce better mental health.
Conditional on the test scores, I do not find significant evidence that family income
affects health endowments.20 The estimates imply that education improves health,
20Empirical evidence regarding the relationship between family income and child health is mixed.
27
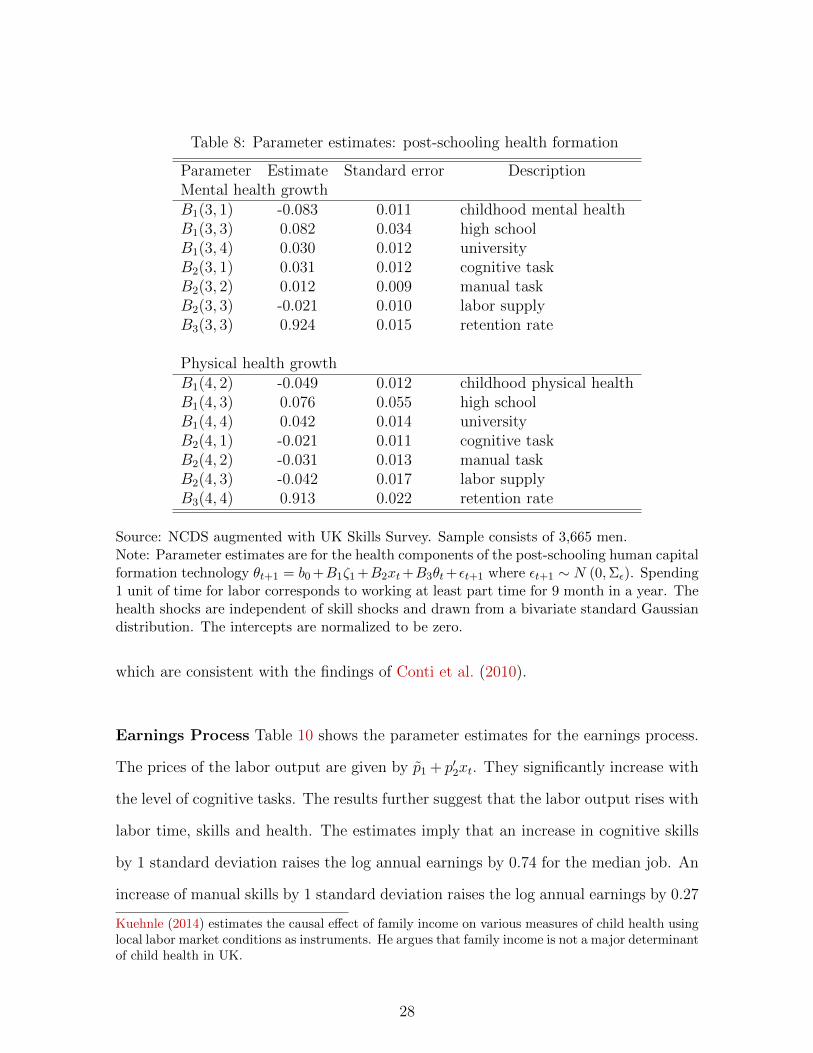
Table 8: Parameter estimates: post-schooling health formation
Parameter Estimate Standard error DescriptionMental health growthB1(3, 1) -0.083 0.011 childhood mental healthB1(3, 3) 0.082 0.034 high schoolB1(3, 4) 0.030 0.012 universityB2(3, 1) 0.031 0.012 cognitive taskB2(3, 2) 0.012 0.009 manual taskB2(3, 3) -0.021 0.010 labor supplyB3(3, 3) 0.924 0.015 retention rate
Physical health growthB1(4, 2) -0.049 0.012 childhood physical healthB1(4, 3) 0.076 0.055 high schoolB1(4, 4) 0.042 0.014 universityB2(4, 1) -0.021 0.011 cognitive taskB2(4, 2) -0.031 0.013 manual taskB2(4, 3) -0.042 0.017 labor supplyB3(4, 4) 0.913 0.022 retention rate
Source: NCDS augmented with UK Skills Survey. Sample consists of 3,665 men.Note: Parameter estimates are for the health components of the post-schooling human capitalformation technology θt+1 = b0 +B1ζ1 +B2xt+B3θt+εt+1 where εt+1 ∼ N (0,Σε). Spending1 unit of time for labor corresponds to working at least part time for 9 month in a year. Thehealth shocks are independent of skill shocks and drawn from a bivariate standard Gaussiandistribution. The intercepts are normalized to be zero.
which are consistent with the findings of Conti et al. (2010).
Earnings Process Table 10 shows the parameter estimates for the earnings process.
The prices of the labor output are given by p̃1 + p′2xt. They significantly increase with
the level of cognitive tasks. The results further suggest that the labor output rises with
labor time, skills and health. The estimates imply that an increase in cognitive skills
by 1 standard deviation raises the log annual earnings by 0.74 for the median job. An
increase of manual skills by 1 standard deviation raises the log annual earnings by 0.27
Kuehnle (2014) estimates the causal effect of family income on various measures of child health usinglocal labor market conditions as instruments. He argues that family income is not a major determinantof child health in UK.
28

Table 9: Parameter estimates: health at labor market entry
Parameter Estimate Standard error DescriptionMental health endowmentA1(3, 1) -0.280 0.048 childhood mental healthA1(3, 3) 0.663 0.065 math test scoresA1(3, 4) -0.005 0.057 family incomeA2(3, 1) 0.111 0.040 high schoolA2(3, 2) 0.168 0.058 university
Physical health endowmentA1(4, 2) -0.264 0.057 childhood physical healthA1(4, 3) 0.228 0.064 math test scoresA1(4, 4) -0.023 0.057 family incomeA2(4, 1) -0.055 0.040 high schoolA2(4, 2) 0.095 0.057 university
Source: NCDS augmented with UK Skills Survey. Sample consists of 3,665 men.Note: Parameter estimates are for the health components of the initial human capital θts =a0+A1ζ0+A2s+ε1, where εt+1 ∼ N (0,Σε1). The health shocks are independent of skill shocksand drawn from a bivariate standard Gaussian distribution. The intercepts are normalizedto be zero. Both math test scores and family income are measured by quantile ranks.
for the median job. These estimates indicate that differences in returns to skills are
sizeable. The estimates imply that an increase in mental health by 1 standard devia-
tion raises the log annual earnings by 0.24 for the median job. An increase of manual
skills by 1 standard deviation raises the log annual earnings by 0.27 for the median
job. The corresponding number of physical health is 0.11. Thus, I find that returns to
skills are far greater than returns to health. These results imply that younger individ-
uals have stronger work incentives to accumulate skills. The model predicts that labor
supply declines as individuals get older since the opportunity costs for non-working fall.
Preferences for Work and Schooling Table 11 reports the parameter estimates
for work preferences. Overall, individuals tend to prefer to perform higher cognitive
tasks and lower manual tasks. More educated individuals have stronger preferences to
perform higher cognitive tasks and lower manual tasks. Mental health conditions are
29
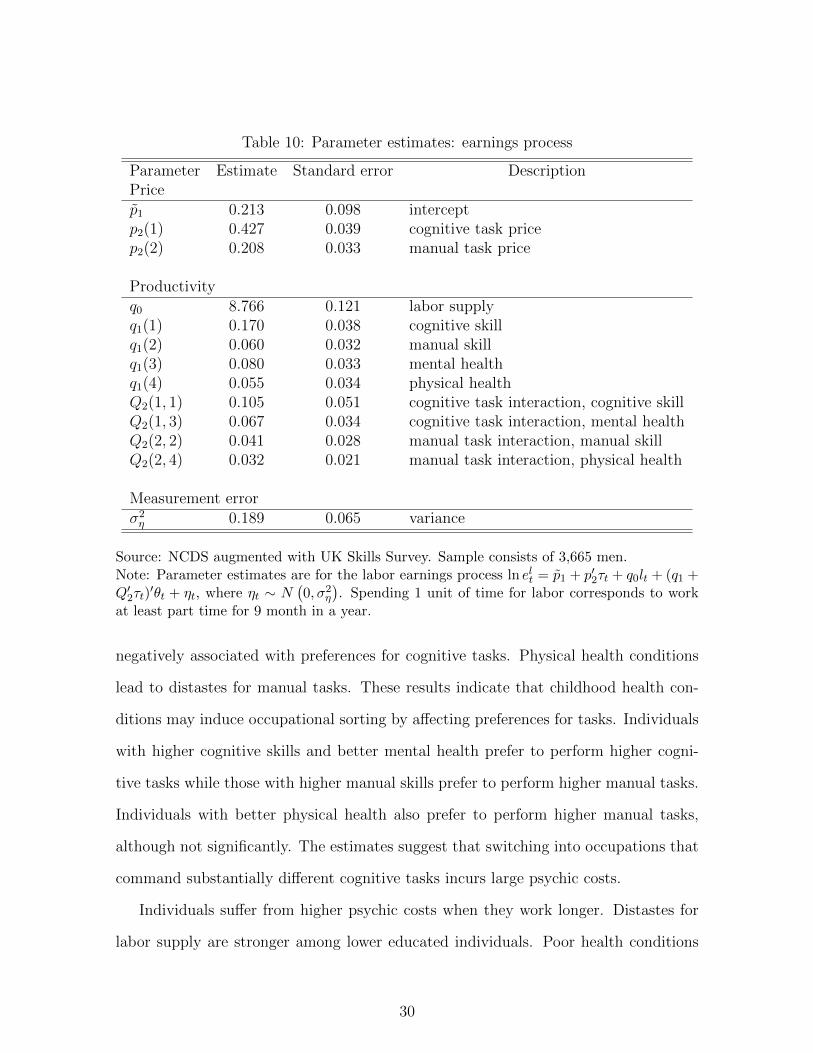
Table 10: Parameter estimates: earnings process
Parameter Estimate Standard error DescriptionPricep̃1 0.213 0.098 interceptp2(1) 0.427 0.039 cognitive task pricep2(2) 0.208 0.033 manual task price
Productivityq0 8.766 0.121 labor supplyq1(1) 0.170 0.038 cognitive skillq1(2) 0.060 0.032 manual skillq1(3) 0.080 0.033 mental healthq1(4) 0.055 0.034 physical healthQ2(1, 1) 0.105 0.051 cognitive task interaction, cognitive skillQ2(1, 3) 0.067 0.034 cognitive task interaction, mental healthQ2(2, 2) 0.041 0.028 manual task interaction, manual skillQ2(2, 4) 0.032 0.021 manual task interaction, physical health
Measurement errorσ2η 0.189 0.065 variance
Source: NCDS augmented with UK Skills Survey. Sample consists of 3,665 men.Note: Parameter estimates are for the labor earnings process ln elt = p̃1 + p′2τt + q0lt + (q1 +Q′2τt)
′θt + ηt, where ηt ∼ N(0, σ2η
). Spending 1 unit of time for labor corresponds to work
at least part time for 9 month in a year.
negatively associated with preferences for cognitive tasks. Physical health conditions
lead to distastes for manual tasks. These results indicate that childhood health con-
ditions may induce occupational sorting by affecting preferences for tasks. Individuals
with higher cognitive skills and better mental health prefer to perform higher cogni-
tive tasks while those with higher manual skills prefer to perform higher manual tasks.
Individuals with better physical health also prefer to perform higher manual tasks,
although not significantly. The estimates suggest that switching into occupations that
command substantially different cognitive tasks incurs large psychic costs.
Individuals suffer from higher psychic costs when they work longer. Distastes for
labor supply are stronger among lower educated individuals. Poor health conditions
30

Table 11: Parameter estimates: work preferences
Parameter Estimate Standard error DescriptionCognitive taskg0(1) 0.283 0.179 interceptG2(1, 1) -0.082 0.028 childhood mental healthG2(1, 2) -0.032 0.021 childhood physical healthG2(1, 3) 0.153 0.004 high schoolG2(1, 4) 0.323 0.011 universityG3(1, 1) 0.054 0.026 cognitive skillG3(1, 3) 0.053 0.024 mental healthG4(1, 1) -24.205 2.430 switching cost
Manual taskg0(2) -0.543 0.206 interceptG2(2, 1) 0.058 0.026 childhood mental healthG2(2, 2) -0.078 0.023 childhood physical healthG2(2, 3) -0.171 0.046 high schoolG2(2, 4) -0.239 0.028 universityG3(2, 2) 0.152 0.026 manual skillG3(2, 4) 0.039 0.028 physical healthG4(2, 2) -0.194 0.054 switching cost
Labor supplyg0(3) -0.354 0.231 interceptG2(3, 1) -0.074 0.029 childhood mental healthG2(3, 2) -0.055 0.026 childhood physical healthG2(3, 3) 0.125 0.046 high schoolG2(3, 4) 0.139 0.068 universityG3(3, 1) 0.029 0.009 cognitive skillG3(3, 2) -0.012 0.008 manual skillG3(3, 3) 0.171 0.066 mental healthG3(3, 4) 0.146 0.068 physical healthG4(3, 3) -14.934 1.516 switching cost
Source: NCDS augmented with UK Skills Survey. Sample consists of 3,665 men.Note: Parameter estimates are for the work preferences gt ≡ (g′0xt + x′tG1xt) + (G2ζ1 +G3θt)
′xt + (xt − xt−1)′G4(xt − xt−1) + ν ′txt where νt ∼ N (0,Σν). I normalize G1 to be thenegative of an identity matrix. Spending 1 unit of time for labor corresponds to work at leastpart time for 9 month in a year.
during childhood and adulthood are associated with distastes for labor supply. Individ-
uals with higher cognitive skills prefer to work more while those with higher manual
31
skills prefer to work less. The estimates suggest that changing time allocation over
time also incurs large psychic costs.
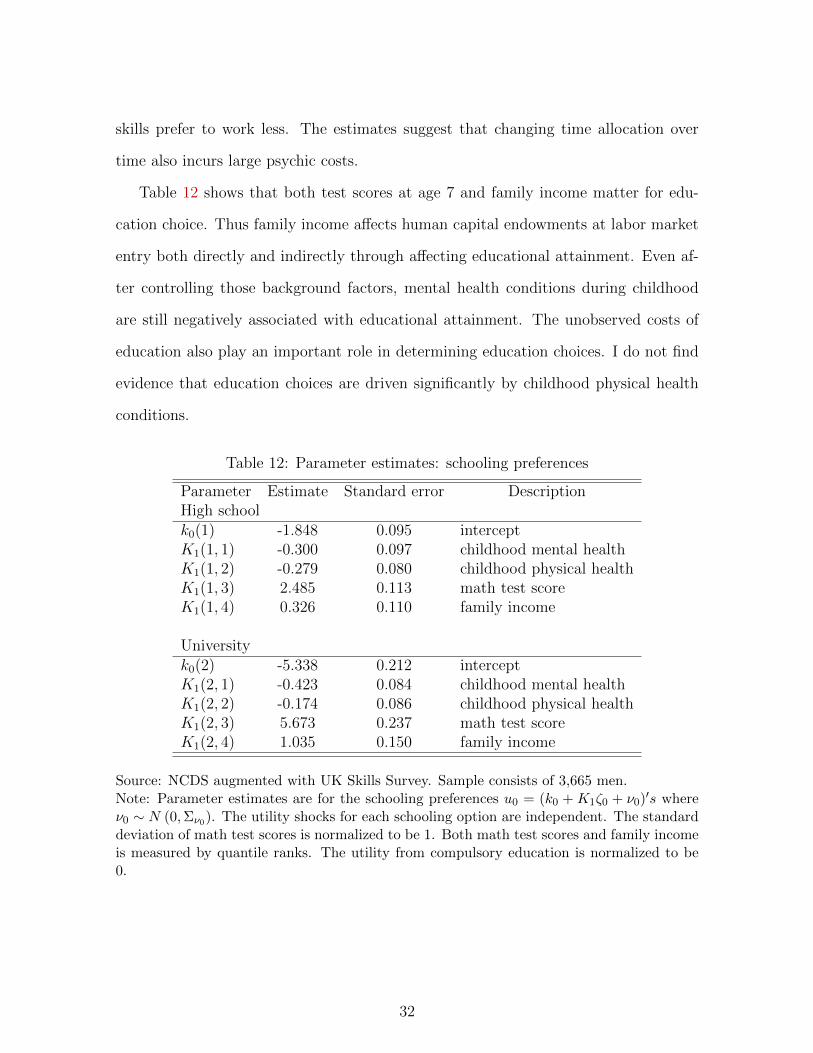
Table 12 shows that both test scores at age 7 and family income matter for edu-
cation choice. Thus family income affects human capital endowments at labor market
entry both directly and indirectly through affecting educational attainment. Even af-
ter controlling those background factors, mental health conditions during childhood
are still negatively associated with educational attainment. The unobserved costs of
education also play an important role in determining education choices. I do not find
evidence that education choices are driven significantly by childhood physical health
conditions.
Table 12: Parameter estimates: schooling preferences
Parameter Estimate Standard error DescriptionHigh schoolk0(1) -1.848 0.095 interceptK1(1, 1) -0.300 0.097 childhood mental healthK1(1, 2) -0.279 0.080 childhood physical healthK1(1, 3) 2.485 0.113 math test scoreK1(1, 4) 0.326 0.110 family income
Universityk0(2) -5.338 0.212 interceptK1(2, 1) -0.423 0.084 childhood mental healthK1(2, 2) -0.174 0.086 childhood physical healthK1(2, 3) 5.673 0.237 math test scoreK1(2, 4) 1.035 0.150 family income
Source: NCDS augmented with UK Skills Survey. Sample consists of 3,665 men.Note: Parameter estimates are for the schooling preferences u0 = (k0 + K1ζ0 + ν0)
′s whereν0 ∼ N (0,Σν0). The utility shocks for each schooling option are independent. The standarddeviation of math test scores is normalized to be 1. Both math test scores and family incomeis measured by quantile ranks. The utility from compulsory education is normalized to be0.
32

4.2 Model Fit
To assess the performance of the model, I first examine its ability to reproduce key
empirical patterns observed in the sample. To predict lfiecycle outcomes using the
estimated model, I simulate each individual in the NCDS sample 1,000 times. If
observations are missing in a particular year, the corresponding simulation outcomes
of the year are treated as missing.
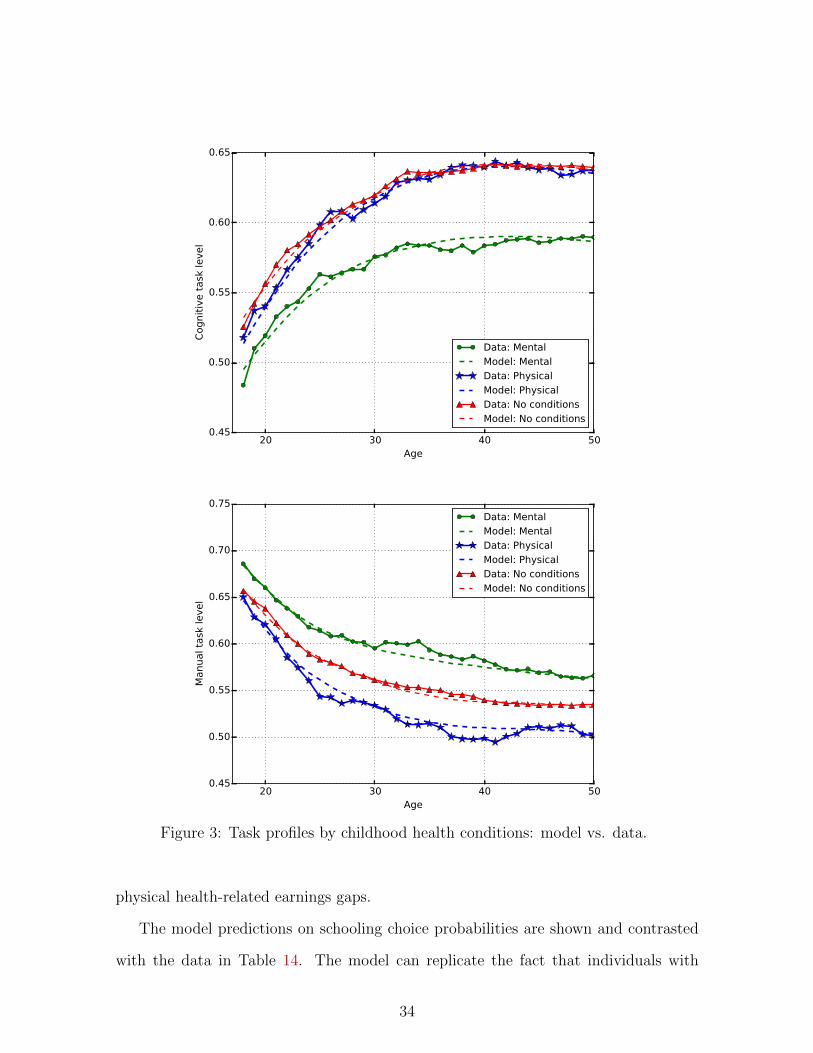
Figure 3 compares the observed and predicted task profiles for each childhood
health group. The model can replicate the occupation sorting patterns associated with
childhood health conditions. Overall, the predicted profiles are reasonably close to the
observed profiles from the data. The task selection patterns are driven both by returns
to the human capital bundle and by tastes. In particular, individuals with childhood
mental health conditions sort into lower cognitive tasks since they have lower cognitive
skill endowment and stronger distastes for higher cognitive tasks.
The lifecycle profiles of fulltime employment are presented in Figure 4 for each
health group. The declining profiles represent falling opportunity costs of non-labor
activity. Monetary returns to skills are substantially higher than returns to health
capitals. Therefore, individuals allocate more time for labor to accumulate their skills
at younger ages while their health capitals depreciate as a result. The gaps in employ-
ment across the health groups are driven by the differences in tastes, health status,
and opportunity costs of non-labor activity.
Table 13 presents the model predictions regarding annual labor earnings at ages
23, 33 and 42. The model can replicate the increasing earnings profiles for each health
group. The earnings growth are driven mainly by skill accumulation in the model.
The model slightly over-predicts earnings at age 23 and under-predicts earnings at
later ages. The magnitude of the deviations amount to at most 600 pounds a year.
Moreover, the model is successful in reproducing the increasing pattern over time
for the mental health-related earnings gaps as well as the decreasing pattern for the
33
20 30 40 50Age
0.45
0.50
0.55
0.60
0.65
Cognit
ive t
ask
level
Data: Mental
Model: Mental
Data: Physical
Model: Physical
Data: No conditions
Model: No conditions
20 30 40 50Age
0.45
0.50
0.55
0.60
0.65
0.70
0.75
Manual ta
sk level
Data: Mental
Model: Mental
Data: Physical
Model: Physical
Data: No conditions
Model: No conditions
Figure 3: Task profiles by childhood health conditions: model vs. data.
physical health-related earnings gaps.
The model predictions on schooling choice probabilities are shown and contrasted
with the data in Table 14. The model can replicate the fact that individuals with
34

20 30 40 50Age
0.80
0.85
0.90
0.95
1.00
Full-
tim
e e
mplo
ym
ent
rate
Data: Mental
Model: Mental
Data: Physical
Model: Physical
Data: No conditions
Model: No conditions
Figure 4: Fulltime employment rate by childhood health conditions: model vs. data.
Table 13: Model fit regading average log annual labor earnings
Age 23 Age 33 Age 42Childhood health conditions Data Model Data Model Data ModelNo conditions 9.402 9.423 9.841 9.815 10.033 9.994Mental 9.313 9.352 9.717 9.701 9.900 9.869
[-0.089] [-0.071] [-0.124] [-0.114] [-0.133] [-0.125]Physical 9.281 9.309 9.777 9.744 9.984 9.954
[-0.121] [-0.113] [-0.064] [-0.071] [-0.049] [-0.040]
Note: The numbers in brackets indicate log annual earnings gaps between individualswith childhood health conditions and their healthy counterparts.
childhood mental health conditions tend not to pursue advanced schooling options.
This is because both of higher psychic costs for schooling and lower returns to schooling
among them. Overall, the model can fit the schooling choice patterns fairly well. The
model, however, slightly over-predict the probability to take the “high-school” option
among individuals with childhood physical conditions.
35

Table 14: Fractions of individuals selecting high school or university: data vs. model
High School UniversityChildhood health conditions Data Model Data ModelNo conditions 0.352 0.361 0.160 0.169Mental 0.251 0.252 0.075 0.078Physical 0.293 0.314 0.164 0.161
Note: Author’s estimates using the NCDS and the UK Skills Survey.
5 Counterfactual Experiments
Childhood health conditions may affect human capital endowments, speed of human
capital formation, and tastes. What are the sources of the earnings gaps associated
with childhood health conditions? Are they driven mainly by the gaps in skill en-
dowments, or are they due to the differences in skill formation? Are they because
childhood health conditions lead to poorer health conditions during the adulthood?
Do they reflect taste-based earnings differentials? To evaluate the importance of alter-
native channels through which childhood health conditions affect earnings, the model
is simulated under the restrictions that individuals with different childhood health con-
ditions are homogeneous in terms of (1) preferences, (2) skill formation, and (3) health
formation. When eliminating heterogeneity in preferences, I assume that individuals
with childhood health conditions have the same preferences with their healthy coun-
terparts regarding schooling choices, time allocation, and task selections. I eliminate
heterogeneity in skill formation by imposing that (a) the distributions of test scores
and family income are degenerate at their means and that (b) childhood health condi-
tions do not directly affect skill formation both during the schooling period and during
the post-schooling periods. I eliminate heterogeneity in health formation similarly.
The results from the counter-factual experiments including the baseline model pre-
dictions are summarized in Table 15. Those results indicate that the difference in skill
formation is the most important factor to account for the mental health-related earn-
36

Table 15: Counterfactual experiments to eliminate channels through which childhoodhealth affects earnings
Mental health-related earnings gapsAge Data Benchmark Preferences Skill formation Health formation23 -0.089 -0.071 -0.058 (17.7%) -0.028 (60.0%) -0.062 (12.7%)33 -0.124 -0.114 -0.081 (28.9%) -0.045 (60.5%) -0.091 (20.1%)42 -0.133 -0.125 -0.087 (30.1%) -0.044 (65.1%) -0.095 (24.4%)Physical health-related earnings gapsAge Data Benchmark Preferences Skill formation Health formation23 -0.121 -0.113 -0.092 (18.8%) -0.047 (58.5%) -0.097 (14.5%)33 -0.064 -0.071 -0.056 (20.5%) -0.048 (31.8%) -0.056 (20.7%)42 -0.049 -0.040 -0.028 (31.0%) -0.029 (28.0%) -0.026 (34.3%)
Note: Author’s estimates using the National Child Development Study with task datafrom UK Skills Survey. The numbers in parentheses stand for the fractions of health-related earnings gaps explained by each channel. Contributions of the alternativechannels do not necessarily sum up to 100%.
ings gaps throughout the lifecycle. The skill channel accounts for about 60%-65% of
the earnings gaps due to childhood mental health conditions. The health channel plays
less significant role especially at younger ages. The contributions of the health channel
increase as individuals get older. This is primarily because health capitals gradually
depreciate over the lifecycle. At age 42, the health channel can account for about one
quarter of the observed health-related earnings gaps. Differences in preferences play a
significant role as well: they can explain about one third of the earnings gap at age 42.
The health channel and the taste channel are equally as important to explain the
observed earnings gaps due to childhood physical health conditions. These two channels
account for about one-third of the earnings gap at age 42, respectively. Both the data
and the model show that the earnings gaps due to childhood physical health conditions
lessen over the lifecycle. The experiments reveal that this pattern is driven mainly by
the declining influences of the skill channel.
I conduct three additional counterfatual experiments to further decompose the skill
formation channel into three components: (1) initial endowments, (2) skill formation
37

during the schooling period, and (3) post-schooling skill formation. Table 16 summa-
rize the results. The differences in endowments across the health groups, which are
Table 16: Decomposion of the skill formation channel
Mental health-related earnings gapsAge Data Benchmark Endowment Schooling Post-schooling23 -0.089 -0.071 -0.047 (33.8%) -0.054 (23.9%) -0.061 (14.1%)33 -0.124 -0.114 -0.082 (28.1%) -0.092 (19.2%) -0.089 (21.9%)42 -0.133 -0.125 -0.096 (23.2%) -0.103 (17.6%) -0.081 (35.2%)Physical health-related earnings gapsAge Data Benchmark Endowment Schooling Post-schooling23 -0.121 -0.113 -0.061 (46.1%) -0.106 (6.3%) -0.107 (5.5%)33 -0.064 -0.071 -0.056 (20.6%) -0.067 (5.6%) -0.066 (7.1%)42 -0.049 -0.040 -0.034 (15.5%) -0.038 (5.1%) -0.037 (8.5%)
Note: Author’s estimates using the National Child Development Study with task datafrom UK Skills Survey. The numbers in parentheses stand for the fractions of health-related earnings gaps explained by each channel. Contributions of the alternativechannels do not necessarily sum up to 100%.
measured by test scores and family income, play the greatest role in accounting for
earnings gaps at younger ages. The effect of the differences in endowments dimin-
ishes over time. Interestingly, the differences in endowments account for most of the
skill effects for the group with childhood physical health conditions. This implies that
the observed earnings gaps associated with childhood physical health conditions are
driven mainly by the correlation between physical health status and human capital
endowments. Skill formation during the schooling period is also an important factor
especially for mental health. The differences in post-schooling skill formation play an
increasingly important role as individual get older. The heterogeneity in cognitive skill
formation accounts for about one third of of the earnings gap at age 42. Further, the
experiments demonstrate that the differences in post-schooling skill formation are the
main driving forces behind the increasing pattern of the mental-health related earnings
gaps.
38

6 Conclusion
While previous research has emphasized the importance of childhood health conditions
in shaping lifetime earnings, little is known about the channels through which childhood
health conditions affect earnings. Childhood health conditions may affect earnings by
restricting skill formation, or by causing poor health status in adulthood. Juxtaposing
the alternative channels is an important step towards understanding effective policies
to alleviate the negative effects of health adversity at earlier life stages.
This paper develops and estimates a lifecycle model that allows multiple channels
through which childhood health conditions may affect future earnings. My framework
embeds a multi-dimensional human capital formation technology into a dynamic model
of schooling, labor supply and occupation choices. The model is estimated based on a
longitudinal cohort panel survey that provides results of medical examinations during
the childhood.
Many salient features of the data are closely reproduced by the model, including the
occupation sorting patterns, employment rates, and earnings over the lifecycle. The
parameter estimates indicate that childhood health conditions affect formation of skills
and health as well as preferences for working and schooling. I then use the estimated
model to study the relative importance of the alternative channels in accounting for
the observed earnings gaps.
My results show that the effect of childhood health on skill formation plays the
greatest role in accounting for the observed earnings losses among individuals who had
childhood mental health conditions. About two-thirds of the earnings losses associ-
ated with childhood mental health conditions can be explained by the skill channel.
The differences in skill endowments between the individuals with childhood mental
health conditions and their healthy counterparts are the main driving forces behind
the earnings gaps at younger ages while the differences in skill growth become more
important as individuals get older. The skill channel is also the main factor behind
39

the earnings losses at younger ages among those with childhood physical health con-
ditions. However, this is primary because of the gaps in endowments and not because
of the differences in skill growth. Further, I find that differences in tastes and health
formation also play significant roles for both types of health conditions, especially at
older ages.
These results imply that skills and good health are complementary in producing
skills over the lifecycle. As the importance of cognitive skills grow in determining wages
in the society, health conditions that restrict cognitive skill formation may become
more detrimental for success in the labor market. This paper studied a sample of
cohorts who experienced childhood in 1960s and 1970s. Investigating the skill-health
complementarities among more recent cohorts is an important research agenda.
40
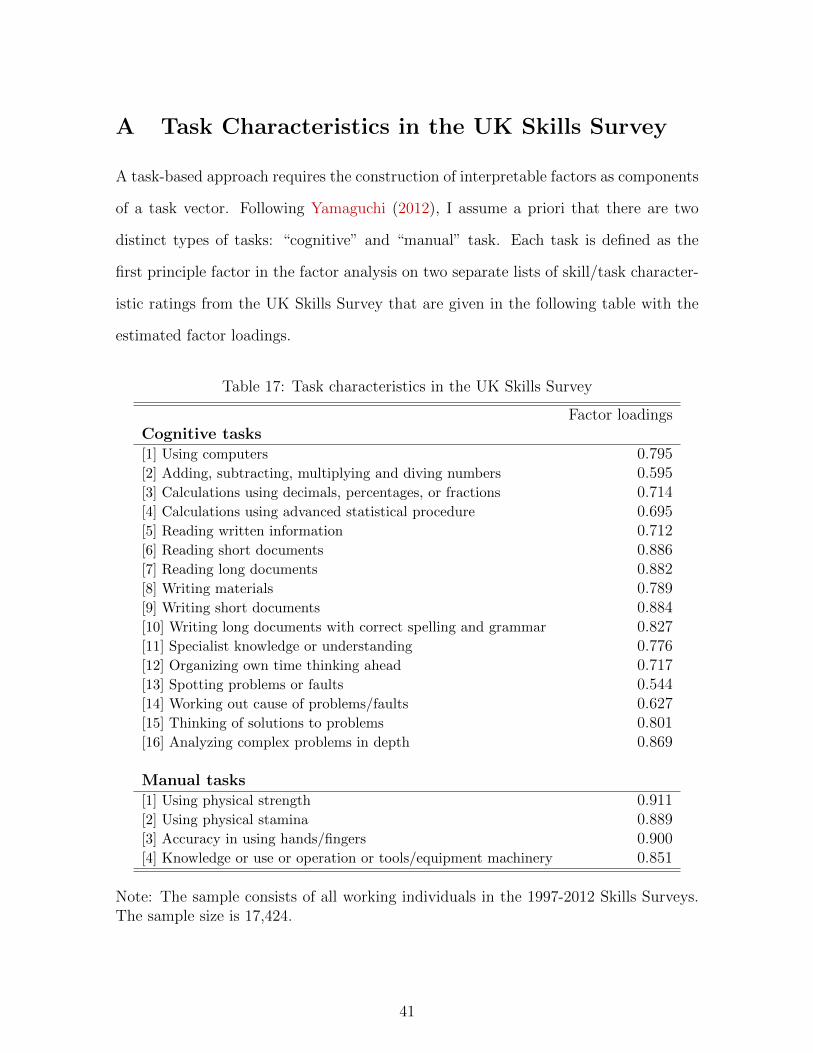
A Task Characteristics in the UK Skills Survey
A task-based approach requires the construction of interpretable factors as components
of a task vector. Following Yamaguchi (2012), I assume a priori that there are two
distinct types of tasks: “cognitive” and “manual” task. Each task is defined as the
first principle factor in the factor analysis on two separate lists of skill/task character-
istic ratings from the UK Skills Survey that are given in the following table with the
estimated factor loadings.
Table 17: Task characteristics in the UK Skills Survey
Factor loadingsCognitive tasks[1] Using computers 0.795[2] Adding, subtracting, multiplying and diving numbers 0.595[3] Calculations using decimals, percentages, or fractions 0.714[4] Calculations using advanced statistical procedure 0.695[5] Reading written information 0.712[6] Reading short documents 0.886[7] Reading long documents 0.882[8] Writing materials 0.789[9] Writing short documents 0.884[10] Writing long documents with correct spelling and grammar 0.827[11] Specialist knowledge or understanding 0.776[12] Organizing own time thinking ahead 0.717[13] Spotting problems or faults 0.544[14] Working out cause of problems/faults 0.627[15] Thinking of solutions to problems 0.801[16] Analyzing complex problems in depth 0.869
Manual tasks[1] Using physical strength 0.911[2] Using physical stamina 0.889[3] Accuracy in using hands/fingers 0.900[4] Knowledge or use or operation or tools/equipment machinery 0.851
Note: The sample consists of all working individuals in the 1997-2012 Skills Surveys.The sample size is 17,424.
41

B Health Measures
B.1 Childhood Health Measures
The National Child Development Study (NCDS) conducts medical examinations at
ages 7 and 16 to diagnose major health conditions during childhood.
Table 18: Prevalence of childhood health conditions
Non-handicapping HandicappingMental health conditions:EBD (Age 7) 0.035 0.011EBD (Age 16) 0.025 0.014Speech disorders (Age 7) 0.013 0.024Speech disorders (Age 16) 0.042 0.006Total (Age 7 or 16) 0.098 0.049
Physical health conditions:Nervous system disorders (Age 7) 0.050 0.002Nervous system disorders (Age 16) 0.014 0.002Heart problems (Age 7) 0.029 0.000Heart problems (Age 16) 0.023 0.000Respiratory system disorders (Age 7) 0.079 0.011Respiratory system disorders (Age 16) 0.039 0.006Limb defects (Age 7) 0.065 0.008Limb defects (Age 16) 0.021 0.017Hearing losses (Age 7) 0.061 0.004Hearing losses (Age 16) 0.036 0.011Vision losses (Age 7) 0.137 0.004Vision losses (Age 16) 0.086 0.058Other physical conditions (Age 7) 0.004 0.005Other physical conditions (Age 16) 0.030 0.008Total (Age 7 or 16) 0.477 0.114
Source: The NCDS. The sample consists of 3,665 men.
Following the 10th revision of the International Statistical Classification of Diseases
(ICD-10), the health conditions are categorized either as “mental” or “physical”. Men-
tal health conditions include emotional and behavioural difficulties/disorders (EBD)
and speech disorders.21 EBDs refer to a wide range of disorders, including internalizing
21From 1930s through to early 1980s, “maladjustment” was the term in use to describe children who
42
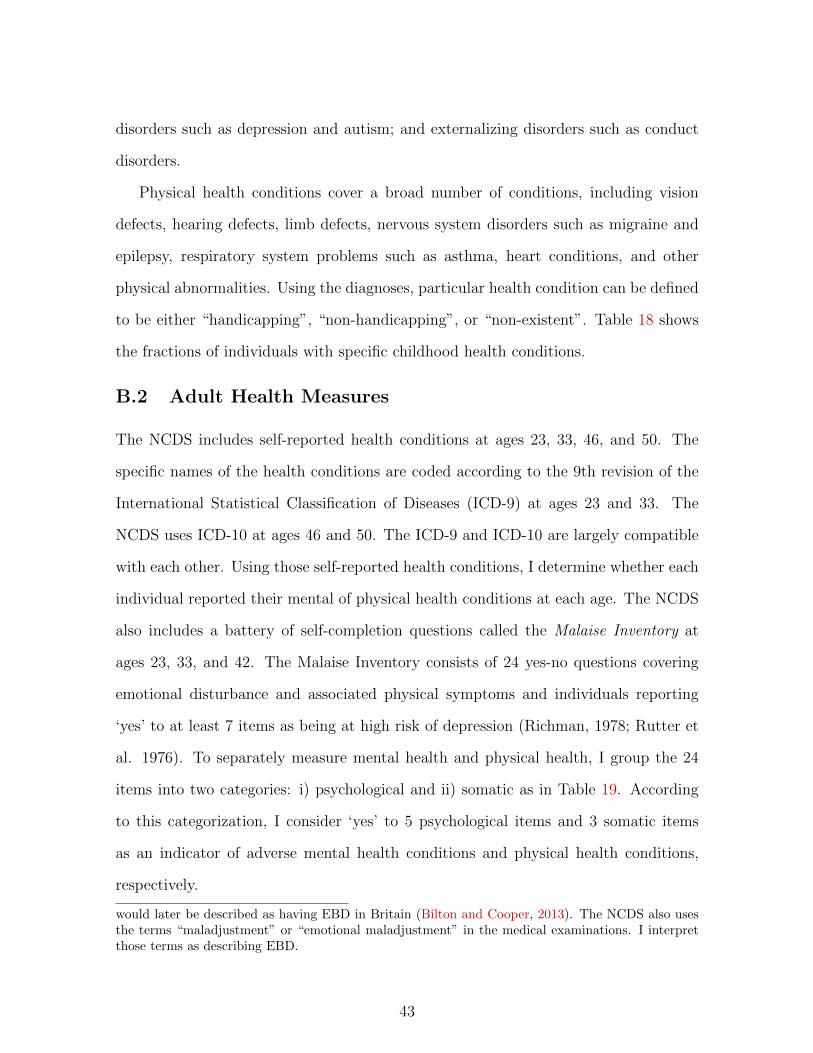
disorders such as depression and autism; and externalizing disorders such as conduct
disorders.
Physical health conditions cover a broad number of conditions, including vision
defects, hearing defects, limb defects, nervous system disorders such as migraine and
epilepsy, respiratory system problems such as asthma, heart conditions, and other
physical abnormalities. Using the diagnoses, particular health condition can be defined
to be either “handicapping”, “non-handicapping”, or “non-existent”. Table 18 shows
the fractions of individuals with specific childhood health conditions.
B.2 Adult Health Measures
The NCDS includes self-reported health conditions at ages 23, 33, 46, and 50. The
specific names of the health conditions are coded according to the 9th revision of the
International Statistical Classification of Diseases (ICD-9) at ages 23 and 33. The
NCDS uses ICD-10 at ages 46 and 50. The ICD-9 and ICD-10 are largely compatible
with each other. Using those self-reported health conditions, I determine whether each
individual reported their mental of physical health conditions at each age. The NCDS
also includes a battery of self-completion questions called the Malaise Inventory at
ages 23, 33, and 42. The Malaise Inventory consists of 24 yes-no questions covering
emotional disturbance and associated physical symptoms and individuals reporting
‘yes’ to at least 7 items as being at high risk of depression (Richman, 1978; Rutter et
al. 1976). To separately measure mental health and physical health, I group the 24
items into two categories: i) psychological and ii) somatic as in Table 19. According
to this categorization, I consider ‘yes’ to 5 psychological items and 3 somatic items
as an indicator of adverse mental health conditions and physical health conditions,
respectively.
would later be described as having EBD in Britain (Bilton and Cooper, 2013). The NCDS also usesthe terms “maladjustment” or “emotional maladjustment” in the medical examinations. I interpretthose terms as describing EBD.
43

Table 19: Malaise Inventory items
Psychological items[1] Do you feel tired most of the time?
[2] Do you often feel miserable or depressed?
[3] Do you often get worried about things?
[4] Do you usually have great difficulty in falling or staying asleep?
[5] Do you usually wake unnecessarily early in the morning?
[6] Do you wear yourself out worrying about your health?
[7] Do you often get into a violent rage?
[8] Do people often annoy and irritate you?
[9] Do you often suddenly become scared for no good reason?
[10] Are you scared to be alone when there are no friends near you?
[11] Are you easily upset or irritated?
[12] Are you frightened of going out alone or of meeting people?
[13] Are you constantly keyed up and jittery?
[14] Is your appetite poor?
[15] Does every little thing get on your nerves and wear you out?
[16] Have you ever had a nervous breakdown?
Somatic items[17] Do you often have back-ache?
[18] Do you often have bad headaches?
[19] Have you at times had a twitching of the face, head or shoulders?
[20] Do you suffer from indigestion?
[21] Do you suffer from an upset stomach?
[22] Does your heart often race like mad?
[23] Do you have bad pains in your eyes?
[24] Are you troubled with rheumatism or fibrosis?
Table 20 shows the fractions of individuals reporting mental or physical health
conditions. It is evident that individuals are more likely to report physical health
problems as they get older while mental health problems appear to decline after age
42. Interestingly, the prevalence of mental health problems appears to be higher with
the Malaise Inventory indicator than with self-reports. In contrast, the prevalence of
physical health problems appears to be lower with the Malaise Inventory indicator
than with self-reports. This is probably because the Malaise Inventory covers only a
44

limited number of somatic symptoms.
Table 20: Adult health indicators
Age 23 Age 33 Age 42 Age 46 Age 50Fraction reporting mental health conditions 0.033 0.024 0.064 0.044 0.039
(0.179) (0.156) (0.245) (0.204) (0.194)Fraction reporting physical health conditions 0.150 0.174 0.216 0.335 0.434
(0.357) (0.379) (0.411) (0.335) (0.434)Malaise Inventory psychological health risk indicator 0.060 0.063 0.153
(0.237) (0.244) (0.360)Malaise Inventory somatic health risk indicator 0.065 0.090 0.104
(0.247) (0.286) (0.306)
Note: Standard errors are in parentheses. The data source is the NCDS. The sample consistsof 3,665 men.
Table 21 presents the estimates of health reporting preference parameters. The
estimates indicate that individuals with better mental health are less likely to report
mental health problems. Likewise, individuals with better physical health are less likely
to report physical health problems. However, I find that the Malaise Inventory somatic
health indicator is not significantly associated with the physical health conditions. This
suggests that the measurement of physical health in my model is driven mostly by the
self-reported physical health indicators. I also find that past labor supply does not
significantly affect mental health reports while past labor supply appears to have small
but statistically significant effects on the Malaise Inventory somatic health indicators.
45

Table 21: Parameter estimates: health reports
Parameter Estimate Standard error DescriptionSelf-reported mental healthh0(1) -1.693 0.071 interceptH1(1, 1) -0.088 0.038 mental healthH2(1, 3) 0.011 0.020 past labor supply
Malaise Inventory mental healthh0(2) -1.400 0.060 interceptH1(2, 1) -0.096 0.032 mental healthH2(2, 3) 0.012 0.023 past labor supply
Self-reported physical healthh0(3) -0.952 0.035 interceptH1(3, 1) -0.085 0.025 physical healthH2(3, 3) 0.022 0.013 past labor supply
Malaise Inventory somatic healthh0(4) -1.040 0.046 interceptH1(4, 1) 0.003 0.025 physical healthH2(4, 3) 0.044 0.021 past labor supply
Source: NCDS augmented with UK Skills Survey. Sample consists of 3,665 men.Note: Parameter estimates are for the health reporting preferences: vt = (h0 + H1θ
Ht +
H2xt−1 +ωt)′rt+ r′tH3rt where ωt ∼ N(0, 1). I assume that past task selections (τt−1) do not
affect health reporting behavior. The parameter matrix H3 is normalized to be an identitymatrix.
References
Almond, Douglas and Janet Currie, “Human Capital Development before Age
Five,” Handbook of Labor Economics, 2011, 4, 1315–1486.
and , “Killing Me Softly: The Fetal Origins Hypothesis,” Journal of Economic
Perspectives, 2011, 25 (3), 153.
Autor, David, Frank Levy, and Richard Murnane, “The Skill Content of Re-
cent Technological Change: An Empirical Exploration,” The Quarterly Journal of
Economics, 2003, pp. 1279–1333.
46

Ben-Porath, Yoram, “The Production of Human Capital and the Life Cycle of
Earnings,” Journal of Political Economy, 1967, pp. 352–365.
Bilton, Katherine and Paul William Cooper, “ADHD and Children with Social,
Emotional and Behavioural Difficulties,” 2013.
Bound, John, “Self-Reported Versus Objective Measures of Health in Retirement
Models,” Journal of Human Resources, 1991, 26 (1), 106.
Bowlus, Audra and Chris Robinson, “Human Capital Prices, Productivity, and
Growth,” American Economic Review, 2012, 102 (7), 3483–3515.
Case, Anne and Christina Paxson, “Causes and Consequences of Early-life
Health,” Demography, 2010, 47 (1), S65–S85.
, Angela Fertig, and Christina Paxson, “The Lasting Impact of Childhood
Health and Circumstance,” Journal of Health Economics, 2005, 24 (2), 365–389.
Conti, Gabriella, James Heckman, and Sergio Urzua, “The Education-Health
Gradient,” American Economic Review, 2010, 100 (2), 234.
Cunha, Flavio and James Heckman, “Formulating, Identifying and Estimating
the Technology of Cognitive and Noncognitive Skill Formation,” Journal of Human
Resources, 2008, 43 (4), 738–782.
Currie, Janet, “Healthy, Wealthy, and Wise: Socioeconomic Status, Poor Health
in Childhood, and Human Capital Development,” Journal of Economic Literature,
2009, 47 (1), 87–117.
, Mark Stabile, Phongsack Manivong, and Leslie Roos, “Child Health and
Young Adult Outcomes,” Journal of Human Resources, 2010, 45 (3), 517–548.
Felstead, Alan, Duncan Gallie, Francis Green, and Ying Zhou, “Skills at
Work, 1986-2006,” 2007.
47

Fletcher, Jason, “The Effects of Childhood ADHD on Adult Labor Market Out-
comes,” Health Economics, 2014, 23 (2), 159–181.
, Jody Sindelar, and Shintaro Yamaguchi, “Cumulative Effects of Job Char-
acteristics on Health,” Health Economics, 2011, 20 (5), 553–570.
Gilleskie, Donna, “A Dynamic Stochastic Model of Medical Care Use and Work
Absence,” Econometrica, 1998, pp. 1–45.
Hansen, Lars Peter and Thomas Sargent, Recursive Models of Dynamic Linear
Economies, Princeton University Press, 2013.
Heckman, James, “The Economics, Technology, and Neuroscience of Human Capa-
bility Formation,” Proceedings of the National Academy of Sciences, 2007, 104 (33),
13250–13255.
and Guilherme Sedlacek, “Heterogeneity, Aggregation, and Market Wage Func-
tions: an Empirical Model of Self-selection in the Labor Market,” Journal of Political
Economy, 1985, pp. 1077–1125.
and , “Self-selection and the Distribution of Hourly Wages,” Journal of Labor
Economics, 1990, pp. S329–S363.
and Thomas MaCurdy, “A Life Cycle Model of Female Labour Supply,” Review
of Economic Studies, 1980, pp. 47–74.
Keane, Michael P and Kenneth Wolpin, “The Career Decisions of Young Men,”
Journal of Political Economy, 1997, 105 (3), 473–522.
Kuehnle, Daniel, “The Causal Effect of Family Income on Child Health in the UK,”
Journal of Health Economics, 2014, 36, 137–150.
48
Lindeboom, Maarten and Marcel Kerkhofs, “Health and Work of the Elderly:
Subjective Health Measures, Reporting Errors and Endogeneity in the Relationship
between Health and Work,” Journal of Applied Econometrics, 2009, 24 (6), 1024–
1046.
Lundborg, Petter, Anton Nilsson, and Dan-Olof Rooth, “Adolescent Health
and Adult Labor Market Outcomes,” Journal of Health Economics, 2014, 37, 25–40.
Sickles, Robim and Abdo Yazbeck, “On the Dynamics of Demand for Leisure and
the Production of Health,” Journal of Business & Economic Statistics, 1998, 16 (2),
187–197.
Smith, James, “The Impact of Socioeconomic Status on Health over the Life-course,”
Journal of Human Resources, 2007, 42 (4), 739–764.
and Gillian Smith, “Long-term Economic Costs of Psychological Problems during
Childhood,” Social Science & Medicine, 2010, 71 (1), 110–115.
Yamaguchi, Shintaro, “Tasks and Heterogeneous Human Capital,” Journal of Labor
Economics, 2012, 30 (1), 1–53.
49