Child poverty and child well-being Jonathan Bradshaw Workshop ACWA08 Strong, safe and sustainable;...
59
Child poverty and child well-being Jonathan Bradshaw Workshop ACWA08 Strong, safe and sustainable; responding to children, young people and families in civil society Sydney Convention & Exhibition Centre 18 August 2008
-
Upload
stuart-shaw -
Category
Documents
-
view
219 -
download
1
Transcript of Child poverty and child well-being Jonathan Bradshaw Workshop ACWA08 Strong, safe and sustainable;...

Child poverty and child well-being
Jonathan Bradshaw
Workshop
ACWA08Strong, safe and sustainable; responding to children, young people
and families in civil society
Sydney Convention & Exhibition Centre18 August 2008

Background
Comparisons of state efforts on behalf of children Work at York on children: Bradshaw and Mayhew
(2005) Child well-being in the UK, Save the Children Luxembourg Presidency EU: Atkinson recommends
“child mainstreaming” and development of child well-being indicators for EU.
We develop of an index of child well-being based on existing comparative data sources for EU (Bradshaw, J., Hoelscher, P. and Richardson, D. (2007) An index of child well-being in the European Union 25, Journal of Social Indicators Research, 80, 133-177.)
UNICEF asks us to adapt it for Innocenti Report Card 7
Now working on Index for CEE/CIS countries for UNICEF: Geneva

FAMILY SPENDING 2003
0.0
0.5
1.0
1.5
2.0
2.5
3.0
3.5
4.0
4.5
0.0
0.5
1.0
1.5
2.0
2.5
3.0
3.5
4.0
4.5
Cash Services Tax breaks towards family OECD-24 (2.4%)

Child poverty rate (circa 2000) by family exp. as % GDP 2003 (OECD data)

Background: We can compare inputs
OECD comparisons of welfare state effort – social expenditure on families with children
Child tax/benefit packages

“Average” child benefit package 2005
Child benefit package 2005
0
5
10
15
20
25
30
35
40
45
den
aus ire fin
cze
usa
hun
lux
ice
swe
ger
uk ost
bel
net
nor
pol
slo ita can fra
jap
swi
nz por
spa
gre
kor
tur
% m
ore
th
an
ch
ildle
ss

Fertility and the child benefit package

We can compare outcomes for children
OECD comparisons of welfare state effort – social expenditure on families with children
Research on child outcomes has usually been comparisons of child poverty

Child poverty
EU, OECD, LIS (and UNICEF) have most commonly compared child well-being using relative income poverty measures.
Flawed Income is not well-being Income data unreliable Income poverty thresholds arbitrary and Level of living different Equivalence scales contested Income poverty rates hide gaps and persistence.
RP 7 an attempt to move beyond income – to put it into perspective
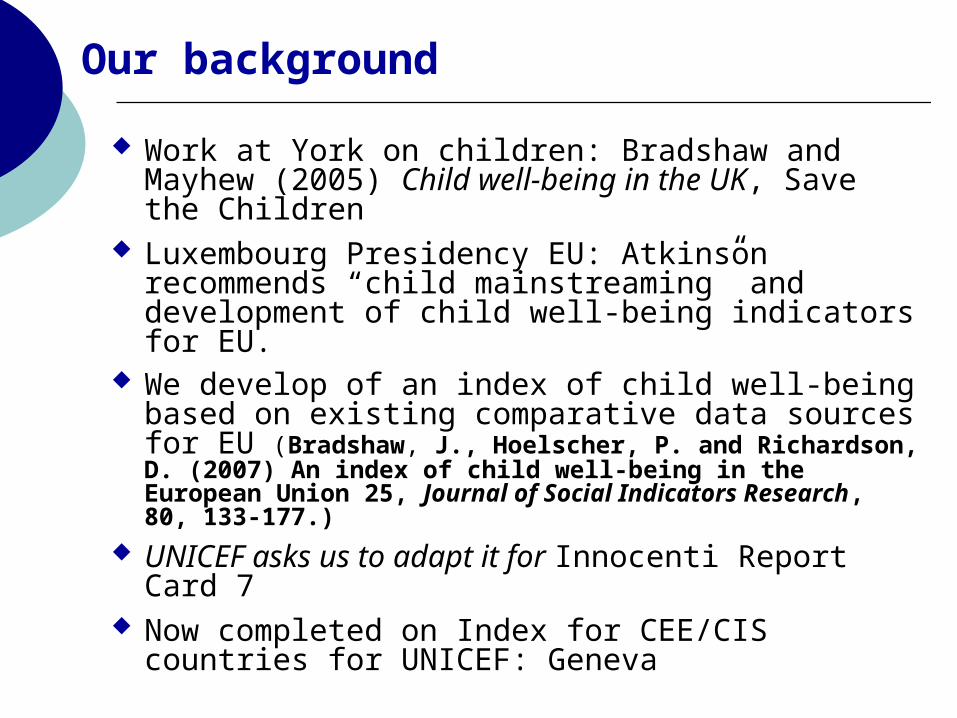
Our background
Work at York on children: Bradshaw and Mayhew (2005) Child well-being in the UK, Save the Children
Luxembourg Presidency EU: Atkinson recommends “child mainstreaming” and development of child well-being indicators for EU.
We develop of an index of child well-being based on existing comparative data sources for EU (Bradshaw, J., Hoelscher, P. and Richardson, D. (2007) An index of child well-being in the European Union 25, Journal of Social Indicators Research, 80, 133-177.)
UNICEF asks us to adapt it for Innocenti Report Card 7
Now completed on Index for CEE/CIS countries for UNICEF: Geneva

UNICEF
UNICEF Innocenti Centre has been publishing Report Cards since 2000
League Tables of rich (OECD) nations 1 and 6 on income poverty 2 on child deaths 3 on teenage births 4 on educational inequality 5 on abuse and neglect
Latest 7 on child well-being “to encourage monitoring, to permit comparison and to stimulate the discussion and development of policies to improve children’s lives.”


Conceptualisation of child well-being
Multi-dimensional approach Based on children’s rights as outlined in the
UN CRC Ideology
Child the unit of analysis What children think and feel is important Well-being more important than well-becoming

Every Child Matters: Outcomes framework Economic well-being: having sufficient income and
material comfort to be able to take advantage of opportunities.
Being healthy: enjoying good physical and mental health and living a healthy lifestyle.
Staying safe: being protected from harm and neglect and growing up able to look after themselves.
Enjoying and achieving: getting the most out of life and developing broad skills for adulthood.
Making a positive contribution: developing the skills and attitudes to contribute to the society in which they live.

Multinational indicators for monitoring and
measuring child well-being
Safety and physical status Personal life Civic life Economic resources and contribution Activities Source: http://multinational-indicators.chapinhall.org

Well-being of children in Ireland

Conceptualisation of child well-being
Multi-dimensional approach Based on children’s rights as outlined in the
UN CRC Ideology
Child the unit of analysis What children think and feel is important Well-being more important than well-becoming

The United Nations Convention on the Rights of the Child (UNCRC)
contains 54 articles that cover every aspect of a child’s life, applying without exception or discrimination to all children
under 18. The articles of the UNCRC divide into the broad areas of
survival rights, development rights, protection rights and participation rights.
The Convention states that the primary consideration in all actions concerning children must be in their best interest and their views must be taken into account

Conceptualisation of child well-being
Multi-dimensional approach Based on children’s rights as outlined in the
UN CRC Ideology
Child the unit of analysis What children think and feel is important Well-being more important than well-becoming

Data Sources I: Surveys
Health Behaviour of School Aged Children (HBSC) 36 countries at 2001 (Australia not covered)
Programme for International Student Assessment (PISA) 32 countries at 2000, 41 at 2003

Data Sources II: Series
WHO mortality data base 1993-1999, all countries except DK & CY
World Bank World Development Indicators 2003, all countries
OECD (2004) Education at a Glance, 2002 data Other OECD sources World Bank (2002) Health, Nutrition and Population
Data

Structure
40 indicators organised into 19 components making 6 dimensions
Material Health and safety Education Peer and family relationships Behaviours and risks Subjective well-being

Overall child well-being: OECD Domain
Rank Country Overall material health education relationships behaviour subjective 1 Netherlands 116.95 10 3 6 3 3 1 2 Sweden 116.87 1 1 5 1 15 7 3 Iceland 112.57 2 13 4 Finland 109.75 3 4 4 6 17 11 5 Denmark 107.97 4 5 9 12 9 12 6 Norway 107.97 2 9 10 13 10 8 7 Spain 106.34 12 6 19 5 8 2 8 Switzerland 106.13 5 10 16 10 4 6 9 Belgium 102.59 7 14 1 19 5 16 10 Australia 102.52 13 15 7 11 Ireland 102.25 22 22 8 4 7 5 12 Italy 101.27 15 7 23 9 1 10 13 Germany 101.2 14 12 11 11 13 9 14 Greece 99.22 17 21 20 7 11 3 15 Canada 98.55 6 17 2 17 18 15 16 France 97.27 9 8 18 14 12 18 17 Poland 96.65 24 19 3 2 14 19 18 Czech Republic 96.6 11 11 12 8 19 17 19 Japan 95.24 18 13 20 Austria 94.55 8 15 22 15 16 4 21 Portugal 94.25 19 18 24 16 2 14 22 Hungary 90.90 23 20 15 18 6 13 23 New Zealand 85.88 16 24 17 24 United States 79.32 20 25 14 20 20 25 United Kingdom 77.18 21 16 21 21 21 20

Overall child well-being index: EU

Overall child well-being index: CEE/CISTable 0.1
Average rank
Material Housing Health EducationPersonal and
Social
Family Forms and Care
Risk and Safety
Croatia 3.4 1 1 1 4 1 7 9
Bosnia Herzegovina 4.8 9 3 13 - 2 1 1
FYR Macedonia 6.3 8 10 3 6 3 4 10
Serbia 6.6 5 6 9 11 7 3 5
Uzbekistan 7.5 14 2 6 - 13 8 2
Turkmenistan 7.6 - 9 15 - 4 6 4
Belarus 8.3 6 5 4 2 11 14 16
Montenegro 8.6 7 11 8 13 7 2 12
Bulgaria 10.6 2 7 14 5 16 12 18
Ukraine 10.6 4 13 7 8 9 19 14
Kazakhstan 11.1 15 12 10 1 12 17 11
Russia 11.3 3 15 5 3 17 16 20
Kyrgyzstan 11.7 16 17 11 18 5 9 6
Romania 12.0 10 19 16 7 14 5 13
Armenia 12.1 17 8 19 12 15 11 3
Georgia 13.6 18 4 17 15 6 18 17
Turkey 14.0 13 - 12 17 - - -
Azerbaijan 14.1 11 16 20 16 19 10 7
Albania 14.4 12 14 18 9 20 13 15
Tajikistan 14.4 19 18 21 10 10 15 8
Moldova 16.1 20 20 2 14 18 20 19

Material
Relative child income poverty OECD Child deprivation
Lacking car, own bedroom, holidays last year, a computer HBSC
Lacking a desk, quiet for study, a computer, calculator, dictionary, text books PISA
Less than ten books in the home PISA Parental worklessness OECD

FIG. 1.1: Relative income poverty: percentage of children (0-17) in households with equivalent income less than 50 per cent of the median
0 5 10 15 20 25
Denmark
FinlandNorway
SwedenBelgium
SwitzerlandCzech Republic
FranceNetherlands
GermanyAustralia
GreeceHungary
AustriaCanada
JapanPoland
PortugalSpain
IrelandItaly
United KingdomNew Zealand
United States
OE
CD
Nat
ions
Date: 2000,1999 (Australia, Austria and Greece), 2001 (Germany, New Zealand and Switzerland).

FIG. 1.3: COMPOSITE TABLE OF CHILD MATERIAL DEPRIVATION (COMBINING FIGS. 1.3A, 1.3B, 1.3C)
-1.5 -1.0 -0.5 0.0 0.5 1.0 1.5
Norway
Sweden
Australia
Canada
Finland
New Zealand
Germany
Spain
Denmark
Austria
United Kingdom
Netherlands
France
Switzerland
Czech Republic
Italy
Belgium
United States
Ireland
Hungary
Portugal
Greece
Poland
Japan
12
34
56
78
910
1112
1314
1516
1718
1920
2122
2324

FIG. 1.2: Percentage of working-age households with children without an employed parent
0 2 4 6 8 10 12
JapanPortugal
SwitzerlandAustria
United StatesGreece
SwedenCanadaFinland
ItalyBelgium
DenmarkSpain
NorwayNetherlands
FranceIreland
New ZealandCzech RepublicUnited Kingdom
GermanyPoland
AustraliaHungary
Israel
OE
CD
Nat
ions
Non
-O
EC
DN
atio
ns
Date: 2000, 1999 (Japan and Canada), 1998 (Switzerland), 2001 (Spain, the Netherlands, and Germany), 2002 (Austria, Norway and Poland). Non-OECD, 2004 (Israel).

FIG. 1.0: THE MATERIAL WELL-BEING OF CHILDREN, AN OECD OVERVIEW
80.0 85.0 90.0 95.0 100.0 105.0 110.0 115.0 120.0
Sweden
Norway
Finland
Denmark
Switzerland
Canada
Belgium
Austria
France
Netherlands
Czech Republic
Spain
Australia
Germany
Italy
New Zealand
Greece
Japan
Portugal
United States
United Kingdom
Ireland
Hungary
Poland
12
34
56
78
910
1112
1314
1516
1718
1920
2122
2324

Child well-being by child poverty r=0.75

Health
Health at birth Infant mortality rates (WDI 2003) Low birth weight (OECD Health Data)
Immunisation Measles WDI (2003) DPT3 WDI HNP (2002) Pol3 WDI HNP (2002)
Child mortality All child deaths: All under 19 deaths per 100,000
children, WHO mortality database, 3 year averages, MRD

FIG. 2.0: THE HEALTH AND SAFETY OF CHILDREN, AN OECD OVERVIEW
80 85 90 95 100 105 110 115 120 125
Sweden
Iceland
Netherlands
Finland
Denmark
Italy
Spain
France
Norway
Switzerland
Czech Republic
Germany
Japan
Australia
United Kingdom
Canada
Portugal
Poland
Belgium
Hungary
Greece
Ireland
Austria
New Zealand
United States
12
34
56
78
910
1112
1314
1516
1718
1920
2122
2324
25

FIG. 2.1A: Infant mortality rate (deaths before the age of 12 months per 1000 live births)
0 1 2 3 4 5 6 7 8 9 10 11
IcelandJapan
FinlandSwedenNorway
Czech RepublicFrance
PortugalSpain
GermanyBelgium
ItalySwitzerland
DenmarkAustria
AustraliaGreece
NetherlandsIreland
United KingdomCanada
New ZealandPoland
United StatesHungary
SloveniaIsraelMalta
CroatiaEstonia
LithuaniaLatvia
OE
CD
Nat
ions
No
n-O
EC
DN
atio
ns
Date: 2003, 2002 (Canada and the USA), 2001 (New Zealand). Non-OECD 2003

FIG. 2.1B: Low birth weight rate (% births less than 2500g)
0 1 2 3 4 5 6 7 8 9 10
IcelandFinland
SwedenIreland
NorwayNetherlands
DenmarkCanadaPoland
New ZealandAustraliaBelgium
ItalySwitzerland
Czech RepublicFrance
GermanySpain
AustriaPortugal
United KingdomUnited States
GreeceHungary
Japan
EstoniaLithuania
LatviaCroatia
MaltaRussian Federation
SloveniaIsrael
OE
CD
Nat
ions
Non
-OE
CD
Nat
ions
Date: 2003, 2002 (Australia, Canada, Greece, Switzerland), 2001 (Spain, Ireland, Italy, the Netherlands), 1995 (Belgium). Non-OECD 2001, 2000 (Croatia).

FIG. 2.2: Percentage of children age 12 - 23 months immunized against the major vaccine-preventable diseases
70 75 80 85 90 95 100
HungaryCzech Republic
PolandDenmark
NetherlandsSwedenFinland
PortugalSpain
FranceAustralia
IcelandUnited States
JapanGermany
CanadaItaly
SwitzerlandNorwayGreece
United KingdomBelgium
New ZealandIrelandAustria
LatviaLithuania
EstoniaRussian Federation
CroatiaIsraelMalta
Slovenia
OE
CD
Nat
ions
Non
-OE
CD
Nat
ions
Date: Measles data , all countries (2003), Pol3 and DPT3 data, all countries (2002)

FIG. 2.3: Accidental and non-accidental deaths under 19 per 100,000 (average of latest three years available)
0 10 20 30 40 50 60 70
SwedenUnited Kingdom
NetherlandsItaly
IcelandSpain
SwitzerlandFranceJapan
NorwayGermany
GreeceCanadaFinlandIrelandAustria
AustraliaBelgiumHungary
PolandCzech Republic
PortugalUnited StatesNew Zealand
MaltaCroatia
SloveniaLithuania
EstoniaLatvia
Russian FederationIsrael
OE
CD
Nat
ions
Non
-OE
CD
Nat
ions
Date: 1993-1995 (Finland, Hungary, Iceland, The Netherlands, Norway), 1994-1996 (Poland, Sweden), 1995-1997 (Australia, Belgium, Germany), 1996-1998 (Spain, US), 1997-1999 (Canada, France, New Zealand, UK), 1999-2001 (Austria, Ireland, Italy, Portugal), 2000-2002 (Switzerland, Greece). Non-OECD: Israel (2003), Russian Federation (2000-2002) Lithuania (1995-97), Estonia, Slovenia (1994-96), Latvia (1993-95), Malta, Croatia (1992-94).

Behaviours and Risks Health behaviour
Eating fruit every day (HBSC) Eating breakfast before school (HBSC) Physical activity (HBSC) Obesity and pre obesity (HBSC)
Experience of violence Young people who were involved in physical fighting at least once in
the previous 12 months 11, 13 and 15 years (%) - HBSC 2001/02 Young people who were bullied at least once in the previous couple
of months 11, 13 and 15 years (%) - HBSC 2001/02 Risk behaviour
Teenage pregnancy (adolescent fertility rate), adolescent fertility rate, births per 1000 women 15-19 - WDI, 2003.
Young people who have had sexual intercourse, 15 years (%) - HBSC 2001/02
Young people who used a condom during their last sexual intercourse, 15-year-olds (%) - HBSC 2001/02
Cigarette smoking at least once per week HBSC 2001 Drunk two or more times HBSC 2001 Cannabis used in the last 12 months HBSC 2001

FIG. 5.2F: Teenage fertility rate: births per 1,000 women age 15 - 19
0 5 10 15 20 25 30 35 40 45 50
JapanNetherlandsSwitzerland
DenmarkItaly
SpainSwedenFinlandFranceNorwayBelgium
GermanyIrelandPolandGreece
AustraliaCanadaAustria
Czech RepublicPortugalHungary
United KingdomNew ZealandUnited States
SloveniaCroatia
IsraelEstonia
LatviaLithuania
Russian Federation
OE
CD
Nat
ions
Non
-OE
CD
Nat
ions
Date: 2003

Child well-being and teenage fertility rate
r = 0.82***

Subjective Well-being
Personal well-being Young people with scores above the middle of a life
satisfaction scale 11, 13 and 15 years (%) - HBSC 2001/02 Students who agree or strongly agree to 'I feel like an
outsider (or left out of things)', 15 years (%) - PISA 2003 Students who agree or strongly agree to 'I feel awkward
and out of place', 15 years (%) - PISA 2003 Students who agree or strongly agree to 'I feel lonely', 15
years (%) - PISA 2003 Well-being at school
Young people liking school a lot 11, 13 and 15 years (%) - HBSC 2001/02
Self defined health Young people rating their health as fair or poor 11, 13 and
15 years (%) - HBSC 2001/02

FIG. 5.3B: PERCENTAGE OF 15 YEAR-OLDS AGREEING OR STRONGLY AGREEING WITH SPECIFIC NEGATIVE STATEMENTS ABOUT PERSONAL WELL-BEING
0 5 10 15 20 25 30 35
AustraliaAustria
BelgiumCanada
Czech RepublicDenmark
FinlandFrance
GermanyGreece
HungaryIcelandIreland
ItalyJapan
NetherlandsNew Zealand
NorwayPoland
PortugalSpain
SwedenSwitzerland
United Kingdom
IsraelLatvia
Russian Federation
OE
CD
Nat
ions
Non
-O
EC
DN
atio
ns
‘I feel like an outsider or left out of things’. ‘I feel awkward and out of place’. ‘I feel like an outsider or left out of things’.
Date: 2003. Non-OECD 2003, 2000 (Israel).

Peer and family relationships
Quality of family relations Students whose parents eat the main meal with them
around a table several times a week, 15 years (%) - PISA 2000
Students whose parents spend time just talking to them several times a week, 15 years (%) - PISA 2000
Family structure Young people living in 'single parent' family structures 11,
13 and 15 years (%) - HBSC 2001/02 Young people living in 'Stepfamily' family structures 11, 13
and 15 years (%) - HBSC 2001/02
Peer relationships Young people finding their peers kind and helpful 11, 13
and 15 years (%) - HBSC 2001/02

FIG. 4.2A: Percentage of 15 year-olds who eat the main meal of the day with their parents 'several times per week'
40 50 60 70 80 90 100
ItalyIcelandFrance
NetherlandsSwitzerland
BelgiumNorway
PortugalJapan
DenmarkSweden
SpainGermany
PolandIreland
HungaryCzech Republic
CanadaAustralia
GreeceAustria
United KingdomUnited StatesNew Zealand
Finland
Russian FederationLatviaIsrael
OE
CD
Nat
ions
No
n-O
EC
DN
atio
ns
Date: 2000

FIG. 4.2B: Percentage of 15 year-olds whose parents spend time 'just talking to them' several times per week
20 30 40 50 60 70 80 90 100
HungaryItaly
FinlandCzech Republic
DenmarkNetherlands
PortugalUnited States
NorwayFranceIreland
United KingdomJapanSpain
GreeceBelgium
New ZealandSweden
AustraliaPoland
SwitzerlandAustria
CanadaIceland
Germany
Russian FederationLatviaIsrael
OE
CD
Nat
ions
Non
-O
EC
DN
atio
ns
Date: 2000

Overall child well-being and % of young people saying they lived in a lone parent family

Education
Achievement Reading literacy achievement, 15 years - PISA, 2003 Mathematics literacy achievement, 15 years - PISA, 2003 Science literacy achievement, 15 years - PISA, 2003
Participation Full-time and part-time students in public and private
institutions, by age: 15-19 as a percentage of the population of 15 to 19-year-olds (2003) LU SK (2002)
Aspirations Percentage of the youth population not in education, not in
the labour force or unemployed - age 15-19 - OECD, 2003 Proportion of pupils aspiring to low skill work, 15 years -
PISA, 2000

FIG. 3.1: EDUCATIONAL ATTAINMENT OF 15 YEAR-OLDS, A COMPOSITE OF READING, MATHEMATICALS AND SCIENTIFIC LITERACY
-2.0 -1.5 -1.0 -0.5 0.0 0.5 1.0 1.5 2.0 2.5
FinlandCanada
AustraliaJapan
NetherlandsNew Zealand
BelgiumSwitzerland
United KingdomSweden
IrelandCzech Republic
FranceIceland
GermanyPolandAustriaNorway
DenmarkHungary
United StatesSpain
ItalyPortugalGreece
12
34
56
78
910
1112
1314
1516
1718
1920
2122
2324
25
Date: 2003

FIG. 3.3B: Percentage of pupils age 15 expecting to find work requiring low skills
0 10 20 30 40 50 60
United StatesPolandGreece
PortugalBelgium
DenmarkCanadaIreland
New ZealandAustralia
ItalySpain
FinlandSwedenNorway
HungaryIcelandAustria
NetherlandsGermany
United KingdomCzech Republic
SwitzerlandFranceJapan
LatviaRussian Federation
Israel
OE
CD
Nat
ions
Non
-O
EC
DN
atio
ns
Date: 2000

Child well-being and educational attainment
r = 0.15 (ns)

What explains these variations?
Very difficult Probably depends on domain – need for
more detailed work National wealth matters

Overall child well-being and GDP per capita complete countries

WHY?
Very difficult Probably depends on domain – need for
more detailed work National wealth matters Policy effort matters

Child well-being and expenditure on social protection benefits as % GDP 2003

WHY?
Very difficult Probably depends on domain – need for
more detailed work National wealth matters Policy effort matters Direction of that effort matters

Child well-being by expenditure on family benefits and services as % GDP all countries

Self criticism
Partly data driven Countries dropped Indicators missing for some countries - USA Some well-being indicators not available – housing,
citizenship…. Validity and reliability of indicators – low birth weight Focus on older children Out of date Summarising indicators
Z scores Implied weights Weighting equal except differences in indicators per dimension No direct access to HBSC Cumulating % without regard to confidence intervals No measures of dispersion

Thoughts about further work
First attempt: Obviously good if Australia, Iceland, Japan and NZ were in HBSC And US asked HBSC questions about sexual
behaviour and children’s feelings! Also to have HBSC data more quickly and
direct access Also OECD updated their poverty estimates
more regularly Further analysis worthwhile – data available Is it pie in the sky to ask for a better
international survey of children?

Child poverty and child well-being
Workshop
ACWA08Strong, safe and sustainable; responding to children, young people
and families in civil society
Sydney Convention & Exhibition Centre18 August 2008