CHILD BENEFITS ANDPOVERTY REDUCTION - UNICEF · A highlight of the research was a series of focus...
60
DIVISION OF POLICY AND PLANNING MAY 2007 WORKING PAPER CHILD BENEFITS AND POVERTY REDUCTION: EVIDENCE FROM MONGOLIA’S CHILD MONEY PROGRAMME
Transcript of CHILD BENEFITS ANDPOVERTY REDUCTION - UNICEF · A highlight of the research was a series of focus...

DIVISION OF POLICY AND PLANNINGMAY 2007
WO
RK
ING
PA
PE
RCHILD BENEFITS ANDPOVERTY REDUCTION:EVIDENCE FROM MONGOLIA’SCHILD MONEY PROGRAMME
Photo credit: © UNICEF/HQ00-1001/Giacomo Pirozzi
For more information, please contact:
The United Nations Children’s Fund (UNICEF)3 United Nations Plaza, Global Policy SectionNew York, NY 10017, USA
E-mail: [email protected]: www.unicef.org/policyanalysis

DIVISION OF POLICY AND PLANNING WORKING PAPERS
CHILD BENEFITS AND POVERTY REDUCTION: EVIDENCE FROM MONGOLIA’S CHILD MONEY PROGRAMME ANTHONY HODGES KHURELMAA DASHDORJ KANG YUN JONG ANNE-CLAIRE DUFAY URANCHIMEG BUDRAGCHAA TUYA MUNGUN
May 2007
CHILD BENEFITS AND POVERTY REDUCTION: EVIDENCE FROM MONGOLIA’S CHILD MONEY PROGRAMME © United Nations Children's Fund (UNICEF), New York, 2007 UNICEF 3 UN Plaza, NY, NY 10017 May, 2007 This is a working document. It has been prepared to facilitate the exchange of knowledge and to stimulate discussion, and has benefited from the support and comments of the Maastricht Graduate School of Governance at Maastricht University, in particular Chris de Neubourg, Academic Director of the School, and Franziska Gassmann, Senior Researcher. The findings, interpretations and conclusions expressed in this paper are entirely those of the author(s) and do not necessarily reflect the policies or the views of UNICEF. The text has not been edited to official publication standards and UNICEF accepts no responsibility for errors. The designations in this publication do not imply an opinion on legal status of any country or territory, or of its authorities, or the delimitation of frontiers.

Acknowledgements The team that carried out the research for this policy paper received valuable information, comments and suggestions from numerous officials in Mongolian government agencies, international organizations and NGOs, as well as from private individuals, many of them beneficiaries of the Child Money Programme (CMP). The team would like to thank all those who provided their time to assist the research. The opinions expressed in this paper are, however, entirely those of the authors and do not reflect the official position of UNICEF or any organization consulted during the research.
We are especially grateful for the assistance provided by the National Statistical Office of Mongolia (NSOM), which made available to us the data sets from the Household Income and Expenditure Survey for April-June 2006, including the special HIES module on the Child Money Programme (CMP). Access to these data sets made it possible for the team to undertake a quantitative analysis of the effectiveness and efficiency of the CMP. We were fortunate also to be able to discuss at length with Mr. Batsukh Tumurtulga, Deputy Director of the Population Development and Social Security Department of the Ministry of Social Welfare and Labour. Other valuable comments were made by Ms. Oyuntsetseg, Specialist, Economic Policy Department of the Ministry of Finance, and Ms. Batchuluun, Director of the Non-Formal and Distance Education Centre, Ministry of Education, Science and Culture.
A highlight of the research was a series of focus group discussions with social workers, other local government officials and CMP beneficiaries in the aimag centre and two soums (Delgertsogt and Deren) in Dundgovi aimag (province) and in the peri-urban Bayangol district of Ulaanbaatar. Another focus group meeting was held with children in the Adolescent Development Centre, Ulaanbaatar. We greatly appreciated the frank comments made by the participants in these meetings, which helped us understand better how the CMP works in practice and how it is viewed by those most directly concerned.
We valued also the discussions with staff of several international organizations that have closely followed the development of the CMP, in particular Ms. D. Nergui, Assistant Resident Representative, and Ms. O. Enkh-Ariuna, Poverty Specialist, in the Mongolia Office of the United Nations Development Programme (UNDP), Mr. Byambatsogt Jugder, Human Development Officer, World Bank, Ms. Bayasgalan Bavuusuren, Social Sectors Officer, Asian Development Bank, and Ms. D. Olonchimeg, Deputy Director of Save the Children UK.
Finally but not least, we would like to thank Mr. Richard Prado, former UNICEF Representative in Mongolia, and Mr. Yameen Mazumder, UNICEF Programme Coordinator, for their advice and comments as the research progressed, as well as for the logistical and other support provided by the UNICEF Office in Mongolia. This made it possible for the team to undertake a complex research programme in a short amount of time. Many thanks also to Ms. Odontuya Norov, UNICEF Programme Assistant, who helped with translation and interpretation.


Table of Contents Page
Executive Summary ......................................................................................................................... i Resumen Ejecutivo ......................................................................................................................... ii Résumé Analytique........................................................................................................................ iii 1. Introduction............................................................................................................................... 1
1.1. Rationale and objective of the study............................................................................... 1 1.2. Methodology, information sources and structure ........................................................... 1
2. The analytical framework for assessing cash transfer programmes ......................................... 2 2.1. Poverty, children and social transfers ............................................................................. 3 2.2. The debate on targeting................................................................................................... 3 2.3. Conditionality in cash transfers ...................................................................................... 5 2.4. The costs of cash transfer programmes........................................................................... 5
3. The context of the Child Money Programme ........................................................................... 6 3.1. Crisis and recovery since the post-Soviet transition ....................................................... 7 3.2. Poverty in Mongolia ....................................................................................................... 7 3.3. Evolution of the policy framework for social assistance ................................................ 8
4. Key features of the CMP........................................................................................................... 9 4.1. The targeted programme (January 2005 to June 2006) .................................................. 9 4.2. The ‘universal’ programme (since July 2006) .............................................................. 11
5. The effectiveness and efficiency of the CMP......................................................................... 12 5.1. Vertical and horizontal efficiency................................................................................. 13 5.2. Impact on short-term monetary poverty ....................................................................... 15 5.3. Benefit incidence of the CMP....................................................................................... 16 5.4. Value of child benefits to households........................................................................... 17 5.5. Access by the most marginalized and disadvantaged children..................................... 18 5.6. Use of CMP benefits for expenditure on children ........................................................ 20 5.7. Wider social and demographic effects.......................................................................... 21
6. Cost, affordability and sustainability of the CMP .................................................................. 22 6.1. Fiscal affordability and sustainability........................................................................... 23 6.2. Private, indirect, social and political costs.................................................................... 25
7. Factors explaining the evolution and performance of the CMP ............................................. 26 7.1. Party politics and public attitudes ................................................................................. 26 7.2. Shortcomings in programme design and implementation ............................................ 29
8. Policy recommendations......................................................................................................... 32 8.1. Universal or targeted child benefits? ............................................................................ 32 8.2. What level of benefit?................................................................................................... 34 8.3. How to improve capacity and systems for programme management, monitoring and evaluation? ............................................................................................................................ 34 8.4. How to reach the most vulnerable and disadvantaged? ................................................ 35
9. Conclusion .............................................................................................................................. 36 Annex: Statistical tables................................................................................................................ 37 List of abbreviations and acronyms .............................................................................................. 42 Bibliography ................................................................................................................................. 43


Executive Summary
This paper analyses the extent to which Mongolia’s Child Money Programme (CMP), a conditional cash transfer programme for families with children, contributes to poverty reduction and the improved well-being of children (with particular reference to MDGs 1 and 2) and does so in an efficient, affordable and sustainable manner.
Applying the concepts and performance indicators developed in the international literature on social transfers, it compares the actual performance of the CMP in its initial targeted phase (January 2005 to June 2006) with the simulated expected performance of the CMP in its more recent ‘universal’ phase, under two different assumptions (the initial benefit level of $31 per child per year and an increase to $117 as approved in the 2007 budget).
The paper finds that the targeted programme resulted in very high leakage to non-poor households and substantial exclusion of poor households, due to flaws in the programme’s proxy means test and implementation problems. Arguing that it is possible to improve only marginally the methodology and implementation of a proxy means test, and that reversion to a targeted programme would be politically costly, the paper advocates retaining the new universal benefit, which resolves most of the exclusion error, further reduces the child poverty headcount and is progressive along the entire household expenditure distribution due to the heavier concentration of children in the lower deciles.
However, the paper identifies some barriers that still hinder access to child benefits by the most severely disadvantaged families and children. It finds little evidence regarding the effects of the programme on the non-monetary dimensions of poverty, in particular regarding the condition on school attendance.
The analysis of fiscal costs concludes that the universal benefit is affordable and sustainable at its initial level (about 1.0% of GDP), but cautions that the approved increase in the benefit level in the 2007 budget is fiscally and politically risky given the country’s external vulnerability to sharp fluctuations in metal prices and adverse weather.
i

Resumen Ejecutivo
Este documento analiza el alcance en que el Programa “Dinero para los Niños” de Mongolia, un programa de transferencia de efectivo condicional para las familias con niños, contribuye a la reducción de la pobreza y a la mejora del bienestar de los niños (especialmente con respecto a los ODM 1 y 2) y si lo hace de una forma eficiente, asequible y sostenible.
Mediante la aplicación de los conceptos y los indicadores de rendimiento establecidos en publicaciones internacionales sobre transferencias sociales, el documento compara el rendimiento real del Programa en su fase inicial basada en la selección de los beneficiarios (enero de 2005 a junio de 2006) con una simulación del rendimiento que se espera del Programa en su fase “universal” más reciente, siguiendo dos supuestos diferentes (el nivel de beneficio inicial, que es de 31 dólares por niño al año, y el aumento a 117 dólares que se aprobó en el presupuesto de 2007).
El documento observa que el programa basado en la selección dio origen a numerosas desviaciones hacia hogares que no son pobres y a una considerable exclusión de los hogares pobres, debido a errores en la prueba de determinación de medios del programa y a problemas en la ejecución. El documento sostiene que sólo es posible mejorar marginalmente la metodología y la aplicación de una prueba de determinación de medios, y que la reversión a un programa basado en la selección de los beneficiarios sería políticamente costosa, y defiende la idea de retener el nuevo beneficio universal, que resuelve la mayor parte de los errores de exclusión, reduce aún más el recuento de la pobreza infantil y es progresivo para toda la distribución de los gastos del hogar debido a la alta concentración de niños en los deciles más bajos.
Sin embargo, el documento define varios obstáculos que impiden todavía que las familias y los niños en una mayor situación de desventaja tengan acceso a los beneficios infantiles. Observa muy pocas pruebas de los efectos del programa en las dimensiones no monetarias de la pobreza, en especial en lo que atañe a la condición de la asistencia escolar.
El análisis de los costos fiscales llega a la conclusión de que el beneficio universal es asequible y sostenible en su nivel inicial (alrededor de un 1,0% del PIB), pero advierte que el aumento aprobado en el nivel de beneficios en el presupuesto de 2007 conlleva riesgos tributarios y políticos, dada la vulnerabilidad externa del país a las agudas fluctuaciones de los precios del metal y al clima adverso.
ii
Résumé Analytique
Ce rapport analyse dans quelle mesure le Programme de la Mongolie « L’argent pour les enfants », un programme de transfert conditionnel de fonds pour les familles avec des enfants, contribue à la réduction de la pauvreté et à l’amélioration du bien-être des enfants (avec une référence particulière aux OMD 1 et 2) et le fait de façon efficace, abordable et durable.
Appliquant les concepts et les indicateurs de performance mis au point dans la documentation internationale sur les transferts sociaux, il compare les résultats réels du Programme « L’argent pour les enfants » dans sa phase ciblée du départ (janvier 2005 à juin 2006) avec la simulation de ses résultats escomptés à sa dernière phase « universelle », en adoptant deux hypothèses : le niveau de prestation initial de 31 dollars par enfant et par an, et un accroissement approuvé au budget 2007 portant cette dernière à 117 dollars.
Ce rapport conclut que le programme ciblé s’est soldé par de très importantes fuites de fonds en direction de familles non pauvres et par une exclusion substantielle des familles pauvres, en raison de failles dans le test d’enquête sur les ressources financières figurant dans le programme et de problèmes dans son application. Affirmant que seule une amélioration marginale de la méthodologie et de l’application de ce test d’enquête sur les ressources financières est possible, et que le retour à un programme ciblé aurait un coût politique important, ce rapport estime qu’il convient de préserver cette nouvelle prestation universelle, qui corrige en grande partie l’erreur conduisant à l’exclusion, qui réduit encore davantage le nombre d’enfants pauvres, et qui se montre progressive dans tout le schéma de distribution des dépenses familiales en raison de la concentration plus importante d’enfants dans les déciles inférieurs.
Toutefois, ce rapport identifie quelques-uns des obstacles qui empêchent encore les familles et les enfants les plus défavorisés d’avoir accès aux prestations pour enfants. Il ne trouve que peu d’indices relatifs aux effets du programme sur les dimensions non monétaires de la pauvreté, en particulier la condition portant sur la fréquentation scolaire.
L’analyse des coûts fiscaux conclut que la prestation universelle est abordable et durable à son niveau initial (environ 1 % du PIB), mais met en garde contre le fait que l’augmentation du niveau de cette prestation approuvée au budget 2007 est fiscalement et politiquement risquée compte tenu de la vulnérabilité externe du pays aux fluctuations importantes du prix des métaux et au mauvais temps.
iii

iv

1. Introduction
1.1. Rationale and objective of the study This study assesses the contribution of a conditional cash transfer programme to poverty reduction and human development in Mongolia. Our objective is to assess the extent to which Mongolia’s Child Money Programme (CMP) is contributing to poverty reduction and more broadly the attainment of the Millennium Development Goals (MDGs). More specifically, what is the CMP’s direct impact on income poverty (MDG1)? And what are its indirect effects on human capital development and child rights more generally, for example with respect to MDG2 on the achievement of universal primary education? Furthermore, insofar as there are positive effects, are these achieved in an efficient, affordable and sustainable manner?
It should be noted that this paper is not an attempt to review the broad policy framework for achievement of the MDGs in Mongolia. Rather, it is an analysis of the performance and cost-effectiveness of one specific programme. This is justified, first, by the size of the programme: Total benefits, which accounted for 0.8% of GDP in 2005 and an estimated 1.2% in 2006, constitute a substantial transfer of resources with a potentially large impact on poverty but also a significant cost in fiscal terms.
Second, the CMP has been one of the ‘hot’ issues in Mongolian politics since proposals for a child benefit programme were first made during the general elections in June 2004. It has also aroused considerably controversy among the donor agencies in Mongolia. This has accompanied the CMP’s rapid evolution since its introduction in January 2005. It started off as a targeted conditional programme, using a proxy means test as well as behavioral conditions to determine households’ eligibility, and then expanded in July 2006 into a quasi-universal programme without means-testing although retaining a weakened form of conditionality. In January 2007 there was a large increase in the benefit rate. These changes and the heated debate about them, among both Mongolian politicians and donors, make an objective assessment of the programme, based on empirical evidence, all the more important.
Since the programme has had two sharply contrasting methodological approaches in its two phases, it provides an opportunity to investigate the relative advantages and disadvantages of targeting versus universal programmes, as well as the effectiveness of behavioral conditionality. This case study therefore provides evidence that may be of wider interest for the design of cash transfer programmes internationally.
1.2. Methodology, information sources and structure In carrying out this analysis, we have applied the concepts and tools developed in the international literature on social assistance programmes, in particular the various forms of cash transfers to families. The research therefore began with an extensive literature review, which covered both the international literature on cash transfers to households and a wide range of studies, official documents and other sources on the CMP and its political, economic and social setting in Mongolia.
This was followed by quantitative analysis of the effectiveness, efficiency and costs of the CMP. To undertake this analysis, the research team used household budget data from the Household
1

Income and Expenditure Surveys (HIES), which are carried out quarterly by the National Statistical Office of Mongolia (NSOM), including data from a special CMP module attached to the HIES in April-June 2006. These survey data were supplemented by CMP administrative data, obtained from the Ministry of Social Welfare and Labour (MSWL), and public expenditure data, which were used for the analysis of the cost, affordability and sustainability of the programme.
The quantitative analysis was complemented by qualitative research, aimed at understanding why the CMP developed in the way that it did, along with the main institutional and technical constraints and whether/how those constraints might be overcome. For this part of the research, the team reviewed relevant documents, interviewed officials in the Ministries of Social Welfare and Labour, Finance and Education, along with officials of international organizations and NGOs, and held several focus group meetings with CMP beneficiaries (parents, guardians and children) and with social workers and local government officials directly involved in the management and delivery of the CMP. These focus group meetings took place in peri-urban communities in Ulaanbaatar and in rural districts (soums) in Dundgovi province (aimag).1
Following this introduction, Section 2 develops the analytical framework for the study, based on the international literature review, while Section 3 sets the CMP in its political, economic and social context. This is followed, in Section 4, by a description of the main features of the CMP during its targeted and quasi-universal phases. The main body of analysis is in three parts. The first part, in Section 5, analyses the effectiveness and efficiency of the CMP, while Section 6 analyses the costs, affordability and sustainability of the programme. Section 7 examines the political, institutional and technical factors that have affected the design and implementation of the CMP. Section 8 draws out the policy implications of the analysis, presenting a series of recommendations for the future development of the programme, and Section 9 summarizes the conclusions of the study. It should be noted that the principal data used in the analysis are compiled in the statistical tables presented in Annex 1. Annex 2 provides a list of abbreviations used in the text and Annex 3 contains the bibliographical references.
2. The analytical framework for assessing cash transfer programmes
It is widely accepted that economic growth is a pre-condition for sustainable, long-term poverty reduction. However, the impact of growth on poverty reduction is less when there are high levels of inequality and may be negligible or non-existent in societies where structural constraints prevent the poor or the very poor from participating in and enjoying the fruits of growth. Recognition of the importance of such constraints has focused attention on a range of issues beyond the stimulation of economic growth, such as human capital development, access to assets, the reduction of vulnerability to external shocks and the strengthening of social capital and political ‘voice’ among the poor.
1 Although the research team included two members from outside Mongolia, the entire team came together in Mongolia for the interviews and focus group meetings, as well as to review the quantitative analysis and discuss the findings and recommendations arising from the research.
2
2.1. Poverty, children and social transfers Within this framework, there has been growing interest in the role of social transfers, which, as regular and predictable grants provided to households or individuals, can ‘help growth reach the very poor and, where growth is weak, have a direct impact on poverty’ (DFID, 2005). Such transfers normally constitute one part of a broader system of social protection, which usually also includes social insurance and legal, regulatory and service-provision measures to protect citizens, including specific social groups such as children, from various types of risks.
This paper focuses on non-contributory social assistance, by which transfers are made to families or individuals, either in cash, in kind (often as food) or as vouchers. Child allowances are one form of social assistance transfer. One of the underlying justifications for such transfers is that children are disproportionately represented among the poor (Barrientos and DeJong, 2004), either because poor women have higher rates of fertility or, as Gassmann points out (2006), the poverty status of families is closely related to their position in the life-cycle, since families with children have a lower income at a time when their needs are higher.
Social transfers to households with children are a means of breaking out of ‘poverty traps’, since childhood poverty can have long-term adverse effects on capabilities in later life as well as inter-generational effects. Child benefits are therefore seen as a means of avoiding chronic, i.e. long term, poverty and for halting the inter-generational transmission of poverty (Barrientos and DeJong, 2004; Harper et al, 2003, and Castañeda and Aldez-Carroll, 1999).
This line of argument underscores the importance of investments in human capital for long-term poverty reduction as well as reducing short-term monetary poverty and fulfilling child rights. From this perspective, supply-side programmes that make available services such as education and maternal and child health care services may need to be complemented by demand-side economic factors that overcome barriers of access to school and health services, while also ensuring the nutritional wellbeing of children. The international literature provides considerable evidence that social transfers to families with children can complement the supply-side provision of social services and measures to stimulate pro-poor growth.
Analysis of these effects is often hampered by lack of data on the intra-household distribution of additional resources from cash transfers, although it often is possible to measure the non-monetary impacts using educational, health, nutritional and other indicators. Although there is some concern that poor households may not necessarily spend their additional resources in ways that benefit children, it is likely that most parents do give high priority to the well-being of their children. Furthermore, the growing literature on this subject (see for example Haddad et al, 1997) provides evidence that cash transfers paid to women tend to have a greater impact on the living standards of children, especially girls.
2.2. The debate on targeting Much of the international literature on cash transfers contributes to an ongoing debate on the advantages and disadvantages of targeting compared with universal approaches that provide benefits to all households (or all households with children) irrespective of their income level or degree of vulnerability. Assuming that a programme has poverty reduction or re-distributional objectives, the theoretical advantage of targeting is obvious. It is a means of concentrating
3

benefits on the poor, given a hard budget constraint. However, some countries opt for universal approaches for ideological or political reasons, including the rights-based notion of universal entitlements, while using progressive taxation for re-distributional purposes (Mkandawire, 2005). Others have practical concerns about the effectiveness, efficiency and costs of targeting or use social transfers for purposes beyond poverty reduction, such as inter-generational equity or raising the birth rate.
Targeting is motivated by three features of the policy environment: the objective of maximizing poverty reduction or the increase in social welfare; the constraint of a fixed programme budget; and the trade-off between the number of beneficiaries and the level of transfers. In practice, however, targeting is never perfect. It is extremely difficult to target in such a way that all the poor receive benefits and none of the non-poor receive benefits. As van de Walle (1998) puts it, ‘people routinely underestimate how difficult it is to target the poor’. Indeed, there is generally an inverse relationship between under-coverage (or exclusion) of the poor and leakage to the non-poor, which creates a policy dilemma for governments.
Going beyond the simple dichotomy between universalism and targeting, it should be borne in mind that there are many different forms of targeting, which, depending on the country context and the robustness of the design and implementation of programmes, may have greater or lesser re-distributional properties, different types and levels of costs, and different degrees of practicality (Coady et al, 2004). These forms of targeting include self-selection (through programme characteristics that encourage self-selection by the poor and self-exclusion by the non-poor), categorical targeting, which defines eligibility on the basis of such characteristics as age, gender, geographical residence or ethnicity, and various types of individual/household assessment. The latter consists of an array of methods by which programme officials directly assess the eligibility of households or individuals. In countries with highly formalized economies and well developed bureaucratic systems, this can take the form of a verified means test. These are rare in developing countries, where many households receive income in the informal economy and means of verification such as pay slips and tax records are generally not available or reliable. Less robust methods can then be used, such as simple means tests (with no verification of income), proxy means tests and community based-targeting, in which members of the community determine who should benefit based on their knowledge of households’ living standards.
Proxy means tests are of particular interest for the present study, as this was the method employed by the CMP to determine eligibility during the first phase of the programme. Proxy means tests determine applicants’ eligibility by means of a score based on observable characteristics of the household. The indicators and weights used in the formula for proxy means testing are derived from regression analysis of data from household surveys. Usually the information provided by applicants is partially verified during visits by programme officials to applicants’ homes or the examination of documents required from applicants. As Coady et al note, this is an administratively demanding method that is rarely found in low income countries.
Much of the literature, including on Mongolia’s CMP (see World Bank, 2006b), focuses on the effects of targeting on exclusion and leakage rates, often with special attention to the exclusion of the extreme poor. However, it is important also to examine issues such as the adequacy of transfers or the reduction of the poverty gap. If there is broader concern about income inequality,
4

it is also instructive to calculate the benefit incidence of cash transfers among the various deciles of the household income distribution. In addition, within the limitations of data availability, it may be possible to analyse the extent to which transfers benefit children within the household and result in non-monetary improvements in child well-being and human capital development. The present paper adopts this broader approach, using a series of measures to assess the effectiveness and efficiency of the CMP.
2.3. Conditionality in cash transfers A recent development in social transfer programmes has been the emergence of programmes, particularly in Latin America, that build behavioral conditions into their design in order to provide incentives for beneficiary poor households to invest in human capital by sending their children to school or taking them to health centres for check-ups or immunization (Rawlings and Rubio, 2005). By fostering human capital accumulation among the young, conditional cash transfer programmes are intended to help break the intergenerational cycle of poverty and thus reduce future poverty, as well as to provide income support for smoothing consumption in the short term.
The programmes blend two components, the flexibility of cash transfers, which gives spending discretion to households, and the conditions that require recipients to invest in their children. The conditionality tends to cover different aspects of child development, such as education, health and nutrition, in order to exploit their complementarities. Conditional cash transfer programmes are seen as complementing supply-side investments in schools and health services in countries where these have been under-utilized by the poor because of high out-of-pocket expenditures and opportunity costs.
Most conditional cash transfer programmes are noteworthy also for their use of baseline surveys, piloting and robust evaluations in order to learn lessons and adjust programme design before scaling-up. Evaluations compare beneficiaries with a control group of non-beneficiaries with similar characteristics in localities not initially covered by the programmes. Drawing on data from these evaluations, Rawlings and Rubio (2005) find that the programmes have had a considerable impact, with several showing positive effects on school enrolment, nutrition and vaccination rates. However, along with Barrientos and DeJong (2004), they note that it is unclear whether it is the transfer or the conditionality (or both) which is responsible for the observed changes. They caution against assuming that similar positive results can be achieved in other countries with different contexts, especially where there are supply-side constraints on the availability of education and health services and/or there is limited capacity to administer a conditional cash transfer programme, which is complex and costly in terms of assessing eligibility and monitoring compliance with conditions. They also note that conditionality may create some perverse outcomes by penalizing those households that are in greatest need of support but cannot meet the programme conditions.
2.4. The costs of cash transfer programmes In addition to the effectiveness and efficiency of cash transfer programmes, it is essential to measure their cost, to determine whether they are affordable. As a rough gauge of programme affordability, it is common to compare budgetary costs with total government expenditure and with gross domestic product (GDP), although it is also important to take into account broader
5

issues of fiscal space, including the long term sustainability of expenditure on social transfer s. It is common also to compare administrative costs with the value of the benefits themselves, since a programme is clearly more economical if it has a lower ratio of administrative costs to benefits.
A full cost-benefit analysis requires the calculation of the opportunity cost of spending an equivalent amount on alternative programmes. However, assessments of programmes rarely take the analysis of budgetary costs that far because of the complexity of the data requirements as well as the need to estimate the marginal utility of alternative outcomes.
The literature on targeting highlights the different types of costs associated with various forms of targeting, including various types of non-fiscal costs, and stresses the importance of taking these into account when making decisions about whether to target and, if so, what form of targeting to adopt. For example, Van de Walle (1998) identifies three such types of costs: ‘administrative costs’ (of programme administration), which may be particularly high in developing countries if complex targeting methods are employed; costs that arise from incentive effects or behavioral responses; and ‘costs that result from the ramifications of political economy’. Coady et al (2003) add two more: private costs (households’ transaction costs and opportunity costs) and social costs such as stigmatization of beneficiaries.
3. The context of the Child Money Programme
Mongolia is one of Asia’s poorest countries, with a gross national income of $744 in 2005. The country is also one of the most thinly populated in the world, with 2.56 million people (in 2005) spread over a territory of 1.56 million square kilometers (NSOM, 2006), which reflects the fact that less than 1% of Mongolia’s land area is arable. The climate is extremely harsh, with long and bitterly cold winters. Although Mongolia had become the world’s second communist country in the early 1920s, development was slow until well after the Second World War. Until then, almost the entire population remained in a nomadic or semi-nomadic economy, herding livestock, and still today almost 40% of the active population is engaged in this sector of the economy.
However, during the Cold War, when Mongolia received substantial inflows of aid from the Soviet bloc, the government made some progress in diversifying the economy, notably to exploit the country’s large mineral deposits, and succeeded in establishing a system of social services that was impressive for a poor developing country. By the end of the 1980s, Mongolia’s human development indicators were far ahead of most low income countries. For example, adult literacy, which was only 17.3% in 1940, had reached 97.0% by 1989, as a result of a massive expansion of primary and junior secondary education (NFDE/LRC, 2005; Steiner-Khamsi and Stolpe, 2004). This transformation was accompanied by rapid urbanization, with the result that, by the end of the 1980s, about one half of the population lived in urban areas, mainly in the capital, Ulaanbaatar.
6

3.1. Crisis and recovery since the post-Soviet transition Since the collapse of the Soviet bloc, Mongolia has been through a wrenching period of change, creating the context in which the Child Money Programme (CMP) emerged in the mid-2000s. Until 1989, Mongolia’s socio-economic system was modeled on the centrally controlled planning system of the former USSR, while political power was monopolized by the Mongolian People’s Revolutionary Party (MPRP). With the end of the Cold War in the late 1980s, the MPRP, which was the only legal party until 1990, accepted constitutional change, introducing a multi-party system with a freely elected parliament (the ‘State Great Khural’). Several new parties emerged, creating a real pluralism in political life for the first time in Mongolian history. An important consequence of these changes is that, while Mongolia’s new multi-party system has taken strong roots, there has been prolonged (though peaceful) political instability, with elections and shifts in political alliances resulting in frequent changes in government. The political competition among the parties and the fragility of the coalition government formed after the last general elections in June 2004, which resulted in a hung parliament, have created a climate of populist politics, which affected the design and implementation of the CMP.
Economically, the transition plunged Mongolia into an acute economic crisis in the early 1990s. The sudden withdrawal of former Soviet bloc assistance had huge repercussions, as this had regularly financed a large part of government expenditure. Mongolia also suddenly lost guaranteed supplies of oil and external markets. As a result, GDP fell by more than 20% during 1990-92 and inflation soared, reaching a peak of 325.5% in 1992, along with growing unemployment. The Government adopted a ‘shock therapy’ response to the crisis, introducing rapidly a series of economic liberalization measures. From the mid-1990s, the economy slowly began to recover, although further setbacks, including heavy loss of livestock during exceptionally harsh winters (dzuds) in 2000/01 and 2001/02, reduced growth again in 2000-2001.
Since then, as Table 1 in Annex 2 shows, Mongolia’s economy has been much stronger, buoyed by the recovery of livestock herds and a major improvement in the terms of trade, resulting from soaring world prices for the country’s exports of copper and gold. GDP growth recovered to an average of 7% a year in 2002-2006. A rapid increase in tax revenue made it possible to reduce the budget deficit during the early 1990s and then achieve large budget surpluses in 2005-2006 (IMF, 2006). Although this much improved fiscal position remains vulnerable to future external shocks (a large decline in copper and gold prices or another severe winter), it encouraged the political parties to advocate increases in social transfers, resulting in the launching of the CMP in January 2005 and its expansion into a quasi-universal programme in mid-2006.
3.2. Poverty in Mongolia The economic collapse during the early years of the transition resulted in a sharp increase in unemployment (from close to zero at the end of the socialist period to around 20%), sharp falls in government expenditure on the social sectors, rising income inequality and worsening poverty. The rise in unemployment drove large numbers of urban-dwellers to move to the countryside, temporarily reversing the long-term trend of urbanization. Although conditions improved from the mid-1990s, as the economy began to recover, the severe winters in 2000/01 and 2001/02 decimated livestock herds, pauperizing a large part of the rural population and promoting migration back to the towns.
7

The last major poverty study, conducted in 2002/2003 by the National Statistical Office of Mongolia (NSOM), found that 36.1% of Mongolians were living in poverty, with a poverty gap of 11.0% and poverty severity at 4.7%, based on an absolute poverty line representing a minimum subsistence basket of food and non-food items, set at Tog24,743 (equivalent to $21.90 at the time). Poverty was much higher in the rural areas than in the urban areas, and highest of all in the Western region, much of which is desert (see Table 2 in Annex 2).
In the early years of the transition, the fiscal crisis made it impossible for the government to sustain the elaborate system of social services developed in the socialist period. Many of the achievements in social welfare and human development were eroded and the quality of services declined. School enrolment and attendance were also affected by the drop in living standards, which made it more difficult for households to cope with informal school fees and the opportunity costs of sending children to school. This was especially so for boys, who were needed for herding after the dismantling of the former rural collective system and the privatization of livestock. The drop-out rate in basic education (primary and junior secondary) soared to 8.1% in 1991/92 and 8.8% in 1992/93, before gradually declining over the following decade, to 2.1% in 2002/03 (NFDE/LRC, 2005). The junior secondary completion rate, which had reached 93-94% by 1980, fell below 90% in the early 1990s, and has only gradually recovered (World Bank, 2006c).
Public expenditure on the health system, which had previously provided free services throughout the country, also declined in the early 1990s. However, donor assistance, as well as the introduction of a health insurance system, made it possible to restore access to a basic package of services throughout most of the country. Maternal mortality remains high, although about 99% of expectant mothers deliver with the assistance of skilled medical personnel and almost all deliver in medical institutions. Partly due to a sharp decline in fertility rates in the early 1990s, the under-5 and infant mortality rates have declined significantly, to respectively 51 and 41 per thousand live births in 2005 (see Table 3 in Annex 2).
3.3. Evolution of the policy framework for social assistance In addition to providing universal free education and health services, the pre-transition government had a well developed social security and welfare system, including pensions, disability insurance and maternity benefits, while also ensuring full employment.
Although there was no programme comparable to the CMP, the government pursued a pro-natalist population policy and provided generous benefits to women with large numbers of children. Women were entitled to maternity leave on full pay for six months (as of the late 1980s). After returning to work, mothers could send their children to free government-run nurseries and nursing mothers were granted two hours off work for child care. Labour legislation protected expectant and nursing mothers from discrimination or dismissal. In addition, mothers with large numbers of children received ‘honor of motherhood’ medals (1st class for those with eight or more children and 2nd class for those with four or more children).2 These mothers could also take early retirement, five years earlier than other women, and were entitled to generous post-retirement annual allowances. Most of these benefits are still in place. From the mid-1990s,
2 Decree approved by the People’s Great Khural on 3 April 1957.
8
following the closure of nurseries for young children, the government also allowed working women to take maternity leave for up to two years without pay and provided them with child care subsidies of approximately Tog12,000 per month for children up to two years old.
It was difficult, however, for the government to sustain its large and complex social welfare system. By 2003, there were 48 types of social welfare services, 21 of which were not intended for vulnerable groups as such, but only eight types of services at most were available in rural areas. The transition to a market economy has also encouraged the government to introduce new forms of social insurance, including health insurance.
In the past few years, donors as well as technocrats in the Ministry of Social Welfare and Labour, became concerned about the cost of social security programmes, as well as poor targeting. As a result, the government adopted a Social Security Sector Strategy Paper in 2003, setting out guidelines for reform (MSWL, 2003). For the social assistance sub-sector, the strategy aimed to reform services that encourage a ‘feed me’ mentality, rationalize services and improve cost-efficiency, notably through improved targeting, and promote the development of family and community based services for the elderly, children in difficult circumstances, the disabled and other vulnerable groups. This would include a shift away from the use of categorical eligibility criteria to new targeting methods focused on the poor. One of the first challenges would be to develop a targeting methodology suited to the realities of Mongolia. The targeted child benefits introduced in January 2005 were to become the first major test of this new approach.
4. Key features of the CMP
This section briefly describes the main features of the CMP during its two successive phases: the targeted programme implemented from January 2005 to June 2006 and the broader although not completely universal programme that followed from July 2006.
4.1. The targeted programme (January 2005 to June 2006) When it was launched in January 2005, the CMP was a targeted conditional cash transfer programme. It provided a cash allowance of Tog3,000 ($2.49) per child under the age of 18 to all families with three or more children living under the Minimum Subsistence Level (MSL), an official measure defined annually by the National Statistical Office of Mongolia (NSOM).3
In its initial phase, the CMP had two distinctive elements that made it radically different from traditional social assistance programmes in Mongolia. First, it introduced a proxy means test to select beneficiaries on the basis of need, thereby breaking with the past practice of determining eligibility for social assistance through subjective prescreening by local authorities. Second, it introduced a form of conditionality that provided incentives for households to invest in human
3 The MSL varies by regions and in 2005 ranged from Tog22,600 ($18.75) in the Central region to Tog30,000 ($24.89) in Ulaanbaatar.
9

capital development, which was intended to help reduce structural long-term poverty, in addition to providing a cash transfer to help the poor meet their short-term needs (World Bank, 2006b).
The proxy means test had been developed in 2004 following the government’s adoption of the Social Security Sector Strategy Paper. An income-based means test was impractical due to the informal nature of much of the economy, particularly among the herding population in the rural areas as well as among many of the urban poor. The government developed a methodology for proxy means testing that would be applied to a broad range of social welfare programmes (HRSWFM, 2005) and, after its launching, the CMP became the largest programme to apply this new methodology.
Like proxy means tests elsewhere, this test used a formula based on a set of indicators for various household characteristics to generate a score, which would determine the eligibility of applicant households. The formula has eleven indicators, which were derived, with their respective weights, from regression analysis of data from a household survey conducted in October-November 2004. The eleven indicators refer to location, household size, household head’s level of education, household members’ employment, housing conditions, household assets, number of livestock owned, means of transport owned, support and assistance received, the presence of household members with physical disabilities, and other indicators of household vulnerability, such as the presence of elderly members (aged 70+), full orphans, and single mothers or fathers with four or more children (HRSWFM, 2005).
The behavioral incentives built into the programme required beneficiary households to meet a set of conditions. Their children had to be up-to-date on mandatory vaccinations, living with their parents (or officially authorized guardians) and not engaged in harmful forms of child labour. If they were eight years or older, they had to be enrolled in school or non-formal education.
The procedures for enrolling in the programme and receiving benefits were based on provisions in a new Social Welfare Law adopted on 1 December 2005 (Parliament, 2005). Households had to apply first to the governor of the local bagh or urban khoroo (the lowest administrative unit in Mongolia), who would complete and stamp a Household Subsistence General Information Questionnaire (HSGIQ). The applicant would then take the stamped form to the social welfare officer in the governor’s office at district (soum) level.4 The information in the HSGIQ would be used to compute the proxy means test score, thereby determining eligibility. To register in the programme, the applicant would also have to present several documents: the parents’ national identification cards and marriage certificates (if married), the children’s birth certificates and vaccination certificates and, for children aged 8-17, their certificates of school enrolment. There was no requirement, however, to verify subsequent school attendance.
Once registered in the programme, the household would receive a passport-sized benefit book, which was to be stamped monthly by the social welfare officer to authorize payment of the benefit. Benefits were paid through the Agricultural Bank, which has branches at district level throughout Mongolia. Households were not required to pick up their money every month and could opt instead to let their benefits accumulate in the bank, although without interest.
4 Mongolia is divided into 22 provinces (aimags), which in turn are sub-divided into 340 districts (soums). Below them, there are 1,671 rural baghs and urban khoroos.
10

There was one important change in the targeted programme six months after it began. From July 2005, the requirement that households had three or more children was dropped. Thereafter, all households with children could be enrolled as long as they were found to be eligible by the proxy means test and met the behavioural conditions.
4.2. The ‘universal’ programme (since July 2006) On 5 May 2006, the parliament adopted a new law which made the provision of ‘child money’ a universal entitlement, to which all children under 18 years of age would be eligible from 1 July 2006, and introduced new benefits for newborn children and newly married couples, both of which were backdated to 1 January 2006 (Parliament, 2006a). While the child benefit was no longer targeted to those under the MSL, it was not fully universal as two conditions remained in place.5 A child had to be living with his or her family and a school-age child had to be attending school or non-formal education. The two other previous conditions (up-to-date vaccinations and non-involvement in harmful forms of child labour) were dropped.
Registration was greatly simplified by the abandonment of proxy means testing and the lighter conditionality requirements. However, applicants for child benefits still have to provide copies of the child’s birth certificate and of the identity cards of the parents or guardians (all certified by a notary), along with references from the bagh or khoroo governor and from the child’s school verifying residence and school attendance. In the case of children living with guardians rather than their own parents, they are required to obtain references from the soum governor showing that the guardianship has been officially approved under Article 66.1 of the Family Law.6
On 2 June 2006, the parliament set the benefit rates. It maintained the child benefit at Tog3,000 per month, while setting the benefits for newly married couples and newborn children at the levels that had been promised by the MPRP before the 2004 elections (Tog500,000 and Tog100,000 respectively). This resolution was vetoed, however, by President Enkhbayar on 14 June, in order to put pressure on the parliament to include an additional programme component: the introduction of school lunches for primary school children.7 In a second resolution, on 29 June 2006, parliament responded by introducing a supplementary clause to resolution no. 47, specifying that the government would also provide Tog300 ($0.26) per child per day for the cost of providing a ‘tea break’ for children enrolled in primary school grades 1 and 2, starting from the beginning of the next academic year, in September 2006.
In a subsequent development, that took place as this paper was being finalized, the budget for 2007 introduced a quarterly payment of Tog25,000 (about $21.50) to every child under the age of 18 (additional to the existing monthly payment of Tog 3,000). This new quarterly payment 5 Strictly speaking, the child benefits were now based on a form of ‘categorical’ demographic targeting focused on households with children. 6 Likewise, to obtain the benefit for newborn children, applicants have to produce a copy of the child’s birth certificate certified by a notary, a reference from a medical doctor confirming that the child was growing healthily and a reference from the bagh or khoroo governor. To obtain the benefit for newly married couples, applicants had to present copies of the marriage certificate and identity cards (all certified by a notary) and references from bagh or khoroo governors. 7 The President has been a strong advocate of state provision of school lunches as a means of reducing school drop-out and had earlier raised this issue with the UNICEF Executive Director, Ann Veneman, during a visit to New York in 2005.
11
almost tripled the total annual benefit per child. To be paid from a Development Fund, set up in mid-2006 with the proceeds of a new windfall tax on mining companies, it took effect from the beginning of 2007, but was to be contingent on continued high international metal prices.
5. The effectiveness and efficiency of the CMP
This section analyses the effectiveness and efficiency of the CMP, based on the framework developed in Section 2. Such an analysis normally presupposes that a programme has clear objectives or intended outcomes, whose degree of achievement can be measured. As we shall discuss in Section 7, the CMP does not have clearly articulated objectives, so this exercise is based on a number of possible intended outcomes, including the reduction of short-term income poverty, the reduction of inequality, child well-being and human capital development.
Where the necessary data are available, the analysis contrasts the actual effectiveness and efficiency of the targeted programme that was implemented from January 2005 to June 2006 (an ex-post analysis) with the expected (ex ante) performance of that programme as well as the simulated ex ante performance of the quasi-universal programme introduced in July 2006. Two scenarios are considered for the universal programme: one based on the initial monthly benefit of Tog3,000 per child, and the second adding the new quarterly payment of Tog25,000 per child, adopted in the 2007 budget, on top of the monthly payment of Tog3,000. On an annualized basis, these are equivalent respectively to Tog36,000 and Tog136,000.
Within one year of its launching, the CMP had expanded to become by far the largest of the government’s social welfare programmes. By the end of 2005, a total of 647,500 children (63% of the country’s children) from 292,400 households were registered for ‘child money’, according to administrative data from the Ministry of Social Welfare and Labour. As might have been expected, given the country’s poverty profile, there was a higher rate of enrolment in the rural areas (74% of children) than in the urban areas (43% of children). Data from the CMP module of the Household Income and Expenditure Survey (HIES) in April-June 2006 showed that the national CMP enrolment rate had risen by that time (the period corresponding to the last quarter of the targeted programme) to 78.1% of children, with 86.0% of rural children and 69.4% of urban children receiving benefits. The survey data also showed large regional differences in the CMP enrolment rate, ranging from 54.9% of children in the capital, Ulaanbaatar, to 90.1% in the West, which, as the poorest region, might have been expected to have the highest enrolment (see Table 4 in Annex 1).
Overall, however, these very high enrolment rates suggest that there was something seriously wrong with the CMP targeting. While 78.1% of children were receiving CMP benefits, only 42.2% of children were living below the official Minimum Subsistence Level (MSL), according to the HIES data for April-June 2006. In other words, almost twice as many children were enrolled as would have been expected with perfect targeting.
This section analyses the effectiveness and efficiency of the CMP in seven respects:
12

1) The rates of leakage to the non-poor and exclusion of the non-poor (vertical and horizontal efficiency);
2) The impact of the CMP on monetary poverty, as measured by the poverty headcount, poverty gap and poverty severity;
3) The benefit incidence of CMP benefits by household deciles; 4) The value of CMP benefits to households relative to their consumption expenditure; 5) Access to CMP benefits by the most marginalized and vulnerable children; 6) The intra-household use of CMP benefits on behalf of children; 7) The wider social and demographic effects of the CMP, including the effects on non-
monetary dimensions of child well-being and human capital development.
5.1. Vertical and horizontal efficiency One of the most common approaches to measuring the performance of cash transfer programmes is to compare under-coverage and leakage rates. Under-coverage, also known as horizontal inefficiency or the exclusion error, is the proportion of poor households that do not benefit from the programme. Leakage or vertical inefficiency refers to the proportion of programme beneficiaries that are non-poor, and is thus considered an inclusion error.
Mathematically, the under-coverage rate (U) and leakage rate (L) can be denoted as follows:
where q is the total number of poor (households or individuals) and qu is the number of poor not reached by a programme, ri is the number of non-poor included in the programme and ni is the total number of programme beneficiaries.
In the analysis to follow, the MSL is taken as a proxy poverty line. In accordance with the Law on Determining the Living Standard of the Population (1998), the National Statistical Office of Mongolia (NSOM) derives the MSL annually for each of the five regions (West, Khangai, Central, East and Ulaanbaatar) by calculating the monetary value of the food and non-food consumption basket required for basic survival. Those with per capita household consumption expenditure below the MSL are considered to be poor and are eligible, as determined by proxy means testing, for benefits under Mongolia’s targeted social assistance programmes. They were the target group during the first phase of the CMP from January 2005 to June 2006. In 2005/2006, the average per capita MSL, weighted to reflect the regional distribution of population, was Tog25,620 ($21.26 per month).
In the following analysis, HIES data on per capita consumption expenditure (from the April-June 2006 survey) are adjusted to exclude CMP benefits, in order to calculate the number of households that would be above and below the MSL in the absence of the CMP. This is based on the simplifying assumption (to be discussed later in this section) that there are zero net savings
13

from receiving or withdrawing child benefits – in other words that household consumption expenditure expands or contracts to the full value of the benefits.
The high degree of leakage implicit in the CMP enrolment figures cited above is confirmed by the data in Figure 1 (see also Annex table 5). Here the leakage rate shows the percentage of programme beneficiaries living above the MSL. Based on data from the CMP module of the HIES, Figure 1 contrasts the CMP’s anticipated performance, as estimated ex ante by the World Bank from analysis of the properties of the proxy means test (World Bank, 2006b), with the CMP’s actual (ex post) performance in April-June 2006, when enrolment in the targeted programme reached its peak, and with the simulated performance of the universal child benefit programme.
Figure 1: Exclusion and leakage rates (households)(exclusion is % of non-poor households not benefiting; leakage is % of
beneficary households that are non-poor; based on World Bank, 2006b, and April-June 2006 HIES data)
4235
20.7
8.0
3833
56.964.8
0
10
203040
50
6070
Ex ante, proxymeans test
formula
Ex ante, WorldBank alternative
Actual, targeted,April-June 2006
Universalbenefits, ex ante
ExclusionLeakage
The data show that, even without taking into account the CMP’s implementation problems, the targeted CMP had a high ex ante inclusion error due to the properties of the formula used in the proxy means test. Analysis of the formula by the World Bank, based on data from the 2002/2003 national poverty study, reveals that 38% of the beneficiary households could be expected to be non-poor (living below the MSL). As will be discussed further in Section 7, the formula, which is still used for other social welfare programmes in Mongolia, is a very blunt instrument for identifying the poor and non-poor. The World Bank has undertaken multivariate regression analysis to redefine the formula. This would reduce the ex ante inclusion error by 5% to 33%, still quite a high figure, although with a slightly higher concentration of the error among those closer to the poverty line (World Bank, 2006b).
However, actual performance revealed a much higher inclusion error than the 38% expected from ex ante simulation, which means that the targeted programme suffered not only from technical problems concerning the formula used for proxy means testing but also from serious shortcomings in implementation. Our analysis of the HIES data for April-June 2006 shows that 56.9% of beneficiary households and 51.3% of beneficiary children were ‘non-poor’, i.e. living above the MSL. Since this rate of leakage is already extremely high, the shift to an explicitly
14
universal programme raises the proportion of non-poor beneficiaries only slightly, to 64.8% of beneficiary households and 57.8% of child beneficiaries, although this no longer represents an inclusion ‘error’ since by definition the universal programme aims to reach all children.
It is striking, however, that the targeted programme also had a high exclusion error or under-coverage rate, indicating a high degree of horizontal inefficiency. The World Bank’s ex ante analysis pointed to an exclusion rate of 42% (of poor households), with more than one third of the excluded poor (35%) living more than 30% below the MSL. The World Bank’s proposed alternative formula would make it possible to bring the simulated exclusion error down to 35%, with a slightly smaller proportion of those excluded (24%) living more than 30% below the poverty line. However, these are still high percentages, confirming that, even under the best of circumstances (an improved formula and no implementation problems), many of the poor and a significant number of extreme poor would still be excluded.
The actual exclusion rate was lower because enrolment rose far beyond what had been anticipated. Nonetheless, there was still quite a high exclusion rate. Our calculations show that, in April-June 2006, 20.7% of households and 16.0% of children below the MSL were not benefiting from the CMP. It should be noted that the exclusion rate is higher for households than for children because some households below the MSL do not have children and therefore are automatically excluded.
By definition, universalization of the programme, assuming it actually reaches all children, reduces the exclusion rate for children to zero, while excluding only those households below the MSL that have no children (8.0% of poor households). In practice, as we shall see below, some children were still not reached by the ‘universal’ programme, either because of self-exclusion by wealthier families or because of barriers to access by extremely vulnerable and marginalized poor families and by children living outside a family framework.
5.2. Impact on short-term monetary poverty Where a poverty line has been constructed, it is possible to calculate the effects of social transfers on monetary poverty as measured by the Foster-Greer-Thorbecke (FGT) class of decomposable poverty indices (Foster et al, 1984):
where n is the total number of individuals, q is the number of poor, z is the poverty line and c is consumption expenditure. If α = 0, equation [3] is the poverty headcount index, which is the proportion of individuals living below the poverty line. If α = 1, equation [3] represents the poverty gap, which represents the mean proportionate expenditure shortfall over the total population. By setting α = 2, i.e. squaring the expenditure shortfalls before aggregation so as to give a greater weight to the larger shortfalls, the equation gives the poverty severity index.
This section calculates the CMP’s effects on the FGT class of poverty indices, using the MSL as a proxy poverty line. The calculations, which are shown in Figure 2 (and Annex table 6) contrast the ex post changes in the poverty headcount, poverty gap and poverty severity (for children and
15

all individuals) resulting from the implementation of the targeted programme in April-June 2006 with the ex ante changes simulated to result from the universalization of the programme on the two different scenarios for benefit levels (Tog36,000 per year and Tog136,000 per year).
Figure 2: Effects of CMP benefits on monetary poverty among children(Source: calculated from HIES data, April-June 2006)
42.2
38.5
37.9
27.4
15.1
13.0
12.6
7.1
7.8
6.2
6.0
2.7
0 5 10 15 20 25 30 35 40 45
Without child benefits (simulated)
With targeted child benefits atTog36,000/year (actual)
With universal child benefits atTog36,000/year (ex ante)
With universal child benefits atTog136,000/year (ex ante)
Child poverty severityChild poverty gapChild poverty head-count
In its targeted phase, the CMP reduced the child poverty headcount by almost 4 percentage points (from 42.2% to 38.5%) and lowered the child poverty gap by about 2 percentage points, assuming that the child benefits received had raised actual household expenditure by an equivalent amount. Ex ante simulations show that universalization of the CMP further reduces poverty due to the incorporation of the previously excluded poor households. However, the reductions in the child poverty headcount (from 38.5% to 37.9%) and the poverty gap are quite small since only a small proportion of poor households with children (20.8%) had previously not been reached. However, the rise in the benefit to Tog136,000 per year, in accordance with the 2007 budget, has a dramatic effect on poverty, reducing the headcount by a full 10 percentage points (to 27.4%) and cutting the poverty gap from 12.6% to 7.1%.
5.3. Benefit incidence of the CMP It is also instructive to examine how the CMP, under different assumptions, affects households along the whole household consumption expenditure distribution. Benefit incidence analysis was conducted, based on household consumption expenditure deciles from the April-June 2006 HIES (once again deducting child benefits from per capita household consumption expenditure on the assumption of zero net savings from the benefits). This exercise reveals that, although the actual distribution of benefits under the targeted programme is the most progressive (the average benefit per household rises from Tog2,108 in the top decile to Tog6,645 in the bottom decile), universal benefits are also highly progressive for the simple reason that there are many more children in households in the lower expenditure deciles (see Annex table 7). CMP benefits per household under a universal programme are still twice as high in the bottom decile as in the top decile.
16

The different degrees of ‘progressiveness’ can be shown graphically by concentration curves. As shown in Figure 3, both concentration curves for the CMP benefits (for the actual benefit distribution of the targeted programme and the simulated ex ante benefit distribution of the universal programme) are progressive, with the curve for the targeted programme furthest from the diagonal (45o line), i.e. most progressive, as would be expected. However, the fact that targeting was not working well means that the adoption of an explicitly universal programme shifts the concentration curve for the distribution of benefits only slightly closer to the diagonal.
Figure 3: Benefit incidence of child benefits (based on April-June 2006 HIES data)
0
10
20
30
40
50
60
70
80
90
100
0 10 20 30 40 50 60 70 80 90 100
Cumulative distribution of population (%)
Cum
ulat
ive
dist
ribut
ion
of b
enef
its
(%)
Equal distribution
Targeted benefits
Universal benefits
5.4. Value of child benefits to households In the focus group meetings held during the research for this paper, CMP beneficiaries frequently expressed the view that, although ‘child money’ is small, it makes an important contribution to the expenditure of poor families. It was claimed that the CMP is the only source of income for very poor families in rural settled areas who own no livestock and have no other source of cash income apart from family solidarity and charity. By contrast, child benefits are seen as being of little value to wealthier families. This perspective is corroborated by the HIES data, which indicate that the child benefits provided by the CMP are of considerable value to the households in the lowest deciles (as defined above), in particular those in decile 1, when measured relative to average household consumption expenditure (see Annex table 7). The ex post analysis of actual CMP benefits in April-June 2006 shows that the benefits received by the households in decile 1 were equivalent in value to 10.9% of their pre-benefit consumption expenditure, compared to 6.4% for households in the second decile and only 0.3% for those in the top decile, as shown in Figure 4.
Universalization of child benefits (at the same benefit rate) raises these proportions slightly, to 12.6% for the lowest decile and 7.5% for the second lowest decile. Of course, the proportions
17
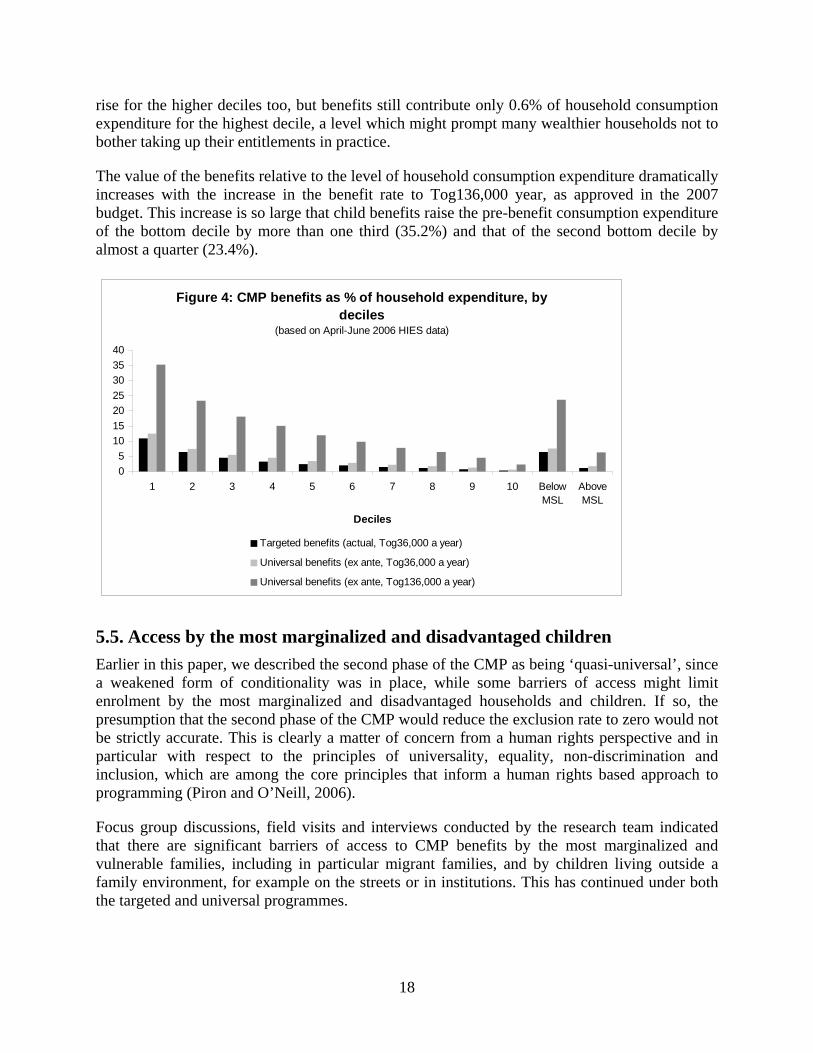
rise for the higher deciles too, but benefits still contribute only 0.6% of household consumption expenditure for the highest decile, a level which might prompt many wealthier households not to bother taking up their entitlements in practice.
The value of the benefits relative to the level of household consumption expenditure dramatically increases with the increase in the benefit rate to Tog136,000 year, as approved in the 2007 budget. This increase is so large that child benefits raise the pre-benefit consumption expenditure of the bottom decile by more than one third (35.2%) and that of the second bottom decile by almost a quarter (23.4%).
Figure 4: CMP benefits as % of household expenditure, by deciles
(based on April-June 2006 HIES data)
05
10152025303540
1 2 3 4 5 6 7 8 9 10 BelowMSL
AboveMSL
Deciles
Targeted benefits (actual, Tog36,000 a year)
Universal benefits (ex ante, Tog36,000 a year)
Universal benefits (ex ante, Tog136,000 a year)
5.5. Access by the most marginalized and disadvantaged children Earlier in this paper, we described the second phase of the CMP as being ‘quasi-universal’, since a weakened form of conditionality was in place, while some barriers of access might limit enrolment by the most marginalized and disadvantaged households and children. If so, the presumption that the second phase of the CMP would reduce the exclusion rate to zero would not be strictly accurate. This is clearly a matter of concern from a human rights perspective and in particular with respect to the principles of universality, equality, non-discrimination and inclusion, which are among the core principles that inform a human rights based approach to programming (Piron and O’Neill, 2006).
Focus group discussions, field visits and interviews conducted by the research team indicated that there are significant barriers of access to CMP benefits by the most marginalized and vulnerable families, including in particular migrant families, and by children living outside a family environment, for example on the streets or in institutions. This has continued under both the targeted and universal programmes.
18
As has already been discussed, some families have found it difficult or costly to enrol, or have been rejected, because required documents are missing, are too old or are damaged. Poor families are those that are most likely to find it difficult to obtain or replace the required documents because of the costs involved, especially in the case of identity documents. Data from the CMP module of the April-June 2006 HIES indicate that ‘lack of documents’ was cited by 26% of households below the MSL who did not apply for child benefits as a reason why they did not do so (compared with 9.1% of households above the MSL). This problem, which is unlikely to have been altered significantly by the switch from a targeted to universal programme, will be discussed in more detail in Section 7, along with the effects of urban residence registration requirements, which makes it difficult or costly for many migrant families to enroll and withdraw benefits.
In conditional cash transfer programmes, there is a risk that the behavioural conditions will exclude the most disadvantaged families if these are in conditions that make it extremely difficult to meet the conditions despite the incentives. In the case of the CMP, one of the initial four conditions, non-involvement in child labour, was never implemented in practice and along with a second, the requirement of full immunization, was dropped in the new universal phase of the programme. Of the two remaining conditions, there is no direct evidence that the requirement for school attendance is a barrier, although this possibility cannot be entirely discounted.
However, the condition that children live with their families is clearly a restricting requirement in the case of children who live on the streets or in institutions. In the case of the estimated 300 orphans and other children living in state owned residential facilities, the government has taken measures to ensure that they are not excluded. Starting in July 2006, their ‘child money’ is deposited in savings accounts opened in the children’s names. However, this measure does not cover the children staying in the approximately 50 private residential facilities run by NGOs and religious organizations.8
Street children, or at least those that are living permanently on the streets without retaining any family ties, are also excluded from the CMP. While it had been hoped that the CMP would encourage families to take these children back home, it is not know to what extent this has happened in practice. The law is also silent concerning children in detention, although the significance of this category of children has greatly diminished since the government took the positive step of releasing all children from prisons in July 2005. However, some children may still be detained in police stations, awaiting trial, and there are no specific provisions in the Child Money Law and related regulations that provide for the payment of benefits to children that are deprived of their liberty.
Thus, while the CMP benefits are contributing to poverty reduction, particularly among children, there are some significant groups of marginalized and disadvantaged children that have not benefited from the CMP, due to documentation problems or the requirement that children live with their families. At the same time, it is important to recognize that child benefits cannot provide the sole solution to such children’s difficulties and vulnerabilities – a point that
8 Acknowledging that this was not fair, the Ministry of Social Welfare and Labour informed the research team that it planned to collect data about children in these institutions and to make arrangements for them too to receive ‘child money’.
19

underscores the need for other social protection interventions to complement cash transfers (Grooten, 2006).
5.6. Use of CMP benefits for expenditure on children Returning to the households that do receive child benefits, what do we know about the use of these benefits within the household? Do they really improve the lives of children or do they mainly benefit adult members of the beneficiary households? Data from the CMP module of the HIES in April-June 2006 provide some answers, although caution must be exercised in interpreting these findings, as survey responses may have been biased by a desire on the part of some of those surveyed to show that they use the money in a ‘correct’ way on behalf of their children. Almost 90% of beneficiaries said that they spend at least some of their ‘child money’ on their children and 57% claimed that they spent the money exclusively on their children.
Many of the beneficiaries said that they spend some of their ‘child money’ on education, in particular on books and stationery (60% of beneficiary households) and on kindergarten and school fees (30% of beneficiary households). This could reflect the increased education costs resulting from the reintroduction of charges for textbooks in the 2005/2006 school-year, which ironically followed shortly after the launching of the CMP.9 According to the households surveyed, another top spending item for CMP benefits is children’s clothing (36% of households), some of which may be for school uniforms.
It is also noteworthy that the assumption of zero savings from child benefits, used to calculate the household consumption expenditure deciles and the number of households living below and above the MSL in the absence of child benefits, is not completely valid. Overall, 15% of beneficiary households said that they use child money to save on behalf of their children. The proportion of households saving CMP benefits in this way is higher for those living above the MSL (18.5%) than for those below the MSL (10.9%). This is consistent with information provided by CMP beneficiaries in the focus group discussions that it is common in wealthier households for ‘child money’ to be used to open savings accounts in the children’s names.
About 43.1% of households use all or some of their CMP benefits for general household purposes, but only 10.5% of survey respondents stated that they used all their ‘child money’ in this way. As might be expected, the proportion doing so was twice as high among those living below the MSL (14.9%) as among those living above the MSL (7.3%).
Only 3.3% of respondents said that they used their child benefits for buying food. However, in the focus group discussions, social workers and CMP beneficiaries said that families, particularly the poorest, tended to use the money for general household needs, including food. In the most extreme cases, they claimed that ‘child money’ was almost the only source of cash income. They also noted that it is common for low income families to use their CMP benefit books to obtain credit from shops, which keep the books as a form of guarantee. However, it would be wrong to conclude that ‘child money’ spent on food and other general household needs does not benefit children in the poorest households, as the resulting increase in household consumption is likely
9 Equivalent to an estimated Tog15,000 per child per year, or 41% of the value of ‘child money’, assuming that each child bought an average of five textbooks per year.
20

to be beneficial for children’s nutrition, clothing, shelter and overall well-being. It is also significant that it is almost always the mothers who register for child benefits and manage the money.
5.7. Wider social and demographic effects Unlike the conditional cash transfer programmes in Latin America, the CMP was not designed and implemented in a manner conducive to evaluating the impact of the programme on human capital development or the non-monetary dimensions of child well-being. The CMP was launched nationally from the start, without any piloting or control groups. There is therefore very little evidence upon which to found a judgment about whether the programme has resulted in improved child outcomes and human capital development and might therefore be contributing to long-term poverty reduction. This is unfortunate because the rationale for conditional cash transfer programmes is that they not only provide poor households with cash to raise their living standards in the short term but also provide incentives for these households to make investments in their children that will improve their life-course opportunities and help break the inter-generational transmission of poverty.
In short, we do not really know whether the programme’s conditionality has had any significant effect on households’ behaviour, although the data in Annex table 8 do provide some limited evidence that CMP benefits are used, at least in part, for investments in children’s education. There is also some circumstantial evidence (from comments made in focus group meetings and data on enrolment in non-formal education) to suggest that the CMP’s eligibility requirements may have encouraged some families to send children who had previously dropped out of school to enroll in NFE courses.10 However, this evidence is insufficient to draw any firm conclusions about the impact of the CMP on enrolment or attendance, especially since, in the absence of strong programme monitoring mechanisms and data-bases on attendance, it is not known whether some households decide to enroll their children formally (or simply persuade school or NFE staff to provide them with certificates of enrolment) in order to obtain the documentation needed to apply for CMP benefits without really sending their children to school or non-formal classes.
Ironically, the reintroduction of charges for school textbooks, in the 2005/2006 school year, risks increasing school drop-out in poor families, possibly canceling out any benefits from the conditionality on school attendance. Two education subsidies are being offered at present: a subsidy of Tog16,000 for education supplies for school pupils from ‘socially marginalized groups’ or living in households with four or more children attending school (MOESC/MOF Joint Order 34/31 of 2001); and textbook vouchers for schoolchildren in households with ‘below average income’ (MOESC/MSWL Joint Order 251/228/94 of 2005). However, poor targeting and inadequate overall funding resulted in 86% of those below the MSL not receiving free textbooks and 56% of free textbooks going to households above the MSL, according to data from the CMP module of the HIES in April-June 2006.
10 Data provided by the National Centre for Non-Formal and Distance Education indicate that enrolment in non-formal basic education (mainly by children) rose by 2.1% in 2005, but by up to 15-20% in some rural aimags.
21

In the quasi-universal programme that began in July 2006, two of the four conditions for CMP eligibility (children being up-to-date on mandatory vaccinations and not being engaged in harmful forms of child labour) were dropped, since officials and parliamentarians had come to the conclusion that neither of these conditions could serve any useful purpose. In practice, the condition on child labour had not been implemented during the first phase of the programme, because there were no mechanisms in place to monitor compliance. Regarding immunization, the view was that immunization rates are already high in Mongolia (see Annex table 2) and there are more effective ways through the health system to detect and immunize children who are behind schedule on their vaccinations. Health workers make regular half-yearly visits to all rural baghs and urban khoroos to identify and vaccinate these children. There is a broad consensus that the conditions on child labour and immunization simply created additional paperwork both for CMP applicants and for officials without having any positive effects.
Finally, it is pertinent to ask whether the CMP might have any demographic effects. It should be recalled that the pre-transition government in Mongolia had an explicitly pro-natalist policy. Although there was no universal child benefit programme comparable to the CMP, the medals and subsidies provided to mothers with more than four children were intended to boost the birth rate. These benefits have remained in place, but the economic crisis that hit Mongolians in the early years of the transition resulted in a sharp decline in the population growth rate in the 1990s -- from an average of 2.8% a year in 1970-1990 to 1.2% a year in 1990-2004 (EIU, 2006a).
In the focus group discussions, social workers were of the view that cash transfers to families with children may increase the fertility rate among the poor and some claimed that this was already observable, with more children born in their soums compared to previous years. The range and size of the benefits now on offer to families, especially during the months immediately after childbirth, are considerable. In addition to the monthly child benefit of Tog3,000 and quarterly payment of Tog25,000, there is the new one-off payment of Tog100,000 for each newborn child (since July 2006), plus a pre-CMP maternity benefit which provides Tog20,000 for five months during pregnancy and seven months after birth to mothers below the MSL. The data in Annex table 9 show that, over the six month period following childbirth, the combined benefits have an average monthly value equivalent to 54% of the average consumption expenditure of households below the MSL (88% in the case of households in the lowest decile). It is reasonable to presume that this provides quite strong pro-natalist incentives to poor families, although there is no statistical evidence to prove this. The introduction of the substantial new benefit for newly married couples could also indirectly contribute to a rise in the birth rate.
6. Cost, affordability and sustainability of the CMP
However effective and efficient a cash transfer programme might be, a crucial question is whether it is affordable and sustainable. This requires an analysis of government expenditure on child benefits, including the costs of the benefits themselves and of programme administration, in the broader framework of the government’s current and expected future fiscal performance. This is the subject matter of the first of two sub-sections. The second uses the limited data available to discuss issues concerning the CMP’s private, indirect (incentive), social and political costs. As in the analysis of effectiveness and efficiency, the analysis contrasts the actual cost of
22
the targeted CMP with the simulated cost of the universal programme, using two scenarios for the child benefit (Tog36,000 a year and Tog136,000 a year).
6.1. Fiscal affordability and sustainability The CMP came into being during a period of economic and fiscal optimism. As Section 3 discussed, the surge in international mineral prices raised real GDP growth to an average of 7.0% in 2002-2006. Meanwhile, there has been a significant fiscal consolidation, with the budget moving into large overall surpluses in 2005 and 2006 (at 2.9% and 9.0% of GDP respectively), providing considerable ‘fiscal space’ for the launching and later expansion of the CMP.
In 2005, the targeted programme cost a total of Tog18.1 billion, equivalent to 2.4% of total government expenditure, or 0.7% of GDP (see Annex table 10). Given the healthy state of the economy and the fact that government finances were moving into overall surplus (at 2.9% of GDP), the targeted CMP was clearly affordable, at least in the short term, despite the high rate of leakage of benefits to the non-poor. It should be noted that these figures on the fiscal cost of the CMP refer only to the value of the benefits, without taking into account the programme’s administrative costs, for which no data are available, partly due to the fact that the social workers who manage the programme and interact with beneficiaries are responsible for the full range of social welfare programmes at local level. In fact, additional administrative expenditure to cope with the burden of managing the CMP was very limited, as no new staff were recruited, resulting in a shift of existing administrative resources from other programmes, rather than a significant increase in overall administrative expenditure on social welfare programmes.
The fiscal context became even more favourable in 2006, as metal prices remained at record highs. In June, the Mongolian parliament approved a budget revision that introduced a windfall tax on mining companies (for allocation to a special Development Fund) while metal prices remained at exceptionally high levels. The revised budget also raised expenditure, including the increases in budget allocations needed to fund the extension of child benefits to all children and the implementation of the previously promised benefits for newborn children and newly married couples (backdated to January 2006).
Based on an expected expansion of child benefit coverage to 1.04 million children in the second half of 2006 (under the new universal programme), the Ministry of Social Welfare and Labour projected that expenditure on child benefits would rise to Tog29.6 billion in 2006 and Tog36.7 billion in 2007. Including also the cost of the benefits for newborn children and newly married couples, the total expenditure on all three benefits was expected to rise to Tog40.1 billion in 2006 and Tog47.8 billion in 2007. The Government also allocated Tog2.7 billion for the new school feeding programme, which would provide 110,000 schoolchildren in the first and second grades with snacks (milk and biscuits) during term-time, in September-December 2006.
Restricting analysis to the cost of the child benefit, it may be seen from Annex table 10 that this is estimated to have accounted for 2.8% of total government expenditure and 0.9% of GDP in 2006, taking into account the switch from a (poorly) targeted programme to a universal programme half way through the year. This was clearly affordable, given the huge overall budget surplus. Maintaining the universal programme at the same benefit level (Tog3,000 per child per month) for the whole of 2007 would have changed these ratios only marginally.
23

Figure 5: Expenditure on child benefits, 2005-2007(Source: calculated from budget data and CMP administrative data)
2.4
2.8
2.6
9.5
0.7
0.9
1.0
3.9
0 2 4 6 8 10 12
Actual, 2005 (targeted at Tog36,000/year)
Estimated, 2006 (universal from June)
Simulated, 2007 (universal at Tog36,000/year)
Projected, 2007 (universal at Tog136,000/year)
% of Govt expenditure % of GDP
However, the 2007 budget included a large increase in the benefit level, adding new quarterly payments of Tog25,000 per child, to be financed from the Development Fund so long as metal prices remained high. Assuming this was to be fully implemented in 2007, the annual child benefit was set to rise from Tog36,000 to Tog136,000, raising the overall cost of the programme to 9.5% of projected government expenditure and 3.9% of projected GDP. This was part of a more broadly expansionary budget, which projected an overall budget deficit of 5.0%.
The financing of a budget deficit on this scale is well beyond what is considered to be consistent with the maintenance of low inflation and the sustainability of Mongolia’s public external debt. Moreover, although much of the increased expenditure, including that on the new quarterly child benefits, is to be financed from the Development Fund and is supposed to be reduced if windfall mineral receipts decline, both the large overall balance and the huge increase in the expenditure on child benefits in particular must be seen as highly risky, given Mongolia’s exposure to a possible sudden fall in mineral prices (or a major drought) and the political difficulty of cutting back on the benefit levels of social transfers if such an external shock were to occur.
It is also important to bear in mind that expenditure on child benefits has an opportunity cost in terms of the foregone expenditure on other government programmes, for any fixed total level of government expenditure. It is pertinent to inquire whether additional spending on child benefits might be better spent on, say, improving education or health services, or developing economic infrastructure. Due to the limited scope of this research, it is impossible to undertake such an analysis of the opportunity cost of the CMP, which would require data on the costs, outputs and outcomes of the full range of government programmes. Such a comprehensive analysis of ‘value for money’ would be more appropriate in a public expenditure review. We will therefore make only some general observations on this subject.
First, total social expenditure is quite high compared with most developing countries. During the period from 2002 to 2005 it consistently accounted for more than half of total government expenditure and about one fifth of GDP. In 2005, social security and welfare expenditure
24

increased to 24.3% of total government expenditure and 8.2% of GDP, reflecting the start-up of the CMP, along with increases in pensions and other social security and welfare programmes. Expenditure on education and health declined relative to GDP between 2002 and 2005, but this was due to the rapid increase in GDP rather than crowding out by social security and welfare expenditure. Education and health expenditure, relative to GDP, also remains quite high by comparison with most developing countries: for example, the world average for education is around 5%, compared with 6.5% in Mongolia in 2005.
Nonetheless, it seems anomalous that in the same year that the government introduced the CMP, it also abolished the provision of free textbooks to schoolchildren. Arguably, from the perspective of human capital development and long-term poverty reduction, it might have been better to spend more money on free textbook distribution and less on discretionary cash transfers to households – a viewpoint shared by many of the participants in the focus group discussions. It is also noteworthy that, when asked about priorities for long term poverty reduction, a common viewpoint was that employment generation was more important than ‘child money’, an opinion which suggests that the government needs to give greater priority to stimulating private investment in its overall development strategy.11
6.2. Private, indirect, social and political costs While analyzing the fiscal costs of the programme, it is important not to lose sight of the private costs sustained by households receiving benefits or applying for enrolment. The transaction costs involved in applying for child benefits could be substantial or even prohibitive for those without the necessary documents, especially if they live in rural areas and need to obtain new identity documents or change their residence registration. Participants in a focus group meeting in a rural soum in Dundgovi aimag estimated that it would cost between Tog15,000 and Tog20,000 (i.e. approximately 40-55% of the value of one year’s child benefits), including the costs of transport, to replace a lost identity card, which requires travel to the aimag centre, announcement of the loss in a newspaper and the payment of a penalty.12
According to data from the CMP module of the April-June 2006 HIES, the transaction costs for receipt of child benefits are also significant, especially for those living in the countryside, far away from soum centres, where payments are received. Although 90% of households collect their child benefits monthly, the amount of time required for the round-trip journey to receive the benefits averages 4.3 hours in summer and 4.9 hours in winter for those living in the countryside, outside soum centres, compared with 1 hour in summer or winter for those living in Ulaanbaatar see Annex table 12). The total cost per journey is more than one third of the value of the monthly benefit per child, for households living in these rural areas outside soum centres, and more than six times higher than for those living in Ulaanbaatar.
There is no evidence that the CMP, in either its targeted or universal phases, has had significant indirect or incentive costs, although some focus group participants suggested that it might reinforce a dependency ‘mindset’. This view is based on the notion that, since socialist times, Mongolians expect hand-outs from the state as a right, but there is no hard evidence that, if this is
11 Public investment expenditure in Mongolia is very low, averaging only 5.3% of GDP in 2002-2005. 12 By contrast, birth certificates can be obtained easily at soum level.
25

true, it diminishes the incentive to work. Such disincentives normally occur in programmes with income means tests, since some individuals may choose to reduce their earned income in order to obtain eligibility. This kind of perverse effect is unlikely in a programme with a proxy means test and cannot arise in a programme with universal eligibility.
In the focus group meetings, it was frequently claimed that the targeted programme resulted in stigmatization of those receiving benefits, since it quickly became known (apparently even among the children themselves) who was receiving benefits. Although this is difficult to accept at face value given the high level of leakage to the non-poor, this ‘social cost’ was one of the main reasons cited by those who supported the programme’s conversion into a universal programme.
Finally, there can be no doubt that the targeted programme also had high political costs. It was widely seen as being unfair, on the grounds that it discriminated by excluding some children. This is consistent with the prevalent universalist attitude towards social transfers in Mongolia, discussed in the next section, and was almost a consensus view among the participants in the focus group discussions. It explains why there was growing and ultimately successful political pressure to change the nature of the programme in mid-2006 and why a return to a targeted programme now appears to be politically unrealistic.
7. Factors explaining the evolution and performance of the CMP
This section turns to the factors that explain the evolving nature and performance of the CMP. There are two parts. The first focuses on issues of political economy, highlighting the role of inter-party competition in the genesis of ‘child money’ and the shift from targeting to universalism, as well as the significance of public perceptions about the programme and its purpose. The second examines a series of shortcomings in the design and implementation of the programme, including the methodological weakness of the proxy means test used for targeting, the manipulation of eligibility procedures, the weak capacity for programme administration, the barriers to enrolment that can result from the programme’s documentation requirements, and the failure to establish a robust monitoring and evaluation system.
7.1. Party politics and public attitudes The literature on cash transfers notes that programmes targeted exclusively on the poorest households sometimes fail to command public support, leading to the erosion of political commitment, since the majority of the electorate does not benefit directly. Although it is argued that this negative response can be overcome, through promotional campaigns that appeal to a moral sense of justice or even the long-term best interest of the non-poor (van de Walle, 1998), these political costs of targeting can leading to the erosion of budgetary commitments (or their failure to keep up with inflation) or the demise of targeted programmes. The CMP provides a graphic example of the role of electoral politics and public attitudes in condemning a targeted programme to failure and substituting it with a far more popular universal programme.
26
The political dynamics of the CMP
The CMP must be understood, first of all, as a product of its political context. Since the transition from the one-party system, there has been acute political competition among the main parties, the MPRP and the Democratic Party (DP), accentuated by frequent shifts in political alliances, involving also various minor parties. Not only have there been frequent changes in government, but since the general elections in June 2004 there has been a hung parliament and a highly unstable coalition.
This environment has stimulated a populist approach to politics among the parties, which have competed for support by trying to outbid each other in their promises to the electorate. Given the socialist past and its system of generous welfare provisions, and widespread concern about poverty and rising inequality, it is perhaps not surprising that the parties would give prime place in their political strategies to promoting themselves as champions of social welfare. In addition, the large rise in government revenues since the early 2000s prompted opposition politicians to voice complaints that the people had not yet reaped the benefits of the surge in mining income, while also providing them with greater ‘fiscal space’ in which to propose increases in social expenditures. This was the context in which ‘child money’ emerged as a hot political issue during the June 2004 elections.
During the election campaign, the incumbent MPRP and the opposition bid for votes by making rival promises to introduce cash transfers to families. In its election manifesto, the opposition promised a monthly allowance of Tog10,000 for every child, claiming that this would result in ‘elimination of unequal income distribution in the society, decrease of poverty, support to young families, and improvement of relationships between parents and children’.13 As for the MPRP, it promised Tog100,000 for every newborn baby, to ‘support population growth’, and Tog500,000 for every newly married couple under a policy of ‘support to young families’.14
After the elections, negotiations among the parties in the new coalition government resulted in a compromise. The launching of the CMP as a conditional cash transfer programme, involving a proxy means test and providing a benefit lower than had been promised (Tog3,000 per child), was also heavily influenced by advice from donors. The latter were primarily concerned about the poor targeting and fiscal sustainability of Mongolia’s social welfare programmes and had long urged improvements in targeting, in accordance with the Social Security Sector Strategy Paper, prepared by the MSWL with the assistance of the Asian Development Bank (ADB) and approved by the MPRP government in November 2003 (MSWL, 2003).
There was continuing pressure, however, to bring the programme closer into line with what had been promised by the parties in the 2004 elections, particularly as the boom in metal prices was raising government revenue to record levels and producing increasingly large budget surpluses. Politicians, particularly from the Democratic Party (DP) after it left the governing coalition in January 2006, echoed the widely held view among the public that it was unfair to give child benefits only to some children and argued that the surge in government revenue made it affordable to extend the benefits to all families with children. Anxious not to be outflanked
13 Action Programme of the Motherland Democracy Coalition. 14 Action Programme of the MPRP.
27

politically, the MPRP revived its proposals for allowances for newborn children and newly married couples. With the fiscal context increasingly favourable, the outcome was a new inter-party deal that led to the resolutions in the State Great Khural in June 2006 introducing the universal child benefit along with the allowances for newborn children and newly married couples.
In short, domestic political dynamics not only gave birth to a major new programme, but ended up outflanking the donors and technocrats who had been advocating reforms in social welfare to improve targeting to the poor and ensure long-term fiscal sustainability. The Social Security Sector Strategy Paper was to all intents and purposes left marooned, prompting the ADB to cancel a pending $3 million tranche of its social security sector policy loan that had been assisting the design and implementation of social security reforms since 2001.
There seems to be little doubt, now that all families with children are eligible to receive ‘child money’, that it would be politically difficult or even impossible to cancel the programme or switch back to a targeted approach. Donor agencies interviewed by the research team, including ADB, the World Bank, and the United Nations Development Programme (UNDP), as well as UNICEF, all acknowledged that it would be extremely difficult to go back to a targeted programme, at least until the next general elections, which are due in 2008.
Public perceptions and attitudes
The emergence and evolution of the CMP in a direction (and on a scale) completely at odds with the tenor of the Social Security Sector Strategy Paper reflects the fact that the donors and their technocratic allies in the MSWL were not speaking the same language as the political parties and much of the public. While the donors and technocrats usually assume that the CMP was intended to improve the welfare of the very poorest, the general public has seen it differently. The focus group discussions with parents and children revealed that families have understood the CMP as a programme for all children, to ensure their well-being and development. They therefore felt that it was important to universalize it, so that all children could benefit without discrimination and also to avoid stigma. Beyond that, the rhetoric of the politicians presented child benefits as a way for all families, or at least all families with children, to gain from the country’s increased mineral revenue, thereby giving it mass appeal. Thus, right from the beginning, there were radically different perspectives on the true purpose and objective of the programme.
This lack of consensus over objectives seems to reflect a deeper clash between the self-interest of the majority of Mongolians, as articulated by the politicians, and the donor/technocrat agenda of ‘poverty reduction’ and fiscal prudence. In addition, there may be an element of ‘cultural misunderstanding’, along the lines of the thesis of Steiner-Khamsi and Stolpe (2004), who have argued that donor-advocated reforms tend to fail in Mongolia because of linguistic misunderstandings and ‘cultural legacies from the socialist past’. In the case of the CMP, public attitudes probably spring partly from the universalist language associated with socialism and the traditional role of categorical entitlements in Mongolia’s social welfare system. In addition, although everyone may assume that the CMP is meant to contribute to ‘poverty reduction’, the latter may be interpreted in different ways. For the donors and technocrats it tends to mean focusing on the poorest households, i.e. more or less the bottom third of the income distribution that lives below the MSL, while for most Mongolians it can be interpreted as an improvement in
28

the living conditions of the vast majority. From that perspective, poverty reduction and universalism are not seen as contradictory.
7.2. Shortcomings in programme design and implementation Compounding the problems arising from the confusion over objectives, there have been serious weaknesses in programme design, planning and implementation. These include shortcomings in the formula used to determine eligibility through the proxy means test, manipulation of the enrolment process, inadequate planning and capacity development for delivering such a large and complex programme, overly burdensome and costly documentation requirements and the lack of robust monitoring and evaluation mechanisms.
Flaws in the proxy means test
In their analysis of targeted cash transfer programmes in developing and transition countries, Coady et al (2004) note that, for proxy means testing to work well, it is necessary to be able to identify, through analysis of household survey data, variables that are closely correlated with household income, that can be easily observed and that cannot be easily manipulated by households in order to gain eligibility. They note that in many cases the formulae at best only explain about half of the variation in consumption among households and often substantially less, and that ‘the prediction for each individual, even if unbiased, has a large standard error, a fact not really taken into account in current practice with proxy means tests’ (p. 54).
In the case of the CMP, Section 5 has already shown that, before taking into account the programme’s implementation problems, the targeted CMP would have been expected to have high ex ante leakage and exclusion rates (38% and 42% respectively) due to the properties of the formula used in the proxy means test, known as the poverty risk ratio (PRR). Worse, much of the leakage and exclusion would be among households far above or below the poverty line. This would obviously be unacceptable for a programme that was intended to benefit the poor.
It was clear from the focus group discussions that there was deep skepticism of the criteria used for selecting beneficiaries. There is a widespread perception that some genuinely poor applicants were excluded while many non-poor households were admitted. Social workers were blamed for being unfair. There was particular criticism that the criteria were the same in both urban and rural areas and so failed to take into account the important differences in the nature of the household economy between urban and rural areas, particularly with respect to the role of livestock and means of transport (two of the key variables in the PRR), which they argued were productive assets in the household herding economy and had little relationship to levels of household consumption. In short, the proxy means test was seen as being urban-biased.
The World Bank has provided a critique of the methodology used to derive the PRR, pointing out that it is based on bivariate rather than multivariate relationships between poverty and other household characteristics (World Bank, 2006b). The Bank has proposed an alternative methodology that determines indicators and their weights simultaneously through ordinary least-squares regressions on the logarithm of per capita consumption, using the LSMS data from 2002/2003. This would also estimate models for four types of location (Ulaanbaatar, aimag centres, soum centres and countryside).
29
However, the alternative methodology proposed by the World Bank would reduce only slightly the ex ante leakage and exclusion errors (to 33% and 35% respectively) and likewise reduce only slightly the proportion of leakage and exclusion occurring furthest from the poverty line (see Figure 6). Of particular concern is the fact that, even without any implementation errors, the properties of this best available alternative to the PRR would exclude more than one third of poor households from benefits, with almost one quarter (24%) of these excluded households living 30% or more below the poverty line. The core issue is whether such a high exclusion error is acceptable, particularly since this could affect access to a wide range of other social welfare benefits beside the CMP.
Manipulation of eligibility procedures
The fact that the actual leakage rate was about two thirds higher than the already high simulated rate (while the actual exclusion rate was significantly lower) shows that the problems did not stop with the design of the formula for proxy means testing. The whole process of determining eligibility was obviously deeply flawed. It ended up enrolling in the programme vastly greater numbers of beneficiaries than would have been expected on the basis of the model alone. On several occasions during the focus group discussions there were allusions to the manipulation of the process by applicants and officials, and the World Bank study likewise noted that ‘there is large anecdotal evidence that documents the subjectivity of the process’ (p. 3).
Wealthier families tried to hide sources of income and assets in order to gain eligibility, and some applicants seem to have persuaded or paid officials to issue them with false certificates. At the same time, it is highly likely that some officials adjusted applicants’ data to meet the eligibility threshold when computing the proxy means test score. The responsibility given to the local governors in completing and stamping the Household Subsistence General Information Questionnaires (HSGIQ forms) which was the first step in the process of applying for enrolment in the targeted programme, would appear to have been particularly open to abuse, given the governor’s political status as elected officials. Besides increasing the risk of favouritism, there is some evidence that this discouraged some would-be poor applicants from even starting the process of application. According to data from the CMP module of the HIES in April-June 2006, when targeting was still being applied, 35.7% of households living below the MSL who did not apply for ‘child money’ said that this was because they were ‘not on the governor’s list of poor families’ and 23.8% said that it was because the governor would not provide them with the necessary certification. Some local officials and focus group participants said that the application and enrolment process had generated tensions between families, governors and social workers.
Inadequate planning and capacity
The CMP was launched in a rush, only a few months after the proposals for ‘child money’ were made during the 2004 elections. As a result there was no proper piloting. Planning was minimal and no additional social workers or administrative personnel were hired to implement the programme. The programme brought a huge increase in workload, especially in its initial phase of enrolment. Discussions with social workers and local officials indicate that, from 2005, they had to spend most of their time on the CMP, at the expense of other programmes such as
30

employment, pensions and assistance for orphans and people with disabilities.15 Likewise, although Tog100 million was allocated in 2005 to print application forms, the HSGIQ and the beneficiary booklets, social workers and other local officials expressed concern about the limited financial resources and equipment, including computers, to administer the CMP. The paperwork has often had to be handled manually.
The more sophisticated programmes using proxy means testing, such as those in Latin America, use home visits by programme officials as part of the application procedure, in order to verify information and so reduce leakage. Often the proxy means test form is filled out on the spot in the applicant’s home (Coady et al, 2004). However, such a labour-intensive approach was impossible for the CMP, given the limited staff resources.
The absence of an integrated programme management information system has been another important weakness. This may have made it possible for some families to succeed in enrolling in more than one location, as there is no way to check previous enrolment in another part of the country. The research team was told of cases where families had managed to register twice – once under the mother’s name and again under the father’s name. On the other hand, the absence of a nationwide data-base means that beneficiaries who migrate cannot draw their benefits without returning to their place of enrolment – a weakness affecting all social welfare programmes.16 In fact, the problem goes beyond the social welfare system, as the lack of an integrated management information system for civil registration also hinders the enrolment of migrants without local residence registration and makes it difficult to verify (or if necessary reissue) the documents required for enrolment, such as ID cards, birth certificates and marriage certificates.17
Adverse effects of the documentation requirements
As the comments above indicate, some families, particularly among those that are most disadvantaged, have found it difficult to obtain the documents required for enrolment in the CMP. According to the data from the CMP module of the HIES in April-June 2006, 26% of households living below the MSL who had not applied for child benefits (when the CMP was still a targeted programme) cited the lack of required documents as one of the reasons. To some extent, the documentation requirements have become lighter under the universal programme. For example, it is no longer necessary to complete the HSGIQ or provide proof of vaccinations. However, some people do not have the remaining required documents (children’s birth certificates, the parents’ ID cards, marriage certificates and letters from schools certifying that their children are enrolled) or have lost them. Discussions in the focus groups indicated that sometimes applications are rejected because the documents are too old or are damaged. As Section 5 has documented, the procedures to replace missing documents can be slow and involve charges or fines, imposing significant direct and opportunity costs, especially for the poor. Furthermore, migrants who have not registered their residence in the areas to which they have moved cannot apply to enrol in the CMP at the new location. They either have to return to their 15 At the time of this research, the Ministry of Social Welfare and Labour was negotiating with the Ministry of Finance to include funds in the 2007 budget to hire one additional social worker in all 70 soums with a population above 4,000. 16 ADB is currently developing a project to set up such an information system. 17 UNDP is planning to support the government to improve computerization of the civil registration system.
31

area of registered residence or register their residence in the new location, which is costly and time consuming.18
A weak monitoring and evaluation system
The fact that the CMP was introduced nationwide without any prior piloting was undoubtedly one of the most serious planning errors. It removed the opportunity to monitor programme performance and learn from experience in a limited geographical area before making necessary design adjustments and scaling up. It has also made it difficult to evaluate programme impacts by measuring and comparing changes in outcome indicators in both programme areas and non-programme areas serving as control groups. This kind of robust evaluation mechanism, which has been one of the strong points of conditional cash transfer programmes in Latin America (Rawlings and Rubio, 2005), has been completely lacking in the case of the CMP.
Even routine monitoring of programme implementation and performance has been severely compromised by the staff constraints and the absence of an integrated social welfare management information system. There was no real monitoring of the application of the proxy-means test methodology and there has been no systematic monitoring of school drop-out to monitor compliance with the behavioral conditions of the programme (World Bank, 2006b). A positive development, however, was the inclusion of the special CMP module in the HIES in April-October 2006 to gather information on such issues as the use of child benefits, the transaction costs of beneficiaries and the barriers to enrolment. However, there is still not yet a real system for regular monitoring of programme implementation and performance.
8. Policy recommendations
The previous sections have discussed the performance of the CMP, in terms of its effectiveness, efficiency and costs, and the political, institutional and technical factors that have influenced the programme’s design and implementation and the quality of its performance. This section draws out the policy implications of this analysis, focusing broadly on four sets of issues. First, based on the evidence presented in this paper, would it be advisable for the Mongolian government to return to a targeted programme, after fixing the problems that undermined the programme’s efficiency, or should it rather continue with the new universal programme? A second related issue is whether child benefits are affordable and sustainable at their new benefit rate of Tog136,000 per year. Third, what measures are needed to strengthen the capacity and systems for management, monitoring and evaluation of the programme? And last, what could be done to overcome the obstacles that deny child benefits to some of the most marginalized and vulnerable children?
8.1. Universal or targeted child benefits? In theory, targeting is justified by the need to concentrate limited resources on the poor, as well as concerns that a rise in expenditure to cover all households with children might be fiscally 18 In one case known to the research team, a very poor family in a peri-urban slum area of Ulaanbaatar would not register their residence out of fear of being asked to pay for the land where they had erected their dwelling.
32

risky and unsustainable. However, the evidence provided in this paper provides a strong case for maintaining the universal child benefit, rather than attempting to return to a targeted approach.
First, any proxy means test in Mongolia, irrespective of improvements in the formula used for determining eligibility, will remain a blunt instrument. It is extremely rare for the weighted variables used in proxy means tests to provide a robust explanation of the variation in consumption expenditure. Any proxy means test is likely to lead to high leakage and exclusion errors, even with the best possible formula, and this is clearly the case in Mongolia. Not only was the formula used during the targeted phase of the CMP deeply flawed, but the improved formula proposed by the World Bank (2006b) still leaves very high exclusion and leakage rates. The most worrisome finding is that, based on the properties of the best available formula and without taking implementation problems into account, the proxy means test would lead to the exclusion of at least one third of the poor (35%). This is unacceptable for a programme intended to reduce poverty.
Second, it is probable that leakage would be much higher in practice than the (already high) simulated figure of 33% under the World Bank’s best alternative formula. Given the tightly knit nature of Mongolian communities, it would be extremely difficult to halt entirely the collusion between applicants and those determining eligibility, who often know each other well. Ending the involvement of the district governors in the first step of the application process would simplify the procedures, but not remove the opportunities for collusion between applicants and social welfare officers, who can easily ‘fix’ households’ data to meet the eligibility threshold.
Third, due to the exclusion error associated with proxy means testing, the current universal programme has a slightly larger impact on poverty reduction (and thus the achievement of MDG 1) than a targeted programme. The fact that this improvement is quite small reflects the fact that the targeted programme had itself come close to becoming a universal programme in practice.
Fourth, even though a targeted programme would be more ‘progressive’, a universal programme concentrates benefits disproportionately in favour of poor households, simply because there are many more children in households in the lower deciles. In practice, the universal programme could be more progressive than this, as there is considerable anecdotal evidence to suggest that many households in the higher deciles are opting not to receive child benefits because of the inconvenience of the time spent in enrolling for and receiving what they regard as a very small source of income (a form of self-exclusion).
Fifth, a universal programme is affordable. Mongolia has a much strengthened fiscal position, with large overall surpluses since 2005, and thus the ‘fiscal space’ to accommodate a programme which (at the initial benefit rate of Tog36,000 per year) would account for only 2.6% of total government expenditure and about 1.0% of GDP. This is comparable with the expenditure on conditional cash transfer programmes in Latin America, which are generally in the range of 1-2% of GDP (UNDP, 2006). Mongolia can afford a programme of this size and should be able to sustain it, despite the risks associated with the country’s exposure to sharp fluctuations in international metal prices and adverse weather conditions.
Finally, there is strong public support for the universal programme, which is founded on a broad consensus that all children should benefit, without discrimination or stigmatization, in order to
33

promote their well-being and development. Now that all families with children are eligible, a return to targeting would be politically costly and inadvisable.
8.2. What level of benefit? The decision in the 2007 budget to raise the annual value of the child benefit to Tog136,000, including Tog100,000 contingent on continued high metal prices (to be financed from the Development Fund), is a bold new development. As such, it would substantially reduce income poverty. The simulation in Section 5 showed that, assuming the additional cash transfer raises household consumption expenditure by an equivalent amount, the poverty headcount would fall by more than one quarter (from 37.9% to 27.4%) and the poverty gap by almost one half, making a very significant contribution to the achievement of MDG1.
The question that arises is whether such a large increase in child benefits is affordable and sustainable. It could be expected to raise child benefits to 3.9% of GDP, well above the normal range for such cash transfer programmes, and to 9.5% of total government expenditure, a level at which there is a much higher risk of the need for a sizeable downscaling in the event of a shift in fiscal fortunes. Given the country’s external vulnerability, it would be prudent for the government to follow a more counter-cyclical fiscal policy, consistent with long-term trend prices for the country’s key minerals. As the IMF has argued (2005), it would be advisable to accumulate assets during the present period of high copper and gold prices in order to increase the ability to maintain expenditure when prices decline, and also to use windfall revenues for investments in physical infrastructure, which is poor in Mongolia and critical for sustainable long-term economic growth and job-creation. The government should therefore be particularly cautious about introducing large increases in social welfare benefits during the present period of high revenues, to avoid the risk of later having to reduce benefit levels, which would be politically difficult and also accentuate the negative effects of an economic downturn on poverty.
It is also important to consider the opportunity cost of spending additional public resources on child benefits, in terms of the relative benefits of alternative possible uses for those resources on other programmes. It might be preferable to direct additional resources to programmes with a more direct effect on children and, through human capital development, on long-term poverty reduction. In particular, the government could consider allocating additional resources for the reintroduction of free textbook distribution, or the development of state-financed services to provide specialized protection services to children in situations of abuse or special vulnerability.
8.3. How to improve capacity and systems for programme management, monitoring and evaluation? The CMP was launched with weak systems for management, monitoring and evaluation. In particular, despite the scale of the CMP, there was no increase in the staff responsible for social welfare programmes. Their workload needs to be carefully assessed, with a view to identifying and meeting the extra staff requirements needed to administer the CMP without compromising the delivery of other social welfare programmes. Second, there is an urgent need to set up an integrated programme management information system in order to avoid double enrolment, enable beneficiaries to receive payment when moving to new locations and facilitate monitoring. This could be used to strengthen the management of all social welfare programmes, including the CMP.
34

An additional step would be to establish a monitoring and evaluation system, with an appropriate set of indicators and mechanisms in place to collect and manage the necessary data, so that there is regular tracking of programme implementation and it is possible to carry out periodic evaluations of programme performance. The proposed increase in staffing and the establishment of an integrated programme management information system would help create the capacity for this.
8.4. How to reach the most vulnerable and disadvantaged? Although ‘child money’ is clearly making a contribution to poverty reduction, it is important to tackle the barriers that, despite the shift to a theoretically universal programme, still appear to exclude some of the very poorest and most vulnerable families and children.
First, the programme condition requiring that children live with families should be dropped. Besides discriminating against some of the most marginalized and vulnerable children, this condition does not seem to be the most effective way to bring children back into a family setting. The special arrangements made to enable orphans and other children living in state-owned institutions to receive ‘child money’ should be extended to the larger numbers accommodated in residential facilities run by NGOs and religious organizations, as well as to children living on the streets or detained in prisons, police stations or any other institutions.
Second, while it is not possible to remove entirely the remaining documentation requirements for CMP beneficiaries, measures need to be taken to make it easier and cheaper for people to replace missing documents, especially identity cards. For example, there seems to be no need to require those applying for the re-issuance of ID cards to place announcements in newspapers announcing the loss of their cards, and the charges for ID cards could be reduced.
Third, it should be made easier for migrants to enroll in the programme and draw benefits in their new areas of residence. Clearly, that requires the establishment of an integrated management information system for civil registration, but that is an investment that would be well worth making to improve the efficiency and security of the whole civil registration system, as well as to make it more flexible and convenient for citizens who move residence. This would also strengthen the access of migrants to other social welfare programmes besides the CMP.
Fourth, it is necessary to investigate further the advantages and disadvantages of the condition requiring children to attend school. At present, it is not known whether this plays any positive role in promoting school attendance and discouraging drop-out or whether it has the unintended consequence of barring access to the CMP by some extremely disadvantaged children.
However, it must be stressed that cash transfers do not provide a solution for all protection problems. Children living in situations of extreme vulnerability also require support in other forms. The government could play a larger role in financing and providing child protection services for orphans, street children and other children in difficult conditions.
35

9. Conclusion
This paper set out to analyse the extent to which the CMP contributes to the reduction of poverty and improvements in the well-being of children, and does so in an efficient, affordable and sustainable manner. The analysis has confirmed that the programme makes a real contribution to poverty reduction as measured by household consumption expenditure per capita (MDG 1), in particular among children, due to the larger number of children living in poor households. It makes a major contribution to household consumption expenditure in the lower expenditure deciles. There is evidence that the intra-household distribution of ‘child money’ does benefit children in particular, although the newness of the programme and the lack of robust monitoring systems make it impossible at this stage to draw any firm conclusions about the effects on the non-monetary dimensions of child poverty, such as school enrolment (MDG 2).
These positive effects are enhanced under a universal programme, since this largely overcomes the ‘exclusion’ problem inherent in the technical shortcomings of proxy means testing. The analysis has also shown that a universal programme is progressive along the entire household consumption expenditure distribution, due to the much larger number of children in poor households. Taking into account also the high leakage of the targeted programme, due both to the bluntness of the proxy means test and deep-seated institutional factors that hinder proper implementation, as well as the lack of public support for a return to targeting, the conclusion is quite clear. It makes much more sense to continue with the universal programme.
This conclusion is further buttressed by the fact that Mongolia has the fiscal space to absorb the higher total cost of benefits under the universal programme, given the large surplus in government finances. As a percentage of GDP and total government expenditure, expenditure on the universal programme appears to be within the normal range internationally for such programmes and can be regarded as affordable and sustainable at the benefit rate of Tog36,000 (approximately $31) per year. However, given Mongolia’s vulnerability to external shocks, the large increase in the annual benefit to Tog136,000 ($117) in the 2007 budget is highly risky, as it raises programme expenditure to a level that would be impossible to sustain in the event of a fiscal contraction. Although the increase in the benefit level (Tog100,000) is supposed to be contingent on the continued receipt of windfall mineral revenue, the new benefit rate may come to be seen as an entitlement in the public mind, making it very difficult politically to make subsequent reductions.
The analysis has highlighted the importance of taking measures to ensure access to child benefits by the most disadvantaged families with children, including in particular migrant families, and by children living outside a family environment in institutions, on the streets or in places of detention. It is also crucial to invest in strengthening the capacity and systems for programme management, monitoring and evaluation, including by establishing an integrated management information system for all social welfare programmes. Finally, it must be stressed that, despite the contribution of the CMP to the reduction of monetary poverty and to child well-being, cash transfers for families with children are not a cure-all and cannot substitute for the delivery of quality services for children. The programme should also be seen as only one component of a broader social protection system, including an enhanced government role in the development and financing of specialized protection services for children in situations of extreme vulnerability.
36

Annex: Statistical tables Table 1: Economic indicators, 2000-2005
2001 2002 2003 2004 2005 2006 est
Real GDP growth (%) 1.0 4.0 6.1 10.8 7.0 7.0 Inflation (end period, %) 8.0 1.6 4.7 11.0 9.5 7.0 Government revenue (% of GDP) 39.4 38.4 37.6 37.0 33.7 40.6 Government expenditure (% of GDP) 43.9 44.2 41.8 39.1 30.7 31.7 Overall budget balance (% of GDP) -4.5 -5.8 -4.2 -2.1 2.9 9.0 Exchange rate (Tog per US$) 1,097.7 1,110.3 1,146.5 1,185.3 1,205.3 1,164
Sources: NSOM, Mongolian Statistical Yearbook 2005; IMF, Mongolia: 2006 Article IV Consultation – Staff Report.
Table 2: Poverty indices, by geographical areas, 2002/2003 (based on household consumption expenditure per capita)
Poverty headcount Poverty gap Poverty severity National 36.1 11.0 4.7 Urban areas 30.3 9.2 4.0
Ulaanbaatar 27.3 8.1 3.3 Aimag centres 33.9 10.5 4.7
Rural areas 43.4 13.2 5.6 Soum centres 44.5 14.4 6.4 Countryside 42.7 12.6 5.1
Regions West 51.1 14.6 5.7 Khangai 38.7 12.3 5.2 Central 34.4 10.1 4.3 East 34.5 12.4 6.6 Ulaanbaatar 27.3 8.1 3.3
Source: NSOM, Report of the HIES/LSMS 2002-2003.
Table 3: Selected human development indicators, 2000 and 2005
2000 2005 Child mortality Under-5 mortality rate (1/1,000) 87 51 Infant mortality rate (1/1,000) 64 40 Nutrition Stunting prevalence (%) 25 21 Child health DPT 3 immunization (%) 99 92 Full immunization (%) … 67 Reproductive health Skilled attendant at delivery (%) 97 99 Education Net primary school attendance rate (%) 76 95
Sources: NSOM, Multiple Indicator Cluster Surveys, 2000 and 2005.
37

Table 4 : Distribution of CMP benefits by location, April-June 2006
% of households receiving benefits % of children receiving benefits
Total 58.1 78.1
Regions West 77.7 90.1 Khangai 74.9 89.5 Central 51.2 72.9 Ulaanbaatar 34.4 54.9 East 59.9 81.5
Urban areas 48.1 69.4 Ulaanbaatar 34.4 54.9 Aimag centres 63.5 82.3 Rural areas 69.2 86.0 Soum centres 73.8 88.1 Countryside 64.6 83.6
Source: Authors’ calculations derived from data of the CMP module of the HIES, April-June 2006.
Table 5: Actual and simulated inclusion and exclusion errors, April-June 2006 (exclusion error is % of non-poor who do not benefit from programme; inclusion error is % of programme beneficiaries who are non-poor)
Targeted programme
Ex ante based on
actual formulaa
Ex ante based on formula by World
Bank a
Actual (April-June 2006)
Universal programme Ex ante
Households
Exclusion error 42 35 20.7 8.0 Inclusion error 38 33 56.9 64.8
Children
Exclusion error … … 16.0 0.0 Inclusion error … … 51.3 57.8
a/ Calculation made by World Bank through analysis of the properties of the formula used in the proxy means test, based on data from the 2002/2003 HIES/LSMS (see World Bank, 2006b). Source: Authors’ calculations derived from HIES data, April-June 2006.
Table 6: Actual and simulated poverty indices, April-June 2006
With universal child benefits (ex ante)
Without child benefits
With targeted benefits (actual) Tog36,000/year Tog136,000/year
Per capita (individuals) Poverty headcount 38.0 35.3 34.8 26.5 Poverty gap 13.4 11.8 11.5 7.2 Poverty severity 6.7 5.6 5.4 2.8 Per capita (children) Poverty headcount 42.2 38.5 37.9 27.4 Poverty gap 15.1 13.0 12.6 7.1 Poverty severity 7.8 6.2 6.0 2.7
Source: Authors’ calculations derived from HIES data, April-June 2006.
38

Table 7: Actual and simulated value of CMP benefits, by deciles, April-June 2006
Universal benefits (ex ante) Targeted benefits
(actual) Tog36,000 Tog136,000
Average child benefits per household (Tog per month) Decile 1 6,645 7,806 29,491 Decile 2 6,247 7,312 27,622 Decile 3 5,333 6,613 24,982 Decile 4 4,296 6,043 22,829 Decile 5 3,667 5,344 20,189 Decile 6 3,505 4,989 18,848 Decile 7 3,043 4,457 16,838 Decile 8 2,753 4,387 16,573 Decile 9 2,108 3,720 14,055 Decile 10 1,989 3,720 14,055 Child benefits as % of household consumption expenditure Decile 1 10.9 12.6 35.2 Decile 2 6.4 7.5 23.4 Decile 3 4.5 5.5 18.1 Decile 4 3.2 4.5 15.0 Decile 5 2.4 3.5 12.0 Decile 6 2.0 2.8 9.8 Decile 7 1.5 2.2 7.8 Decile 8 1.1 1.8 6.4 Decile 9 0.7 1.2 4.5 Decile 10 0.3 0.6 2.3
Source: Authors’ calculations derived from HIES data, April-June 2006.
Table 8: Use of CMP benefits by recipient households, April-June 2006
% of households receiving child money Overall Below MSL* Above MSL* Households using all child money for children 56.9 47.2 64.3 Households using all or some child money for children 89.5 85.1 92.7 Saving 15.2 10.9 18.5 Books and stationery 59.5 61.5 58.0 Kindergarten or school fees 29.7 29.8 29.7 Clothing 36.3 36.5 36.1 Tuition fees (higher education) 3.8 3.4 4.0 Public transport 4.5 4.0 4.9
Households using all child money for household needs 10.5 14.9 7.3 Households using all or some child money for household needs 43.1 52.8 35.7 Saving 5.3 4.9 5.6 Food 3.3 3.1 3.5
* Calculated on basis of per capita household consumption expenditure minus value of CMP benefits. Source: Authors’ calculations derived from HIES data, April-June 2006.
39

Table 9: Value of all child and maternity benefits in first 6 months after birth
Value of benefits during first 6 months after birth (Tog)
Newborn child (one-time payment of Tog100,000) 100,000
Maternity benefit (12 months at Tog20,000/month) 120,000 Child benefit (18 years at Tog136,000/year) 68,000 Total 288,000 Value per month (first six months after birth) 48,000
Monthly benefits as % of monthly household consumption expenditure 88.5 Decile 1 53.0 Decile 2 42.4 Decile 3 37.2 Decile 4 54.4 Households below MSL 88.5
Source: Authors’ calculations derived from HIES data, April-June 2006.
Table 10: Expenditure on child benefits and other new allowances, 2005-2007
2007
2005
(actual)
2006
(estimated) Benefit at Tog36,000 per year
Benefit at Tog136,000
per year Expenditure on child benefits (Tog million) 18,087 29,628 38,612 145,866 As % of social welfare expenditure 9.7 n.a. n.a. n.a. As % of social sector expenditure 4.1 n.a. n.a. n.a. As % of total government expenditure 2.4 2.8 2.6 9.5 As % of GDP 0.7 0.9 1.0 3.9 Overall fiscal balance as % of GDP 2.9 9.0 -2.6 -5.0
Source: CMP administrative data, Ministry of Social Welfare and Labour; budget data from IMF, Mongolia: 2006 Article IV Consultation – Staff Report; GDP data from NSOM, Mongolian Statistical Yearbook 2005.
Table 11: Social sector expenditure, 2002-2005
2002 2003 2004 2005 As % of total government expenditure Education 18.9 18.7 18.7 19.3 Health 10.6 9.4 9.7 10.5 Social security and welfare 17.7 19.1 20.0 24.3 Total social expenditure (including others) 51.7 51.3 52.6 57.9 As % of GDP Education 8.36 7.89 7.38 6.52 Health 4.67 3.98 3.83 3.54 Social security and welfare 7.81 8.05 7.88 8.19 Total social expenditure (including others) 22.86 21.60 20.72 19.52
Source: NSOM, Mongolian Statistical Yearbook 2005.
40
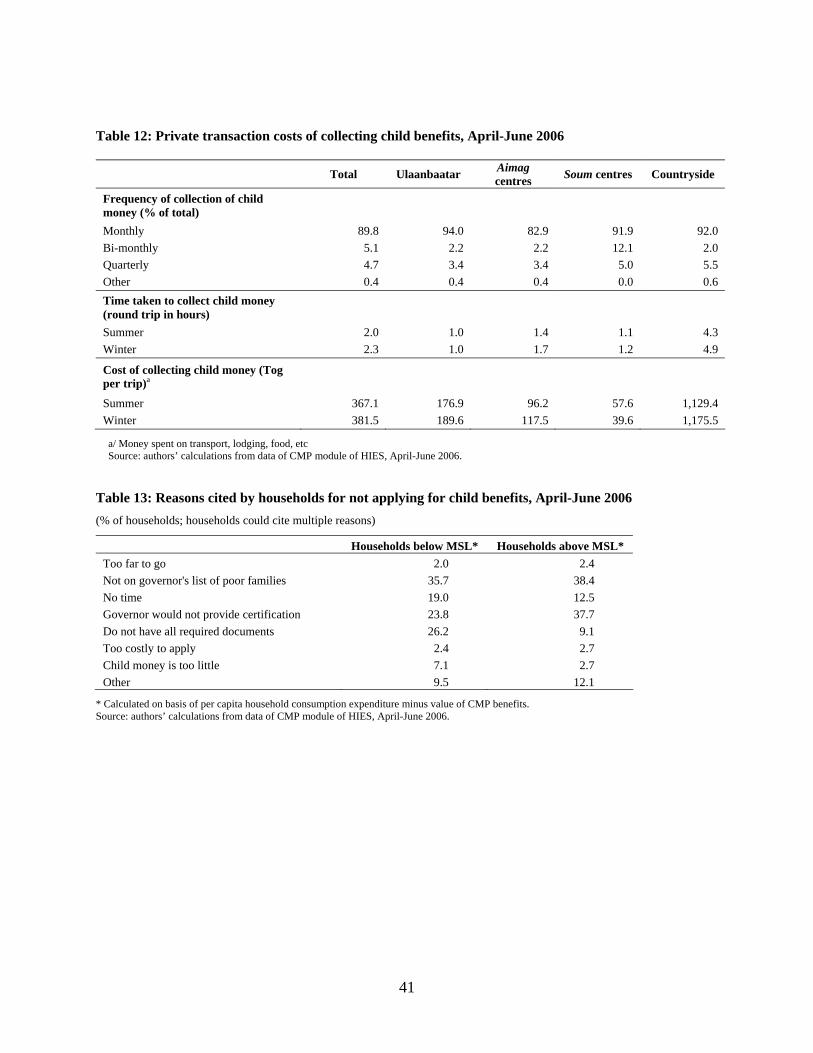
Table 12: Private transaction costs of collecting child benefits, April-June 2006
Total Ulaanbaatar Aimag centres Soum centres Countryside
Frequency of collection of child money (% of total)
Monthly 89.8 94.0 82.9 91.9 92.0 Bi-monthly 5.1 2.2 2.2 12.1 2.0 Quarterly 4.7 3.4 3.4 5.0 5.5 Other 0.4 0.4 0.4 0.0 0.6 Time taken to collect child money (round trip in hours)
Summer 2.0 1.0 1.4 1.1 4.3 Winter 2.3 1.0 1.7 1.2 4.9
Cost of collecting child money (Tog per trip)a
Summer 367.1 176.9 96.2 57.6 1,129.4 Winter 381.5 189.6 117.5 39.6 1,175.5
a/ Money spent on transport, lodging, food, etc Source: authors’ calculations from data of CMP module of HIES, April-June 2006.
Table 13: Reasons cited by households for not applying for child benefits, April-June 2006 (% of households; households could cite multiple reasons)
Households below MSL* Households above MSL* Too far to go 2.0 2.4 Not on governor's list of poor families 35.7 38.4 No time 19.0 12.5 Governor would not provide certification 23.8 37.7 Do not have all required documents 26.2 9.1 Too costly to apply 2.4 2.7 Child money is too little 7.1 2.7 Other 9.5 12.1
* Calculated on basis of per capita household consumption expenditure minus value of CMP benefits. Source: authors’ calculations from data of CMP module of HIES, April-June 2006.
41

List of abbreviations and acronyms
ADB Asian Development Bank
CMP Child Money Programme
COMECON Council for Mutual Economic Assistance
DFID Department for International Development (of the British Government)
DP Democratic Party
EIU Economist Intelligence Unit
FGT Foster-Greer-Thorbecke (class of decomposable poverty indices)
GDP Gross domestic product
HIES Household Income and Expenditure Survey
HRSWFM Human Resource and Social Welfare Foundation of Mongolia
HSGIQ Household Subsistence General Information Questionnaire
IMF International Monetary Fund
IMR Infant mortality rate
LSMS Living Standards Measurement Survey
MDC Motherland Democratic Coalition
MDG Millennium Development Goal
MICS Multiple Indicator Cluster Survey
MOECS Ministry of Education, Culture and Science
MOF Ministry of Finance
MPRP Mongolian People’s Revolutionary Party
MSL Minimum Subsistence Level
MSWL Ministry of Social Welfare and Labour
MTBF Medium Term Budget Framework
NFE Non-formal education
NGO Non-governmental organization
NSOM National Statistical Office of Mongolia
Tog Togrog
U5MR Under-5 mortality rate
UNICEF United Nations Children’s Fund
VAT Value added tax
42

Bibliography
Barrientos, A., and J. De Jong (2004), Child Poverty and Cash Transfers, Report no. 4, Childhood Poverty Research and Policy Centre, London.
Castañeda, T., and E. Aldez-Carroll (1999), The Intergeneracional Transmision of Poverty: Some Causes and Policy Implications, discussion paper, Inter-American Development Bank, Washington, D.C.
Coady, D., M. Grosh and J. Hoddinott (2004), Targeting of Transfers in Developing Countries: Review of Lessons and Experience, The World Bank and International Food Policy Research Institute, Washington, D.C.
Demery, L. (2003), ‘Analyzing the Incidence of Public Spending’, Chapter 2 in World Bank, Toolkit for Evaluating the Poverty and Distributional Impact of Economic Policies, Washington, D.C.
DFID (2005), Social Transfers and Chronic Poverty: Emerging Evidence and the Challenge Ahead, Department for International Development, London.
EIU (2006a), Mongolia Country Profile 2006, The Economist Intelligence Unit, London.
EIU (2006b), Mongolia Country Report, August, The Economist Intelligence Unit, London.
Foster, J., J. Greer and E. Thorbecke (1984), ‘A Class of Decomposable Poverty Measures’, Econometrica, vol. 52, pp. 761-765.
Gassmann, F. (2006), Targeting: Theory and Practice, PowerPoint lecture, Maastricht School of Governance, University of Maastricht.
Gassmann, F., and G. Notten (2006), Size Matters: Poverty Reduction Effects of Means-Tested and Universal Child Benefits in Russia, Maastricht School of Governance, University of Maastricht, January.
GOM (2004), Millennium Development Goals: National Report on the Status of Implementation in Mongolia, Government of Mongolia, Ulaanbaatar.
Grooten, S. (2006), Cash Transfers to Reduce Children’s Poverty, Policy Brief No. 2, Maastricht School of Governance, University of Maastricht, August.
Haddad, L., J. Hoddinott and H. Alderman (eds.) (1997), Intrahousehold Resource Allocation in Developing Countries, John Hopkins University Press, London.
Harper, C., R. Marcus and K. Moore (2003), ‘Enduring Poverty and the Conditions of Childhood: Lifecourse and Intergenerational Poverty Transmissions’, World Development, vol. 31, no. 3, pp. 535-554.
HRSWFM (2005), Study of the Current Methodology for Identifying Living Standard of Households and Citizens and its Comparison with Some Countries at Similar Level of Development, Human Resource and Social Welfare Foundation of Mongolia, for Poverty Research Group of the Ministry of Finance and UNDP, Ulaanbaatar.
43
IMF (2005), Mongolia: Selected Issues and Statistical Appendix, Country Report no. 05/400, November, International Monetary Fund, Washington, D.C.
IMF (2007), Mongolia: 2006 Article IV Consultation – Staff Report, Country Report no. 07/30, November, International Monetary Fund, Washington, D.C.
Mkandawire, Thandika (2005), Targeting and Universalism in Poverty Reduction, social policy and development programme paper no. 25, December, United Nations Research Institute for Social Development, Geneva.
MSWL (2003), Social Security Sector Strategy Paper, Ministry of Social Welfare and Labour, Ulaanbaatar, November.
NFDE/LRC (2005), ‘Literacy Education in Mongolia: Past and Present’, Gegeerel, newsletter of the National Centre for Non-formal and Distance Education/Literacy Resource Centre, no. 1, February, Ulaanbaatar.
NSOM (2001), Mongolia: Child and Development Survey 2000 (MICS-2), National Report, National Statistical Office of Mongolia, Ulaanbaatar.
NSOM (2004), Main Report of ‘Household Income and Expenditure Survey/Living Standards Measurement Survey’, 2002-2003, National Statistical Office of Mongolia, Ulaanbaatar.
NSOM (2006), Mongolian Statistical Yearbook 2005, National Statistical Office of Mongolia, Ulaanbaatar.
NSOM and UNICEF (2006), Findings from the Mongolia Child and Development Survey 2005 (Multiple Indicator Cluster Survey 3), Preliminary Report, September, National Statistical Office of Mongolia, Ulaanbaatar.
Parliament (2005a), Law of Mongolia on Social Welfare, 1 December, State Great Khural of Mongolia, Ulaanbaatar.
Parliament (2005b), Resolution no. 65, on the General Guidelines for Socio-Economic Development of Mongolia, 17 November, State Great Khural of Mongolia, Ulaanbaatar.
Parliament (2006a), Law of Mongolia on Granting Child Benefit and Rendering Pecuniary Aid for Children and Families, 5 May, State Great Khural of Mongolia, Ulaanbaatar.
Parliament (2006b), Resolution no. 47, on allowances and cash supplements, 2 June 2006, State Great Khural of Mongolia, Ulaanbaatar.
Parliament (2006c), Resolution no. 66, 29 June 2006, State Great Khural of Mongolia, Ulaanbaatar.
Piron, L-H., and T O’Neill (2006), Integrating Human Rights into Development: A Synthesis of Donor Approaches and Experiences, draft report for the OECD-DAC Network on Governance (GOVNET), Overseas Development Institute, London.
Rawlings, L.B., and G.M. Rubio (2005), ‘Evaluating the Impact of Conditional Cash Transfer Programmes’, The World Bank Research Observer, vol. 20, no. 1, Spring, pp. 29-55.
SCUK (2006), Children’s School Attendance/Probability of Studying: Policy Impact, draft, June, Save the Children UK, Ulaanbaatar.
44
Steiner-Khamsi, G, and I. Stolpe, ‘Decentralization and Recentralization Reform in Mongolia: Tracing the Swing of the Pendulum’, Comparative Education, vol. 40, no. 1, February, pp. 29-53
UNDP (2006), ‘Do CCTs reduce poverty?’, United Nations Development Programme International Poverty Centre, Brasilia, September.
Van de Walle, D. (1998), ‘Targeting Revisited’, The World Bank Research Observer, vol. 13, no. 2, August, pp. 231-248.
World Bank (2006a), Mongolia Macroeconomic Brief, Ulaanbaatar, February.
World Bank (2006b), Assessment of the Child Money Program and Properties of its Targeting Methodology, Washington, D.C., April.
World Bank (2006c), Mongolia Poverty Assessment, Poverty Reduction and Economic Management, East Asia and the Pacific Region, The World Bank, Washington, D.C., Report no. 35660-MN, April.
45


DIVISION OF POLICY AND PLANNINGMAY 2007
WO
RK
ING
PA
PE
RCHILD BENEFITS ANDPOVERTY REDUCTION:EVIDENCE FROM MONGOLIA’SCHILD MONEY PROGRAMME
Photo credit: © UNICEF/HQ00-1001/Giacomo Pirozzi
For more information, please contact:
The United Nations Children’s Fund (UNICEF)3 United Nations Plaza, Global Policy SectionNew York, NY 10017, USA
E-mail: [email protected]: www.unicef.org/policyanalysis