Child and Youth Behavioral Health Maps
8
Behavioral Health - Student Disciplinary Actions Project Overview Children’s Optimal Health (COH) is a collective leade rship initiative to ensure that every child in Central Texas becomes a healthy, productive adult engaged in his or her com- munity. COH works with partner org anizations throughout the commu nity to map dis- parate data sets to help illuminate issues impacti ng Central Texas children. This project seeks to highlight the geographic distribution of assets and issues of concern pertinent to child and youth behavioral health. As part of the federal Safe Schools/Healthy Studen ts grant, known locally as the Austin Community Collaboration to Enhance Student Success (ACCESS), and in keeping with the mission of Children’s Optimal Health, it is our hope that the enclosed map s and related analyses be used to raise community awareness and action around issues perti- nent to child and youth behavioral health and mental health. We hope that they will encourage conversation, stimulate brainstormi ng of solutions and result in collaborative action to positively affect the social and emotional well being of children and youth, reduce their engagement in risky behaviors, reduce health disparities and promote suc- cessful school completion. COH’s completed mapping initiatives can be found online at www.childrensoptimalhealth.org . Background Parents, health, education and business leaders, and the general public increasingly recognize the importance of mental heal th as a component of healthy physical, emo- tional, social, and intellectua l development of children and youth. Using a public health approach, we understand the interplay between the child, their relationships with key persons and their environment in establishing and maintaining social, emotional and behavioral health. This is typically referred to as an ecological model. 1 For young children, relationshi ps with parents and caretakers predomin ate. As children mature, the impact of other environmental factors play stronger roles in their healthy development . For adolescents, while the family continue s to play a vital role, the neighborhood, school, peer relationships, work, spirituality and media increasingly influ- ence teen behavior. 2 As a community working together, there are multiple partners, settings and interven- tions that we can use, in a c oordinated fashion, to promote menta l health, preve nt risky behavior, and respond effectively to the needs of our children and youth. 3 We can identify and promote protective factors, and reduce risk factors for children and youth at the individual, family, school and community levels. We can create and improve our systems of care. The ACCESS Safe Schools/Healthy Students federal grant, which has funded this project, is intended to focus on these systemic transformations . It is our hope that these maps and associated comme nts can help the Austin community in identifying neighborhoods in which we can most effectively and efficiently target these efforts to improve outcomes for children and youth. Adapted from Nemours: Framework for Examining Emotional and Behavioral Health in Children 1 Adapted from School Based Mental Health: An Empirical Guide for Decision Makers 4
Transcript of Child and Youth Behavioral Health Maps
8/6/2019 Child and Youth Behavioral Health Maps
http://slidepdf.com/reader/full/child-and-youth-behavioral-health-maps 1/8
Behavioral Health - Student Disciplinary Actions
Pro jec t Overv iew
Children’s Optimal Health (COH) is a collective leadership initiative to ensure that every
child in Central Texas becomes a healthy, productive adult engaged in his or her com-
munity. COH works with partner organizations throughout the community to map dis-
parate data sets to help illuminate issues impacting Central Texas children. This project
seeks to highlight the geographic distribution of assets and issues of concern pertinent
to child and youth behavioral health.
As part of the federal Safe Schools/Healthy Students grant, known locally as the AustinCommunity Collaboration to Enhance Student Success (ACCESS), and in keeping with
the mission of Children’s Optimal Health, it is our hope that the enclosed maps and
related analyses be used to raise community awareness and action around issues perti-
nent to child and youth behavioral health and mental health. We hope that they will
encourage conversation, stimulate brainstorming of solutions and result in collaborative
action to positively affect the social and emotional well being of children and youth,
reduce their engagement in risky behaviors, reduce health disparities and promote suc-
cessful school completion.
COH’s completed mapping initiatives can be found online at
www.childrensoptimalhealth.org.
Backg round
Parents, health, education and business leaders, and the general public increasingly
recognize the importance of mental health as a component of healthy physical, emo-
tional, social, and intellectual development of children and youth.
Using a public health approach, we understand the interplay between the child, their
relationships with key persons and their environment in establishing and maintaining
social, emotional and behavioral health. This is typically referred to as an ecological
model.1
For young children, relationships with parents and caretakers predominate. As children
mature, the impact of other environmental factors play stronger roles in their healthy
development. For adolescents, while the family continues to play a vital role, the
neighborhood, school, peer relationships, work, spirituality and media increasingly influ-
ence teen behavior.2
As a community working together, there are multiple partners, settings and interven-
tions that we can use, in a coordinated fashion, to promote mental health, prevent
risky behavior, and respond effectively to the needs of our children and youth.3 We can
identify and promote protective factors, and reduce risk factors for children and youth at
the individual, family, school and community levels. We can create and improve our
systems of care. The ACCESS Safe Schools/Healthy Students federal grant, which has
funded this project, is intended to focus on these systemic transformations.
It is our hope that these maps and associated comments can help the Austin community
in identifying neighborhoods in which we can most effectively and efficiently target
these efforts to improve outcomes for children and youth.
Adapted from Nemours: Framework for Examining Emotional and Behavioral Health in Children 1
Adapted from School Based Mental Health: An Empirical Guide for Decision Makers4
8/6/2019 Child and Youth Behavioral Health Maps
http://slidepdf.com/reader/full/child-and-youth-behavioral-health-maps 2/8
Behavioral Health - Student Disciplinary Actions2
The research literature abounds with assertions that barriers to learning impact our
children and youth. No matter how advanced curriculum is, if students are not ready to
learn because of internal or external factors, they won’t learn. “Even the best schools
find that too many youngsters are growing up in situations where significant barriers
regularly interfere with their reaching full potential.” 4
Child development is a result of the interplay between genetic gifts and environmental
conditions. The first few years of life are an especially sensitive period for brain devel-opment affecting cognitive, social, emotional and physical health. A variety of factors
can either promote or impede optimal development. Factors that promote development
include access to adequate nutrition and health care; close, nurturing relationships with
primary caregivers; and safe stimulating learning environments. Conversely, the lack
of these factors can have profound and long-lasting effects. Other factors which are
often associated with poverty, such as high neighborhood crime rates, food insecurity,
and lack of high quality educational and support services, add to the stressors that
compromise healthy development. Some children are resilient in the face of the most
devastating circumstances, but most children are not so fortunate.
We know that minority children are disproportionately poor, and poverty is associated
with higher rates of exposure to harmful toxins, including lead, alcohol, and tobacco in
early stages of development. Poor children are also more likely to be born with low birth
weight, to have poorer nutrition, and to have home and child care environments that
are less supportive of early cognitive and emotional development than their counter-
parts. When poverty is deep and persistent, the number of risk factors rises, seriously
jeopardizing healthy development.
Regardless of ethnicity or economic status, children tend to repeat the behaviors they
observe in adults. Risk taking behavior escalates in adolescence as young people make
choices that will affect their future health and well-being.
Texas school systems are just beginning to see the impact of the dramatic increase in
child births that has occurred over the last several years. Texas leads the country in
child population growth, and Central Texas growth is twice that of the state rate. In
Travis County, 1 in 3 births in 2008 were to women with less than a 12 th grade educa-
tion, and the Central Texas English language learner population is growing at 3 times
the general population. Children with this background enter school with a readiness
gap that persists. We need effective strategies across the community to ensure the
healthy development of all children.
Why is th is an issue in Centr a l Texas?
Community measures of youth outcomes reflect the circumstances, capacity and cop-
ing strategies for managing life circumstances that our youth experience. Our base-
line knowledge informs us that:
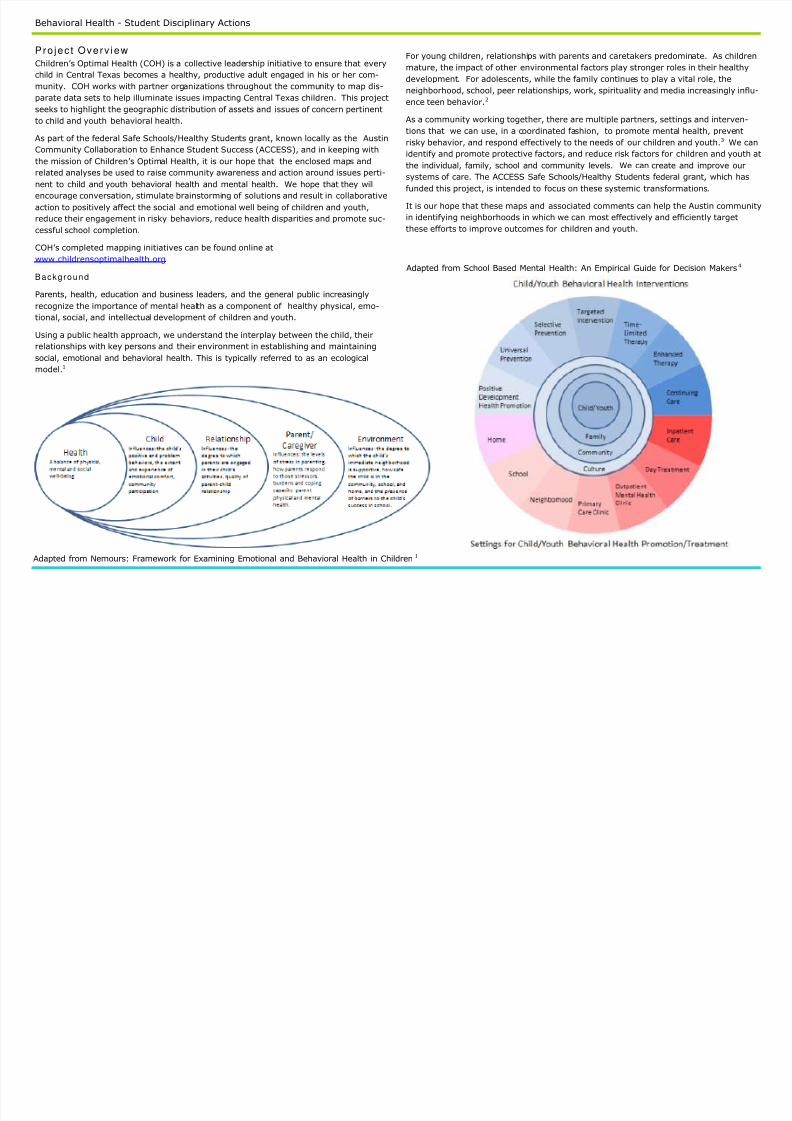
In Austin Independent School District (AISD) for school year 2008-09
Over 2,000 students in AISD are homeless.
Over 6,000 students change residence and 17,000 change campuses
during the school year.
Over 4,700 students have at least one parent incarcerated.
Using Texas Education Agency (TEA) at-risk data, 45,626 students have
at least one identified risk, and of those, 14,603 have two or more.
Travis County Human Services Department of Family and Protective Services has
seen an increase in average daily caseload from 21.0 (9/2008) to 36.1 (3/2010).
Travis County Juvenile Probation Department (TCJPD) had over 5,000 referrals in
2009.
2,500 youth are on probationary supervision, over 1,600 of them in
AISD.
Disproportionality by ethnic group is evident in our Child Protective System, in
AISD disciplinary data, in juvenile probation data, and in the rates of successfulhigh school completion.

8/6/2019 Child and Youth Behavioral Health Maps
http://slidepdf.com/reader/full/child-and-youth-behavioral-health-maps 3/8
Behavioral Health - Student Disciplinary Actions 3
Studen t Subs tance Use and Sa fe ty Survey
Many of the maps in this series are based on the results of the 2010 Student Substance Use
and Safety Survey. The federal Title IV Safe and Drug Free Schools and Communities grant
requires annual needs assessment and evaluation of substance use and safety issues. Conse-
quently, each year an anonymous self-report student survey of substance use and school
safety is administered to a random, representative sample of AISD students. The survey pro-
vides the best available local information on youth risk behavior, and is used to track student
knowledge, attitudes, and self-reported behavior over time. In the Spring of 2010 a sample of
11,593 surveys were sent out. Of those surveyed, 8,521 students in grades 6-12 submittedresponses to the district’s annual Student Substance Use and Safety Survey . Of these, 359
surveys were removed from analysis due to invalid responses, yielding an effective response
rate of 70%. Although the resources from the federal grant were discontinued beginning in the
2010-2011 school year, it is hoped that AISD will continue to survey students so that the com-
munity can monitor results and adjust interventions to better meet their needs. When it is not feasible to survey an entire population, samples are used instead. However,
when a sample is used to make inferences about a population the results must be interpreted
with caution. For example, although 87% of a sample may select a particular survey re-
sponse, this does not necessarily mean 87% of the entire population feels the same way. To
interpret the sample data cautiously, we have used the following information to construct an
interval that describes the range within which the result for a campus population is likely to
fall:
Population size: In this case, the number of students at a campus.
Sample size: In this case, the number of survey respondents from a campus.
Desired level of confidence: In this case, 95%.
The 95% confidence interval is not the only interval, but it is commonly used, indicating that
you can be 95% confident that the true population result will fall within the constructed inter-
val. To make inferences about a campus population using the sample data, the results should
be interpreted with the computed confidence interval of 5 percentage points on each side of
the sample statistics. For example, in 2010 if 33% of respondents from a campus indicated
that their friends belonged to gangs, applying the confidence interval (i.e., adding and sub-
tracting 5 percentage points) to the 33% yields a range of 28% - 38%. Therefore, you can be
95% confident that somewhere between 28% - 38% of all students at a campus would indi-
cate that their friends belong to a gang. Specific information on confidence levels is available
in the report set, available at http://archive.austinisd.org/inside/accountability/evaluation/
survey_reports.phtml. Campus confidence levels are reported in an appendix to this publica-
tion.
Maps from the Substance Use and Safety Survey are derived from the 2010 Report. In inter-
preting the maps, it is important to note that other than the campus name at which the survey
was completed, there was no geographic reference to help define the neighborhood or com-
munity. Some questions in the survey ask specifically about student behavior/perceptions on
campus.
Studen t D isc ip l i na ry I ssues
The AISD Discipline Coordinator annually reports on disciplinary actions, including analysis
by ethnicity, gender, and academic level. Disproportionality in disciplinary actions is a com-
plex issue that is monitored by Administration and the Board of Trustees. Together with sur-
vey reports produced by the AISD Department of Program Evaluation, these data help us
understand behavior that students self-report, as well as behavior that results in disciplinary
action. This Child and Youth Behavioral Health publication and summit are significant steps
forward in promoting the community use of the data collected by AISD. The survey and
disciplinary incident maps contained in this series of publications together represent the
voice of Austin’s students. This document presents our opportunity to listen to this voice and
respond, as our community does when children’s needs are identified.
The maps in this collection on Student Discipline graphically illustrate where the issues exist.
Student disciplinary removals stem from a range of factors: substance abuse, diagnosed
and undiagnosed mental health issues, gang influence, bullying, fighting, etc. Substance
abuse incidents do not originate in the school. The substances that students take or sell are
brought into the school from other places, and the school has no practical jurisdiction for
intervening or preventing off campus activity. Schools need their community partners to ef-
fectively address these issues.
Regardless of the cause, all removals have a negative impact on learning, for the student,
the classroom and the school. Teachers and administrators are frequently sidetracked with
disciplinary issues that originated outside the school and reflect a need for intensive inter-
ventions beyond the purview of the school. Teachers are experts in learning styles and
content mastery. They are not equipped to support students with outside-of-school issuesand are not allowed to probe the root causes. Even though many disciplinary issues origi-
nate outside of school, the lens for considering their impact is school-centric. Summary
reports on substance abuse, gang activity, etc. are compiled, measured and reported by
campus and influence public perception of the campus. Campus attendance and achieve-
ment are adversely affected by disciplinary removals. The school is impacted by both the
absenteeism and the learning ramifications of issues underlying disciplinary actions.
These maps are an attempt to move beyond the school-centric view of disciplinary issues to
understand their neighborhood patterns. They provide a baseline of accountability for our
community’s role in addressing the issues that compromise the mental health of our children
and youth, and which can impede their school progress and life success. If community inter-
est and support persist, using time series maps, we can monitor our progress against this
baseline over time.
Other questions, particularly those addressing youth risk behavior, are not specific to the
campus, and reflect behaviors occurring off campus, in the community. They are associated
with the campus only because that is where the student completed the survey. Unless the
question specifically asks about an issue on campus, the resulting map reflects the experi-
ences of the students enrolled at that campus, but does not necessarily reflect experiences/
activity occurring on the campus.
8/6/2019 Child and Youth Behavioral Health Maps
http://slidepdf.com/reader/full/child-and-youth-behavioral-health-maps 4/8
Behavioral Health - Student Disciplinary Actions4
References
1. Nemours. A Conceptual Framework for Understanding Children’s Emotional
and Behavioral Health. 2006. http://www.nemours.org/content/dam/
nemours/www/filebox/service/preventive/nhps/publication/06cbookchap2.pdf
2. An Ecological Model of Adolescent Health & Development. Adolescent
Health and Development. Johns Hopkins Bloomberg School of Public Health.
http://ocw.jhsph.edu.
3. Weisz, J., Sandler, I., Durlak, J., & Anton, B. (2005). Promoting and pro-
tecting youth mental health through evidence-based prevention and treat-
ment. American Psychologist, 60(6), 628 648, American Psychological Asso-
ciation.
4. Description of Conceptual Models for School Based Mental Health. School
Based Mental Health: An Empirical Guide for Decision Makers. 2004. Univer-
sity of South Florida. http://rtckids.fmhi.usf.edu/rtcpubs/study04/
SBMHchapter3.pdf
5. AISD Substance Use and Safety Survey Report, 2010. http://www.austinisd.org/inside/docs/ope_09-53.c_District_SSUSS_09_10.pdf
6. AISD. AEIS Addendum: AISD School Violence Prevention and Intervention
2009-2010 . http://archive.austinisd.org/inside/docs/
ratings_School_Violence_Prevention_Intervention_2009_2010.pdf
Unders tand in g A I SD Student D isc ip l ine Data
Procedures for disciplinary removals are set by the Texas Education Code
(TEC) and local District policy. Removals can be categorized as discretion-ary or mandatory.
Mandatory removals result from offenses for which TEC requires
offenders’ removal from the regular educational setting.
Discretionary removals are for offenses that, although they do notrequire removal under TEC, the District has determined that re-moval from the regular educational setting is the appropriate re-
sponse.When students are removed from the regular educational setting there area number of possible destinations:
Home suspension—the student is sent home.
In-school-suspension (ISS)—the student is placed in a separate
“suspension” room at the home campus.
Disciplinary Alternative Education Program (DAEP)
ACES (Alternative Education for Elementary Students)—
elementary students are removed to a separate campus.
ALC (Alternative Learning Center)—secondary students are re-moved to a separate campus
Juvenile Justice Alternative Education Program (JJAEP)—students
who are “expelled” are placed in a separate campus, usually bycourt order.
Austin Travis County Juvenile Justice Center or Gardner-Betts—a
variety of alternative settings for students in the justice system
pending judge determination of placement or completion of courtordered program.
Detailed information about disciplinary offenses and placements can befound in the Austin ISD Student Code of Conduct. http://
archive.austinisd.org/academics/parentsinfo/conduct_code/
8/6/2019 Child and Youth Behavioral Health Maps
http://slidepdf.com/reader/full/child-and-youth-behavioral-health-maps 5/8
Behavioral Health - Student Disciplinary Actions 5
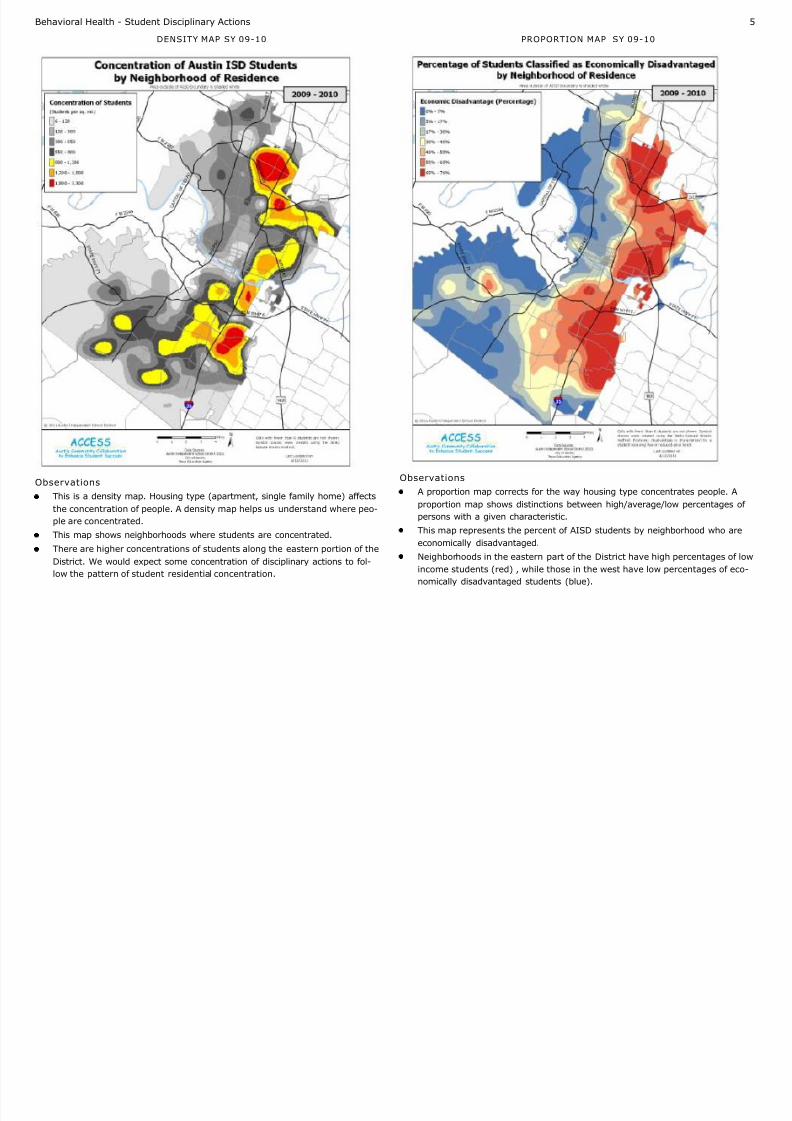
DENSITY MAP SY 09-10 PROPORTION MAP SY 09-10
Observations
This is a density map. Housing type (apartment, single family home) affects
the concentration of people. A density map helps us understand where peo-
ple are concentrated.
This map shows neighborhoods where students are concentrated.
There are higher concentrations of students along the eastern portion of theDistrict. We would expect some concentration of disciplinary actions to fol-
low the pattern of student residential concentration.
Observations
A proportion map corrects for the way housing type concentrates people. A
proportion map shows distinctions between high/average/low percentages of
persons with a given characteristic.
This map represents the percent of AISD students by neighborhood who are
economically disadvantaged.
Neighborhoods in the eastern part of the District have high percentages of low
income students (red) , while those in the west have low percentages of eco-
nomically disadvantaged students (blue).

8/6/2019 Child and Youth Behavioral Health Maps
http://slidepdf.com/reader/full/child-and-youth-behavioral-health-maps 6/8
Behavioral Health - Student Disciplinary Actions6
DENSITY MAP SY 09-10 PROPORTION MAP SY 09-10PHYSICAL AGGRESSION
Observations
There were 4,723 students disciplined for physical aggression, and
7,194 incidents.
Most students disciplined are concentrated in the eastern part of the
District, which is expected because there are also many more studentsliving in that area. We need a proportion map to better understand this
pattern.
Observations
When we control for housing concentration, this proportion map indicates a
broader distribution of students disciplined for physical aggression.
Because this map represents a percentage, it is possible that in small areas
with few students enrolled, a small number of students account for a hotspot.

8/6/2019 Child and Youth Behavioral Health Maps
http://slidepdf.com/reader/full/child-and-youth-behavioral-health-maps 7/8
Behavioral Health - Student Disciplinary Actions 7
Observations
There were 795 students disciplined for drugs or alcohol, and 878 inci-
dents. Some students may have been disciplined more than once.
There were higher concentrations of students disciplined for drugs/
alcohol in the eastern portion of the District. There are also more stu-
dents living in that area. We need a proportion map to understand the
pattern.
DRUGS/ALCOHOLDENSITY MAP SY 09-10 PROPORTION MAP SY 09-10
Observations
When we control for housing concentration, this proportion map indicates a
higher percentage of students disciplined for drugs or alcohol in the west-
ern portion of the District.
Because this map represents a percentage, it is possible that in small areas
with few students enrolled, a small number of students account for a hot
spot.

8/6/2019 Child and Youth Behavioral Health Maps
http://slidepdf.com/reader/full/child-and-youth-behavioral-health-maps 8/8
Behavioral Health - Student Disciplinary Actions8
DENSITY MAP SY 09-10 DISRUPTIVE BEHAVIOR
Observations
There were 9667 students disciplined for disruptive behavior, and
29,326 incidents.Students disciplined for disruptive behavior appear concentrated along
the eastern area.
PROPORTION MAP SY 09-10
Observations
When we control for housing concentration, the pattern of students disci-
plined for disruptive behavior is much broader though highest percentagesof students disciplined remain in the eastern area.