CHIKWAWA DISTRICT PHYSICAL DEVELOPMENT PLAN Malawi ...
207
CHIKWAWA DISTRICT PHYSICAL DEVELOPMENT PLAN i Malawi Government CHIKWAWA DISTRICT PHYSICAL DEVELOPMENT PLAN AUGUST 2020 Chikwawa District Council
Transcript of CHIKWAWA DISTRICT PHYSICAL DEVELOPMENT PLAN Malawi ...
CHIKWAWA DISTRICT PHYSICAL DEVELOPMENT PLAN
i
Malawi Government
CHIKWAWA DISTRICT PHYSICAL DEVELOPMENT PLAN
AUGUST 2020
Chikwawa District Council
i
CHIKWAWA DISTRICT PHYSICAL DEVELOPMENT PLAN
TABLE OF CONTENTS
EXECUTIVE SUMMARY ........................................................................................... xi
FOREWORD ......................................................................................................... xiii
PREFACE ............................................................................................................... xiv
ACKNOWLEDGEMENTS ......................................................................................... xv
ABBREVIATIONS AND ACRONYMS ...................................................................... xvi
1 Introduction and Background .............................................................................. 1
1.1 Introduction .................................................................................................1
1.2 Content and Life Span of the Plan .................................................................1
1.3 Scope and Objectives of the Plan ..................................................................1
1.4 Planning Process and Consultations .............................................................. 2
1.5 Background Studies...................................................................................... 3
2 Geography ........................................................................................................ 4
2.1 Introduction ................................................................................................ 4
2.2 Location and Size ........................................................................................ 4
2.3 Topography and Drainage ........................................................................... 6
2.3.1 Topography .......................................................................................................... 6
2.3.2 Drainage ............................................................................................................... 6
2.4 Geology and Soils ........................................................................................ 6
2.5 Climate ...................................................................................................... 12
2.5.1 Rainfall ............................................................................................................... 12
2.5.2 Temperatures ...................................................................................................... 13
2.6 Climate and Climate Change ....................................................................... 15
2.7 Vegetation ................................................................................................. 15
3 Existing Policy and Legal Framework ................................................................. 18
3.1 Introduction ............................................................................................... 18
3.2 International Policy Framework .................................................................. 18
3.2.1 Sustainable Development Goals, 2015 ............................................................... 18
3.2.2 Guiding Principles on Large Scale Land Based Investments in Africa ............. 18
3.3 National Legal and Policy Framework ......................................................... 18
3.3.1 The Malawi Constitution .................................................................................... 18
3.3.2 The Malawi Growth and Development Strategy (MGDS III) ........................... 18
3.3.3 The National Physical Development Plan .......................................................... 19
CHIKWAWA DISTRICT PHYSICAL DEVELOPMENT PLAN
ii
3.3.4 The Physical Planning Act 2016 ........................................................................ 20
3.3.5 The National Land Policy, 2002 ......................................................................... 20
3.3.6 National Decentralization Policy, 1998 .............................................................. 20
3.3.7 National Environmental Policy, 2004 ................................................................ 20
3.3.8 Malawi National Disaster Risk Management Policy, 2016 ............................... 21
3.3.9 National Wildlife Policy, 2000 ........................................................................... 21
3.3.10 National Housing Policy, 2018 .......................................................................... 21
3.3.11 National Agriculture Policy, 2016 ...................................................................... 21
3.3.12 National Climate Change Management Policy, 2016 ........................................ 21
3.3.13 The National Urban Policy, (NUP) 2019 ........................................................... 21
3.3.14 The Water Policy, 2007 ...................................................................................... 22
3.3.15 National Gender Policy, 2011 ............................................................................ 22
3.3.16 Land Resources Management Policy and Strategy, 2000 .................................. 22
3.4 Existing Major Development Programmes/Projects ..................................... 22
3.4.1 Shire Valley Transformation Programme .......................................................... 22
3.4.2 Shire River Basin Management Project ............................................................. 22
3.4.3 Existing Urban Structure Plans .......................................................................... 23
4 Natural Resources and Economic Activities ....................................................... 24
4.1 Introduction .............................................................................................. 24
4.2 Fauna and Flora ........................................................................................ 24
4.2.1 Forestry ............................................................................................................... 24
4.2.2 Production Forests /Tree Plantation ................................................................... 24
4.2.3 Forestry Services ................................................................................................ 25
4.2.4 Key Issues affecting Forestry ............................................................................. 26
4.2.5 Majete Wildlife Reserve ..................................................................................... 26
4.2.6 Lengwe National Park ........................................................................................ 27
4.2.7 Nyala National Park ........................................................................................... 27
4.2.8 Elephant Marsh ................................................................................................... 28
4.3 Agriculture ................................................................................................ 30
4.3.1 The Role of Agriculture in the District’s Economy ........................................... 30
4.3.2 Agricultural Land. .............................................................................................. 30
4.3.3 Large Scale Farming .......................................................................................... 30
4.3.4 Smallholder Agriculture ..................................................................................... 31
4.3.5 Irrigation ............................................................................................................. 36

CHIKWAWA DISTRICT PHYSICAL DEVELOPMENT PLAN
iii
4.3.6 Livestock ............................................................................................................ 38
4.3.7 Major Issues affecting Livestock Production ..................................................... 39
4.3.8 Fisheries Resources ............................................................................................ 40
4.3.9 Major Issues affecting Fish Production .............................................................. 41
4.4 Commerce and Industry. ........................................................................... 42
4.4.1 Small and Medium Enterprises and Co-operative Development. ...................... 42
4.4.2 Large Scale Businesses ...................................................................................... 43
4.4.3 Banks and Financial Lending Institutions in Chikwawa .................................... 43
4.4.4 Business Promotion Services ............................................................................. 44
4.4.5 Contribution of Small and Medium Enterprise to the Local Economy .............. 44
4.4.6 Key Issues and opportunities Affecting Business Sector Growth ...................... 44
4.5 Mining and Mineral Deposits ..................................................................... 45
4.6 Tourism .................................................................................................... 45
4.6.1 Tourism Potential ............................................................................................... 45
4.6.2 Tourism Facilities ............................................................................................... 45
4.6.3 Key Issues from Tourism Sector ........................................................................ 47
4.7 Labour and Employment ........................................................................... 48
4.7.1 Labour Force ...................................................................................................... 48
4.7.2 Key Issues from the Labour Sector .................................................................... 48
5 Population and Demographic Characteristics..................................................... 50
5.1.1 Introduction ........................................................................................................ 50
5.1.2 Population Size and Growth Trends -1977 – 2018 ............................................ 50
5.1.3 Population Density ............................................................................................. 51
5.1.4 Age-Sex Structure .............................................................................................. 53
5.1.5 Urban and Rural Population ............................................................................... 56
5.1.6 Population Migration .......................................................................................... 56
5.1.7 Population Distribution ...................................................................................... 57
5.1.8 Population Projections 2019 - 2040 ................................................................... 59
5.1.9 Land Carrying Capacity ..................................................................................... 60
5.1.10 Major Issues ....................................................................................................... 60
6 Urbanization .................................................................................................... 61
6.1.1 Introduction ........................................................................................................ 61
6.1.2 Existing Service Centres .................................................................................... 61
6.1.3 Sub-Regional Centres ......................................................................................... 63
CHIKWAWA DISTRICT PHYSICAL DEVELOPMENT PLAN
iv
6.1.4 Main Market Centre ........................................................................................... 64
6.1.5 Rural Market Centres ......................................................................................... 64
6.1.6 Village Centres ................................................................................................... 67
6.2 Inter-Settlement Functional Linkages........................................................... 70
6.2.1 Relative Importance of Centres and Catchment Area Analysis ......................... 70
6.2.2 Business Operations; Usual Centre for Purchasing Goods ................................ 73
6.2.3 Distance Factor in Functional Linkages ............................................................. 73
6.2.4 Major Issues on Inter-settlement Linkages ........................................................ 74
7 Physical Infrastructure and Utilities ................................................................... 75
7.1 Introduction .............................................................................................. 75
7.2 Transportation Links .................................................................................. 75
7.3 Road Transport ......................................................................................... 75
7.3.1 Existing Road Network ...................................................................................... 78
7.3.2 Road Traffic Volume .......................................................................................... 82
7.3.3 Key Issues ........................................................................................................... 84
7.3.4 Road Passenger Transport .................................................................................. 85
7.3.5 Road Freight ....................................................................................................... 85
7.3.6 Key issues ........................................................................................................... 86
7.4 Railway Transport ..................................................................................... 86
7.5 Water Transport ........................................................................................ 87
7.5.1 Key Issues ........................................................................................................... 88
7.6 Air Transport ............................................................................................. 88
7.6.1 Key Issues ........................................................................................................... 89
7.7 Market Infrastructure ................................................................................. 89
7.8 Energy Supplies ......................................................................................... 89
7.8.1 Access to Electricity ........................................................................................... 89
7.8.2 Hydro-Electricity Supply ................................................................................... 89
7.8.3 Key Issues ........................................................................................................... 92
7.8.4 Off Grid Electricity ............................................................................................ 92
7.8.5 Key Issues ........................................................................................................... 93
7.8.6 Other Sources of Energy .................................................................................... 93
7.8.7 Key Issues ........................................................................................................... 94
7.9 Waste Management ................................................................................... 94
7.9.1 Solid Waste Management ................................................................................... 94
CHIKWAWA DISTRICT PHYSICAL DEVELOPMENT PLAN
v
7.9.2 Liquid Waste Management ................................................................................ 94
7.9.3 Gaseous Waste Management .............................................................................. 95
7.9.4 Key Issues ........................................................................................................... 95
7.10 Water Suppy ............................................................................................. 96
7.10.1 Access to Potable Water ..................................................................................... 96
7.10.2 Rural Piped Water Projects ................................................................................ 97
7.10.3 Planned Rural Piped Water Supply Projects .................................................... 100
7.10.4 Ground Water Supplies .................................................................................... 100
7.10.5 Key Issues ......................................................................................................... 101
7.11 Irrigation Infrastructure ............................................................................. 102
7.11.1 Existing Irrigation Schemes ............................................................................. 102
7.11.2 Proposed Irrigation Infrastructure .................................................................... 103
7.11.3 Key Issues ......................................................................................................... 105
7.12 Health...................................................................................................... 105
7.12.1 Introduction ...................................................................................................... 105
7.12.2 Existing Health Facilities ................................................................................. 105
7.12.3 District Hospital ............................................................................................... 105
7.12.4 Key Issues ......................................................................................................... 109
7.13 Education ................................................................................................. 109
7.13.1 Literacy Rates ................................................................................................... 109
7.13.2 Early Childhood Development Centres ............................................................ 109
7.13.3 Primary School Facilities ................................................................................. 110
7.13.4 Secondary School Education ............................................................................ 114
7.13.5 Tertiary Education ............................................................................................ 115
7.13.6 Key Issues ......................................................................................................... 117
7.14 Posts and Telecommunication ................................................................... 117
7.14.1 Postal Services .................................................................................................. 117
7.15 Communication Services ........................................................................... 118
7.15.1 Key Issues ......................................................................................................... 121
7.16 Security Infrastructure ............................................................................... 121
7.16.1 Key Issues ......................................................................................................... 123
7.17 Sports and Recreation Facilities ................................................................. 123
7.18 Linkage of Physical Infrastructure and Urbanization ................................... 123
8 Major Land Uses ............................................................................................. 125
CHIKWAWA DISTRICT PHYSICAL DEVELOPMENT PLAN
vi
8.1 Introduction ............................................................................................. 125
8.2 Agriculture ............................................................................................... 125
8.3 Shire Valley Transformation Project (SVTP) Area ....................................... 125
8.4 Estates and Large scale Holdings ................................................................ 125
8.4.1 Smallholding/Subsistence Farming and Gardens ............................................. 127
8.4.2 Human Settlements/Built up areas ................................................................... 127
8.4.3 Airports ............................................................................................................. 127
8.5 Conservation Areas in Chikwawa District .................................................. 128
8.6 National Parks, Game and Wild Life Reserves ............................................ 129
8.6.1 Forest Reserves ................................................................................................. 129
8.6.2 Infrastructure and Utilities ................................................................................ 129
8.7 Natural Physical Development Constraints and Potentials .......................... 129
8.7.1 Physical Development Constraints ................................................................... 129
8.7.2 Physical Development Potentials ..................................................................... 129
8.7.3 Land for Future Uses ........................................................................................ 130
8.8 Housing Provision .................................................................................... 131
8.8.1 Malawi Housing Corporation (MHC) .............................................................. 131
8.8.2 Institutional Houses .......................................................................................... 131
8.8.3 Private Real Estate Enterprises ......................................................................... 132
8.8.4 Rural Housing Project ...................................................................................... 132
8.9 Former Malawi Young Pioneers (MYP) Bases Land .................................... 132
8.9.1 Kakoma Former MYP Base ............................................................................. 132
8.9.2 Gola former MYP Base .................................................................................... 132
8.9.3 Proposed Uses for Kakoma and Gola ex MYP Bases. ..................................... 133
8.10 Disaster Issues Management Systems .......................................................... 133
8.10.1 Disasters in Chikwawa ..................................................................................... 133
8.10.2 Disaster Mitigation Measures ........................................................................... 133
8.10.3 Disaster Resilience System .............................................................................. 133
8.10.4 Early Warnings Measures ................................................................................ 133
8.10.5 Disaster Management System .......................................................................... 134
8.10.6 Key Issues ......................................................................................................... 136
9 Institutional Framework for Planning and Implementation ............................... 137
9.1 Introduction ............................................................................................. 137
9.2 Department of Physical Planning ............................................................... 137

CHIKWAWA DISTRICT PHYSICAL DEVELOPMENT PLAN
vii
9.3 Department of Housing ............................................................................ 137
9.4 Local Government Authorities .................................................................. 137
9.4.1 Chikwawa District Council .............................................................................. 137
9.4.2 District Executive Committee/Council’s Secretariat (DEC/CS ....................... 138
9.4.3 ADCs and VDCs .............................................................................................. 138
9.4.4 Issues and Planning Implication ....................................................................... 140
9.4.5 District Agriculture Development Office ......................................................... 140
9.5 Issues and Planning Implications ................................................................ 140
9.6 Roles of ADMARC and Other Similar Bodies ............................................. 141
9.6.1 Challenges ........................................................................................................ 141
9.6.2 Issues and Implications .................................................................................... 141
9.7 Department of Wildlife and Parks ............................................................. 141
9.8 Issues and Planning Implications ................................................................ 141
10 Institutional Framework for Plan Implementation ......................................... 144
10.1 Introduction ............................................................................................. 144
10.2 Legal and Regulatory Framework .............................................................. 144
10.3 Implementation and Monitoring ............................................................... 144
10.4 Key Activities and Responsibilities ............................................................. 145
11 THE PLAN RECOMMENDATIONS AND STRATEGIES ..................................... 148
11.1 Recommended Policies/Actions ................................................................. 148
Appendix 1: Inter-settlement functional linkages: methodology ........................... 162
Appendix 2: Deficits in the Provision of Services and Facilities in Service Centres ... 163
Appendix 3: Locational Analysis of Centres ......................................................... 173
Appendix 4: Point System for Service Centres ...................................................... 175
Appendix 5: Spatial Distribution of Development Planning Proposals .................. 176
Appendix 6: The Project Team ............................................................................ 186
Bibliography ......................................................................................................... 187
TABLE OF FIGURES
Figure 1: Map of Malawi showing Chikwawa ........................................................................... 5
Figure 2: Topographic Map of Chikwawat ................................................................................ 7
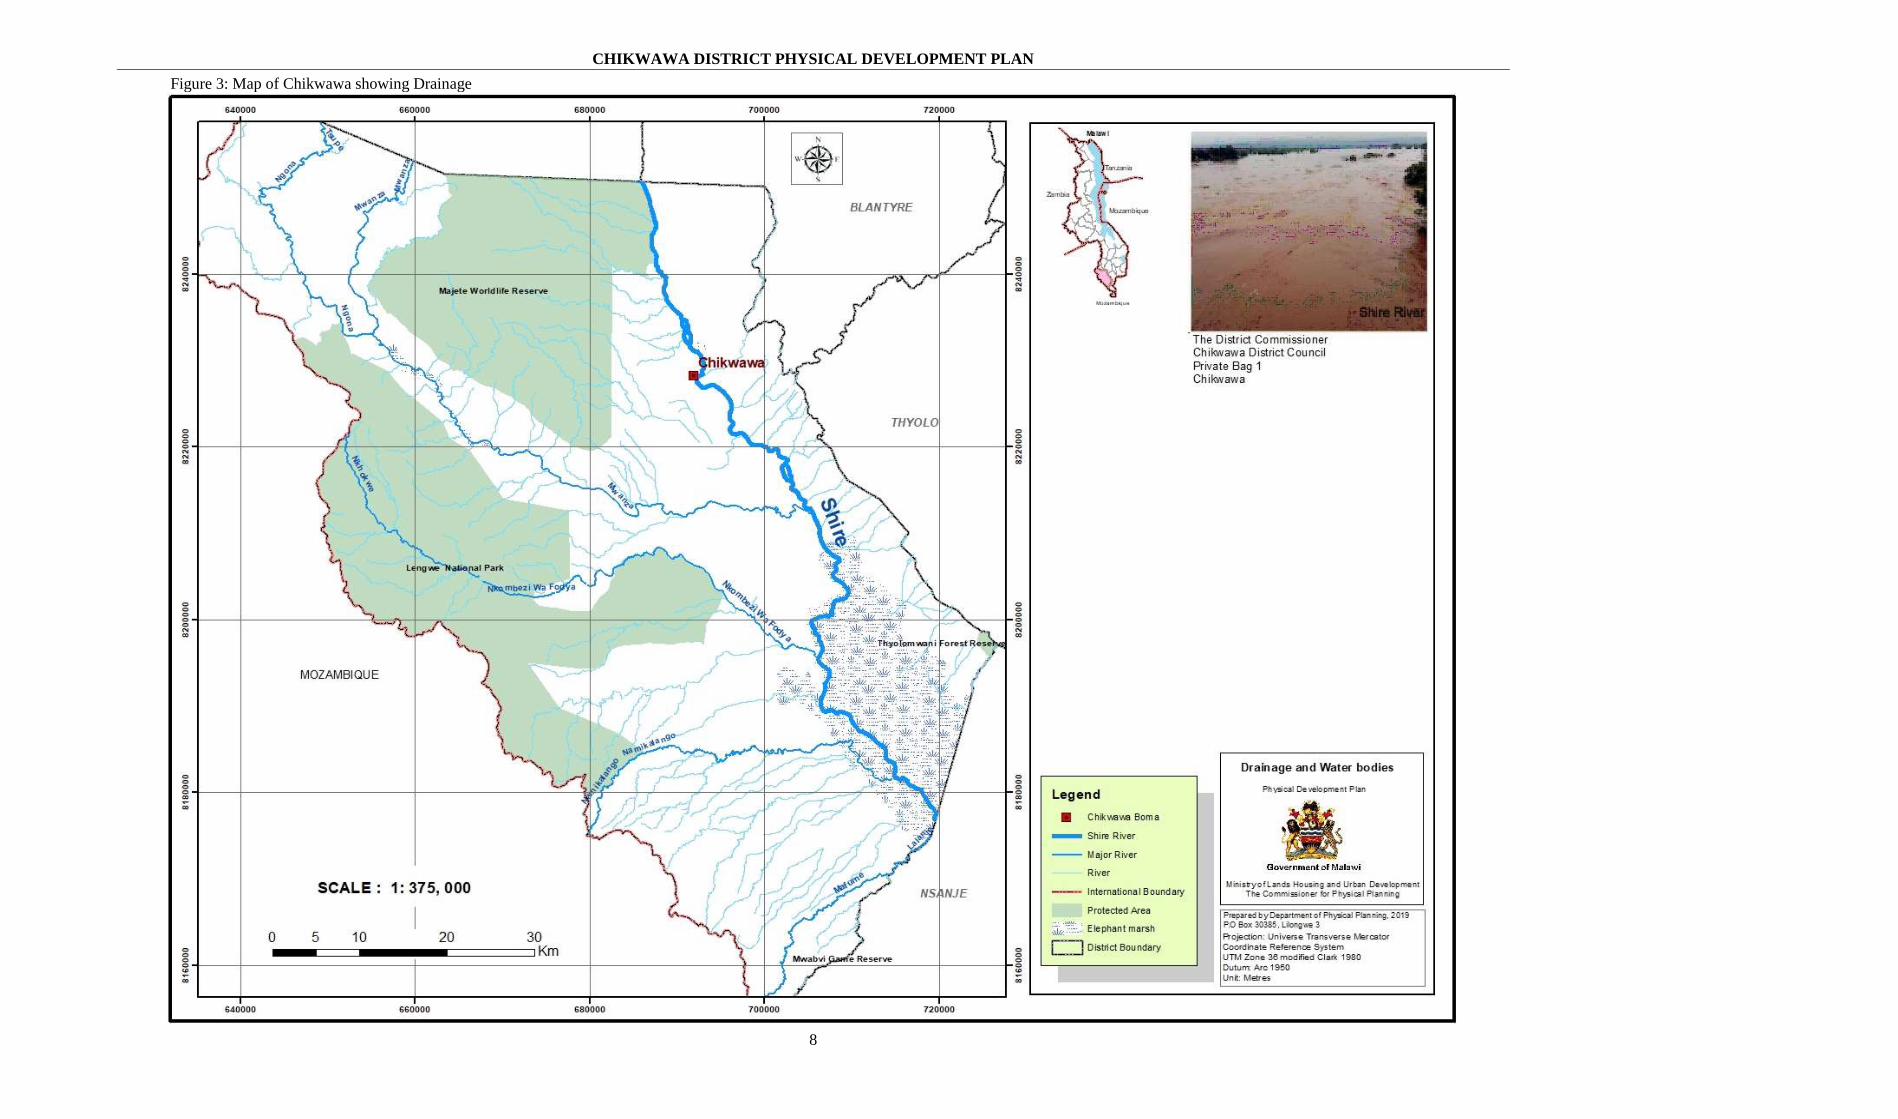
Figure 3: Map of Chikwawa showing Drainage ........................................................................ 8
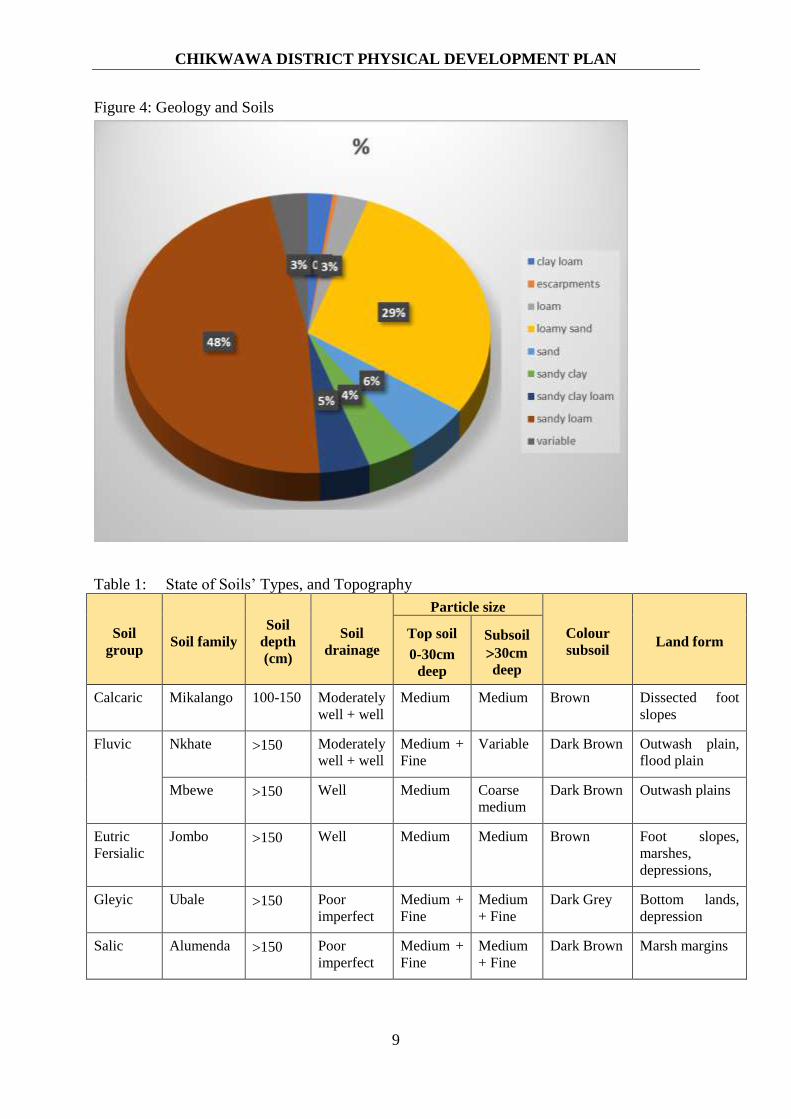
Figure 4: Geology and Soils ....................................................................................................... 9
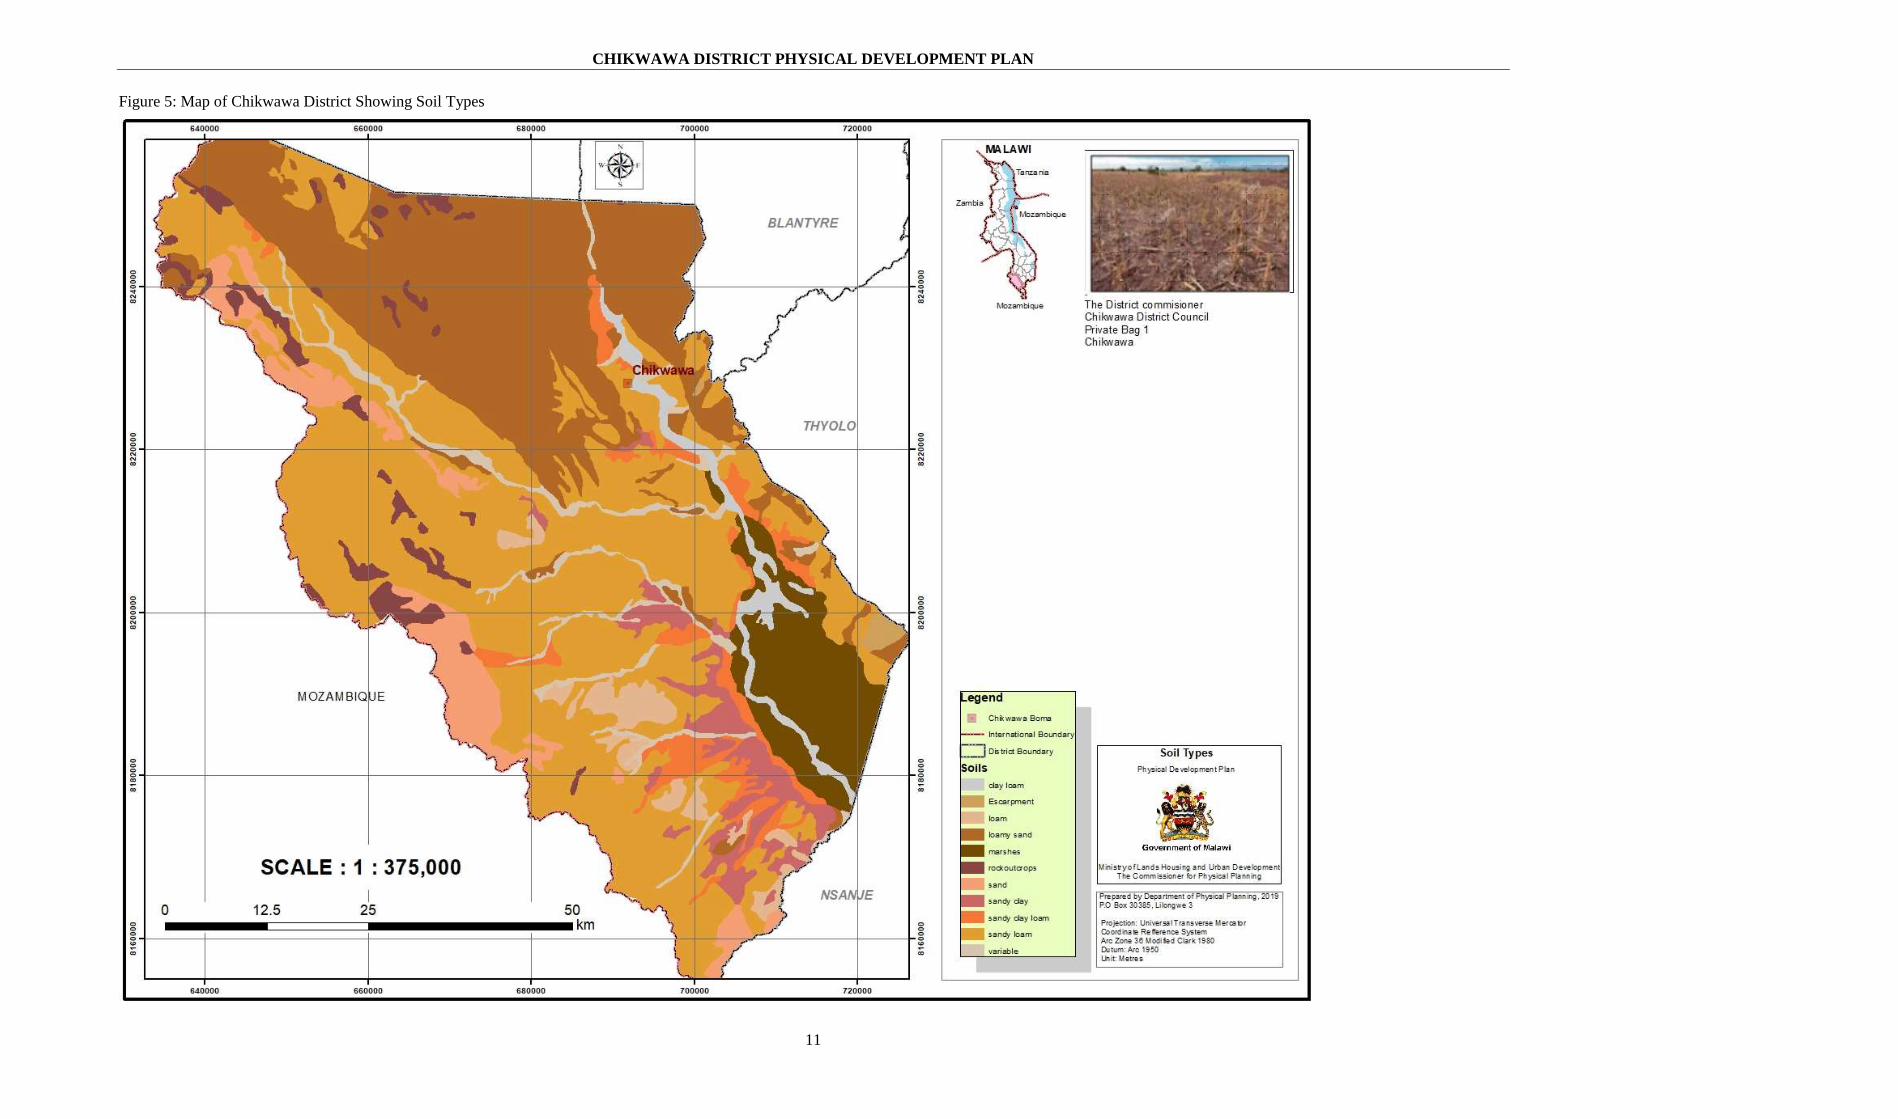
Figure 5: Map of Chikwawa District Showing Soil Types ...................................................... 11
Figure 6: Mean Annual Rainfall ............................................................................................... 12

CHIKWAWA DISTRICT PHYSICAL DEVELOPMENT PLAN
viii
Figure 7: Annual Temperatures ................................................................................................ 13
Figure 8: Rainfall and Temperature Chart ............................................................................... 14
Figure 9: Typical Vegetation .................................................................................................... 16
Figure 10: Map showing Land Cover in Chikwawa District.................................................... 17
Figure 11: Community Tree Planting ....................................................................................... 25
Figure 12: Village Forest Areas Distribution by T/A ............................................................... 26
Figure 13: Map showing Protected Areas in Chikwawa District ............................................. 29
Figure 14: Map Showing Extension Planning Areas in Chikwawa District ............................ 35
Figure 15: Existing and Proposed Irrigation Sites .................................................................... 37
Figure 16: Map Showing Tourism Sites in Chikwawa District ............................................... 46
Figure 17: Total Visitors per Year ........................................................................................... 47
Figure 18: Population Size and Growth Rate ........................................................................... 51
Figure 19: Land Area (km2) by Traditional Authority ............................................................. 53
Figure 20: Population Densities per Traditional Authority ...................................................... 54
Figure 21: Age /Sex Structure .................................................................................................. 56
Figure 22: Map Showing Spatial Population Distribution in Chikwawa ................................. 58
Figure 23: Map Showing Distribution of Service Centres and Facilities................................. 62
Figure 24: Map Showing Existing Rural Market Centres ........................................................ 66
Figure 25: Map Showing Distribution of Existing Village Centres ......................................... 69
Figure 26: Institutional Framework for Road Sector ............................................................... 76
Figure 27: Map Showing Existing Road Network ................................................................... 77
Figure 28: Washed away bridge on Mwanza River ................................................................. 79
Figure 29: Livunzu and Chapananga Bridges .......................................................................... 82
Figure 30: Washed away Rail Bridge across Shire River at Chiromo ..................................... 87
Figure 31: Crossing Shire River at T/A Maseya ...................................................................... 88
Figure 32: Kapichira Hydro Power Scheme ............................................................................. 90
Figure 33: Map Showing Electricity Transmission and Distribution ....................................... 91
Figure 34: Thendo and Mandirade Solar Energy ..................................................................... 92
Figure 35: Mbande and Mthumba Solar Irrigation Farms ....................................................... 93
Figure 36: PressCane Waste Dumping Ponds at Lauji ............................................................. 95
Figure 37: Solar Water Pumping at Chikwawa Boma ............................................................. 97
Figure 38: Miseu Folo Rural Water Supply Scheme ............................................................... 98
Figure 39: Map Showing Water Supply Facilities ................................................................... 99
Figure 40: Borehole Status by T/A ......................................................................................... 101
Figure 41: Centre Pivot and Furrow Irrigation System .......................................................... 102
Figure 42: Washed away Pipes at Chilengo and Irrigation Canal at Phala ............................ 103
Figure 43: Map Showing Proposed Irrigation Canals ............................................................ 104
Figure 44 Makhwira Health Centre ........................................................................................ 107
Figure 45: Map Showing Existing Health Facilities .............................................................. 108
Figure 46: Ndakwera and Mandrade Primary Schools .......................................................... 111
Figure 47: Teaching and Learning in the open at Nchalo Primary School ............................ 113
Figure 48: Primary Schools Distribution by Education Zone ................................................ 113

CHIKWAWA DISTRICT PHYSICAL DEVELOPMENT PLAN
ix
Figure 49: Secondary School Distribution by Zone ............................................................... 114
Figure 50: Ngabu Community College (under construction) ................................................. 115
Figure 51: Map Showing Existing Education Facilities ......................................................... 116
Figure 52: Chapananga Post Office ........................................................................................ 117
Figure 53: Map showing Existing Base Transmitting Stations .............................................. 120
Figure 54: Map Showing Existing Police Facilities ............................................................... 122
Figure 55: Map Showing Existing Land Uses ........................................................................ 126
Figure 56: Map Showing Disaster Flood Risk Areas ............................................................. 135
Figure 57: Map Showing Boundary of Traditional Authority ............................................... 139
LIST OF TABLES
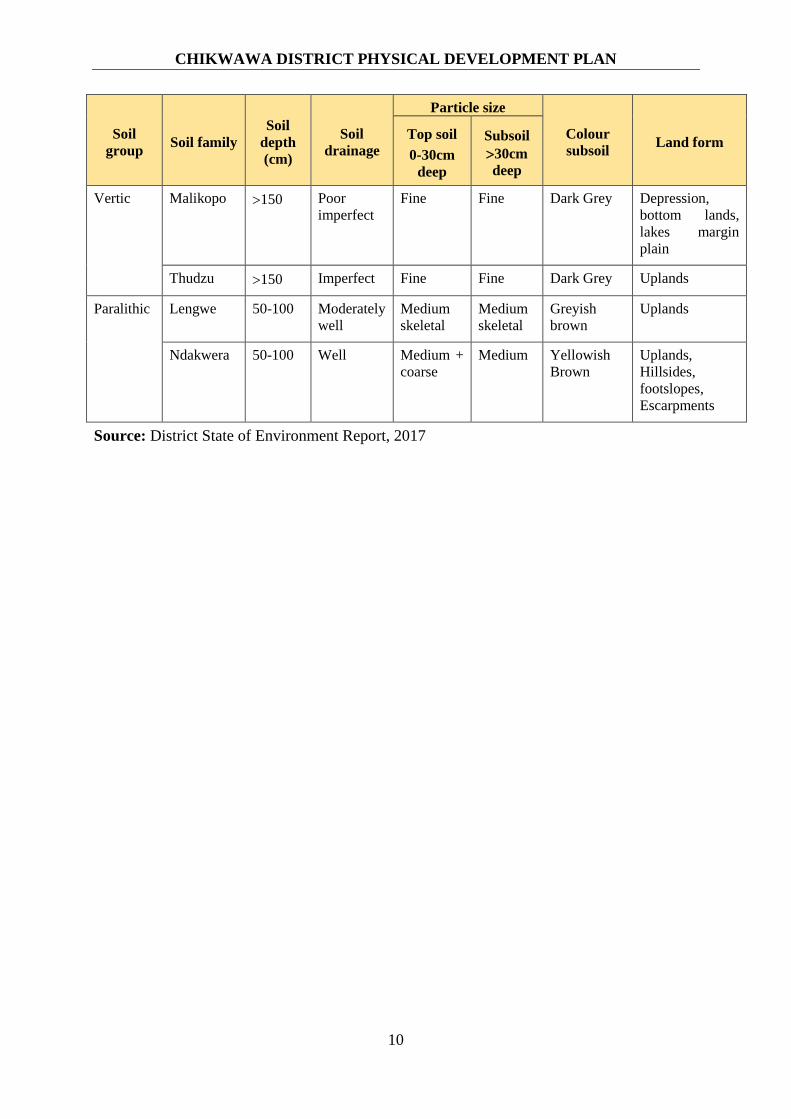
Table 1: State of Soils, Types and Topography…………………………………………….9
Table 2: Monthly Rainfall Totals in mm from 1996 to 2018……………………………...12
Table 3: Monthly Mean Minimum Temperatures in ⁰C from 1999 to 2018………………14
Table 4: Major Large Scale Farms…………………………………………………………31
Table 5: List of Co-operatives in Chikwawa ....................................................................... 31
Table 6: Production, Yield and Area Planted/Major and Minor Crop ................................. 33
Table 8: Number of Members, Fish ponds per EPA and Pond Area ................................... 40
Table 9: Fishing Gear and Craft Statistics ........................................................................... 41
Table 10: Characteristics of Businesses. ................................................................................ 42
Table 11: Summary of Businesses by TA and Scale of Business by 2017 ............................ 42
Table 12: Average bank interest rates in Malawi ................................................................... 43
Table 14: Work Force Distribution in Public and Private Sector/ CSOs ................................ 48
Table 15: Historical trends in Population and Inter-censual Annual Growth Rates ............... 50
Table 17: Population Distribution by 5 Year Age Groups in 2018 ........................................ 54
Table 18: Population Migration .............................................................................................. 56
Table 19: Population distribution by Traditional Authority ................................................... 57
Table 20: Population Projections 2019 - 2040 ........................................................................ 59
Table 21: Hierarchy point system ........................................................................................... 61
Table 23: Relative Strength of Centres ................................................................................ 71
Table 24: Characteristic Data on Main Central Places ........................................................... 73
Table 25: Classification of Roads and their Reserves ............................................................ 75
Table 26: Network of Major Existing Roads in Chikwawa .................................................... 80
Table 28: Traffic Count at Kamuzu Bridge ........................................................................... 83
Table 29: Traffic Count at Sorgin .......................................................................................... 84
Table 30: Minibus Count at Dyeratu, Nchalo and Ngabu on a single day............................. 85
Table 31: Cargo in and Out of PressCane .............................................................................. 86
Table 32: SORGERV Power Projects in Chikwawa District ................................................ 92
Table 33: Urban Water Supply Schemes and their Capacity ................................................. 96
Table 34: Rural Piped Water Projects .................................................................................... 97
Table 35: Ground Water Supply .......................................................................................... 100
CHIKWAWA DISTRICT PHYSICAL DEVELOPMENT PLAN
x
Table 36: Proposed Irrigation Infrastructure under SVTP ................................................... 103
Table 37: Health Facilities ................................................................................................... 106
Table 40: Current Plans for School Block Construction ...................................................... 112
Table 44: Estates and Large-scale Holdings ...................................................................... 127
Table 45: Estates under SVTP ............................................................................................. 127
Table 46: Chikwawa District Consolidated Catchment Conservation Areas ...................... 128
Table 48: Summary of Existing and Proposed Major Land Uses ........................................ 130
Table 49: Progress and the Beneficiaries of the Project ...................................................... 132
Table 50: Key Institutions in the Planningand Implementation Process ............................. 142
Table 51: Roles and responsibilities in the Plan Implementation ........................................ 145
Table 52: Recommended Policies/Actions ....................................................................... 148
Table 54: Service and Facilities in District and/ Main Market Centre ................................ 166
Table 55: Deficits/Requirement of Service and Facilities in Rural Market Centre: ............ 168
Table 56: Deficit Indices for Rural Market Centres ............................................................ 170
Table 56: Service Facilities in Village Market Centre: Deficits/Requirement .................... 171
Table 57: Point System for Service Centres ........................................................................ 175
CHIKWAWA DISTRICT PHYSICAL DEVELOPMENT PLAN
xi
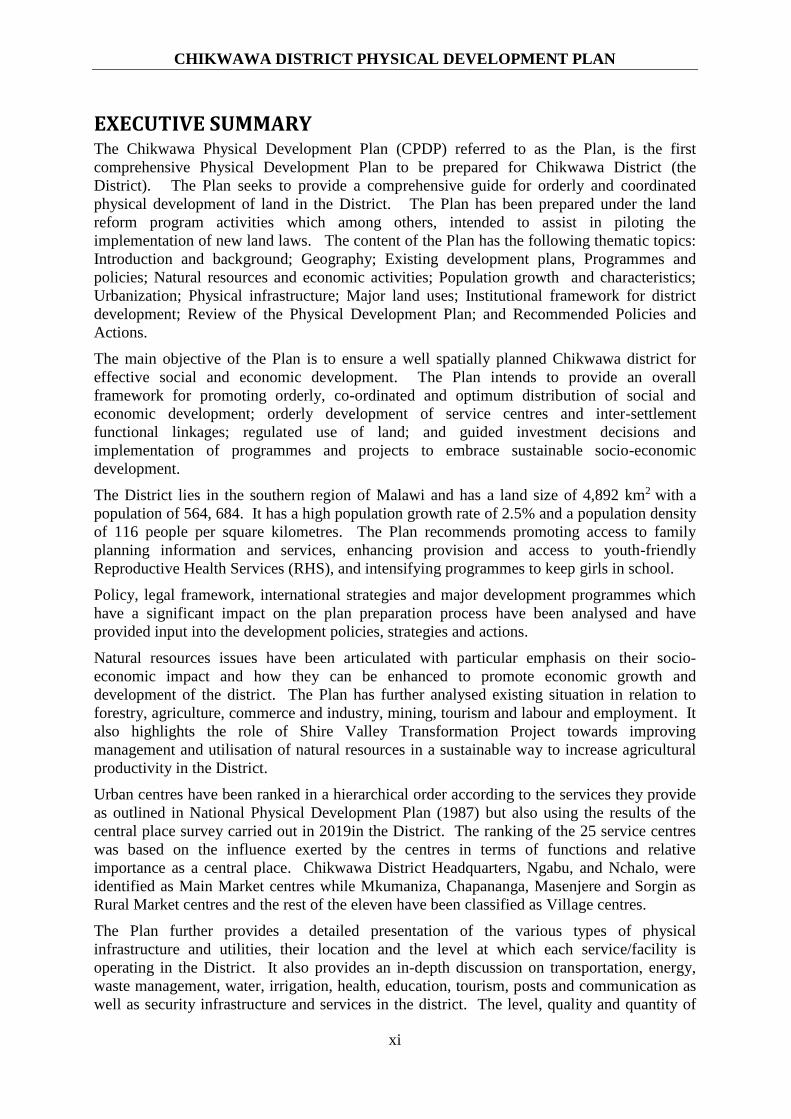
EXECUTIVE SUMMARY The Chikwawa Physical Development Plan (CPDP) referred to as the Plan, is the first
comprehensive Physical Development Plan to be prepared for Chikwawa District (the
District). The Plan seeks to provide a comprehensive guide for orderly and coordinated
physical development of land in the District. The Plan has been prepared under the land
reform program activities which among others, intended to assist in piloting the
implementation of new land laws. The content of the Plan has the following thematic topics:
Introduction and background; Geography; Existing development plans, Programmes and
policies; Natural resources and economic activities; Population growth and characteristics;
Urbanization; Physical infrastructure; Major land uses; Institutional framework for district
development; Review of the Physical Development Plan; and Recommended Policies and
Actions.
The main objective of the Plan is to ensure a well spatially planned Chikwawa district for
effective social and economic development. The Plan intends to provide an overall
framework for promoting orderly, co-ordinated and optimum distribution of social and
economic development; orderly development of service centres and inter-settlement
functional linkages; regulated use of land; and guided investment decisions and
implementation of programmes and projects to embrace sustainable socio-economic
development.
The District lies in the southern region of Malawi and has a land size of 4,892 km2 with a
population of 564, 684. It has a high population growth rate of 2.5% and a population density
of 116 people per square kilometres. The Plan recommends promoting access to family
planning information and services, enhancing provision and access to youth-friendly
Reproductive Health Services (RHS), and intensifying programmes to keep girls in school.
Policy, legal framework, international strategies and major development programmes which
have a significant impact on the plan preparation process have been analysed and have
provided input into the development policies, strategies and actions.
Natural resources issues have been articulated with particular emphasis on their socio-
economic impact and how they can be enhanced to promote economic growth and
development of the district. The Plan has further analysed existing situation in relation to
forestry, agriculture, commerce and industry, mining, tourism and labour and employment. It
also highlights the role of Shire Valley Transformation Project towards improving
management and utilisation of natural resources in a sustainable way to increase agricultural
productivity in the District.
Urban centres have been ranked in a hierarchical order according to the services they provide
as outlined in National Physical Development Plan (1987) but also using the results of the
central place survey carried out in 2019in the District. The ranking of the 25 service centres
was based on the influence exerted by the centres in terms of functions and relative
importance as a central place. Chikwawa District Headquarters, Ngabu, and Nchalo, were
identified as Main Market centres while Mkumaniza, Chapananga, Masenjere and Sorgin as
Rural Market centres and the rest of the eleven have been classified as Village centres.
The Plan further provides a detailed presentation of the various types of physical
infrastructure and utilities, their location and the level at which each service/facility is
operating in the District. It also provides an in-depth discussion on transportation, energy,
waste management, water, irrigation, health, education, tourism, posts and communication as
well as security infrastructure and services in the district. The level, quality and quantity of
CHIKWAWA DISTRICT PHYSICAL DEVELOPMENT PLAN
xii
infrastructure and service provision in the District has been analysed to identify challenges
and opportunities.
The Plan also provides in detail district institutional framework for implementation,
monitoring and evaluation of the Plan. Key institutions involved include; Local Government
Authority structures in Chikwawa District, Department of Physical Planning, Shire Valley
Agricultural Development Division, Agricultural Development and Marketing Corporation,
Department of Wildlife and Parks, Ministry of Industry and Trade and Department of Disaster
Management Affairs and other relevant stakeholders. Key issues and recommendations have
been outlined in Chapter 12.
In order to address issues and challenges highlighted in the background studies report,
recommended policies and actions are prioritised to stimulate socio-economic growth and
manage the environment in the district. The policies and actions are also meant to address the
need for sustainable and balanced development of urban centres and guide location of various
investments according to designated land uses in order to derive maximum benefits from land
based investments and resources. Lastly, they are intended to provide a spatial framework for
the sustainable development of human settlements to make sure that they are resilient to
natural disasters.
It is important that all stakeholders operating in the District should work with Chikwawa
District Council in addressing issues highlighted and implement proposals to ensure that the
overall goal and objectives of the Plan are achieved.
CHIKWAWA DISTRICT PHYSICAL DEVELOPMENT PLAN
xiii
FOREWORD One of the fundamental national development policy objectives is that the fruits of social and
economic development should be spread as evenly as possible in all parts of the country and
among all sections of the people. In line with this, the Malawi Government has been
endeavouring to achieve rapid socio-economic development as a pathway to improving the
living standards of the people.
In an effort to achieve balanced development within the framework of the fundamental
objective stated above, the Government is implementing many development programmes and
projects in all parts of the country. From physical planning point of view, the geographical
distribution of these development efforts is of particular importance and in this respect the
Government has adopted the policy of decentralised development.
The first step in the implementation of this policy was the moving of the Capital City from
Zomba to Lilongwe and the designation of Chirimba in Blantyre, Liwonde in Machinga,
Kanengo in Lilongwe and Luwinga in Mzuzu as industrial sites. It is in the same spirit that
government implemented the Secondary Centres Development Programme in Karonga,
Salima, Dedza, Mangochi, and Luchenza and Rural Growth Centres project in Mbalachanda,
Likoma, Neno, Lobi, Tsangano, Chapananga, Malomo, Bolero, and Jenda.
The main objective of the Plan is therefore, inter alia, to provide comprehensive spatial
development strategies for achieving balanced, sustainable, participatory and resilient socio-
economic development of Chikwawa District.
I therefore, present this plan to all Government Ministries, Departments, Statutory
Organisations, the Private Sector, Donors, Civil society organisations and all those that have a
role to play in implementing the Plan. The Plan is as an integral part of our District
Development Plan and it will assist the District Council to effectively implement
development programmes and projects in the District.
Councillor Bede
CHAIRMAN
CHIKWAWA DISTRICT COUNCIL

xiv
PREFACE In Malawi, the district is the central focus of development planning activities as it interprets the
provisions in the Malawi Growth and Development Strategy and of the National Physical
Development Plan. The plan has been prepared by the Department of Physical Planning in
collaboration with and on behalf of Chikwawa District Council.
The basic aim of the Plan is to provide an overall framework for
a) Promoting orderly, coordinated and optimum distribution of social and economic development
in the entire district;
b) Promoting the proper development of service centres and inter-settlement functional linkages;
c) Regulating the use of land; and
d) Guiding investment decisions and development.
The background studies of the Chikwawa District Physical Development Plan identified the problems
in the district as:
a) Rampant illegal developments (encroachments into road reserves, way leaves and protected
areas)
b) Chaotic/haphazard developments due to nonexistent development control mechanisms.
c) Lack of capacity for physical planning at the Council
d) Prone to natural disasters (floods and droughts)
e) Settlements in hazard prone areas
f) Shortage of land
g) Conflict of land use mainly among settlement, conservation and agriculture
h) High population growth against limited habitable and good arable land
i) Inadequate all weather road network and poor inter-settlement linkages
j) Over reliance on one source of power generation
k) Inadequate access to portable water
l) Industrial waste pollution
m) Lack of established waste management system
n) Non availability of some public services such as toilets and drainage system
o) Inadequate health facilities
p) Lack of/inadequate basic infrastructure and services
The policies formulated in the Plan are intended to assist in overcoming these problems. Therefore, I
appeal to all those involved in the Planning, development and administration of Chikwawa District to
hold hands in implementing the Plan to ensure its success and in promoting sustainable development
in Chikwawa.
Ali Phiri
DISTRICT COMMISSIONER
CHIKWAWA DISTRICT COUNCIL

xv
ACKNOWLEDGEMENTS The Ministry of Lands, Housing and Urban Development would like to express its heart-felt
gratitude to the Departments of Physical Planning for the tremendous effort it had made in
preparing the Plan. I wish to congratulate the Commissioner for Physical Planning and his
team for the hard working spirit they demonstrated during the whole exercise amid a lot of
challenges. May I thank the Land Reform Implementation Unit led by its able Team Leader
for providing the necessary coordination in conjunction with the Policy and Planning Section.
The Department of Surveys also played a pivotal role in the whole exercise by providing the
necessary geo-spatial information for the planning exercise to be successful.
The preparation of the Plan whould not have been pssible without the financial and logistical
support from the World Bank funded Shire Valley Transformation Programme under the
Ministry of Agriculture, Irrigation and Water Development. Chikwawa District Council,
being the client and main beneficiary of the Plan, showed ownership and fully participated in
the whole plan preparotory process.
The Ministry is indebted to various institutions including Government Ministries and
Departments, statutory organisations, private sector and the general public for their valuable
contributions and co-operation during the preparation of this plan.
The draft plan was circulated to all interested stakeholders and discussed in a workshop. The
plan was also displayed in all major centres in the district for public input. We wish to extend
our sincere gratitude to all government officials and representatives of statutory organisations,
civil society organisations and the private sector, members of parliament, the chair and all
members of Chikwawa District Council, including Chiefs, for their valuable contributions.
Special tribute should go to the District Commissioner and his team comprising the District
Executive Committee for the support the planning team got through out the planning exercise.
The team has strong conviction and hope that the maximum support and co-operation
received during the preparation of the Plan will also prevail during its implementation.
……………………………………………………………
BERNARD H. SANDE
SECRETARY FOR LANDS
CHIKWAWA DISTRICT PHYSICAL DEVELOPMENT PLAN
xvi
ABBREVIATIONS AND ACRONYMS AA Anhydrous Alcohol
AIDS Acquired Immune-deficiency Syndrome
ACPC Area Civil Protection Committee
ADB African Development Bank
ADD Agricultural Development Division
ADC Area Development Committee
ADMARC Agricultural Development and Marketing Corporation
ASP Agriculture Stakeholders Panel
AU African Union
BCC Blantyre City Council
CADECOM Catholic Development Commission
CDPDP Chikwawa District Physical Development Plan
CHAM Christian Health Association of Malawi
CSOs Civil Society Organizations
DADO District Agriculture Development Officer
DAEC District Agriculture Executive Committee
DC District Commissioner
DC District Council
DR District Road
DEC District Executive Committee
DEM District Education Manager
DFO District Fisheries Officer
DODMA Department of Disaster Management
DMS Degrees, Minutes and Seconds
ECDCs Early Childhood Development Centres
EMA Environment Management Act
ESCOM Electricity Corporation of Malawi
EGENCO Energy Generation Company
ETG Exports Trading Group
CHIKWAWA DISTRICT PHYSICAL DEVELOPMENT PLAN
xvii
EPA Extension Planning Area
FAO Food and Agricultural Organization
FDH First Discount House
FINCA Foundation for International Community Assistance
FIG Figure
GA Great African Rift Valley
GBA Green Belt Authority
GWAN Government Wide Area Network
HIV Human Immuno-deficiency Virus
ICT Information Communication Technology
IFMSLP Improved Forest Management for Sustainable Livelihood
Programme
LGA Local Government Policy
LPDP Local Physical Development Plan
LSLBI Large Scale Land Based Investment
MARDEF Malawi Rural Development Fund
MACOHA Malawi Council for the Handicapped
MASAF Malawi Social Action Fund
MGDS Malawi Growth and Development Strategy
MNLUP Malawi National Land Use Policy
MHC Malawi Housing Corporation
MoAIWD Ministry of Agriculture, Irrigation and Water Development
MoLHUD Ministry of Lands, Housing and Urban Development.
MoH Ministry of Health
MPS Malawi Police Service
MTL Malawi Networks Limited
SME Small and Medium Enterprise
SOGERV Sustainable Off-Grid Electrification of Rural Villages
SDA Seventh Day Adventist
SRWB Southern Region Water Board
NBM National Bank of Malawi
CHIKWAWA DISTRICT PHYSICAL DEVELOPMENT PLAN
xviii
NBS New Building Society
NDP National Development Policy
NEP National Environmental Policy
NGOs Non -Governmental Organizations
NLP National Land Policy
NRA National Road Authority
NSO National Statistical Office
RAI Rural Access Index
RDP Rural Development Project
RGCs Rural Growth Centres
RS Rectified Spirits
OIBM Opportunity International Bank of Malawi
OPC Office of President and Cabinet
OVOP One Village One Product
PEA Primary Education Advisor
PO Post Office
SDGs Sustainable Development Goals
STD Standard Bank
SUCOMA Sugar Corporation of Malawi
SVTP Shire Valley Transformation Project
T/A Traditional Authority
TEVETA Technical Entrepreneurial Vocational Educational Training
Authority
TNM Telekom Networks Malawi
VAC Village Agriculture Committee
VDC Village Development Committee
VFA Village Forest Areas
NPDP National Physical Development Plan
USA United States of America
UTM Universal Transverse Mercator
VC Village Centre

CHIKWAWA DISTRICT PHYSICAL DEVELOPMENT PLAN
xix
WB World Bank
WV World Vision
CHIKWAWA DISTRICT PHYSICAL DEVELOPMENT PLAN
1
1 INTRODUCTION AND BACKGROUND
1.1 INTRODUCTION The Chikwawa Physical Development Plan is in response to the requirements of the Physical
Planning Act 2016. The Act seeks to provide for all matters connected to physical planning
in Malawi and makes provision for orderly and progressive development of land both in
urban and rural areas. In line with this legal requirement, the Plan has been prepared to guide
spatial development of Chikwawa District while taking into consideration social and
economic development aspects of all sector activities and projects. The Plan is the first
comprehensive physical development plan to be prepared for Chikwawa district and has been
developed under the National Land Reform Programme activities of which among others is to
assist in piloting the implementation of new land laws before rolling out nation-wide. The
Plan is also expected to guide the Shire Valley Transformation Project and other major
projects of national interest in the District in the location and development of land based
investments.
The Plan has been prepared by Chikwawa District Council with technical assistance from the
Department of Physical Planning following a request by Chikwawa District Council to take
lead in the Plan preparation process while the Council is developing its technical capacity.
1.2 CONTENT AND LIFE SPAN OF THE PLAN The Plan comprises background study report, documentation of physical planning issues
identified and policies and strategies to address the issues identified. The Plan outlines
existing socio-economic and geospatial situation, their planning policy implications, and
integrates them into proposals and recommendations for guiding spatial development
framework for Chikwawa District. It has the following thematic topics: Introduction and
background; Geography; Existing development plans, programmes and policies; Natural
resources and economic activities; Population growth and characteristics; Urbanization;
Physical infrastructure; Major land uses; Institutional Framework for District Development;
Review of the Physical Development Plan; and Recommended Policies/Actions.
The lifespan of the Plan is expected to be 20 years after which the Plan will be reviewed
comprehensively. However, proposals and recommendations for short-term, medium-term
and long-term have been expounded.
1.3 SCOPE AND OBJECTIVES OF THE PLAN The Plan covers the entire Chikwawa District with an area of about 4,755 sq Km, which
includes both urban and rural areas.
The Plan aims at ensuring a well spatially planned Chikwawa District for effective social and
economic development. To achieve this, the Plan has been prepared with the following
objectives:
i. To facilitate the promotion of a more spatially balanced economic growth that will
ensure an optimum distribution of productive activities and population;
ii. To provide a spatial framework for the coordination and implementation of socio-
economic development programmes and projects;

CHIKWAWA DISTRICT PHYSICAL DEVELOPMENT PLAN
2
iii. To promote the development of service centres in conformity with the system of urban
and rural settlements and hierarchy of service centres established in the National
Physical Development Plan;
iv. To provide for transportation network that will promote the development of human
settlements, support production activities and facilitate inter settlement – functional
linkages such as travel, commodity flows and delivering of services;
v. To provide guidelines for the location of other Government development projects and
private land based investments;
vi. To rationalize and promote the optimal use of land and, in particular, the preservation
of the best arable land;
vii. To provide guidelines for the location of infrastructure and services in accordance
with available resources;
viii. To rationalize and promote the optimal use of land consistent with the requirements of
land use related laws, and the need for the conservation and management of natural
resources, environmental protection and quality of life;
ix. To provide guidelines for location of tourist destination points to achieve optimum use
of the Shire Valley and increase economic and social benefits accruing from tourism;
and
x. To promote mitigation and resilience to disasters.
It is further envisaged that, the Plan will enhance and facilitate the efficient and effective
implementation of the Shire Valley Transformation Project which is being implemented in the
district.
The preparation of the Plan has been necessitated by the need to have guidance on spatial
development of the district. The prevailing legal environment empowers local government
authorities to prepare physical development plans in order to provide proper spatial
coordination of physical, social, economic development and environmental management and
enforce development control. The Physical Planning Act 2016 also advocates for all types of
land in Malawi to be subjected to planning regulations.
1.4 PLANNING PROCESS AND CONSULTATIONS Background studies including Literature Review, Extensive Socio-Economic, and Geospatial
Surveys were conducted by a team of Physical Planners, Economists, Surveyors and
Environmental Planners. Institutions consulted include Government Ministries and
Departments, Chikwawa District Council, Traditional Authorities and their subjects, private
stakeholders, and community members within Chikwawa District.
Consultations further continued during and after the preparation of the first draft plan in order
to incorporate relevant views from various development stakeholders in the district. A better
understanding of major challenges and issues on existing spatial and socio-economic situation
in the district was vital in guiding formulation of recommendations and proposals.
Final draft of the Plan was presented in focused group sensitisation and consultative
stakeholder workshops so as to incorporate comments from participants. The final draft plan
was also put on display at 8 centres within the district to solicit public views. The District
Council through the office of the Director of Planning and Development coordinated most of

CHIKWAWA DISTRICT PHYSICAL DEVELOPMENT PLAN
3
the Planning process activities with financial support of the Shire Valley Transformation
Project.
1.5 BACKGROUND STUDIES The Government of Malawi prepared the National Physical Development Plan (NPDP) in
1987 which aimed at integrating aspects of socio-economic development planning into spatial
planning so that physical development is accomplished with sustainable use of natural
resources. The NPDP provided proposals and statements for guiding the national agenda for
development. It was also intended to direct the preparation of District Physical Development
Plans in all districts. Due to financial constraints and other factors, such as capacity, only
Karonga, Mzimba and Machinga/Balaka District plans were prepared. Despite availability of
the NPDP and other sector policies, Chikwawa lacked a comprehensive spatial development
framework to articulate and guide the District’s socio-economic and spatial development.
The District is prone to several challenges affecting the inhabitants which include lack of
adequate resources to meet the increasing demand of its population; rapid urbanisation
challenges, natural disasters, frequent flooding and drought as a result of climatic changes and
other environmental and land use challenges. Approaches to deal with these challenges have
taken place but without proper balance of space requirement and regulation of competitive
and conflicting demands for uses of land like agriculture, human settlement, forestry,
industry, infrastructure for social amenities and utilities, national parks and wildlife reserves.
Lack of a proper physical development plan for the district has significantly contributed to
uncoordinated haphazard developments taking place in the district and mostly visible in urban
centres.
Chikwawa District Council prepared land use plans to guide spatial developments and
allocation of plots at Chikwawa District Headquarters, Nchalo, Kapichira, Chapananga and
Ngabu with assistance from the Regional Commissioner for Physical Planning (South). The
plans were however not fully followed because they were considered just advisory and lacked
legal implementation and enforcement mechanisms. The local plans also lacked coherence
and proper coordination with peripheral developments due to lack of a comprehensive district
physical development plan and lack of requisite capacity at the District Council.
The Plan has a legal backing required for its implementation Under the Physical Planning
Act, 2016. The motion to prepare the Plan was unanimously adopted by the Chikwawa
District Council at its meeting held in January 2019, where among others it was decided to
request the Department of Physical Planning under Ministry of Lands, Housing and Urban
Development to prepare the Plan on the Council’s behalf. The Department was also tasked to
sensitize people at grassroot level before embarking on actual preparation of the Plan.

CHIKWAWA DISTRICT PHYSICAL DEVELOPMENT PLAN
4
2 GEOGRAPHY
2.1 INTRODUCTION This chapter gives a general description of the district which includes location, administrative
and political boundaries, climate, geology and vegetation and other physical features.
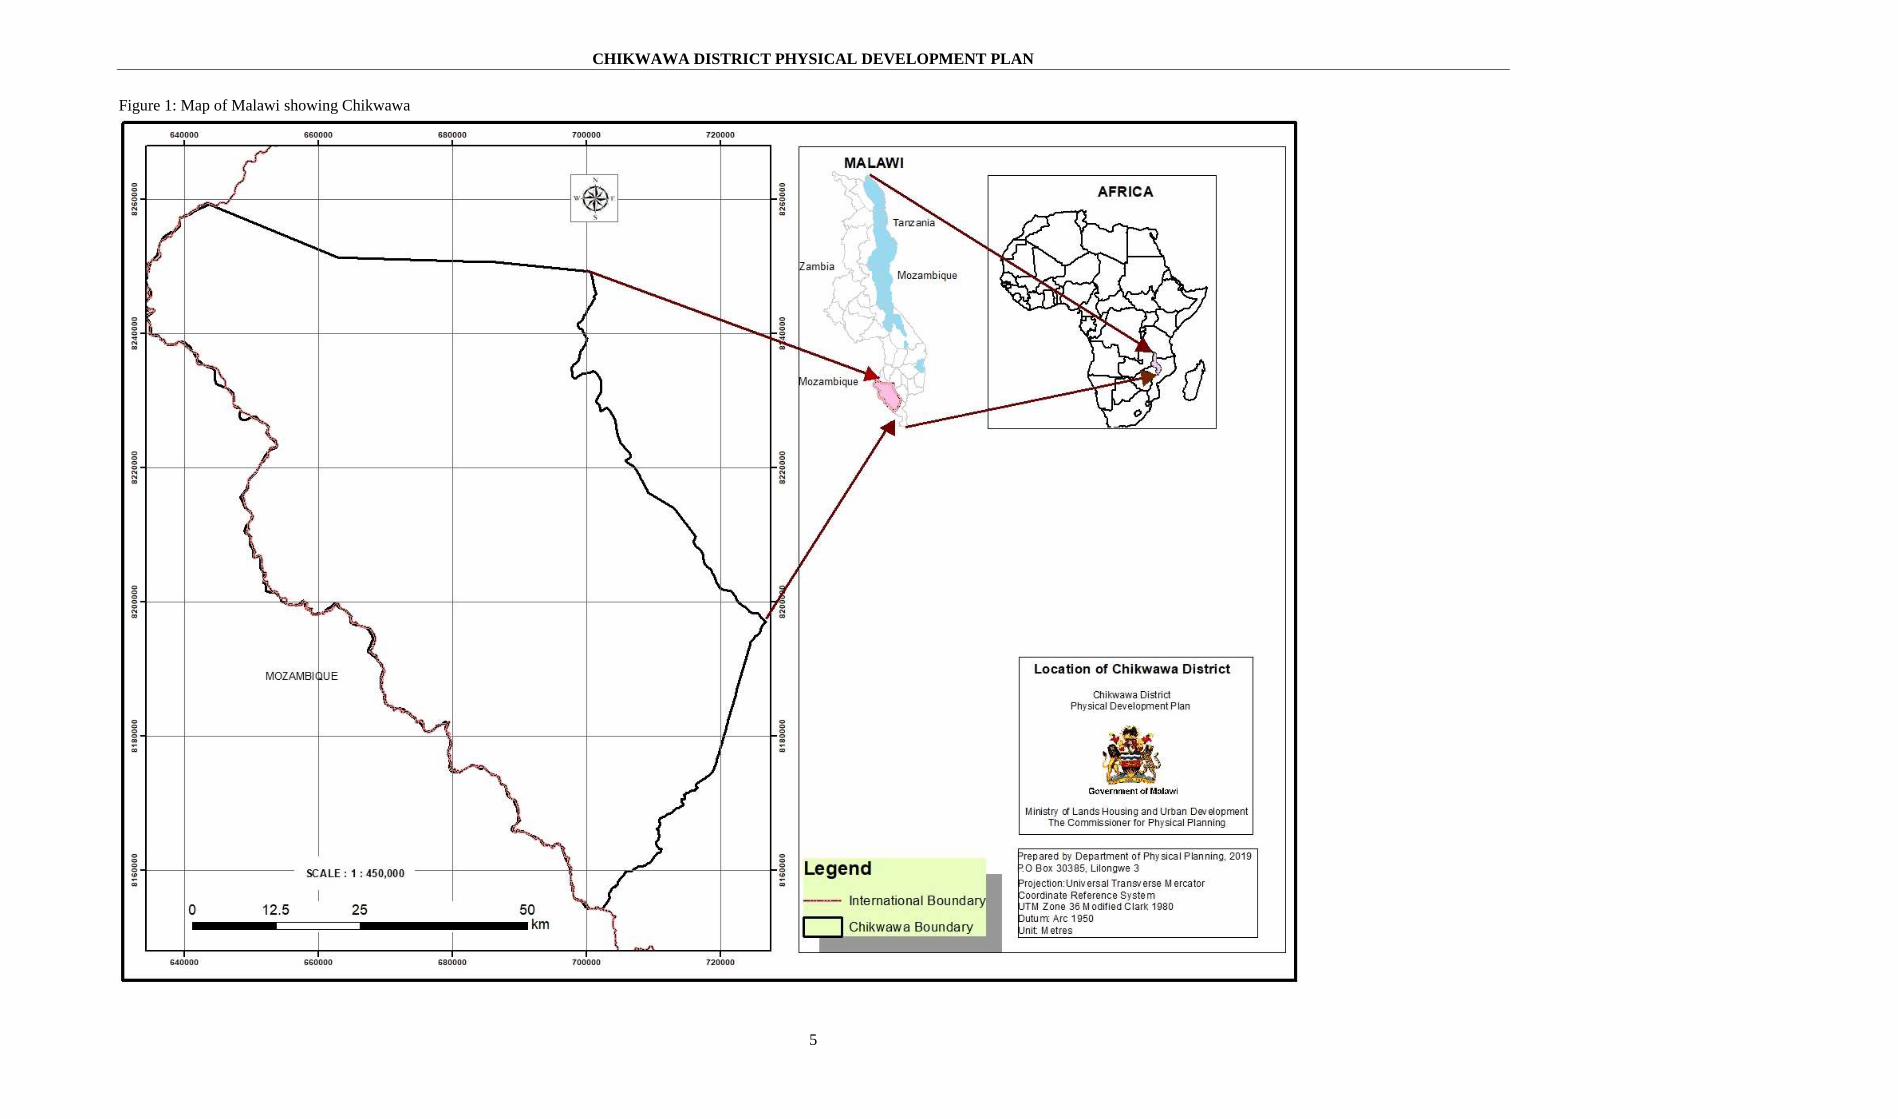
2.2 LOCATION AND SIZE Chikwawa District is located in the Southern Region of Malawi. It shares its boundary with
Mwanza District to the North, Blantyre to the North East, Thyolo to the East, Nsanje to the
South and Mozambique international boundary to the West. The District Headquarters is
approximately 54 km away from Blantyre City. Its geographic locational coordinates are
16°10'0" S and 34°45'0" E in DMS (Degrees Minutes Seconds) or -16.1667 and 34.75 (in
decimal degrees). The District covers a total land area of 4,892 km2 (489,165.769 ha) which
is about 15% the size of the Southern Region and 5.04% of the country;. It is the second
largest district in southern region and fifth in Malawi. Figure 1 is a Map of Malawi showing
the location of Chikwawa District.
CHIKWAWA DISTRICT PHYSICAL DEVELOPMENT PLAN
5
Figure 1: Map of Malawi showing Chikwawa
CHIKWAWA DISTRICT PHYSICAL DEVELOPMENT PLAN
6
2.3 TOPOGRAPHY AND DRAINAGE
2.3.1 Topography
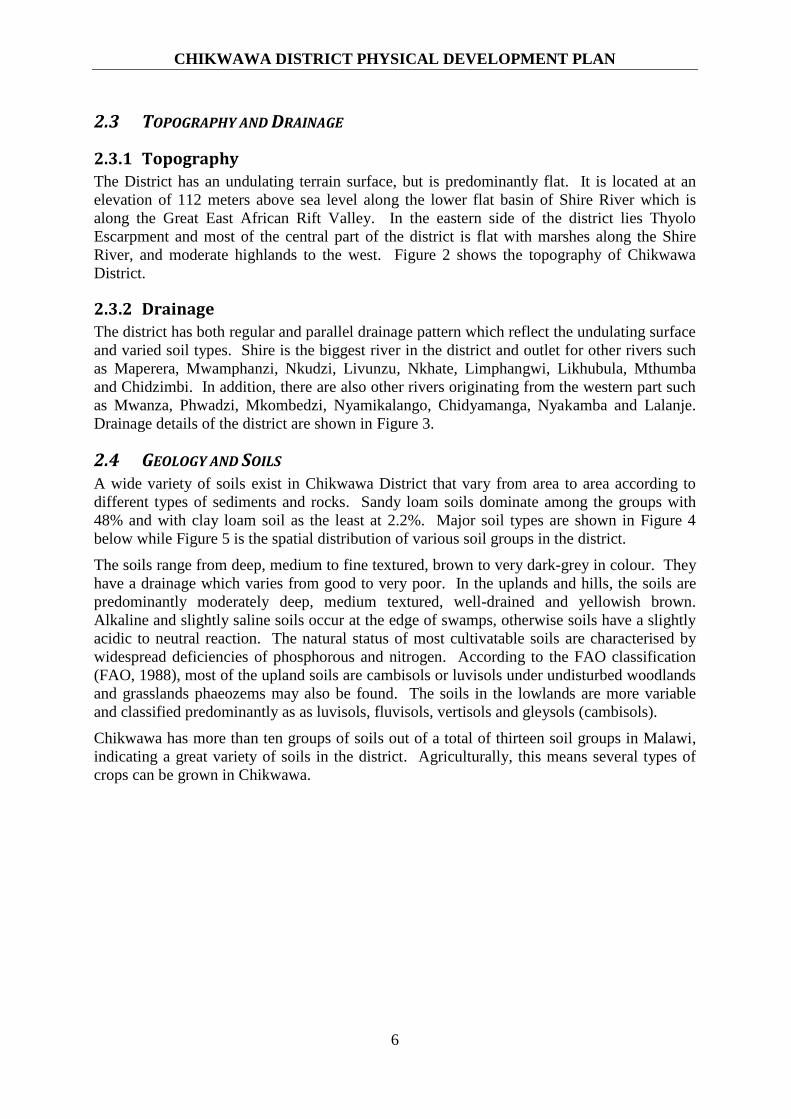
The District has an undulating terrain surface, but is predominantly flat. It is located at an
elevation of 112 meters above sea level along the lower flat basin of Shire River which is
along the Great East African Rift Valley. In the eastern side of the district lies Thyolo
Escarpment and most of the central part of the district is flat with marshes along the Shire
River, and moderate highlands to the west. Figure 2 shows the topography of Chikwawa
District.
2.3.2 Drainage
The district has both regular and parallel drainage pattern which reflect the undulating surface
and varied soil types. Shire is the biggest river in the district and outlet for other rivers such
as Maperera, Mwamphanzi, Nkudzi, Livunzu, Nkhate, Limphangwi, Likhubula, Mthumba
and Chidzimbi. In addition, there are also other rivers originating from the western part such
as Mwanza, Phwadzi, Mkombedzi, Nyamikalango, Chidyamanga, Nyakamba and Lalanje.
Drainage details of the district are shown in Figure 3.
2.4 GEOLOGY AND SOILS A wide variety of soils exist in Chikwawa District that vary from area to area according to
different types of sediments and rocks. Sandy loam soils dominate among the groups with
48% and with clay loam soil as the least at 2.2%. Major soil types are shown in Figure 4
below while Figure 5 is the spatial distribution of various soil groups in the district.
The soils range from deep, medium to fine textured, brown to very dark-grey in colour. They
have a drainage which varies from good to very poor. In the uplands and hills, the soils are
predominantly moderately deep, medium textured, well-drained and yellowish brown.
Alkaline and slightly saline soils occur at the edge of swamps, otherwise soils have a slightly
acidic to neutral reaction. The natural status of most cultivatable soils are characterised by
widespread deficiencies of phosphorous and nitrogen. According to the FAO classification
(FAO, 1988), most of the upland soils are cambisols or luvisols under undisturbed woodlands
and grasslands phaeozems may also be found. The soils in the lowlands are more variable
and classified predominantly as as luvisols, fluvisols, vertisols and gleysols (cambisols).
Chikwawa has more than ten groups of soils out of a total of thirteen soil groups in Malawi,
indicating a great variety of soils in the district. Agriculturally, this means several types of
crops can be grown in Chikwawa.

CHIKWAWA DISTRICT PHYSICAL DEVELOPMENT PLAN
7
Figure 2: Topographic Map of Chikwawa
CHIKWAWA DISTRICT PHYSICAL DEVELOPMENT PLAN
8
Figure 3: Map of Chikwawa showing Drainage
CHIKWAWA DISTRICT PHYSICAL DEVELOPMENT PLAN
9
Figure 4: Geology and Soils
Table 1: State of Soils’ Types, and Topography
Soil
group Soil family
Soil
depth
(cm)
Soil
drainage
Particle size
Colour
subsoil Land form
Top soil
0-30cm
deep
Subsoil
30cm
deep
Calcaric Mikalango 100-150 Moderately
well + well
Medium Medium Brown Dissected foot
slopes
Fluvic Nkhate 150 Moderately
well + well
Medium +
Fine
Variable Dark Brown Outwash plain,
flood plain
Mbewe 150 Well Medium Coarse
medium
Dark Brown Outwash plains
Eutric
Fersialic
Jombo 150 Well Medium Medium Brown Foot slopes,
marshes,
depressions,
Gleyic Ubale 150 Poor
imperfect
Medium +
Fine
Medium
+ Fine
Dark Grey Bottom lands,
depression
Salic Alumenda 150 Poor
imperfect
Medium +
Fine
Medium
+ Fine
Dark Brown Marsh margins
CHIKWAWA DISTRICT PHYSICAL DEVELOPMENT PLAN
10
Soil
group Soil family
Soil
depth
(cm)
Soil
drainage
Particle size
Colour
subsoil Land form
Top soil
0-30cm
deep
Subsoil
30cm
deep
Vertic Malikopo 150 Poor
imperfect
Fine Fine Dark Grey Depression,
bottom lands,
lakes margin
plain
Thudzu 150 Imperfect Fine Fine Dark Grey Uplands
Paralithic Lengwe 50-100 Moderately
well
Medium
skeletal
Medium
skeletal
Greyish
brown
Uplands
Ndakwera 50-100 Well Medium +
coarse
Medium Yellowish
Brown
Uplands,
Hillsides,
footslopes,
Escarpments
Source: District State of Environment Report, 2017
CHIKWAWA DISTRICT PHYSICAL DEVELOPMENT PLAN
11
Figure 5: Map of Chikwawa District Showing Soil Types
CHIKWAWA DISTRICT PHYSICAL DEVELOPMENT PLAN
12
2.5 CLIMATE
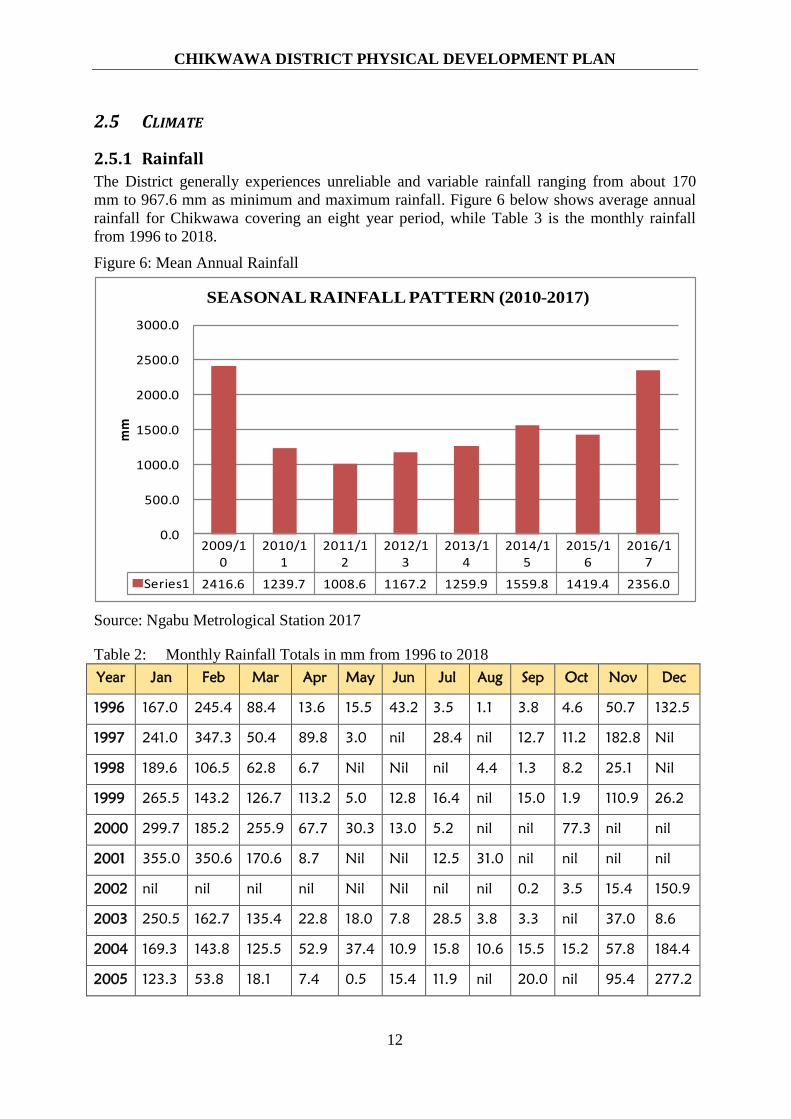
2.5.1 Rainfall
The District generally experiences unreliable and variable rainfall ranging from about 170
mm to 967.6 mm as minimum and maximum rainfall. Figure 6 below shows average annual
rainfall for Chikwawa covering an eight year period, while Table 3 is the monthly rainfall
from 1996 to 2018.
Figure 6: Mean Annual Rainfall
2009/10
2010/11
2011/12
2012/13
2013/14
2014/15
2015/16
2016/17
Series1 2416.6 1239.7 1008.6 1167.2 1259.9 1559.8 1419.4 2356.0
0.0
500.0
1000.0
1500.0
2000.0
2500.0
3000.0
mm
SEASONAL RAINFALL PATTERN (2010-2017)
Source: Ngabu Metrological Station 2017
Table 2: Monthly Rainfall Totals in mm from 1996 to 2018
Year Jan Feb Mar Apr May Jun Jul Aug Sep Oct Nov Dec
1996 167.0 245.4 88.4 13.6 15.5 43.2 3.5 1.1 3.8 4.6 50.7 132.5
1997 241.0 347.3 50.4 89.8 3.0 nil 28.4 nil 12.7 11.2 182.8 Nil
1998 189.6 106.5 62.8 6.7 Nil Nil nil 4.4 1.3 8.2 25.1 Nil
1999 265.5 143.2 126.7 113.2 5.0 12.8 16.4 nil 15.0 1.9 110.9 26.2
2000 299.7 185.2 255.9 67.7 30.3 13.0 5.2 nil nil 77.3 nil nil
2001 355.0 350.6 170.6 8.7 Nil Nil 12.5 31.0 nil nil nil nil
2002 nil nil nil nil Nil Nil nil nil 0.2 3.5 15.4 150.9
2003 250.5 162.7 135.4 22.8 18.0 7.8 28.5 3.8 3.3 nil 37.0 8.6
2004 169.3 143.8 125.5 52.9 37.4 10.9 15.8 10.6 15.5 15.2 57.8 184.4
2005 123.3 53.8 18.1 7.4 0.5 15.4 11.9 nil 20.0 nil 95.4 277.2

CHIKWAWA DISTRICT PHYSICAL DEVELOPMENT PLAN
13
Year Jan Feb Mar Apr May Jun Jul Aug Sep Oct Nov Dec
2006 137.8 78.4 175.2 20.9 3.8 1.2 nil nil nil nil 57.2 150.2
2007 515.7 166.8 53.1 33.3 6.8 nil 27.7 nil 7.1 27.3 86.4 334.7
2008 319.6 61.8 95.1 nil nil nil 10.0 0.8 nil 0.1 5.3 283.0
2009 110.7 45.6 57.8 38.4 64.7 7.7 11.0 10.0 nil 32.7 64.9 67.1
2010 42.0 140.6 116.0 26.7 10.4 14.4 nil 2.1 nil 4.1 90.8 179.0
2011 122.6 55.7 113.7 6.9 2.4 1.0 8.1 6.9 9.6 51.4 14.3 137.7
2012 226.6 123.5 83.0 23.3 11.5 29.6 nil nil nil 0 0.4 178.6
2013 319.5 137.8 77.1 39.5 8.0 19.0 15.2 1.9 66.4 2.1 23.3 105.0
2014 216.2 125.5 115.3 43.4 17.0 12.1 17.0 nil 3.8 2.8 9.2 104.0
2015 485.0 262.3 120.0 6.1 4.5 1.9 nil nil nil nil 79.5 68.2
2016 216.1 155.6 85.3 19.6 20.2 12.5 13.1 nil nil 1.8 33.6 103.1
2017 260.3 201.0 96.4 55.4 30.1 18.0 15.9 nil 1.6 19.1 49.8 86.9
2018 126.8 189.8 141.3 60.1 40.8 nil 53.4 13.6 nil nil 101.7 232.4
Source: Ngabu Meteorological Station 2018
2.5.2 Temperatures
Temperatures are generally high with a maximum of about 37.6°C usually experienced in
November and a minimum of 27.6 °C in July every year whilst the mean average
temperatures are usually above 20 °C.
Figure 7: Annual Temperatures
2009 2010 2011 2012 2013 2014 2015
Mean Min.Temp 20.9 21.1 19.1 18.9 21.1 20.7 20.8
Mean Max. Temp 33.3 33.5 33.5 33.4 32.1 32.8 33.0
0.0
5.0
10.0
15.0
20.0
25.0
30.0
35.0
40.0
oC
MEAN MIN AND MAX TEMP (2009-2015)
Source: Ngabu Meteorological Station 2015
C°
CHIKWAWA DISTRICT PHYSICAL DEVELOPMENT PLAN
14
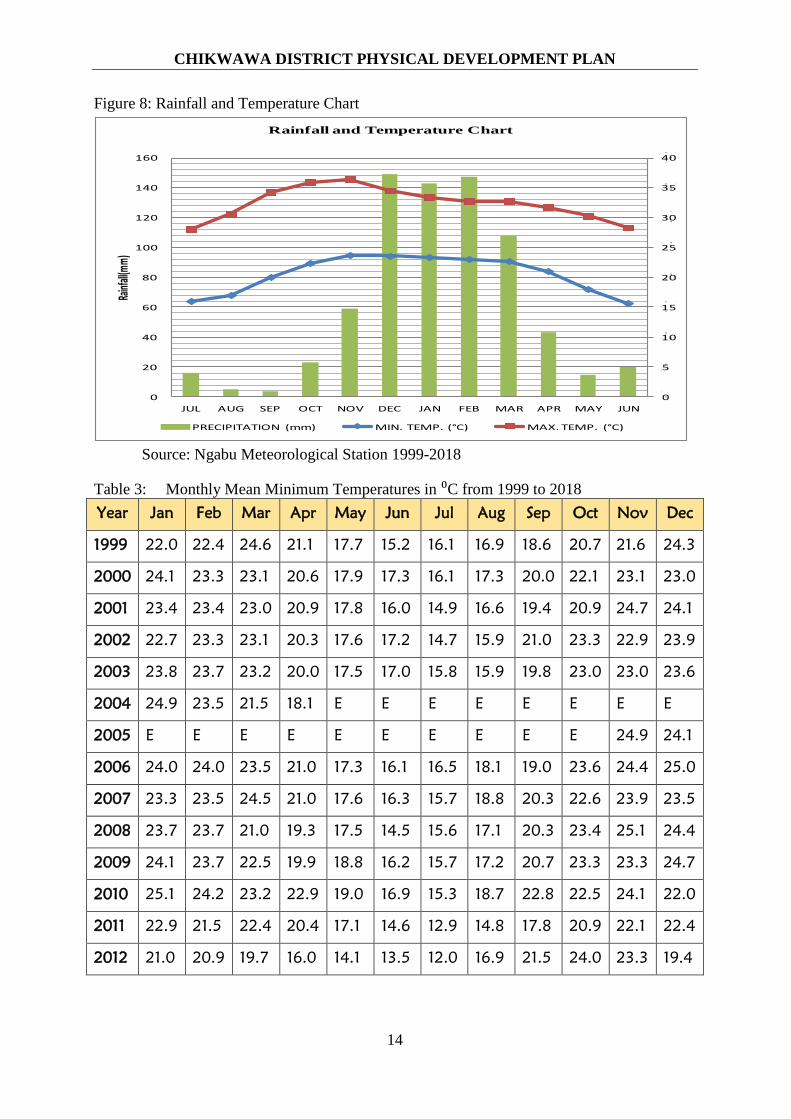
Figure 8: Rainfall and Temperature Chart
0
5
10
15
20
25
30
35
40
0
20
40
60
80
100
120
140
160
JUL AUG SEP OCT NOV DEC JAN FEB MAR APR MAY JUN
Rainf
all(m
m)
Rainfall and Temperature Chart
PRECIPITATION (mm) MIN. TEMP. (°C) MAX. TEMP. (°C)
Source: Ngabu Meteorological Station 1999-2018
Table 3: Monthly Mean Minimum Temperatures in ⁰C from 1999 to 2018
Year Jan Feb Mar Apr May Jun Jul Aug Sep Oct Nov Dec
1999 22.0 22.4 24.6 21.1 17.7 15.2 16.1 16.9 18.6 20.7 21.6 24.3
2000 24.1 23.3 23.1 20.6 17.9 17.3 16.1 17.3 20.0 22.1 23.1 23.0
2001 23.4 23.4 23.0 20.9 17.8 16.0 14.9 16.6 19.4 20.9 24.7 24.1
2002 22.7 23.3 23.1 20.3 17.6 17.2 14.7 15.9 21.0 23.3 22.9 23.9
2003 23.8 23.7 23.2 20.0 17.5 17.0 15.8 15.9 19.8 23.0 23.0 23.6
2004 24.9 23.5 21.5 18.1 E E E E E E E E
2005 E E E E E E E E E E 24.9 24.1
2006 24.0 24.0 23.5 21.0 17.3 16.1 16.5 18.1 19.0 23.6 24.4 25.0
2007 23.3 23.5 24.5 21.0 17.6 16.3 15.7 18.8 20.3 22.6 23.9 23.5
2008 23.7 23.7 21.0 19.3 17.5 14.5 15.6 17.1 20.3 23.4 25.1 24.4
2009 24.1 23.7 22.5 19.9 18.8 16.2 15.7 17.2 20.7 23.3 23.3 24.7
2010 25.1 24.2 23.2 22.9 19.0 16.9 15.3 18.7 22.8 22.5 24.1 22.0
2011 22.9 21.5 22.4 20.4 17.1 14.6 12.9 14.8 17.8 20.9 22.1 22.4
2012 21.0 20.9 19.7 16.0 14.1 13.5 12.0 16.9 21.5 24.0 23.3 19.4

CHIKWAWA DISTRICT PHYSICAL DEVELOPMENT PLAN
15
Year Jan Feb Mar Apr May Jun Jul Aug Sep Oct Nov Dec
2013 E E E E E E 16.0 16.8 21.6 22.1 24.7 24.5
2014 24.1 20.7 23.2 20.0 18.0 16.4 16.8 17.8 19.4 21.8 23.9 22.1
2015 22.0 22.7 20.4 19.6 19.5 15.8 16.1 18.0 19.0 19.9 22.2 22.1
2016 22.3 22.1 20.4 20.0 19.4 14.8 15.8 17.3 19.1 19.4 20.8 21.6
2017 23.4 22.1 21.4 20.8 19.4 16.1 14.9 16.6 18.5 18.8 20.7 22.4
2018 23.0 22.0 21.5 20.5 19.0 16.2 15.2 15.9 19.0 18.0 20.1 22.2
2.6 CLIMATE AND CLIMATE CHANGE The district experiences tropical climate and falls into wet and dry seasons. The Inter-
Tropical Convergence Zone oscillations largely determine the district’s climate as it is the
interactions between the Zonal Congo air mass and the meridian south-eastern trade winds
and monsoonal north-eastern winds. It is hot and humid from October to April in the
District1. The wet season extends from November/December and ends in April/May, while
the dry season occurs from May to October/November. It generally receives unreliable and
variable rainfall ranging from a minimum of about 170 mm to a maximum of about 967.6 mm
per annum. Temperatures are generally high with an average minimum of about 27.6 °C in
July and maximum of about 37.6°C usually experienced in November every year whilst the
mean monthly temperatures are usually above 20.0 °C.
Climate change greatly affects the district in many ways. The effects result into different
types of disasters with floods and prolonged dry spells dominating. Other disasters include
stormy rains, strong winds, high prevalence rate of HIV and AIDS pandemic, cholera and
army worm outbreak and foot and mouth disease mostly when the flood victims are gathered
in camp/evacuation sites. The impact of floods on rural communities is devastating and
hinders development. Communities are mainly affected when their crops and livestock get
washed away resulting into food insecurity and loss of livelihoods. The damage to
infrastructure reduces access to social and economic amenities; among them being limited
access to safe and potable drinking water and sanitation facilities.
The negative coping mechanisms have left vulnerable households with no means of
livelihood and hence trapped in the poverty cycle. In some cases, floods and strong winds,
strike at a period when the only viable option for replanting is to use irrigation. Floods bring
alluvial soil which is very fertile for agricultural activities in Chikwawa District. Climate
change has also impacted on prevailing winds. Its annual average speed movement has
increased to 4.3km/h over the past 10 years between 2005 and 2014. Prevailing winds
usually are from south east at moderate speed of about 2m/s.
2.7 VEGETATION Chikwawa is one of the districts in Malawi that enjoys both terrestrial and aquatic vegetation
types. The terrestrial ecosystem of the district is classified into two; acacia thicket clump
savanna that is predominantly within Lengwe National Park. It comprises tree species like
1 factrover.com/geography/Malawi, 2019
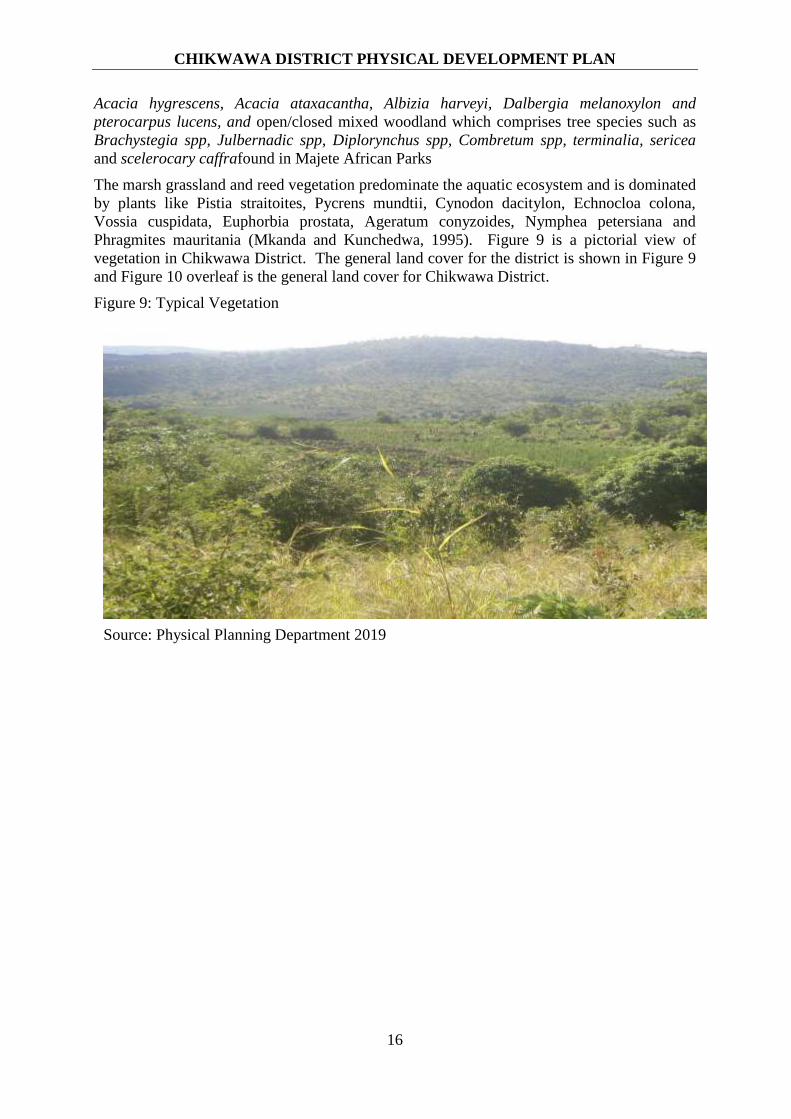
CHIKWAWA DISTRICT PHYSICAL DEVELOPMENT PLAN
16
Acacia hygrescens, Acacia ataxacantha, Albizia harveyi, Dalbergia melanoxylon and
pterocarpus lucens, and open/closed mixed woodland which comprises tree species such as
Brachystegia spp, Julbernadic spp, Diplorynchus spp, Combretum spp, terminalia, sericea
and scelerocary caffrafound in Majete African Parks
The marsh grassland and reed vegetation predominate the aquatic ecosystem and is dominated
by plants like Pistia straitoites, Pycrens mundtii, Cynodon dacitylon, Echnocloa colona,
Vossia cuspidata, Euphorbia prostata, Ageratum conyzoides, Nymphea petersiana and
Phragmites mauritania (Mkanda and Kunchedwa, 1995). Figure 9 is a pictorial view of
vegetation in Chikwawa District. The general land cover for the district is shown in Figure 9
and Figure 10 overleaf is the general land cover for Chikwawa District.
Figure 9: Typical Vegetation
Source: Physical Planning Department 2019
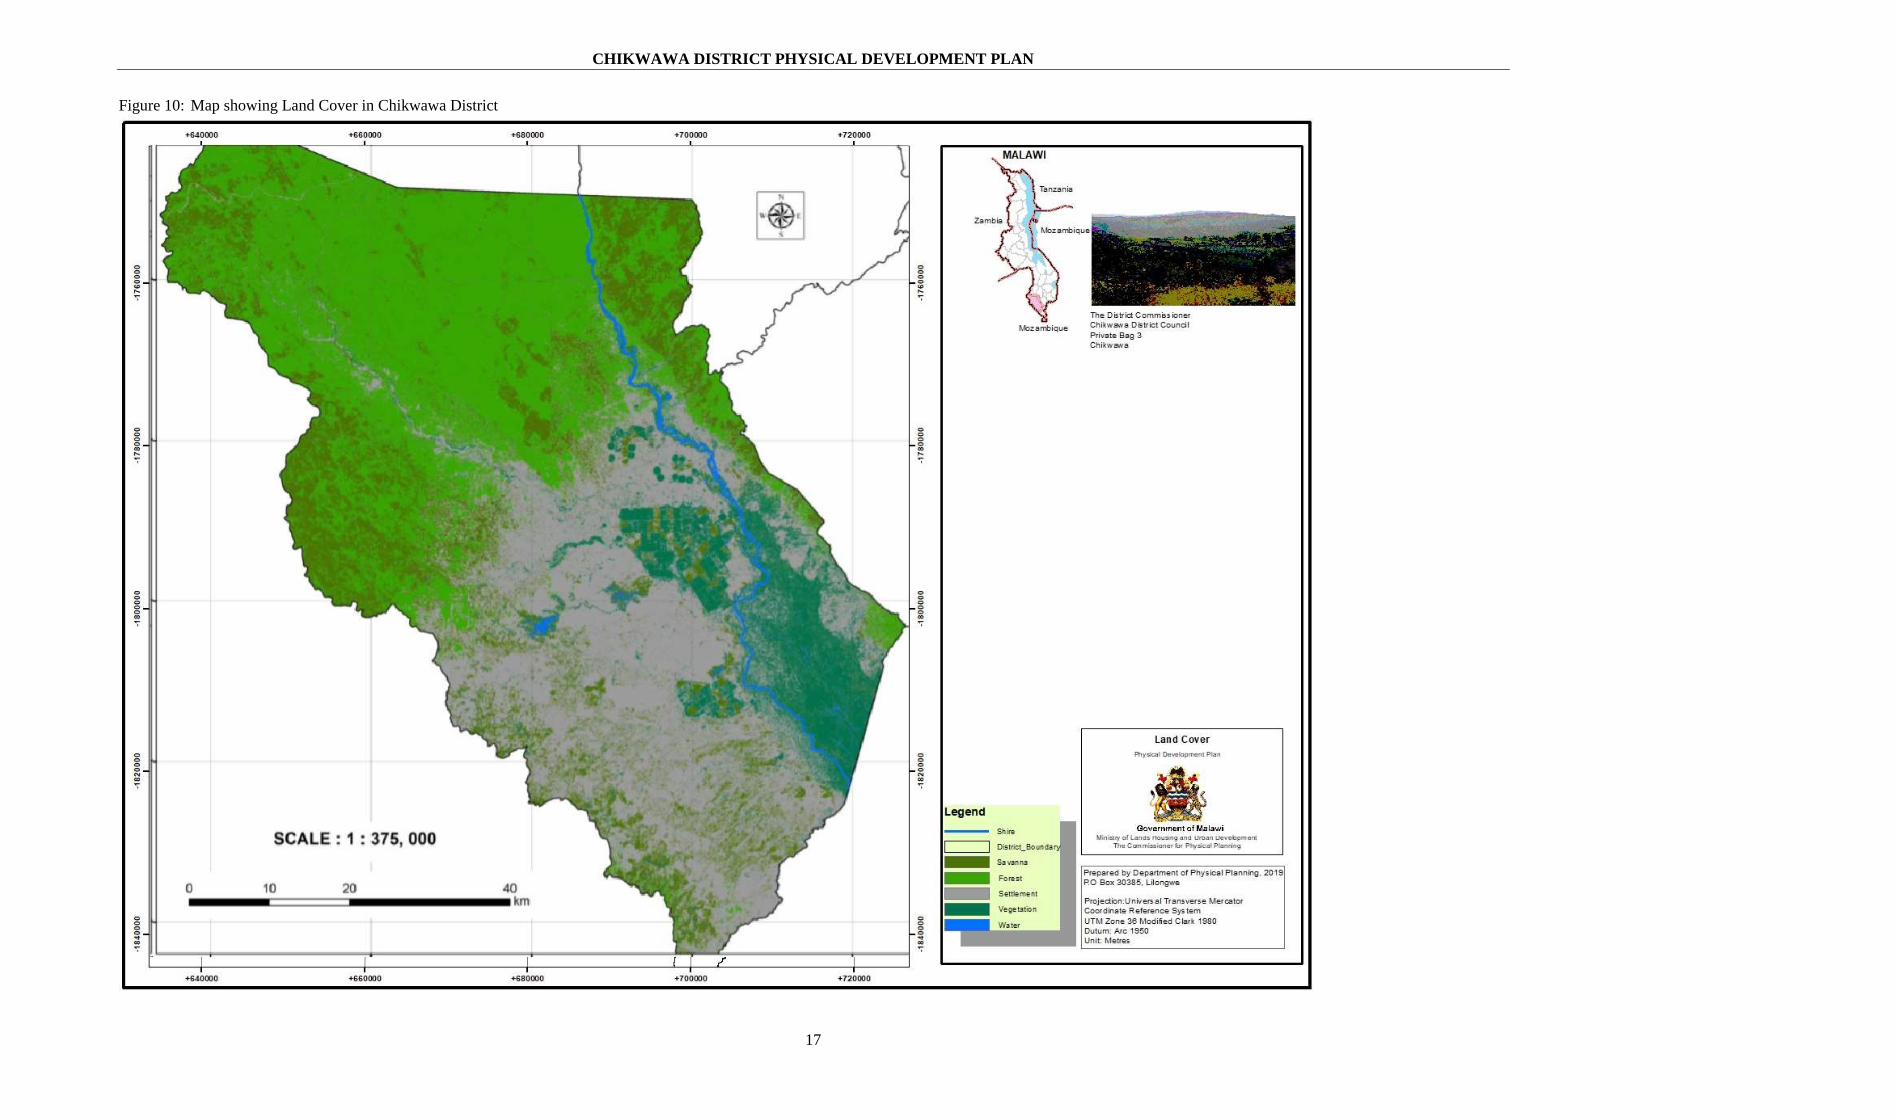
CHIKWAWA DISTRICT PHYSICAL DEVELOPMENT PLAN
17
Figure 10: Map showing Land Cover in Chikwawa District

18
3 EXISTING POLICY AND LEGAL FRAMEWORK
3.1 INTRODUCTION This chapter outlines the policy and legal framework, international strategies and best
practices and major development programmes which will have a significant impact on
Chikwawa District Physical Development Plan preparation process, policies and the future
development of the district.
3.2 INTERNATIONAL POLICY FRAMEWORK
3.2.1 Sustainable Development Goals, 2015
The Sustainable Development Goals (SDGs) developed by United Nations and adopted in
2015 by all countries seek to achieve a better and more sustainable future for all. Goal 11 of
the SGDs specifically expresses the need to make cities and human settlements inclusive,
safe, resilient and sustainable. Malawi has localised the SDGs. Thus, Goal 11 is particularly
pertinent to the district and local plan preparation and implementation process.
3.2.2 Guiding Principles on Large Scale Land Based Investments in Africa
At continental level, the African Union adopted the Guiding Principles on Large Scale Land
Based Investments (LSLBI) in 2014 following a growing realization that LSLBI were often
times associated with risks such as wide spread alienation of land from local communities
without adequate compensation, marginalization of smallholder farmers in favour of large
scale investors who receive protection, and promotion of gender based inequalities. The
Guiding Principles were the outcome of a desire by African Union Member States to ensure
that investments in land benefit Member States and key stakeholders. The Principles
primarily seek to ensure observance of international human rights declarations and
conventions as well as regional declarations in the manner in which LSLBI are conducted.
3.3 NATIONAL LEGAL AND POLICY FRAMEWORK
3.3.1 The Malawi Constitution
Article 13(d) of the Malawi Republican Constitution calls upon the state to promote
sustainable development and manage the environment responsibly in order to prevent
degradation. It further stipulates that the state should guarantee the right to development and
take measures for the realization of this right and to introduce reforms aimed at eradicating
social injustice and inequities.
In view of this constitutional provision, the Chikwawa District Physical Development Plan
shall promote improved land use, planning and management for orderly, coordinated and
sustainable socio-economic development.
3.3.2 The Malawi Growth and Development Strategy (MGDS III)
The MGDS III is Malawi’s overarching development strategy for the period 2017-2022. The
overall objective is to move Malawi to a productive, competitive and resilient nation through
sustainable economic growth, energy, industrial and infrastructure development while
addressing water, climate change and environmental management and population challenges.
CHIKWAWA DISTRICT PHYSICAL DEVELOPMENT PLAN
19
The strategy has identified five priority areas of development which include; Agriculture,
Water Development and Climate Change Management; Education and Skills Development;
Energy, Industry and Tourism Development; Transport and ICT Infrastructure and Health
and Population. It is government’s expectation that the five priority areas will not only be
key in promoting economic growth and infrastructure development, but will also be
instrumental in accelerating the attainment of the Sustainable Development Goals (SDGs).
Human Settlements and Physical Planning are placed in the category of Other Development
Areas of Focus which are considered to be essential complements, guide for physical
development and play a catalytic role to the realization of the five key priority areas.2
MGDS III acknowledges that Malawi is experiencing significant demographic changes which
influence the unprecedented growing need for land for various uses. The strategy further
acknowledges that, due to lack of appropriate spatial framework, human settlements have
developed uncontrollably and spread to environmentally fragile areas such as wetlands, steep
slopes and riverbanks among others, resulting in environmental degradation in most parts of
the country. This state of affairs has created an urgent need for the development of effective
mechanisms to contain the situation. The Chikwawa District Physical Development Plan is
one such instrument that will ensure that physical development, both in urban and rural areas
of the district, is properly guided.
3.3.3 The National Physical Development Plan
The National Physical Development Plan (NPDP) was adopted by the Government for
implementation in 1987. The purpose of the Plan is to provide a spatial framework for
integrating all aspects of physical planning into national development planning, programmes
and projects in order to promote coordinated and balanced distribution of social and
economic development in the country. The NPDP has also played a major role as the
country’s strategy for managing land use and urbanisation.
The NPDP was the first major step towards guiding rural land use planning. The Plan
designated areas into zones of major land uses on the basis of their development potential and
stipulated broad principles and policies to be elaborated on and applied by respective District
and Local Physical Development Plans.
However, several issues have emerged in most sectors of the economy over the years that
have to some extent undermined the relevance and effectiveness of NPDP. For instance, the
country has experienced a shift in government development strategy to reflect global trends
of people-centred planning approaches which subsequently saw the birth and adoption of the
Millennium Development Goals (MDGs) in 2000 and superseded by the Sustainable
Development Goals (SDGs) in 2015. In addition, Government adopted a new development
strategy namely, the Malawi Growth and Development Strategy (MGDS) which resulted in
the realignment of the country’s development focus areas.
Since the Plan was prepared in 1987, some strategies and approaches have changed rendering
the Plan outdated. Furthermore, this has been compounded with the enactment of the
Physical Planning Act 2016, which advocates for participatory planning, decentralised
approaches to implementation and give emphasis to sustainable development. It is therefore
imperative that the NPDP should be reviewed to realign it with the country and international
physical, social and economic changes. This notwithstanding, it is noteworthy that the
general provisions and guiding principles of the Plan are still relevant for most sectors. Thus,
the NPDP forms a sound basis for the preparation of the Plan.
2 MGDS III,
CHIKWAWA DISTRICT PHYSICAL DEVELOPMENT PLAN
20
3.3.4 The Physical Planning Act 2016
The Physical Planning Act 2016 is the principal statutory instrument governing physical
planning in Malawi. The Act gives the responsibility of district physical development plan
preparation to Local Government Authorities and Sections 29-32 of the Act stipulate the
Plan’s content, preparation and approval process. To this end, all consultations during
situation analysis process for the Plan has been strictly aligned to the provisions of the Act.
Other pieces of legislation, which are critical for the Plan include the following: The Land
(Amendment) Act, 2016, Customary Land Act, 2016, Land Survey Act 2016, the Forestry
(Amendment) Act, 2016, the Local Government (Amendment) Act, 2010 and the Water
Resources Act among others. Also listed below are some of the policies and major existing
development programmes/projects whose provisions have a direct bearing on the Plan.
3.3.5 The National Land Policy, 2002
The goal of the National Land Policy (NLP) is to ensure tenure security and equitable access
to land and facilitate the attainment of social harmony and broad based social and economic
development through optimum and ecologically balanced use of land and land-based
resources.
The NLP stipulates that the application of the physical planning law should extend land use
and development control to all rural and urban areas. In essence, the policy provision
declared the whole country a planning area. The NLP also identified the need to develop a
comprehensive spatial development framework to ensure that social and economic
development takes place in a sustainable manner throughout the country. This necessitated
the preparation of the National Land Use Policy (NLUP).
The goal of the NLUP is to achieve coordinated, efficient and environmentally sustainable
socio-economic development through effective land use planning, orderly development, and
management of land and land-based resources. In this regard, the Plan seeks to provide a
spatial framework that will promote and support sustainable social and economic
development in the district.
3.3.6 National Decentralization Policy, 1998
The National Decentralization Policy (NDP) 1998 provides for popular participation in
governance through local governments. The NDP provide for many functions to be
devolved including physical planning to the local level and designates Local Government
Authorities as planning authorities and requires them to provide for stakeholder participation
in the formulation, implementation and monitoring of plans and socio-economic and
infrastructural development. The policy is reinforced by the Local Government
(Amendment) Act, 2010 which empowers local authorities to plan and implement
development projects.
3.3.7 National Environmental Policy, 2004
The overall goal of the National Environmental policy (NEP) is to promote sustainable social
and economic development through the sound management of the environment and natural
resources in the country. The NEP acts as the benchmark against which all sectoral
environmental policies are developed to ensure that they conform to the principles of
sustainable development. In this context, the NEP provides guiding principles which the Plan
is advocating.

CHIKWAWA DISTRICT PHYSICAL DEVELOPMENT PLAN
21
3.3.8 Malawi National Disaster Risk Management Policy, 2016
The policy emphasizes the need for mainstreaming disaster risk management into all
sustainable development planning and implementation processes at all levels. The
Chikwawa District Physical Development Plan will integrate disaster risk management with
the view to increase communities’ resilience and mitigate the impact of disasters.
3.3.9 National Wildlife Policy, 2000
The policy seeks to conserve and manage protected areas and wildlife (national parks,
wildlife reserves etc) and provide for their sustainable use through equitable access and fair
sharing of benefits to Malawians. The policy is particularly relevant to Chikwawa District in
view of the existence of two of the country’s major national parks namely, Lengwe and
Majete, and the presence of Elephant Marsh and other tourist attractions.
3.3.10 National Housing Policy, 2018
The National Housing Policy seeks to create an enabling institutional, legal and strategic
framework for the better delivery of adequate and affordable housing to meet the current and
future housing demands and related infrastructural needs for all Malawians. Implementation
of this policy is relevant and critical to Chikwawa District in the light of the ever-growing
housing needs resulting from population growth, coupled with natural disasters, especially
floods which have a negative impact on the district’s existing housing stock.
3.3.11 National Agriculture Policy, 2016
The goal of the policy is to achieve sustainable agricultural transformation that will result in
significant growth of the agricultural sector, expanding incomes for farm households,
improved food and nutrition security for all Malawians, and increased agricultural exports.
One of the objectives of the policy is to strengthen linkages between the agricultural sector
and other sectors to ensure sustained and resilient socio-economic growth and development.
The policy promotes development and maintenance of agriculture-related infrastructure, such
as roads, value addition centres, and warehouses to enhance urban-rural market linkages.
This policy’s implementation is extremely significant in view of the major agricultural
projects being implemented in Chikwawa District namely, the Shire Valley Transformation
and Agriculture Commercialisation.
3.3.12 National Climate Change Management Policy, 2016
The goal of the policy is to promote climate change adaptation, mitigation, technology
development and transfer and capacity building for sustainable livelihoods through green
economy measures for Malawi. It seeks to guide programming of interventions for reduction
of greenhouse gas emissions into the atmosphere, as well as adapting to the adverse effects
and impacts of climatic change and climate variability. Implementation of this policy will be
very critical because Chikwawa district is susceptible to natural disasters such as floods,
strong winds and droughts some of which are a result of climate change.
3.3.13 The National Urban Policy, (NUP) 2019
The overall goal of NUP is to create an enabling environment for developing efficient and
dynamic urban settlements, which promote equality in accessing economic opportunities,
ensure improved standard of living and well-being, and foster sustainable economic growth.
Implementation of this policy will be critical in view of the rapid urbanization being
experienced in the country and indeed in some of the urban centres in Chikwawa District
such as Ngabu, Dyeratu and Nchalo.

CHIKWAWA DISTRICT PHYSICAL DEVELOPMENT PLAN
22
3.3.14 The Water Policy, 2007
The goal of the policy is to realise sustainable and efficient access to water to satisfy the basic
needs of Malawians and for enhancement of the natural ecosystem. This policy ensures that
water provision and conservation are part of sustainable land use and management principles
and practices. This policy is critical to the implementation of the Plan and various other
village land use plans which form part of the spatial frameworks for the Shire Valley
Transformation Project and all other development projects in the district.
3.3.15 National Gender Policy, 2011
The goal of the policy is to ensure mainstreaming of gender in the national development
process to enhance participation of all people for sustainable and equitable social economic
development for poverty eradication. The Plan preparation process was highly consultative
to allow for the participation of all stakeholders including all groups of people.
3.3.16 Land Resources Management Policy and Strategy, 2000
The policy promotes the sustainable utilisation and management of land for agricultural
productivity in order to balance land requirements for different uses according to land and
soil suitability. The policy is also an instrument for conservation of land-based resources.
Thus, the policy has direct relevance to the Plan that forms the spatial framework for
development and has assigned land uses in a manner that will achieve optimum utilisation of
the land and land-based resources.
3.4 EXISTING MAJOR DEVELOPMENT PROGRAMMES/PROJECTS
3.4.1 Shire Valley Transformation Programme
The Shire Valley Transformation Project is currently the major existing development project
in Chikwawa District. The overall objective of the Programme is to increase agricultural
productivity and commercialization for targeted households in the Shire Valley and to
improve the sustainable management and utilization of natural resources. The primary
beneficiaries of the SVTP programme will be smallholder farmers in the districts of
Chikwawa and Nsanje. The programme has four main focus areas namely; irrigation
services, land tenure strengthening, agriculture commercialization and landscape and
environmental conservation.
The smallholder farmers will benefit through access to irrigated agriculture, secure land and
water tenure, farm organization, agriculture (including aquaculture and livestock) production
and marketing support, through improved public and private advisory services, and the access
to financial services and value chain enhancement through support to value-chain enterprises.
It is envisaged that this programme will have a substantial impact on the agriculture sector,
which is the main source of Malawi’s economy as it provides an opportunity to move away
from the uncertainties associated with rain-fed agriculture. Ultimately, the programme will
boost the country’s agricultural production and subsequently achieve food security, increased
income and ensure sustainable socio-economic growth and development.
3.4.2 Shire River Basin Management Project
The main objective of the project is to achieve socially, environmentally and economically
sustainable development in the Shire River Basin.
Chikwawa District stands to benefit considerably from this project whose focus is to
safeguard and enhance the environment and natural resource base in the Shire River Basin.

CHIKWAWA DISTRICT PHYSICAL DEVELOPMENT PLAN
23
This aims at ensuring improved and sustainable livelihoods, food security, water supply and
electrical energy generation; essential elements to support sustainable economic growth and
poverty alleviation efforts.
3.4.3 Existing Urban Structure Plans
Physical Planning Office in the Southern Region prepared urban structure plans to promote
orderly development in the following urban centres: Chikwawa District Headquarters in
1979, Nchalo in 1978, Kapichira in 1996, Ngabu in 1997, and Chapananga in 2009. These
plans are all out of date and in need of urgent review in order to reflect the current status of
the centres.

CHIKWAWA DISTRICT PHYSICAL DEVELOPMENT PLAN
24
4 NATURAL RESOURCES AND ECONOMIC ACTIVITIES
4.1 INTRODUCTION This chapter examines the natural resources and their related economic activities in
Chikwawa District. It establishes the baseline and potential for the development of these
resources with particular reference to agriculture, fisheries, forestry, commerce, industry,
tourism, mining and employment. In order to achieve Sustainable Development Goals
(SDGs) and the Malawi Growth and Development Strategy III (MDGSIII) targets,
environmental protection and management must constitute an integral part of the
development process. This is further highlighted in the Environment Management Act
(EMA) and the National Environmental Policy (NEP).
Average income levels in Chikwawa show that most households face serious inadequacy and
cannot afford sufficient basic needs. According to the fourth Integrated Household Survey,
approximately 72%, 56% and 59.4% of the households face inadequacies in food, housing
and healthcare respectively. This is higher than the national averages which are 63.8%,
55.6% and 54.8% in food housing and healthcare respectively. Only 4.9% households have
an income that allows them to build savings. 31.7% of households rely on borrowing to
support their insufficient income base.
4.2 FAUNA AND FLORA
4.2.1 Forestry
Forest covers about 35% of the district’s land area of which 21,000 Ha and 482 Ha is natural
woodland and communal plantations respectively while 158,700ha is protected area. A
greater proportion of Chikwawa’s natural forests are dominated by Miombo (brachystegia).
These type of trees have low growth rates, are not good enough for timber and mostly being
used by local people for firewood and charcoal. About 93.5% of Malawi’s population use
biomass fuels [firewood and charcoal] for cooking and heating3. The most common use of
forests include household fuel wood, brick burning, curio making, tourist attraction, industrial
fuel wood, and herbs. Land clearing for agriculture, fuelwood and charcoal making also
accelerates deforestation in the district. The demand for forestry products in Blantyre poses a
major challenge to Chikwawa forest reserves.
Of the 489,168.769 Ha of the total district’s land area, 10% is woodland under customary
land tenure. The main natural woodland on the customary land covers about about 21,000 ha
in the district covers Chikwawa/Thyolo escarpment in the eastern part of the district. The
escarpment falls within Traditional Authorities Makhuwira, Maseya, Katunga and Mulilima.
This is a very important natural resource as it forms a watershed for a number of important
rivers that feed into Shire River. The Department of Forestry initiated an Improved Forest
Management for Sustainable Livelihood Programme (IFMSLP) working with communities to
conserve the escarpment.
4.2.2 Production Forests /Tree Plantation
Community plantations are owned and managed by communities themselves. These were
established to enhance afforestation of the degraded part of Chikwawa/Thyolo escarpment for
3 National Statistics Office 1998

CHIKWAWA DISTRICT PHYSICAL DEVELOPMENT PLAN
25
both socio and economic benefit of the surrounding population and reducing siltation of Shire
River.
Figure 11: Community Tree Planting
Source: Chikwawa District Forestry Office, 2017
4.2.3 Forestry Services
There is a high vacancy rate of forestry extension workers in most parts of the district. There
are 19 extension workers against the requirement of 84. This hampers the provision of
extension services in the district. Extension services are provided by the public, private
organizations and non-governmental organizations. Services are mainly in form of technical
advice especially targeting communal groups called Village Natural Resources Management
Committees. There are about 483 Village Natural Resources Management Committees in the
district. The most active communities managing village forests are found in Traditional
Authorities of Chapananga, Ngabu and Makhuwira across the Shire River because of the
technical, financial and material support given to the communities by the Improved Forest
Management for sustainable Livelihood Programme (IFMSLP). This project phased out but
its activities were handed over to ICRAF and World Vision who are currently sustaining the
interventions. Figure 12 is the distribution of Village Forest Areas in Chikwawa according to
Traditional Authority.
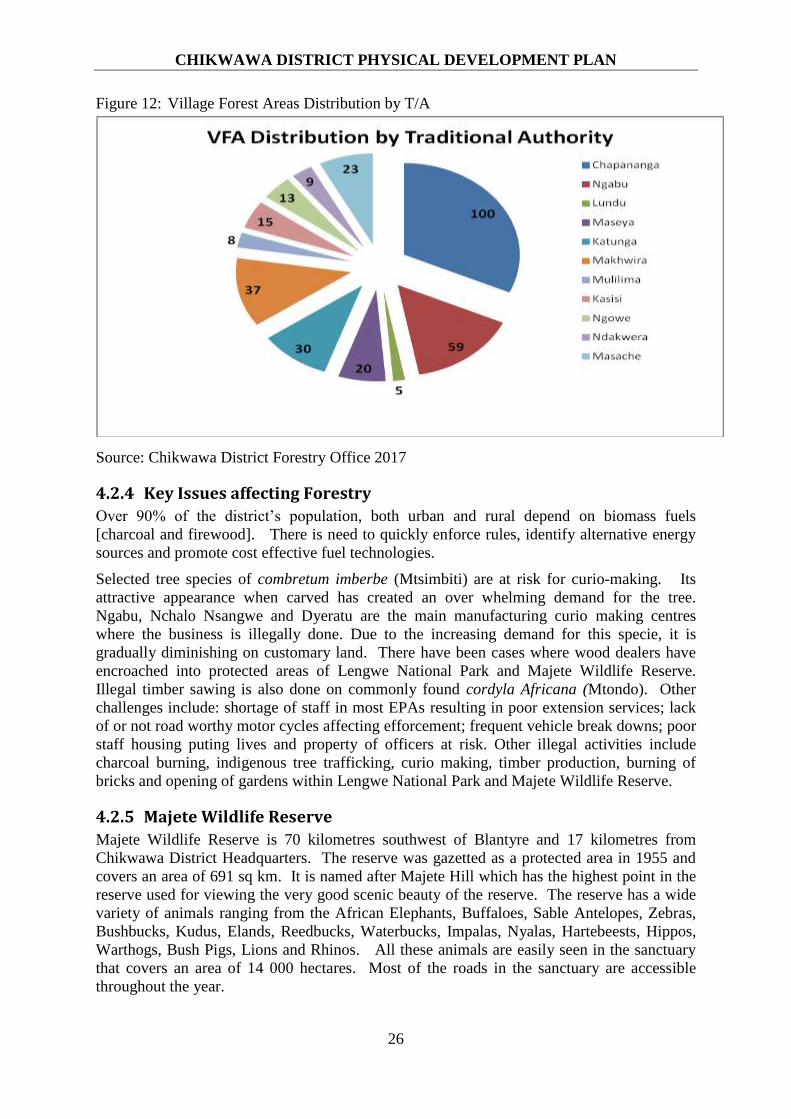
CHIKWAWA DISTRICT PHYSICAL DEVELOPMENT PLAN
26
Figure 12: Village Forest Areas Distribution by T/A
Source: Chikwawa District Forestry Office 2017
4.2.4 Key Issues affecting Forestry
Over 90% of the district’s population, both urban and rural depend on biomass fuels
[charcoal and firewood]. There is need to quickly enforce rules, identify alternative energy
sources and promote cost effective fuel technologies.
Selected tree species of combretum imberbe (Mtsimbiti) are at risk for curio-making. Its
attractive appearance when carved has created an over whelming demand for the tree.
Ngabu, Nchalo Nsangwe and Dyeratu are the main manufacturing curio making centres
where the business is illegally done. Due to the increasing demand for this specie, it is
gradually diminishing on customary land. There have been cases where wood dealers have
encroached into protected areas of Lengwe National Park and Majete Wildlife Reserve.
Illegal timber sawing is also done on commonly found cordyla Africana (Mtondo). Other
challenges include: shortage of staff in most EPAs resulting in poor extension services; lack
of or not road worthy motor cycles affecting efforcement; frequent vehicle break downs; poor
staff housing puting lives and property of officers at risk. Other illegal activities include
charcoal burning, indigenous tree trafficking, curio making, timber production, burning of
bricks and opening of gardens within Lengwe National Park and Majete Wildlife Reserve.
4.2.5 Majete Wildlife Reserve
Majete Wildlife Reserve is 70 kilometres southwest of Blantyre and 17 kilometres from
Chikwawa District Headquarters. The reserve was gazetted as a protected area in 1955 and
covers an area of 691 sq km. It is named after Majete Hill which has the highest point in the
reserve used for viewing the very good scenic beauty of the reserve. The reserve has a wide
variety of animals ranging from the African Elephants, Buffaloes, Sable Antelopes, Zebras,
Bushbucks, Kudus, Elands, Reedbucks, Waterbucks, Impalas, Nyalas, Hartebeests, Hippos,
Warthogs, Bush Pigs, Lions and Rhinos. All these animals are easily seen in the sanctuary
that covers an area of 14 000 hectares. Most of the roads in the sanctuary are accessible
throughout the year.
CHIKWAWA DISTRICT PHYSICAL DEVELOPMENT PLAN
27
Majete also boasts an abundance of bird life with over 300 species including the rock
pranticole that are unique to the area since they breed on the rocks of the Shire River. The
vegetation of Majete ranges from reverine forest to woodlands and thickets and an abundance
of tree species. Some of the most common tree species are the Marula trees and Sterculias.
Hippos are best seen from Mvuu Spot while at Sunset spot there is not only nice sunshine
colours at sunset, but also good and unblocked view of the park.
Majete Wildlife Reserve also offers visitors supporting activities such as bush walks,
elephants tracking where a scout guides and offers security, noiseless game drive and
camouflaged vehicle. Accommodation is also available at Thawale camp which offers top of
the range accommodation in self-contained tents. The tents have a balcony that overlooks a
waterhole that attracts animals during the day and night. The water is floodlit during the
night. Accommodation facilities are also offered in Lengwe and Nyala Parks.
Community Participation is through Majete Wildlife Reserve Association (MWRA); Joint
Liaison Committee (JLC); CBO meetings (98, 1324 people); Zone meetings (12, 352 people);
and Village sensitization meetings. Key challenges include; Human-Wildlife Conflict,
inadequate law enforcement, snaring, poaching, illegal fishing, shortage of personnel,
equipment and poor relationships with communities.
4.2.6 Lengwe National Park
Lengwe National Park receives paying and non-paying visitors. The paying visitors are
categorized into Malawians, resident foreigners and non-residentsNon-paying visitors include
education visitors, Illovo employees, Malawi Government officials, and children.
4.2.6.1 Revenue collection
Revenue is collected in form of personal fees, vehicle fees and guiding fees. The fees are as
follows; 1US$ for Malawians per day, 3US$ per day for resident foreigners, 5US$ per day
for non-residents, 3US$ per day for a vehicle, and 10US$ per day for a tour guide.
The trend in amount of revenue realized from 2014 to 2018 in Lengwe national Park is
similar to that of paying visitors within the period under review. In 2014 the Park realized
the highest amount of revenue of MWK2,362,075. In 2015, the revenue amount dropped by
30% to MWK1,643,970. There was a rise in 2016 and 2017 but later dropped again from
MWK2,110,690 in 2017 to MWK1,187,680 in 2018 representing a 44% decrease.
4.2.7 Nyala National Park
Nyala National Park was established in 1982 by Lonrho, owners of Sugar Corporation of
Malawi (SUCOMA) during a serious drought then. The area was deemed unsuitable for
Agriculture due to high soil salinity. The area is also prone to flooding from the nearby
Mwanza River.
4.2.7.1 Wildlife and Conditions of Entry
Key attractions include Nyala, Giraffe, Zebra, Wildebeast, Waterbuck, Impala, Bushbuck,
Bush pig, Buffalo. Visitors check in at entrance gate, pay entrance fee, and hire a guide or
use a map. The Park opens from 6.00 am to 6.00 pm every day. The park is accessible all
year round but in rainy season some roads become slippery. Such roads are closed with
branches and should be avoided at all costs. The majority of visitors are Illovo staff and their
associates. In a year, the park receives about 1,000 adults in total and about 1,000 school
children from the estate. In a year outside visitors reach a total of about 500.
CHIKWAWA DISTRICT PHYSICAL DEVELOPMENT PLAN
28
4.2.7.2 Management
Animals are managed to maintain maximum sustainable numbers, any excess are either sold
or exchanged with other species. Water is provided through a canal that runs across the park
from west to east. Two dams are provided as drinking points fed from the canal. Feeding
grounds are slashed towards the end of rainy season. In dry months animals are given game
pellets and licks as supplementary food. Some game pellets are for energy while others have
chemicals to prevent external and internal parasites. Efforts to eradicate exotic plants are
underway. On its perimeter the park is fenced to maintain its integrity.
4.2.7.3 Park Facilities and Regulations
Park facilities include one visitors’ picnic site and four exclusively for guests. There is also a
main picnic site for Illovo staff only but on special arrangement can be made available to
guests. Regulations include: do not get out of your car except at the picnic area; do not litter;
do not start any fires; do not feed animals; do not drive off road.
4.2.8 Elephant Marsh
Elephant Marsh is a RAMSAR site which is a globally recognised wetland but is not yet
gazetted. However, management of the site is poor and officers working in collaboration
with the community to ensure effective management. The marsh plays an important role in
maintaining the valley’s hydrological regime through flood control, water storage and supply
of nutrient-rich sediments. Figure 13 is a map showing protected areas in Chikwawa District
which consist of Lengwe National Park, Majete Wildlife Reserve, Nyala National Park,
Thyolomwani Forest Reserves and and Elephant Marsh.

29
Figure 13: Map showing Protected Areas in Chikwawa District
30
4.2.8.1 Fauna and Flora
Overall, the Elephant Marsh supports over 2,000 species of migrating birds, insects, reptiles,
fish and large mammals such as the hippopotamus which is vitally important for keeping the
tributaries open and allowing for the flow of water throughout the marsh. The other fauna
include: 110 water-bird species (among which 26 breed in the area), 65 species of fish, 34
amphibian species, and 58 species of reptiles including the Nile crocodile, which is the
largest reptile in the marsh4. The Elephant Marsh supports over 20,000 water birds and 1%
or more of a delineated population of three water bird species therefore exceeding the
thresholds set by the RAMSAR Convention for a wetland to be considered of ‘international
importance’. In addition to this, the marsh also supports populations of aquatic invertebrates,
including one new sub- species of butterfly. Local populations derive important food and
income from wetland farming, casual labour on wetland farms and the harvesting of wetland
products (including fishing). This forms a significant part of household livelihoods across the
Elephant Marsh.
The two most common marsh species are Phragmites australis and Cyperus papyrus.They are
resilient to clearing and sprout rapidly and more densely in response to being cut. See map
below for the distribution of vegetation types.
4.3 AGRICULTURE
4.3.1 The Role of Agriculture in the District’s Economy
Agriculture is important for food security, source of income and a source of employment for
more than 134,775 families. The district is subdivided into 6 Extension Planning Areas of
Kalambo, Mbewe, Mitole, Livunzu, Mikalango and Dolo. Major food crops for the district
are maize, sorghum, millet, sweet potatoes and rice which is complimented by beef, goat
meat, pork, milk and fish. Cash crops grown include rice, sweet potatoes sugar cane and
cotton. Cotton remains the major cash crop while major livestock classes in the district are
cattle, poultry, pigs, goats, and sheep. Other classes of livestock raised are rabbits, turkeys,
guinea fowls and ducks. In addition, the District has also good environmental conditions for
fishing activities and fish rearing, along the Shire River, Elephant and Ndindi Marshes and in
ponds.
4.3.2 Agricultural Land.
Twenty five percent of the land in Chikwawa is cultivated, while about 53% is the total
arable that can be used for various agricultural activities. The district has a total area of
4,892sq kms. The total land area for agriculture is 489,168.769 hectares of which 20,118
hectares is dry arable land and 29,962 hectares is wet arable land. Estates occupy 19,000
hectares while public land covers 211,788 hectares. Non arable land covers 191,089
hectares.
4.3.3 Large Scale Farming
Large scale farming include: Illovo, KAMA, Phata and Kasinthula cane growers; and Nchalo
Greenbelt Limited focusing on cotton as outlined in Table 4.
4 MRAG, 2016

CHIKWAWA DISTRICT PHYSICAL DEVELOPMENT PLAN
31
Table 4: Major Large Scale Farms
ID # Name Crop Hectarage
1 Illovo Sugarcane 13600
2 Kasinthula Cane Growers Limited Sugarcane 1435
3 Phata Cane Growers Limited Sugarcane 600
4 Nchalo Green Belt Limited Cotton 480
5 KAMA Cane Growers Association Sugarcane 106
4.3.3.1 Cooperatives
The district creates an enabling environment for empowering small and medium enterprises
and co-operatives. Promoting the formation and development of SMES and cooperative
societies enables the capability to aggregate and produce high quality goods and services for
both domestic and export markets.
Table 5: List of Co-operatives in Chikwawa
TA Primary Co-operatives Secondary Cooperatives Value Chain
Makhuwira Zatonse, Chang’anima,
Nkhate, Livunzu, Masenjere
Lower Shire Rice Rice, Legume
Mlilima Dumwalili Legume
Kasisi Njereza, Mtadeya, Mitole Fruits and Cotton
Maseya Phata Sugarcane
Katunga Khama Sugarcane
Lundu Nkombezi Lower Shire Rice Rice
Ngabu Linga, Nyasamba, Makala Cotton and cereals
Ndakwera Mandirade Livestock
Source: District council co-operative data
4.3.4 Smallholder Agriculture
Smallholder agriculture is mainly subsistence farming where the bulk of the produce is
consumed by the farming families while some is sold to meet cash requirements of the
farmers. Smallholder farming is guided by Chikwawa Rural Development Project (RDP)
under Shire Valley Agricultural Development Programme (ADD). The District has a total of
134,775 farm families comprising 78% and 22% male headed and female headed households.
About 39% of the population in the district are farmers with an average land holding size of
cultivated land of less than 0.5 ha per household. About 82% of the households have land-
holding sizes of less than 1 ha and only 18% of the farm families have above 1 ha of
cultivable land.
4.3.4.1 Agricultural Production Indicators
Major crops in Chikwawa District include maize, sorghum, rice, cotton, millet, pigeon peas
and sweet potatoes which are complemented by beans, fruits and vegetables. Minor crops
CHIKWAWA DISTRICT PHYSICAL DEVELOPMENT PLAN
32
are sesame, cow peas, cassava, and ground nuts. Cotton remains the major cash crop in the
district. However, farmers are slowly losing interest in the crop due to poor market
incentives and lack of inputs. Slowly out-grower sugar cane schemes are taking shape in
the district. The existing schemes include Kasinthula and Phata. The sugar cane out-
grower schemes offers a greater economic value to the communities since sugarcane has a
readily available market at Illovo sugar factory hence an upward push in the household per
capita income. Most famers are opting for maize, sorghum and millet production as food
crops and pigeon peas and phaseolus beans as cash crops.
4.3.4.2 Major Challenges affecting Crop Production
The district is mostly affected by drought, pests and diseases, and floods. Pests and diseases
such as fall army worm which attack grass family, Banana bunchy top and Cassava mosaic
highly affect production in the district. The department responsible for irrigation is currently
encouraging irrigated cropping through the use of residual moisture, treadle pumps,
canalisation and watering cans. Farmers are also encouraged to grow early maturing varieties
such as Pilira 1 in sorghum and Kanyani in maize. Farmers are further advised to grow
drought tolerant crops such as orange flesh sweet potatoes and cassava.
4.3.4.3 Agriculture Services
4.3.4.3.1 Agricultural Markets
The District has both council markets, and Agricultural Development and Marketing
Corporation (ADMARC) markets, and some seasonal markets being operated by private
traders and cotton buyers including Export Trading Group (ETG), GLCC, Malawi Cotton,
Afrisian, Mapeto and CGL Companies. Agricultural produce is mostly sold on these local
council periodic (mobile) markets and on the farm gate due to its price competitiveness.
ADMARC is a national body with the following unique functions:
To provide efficient system for supplying agricultural requirements for farmers.
These include: To sell seeds, chemicals and pesticides;
To purchase and process farm produce such as cotton, maize, and sorghum;
To market agricultural produce and promote its consumption;
To establish agro-industry and its associated enterprises in order to exploit fully the
agriculture potential of the country;
To provide adequate stabilization funds for unpredictable trade fluctuations;
To operate factories through its Development and Investment Division in order to
encourage more agricultural production and to provide employment in the district.

33
Table 6: Production, Yield and Area Planted/Major and Minor Crop
CROP 2010/2011 2011/2012 2012/2013 2013/2014
AREA YIELD PRODUCE AREA YIELD PRODUCE AREA YIELD PRODUCE AREA YIELD PRODUCE
Maize 45,437 896 40695 41937 1178 49414 48241 1334 64332 51605 1454 75040
Rice 4917 1872 9204 3563 2407 8577 3686 2322 8560 4278 2656 11362
Sorghum 25772 743 19137 16922 875 14804 24860 962 23918 25842 1174 30046
Millet 11402 737 8397 8689 942 8184 13520 957 12937 13719 1086 14896
Cotton 26973 881 23753 60517 913 55229 39681 957 37961 35617 1124 40042
Beans 4073 791 3221 6857 336 2311 5949 1039 6178 5860 1089 6381
Cow peas 11691 343 4014 10692 400 4273 11928 474 5650 12083 489 5911
Sweet potatoes 5164 13840 71496 5891 15943 93920 6886 16125 111038 7514 16353 122878
Continued
CROP 2014/2015 2015/2016 2016/2017
AREA YIELD PRODUCE AREA YIELD PRODUCE AREA YIELD PRODUCE
Maize 50490 1346 67960 48583 662 32149 57361 761 43668
Rice 4731 2280 10786 3906 1377 5377 4464 2209 9859
Sorghum 25827 753 19452 29723 244 7248 33335 500 16666
Millet 13865 725 10048 16282 118 1921 17584 407 7139
Cotton 33933 801 27190 18740 245 4587 7124 442 7332
Beans 6728 1319 8872 5973 1283 7660 23036 1212 8634
Cow peas 12009 510 6121 11951 246 2943 8515 322 7426
Sweet potatoes 7637 16582 126640 7108 15709 111657 16557 140984
Source: Chikwawa District Agriculture Office 2017.
CHIKWAWA DISTRICT PHYSICAL DEVELOPMENT PLAN
34
ADMARC has 28 market depots in the District. It employs 190 permanent staff members
and 200 casual labourers. ADMARC has partnered with the Green Belt Authority in order to
grow cotton seed which is ginned at Ngabu Ginnery. The cotton seed and lint is then to be
exported. Another initiative is the winter bean growing project where farmers are given
beans on loan to grow prioritising farmers along the Shire River.
Most markets, especially government markets, do not stock the inputs like seeds, chemicals
and fertilizers except during the time of farm input subsidy distribution. Farmers travel long
distances to have access to inputs in hard to reach areas like Changoima in Kalambo, Chavala
in Mitole and Makungu in Livunzu EPAs. Private traders (agro-dealers), in most trading
centres, stock seeds and pesticides but the availability of some items is seasonal.
Most government markets usually do not have the resources to purchase commodities.
Farmers sell their produce either on farm gate basis (right on the farm) or to vendors at very
low prices. In most cases, buyers collude to fraud the farmers.
4.3.4.3.2 Extension Services
Chikwawa District is in the critical shortage of extension workers, with Mikalango being the
largest of all the six EPAs in terms of number of sections. However, the Extension staff
situation in the District continues to be pathetic despite the increase in the demand for
extension services. There are currently 107 qualified extension workers providing services to
the farmers including other stakeholders. In essence, this denotes an awkward overall
Extension worker to farmer ratio of 1:1,259 which is above the national average of 1:700. As
a coping mechanism, the ADD is currently deploying one extension worker to man more than
one section. Figure 14 shows extension planning areas which are administrative units for
extension services in the district.
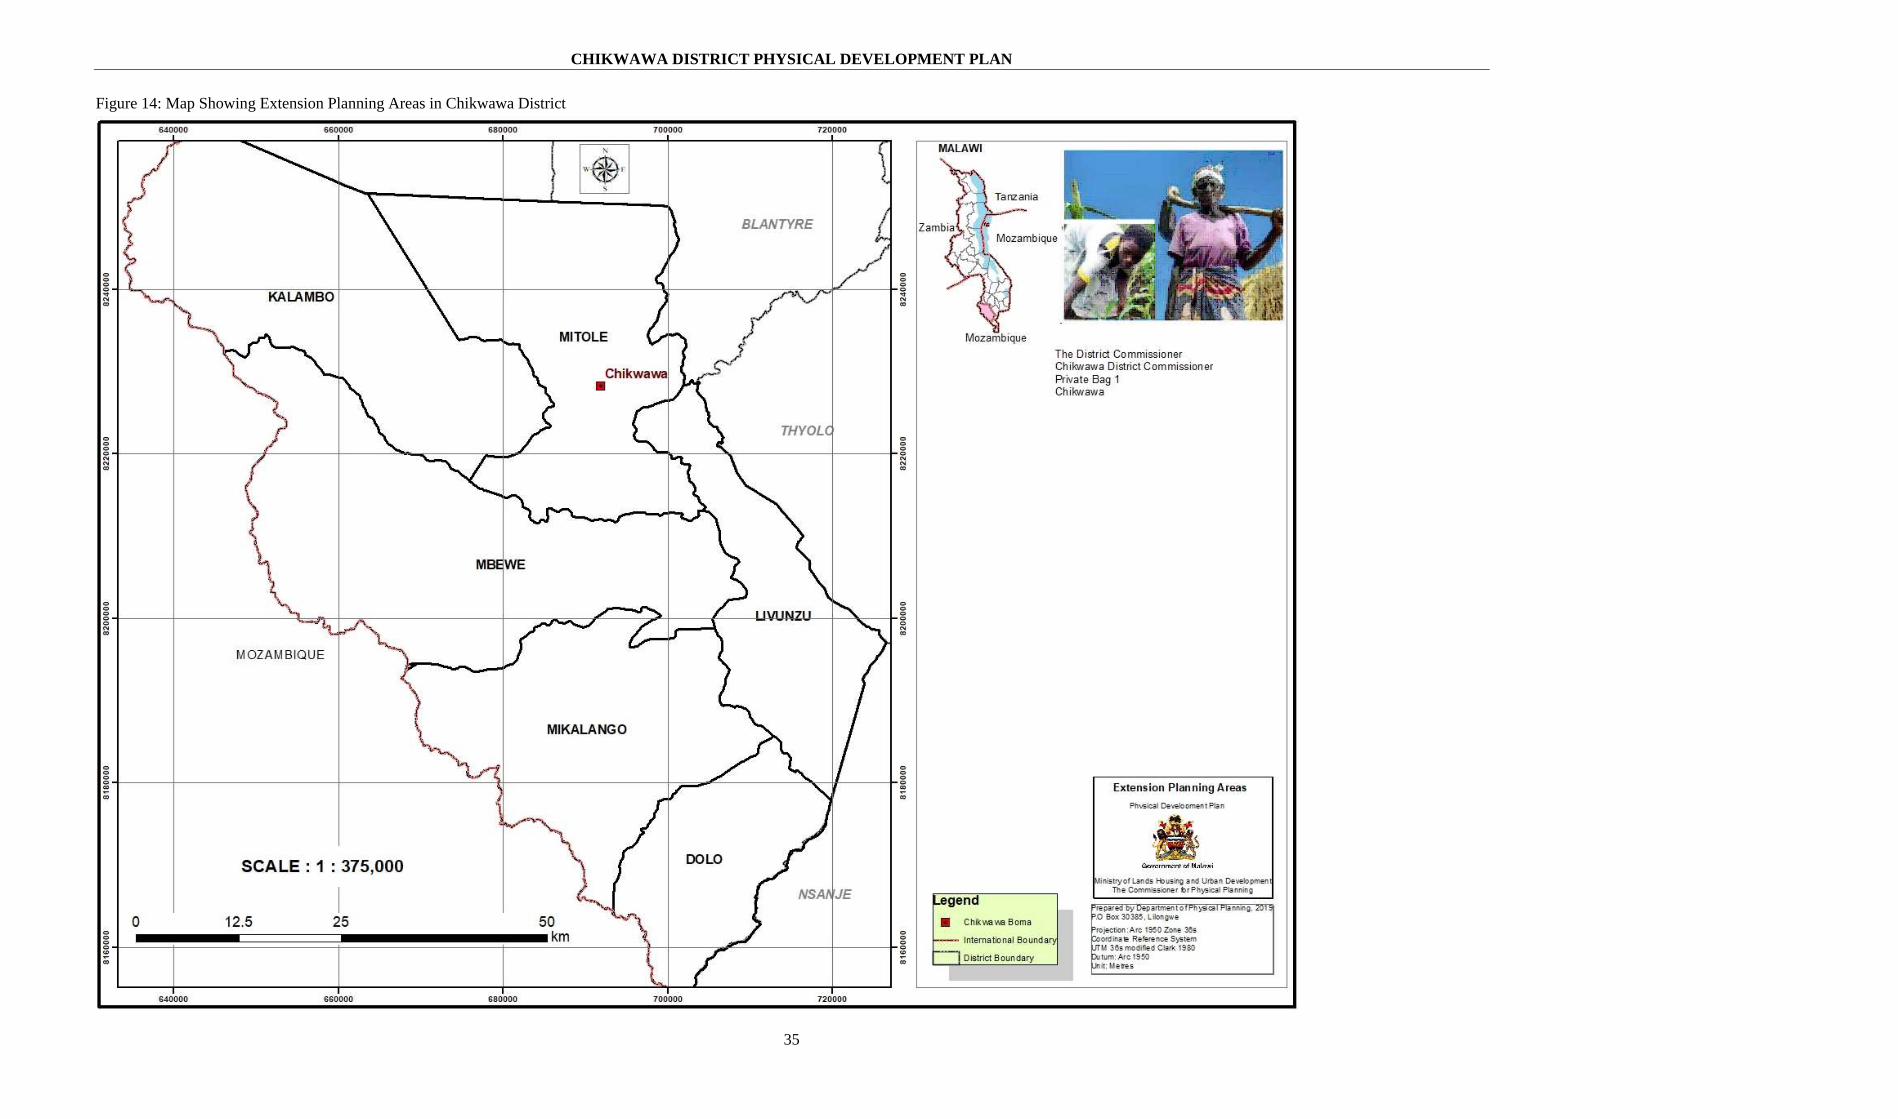
CHIKWAWA DISTRICT PHYSICAL DEVELOPMENT PLAN
35
Figure 14: Map Showing Extension Planning Areas in Chikwawa District
CHIKWAWA DISTRICT PHYSICAL DEVELOPMENT PLAN
36
4.3.4.3.3 Agricultural Credit Services
Access to credit is vital to the social and economic development of the district. Currently
there is no agricultural credit service being rendered in the district. However, some credit
institutions such as Blue Bank, Green wing, FINCA and other local financial institutions
provide credit but not specifically tailor-made to agricultural credit facilities.
4.3.5 Irrigation
The Department of Irrigation in general, aims at developing small-scale irrigation schemes
that are economically viable and sustainable under smallholder situation and circumstance.
Chikwawa has great potential for irrigation development due to the availability of perennial
rivers, such as Shire, Livunzu, Nkhate, Mapelera, Mwamphanzi, Nkudzi, Limphangwi,
Chidzimbi, Mkombezi, Nyakamba and other small rivers and water sources.
4.3.5.1 Irrigation Potential
Chikwawa District is in the Shire Valley Irrigation Services Division. It has 490,000 ha of
landof which 95,000 ha has irrigation potential. It has 6 EPAs and 120 sections. Currently,
18,590.1 ha are irrigated. Between 2014 and 2019, 16 new irrigation schemes were
developed covering 1,023.6 hectares benefiting 5,947 farmers of which 3,662 are men and
2,285 women. During the same period, 218 ha of existing irrigation schemes were
rehabilitated benefiting 1,274 farmers of which 1,072 are men and 752 women. The area
under private sector irrigation is 15,695.0ha. Overall, the total area which was being utilized
for irrigation both under smallholder and estate sub sectors stood at 18,590.1 ha.
4.3.5.2 Irrigation Practices
Most irrigation systems being employed in the district include treadle pumps, motorized
furrow, motorized sprinkler and gravity water diversion and residual moisture. The
importance of perennial rivers cannot be over emphasized as the rains in Chikwawa are
always unreliable. Two extremes of floods and prolonged dry spell characterize the rainfall
pattern in the district. In view of the aforementioned, farmers mostly rely on irrigated
cropping other than rain-fed due to its unpredictability. Furthermore, land holding sizes in
the district remain very small, to be fully maximized through irrigation intensification to
allow multiple cropping per year. This calls for robust and sustainable irrigation initiatives in
order to accelerate the agro-based incomes and ensure food self-sufficiency. Figure 15
contains existing small scale irrigation sites and and proposed irrigation sites in Chikwawa
District.

CHIKWAWA DISTRICT PHYSICAL DEVELOPMENT PLAN
37
Figure 15: Existing and Proposed Irrigation Sites

CHIKWAWA DISTRICT PHYSICAL DEVELOPMENT PLAN
38
4.3.6 Livestock
Livestock plays a very important role in the economy of the district, especially among
smallholder farmers. Livestock uses include food, income, manure and to a limited extent
survival mechanism during draught. While livestock management is mainly traditional, stall-
feeding and breeding programs are being encouraged. The major livestock types are cattle,
goats, poultry, hog/pig, rabbits and sheep. Commercial cattle, goats, pigs and chickens are
extremely important as they provide income and source of nutritional protein to the general
public. The district has the potential to increase household economic base through livestock
production as it has high monetary value. Livestock is also used as a fall back during the lean
months of the year where they are sold usually at a very cheap price for the farmers to buy
food. The movement of price index from one year to another therefore varies according to
the food availability and the ruling market price of main food crops such as maise on the
market.
4.3.6.1 Livestock Use
There is no noticeable dairying in the district mainly because of lack of dairy animals and
market facilities. Dairy production remains a challenge in the district due to harsh and
unfavourable climatic weather conditions for the survival of the dairy breeds. Besides the
volatile nature of weather, poor quality feed, and lack of drugs also contribute to the problem.
In addition, market remains a challenge in the district hence the need for bulking groups for
aggregation and transporting to Blantyre.
About 98% of the cattle herd and poultry are used for meat purposes. Traction is done on a
very small and limited scale. Only about 6,433 cattle have been registered to be used for
traction or about 2.8% of the total cattle herd. About 8% of the population in Chikwawa is
registered in the use of cattle for transport. Hides and skins, manure, and feathers are the
main livestock by-products. Hides and skins are used to manufacture leather products while
feathers are employed in the making of pillows and cushions. Manure is applied into the soil
as fertilizer to improve fertility
4.3.6.2 Livestock Diseases
Ticks, viruses, bacteria, and worms are the main causes of livestock diseases. While these
may lead to low production and reduction in animal population, appropriate measures were
instituted to remedy the situation and ensure proper quality of livestock and by-products from
the district. Major diseases and parasites include Foot and Mouth in cattle, New Castle
Disease in poultry, African Swine Fever in Pigs, Anaplasmosis normally transmitted by ticks,
Lumpy Skin Disease, Rabies in dogs, Biting flies, ticks, Internal worms and Foot Rot.
Table 7: Proportion of Livestock affected disease/parasite
Disease % attack
2011/12
% attack
2012/13
% attack
2013/14
% attack
2014/15
% attack
2015/16
% attack
2016/17
% attack
2017/18
New castle 31 24 21 32 27 31 29
African swine fever 12 7 11 8 14 11 10
Anaplasmolysis 16 11 9 18 14 12 15
Lumpy skin disease 6 8 12 9 12 14 10
Rabies 4 7 6 4 5 4 5
Biting flies 23 27 22 34 28 28 25
Ticks 32 42 44 31 36 47 45

CHIKWAWA DISTRICT PHYSICAL DEVELOPMENT PLAN
39
Disease % attack
2011/12
% attack
2012/13
% attack
2013/14
% attack
2014/15
% attack
2015/16
% attack
2016/17
% attack
2017/18
Internal worms 58 62 69 57 49 53 60
Foot and mouth
disease
22 16 18 26 15 18 20
4.3.6.3 Livestock Services and Facilities
The major livestock services that are being offered to farmers include cattle dipping, meat
inspection, livestock treatment, vaccinations and production estimates (in form of Census).
Normally these services are offered by the Shire Valley Agricultural Development Division
during particular periods of the year
After market liberalization, Government however stopped operating the markets and private
traders were allowed to operate. Only 5 markets are now operational and majority of dip
tanks are not functioning.
4.3.6.4 Prevention and Management of Pests and Diseases.
Livestock treatment is usually done by farmers themselves with technical assistance from
veterinary officers, animal health surveillance assistants and the agriculture extension
development officers. In case of pests and disease attack of national importance, such as
Foot and Mouth disease or Rabies, government provides the vaccine for free to the farmers.
Government through the office of the District Agricultural Development Officer (DADO)
rely on the assistance that it gets from the stakeholders in the purchase of drugs such as
rabsin. The vaccination campaigns are intended to be conducted throughout the district but
due to the exorbitant drug prices, only few drugs are procured and therefore few animals are
treated leaving out a significant number of animals untreated thereby creating a huge risk to
the animals and the people in the district.
4.3.6.5 Dip Tanks and Cattle Markets
The District has 11 Dip tanks and 6 cattle markets. Eight dip tanks were rehabilitated in
2017/ 2018 season. Over the recent past years, dip tanks have never been functional owing to
the fact that the infrastructure in almost all the dip tanks was in a dilapidated state. Recently,
UBALE project came to the rescue of the famers by rehabilitating 8 dip tanks and 5 cattle
markets.
4.3.7 Major Issues affecting Livestock Production
Key challenges facing agricultural production in the district include:
i. Prolonged dry spells and floods which affect both livestock and crops which
negatively affect households, the district and the national economy at large;
ii. Heavy attacks by pests and diseases such as fall army worm which attack the grass
family of crops, Banana bunchy top which attack bananas and Cassava mosaic
which affects cassava;
iii. Under-exploitation of the potential irrigable areas due to both inadequate financial
and human resources since irrigation development requires huge initial
investments;
iv. Poor water resource management by farmers;
v. Inadequate availability of and accessibility to inputs such as fertilizer, high quality
seeds and pesticides which compromise the quality and quantity of production;

CHIKWAWA DISTRICT PHYSICAL DEVELOPMENT PLAN
40
vi. Inadequate funds for maintenance/rehabilitation of existing Government
agricultural schemes;
vii. Low producer prices which result in low returns to investment;
viii. Climate change;
ix. Critical shortage of extension workers;
x. Poor access to markets;
xi. Farmers travel long distances to have access to inputs;
xii. Vandalism of pipes and gates in irrigation schemes;
xiii. Small holding sizes; and poor agronomic practices.
4.3.8 Fisheries Resources
Fish is the most common and cheapest source of animal protein. It contributes to over 60%
of dietary animal protein consumption in the district. Fish industry also plays a significant
economic role by providing employment opportunities and source of livelihood to
communities and traders in the district. The per-capita consumption of fish in the district as
of 2017 was estimated at 10kg/person/year which still lag behind the FAO recommendation
of 15kg/person/year. Shire River and its tributaries of Lisuli and Gumbwi have a variety of
fish ranging from the delicious Chambo species, Tiger fish and Cat Fish. Construction of a
canal should therefore be accompanied with precautionary measures such as construction of
4m high barrier and use of wire mesh at the mouth of the canal. These will help to control
spreading of the Tiger fish to upper Shire and Lake Malawi.
About 344 fishermen employed in fishing industry often use passive fish traps. There is
increasing fishing pressure on the fish stocks in the Shire waters as a result of
overfishing. This can be attributed to a number of factors; such as increasing human
population, and limited alternative income generating activities. Habitat degradation
within the aquatic environment and catchment areas and climate change also affect
fish productivity.
4.3.8.1 Fishing Grounds
Chikwawa District is blessed with the Shire River which meanders through the district
creating a large wetland known as the Elephant Marsh. The river is associated with many
perennial tributaries of which two significant ones are Lisuli and Gumbwa. The Shire River
and its associated water bodies support an important fishing industry in Chikwawa. The
wetland and its peripheral areas have a potential in pond based aquaculture production.
Currently, the area, being a wetland of international significance was declared a Ramsa site.
Fish farming is done in all but Dolo EPA. Dolo EPA needs an assessment of potential areas
for aquaculture because the EPA is generally too dry to support fish production. Table below
summarizes the number of fishponds and area per EPA.
Table 8: Number of Members, Fish ponds per EPA and Pond Area
EPA NUMBER OF MEMBERS
NO. OF PONDS POND AREA (m2) MALES FEMALES
MITOLE 57 72 40 19620
KALAMBO 20 47 9 5000

CHIKWAWA DISTRICT PHYSICAL DEVELOPMENT PLAN
41
The main fish species found and caught are mostly cichlids, cyprinids and clarids. The
commonly caught cichlids include; Oreochromis mossambicus locally known as Makakana,
Tilapia rendalli locally known as Nyungwe or Nyumgwitsale and Tiger fish locally known as
Ntchila. The clarids comprise; Clarias gariepinus (African sharp tooth catfish) locally
known as Mlamba, Clarias ngamensis locally known as Chikanu and Protopterus annectus
(African lung fish) locally known as Dowe and small quantities of other species such as
Syanodontis Njasae locally known as Nkholokolo.
A wide range of fishing gears is used to catch fish in Chikwawa. These gears include passive
fish traps locally known as mono, gill nets, hooks, and cast nets. As of 2016, the district
registered a total of 344 fishermen of which 23 were females and 285 were males. Table
below summarizes the prevalent crafts and fishing gears as of 2016.
Table 9: Fishing Gear and Craft Statistics
Crafts Gillnets Hook and Line Fish
Trap Other Gears
Planked
Canoe
Dugout
Canoe
Gillnet Ngon
gongo
Usipa
Seine
Longline Handl
ine
Chom
anga
Mono Scoop
Net
Cast
Net
1 97 11 403 5 30 104 8 2,488 48 87
There are 8 Beach Village Committees in the District as of 2019. In the West Bank there are
Mchere and Alumenda while in the East bank they include; Lisuli, Yolodani, Gumbwa,
Mitawi, Thedzi and Chijere committees.
Demand for fish is increasing in the district following increased population growth. The
recovery in capture is still not enough to meet the per capita requirement of the fish for the
growing population.
4.3.8.2 Fisheries Services
Fish farmers and fishing communities are supported through pluralistic extension services
and which are offered and supported by a number of players including government agencies
and non-state actors. The extension services are controlled and coordinated by the District
Council through its fisheries sector headed by the District Fisheries Officer (DFO). Under
the DFO, there are Fisheries assistants who man the Extension Planning Areas and the two
fishing minor stratum of 11.2 in the East bank and 11.1 in the West bank where the 6 BVCs
are located. The vacancy rate for extension services is at 50 percent.
4.3.9 Major Issues affecting Fish Production
Fish resources face challenges that threaten their sustainability.
i. High population increase and demand for fish resources has exerted pressure leading
to failure to comply with fish management regulations including use of illegal nets
and under meshed nets.
LIVUNZU 60 76 16 5006
MBEWE 9 16 6 2535
MIKALANGO 7 3 4 2400
DOLO 0 0 0 0
TOTALS 153 214 75 34561
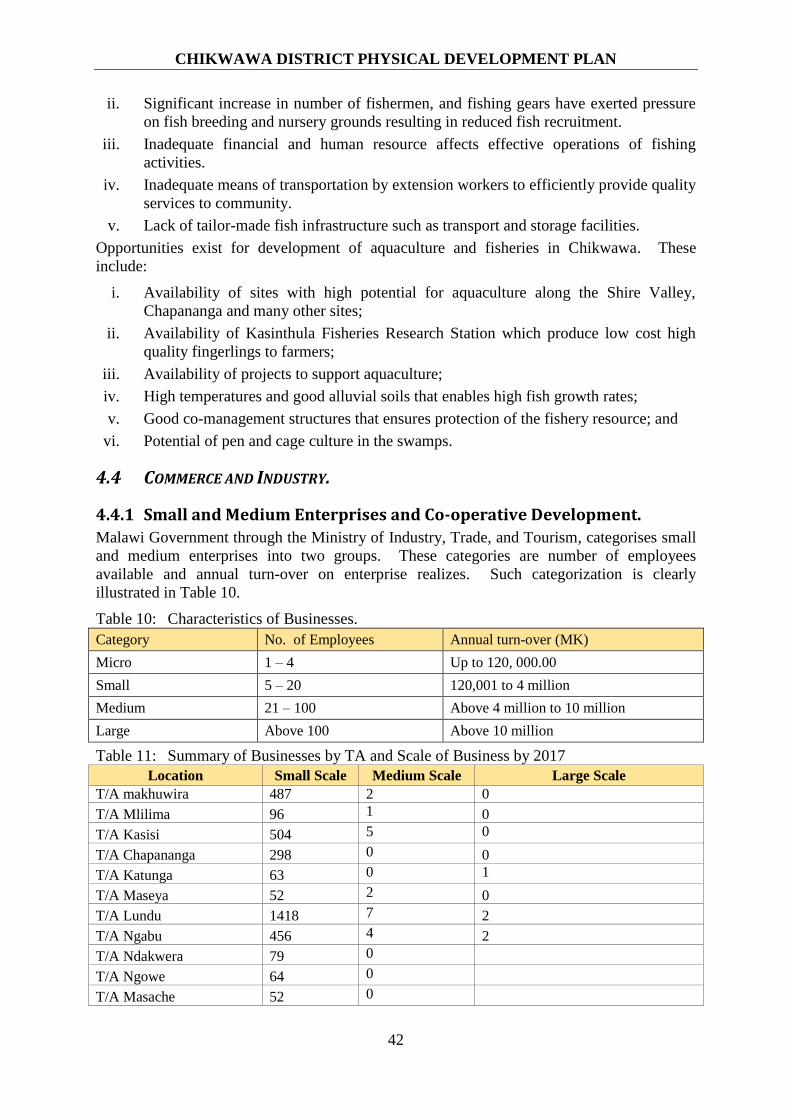
CHIKWAWA DISTRICT PHYSICAL DEVELOPMENT PLAN
42
ii. Significant increase in number of fishermen, and fishing gears have exerted pressure
on fish breeding and nursery grounds resulting in reduced fish recruitment.
iii. Inadequate financial and human resource affects effective operations of fishing
activities.
iv. Inadequate means of transportation by extension workers to efficiently provide quality
services to community.
v. Lack of tailor-made fish infrastructure such as transport and storage facilities.
Opportunities exist for development of aquaculture and fisheries in Chikwawa. These
include:
i. Availability of sites with high potential for aquaculture along the Shire Valley,
Chapananga and many other sites;
ii. Availability of Kasinthula Fisheries Research Station which produce low cost high
quality fingerlings to farmers;
iii. Availability of projects to support aquaculture;
iv. High temperatures and good alluvial soils that enables high fish growth rates;
v. Good co-management structures that ensures protection of the fishery resource; and
vi. Potential of pen and cage culture in the swamps.
4.4 COMMERCE AND INDUSTRY.
4.4.1 Small and Medium Enterprises and Co-operative Development.
Malawi Government through the Ministry of Industry, Trade, and Tourism, categorises small
and medium enterprises into two groups. These categories are number of employees
available and annual turn-over on enterprise realizes. Such categorization is clearly
illustrated in Table 10.
Table 10: Characteristics of Businesses.
Category No. of Employees Annual turn-over (MK)
Micro 1 – 4 Up to 120, 000.00
Small 5 – 20 120,001 to 4 million
Medium 21 – 100 Above 4 million to 10 million
Large Above 100 Above 10 million
Table 11: Summary of Businesses by TA and Scale of Business by 2017
Location Small Scale Medium Scale Large Scale
T/A makhuwira 487 2 0
T/A Mlilima 96 1 0
T/A Kasisi 504 5 0
T/A Chapananga 298 0 0
T/A Katunga 63 0 1
T/A Maseya 52 2 0
T/A Lundu 1418 7 2
T/A Ngabu 456 4 2
T/A Ndakwera 79 0
T/A Ngowe 64 0
T/A Masache 52 0
CHIKWAWA DISTRICT PHYSICAL DEVELOPMENT PLAN
43
Source: Chikwawa District Council, Business Register, 2017
The 2014 District Council’s business register provides information on all registered
businesses. The large scale businesses comprise Illovo, Kasinthula and Kapichira Hydro
Power Station, PressCane, cotton ginning and cattle ranches while medium scale businesses
consisted of wholesale stores, filling stations and banks. Illovo Sugar Company employs a
lot of people from Chikwawa and other neighboring districts like Nsanje, Thylo, Mulanje as
well as Blantyre. Similarly, PressCane and Kapichira employ both skilled and non-skilled
personnel thus assisting the district in reducing unemployment rate. Despite the contribution
made by Illovo on increasing employment rate, improving the household income and social
corporate responsibility, the sugarcane plantation covers a large area of land which negatively
affects land access to local communities in TA Lundu and Ngabu. Some notable affected
areas are Bereu, Ndirande, Maseya, Tomali, Jombo, Nchalo, Ngabu, among others.
The district registered 6,486 small scale businesses where 1,753 were small shops, 1,430
cycle taxis, 655 groceries and 332 maize mills. Most of the bicycle taxi operators operate
their business in TA Kasisi, Makhuwira, Lundu and Ngabu. The majority of maize millers
operate their businesses in TA Makhuwira and chapananga where 27 and 24 were registered
respectively.
4.4.2 Large Scale Businesses
4.4.2.1 PressCane Limited
PressCane Limited is Malawi’s leading ethanol fuel producing company using molasses
supplied by Illovo. The Company is located at Dyeratu on the western shore of the Shire
River which supplies water for the distillery’s operations. The Company currently
manufactures two grades of ethanol; Anhydrous Alcohol (AA) with 99.5% v/v alcohol
content for blending with petrol, and Rectified Spirit (RS) at 96 % alcohol content for
industrial uses. The Company also produces rectified spirit ethanol that is used as a solvent
in the printing and pharmaceutical industries. PressCane Limited’s distillery is capable of
producing 18 million litres of ethanol annually. Its highest plant capacity utilization of 89%
was achieved in 2015 due to molasses sourced from Companhia de Sena in Mozambique.
4.4.3 Banks and Financial Lending Institutions in Chikwawa
There are 6 banks operating at Nchalo Trading Centre in T/A Lundu and these include FDH,
NBS, NBM, Standard Bank as well as FINCA. There is also one FDH Bank and financial
lending institutions like MARDEF and FINCA at District Headquarters in T/A Kasisi and
one lending financial institution at T/A Katunga. Most of these banks are operating at
medium scale and they employ staff of less than one hundred.
4.4.3.1 Major Roles Played by Banks.
Banks play a big role in the economic growth of the district. They collect the savings of the
individuals and lend them out to business people and manufacturers for purchasing raw
materials and for working capital. The banking system facilitates local and international
trade where a large part of it is done on credit. The bank interest rates that most of the
financial institutions levy on loans are the same as the ones that prevail at the national
financial market.
Table 12: Average bank interest rates in Malawi
Indicator 2014 2015 2016 2017 2018
Bank Interest rates 46.01 44.29 32.33 24.63 23.75
CHIKWAWA DISTRICT PHYSICAL DEVELOPMENT PLAN
44
Source: www.TheGlobalEconomy.com
Due to high interest rates and collateral requirements on loans by the banks, individuals have
resorted to forming informal community banking groups/cooperatives populary known as
village banks or Banki Mkhonde within their localities. The interest rates on the loans
obtained by the members range from 15% to 25%, and are far much lower than those in the
formal banks. Some notable cooperatives are COMSIP Co-operatives like Mandirade,
Zimveke, Livunzu, Chang’anima, Nkhate, among others.
4.4.4 Business Promotion Services
Business advisory services in the district are provided by government institutions and some
NGOs. The main institutions providing such services are the Ministry of Industry, Trade and
Tourism and through OVOP program, office of the DADO, the District Forestry Office, the
Community Development and MACOHA.
4.4.5 Contribution of Small and Medium Enterprise to the Local Economy
The SMEs have contributed in the following areas:
i. Employment. eg bicycle taxis, maize mills, retail shops, bottle stores, restaurants,
lodges and manufacturing;
ii. Source of revenue for the District Council. Eg market fees and business licenses;
iii. Market for farmers and other SMEs; and
iv. Provision of basic goods and services. Eg fuel, stationery, basic household needs.
4.4.6 Key Issues and opportunities Affecting Business Sector Growth
These include:
i. Small scale businesses, 463 in total, dominates the business sector with only 21
medium scale businesses and 5 large scale businesses;
ii. TA Masache trails behind the rest of the TAs in terms of business development while
TA Lundu dominates followed by TA Kasisi within which the district headquarters is
located;
iii. Min shops and Bicycle taxis dominate the business sector while hardware shops are
very few;
iv. Inadequate access to banking services;
v. The sugarcane plantation covers a large area which restricts access to land by local
people in T/A Lundu and T/A Ngabu. Lack of adequate trade officers in the
Department of Trade to supervise, monitor, inspect and advise people. The
Directorate of Commerce and Industry has also remained vacant at Chikwawa District
Council thereby having no one to properly coordinate trade matters. Filling the
crucial vacancies will go a long way in assisting the district to fulfil its trade potential
and contribute positively to the economic development of the district and country; and
vi. High interest rates on bank loans making it difficult to access capital.
The possible factors contributing to the status quo in the business sector in the district
includes:
i. Unpredictable macroeconomic environment, high inflation rates, unstable exchange
rate and high interest rates

CHIKWAWA DISTRICT PHYSICAL DEVELOPMENT PLAN
45
ii. Natural disasters such as floods, wind storms and droughts have derailed economic
activities in the district
The business sector has a number of opportunities for growth and these include:
i. Availability of expertise on informal banking initiatives such VSL which is provided
for free by NGOs and Government departments; and
ii. Tarmac road between Blantyre and Nsanje District headquarters provides easy access
to better and competitive markets.
4.5 MINING AND MINERAL DEPOSITS Mining is almost non-existent in the district with some small scale mineral deposits, such as
gemstone and blue agate in TA Ngabu. There are also some coal deposits at Lengwe
National Park. Andrew and Bailey, during their 1906 – 1909 survey, collected eight samples
of coal shale and concluded that the material would be of little value as fuel. The district
should therefore further explore whether it would be of economic value to mine the available
coal.
4.6 TOURISM
4.6.1 Tourism Potential
Chikwawa has many potential sites for tourism development. These include Kapichira falls,
Madziotentha spring, Diwa spring, Kapichira Hydro Electric Power Station, Majete Wildlife
Reserve, Lengwe National Park and meandering Shire River view from Thyolo – Chikwawa
escarpments on the way to Chikwawa District Headquarters. There are also some historical
sites and traditional dances.
4.6.2 Tourism Facilities
4.6.2.1 Parks and Wild Life
Established to conserve wildlife, Lengwe National Park was established in 1975 and covers
887 sq kilometres. Common wildlife in the Park include; Antelopes, Nyala, Buffaloes, Kudu,
Livingstone Suni, Impala, Warthogs, Bush bucks, Bush Pigs, Grysbok, Common Duikers,
Leopards, Hyenas, Civets, monkeys and birds. The Illovo Sugar Company also established
Nyala Park for Tourism. Animals in this facility include; Nyalas, Zebras, giraffes and
Camels.
Majete which was created in 1955, is run by African Parks through a 25 year concession
which started in 2003. It sits on a 700 km2 piece of land. Although the reserve has some land
falling in Blantyre, Mwanza and Neno Districts, a large chunk is in Chikwawa District. Part
of the reserve, also known as Mkulumadzi, is managed by Robin Pop Safari under a separate
concession, with African Parks as the concessionaire.
The Wildlife Reserve has all the big five game and others including Lion, Elephant, Zebra,
Leopard, hippos, Warthog, Black rhino, Eland, Impala, Buffalo, Sable antelope and
Hartebeest. There are facilities like Sunbird Thawale Lodge, Mkulumadzi 5-star Lodge,
community camp site, rest shelter, picnic shelter, swimming pool, restaurant, tourism office,
conference room, road network for tourism and an airstrip. Tourism sites and major activities
are depicted on a map in Figure 16.
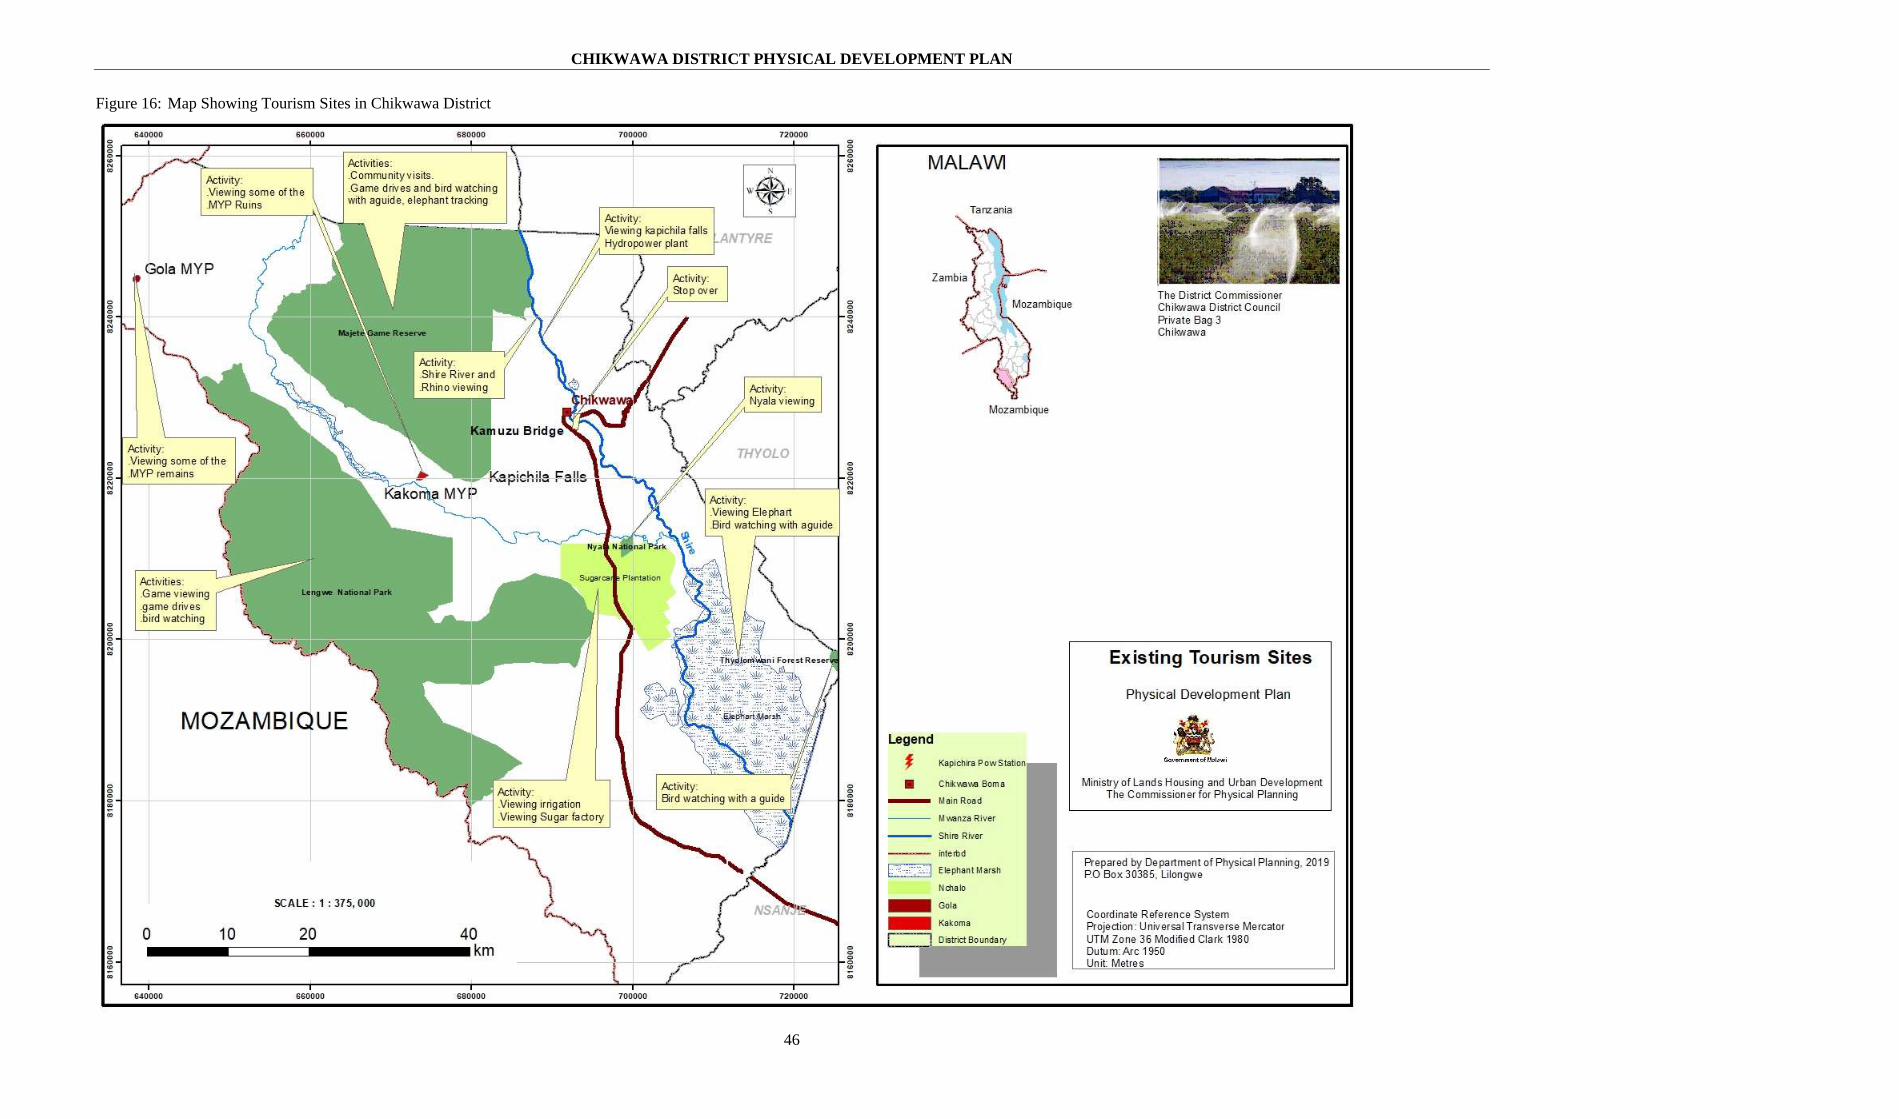
CHIKWAWA DISTRICT PHYSICAL DEVELOPMENT PLAN
46
Figure 16: Map Showing Tourism Sites in Chikwawa District

CHIKWAWA DISTRICT PHYSICAL DEVELOPMENT PLAN
47
4.6.2.2 Paying visitors in Lengwe National Park from 2014 to 2018
Statistics show that the park receives more visitors between May and December (see Table 14
for details). During the rainy season, the number decreases because the roads become muddy
and impassable and also the increase in vegetation cover decreases animal visibility. These
conditions improve between April and May when visitation increases. The possible reasons
for the sharp decrease in paying visitors in 2018 include that Nyala Lodge which provides
food and accommodation services to visitors has not been attractive as it used to be. At one
time in 2018, the Malawi Bureau of Standards had to close the lodge due to substandard
services and it is thought that visitors became discouraged. Secondly, construction works of
the Conference Hall in the park caused a lot of disturbances to the visitors. To some extent, it
is thought that the high animal species diversity in Majete Wildlife Reserve attract visitors
who used to visit Lengwe National park before.
Table 13: Paying Visitors Received in Lengwe National Park from 2014 to 2018
YR JAN FEB MAR APR MAY JUN JUL AUG SEP OCT NOV DEC GRAND
TOTAL
2014 41 12 38 103 40 47 57 94 63 72 66 58 691
2015 4 6 3 20 43 57 68 53 50 51 55 45 455
2016 50 24 25 43 68 72 86 132 65 64 28 103 760
2017 38 46 59 49 93 69 101 54 73 70 56 67 775
2018 37 25 47 38 54 46 14 15 15 51 40 42 424
Figure 17: Total Visitors per Year
4.6.3 Key Issues from Tourism Sector
Majete Wildlife Reserve is a success story as it has booming wildlife and its tourism facilities
due to the public-private partnership. The Lengwe National Park is inaccessible during the
wet season and has inadequate facilities. Stray lions sometimes cross the international
boundary from Mozambique into Lengwe.
Key challenges include vandalism in tourist attraction areas, poaching, poor road conditions,
lack of electric power network, floods and inadequate human and financial resources to
support sustainable development and maintenance of key tourist sites.
CHIKWAWA DISTRICT PHYSICAL DEVELOPMENT PLAN
48
4.7 LABOUR AND EMPLOYMENT
4.7.1 Labour Force
There are two main groups labour and these are formal and informal. Formal labour refers to
the type of employment where one works in an organisation where he/she receives salary per
fortnight or month end. Informal labour refers to self-employment where one works in
his/her own entity such as small holder farmer, bicycle taxi or on casual, short tem or tempora
temporary employment. This is the group where highest percentage of employment is
registered.
The Government and the private sector that offer formal employment in the district.
Government agencies employ about 3,171 people of which 2,480 are male while 1,031 are
female. The private sector and NGOs employ about 5,809 people of whom 5,508 are male
while 301 are female.
Table 15 shows work force distribution in Government Agencies and the Private Sector
Including Civil Society Organisations.
Table 14: Work Force Distribution in Public and Private Sector/ CSOs
The distribution of work force in formal sector indicates the private sector has the bigger
work force than the public agencies in the district.
The district experiences issues of child labour. Virtually, there is no child labour at present in
the formal sector. This is due to intensified labour inspection in these work places by the
council and increased dissemination of information on effects of child labour.
Much of child labour is practised in the informal sector including in residences, SMEs where
children are sent to sell goods of low order value such as doughnuts. In fact, the Council has
always had challenges to mitigate child labour in private homes as labour inspection services
are restricted in these workplaces.
There is need for information dissemination across the sectors on issues surrounding child
labour. These children may be enrolled in schools or provide them with vocational skills so
that they would be reliable citizens in the future but this is not possible because there is only
Mphungu skills centre which is operational.
The Council has established that most employers especially those in the Small and Medium
Enterprises, pay below the minimum wage. Due to the challenge of lack of adequate
resources, few workplaces are visited by a labour inspector which results into employers
taking advantage of this as no one is there to enforce the statutory minimum wage
Employees in Chikwawa District work for 72 hours per week on average. It is unfortunate
that most employers in the district do not compensate their workforce for working an extra
mile beyond the normal 48 working hours as provided in the Employment Act 2000.
4.7.2 Key Issues from the Labour Sector
The key issues of labour in the district are Non-compliance to minimum wage by employers.
This can mainly be attributed to low income levels of the employers in informal sectors.
Non-compliance by employers to general labour laws including the Employment Act, Labour
Employer Male Employees Female Employees Total No. of Employees
Government Agencies 2480 1031 3171
Private Sector/CSOs 5508 301 5809

CHIKWAWA DISTRICT PHYSICAL DEVELOPMENT PLAN
49
Relations Act, Pension Act, Occupation Safety Health and Welfare Act, Workers
Compensation Act, is due to an array of factors. Some organizations do not have Human
Resource personnel who can interpret and apply the laws. The other reason is that there is
lack of strong punitive measures against those who do not comply with these laws.
CHIKWAWA DISTRICT PHYSICAL DEVELOPMENT PLAN
50
5 POPULATION AND DEMOGRAPHIC CHARACTERISTICS
5.1.1 Introduction
Population is the number of people living within a political or geographical boundary.
Population is very crucial in the development of an area. Therefore it needs to be accorded
special attention when preparing any social, economic, environmental or physical
development plan of an area.
Understanding population and demographic characteristics and dynamics is a prerequisite in
plan making process because it aids in making estimates for land requirements, social service
needs, and infrastructural development. It also guides in the formulation of land use plans, as
well as development strategies, policies and programs.
This chapter assesses the population and demographic characteristics of the district such as
existing and projected populations, population growths and growth rates, population
densities, population distributions, age-sex structures, migration as well as urban and rural
population sizes.
5.1.2 Population Size and Growth Trends -1977 – 2018
The 1977 and 1987 population census results, show that the population of Chikwawa was
194,425 and 316,733 people respectively. Between this intercensal period, the population
grew by 122, 308 people representing an intercensal growth rate of 4.9 %. From 1987 to
1998 intercensal period, the number of people grew by 39, 949 people from 316, 733 people
in 1987 to 356, 682 people in 1998. This represents an intercensal growth rate of 1.1%.
The 2008 Population and Housing Census pegged the total population of Chikwawa District
at 434, 684 people. This means population grew by 77, 966 people from 356,682 people in
1998, representing an intercensal growth rate of 2.1%. In 2018 it was pegged at 564, 684
persons, growing by 130,036 people from about 434, 684 people in 2008. This represents an
intercensal growth rate of 2.5%. Much as the growth rate has been oscillating all along, it has
been on the increase since 2008. This increase is a bit worrisome considering the prevailing
economic and environmental conditions of the district. The graph below illustrates this.
Table 15: Historical trends in Population and Inter-censual Annual Growth Rates
Area
Population ('000s) Inter-censual Growth Rates
1987 1998 2008 2018 1987/98 1998/2008 2008/2018
Malawi 7,988.5 9,933.9 13,077.2 17,563.7 2.0 2.8 2.9
South 3,965.7 4,634.0 5,858.0 7,750.6 1.4 2.4 2.7
Chikwawa 316.7 356.7 434.7 564.7 1.1 2.1 2.5
The table and graph above show that the inter-censual growth of Chikwawa is in tandem with
that of the Southern region as well as the country. They all took a deep in the 1987/98 inter-
censual period and started increasing thereafter. The reasons for the decrease are
multifaceted some of which being: mass repatriation of refugees to Mozambique (NSO,
2018:10), and high mortality rates due to the upsurge of malaria and AIDS epidemic
(Zimalirana, 1992: 46-47).

CHIKWAWA DISTRICT PHYSICAL DEVELOPMENT PLAN
51
Figure 18: Population Size and Growth Rate
Graph above shows inter-censual growth rates for Chikwawa from 1977 – 2018
As observed in the graph in Figure 18 and Table 16, population of Chikwawa is increasing
substantially. This increase in population puts pressure on available resources.
Consequently, there is need for sustainable use of land-based resources. In addition,
economic diversification is a crucial aspect in order to avoid overdependence on dwindling
agricultural products. There is need to add social services and expand the available ones to
meet the needs of the growing population.
5.1.3 Population Density
Population density is the average number of persons per square kilometre. The population
density of Chikwawa District has been on a steady increase since 1987. In 2018 population
density was at 116 people per square kilometre, which has increased from 91people per
square kilometre in 2008. Similarly in 1998, population density was 75 people per square
kilometre which was higher than that of 1987 which was estimated at 67 people per square
kilometre and the 1977 density of 41 people per square kilometre. Table 17 shows Land
Area, Population Size and Population Density
Table 16: Land Area, Population Size and Population Density
Regions and
Districts
Land Area
(sq. km)
Population (thousands) Population Density (per sq km)
1977 1987 1998 2008 2018 1977 1987 1998 2008 2018
Malawi 94,552 5,547.5 7,988.5 9,934 13,077 17,564 59 85.0 105 138 186
South 31,780 2,754.9 3,965.7 4,634 5,858 7,751 87 125.0 146 184 244
Chikwawa 4,892 194.4 316.7 356.7 434.6 564.7 41 75.0 73 90 113.34
Ngabu 873 n/a 103.9 121.3 149.5 164.7 n/a 97.3 113.69 140.1 188.72
Lundu 200 n/a 33.4 42.5 46.4 62.2 n/a 184.5 234.9 256.2 310.88
Chapananga 770 n/a 91.3 65 86.5 88.6 n/a 81.7 74.4 99.1 115.11
Maseya 140 n/a 17.2 19.2 26.6 37.8 n/a 118.7 132.5 183.2 269.95
Katunga 152 n/a 14.5 16.4 24.7 32.9 n/a 91.9 104.0 170.2 216.73
Kasisi 337 n/a 20.3 25.4 31 23.3 n/a 68.3 85.4 104.4 69.03
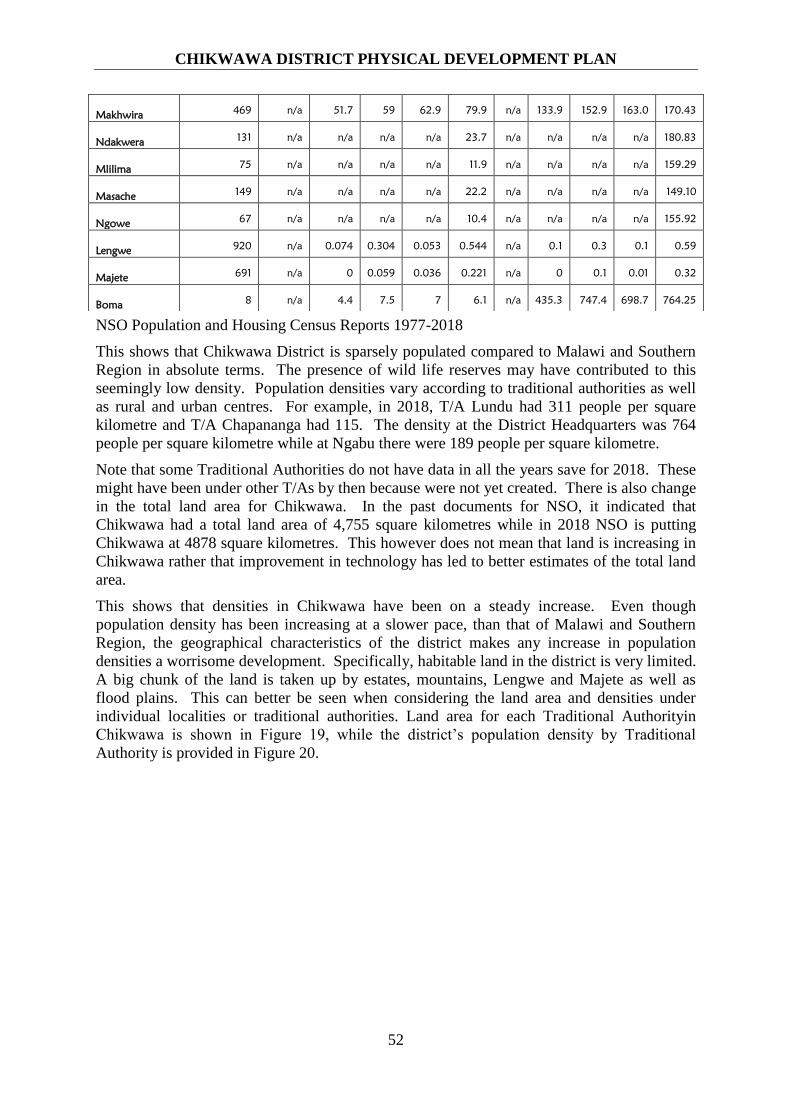
CHIKWAWA DISTRICT PHYSICAL DEVELOPMENT PLAN
52
NSO Population and Housing Census Reports 1977-2018
This shows that Chikwawa District is sparsely populated compared to Malawi and Southern
Region in absolute terms. The presence of wild life reserves may have contributed to this
seemingly low density. Population densities vary according to traditional authorities as well
as rural and urban centres. For example, in 2018, T/A Lundu had 311 people per square
kilometre and T/A Chapananga had 115. The density at the District Headquarters was 764
people per square kilometre while at Ngabu there were 189 people per square kilometre.
Note that some Traditional Authorities do not have data in all the years save for 2018. These
might have been under other T/As by then because were not yet created. There is also change
in the total land area for Chikwawa. In the past documents for NSO, it indicated that
Chikwawa had a total land area of 4,755 square kilometres while in 2018 NSO is putting
Chikwawa at 4878 square kilometres. This however does not mean that land is increasing in
Chikwawa rather that improvement in technology has led to better estimates of the total land
area.
This shows that densities in Chikwawa have been on a steady increase. Even though
population density has been increasing at a slower pace, than that of Malawi and Southern
Region, the geographical characteristics of the district makes any increase in population
densities a worrisome development. Specifically, habitable land in the district is very limited.
A big chunk of the land is taken up by estates, mountains, Lengwe and Majete as well as
flood plains. This can better be seen when considering the land area and densities under
individual localities or traditional authorities. Land area for each Traditional Authorityin
Chikwawa is shown in Figure 19, while the district’s population density by Traditional
Authority is provided in Figure 20.
Makhwira 469 n/a 51.7 59 62.9 79.9 n/a 133.9 152.9 163.0 170.43
Ndakwera 131 n/a n/a n/a n/a 23.7 n/a n/a n/a n/a 180.83
Mlilima 75 n/a n/a n/a n/a 11.9 n/a n/a n/a n/a 159.29
Masache 149 n/a n/a n/a n/a 22.2 n/a n/a n/a n/a 149.10
Ngowe 67 n/a n/a n/a n/a 10.4 n/a n/a n/a n/a 155.92
Lengwe 920 n/a 0.074 0.304 0.053 0.544 n/a 0.1 0.3 0.1 0.59
Majete 691 n/a 0 0.059 0.036 0.221 n/a 0 0.1 0.01 0.32
Boma 8 n/a 4.4 7.5 7 6.1 n/a 435.3 747.4 698.7 764.25

CHIKWAWA DISTRICT PHYSICAL DEVELOPMENT PLAN
53
Figure 19: Land Area (km2) by Traditional Authority
Lengwe920
Ngabu873
Chapananga770
Majete691
Makhwira469
Kasisi337
Lundu200
Katunga152
Masache149
Maseya140
Ndakwela131
Mlilima75
Ngowe67
Boma8 Lengwe
Ngabu
Chapananga
Majete
Makhwira
Kasisi
Lundu
Katunga
Masache
Maseya
Ndakwela
Mlilima
Ngowe
Boma
NSO Population and Housing Census Preliminary Report 2018
5.1.4 Age-Sex Structure
The overall population of Chikwawa District according to latest population census figures is
skewed towards young people. Approximately 54.3% of the total population is below the age
of 19 of which 49.3% are under the age of 18. On the other hand, 5.5% of the total
population is over the age of 60. This means that 54.8% of the total population is an
economic burden on the economically active group. The population of females is slightly
higher than that of males. 51 percent of the district’s total population are females. This is not
too far from 2008 population and housing census results which showed that 50.1% of the
total population were females.

CHIKWAWA DISTRICT PHYSICAL DEVELOPMENT PLAN
54
Figure 20: Population Densities per Traditional Authority
Ngabu189
Lundu311
Chapananga 115
Maseya270Katunga
217
Kasisi
69
Makhwira 170
Ndakwela181
Mlilima 159
Masache149
Ngowe 156
Boma 764
Population Density by TA
NSO Population and Housing Census Reports 1977-2018
Table 17: Population Distribution by 5 Year Age Groups in 2018
Age group Total Male Female
1-4 69,375 34,306 35,069
5-9 88,719 44,010 44,709
10-14 79,904 39,509 40,395
15-19 68,448 34,406 34,042
20-24 51,269 24,140 27,129
25-29 42,857 20,502 22,355
30-34 34,108 16,004 18,104
35-39 32,482 15.748 16,734
40-44 24,252 12,683 11,569
45-49 19,330 10,416 8,914
50-54 11,702 5,830 5,872
55-59 11,199 5,613 5,586
60-64 7,273 3,469 3,804
65-69 7,970 3,666 4,304
70-74 5,526 2,443 3,083

CHIKWAWA DISTRICT PHYSICAL DEVELOPMENT PLAN
55
Age group Total Male Female
75-79 4,359 1,833 2,526
80-84 2230 770 1,460
85-89 2239 887 1,352
90-94 696 253 443
95-99 561 219 342
100-104 125 37 88
105-109 54 21 33
110-114 19 5 14
115-119 13 4 9
120-999 6 4 2
NSO Population and Housing Census 2018
The graph on Figure 21 is a graphic representation of Table 18, showing a clear picture of the
population in Chikwawa as regards age and sex distribution.
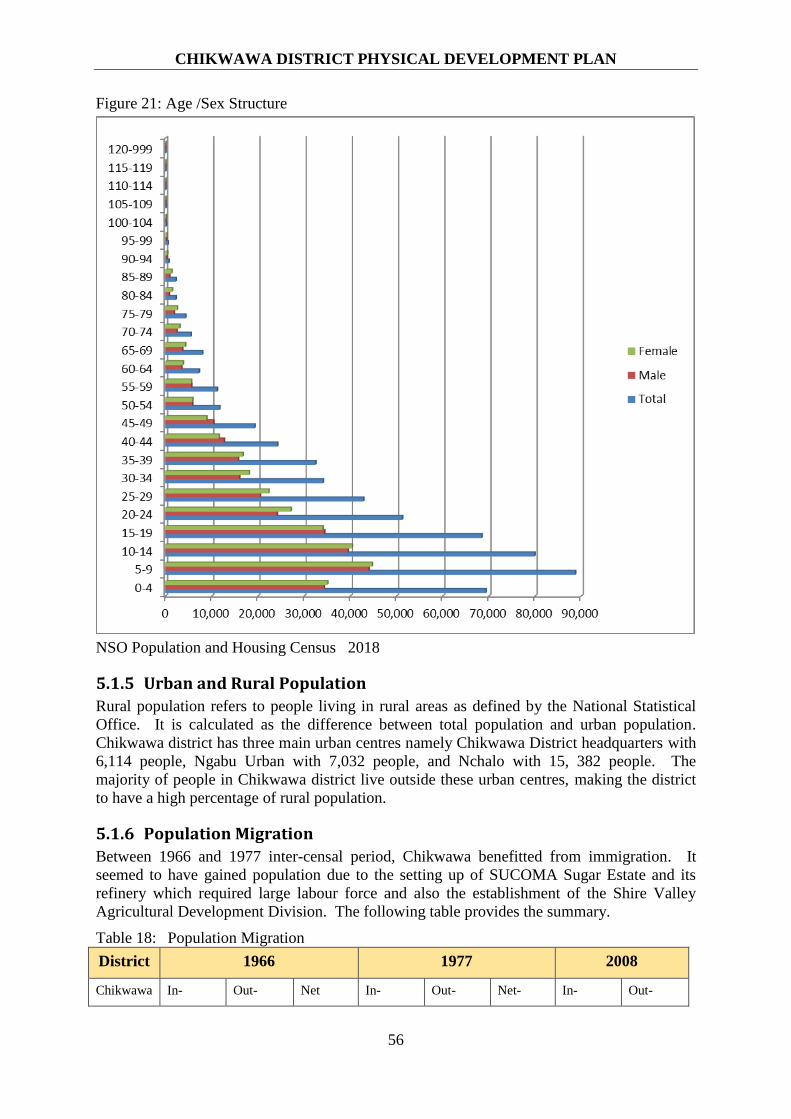
CHIKWAWA DISTRICT PHYSICAL DEVELOPMENT PLAN
56
Figure 21: Age /Sex Structure
NSO Population and Housing Census 2018
5.1.5 Urban and Rural Population
Rural population refers to people living in rural areas as defined by the National Statistical
Office. It is calculated as the difference between total population and urban population.
Chikwawa district has three main urban centres namely Chikwawa District headquarters with
6,114 people, Ngabu Urban with 7,032 people, and Nchalo with 15, 382 people. The
majority of people in Chikwawa district live outside these urban centres, making the district
to have a high percentage of rural population.
5.1.6 Population Migration
Between 1966 and 1977 inter-censal period, Chikwawa benefitted from immigration. It
seemed to have gained population due to the setting up of SUCOMA Sugar Estate and its
refinery which required large labour force and also the establishment of the Shire Valley
Agricultural Development Division. The following table provides the summary.
Table 18: Population Migration
District 1966 1977 2008
Chikwawa In- Out- Net In- Out- Net- In- Out-
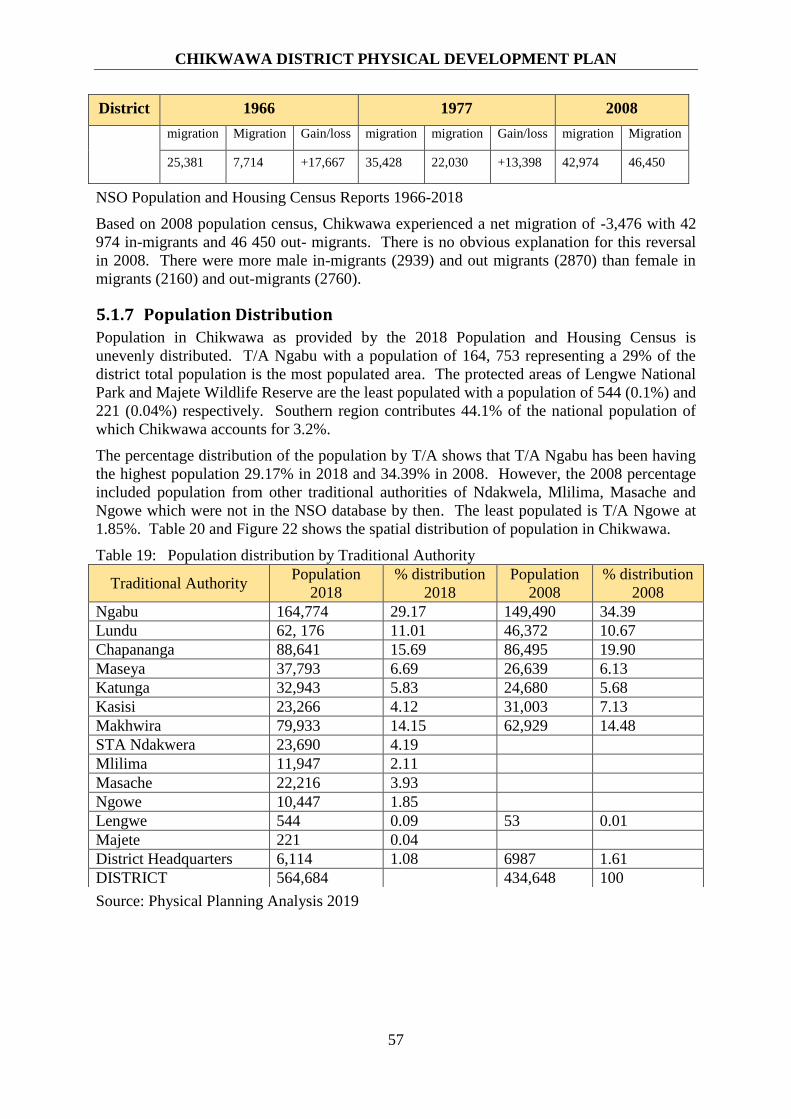
CHIKWAWA DISTRICT PHYSICAL DEVELOPMENT PLAN
57
District 1966 1977 2008
migration Migration Gain/loss migration migration Gain/loss migration Migration
25,381 7,714 +17,667 35,428 22,030 +13,398 42,974 46,450
NSO Population and Housing Census Reports 1966-2018
Based on 2008 population census, Chikwawa experienced a net migration of -3,476 with 42
974 in-migrants and 46 450 out- migrants. There is no obvious explanation for this reversal
in 2008. There were more male in-migrants (2939) and out migrants (2870) than female in
migrants (2160) and out-migrants (2760).
5.1.7 Population Distribution
Population in Chikwawa as provided by the 2018 Population and Housing Census is
unevenly distributed. T/A Ngabu with a population of 164, 753 representing a 29% of the
district total population is the most populated area. The protected areas of Lengwe National
Park and Majete Wildlife Reserve are the least populated with a population of 544 (0.1%) and
221 (0.04%) respectively. Southern region contributes 44.1% of the national population of
which Chikwawa accounts for 3.2%.
The percentage distribution of the population by T/A shows that T/A Ngabu has been having
the highest population 29.17% in 2018 and 34.39% in 2008. However, the 2008 percentage
included population from other traditional authorities of Ndakwela, Mlilima, Masache and
Ngowe which were not in the NSO database by then. The least populated is T/A Ngowe at
1.85%. Table 20 and Figure 22 shows the spatial distribution of population in Chikwawa.
Table 19: Population distribution by Traditional Authority
Source: Physical Planning Analysis 2019
Traditional Authority Population
2018
% distribution
2018
Population
2008
% distribution
2008
Ngabu 164,774 29.17 149,490 34.39
Lundu 62, 176 11.01 46,372 10.67
Chapananga 88,641 15.69 86,495 19.90
Maseya 37,793 6.69 26,639 6.13
Katunga 32,943 5.83 24,680 5.68
Kasisi 23,266 4.12 31,003 7.13
Makhwira 79,933 14.15 62,929 14.48
STA Ndakwera 23,690 4.19
Mlilima 11,947 2.11
Masache 22,216 3.93
Ngowe 10,447 1.85
Lengwe 544 0.09 53 0.01
Majete 221 0.04
District Headquarters 6,114 1.08 6987 1.61
DISTRICT 564,684 434,648 100
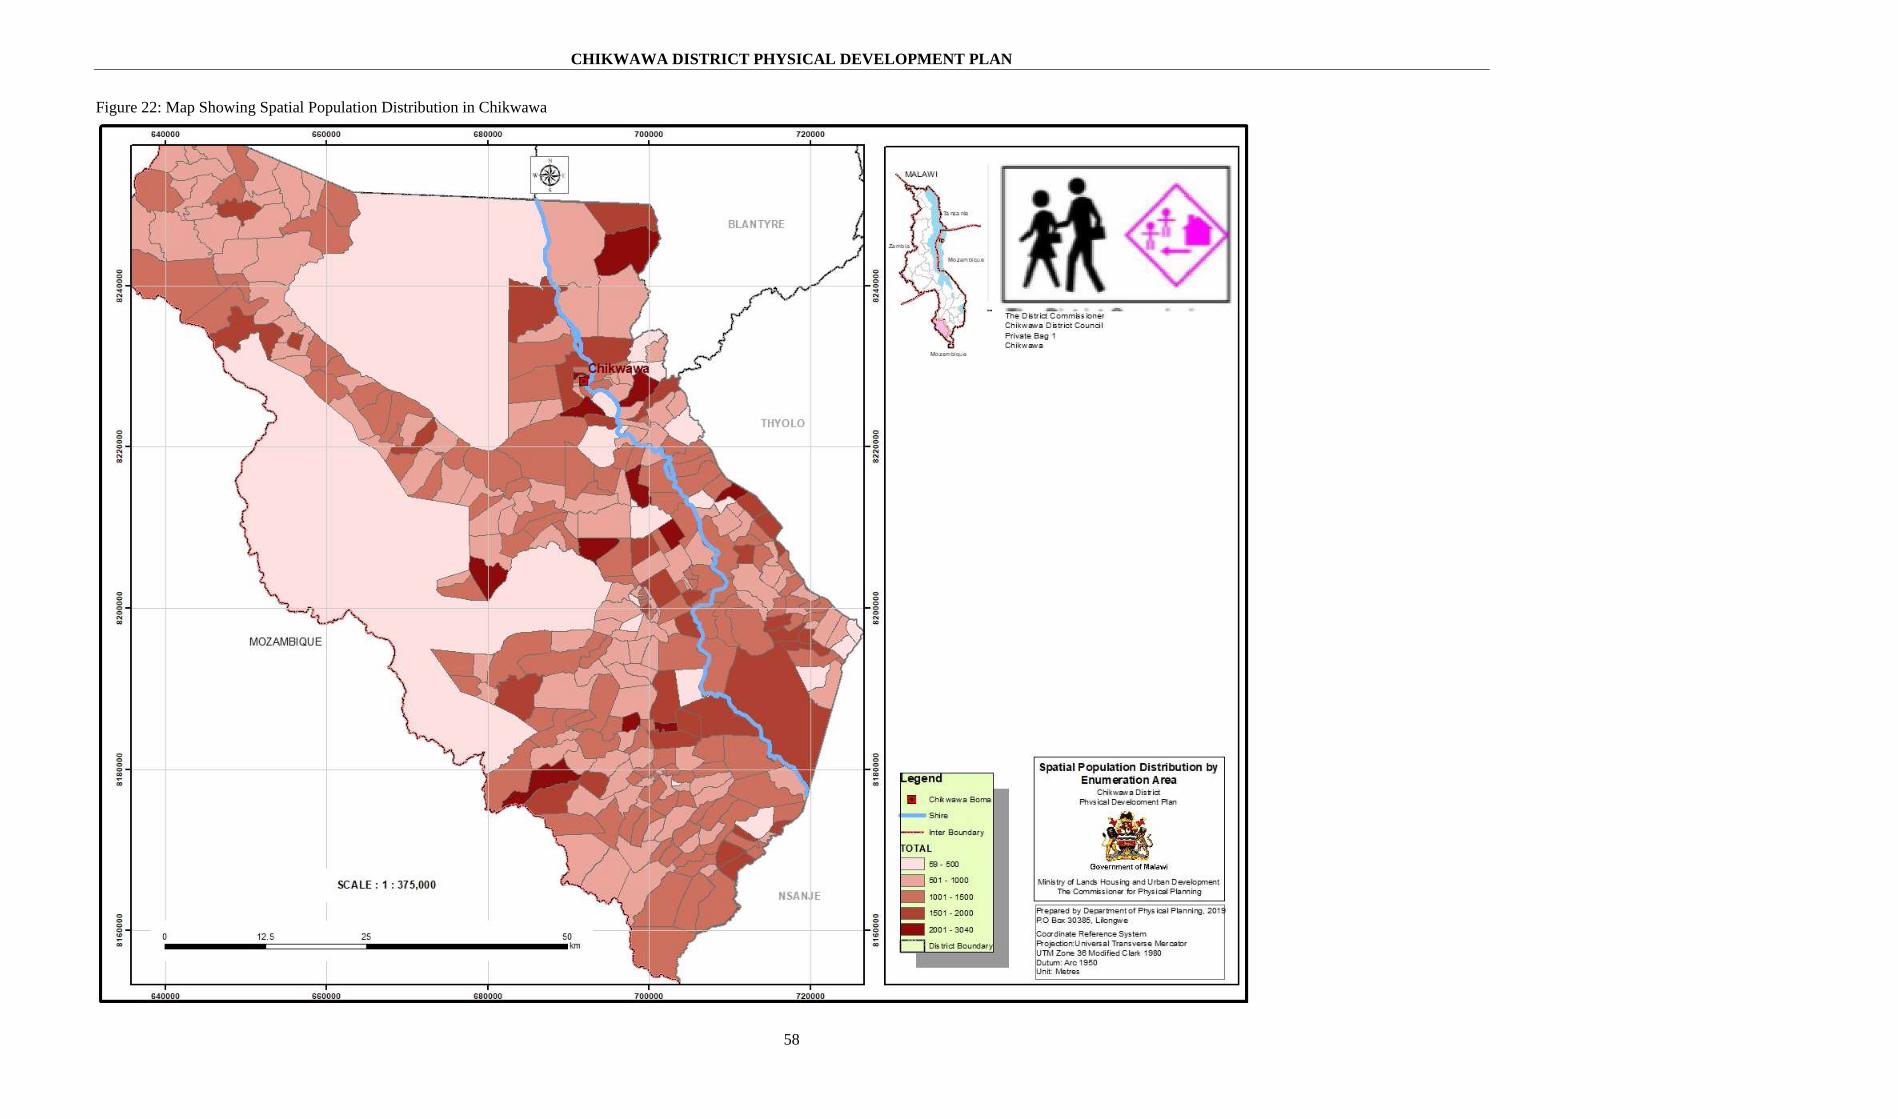
CHIKWAWA DISTRICT PHYSICAL DEVELOPMENT PLAN
58
Figure 22: Map Showing Spatial Population Distribution in Chikwawa

CHIKWAWA DISTRICT PHYSICAL DEVELOPMENT PLAN
59
5.1.8 Population Projections 2019 - 2040
With an annual growth rate of 2.5%, it is expected that by the year 2040 the total population
of Chikwawa District will increase with 407446 people; from 564,684 to 972,130 as seen in
Table 21 below.
Table 20: Population Projections 2019 - 2040
Year Population Change percentage
2018 564 684 -
2019 578 801 2.5
2020 593 271 2.4
2021 608 102 2.4
2022 623 304 2.5
2023 638 886 2.5
2024 654 858 2.4
2025 671 229 2.5
2026 688 009 2.5
2027 705 209 2.5
2028 722 839 2.5
2029 740 909 2.5
2030 759 431 2.5
2031 778 416 2.5
2032 797 876 2.5
2033 817 822 2.5
2034 838 267 2.5
2035 859 223 2.5
2036 880 703 2.5
2037 902 728 2.5
2038 925 288 2.5
2039 948 420 2.5
2040 972 130 2.5
Source: Physical Planning Analysis 2019
If the population projection trends of Chikwawa District are anything to go by, then we
should expect more pressure on the few available resources, and land- based resources would
not sustain the growing population. People’s livelihoods have to move away from heavy
dependency on agriculture. This means introducing other economic activities that would
absorb more people to take pressure off the land. In addition, with this increase in population
the district should brace for more environmental degradation and more pronounced related
disasters like floods if upstream river catchment areas are not given special attention now.
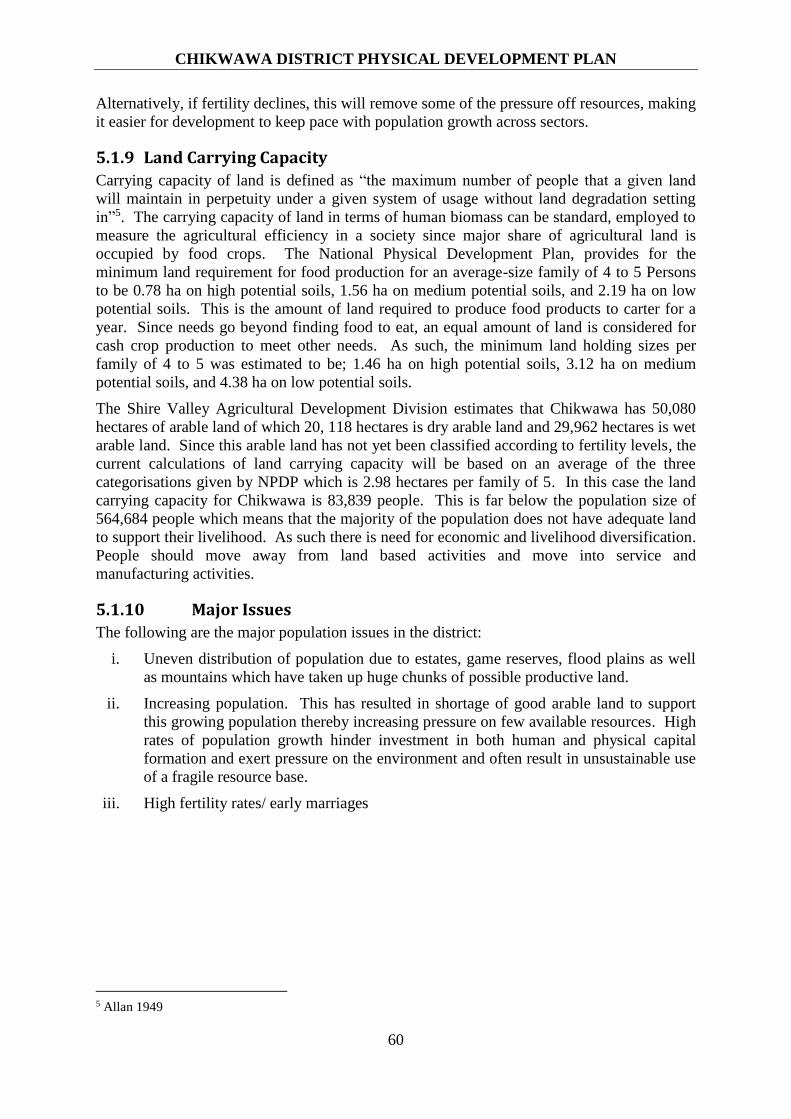
CHIKWAWA DISTRICT PHYSICAL DEVELOPMENT PLAN
60
Alternatively, if fertility declines, this will remove some of the pressure off resources, making
it easier for development to keep pace with population growth across sectors.
5.1.9 Land Carrying Capacity
Carrying capacity of land is defined as “the maximum number of people that a given land
will maintain in perpetuity under a given system of usage without land degradation setting
in”5. The carrying capacity of land in terms of human biomass can be standard, employed to
measure the agricultural efficiency in a society since major share of agricultural land is
occupied by food crops. The National Physical Development Plan, provides for the
minimum land requirement for food production for an average-size family of 4 to 5 Persons
to be 0.78 ha on high potential soils, 1.56 ha on medium potential soils, and 2.19 ha on low
potential soils. This is the amount of land required to produce food products to carter for a
year. Since needs go beyond finding food to eat, an equal amount of land is considered for
cash crop production to meet other needs. As such, the minimum land holding sizes per
family of 4 to 5 was estimated to be; 1.46 ha on high potential soils, 3.12 ha on medium
potential soils, and 4.38 ha on low potential soils.
The Shire Valley Agricultural Development Division estimates that Chikwawa has 50,080
hectares of arable land of which 20, 118 hectares is dry arable land and 29,962 hectares is wet
arable land. Since this arable land has not yet been classified according to fertility levels, the
current calculations of land carrying capacity will be based on an average of the three
categorisations given by NPDP which is 2.98 hectares per family of 5. In this case the land
carrying capacity for Chikwawa is 83,839 people. This is far below the population size of
564,684 people which means that the majority of the population does not have adequate land
to support their livelihood. As such there is need for economic and livelihood diversification.
People should move away from land based activities and move into service and
manufacturing activities.
5.1.10 Major Issues
The following are the major population issues in the district:
i. Uneven distribution of population due to estates, game reserves, flood plains as well
as mountains which have taken up huge chunks of possible productive land.
ii. Increasing population. This has resulted in shortage of good arable land to support
this growing population thereby increasing pressure on few available resources. High
rates of population growth hinder investment in both human and physical capital
formation and exert pressure on the environment and often result in unsustainable use
of a fragile resource base.
iii. High fertility rates/ early marriages
5 Allan 1949

CHIKWAWA DISTRICT PHYSICAL DEVELOPMENT PLAN
61
6 URBANIZATION
6.1.1 Introduction
Urbanization, in this plan, is defined as a process whereby the functions of a rural settlement
of the village increasingly become oriented towards non-farm activities such as the
production of goods, marketing, professional services, etc., with a concomitant increase in the
non-agricultural population.
This chapter is based on the results of the central place survey carried out by the National
Physical Development Plan (NPDP) team in 1981/1983 and updated by the physical planning
team in 2019. This survey identified three types of levels of services available at various
centres in Chikwawa District. These services were given points to reflect a high, medium or
low level of service. The points accumulated for each settlement centre reflect the
settlements (a) centrality as a service centre; (b) rank on the existing hierarchy of service
centres and (c) level of urbanization in terms of non- farm activities. The following point
system in Table 22 has been used to define the hierarchy of settlements. Centres with more
than 11 points were considered urban
Table 21: Hierarchy point system
CENTRES POINTS
Village Centre 7 – 11 Points
Rural Market Centre 12 – 19 points
District or Main Market Centre 20 – 35 points
Sub Regional Centre 36 – 45 points
Regional Centre 36 – 45 points
National Centre 36 – 45 points
Source; National Physical Development Plan, 1987
6.1.2 Existing Service Centres
The NPDP central place survey held in 1981/83 identified a total of four service centres in
this district and were Chikwawa Boma, Chapananga, Nchalo and Ngabu. The central place
survey conducted by the Physical Planning Team in 2019 however identified 25 service
centres in the district. There are three Main market centres, four rural market centres and
eleven village centres. Almost all centres have developed in haphazard manner. These
centres are graphically shown on Figure 23, the map of distribution of service centres and
facilities
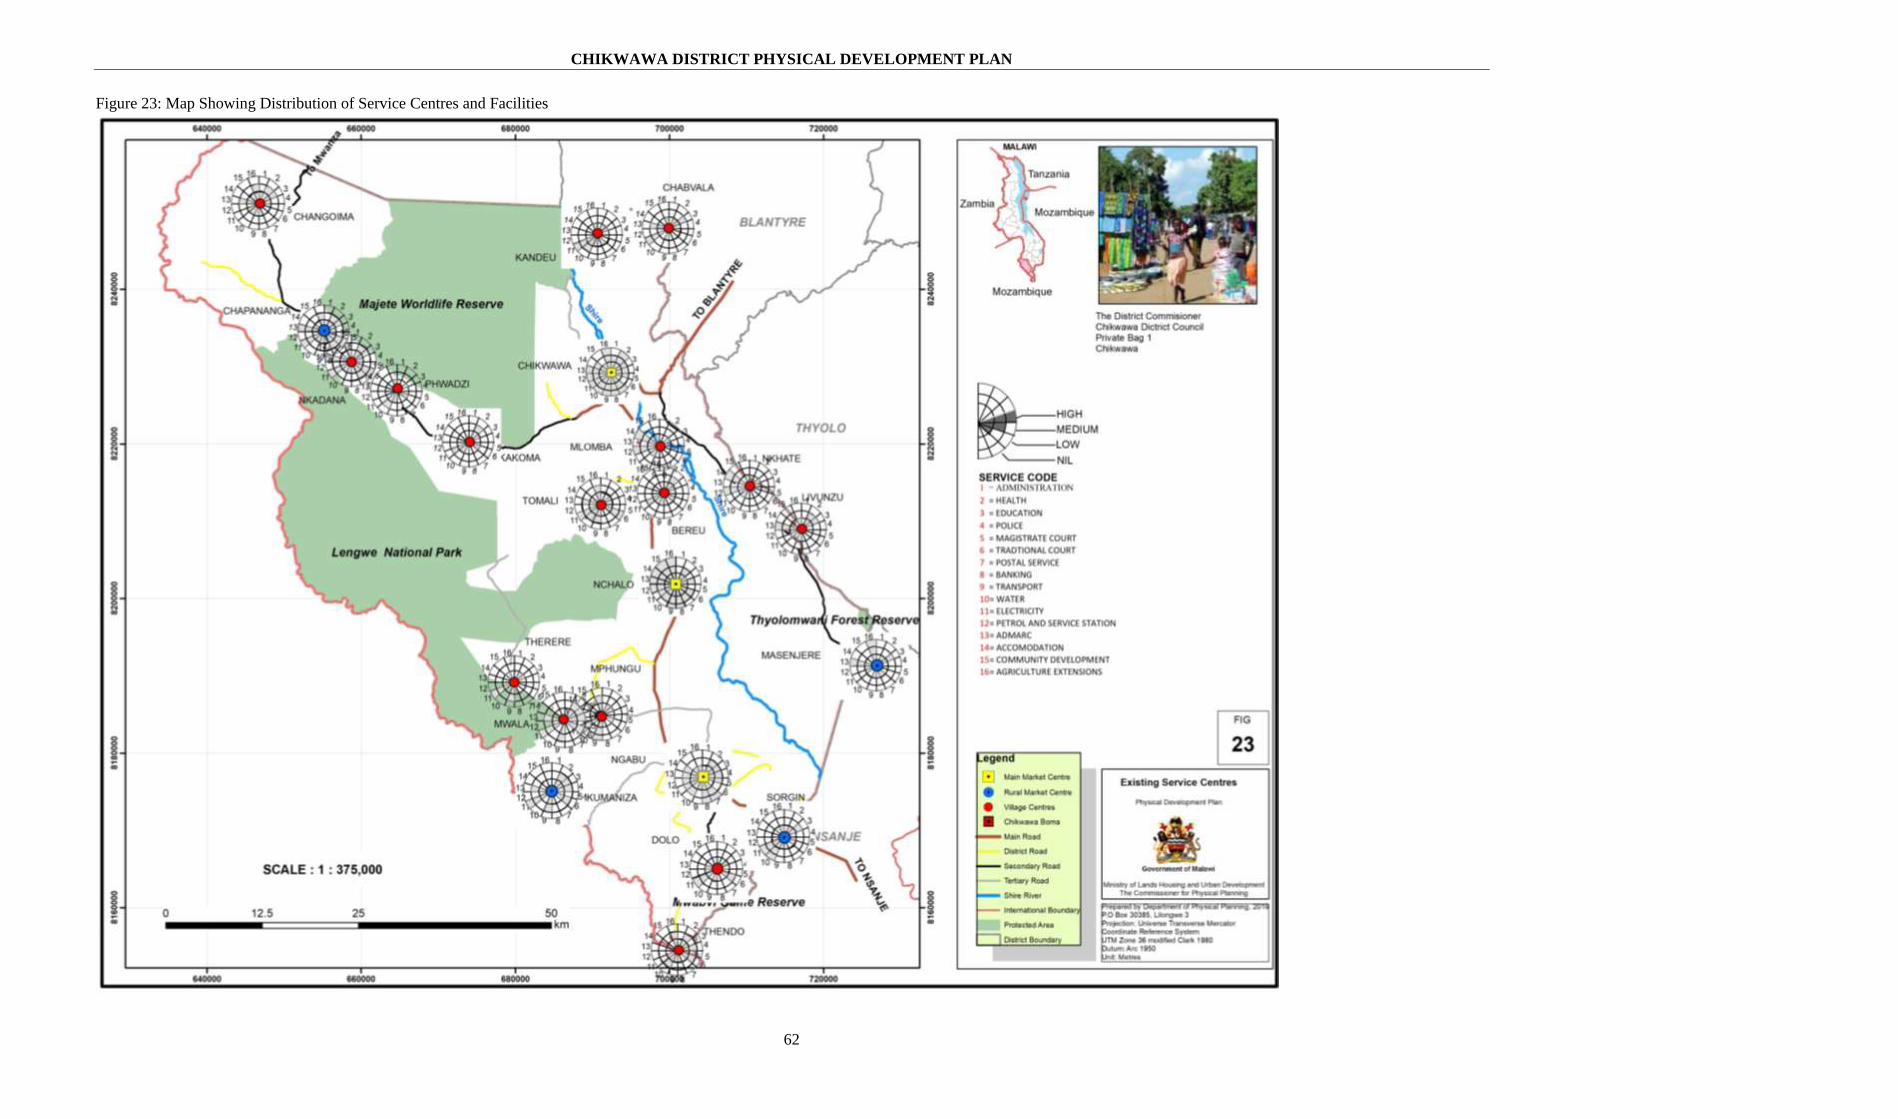
CHIKWAWA DISTRICT PHYSICAL DEVELOPMENT PLAN
62
Figure 23: Map Showing Distribution of Service Centres and Facilities
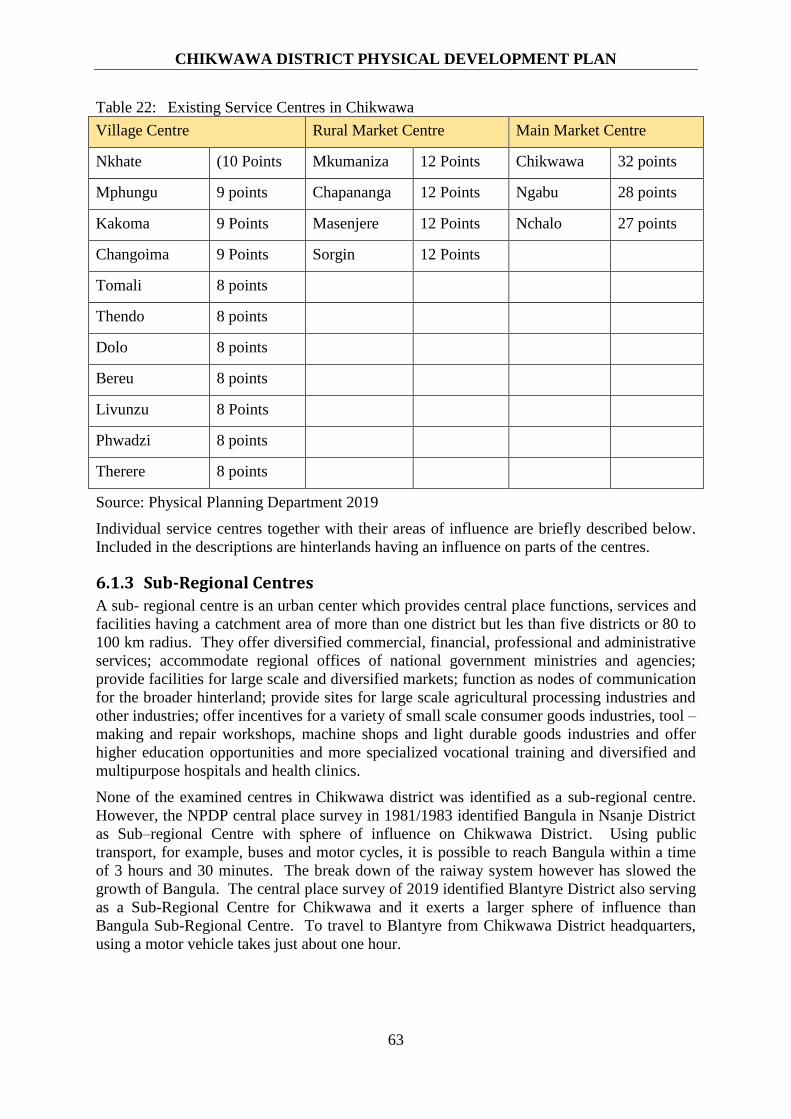
CHIKWAWA DISTRICT PHYSICAL DEVELOPMENT PLAN
63
Table 22: Existing Service Centres in Chikwawa
Village Centre Rural Market Centre Main Market Centre
Nkhate (10 Points Mkumaniza 12 Points Chikwawa 32 points
Mphungu 9 points Chapananga 12 Points Ngabu 28 points
Kakoma 9 Points Masenjere 12 Points Nchalo 27 points
Changoima 9 Points Sorgin 12 Points
Tomali 8 points
Thendo 8 points
Dolo 8 points
Bereu 8 points
Livunzu 8 Points
Phwadzi 8 points
Therere 8 points
Source: Physical Planning Department 2019
Individual service centres together with their areas of influence are briefly described below.
Included in the descriptions are hinterlands having an influence on parts of the centres.
6.1.3 Sub-Regional Centres
A sub- regional centre is an urban center which provides central place functions, services and
facilities having a catchment area of more than one district but les than five districts or 80 to
100 km radius. They offer diversified commercial, financial, professional and administrative
services; accommodate regional offices of national government ministries and agencies;
provide facilities for large scale and diversified markets; function as nodes of communication
for the broader hinterland; provide sites for large scale agricultural processing industries and
other industries; offer incentives for a variety of small scale consumer goods industries, tool –
making and repair workshops, machine shops and light durable goods industries and offer
higher education opportunities and more specialized vocational training and diversified and
multipurpose hospitals and health clinics.
None of the examined centres in Chikwawa district was identified as a sub-regional centre.
However, the NPDP central place survey in 1981/1983 identified Bangula in Nsanje District
as Sub–regional Centre with sphere of influence on Chikwawa District. Using public
transport, for example, buses and motor cycles, it is possible to reach Bangula within a time
of 3 hours and 30 minutes. The break down of the raiway system however has slowed the
growth of Bangula. The central place survey of 2019 identified Blantyre District also serving
as a Sub-Regional Centre for Chikwawa and it exerts a larger sphere of influence than
Bangula Sub-Regional Centre. To travel to Blantyre from Chikwawa District headquarters,
using a motor vehicle takes just about one hour.

CHIKWAWA DISTRICT PHYSICAL DEVELOPMENT PLAN
64
6.1.4 Main Market Centre
Main market centre is an urban center which provides central place functions, facilities and
services having a catchment area of the whole district or 40 t0 50 km radius. There are three
types of these: where administration and commercial services are combined or administration
function without commercial functions or commercial function without administrative
functions.
Main market centres provide wide varieties of agricultural commodities processed goods
household and common consumer products and farm inputs and offer access to all weather
road network. They provide the pre-conditions and infrastructure to promote agro-processing
plants and small scale bulk commodity handling facilities. They also make available a variety
of rural financial and credit services, meet rural energy and utility needs and offer access to
all weather roads network. Main market centres further provide higher level administrative
services; offer vocational and secondary education, health and child care services and rural
commercial services. There are three District / Main Market centres in Chikwawa District
and these are Chikwawa District Headquarters, Ngabu and Nchalo.
6.1.4.1 Chikwawa District Headquarters (32 points)
Located north of Chikwawa District, the centre falls under the jurisdiction of Traditional
Authority (T/A) Kasisi. According to 2018 preliminary Population and Housing Census
report, T/A Kasisi has an estimated population of 23,266 people. The District Headquarters
offers the following services; district hospital, district education offices, district
commissioner’s office and other non-governmental organizations’ offices. The centre is also
vibrant because of its various small scale commercial businesses. PressCane Limited is one
of the industries located in the area which provides employment opportunities to the people
within and the surrounding areas.
6.1.4.2 Ngabu (28 points)
Ngabu is located on the southern part of Chikwawa and is bordered by Nsanje. The centre is
49 km away from Chikwawa District Headquarters and it lies along the M1 Road. According
to NSO preliminary Population and Housing Census report of 2018, Ngabu has an estimated
population of 157,742. The main mode of transport at the centre includes motor cycles and
bicycles.
6.1.4.3 Nchalo (27 points)
Nchalo is located at the centre of Chikwawa District. ILLOVO group of companies is the
major contributing factor to the growth of the centre. The company provides employment to
a large population within Nchalo and the surrounding areas such as Sekeni, Kalulu and
Jombo. The centre lies along the M1 Road and the main modes of transport include
minibuses, pick-ups, motor cycles and bicycles.
6.1.5 Rural Market Centres
A rural market centre is an urban center in a rural setting which provides central place
functions, services and facilities having a catchment area of less than one district, one chief’s
area, or more than one chief’s area or 15 km radius.
The centres contain services and facilities to assemble agricultural commodities. They
provide local periodic markets, extend transport access to main market towns and larger
urban centres, accommodates small scale agro- processing and handcraft industries, distribute
credit and market information as well as savings and provide basic health facilities,
recreation, education and administrative services. The level of services include; wholesale
and small retail shops, post office, health facilities, educational facilities, agricultural

CHIKWAWA DISTRICT PHYSICAL DEVELOPMENT PLAN
65
commodities, mobile Bank services, and ADMARC facilities for agricultural input and
output market. Figure 24 depicts distribution of existing rural market centres in Chikwawa
District.
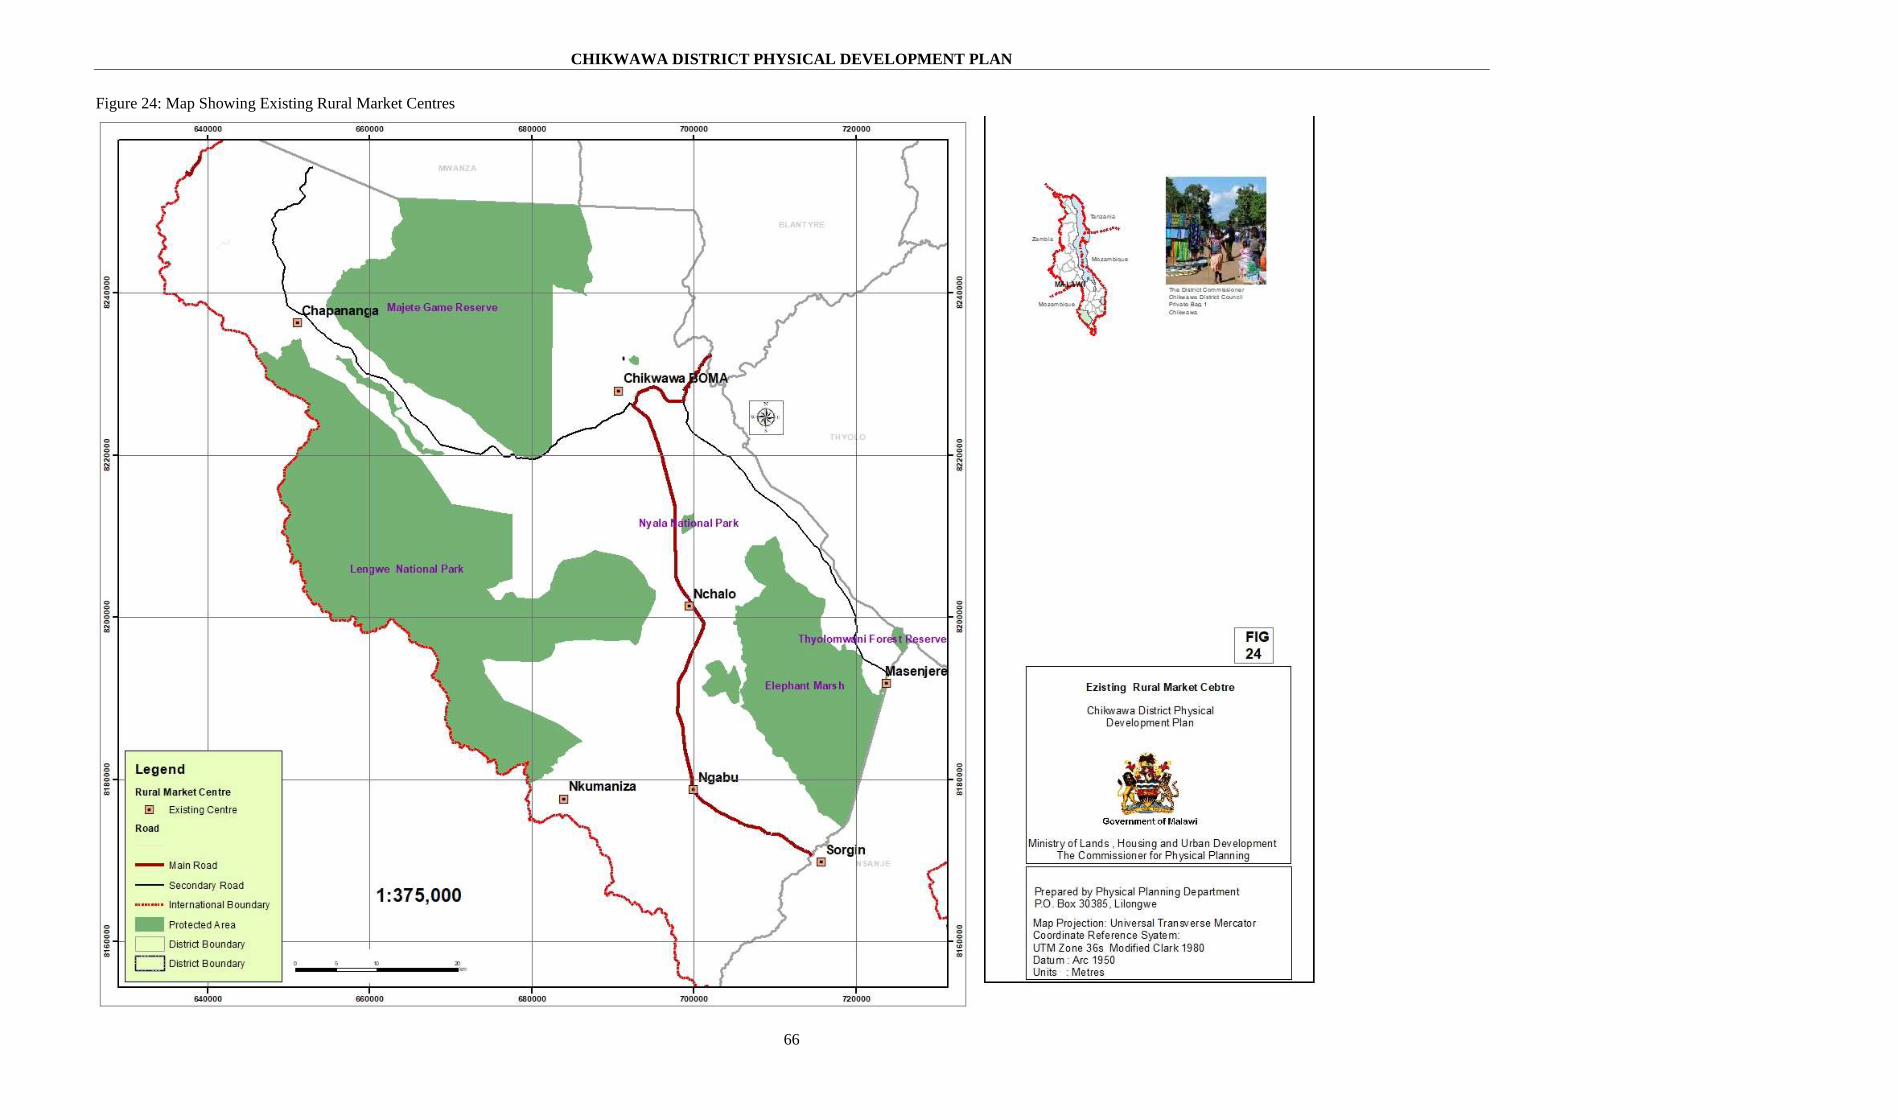
CHIKWAWA DISTRICT PHYSICAL DEVELOPMENT PLAN
66
Figure 24: Map Showing Existing Rural Market Centres

CHIKWAWA DISTRICT PHYSICAL DEVELOPMENT PLAN
67
The following are the four existing rural market centres;
6.1.5.1 Mkumaniza (12 points)
The centre is situated approximately 15km from Ngabu and is located to the southwest of
Chikwawa District bordering with Mozambique. It has an approximate population of
157,742 people according to NSO 2018 preliminary Population and Housing Census report.
The centre has a numerous number of retail shops and a couple of wholesale shops. The
centre also has a primary and secondary school.
6.1.5.2 Chapananga (12 points)
Chapananga is located northwest of Chikwawa District with an approximate distance of
45km from Chikwawa District Headquarters. The centre serves a large population and it is
important among other things because it has an ADMARC depot, post office, health centre
and traditional court.
6.1.5.3 Masenjere (12 points)
Masenjere is situated to the East of Chikwawa District and lies on the boundary between
Chikwawa and Nsanje district. Economic activities like barter trade, farming and the
marketing of other goods have mainly contributed to the growth of the centre. The centre has
a health centre and a community day secondary school. The main modes of transportation at
the centre are bicycles and pick-ups. There are more than five rivers of which most of these
have no bridges and some bridges have been completely washed away which makes the
centre hardly accessible by vehicles during rainy season. The construction of new bridges is
underway in some points. The condition of infrastructure at the centre is poor and
inadequate.
6.1.5.4 Sorgin (12 points)
The centre is a centre in Nsanje district and it borders Chikwawa District to the South-East.
Part of its catchment area is mainly Chikwawa although administratively it is in Nsanje
district.
6.1.6 Village Centres
A village centre is a rural service center providing basic services for a catchment area
covering one or several villages, part of or one chief’s area or 5 to 8 km radius. Village
centres offer the lowest level of the services within the hierarchy of service centres. They
provide basic services such as health, elementary education, agricultural extension and day to
day commercial activities. Figure 25 shows existing village centres in the district.
The following are the existing village market centres;
6.1.6.1 Nkhate (10 points)
Located approximately 17km from Thabwa centre along M1 road. The main modes of
transportation are bicycle, motor cycles and pick-ups.
6.1.6.2 Mphungu (9 points)
Mphungu has a health centre, serving a population of 42,087 persons, which gives its
significance,.
6.1.6.3 Kakoma (9 points)
Kakoma is to the North West of Chikwawa District. The main modes of transportation are
bicycle, motor cycles and pick-ups.
CHIKWAWA DISTRICT PHYSICAL DEVELOPMENT PLAN
68
6.1.6.4 Changoima (9 points)
The centre is to the North East of Chikwawa District. The main mode of transportation is
motor cycles. It is at a distance of 19 Km from Chapananga trading centre.
6.1.6.5 Tomali (8 points)
Tomali is located approximately 10Km from the M1 road. The centre is located in
Paramount Chief Lundu’s jurisdiction which has a population of 62,176 according to NSO
preliminary survey 2018 results.
6.1.6.6 Thendo (8 points)
Thendo is bordered by Mozambique and is located 26 Km from the M1 road. It is located
south-west of Chikwawa in T/A Ngabu’s jurisdiction which has a population of about
164,753 according to NSO preliminary survey 2018 results.
6.1.6.7 Dolo (8 points)
Dolo is located approximately 7.3 Km from the M1 road. Among other things, the centre has
a health centre which serves a population of about 47 000 people. The presence of Extension
planning Area (EPA) office at the centre also increases its significance. The centre is
accessible by a tarmac road.
6.1.6.8 Bereu (8 points)
Bereu is located approximately 18km from Chikwawa District Headquarters astride the M1
road. The presence of shops and an ADMARC depot increases the significance of the centre.
6.1.6.9 Livunzu (8 points)
Livunzu is located approximately 24Km from Thabwa centre which is along M1 road.
Although the centre is located on the eastern part of the district the risk of disaster is minimal.
The area has enough space for development and is characterized by linear settlements. The
market activities of the centre are the contributory factor for its growth.
6.1.6.10 Phwadzi (8 points)
Phwadzi is located North-West of Chikwawa District. The main modes of transportation are
bicycles, pickups and motorcycles. The centre has a secondary school which plays a
significant role to settlement and economic development of the area.
6.1.6.11 Therere (8 points)
Therere is located South-West of Chikwawa District. The centre is at a distance of 20.7km
from Miseu Folo which lies along the M1. Therere has a health post, ADMARC depot,
agricultural offices and a secondary school.
6.1.6.12 Chabvala (7 points)
Chabvala is located north-west of Chikwawa District bordering Blantyre. There is a health
centre that is under construction. The health centre once completed, will increase the
significance of the centre.

CHIKWAWA DISTRICT PHYSICAL DEVELOPMENT PLAN
69
Figure 25: Map Showing Distribution of Existing Village Centres

CHIKWAWA DISTRICT PHYSICAL DEVELOPMENT PLAN
70
6.2 INTER-SETTLEMENT FUNCTIONAL LINKAGES
6.2.1 Relative Importance of Centres and Catchment Area Analysis
In determining the catchment area of centres and their functional linkages, a sample of people
in the district were asked to indicate the place where they go to buy goods and obtain
services. The goods and services involved were postal services, dispensaries, hospitals,
under-five clinics, primary and secondary schools, places of worship, district council
markets, maize mill, bicycles, clothing and grocery shops, ADMARC Markets and places of
work. Furthermore, a number of different centres and areas were also given as to where they
purchased and obtained the goods and services other than the centres already mentioned.
Place of non-farm employment and other administrative functions were also included in the
functions.
At Chikwawa Boma, from the total number of 900 people who were interviewed, 68 bought
clothes at Chikwawa Boma, 46 bought bicycles, 58 bought produce goods, 318 visited
Chikwawa for administration, 126 used post office services, 106 visited the hospital, 26
dispensary, and 16 non–farm employment. In total Chikwawa Boma received 764 votes thus
the strength of attraction exerted by Chikwawa is indicated as 11%.
At Ngabu centre, from the total number of 900 people who were interviewed, 104 bought
clothes, 158 bought bicycles, 110 bought produce goods, 50 visited for administration, 126
the post office, 96 the hospital, 56 the dispensary and 30 mentioned Ngabu as a place of non-
farm employment. In total, Ngabu received 730 votes thus the strength of attraction exerted
by Ngabu is indicated as 10%.
A follow up questionnaire regarding an alternative place where people purchased goods and
services was administered. From the total number of 900 people who were interviewed 68
bought clothes, 70 bought biycles, 6 bought produce goods, 2 acquired Administrative
services, 2 visited the post office, 2 visited the hospital, 2 visited the dispensary, 12 acquired
non-farm employment outside Chikwawa. In total, outside Chikwawa received 120 votes,
thus the strength of attraction exerted is indicated as 1.6%. Blantyre, Ntcheu, Lilongwe and
Mozambique are some of the areas that were mentioned where people acquire goods and
services outside the district.
The ranking of other centres based on the influence exerted in terms of the number of
functions and relative importance as a central place, is as illustrated in Table 24.

71
Table 23: Relative Strength of Centres
Centre
NUMBER OF PREFERNECE VOTES BY FUNCTIONS (1) No. of
Significant
functions (2)
Total User
Preference
Votes
Relative
Strength of
Centres (3)
%
Purchase
of
Clothes
Purchase
of
Bicycles
Visit to
Produce
Market
Visit to
Administration
Visit to
Post
Office
Visit to
Hospital
Visit to
Dispensary
Vist to
Nonfarm
Employment
Boma 68 46 58 318 126 106 26 16 6 764 11
Ngabu 104 158 110 50 126 96 56 30 7 730 10
Nchalo 40 164 16 12 30 4 4 78 2 348 5
Chapananga 12 10 16 - 24 6 8 4 0 80 1
Livuzu 16 - 30 2 36 28 10 22 0 134 2
Fatima - 48 - - 44 32 12 12 1 148 2
Masenjere 40 - - - - 56 36 24 1 156 2
Mitondo 64 - 84 - - - 12 - 2 160 2
Mphingu - - 8 - - 18 20 4 0 50 0
Miseufolo 20 - 18 - - - - 13 0 36 0
Dolo - - - 2 - 18 12 4 0 36 0.5
Nkadana - - 2 - - 10 10 4 0 36 0.3
Mpama 4 - 16 - - - - - 0 20 0.2
Kanyongolo 4 - 3 - - - - - 0 6 0
Phwazi - - 4 - - 8 3 - 0 14 0.1
Malata 4 - 3 - - 4 4 - 0 14 0.1
Mkumaniza 126 10 14 12 6 33 14 - 1 103 1.4
Kakoma 10 - 4 - - 4 - 4 0 22 0.3
Therere 1 - 2 - - - 1 - 0 8 0.1
Changoima 10 - 4 12 6 33 14 - 0 33 0.3
Outside 24 70 6 2 2 3 3 13 1 120 1.6
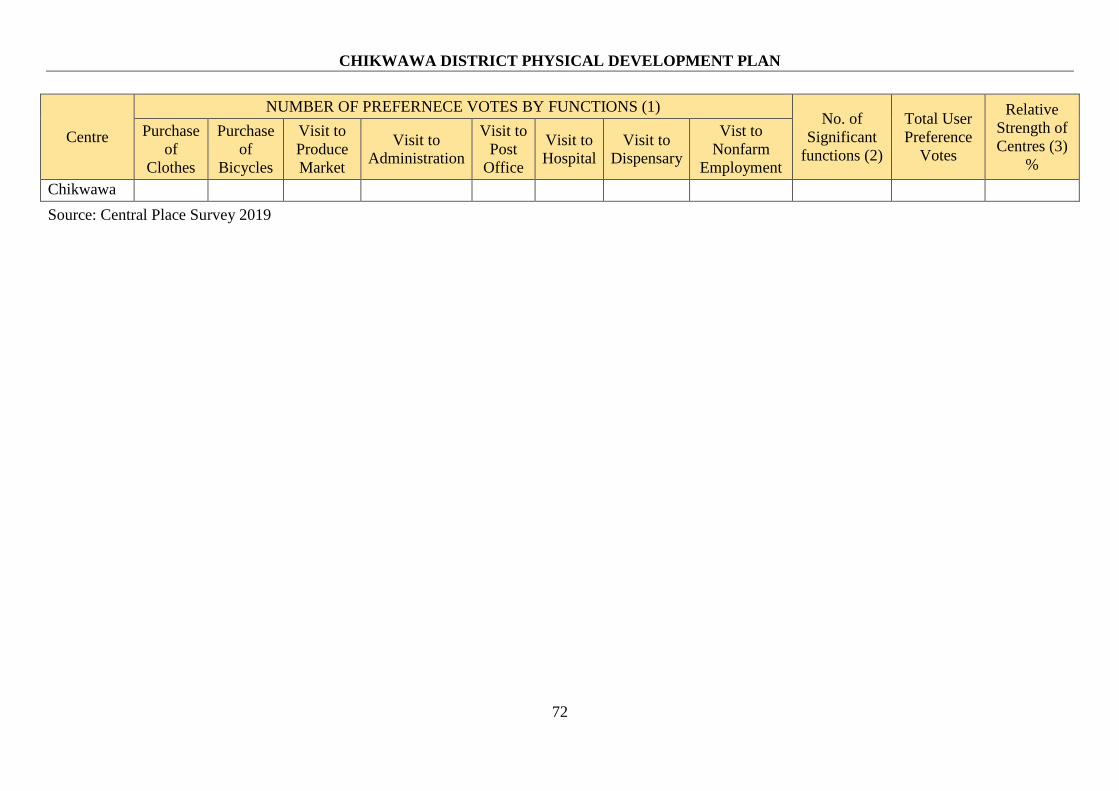
CHIKWAWA DISTRICT PHYSICAL DEVELOPMENT PLAN
72
Centre
NUMBER OF PREFERNECE VOTES BY FUNCTIONS (1) No. of
Significant
functions (2)
Total User
Preference
Votes
Relative
Strength of
Centres (3)
%
Purchase
of
Clothes
Purchase
of
Bicycles
Visit to
Produce
Market
Visit to
Administration
Visit to
Post
Office
Visit to
Hospital
Visit to
Dispensary
Vist to
Nonfarm
Employment
Chikwawa
Source: Central Place Survey 2019
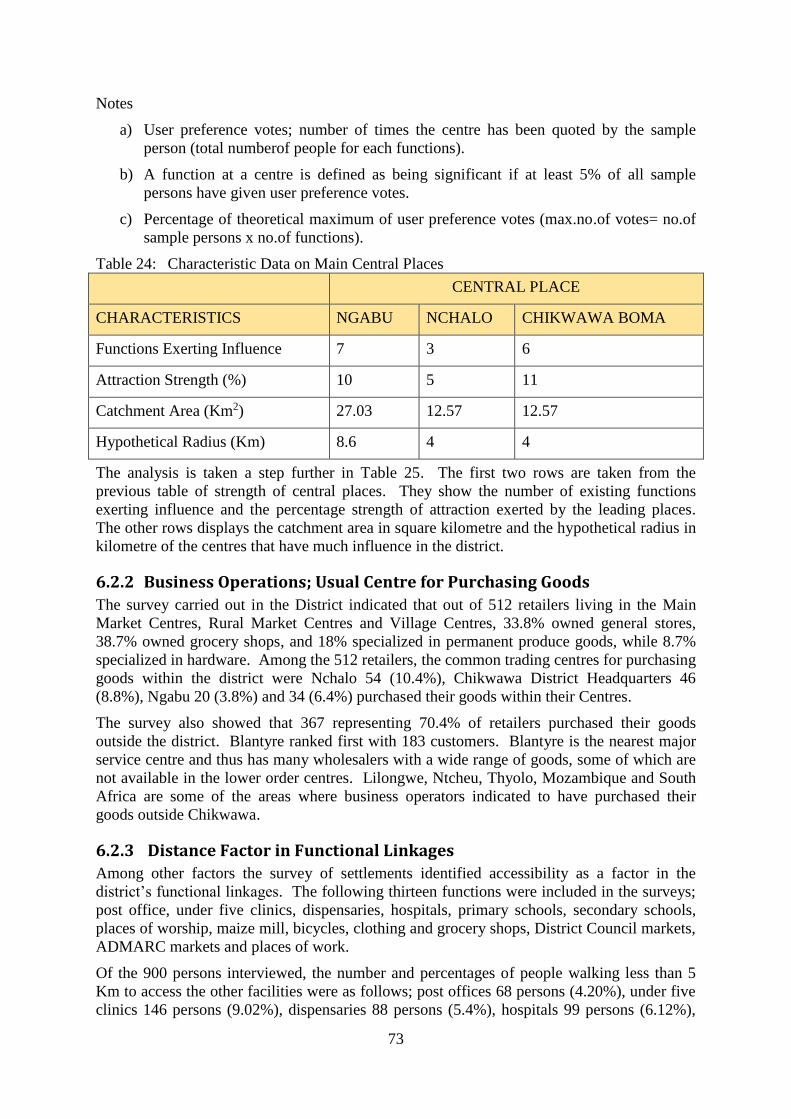
73
Notes
a) User preference votes; number of times the centre has been quoted by the sample
person (total numberof people for each functions).
b) A function at a centre is defined as being significant if at least 5% of all sample
persons have given user preference votes.
c) Percentage of theoretical maximum of user preference votes (max.no.of votes= no.of
sample persons x no.of functions).
Table 24: Characteristic Data on Main Central Places
CENTRAL PLACE
CHARACTERISTICS NGABU NCHALO CHIKWAWA BOMA
Functions Exerting Influence 7 3 6
Attraction Strength (%) 10 5 11
Catchment Area (Km2) 27.03 12.57 12.57
Hypothetical Radius (Km) 8.6 4 4
The analysis is taken a step further in Table 25. The first two rows are taken from the
previous table of strength of central places. They show the number of existing functions
exerting influence and the percentage strength of attraction exerted by the leading places.
The other rows displays the catchment area in square kilometre and the hypothetical radius in
kilometre of the centres that have much influence in the district.
6.2.2 Business Operations; Usual Centre for Purchasing Goods
The survey carried out in the District indicated that out of 512 retailers living in the Main
Market Centres, Rural Market Centres and Village Centres, 33.8% owned general stores,
38.7% owned grocery shops, and 18% specialized in permanent produce goods, while 8.7%
specialized in hardware. Among the 512 retailers, the common trading centres for purchasing
goods within the district were Nchalo 54 (10.4%), Chikwawa District Headquarters 46
(8.8%), Ngabu 20 (3.8%) and 34 (6.4%) purchased their goods within their Centres.
The survey also showed that 367 representing 70.4% of retailers purchased their goods
outside the district. Blantyre ranked first with 183 customers. Blantyre is the nearest major
service centre and thus has many wholesalers with a wide range of goods, some of which are
not available in the lower order centres. Lilongwe, Ntcheu, Thyolo, Mozambique and South
Africa are some of the areas where business operators indicated to have purchased their
goods outside Chikwawa.
6.2.3 Distance Factor in Functional Linkages
Among other factors the survey of settlements identified accessibility as a factor in the
district’s functional linkages. The following thirteen functions were included in the surveys;
post office, under five clinics, dispensaries, hospitals, primary schools, secondary schools,
places of worship, maize mill, bicycles, clothing and grocery shops, District Council markets,
ADMARC markets and places of work.
Of the 900 persons interviewed, the number and percentages of people walking less than 5
Km to access the other facilities were as follows; post offices 68 persons (4.20%), under five
clinics 146 persons (9.02%), dispensaries 88 persons (5.4%), hospitals 99 persons (6.12%),

CHIKWAWA DISTRICT PHYSICAL DEVELOPMENT PLAN
74
primary schools 179 persons (11.06%), secondary schools 97 persons (6%), places of
worship 186 persons (11.5%), District Council markets 110 persons (6.8%), maize mill 189
persons (11.68%), bicycle 85 persons (5.25%), clothing and grocery 159 persons (9.83%),
ADMARC 96 persons (5.93%), place of work 116 persons (7.17%).
6.2.4 Major Issues on Inter-settlement Linkages
Some of the major issues that have been identified from the analysis to be considered in the
formulation of the Plan are;
i. Poor inter-settlement linkages due to bad roads especially during rainy season
ii. There is a marked low level of services/facilities at most existing centres
iii. There is complete lack of certain services and facilities in most centres
iv. There is lack of spatially balanced pattern of service centres which can maximize the
provision of good and services
v. Most centres lack public utilities such as public toilets, water, electricity, skips and
proper dumping sites for refuse.
vi. Almost all centres have developed in a haphazard manner
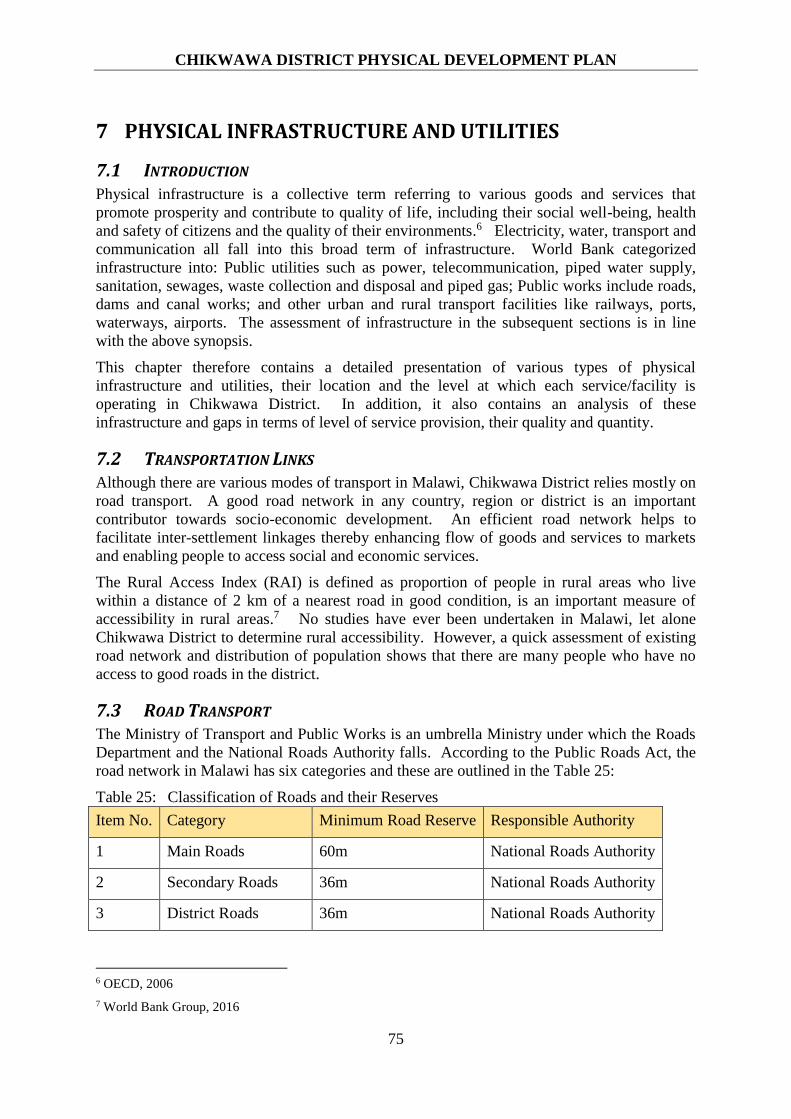
CHIKWAWA DISTRICT PHYSICAL DEVELOPMENT PLAN
75
7 PHYSICAL INFRASTRUCTURE AND UTILITIES
7.1 INTRODUCTION Physical infrastructure is a collective term referring to various goods and services that
promote prosperity and contribute to quality of life, including their social well-being, health
and safety of citizens and the quality of their environments.6 Electricity, water, transport and
communication all fall into this broad term of infrastructure. World Bank categorized
infrastructure into: Public utilities such as power, telecommunication, piped water supply,
sanitation, sewages, waste collection and disposal and piped gas; Public works include roads,
dams and canal works; and other urban and rural transport facilities like railways, ports,
waterways, airports. The assessment of infrastructure in the subsequent sections is in line
with the above synopsis.
This chapter therefore contains a detailed presentation of various types of physical
infrastructure and utilities, their location and the level at which each service/facility is
operating in Chikwawa District. In addition, it also contains an analysis of these
infrastructure and gaps in terms of level of service provision, their quality and quantity.
7.2 TRANSPORTATION LINKS Although there are various modes of transport in Malawi, Chikwawa District relies mostly on
road transport. A good road network in any country, region or district is an important
contributor towards socio-economic development. An efficient road network helps to
facilitate inter-settlement linkages thereby enhancing flow of goods and services to markets
and enabling people to access social and economic services.
The Rural Access Index (RAI) is defined as proportion of people in rural areas who live
within a distance of 2 km of a nearest road in good condition, is an important measure of
accessibility in rural areas.7 No studies have ever been undertaken in Malawi, let alone
Chikwawa District to determine rural accessibility. However, a quick assessment of existing
road network and distribution of population shows that there are many people who have no
access to good roads in the district.
7.3 ROAD TRANSPORT The Ministry of Transport and Public Works is an umbrella Ministry under which the Roads
Department and the National Roads Authority falls. According to the Public Roads Act, the
road network in Malawi has six categories and these are outlined in the Table 25:
Table 25: Classification of Roads and their Reserves
Item No. Category Minimum Road Reserve Responsible Authority
1 Main Roads 60m National Roads Authority
2 Secondary Roads 36m National Roads Authority
3 District Roads 36m National Roads Authority
6 OECD, 2006
7 World Bank Group, 2016

CHIKWAWA DISTRICT PHYSICAL DEVELOPMENT PLAN
76
Item No. Category Minimum Road Reserve Responsible Authority
4 Tertiary Roads 36m District Council
5 Branch/Feeder Roads 18m District Council
6 Estate Roads 12m District Council
Source: National Roads Authority
The Roads Authority (RA) is a quasi-public body established under the Act of Parliament and
it is responsible for managing public roads on behalf of the Controller of Roads. Its principal
mandate is to ensure that all public roads are constructed, maintained and rehabilitated at all
times.8 The Roads Fund Administration (RFA), also a quasi – public body is mandated to
mobilize, administer and account for funds for construction, maintenance and rehabilitation
of all public roads. Chikwawa District Council therefore only undertakes road works under
the direct supervision of the above bodies. Individual large scale land owners such as Illovo
and the wildlife reserves are responsible for constructing and maintaining the internal road
network within their properties.
Figure 26 below depicts a simplified institutional structure for the road sector in Malawi and
Figure 27 is a map showing the existing major roads in Chikwawa.
Figure 26: Institutional Framework for Road Sector
8 Malawi Government, 2006
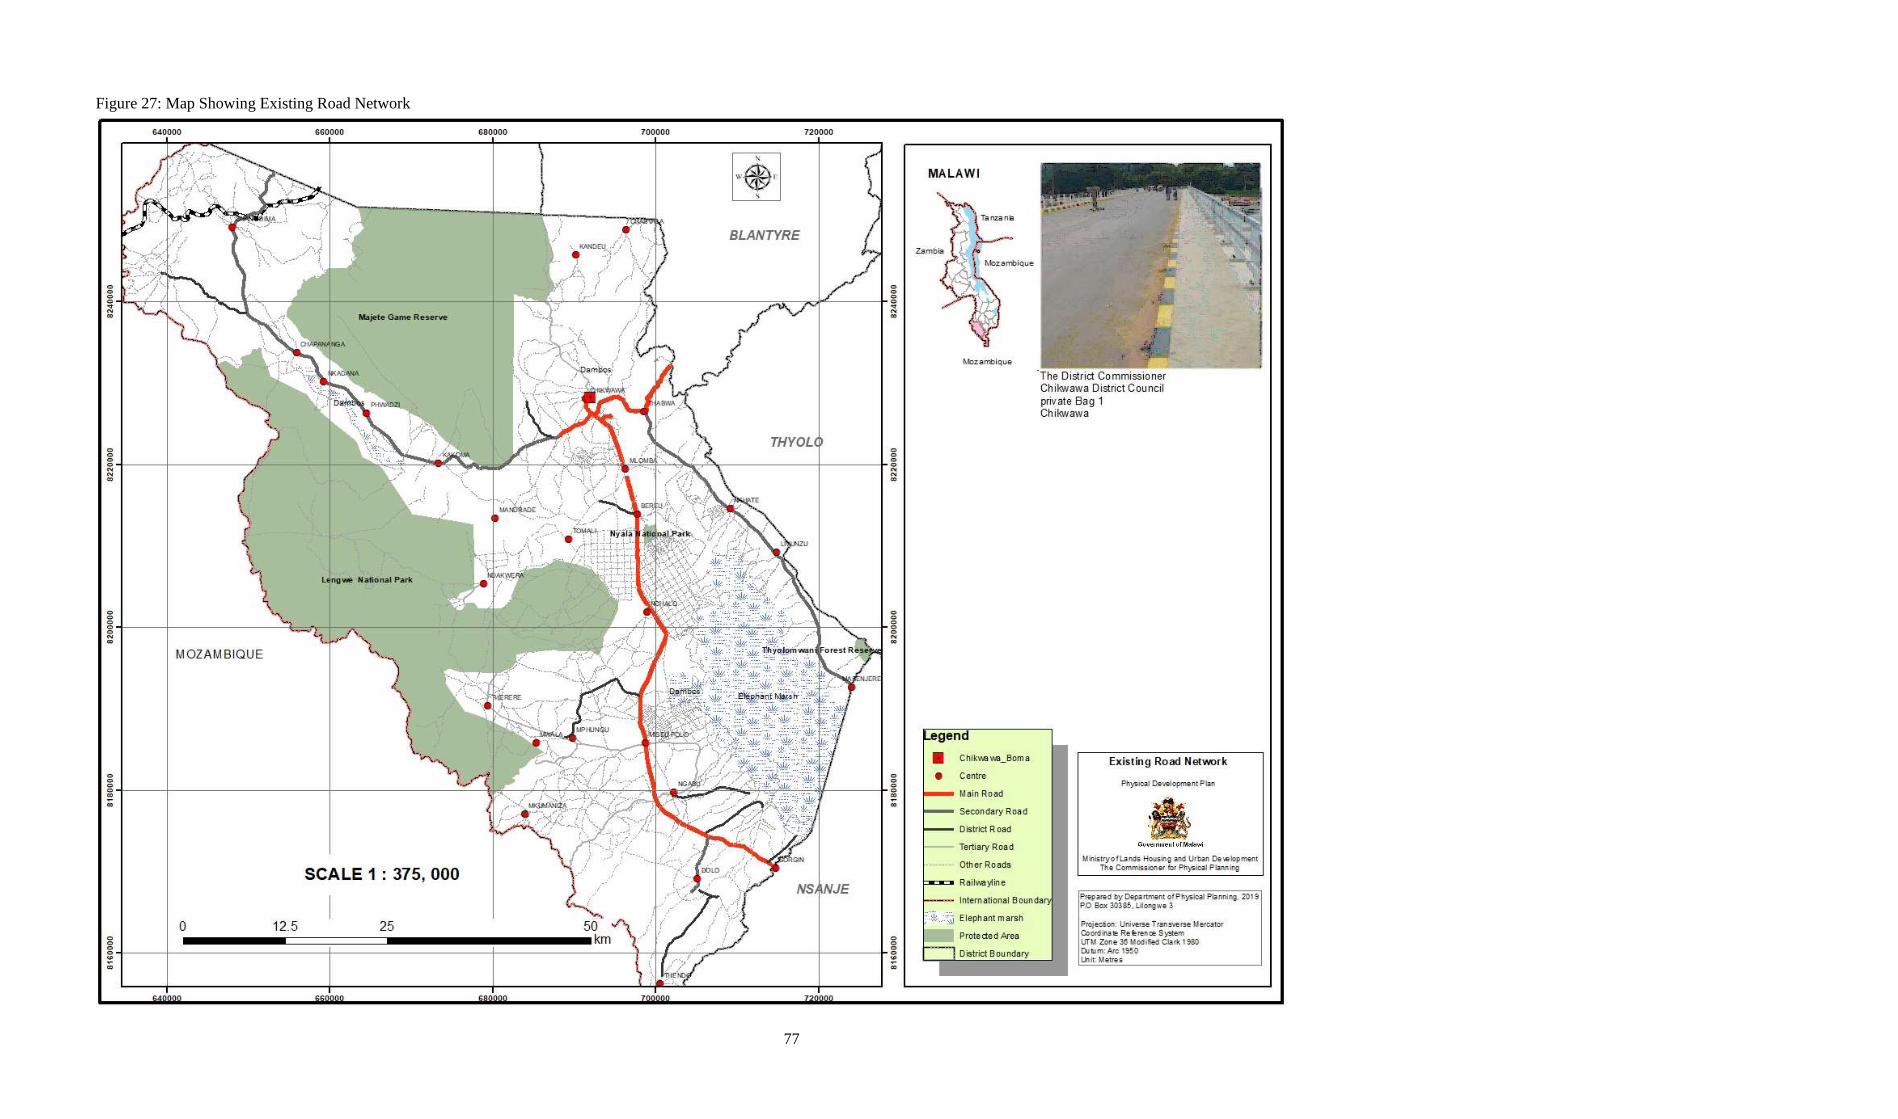
77
Figure 27: Map Showing Existing Road Network
78
7.3.1 Existing Road Network
The existing road network for Chikwawa District according to the Draft Socio – Economic
Profile, 2017 has 5 categories of roads. The categories and their descriptions are given
below:
a) Main Roads: These are main trunk roads joining district/main market centres and
regional/sub-regional centres. They also serve as international corridors
b) Secondary Roads: These are roads branching from main roads. They link main
centres of population and production and connecting to the main road network
c) District Roads: These are roads branching from secondary roads and/or main roads.
They link local centres of population and developed areas with the principal arterial
road system
d) Tertiary Roads: Roads outside cities or towns unilaterally designated by Government
linking collector roads to arterial roads accommodating the shorter trips and feeding
the arterial road network
e) Feeder Roads: These are roads branching from or leading to district roads
The main road (M1) is approximately 91.8 km from Madziabango to Sorgin and is of
bitumen surface. There are only two secondary roads with a combined length of 115 km.
The total distance for all district roads, which are 10 in total, is 137.5 km. Both the secondary
and district roads are earth surfaced. Total length of all the four existing tertiary roads is
approximately 93.4 km. In addition, there are 49 undetermined/feeder roads in the district
which are also earth surfaced and have a combined distance of 2,218.5 km. The total
distance for all designated roads is 438 km, occupying approximately 1,795 ha of land. In
terms of condition, the Socio-Economic Profile emphasized the roads’ accessibility during
the wet season only. As shown in Table 26, the eastern bank is completely cut off during
heavy rains as witnessed during the March 2019 flooding. Therefore, linkage between the
east bank and west bank and other parts of the region is greatly limited during the wet season.
A field visit carried out in March 2019 during the socio-economic and geospatial survey
showed that even with four wheel utility vehicles, some rivers could not be crossed. Table 26
contains a network of major roads in the district and gives a picture of their condition
especially during the wet season.
Lack of bridges along Mwanza River is a huge barrier to linkage between communities on
both sides especially during the rainy season as seen above. Specifically, access to services
such as District Hospital, Kakoma Health Centre and various secondary schools is always a
challenge for communities on the west side of Mwanza River. Figure 28 shows the washed
away bridge on Mwanza River between Tomali and Mlomba and the challenges communities
face to cross during the rainy season. More details on this challenge is highlighted in the
respective Group Village Land Use Plans for the impact areas under the Shire Valley
Transformation Programme.

CHIKWAWA DISTRICT PHYSICAL DEVELOPMENT PLAN
79
Figure 28: Washed away bridge on Mwanza River
Source: Physical Planning Department 2019

80
Table 26: Network of Major Existing Roads in Chikwawa
Road Class
And
Number
Road Name
Estimated
Distance
(Km)
Surface Finish Road Condition
Description
Rehabilitation Plans
Current Future
M1 Madziabango- Sorgin 91.8 Bitumen Cut by flood water but
passable through
diversion
Maintenance yearly Not known
S152 Thabwa –Masenjere 49 Under construction Not passable, affected
by floods
Under construction Under construction
S136 Chikwawa - Chapananga 71 Being Upgraded from
Earth to Bitumen
Passable Construction of
Chapananga bridge
Construction still on-
going
D383 Chafudzika- Chikuse 18 Earth Under maintenance Re-shaping Not known
D136 Miseu 4 – Nsomo -
Ngabu
15 Earth Irish bridge on
Namikalango River
destroyed
None Not known
D383 Nsangwe- Masanduko 12 Earth Irish Bridge destroyed Re-shape Provision of a drift
D390 Sorgin- Nkhwangwa 21 Earth Passable Addition of a km Re-shape
(Roads authority)
D135 Tsapa –Pende 10 Earth Passable Maintenance Under
Community Clubs
Re-shape under DC
D389 Thudzu-
Mwanawanjovu
9 Earth 5km passable Under maintenance On-going (Passable part
under community clubs
and
impassable part through
contractor)
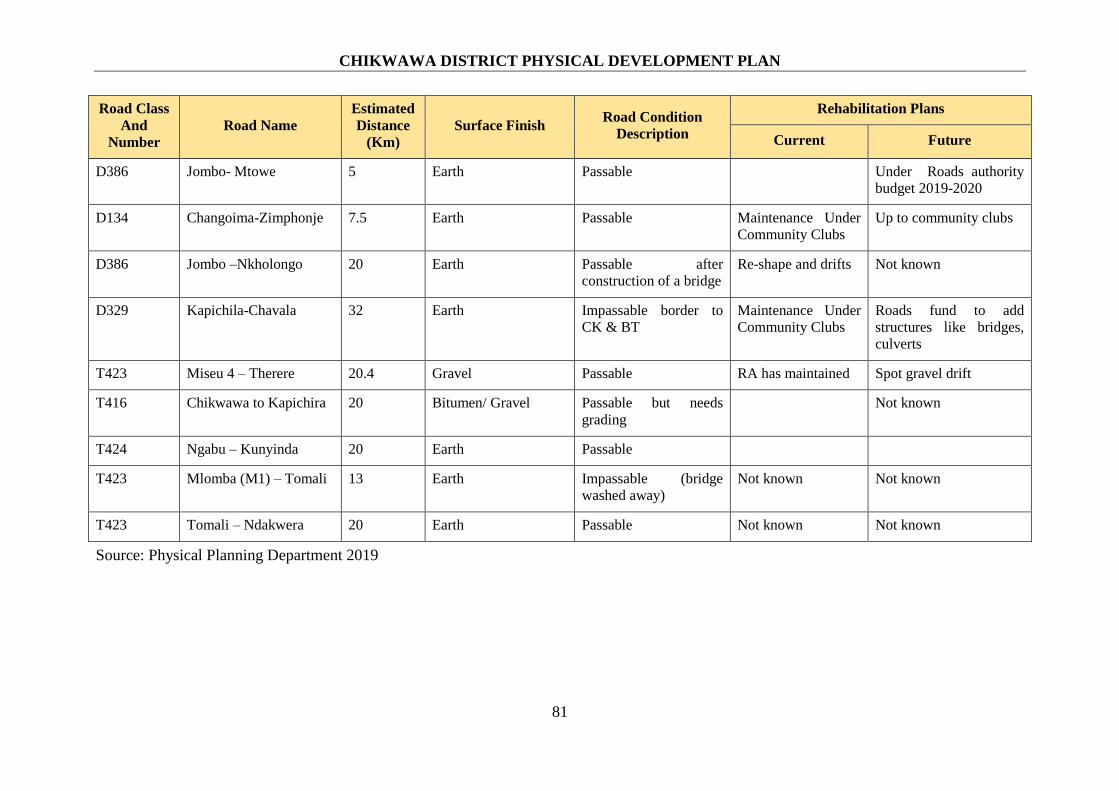
CHIKWAWA DISTRICT PHYSICAL DEVELOPMENT PLAN
81
Road Class
And
Number
Road Name
Estimated
Distance
(Km)
Surface Finish Road Condition
Description
Rehabilitation Plans
Current Future
D386 Jombo- Mtowe 5 Earth Passable Under Roads authority
budget 2019-2020
D134 Changoima-Zimphonje 7.5 Earth Passable Maintenance Under
Community Clubs
Up to community clubs
D386 Jombo –Nkholongo 20 Earth Passable after
construction of a bridge
Re-shape and drifts Not known
D329 Kapichila-Chavala 32 Earth Impassable border to
CK & BT
Maintenance Under
Community Clubs
Roads fund to add
structures like bridges,
culverts
T423 Miseu 4 – Therere 20.4 Gravel Passable RA has maintained Spot gravel drift
T416 Chikwawa to Kapichira 20 Bitumen/ Gravel Passable but needs
grading
Not known
T424 Ngabu – Kunyinda 20 Earth Passable
T423 Mlomba (M1) – Tomali 13 Earth Impassable (bridge
washed away)
Not known Not known
T423 Tomali – Ndakwera 20 Earth Passable Not known Not known
Source: Physical Planning Department 2019
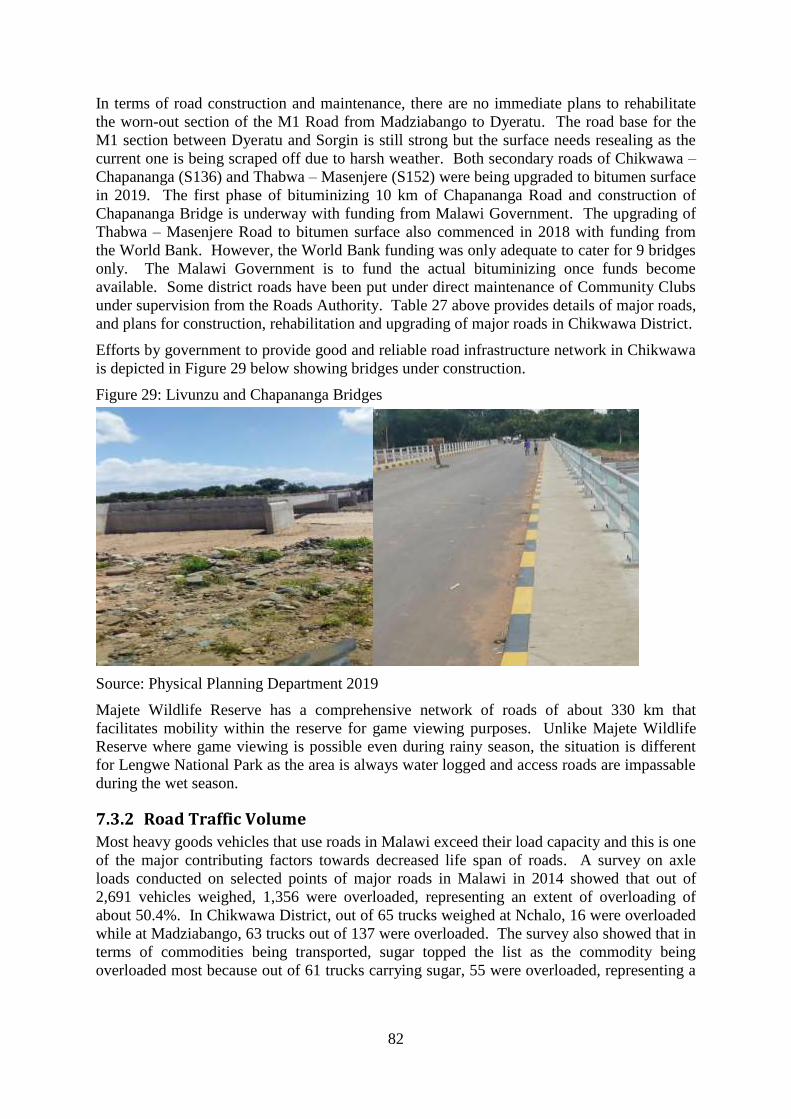
82
In terms of road construction and maintenance, there are no immediate plans to rehabilitate
the worn-out section of the M1 Road from Madziabango to Dyeratu. The road base for the
M1 section between Dyeratu and Sorgin is still strong but the surface needs resealing as the
current one is being scraped off due to harsh weather. Both secondary roads of Chikwawa –
Chapananga (S136) and Thabwa – Masenjere (S152) were being upgraded to bitumen surface
in 2019. The first phase of bituminizing 10 km of Chapananga Road and construction of
Chapananga Bridge is underway with funding from Malawi Government. The upgrading of
Thabwa – Masenjere Road to bitumen surface also commenced in 2018 with funding from
the World Bank. However, the World Bank funding was only adequate to cater for 9 bridges
only. The Malawi Government is to fund the actual bituminizing once funds become
available. Some district roads have been put under direct maintenance of Community Clubs
under supervision from the Roads Authority. Table 27 above provides details of major roads,
and plans for construction, rehabilitation and upgrading of major roads in Chikwawa District.
Efforts by government to provide good and reliable road infrastructure network in Chikwawa
is depicted in Figure 29 below showing bridges under construction.
Figure 29: Livunzu and Chapananga Bridges
Source: Physical Planning Department 2019
Majete Wildlife Reserve has a comprehensive network of roads of about 330 km that
facilitates mobility within the reserve for game viewing purposes. Unlike Majete Wildlife
Reserve where game viewing is possible even during rainy season, the situation is different
for Lengwe National Park as the area is always water logged and access roads are impassable
during the wet season.
7.3.2 Road Traffic Volume
Most heavy goods vehicles that use roads in Malawi exceed their load capacity and this is one
of the major contributing factors towards decreased life span of roads. A survey on axle
loads conducted on selected points of major roads in Malawi in 2014 showed that out of
2,691 vehicles weighed, 1,356 were overloaded, representing an extent of overloading of
about 50.4%. In Chikwawa District, out of 65 trucks weighed at Nchalo, 16 were overloaded
while at Madziabango, 63 trucks out of 137 were overloaded. The survey also showed that in
terms of commodities being transported, sugar topped the list as the commodity being
overloaded most because out of 61 trucks carrying sugar, 55 were overloaded, representing a
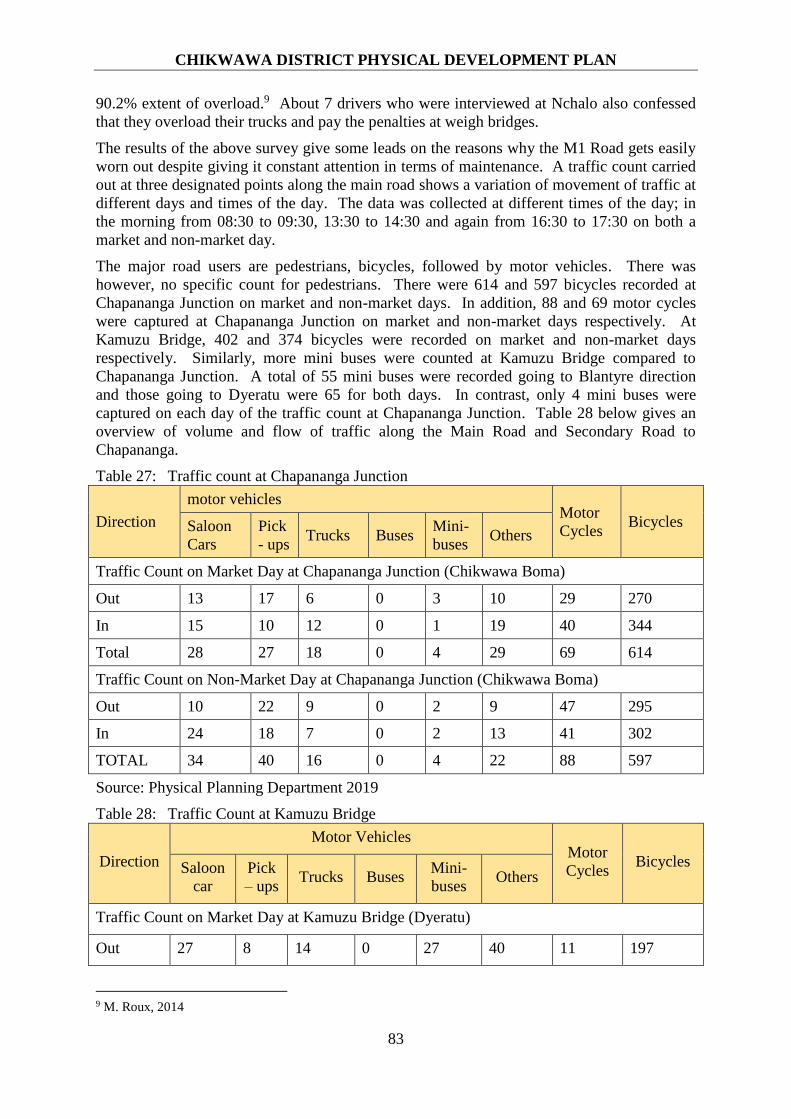
CHIKWAWA DISTRICT PHYSICAL DEVELOPMENT PLAN
83
90.2% extent of overload.9 About 7 drivers who were interviewed at Nchalo also confessed
that they overload their trucks and pay the penalties at weigh bridges.
The results of the above survey give some leads on the reasons why the M1 Road gets easily
worn out despite giving it constant attention in terms of maintenance. A traffic count carried
out at three designated points along the main road shows a variation of movement of traffic at
different days and times of the day. The data was collected at different times of the day; in
the morning from 08:30 to 09:30, 13:30 to 14:30 and again from 16:30 to 17:30 on both a
market and non-market day.
The major road users are pedestrians, bicycles, followed by motor vehicles. There was
however, no specific count for pedestrians. There were 614 and 597 bicycles recorded at
Chapananga Junction on market and non-market days. In addition, 88 and 69 motor cycles
were captured at Chapananga Junction on market and non-market days respectively. At
Kamuzu Bridge, 402 and 374 bicycles were recorded on market and non-market days
respectively. Similarly, more mini buses were counted at Kamuzu Bridge compared to
Chapananga Junction. A total of 55 mini buses were recorded going to Blantyre direction
and those going to Dyeratu were 65 for both days. In contrast, only 4 mini buses were
captured on each day of the traffic count at Chapananga Junction. Table 28 below gives an
overview of volume and flow of traffic along the Main Road and Secondary Road to
Chapananga.
Table 27: Traffic count at Chapananga Junction
Direction
motor vehicles Motor
Cycles Bicycles Saloon
Cars
Pick
- ups Trucks Buses
Mini-
buses Others
Traffic Count on Market Day at Chapananga Junction (Chikwawa Boma)
Out 13 17 6 0 3 10 29 270
In 15 10 12 0 1 19 40 344
Total 28 27 18 0 4 29 69 614
Traffic Count on Non-Market Day at Chapananga Junction (Chikwawa Boma)
Out 10 22 9 0 2 9 47 295
In 24 18 7 0 2 13 41 302
TOTAL 34 40 16 0 4 22 88 597
Source: Physical Planning Department 2019
Table 28: Traffic Count at Kamuzu Bridge
Direction
Motor Vehicles Motor
Cycles Bicycles Saloon
car
Pick
– ups Trucks Buses
Mini-
buses Others
Traffic Count on Market Day at Kamuzu Bridge (Dyeratu)
Out 27 8 14 0 27 40 11 197
9 M. Roux, 2014
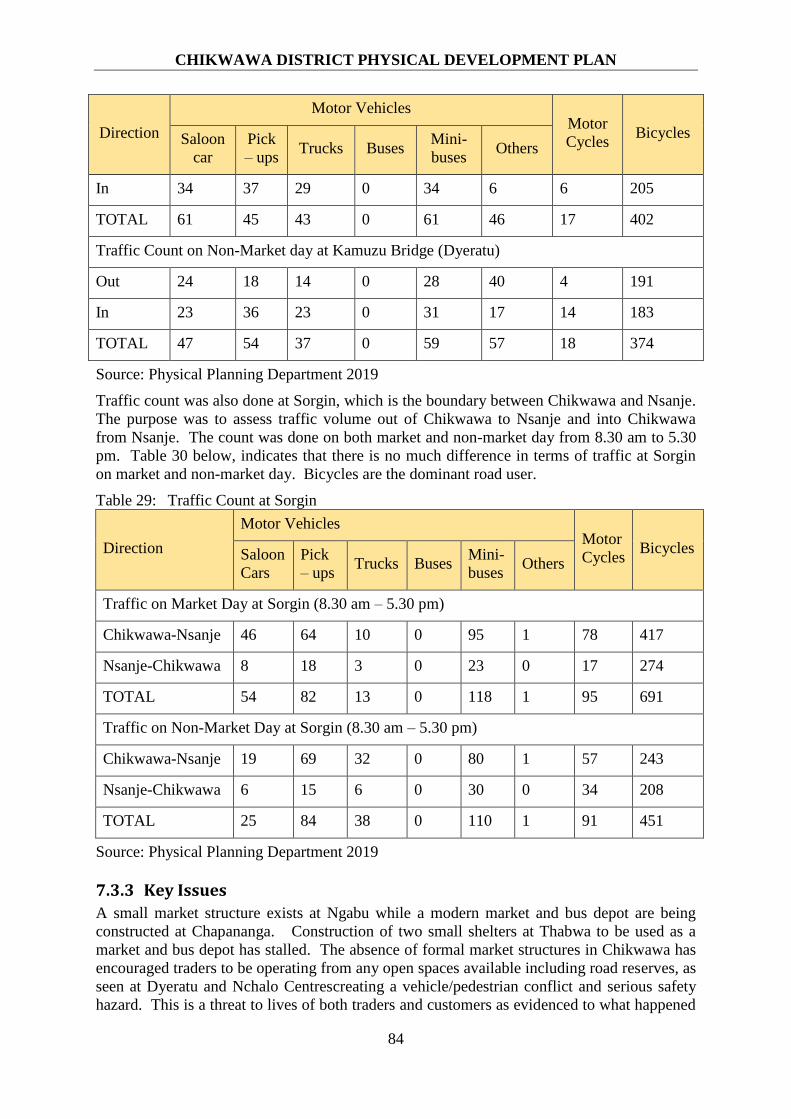
CHIKWAWA DISTRICT PHYSICAL DEVELOPMENT PLAN
84
Direction
Motor Vehicles Motor
Cycles Bicycles Saloon
car
Pick
– ups Trucks Buses
Mini-
buses Others
In 34 37 29 0 34 6 6 205
TOTAL 61 45 43 0 61 46 17 402
Traffic Count on Non-Market day at Kamuzu Bridge (Dyeratu)
Out 24 18 14 0 28 40 4 191
In 23 36 23 0 31 17 14 183
TOTAL 47 54 37 0 59 57 18 374
Source: Physical Planning Department 2019
Traffic count was also done at Sorgin, which is the boundary between Chikwawa and Nsanje.
The purpose was to assess traffic volume out of Chikwawa to Nsanje and into Chikwawa
from Nsanje. The count was done on both market and non-market day from 8.30 am to 5.30
pm. Table 30 below, indicates that there is no much difference in terms of traffic at Sorgin
on market and non-market day. Bicycles are the dominant road user.
Table 29: Traffic Count at Sorgin
Direction
Motor Vehicles Motor
Cycles Bicycles Saloon
Cars
Pick
– ups Trucks Buses
Mini-
buses Others
Traffic on Market Day at Sorgin (8.30 am – 5.30 pm)
Chikwawa-Nsanje 46 64 10 0 95 1 78 417
Nsanje-Chikwawa 8 18 3 0 23 0 17 274
TOTAL 54 82 13 0 118 1 95 691
Traffic on Non-Market Day at Sorgin (8.30 am – 5.30 pm)
Chikwawa-Nsanje 19 69 32 0 80 1 57 243
Nsanje-Chikwawa 6 15 6 0 30 0 34 208
TOTAL 25 84 38 0 110 1 91 451
Source: Physical Planning Department 2019
7.3.3 Key Issues
A small market structure exists at Ngabu while a modern market and bus depot are being
constructed at Chapananga. Construction of two small shelters at Thabwa to be used as a
market and bus depot has stalled. The absence of formal market structures in Chikwawa has
encouraged traders to be operating from any open spaces available including road reserves, as
seen at Dyeratu and Nchalo Centrescreating a vehicle/pedestrian conflict and serious safety
hazard. This is a threat to lives of both traders and customers as evidenced to what happened
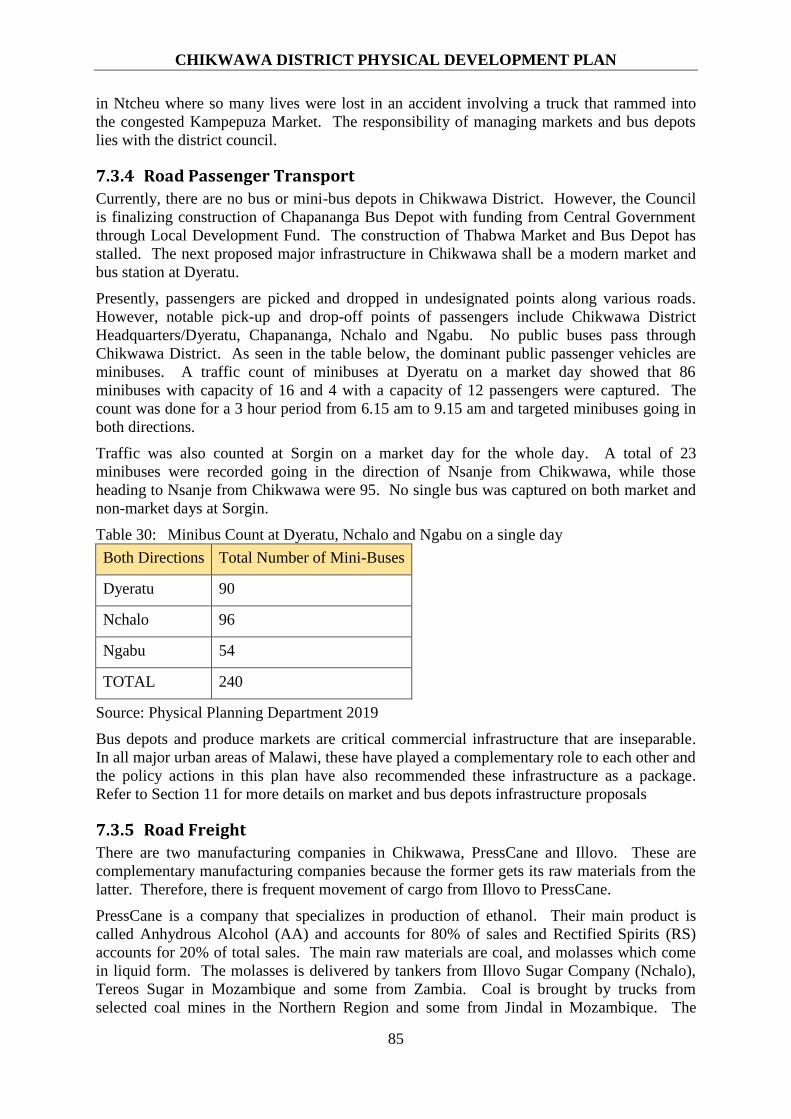
CHIKWAWA DISTRICT PHYSICAL DEVELOPMENT PLAN
85
in Ntcheu where so many lives were lost in an accident involving a truck that rammed into
the congested Kampepuza Market. The responsibility of managing markets and bus depots
lies with the district council.
7.3.4 Road Passenger Transport
Currently, there are no bus or mini-bus depots in Chikwawa District. However, the Council
is finalizing construction of Chapananga Bus Depot with funding from Central Government
through Local Development Fund. The construction of Thabwa Market and Bus Depot has
stalled. The next proposed major infrastructure in Chikwawa shall be a modern market and
bus station at Dyeratu.
Presently, passengers are picked and dropped in undesignated points along various roads.
However, notable pick-up and drop-off points of passengers include Chikwawa District
Headquarters/Dyeratu, Chapananga, Nchalo and Ngabu. No public buses pass through
Chikwawa District. As seen in the table below, the dominant public passenger vehicles are
minibuses. A traffic count of minibuses at Dyeratu on a market day showed that 86
minibuses with capacity of 16 and 4 with a capacity of 12 passengers were captured. The
count was done for a 3 hour period from 6.15 am to 9.15 am and targeted minibuses going in
both directions.
Traffic was also counted at Sorgin on a market day for the whole day. A total of 23
minibuses were recorded going in the direction of Nsanje from Chikwawa, while those
heading to Nsanje from Chikwawa were 95. No single bus was captured on both market and
non-market days at Sorgin.
Table 30: Minibus Count at Dyeratu, Nchalo and Ngabu on a single day
Both Directions Total Number of Mini-Buses
Dyeratu 90
Nchalo 96
Ngabu 54
TOTAL 240
Source: Physical Planning Department 2019
Bus depots and produce markets are critical commercial infrastructure that are inseparable.
In all major urban areas of Malawi, these have played a complementary role to each other and
the policy actions in this plan have also recommended these infrastructure as a package.
Refer to Section 11 for more details on market and bus depots infrastructure proposals
7.3.5 Road Freight
There are two manufacturing companies in Chikwawa, PressCane and Illovo. These are
complementary manufacturing companies because the former gets its raw materials from the
latter. Therefore, there is frequent movement of cargo from Illovo to PressCane.
PressCane is a company that specializes in production of ethanol. Their main product is
called Anhydrous Alcohol (AA) and accounts for 80% of sales and Rectified Spirits (RS)
accounts for 20% of total sales. The main raw materials are coal, and molasses which come
in liquid form. The molasses is delivered by tankers from Illovo Sugar Company (Nchalo),
Tereos Sugar in Mozambique and some from Zambia. Coal is brought by trucks from
selected coal mines in the Northern Region and some from Jindal in Mozambique. The

CHIKWAWA DISTRICT PHYSICAL DEVELOPMENT PLAN
86
finished products such as the AA are collected by tankers to petroleum companies such as
Total Malawi and Puma Depots where they are blended with the fuel. RS is collected in
drums by individual customers. Table 32 below gives a picture of freight on Chikwawa Road
as captured at PressCane.
Table 31: Cargo in and Out of PressCane
PEAK OFF- PEAK
Trucks In 22 5
Trucks Out 22 5
Tonnage In 2000 500
Tonnage Out 2000 500
Source: Physical Planning Department 2019
Trucks wait for days before loading or off-loading cargo during peak or off-peak seasons. At
PressCane, peak season runs from May to November while off – peak season spans from
December to April. The main challenge faced by PressCane on road freight is congestion at
Dyeratu Trading Centre caused by minibuses, bicycles and taxis because of location of a bus
bay and the roadside market and also delays in customs clearance for international freight
which delays delivery of goods. Interviews with 7 truck drivers at separate occasions at
Nchalo revealed that they wait for an average of 2 to 3 days to load or off-load goods at
Illovo and most of the trucks are parked in front of the banking area, a situation that
inconveniences bank customers. The waiting period gets longer when trucks belonging to
powerful members of the society arrive for loading as they are given priority.
7.3.6 Key issues
The total length of all classified roads in Chikwawa is 2,656 km. The assessment of this road
network shows that the majority of the roads in Chikwawa are earth surfaced. The total road
length whose surface is bituminized is only about 109 km while the earth surfaced road
network is about 2,547 km. All earth surfaced roads are in poor condition in the wet season
and this renders movement of people and goods very difficult. An analysis of the spatial
distribution of settlements and network of roads shows that most communities are accessible
but the challenge is the tough climatic conditions associated with heavy rains over short
period of time which results in washing away of roads and bridges making most of the roads
impassable.
Some parts of the district are also inaccessible due to non-existence of feeder roads. There
are no bus depots in Chikwawa and only public passenger travel is through mini-buses.
Mini-buses pick passengers in undesignated points along all roads in the district. This causes
traffic chaos and safety concerns at all major urban centres of Ngabu, Nchalo and Dyeratu.
The situation is worse during market days at all these centres where there is pedestrian and
vehicle conflict.
7.4 RAILWAY TRANSPORT Haulage of cargo is arguably cheaper through railway transport than other transport modes.
Chikwawa District is partially connected to the country’s railway network. A railway line
passes through the north-western part of the district and it links two cities in Mozambique
(Tete and Nacala) through Malawi. It is located about 67km away from Chikwawa Boma.
The other nearest railway line to Chikwawa District is at Bangula in Nsanje, about 85 km
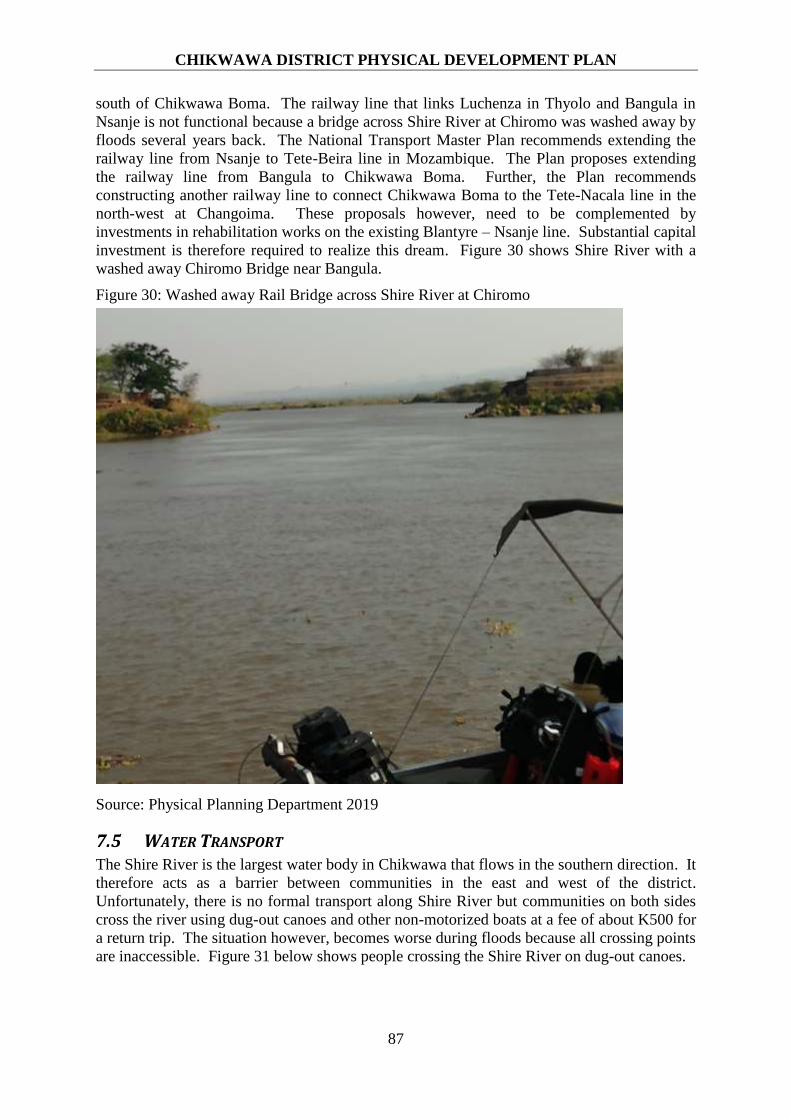
CHIKWAWA DISTRICT PHYSICAL DEVELOPMENT PLAN
87
south of Chikwawa Boma. The railway line that links Luchenza in Thyolo and Bangula in
Nsanje is not functional because a bridge across Shire River at Chiromo was washed away by
floods several years back. The National Transport Master Plan recommends extending the
railway line from Nsanje to Tete-Beira line in Mozambique. The Plan proposes extending
the railway line from Bangula to Chikwawa Boma. Further, the Plan recommends
constructing another railway line to connect Chikwawa Boma to the Tete-Nacala line in the
north-west at Changoima. These proposals however, need to be complemented by
investments in rehabilitation works on the existing Blantyre – Nsanje line. Substantial capital
investment is therefore required to realize this dream. Figure 30 shows Shire River with a
washed away Chiromo Bridge near Bangula.
Figure 30: Washed away Rail Bridge across Shire River at Chiromo
Source: Physical Planning Department 2019
7.5 WATER TRANSPORT The Shire River is the largest water body in Chikwawa that flows in the southern direction. It
therefore acts as a barrier between communities in the east and west of the district.
Unfortunately, there is no formal transport along Shire River but communities on both sides
cross the river using dug-out canoes and other non-motorized boats at a fee of about K500 for
a return trip. The situation however, becomes worse during floods because all crossing points
are inaccessible. Figure 31 below shows people crossing the Shire River on dug-out canoes.
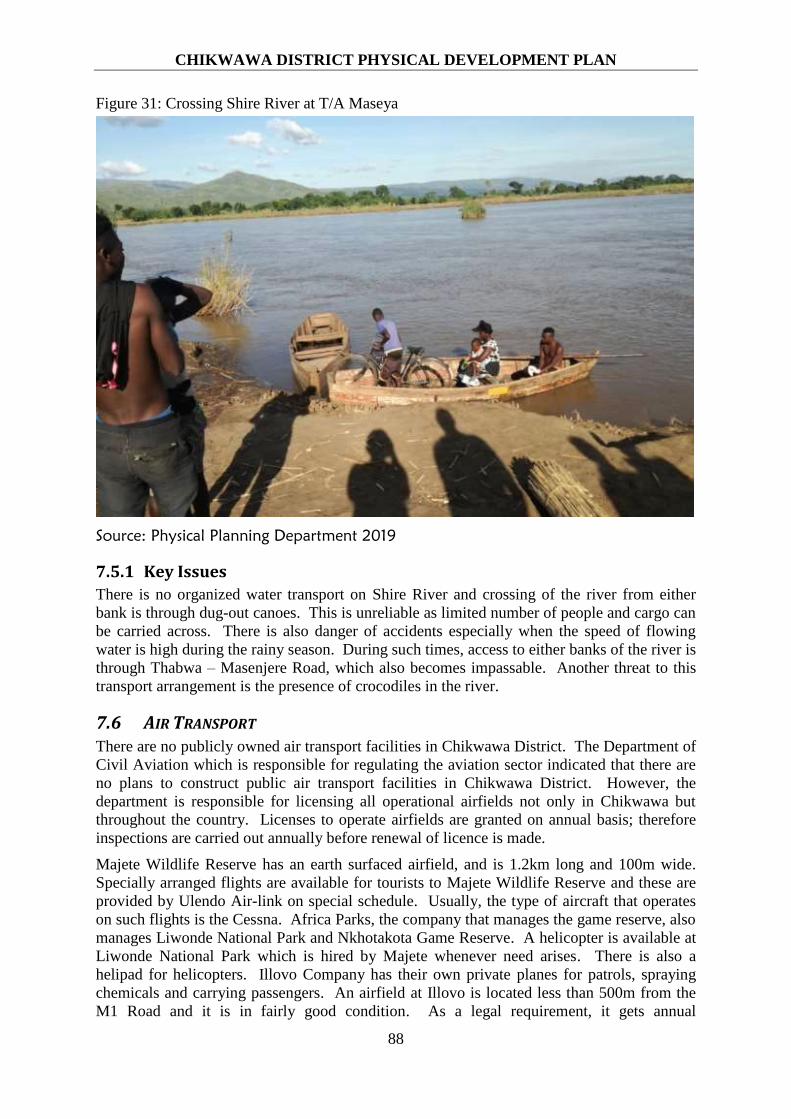
CHIKWAWA DISTRICT PHYSICAL DEVELOPMENT PLAN
88
Figure 31: Crossing Shire River at T/A Maseya
Source: Physical Planning Department 2019
7.5.1 Key Issues
There is no organized water transport on Shire River and crossing of the river from either
bank is through dug-out canoes. This is unreliable as limited number of people and cargo can
be carried across. There is also danger of accidents especially when the speed of flowing
water is high during the rainy season. During such times, access to either banks of the river is
through Thabwa – Masenjere Road, which also becomes impassable. Another threat to this
transport arrangement is the presence of crocodiles in the river.
7.6 AIR TRANSPORT There are no publicly owned air transport facilities in Chikwawa District. The Department of
Civil Aviation which is responsible for regulating the aviation sector indicated that there are
no plans to construct public air transport facilities in Chikwawa District. However, the
department is responsible for licensing all operational airfields not only in Chikwawa but
throughout the country. Licenses to operate airfields are granted on annual basis; therefore
inspections are carried out annually before renewal of licence is made.
Majete Wildlife Reserve has an earth surfaced airfield, and is 1.2km long and 100m wide.
Specially arranged flights are available for tourists to Majete Wildlife Reserve and these are
provided by Ulendo Air-link on special schedule. Usually, the type of aircraft that operates
on such flights is the Cessna. Africa Parks, the company that manages the game reserve, also
manages Liwonde National Park and Nkhotakota Game Reserve. A helicopter is available at
Liwonde National Park which is hired by Majete whenever need arises. There is also a
helipad for helicopters. Illovo Company has their own private planes for patrols, spraying
chemicals and carrying passengers. An airfield at Illovo is located less than 500m from the
M1 Road and it is in fairly good condition. As a legal requirement, it gets annual
CHIKWAWA DISTRICT PHYSICAL DEVELOPMENT PLAN
89
certification from the Department of Civil Aviation. The airfield is almost 140m wide and
1.25km long.
7.6.1 Key Issues
Formal air transport is non-existent in Chikwawa District. The private airdromes are
inaccessible to public aircrafts. The nearest airfield is Bangula in Nsanje District and it is
located 56.5 km from Nchalo and 85 km from Chikwawa District Headquarters.
7.7 MARKET INFRASTRUCTURE Chikwawa District does not have proper sites where small scale traders can carry out their
businesses. There are informal markets at all major trading centres in the district such as
Chikwawa Boma, Dyeratu, Nchalo, Ngabu, Thabwa, Nkhate, Livunzu and Masenjere. The
only standard market available in the district is at Chapananga, which was constructed under
the Rural Growth Centre Programme. At the time of study, the facility had not yet been fully
completed.
7.8 ENERGY SUPPLIES
7.8.1 Access to Electricity
In Malawi, use of electricity is very low especially in rural areas. Chikwawa District which is
predominantly rural in nature also has low connections to electricity. The 2008 population
and housing census indicated that only 0.9% had access to electricity for cooking and 3.7%
for lighting.10 The recent Integrated Household Survey of 2017 reported an improved access
to electricity for both Malawi as a whole at 10.7% and Chikwawa District in particular at
6.4%. This access to electricity is however predominantly from the national electricity grid.
Chikwawa District has also experienced an increase in off grid power generation, mainly
from solar.
7.8.2 Hydro-Electricity Supply
Most of the electricity in Malawi is generated from water. While the electricity sector
contributes significantly to the national economy, its access is very low. The rates of access
are particularly very low in rural areas compared to urban areas. All the hydro-electricity is
generated along Shire River, except for a smaller plant at Wovwe River in Karonga. Malawi
has a total installed capacity of about 406.6 MW, of which 128 MW is generated at Kapichira
Hydro Power Scheme, which is the only power generation plant located in Chikwawa
District. The total available power for Malawi is only 335 MW. Figure 32 shows the
Kapichira Power Plant, located north of Chikwawa Boma.
10 National Statistical Office, 2012

CHIKWAWA DISTRICT PHYSICAL DEVELOPMENT PLAN
90
Figure 32: Kapichira Hydro Power Scheme
Source: Physical Planning Department 2019
Chikwawa is supplied with hydro-electricity from Kapichira Scheme whose overall
production capacity is 128 megawatts. Kapichira which was commissioned in the year 2000,
is located about 22km north of Chikwawa District Headquarters and is bordered with Majete
Wildlife Reserve. While hydro-electricity is generated by a quasi-public company known as
Energy Generation Company (EGENCO), its transmission and distribution is done by
Electricity Supply Corporation of Malawi (ESCOM), another quasi-public company. In
Chikwawa District in particular, power transmission is done through a 132 kV power line and
capacity of transmission lines is 345.5 amps. Associated support facilities include
switchgear, substations, SCADA and metering equipment. Thereafter, power is distributed
through 33kv and 400 V power lines. (ESCOM, 2018). The major transmission power lines
in Chikwawa District comprises of 702 km of 33 kV line and 800 km of 400 kV.
Expansion of existing industries and establishment of other industries under the Malawi
Investment and Trade Centre, the Agriculture Commercialization Project and the Shire
Valley Transformation Project in Chikwawa District will result in an increase in electricity
needs. The Ministry of Energy and Mining should therefore carry out a preliminary
assessment of energy needs in the district and recommend ways of meeting such increased
demand. See Chapter 11 for details of the recommended actions.
In terms of consumption, the district’s average annual consumption is 4,146 amps which
supplies to about 4985 customers. Out of these, 4658 are domestic, 306 are commercial
while industrial consumers are 21 (Source: ESCOM Responses).
Figure 33 is a map showing network of major transmission and distribution power lines in
Chikwawa District.
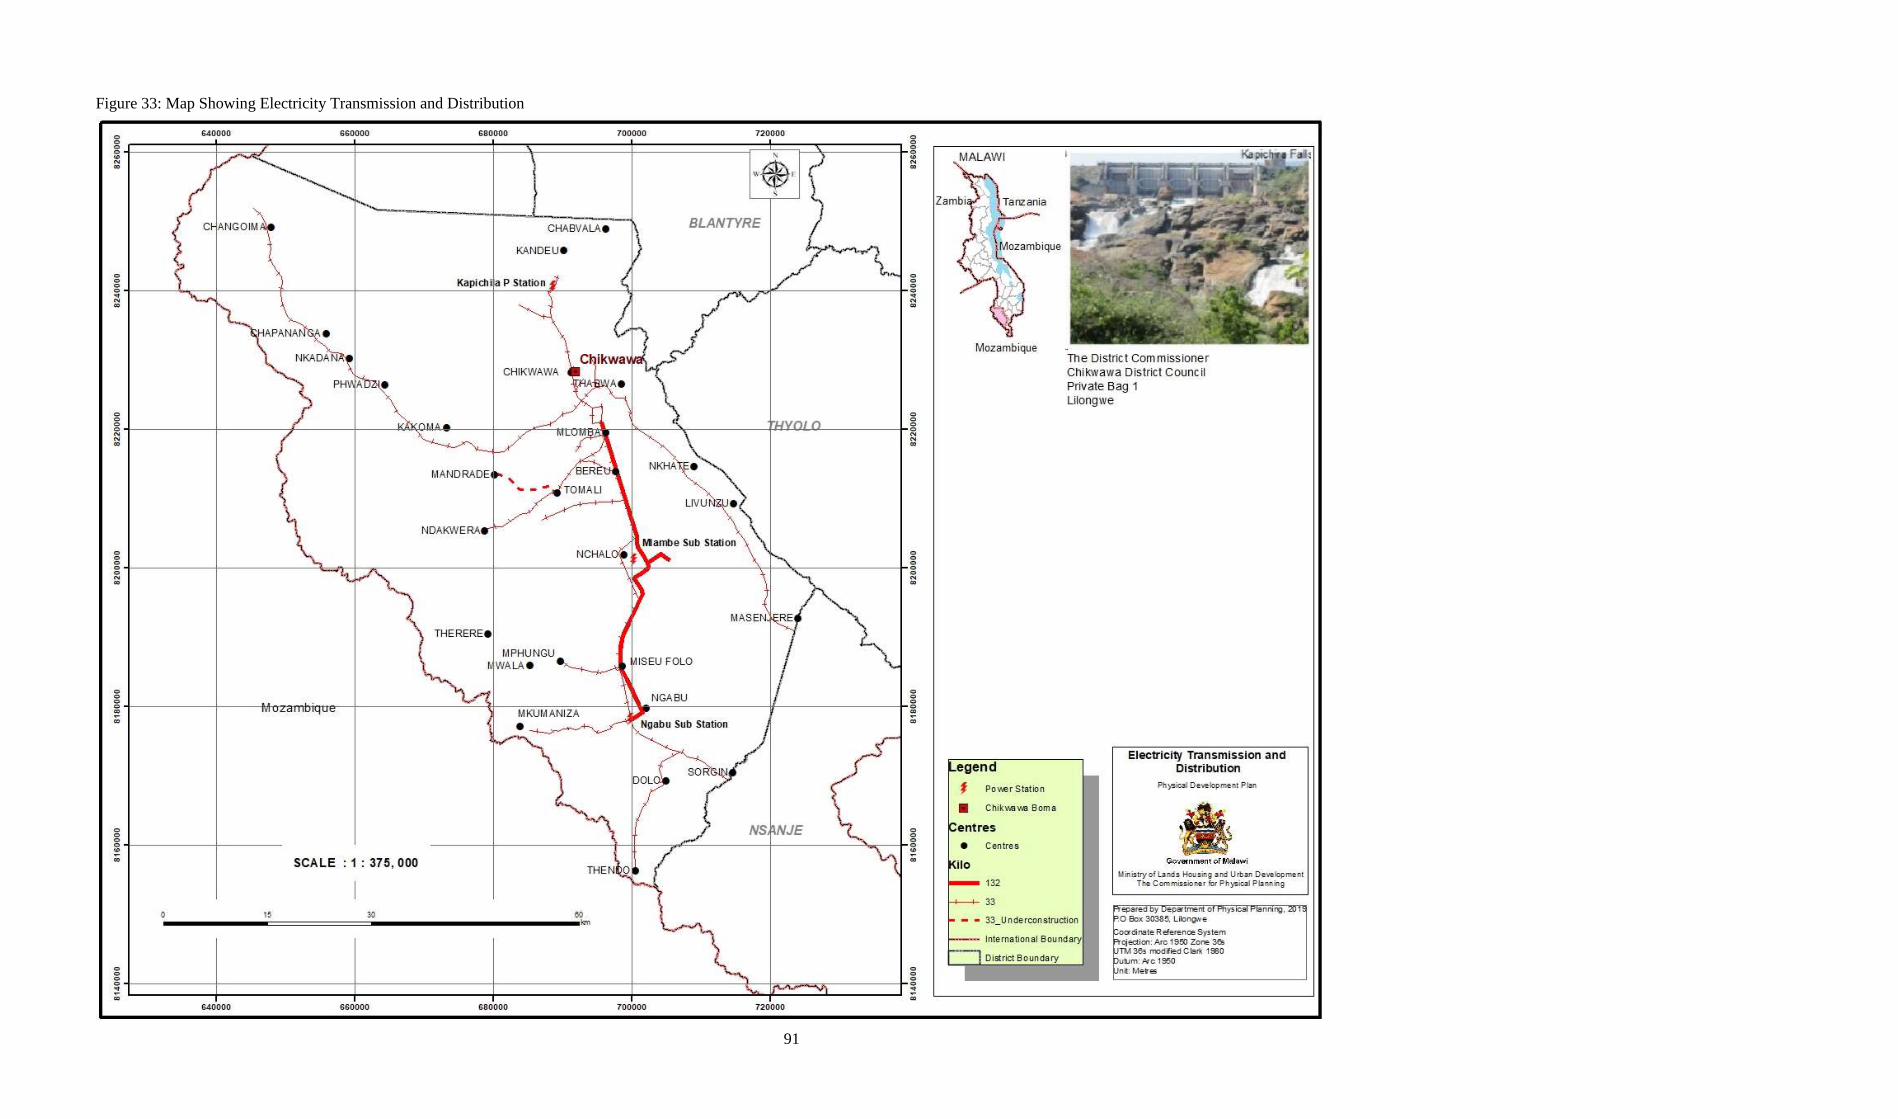
91
Figure 33: Map Showing Electricity Transmission and Distribution

92
7.8.3 Key Issues
Major problem associated with power supply in Chikwawa is the reliance on one 132kV
transmission line because once there is damage to this line, the whole of Chikwawa and
Nsanje have no supply. This happened during the recent floods of March 2019, when a
transmission line got damaged rendering the two districts of Chikwawa and Nsanje to have
no power. Another challenge is on encroachments into way leaves and vandalism to the
equipment. In some cases, wooded poles are not adequately and properly treated, thereby
easily getting attacked by termites. In terms of distribution, areas of concern are on use of
unqualified electrical contractors and also use of substandard electrical wiring materials.
The major challenge posed to hydro-electricity is over-reliance on one source of power
generation. Escom gets its power from Kapichira, which is on the Shire River. Any
disturbance to the flow of the river causes instability in power supply.
7.8.4 Off Grid Electricity
Sustainable Off-Grid Electrification of Rural Villages (SOGERV) is a project that involves
off-grid generation of electricity from solar energy and targeted four communities of
Mandrade, Kandeu, Gola and Thendo. The project was funded by the Scottish Government
through Strathclyde University, Glasgow in collaboration with WASHTED of Polytechnic
and Concern Universal of Malawi. Table 33 below gives details of the SOGERV power
projects in Chikwawa District.
Table 32: SORGERV Power Projects in Chikwawa District
Name of Project Traditional Authority Capacity (watts) Year Commissioned
Mandrade Ndakwera 3,700 2015
Kandeu Kasisi 3,540 2015
Thendo Masache 1,530 2017
Gola Chapananga 3,540 2017
Source: SOGERV, Policy Brief 2018
Figure 34: Thendo and Mandirade Solar Energy
Source: Physical Planning Department 2019
The project was designed to construct 4KW photovoltaic charge stations at each centre whose
electricity would be rented at a fee to small and medium entrepreneurs. By 2018, the
electricity was benefitting 10 businesses and 795 households. Separate systems were also
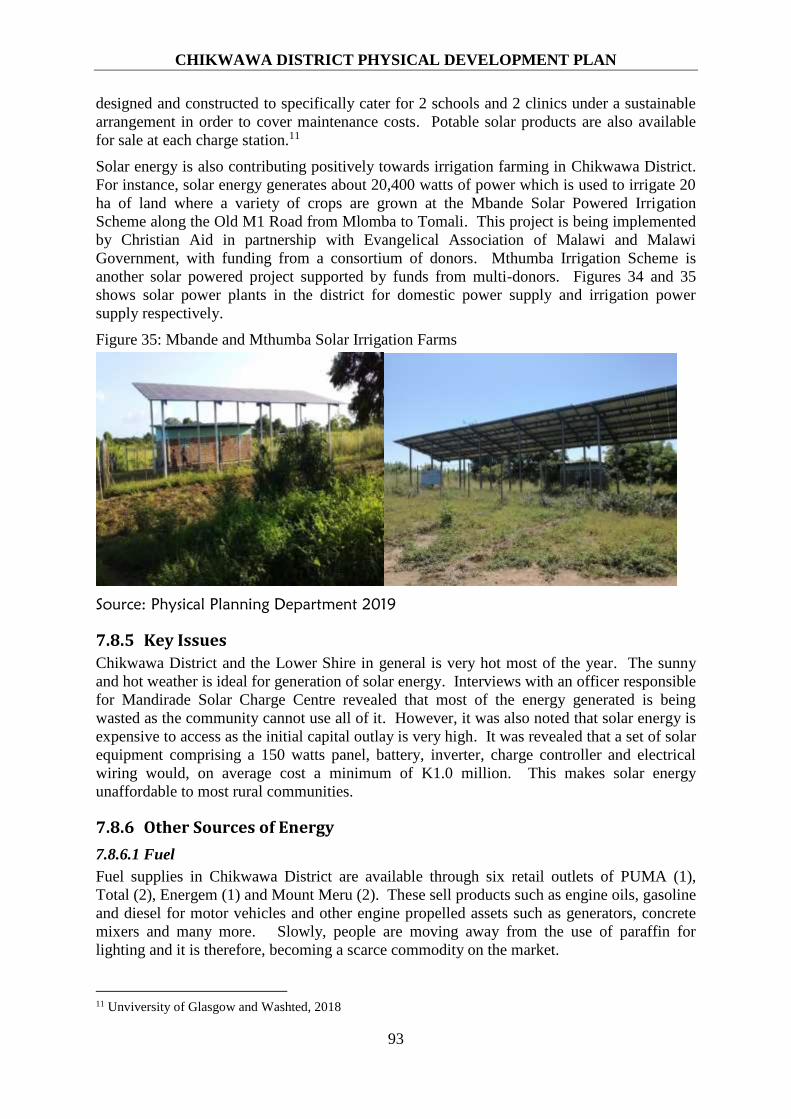
CHIKWAWA DISTRICT PHYSICAL DEVELOPMENT PLAN
93
designed and constructed to specifically cater for 2 schools and 2 clinics under a sustainable
arrangement in order to cover maintenance costs. Potable solar products are also available
for sale at each charge station.11
Solar energy is also contributing positively towards irrigation farming in Chikwawa District.
For instance, solar energy generates about 20,400 watts of power which is used to irrigate 20
ha of land where a variety of crops are grown at the Mbande Solar Powered Irrigation
Scheme along the Old M1 Road from Mlomba to Tomali. This project is being implemented
by Christian Aid in partnership with Evangelical Association of Malawi and Malawi
Government, with funding from a consortium of donors. Mthumba Irrigation Scheme is
another solar powered project supported by funds from multi-donors. Figures 34 and 35
shows solar power plants in the district for domestic power supply and irrigation power
supply respectively.
Figure 35: Mbande and Mthumba Solar Irrigation Farms
Source: Physical Planning Department 2019
7.8.5 Key Issues
Chikwawa District and the Lower Shire in general is very hot most of the year. The sunny
and hot weather is ideal for generation of solar energy. Interviews with an officer responsible
for Mandirade Solar Charge Centre revealed that most of the energy generated is being
wasted as the community cannot use all of it. However, it was also noted that solar energy is
expensive to access as the initial capital outlay is very high. It was revealed that a set of solar
equipment comprising a 150 watts panel, battery, inverter, charge controller and electrical
wiring would, on average cost a minimum of K1.0 million. This makes solar energy
unaffordable to most rural communities.
7.8.6 Other Sources of Energy
7.8.6.1 Fuel
Fuel supplies in Chikwawa District are available through six retail outlets of PUMA (1),
Total (2), Energem (1) and Mount Meru (2). These sell products such as engine oils, gasoline
and diesel for motor vehicles and other engine propelled assets such as generators, concrete
mixers and many more. Slowly, people are moving away from the use of paraffin for
lighting and it is therefore, becoming a scarce commodity on the market.
11 Unviversity of Glasgow and Washted, 2018

CHIKWAWA DISTRICT PHYSICAL DEVELOPMENT PLAN
94
7.8.6.2 Charcoal and Fuelwood
As seen in the 2016/17 Integrated Household Survey, about 85.8% and 13.6 % of the
population in Chikwawa were using firewood and charcoal respectively for cooking. Further,
81.6%, 6.8% and 5.9% were using torches (dry cell batteries), firewood and electricity for
lighting respectively.12 The results of this survey show that the majority of the population in
Chikwawa District are using firewood and charcoal to meet their energy needs for cooking.
The implication of these findings is seen in the rampant deforestation taking place in the
district.
7.8.7 Key Issues
Over reliance on fuelwood and charcoal for cooking is putting a strain on the district’s
forestry resources. The rate of forestry depletion is not matching with the rate of natural
resource regeneration and reforestation. Coupled with high population growth, the district is
losing forests at a fast rate. Strong measures shall be put in place to compensate for formal
loss of forest cover through Shire Valley Transformation Project implementation. In
addition, appropriate strategies have been recommended in subsequent sections.
7.9 WASTE MANAGEMENT
7.9.1 Solid Waste Management
Solid waste management is generally poor in Chikwawa District. According to the recent
Integrated Household Survey, none of the households were using rubbish bins, 50% had
access to rubbish pits, 15% were burning the waste while 30.7% had no any means of waste
disposal. The District Council does not provide waste collection services for households,
neither does it have a properly organized solid waste collection system and disposal facility.
Periodically, the council collects waste from markets using funds that it generates through
market fees. The council, however, is in the process of identifying a suitable site for solid
waste disposal. In the meantime there are people who request for the waste after it has been
collected to be used as manure in the fields/gardens. In other circumstances people get the
solid waste in order to fill up gullies since gullies are a big problem in Chikwawa.
Apart from solid waste generated by households and businesses especially in major urban
centres of Chikwawa, two companies, Illovo and PressCane also generate large quantities of
solid waste which needs appropriate and sustainable management.
PressCane generates about 1,500 tons of solid waste (Coal ash) per year. Some of the solid
waste is transported to Fombe dump site using tippers and some ash is used for production of
bricks. The main problems faced with solid waste include high costs of transporting the large
volume of waste, relatively small land size for the dump site and lack of best practices by the
community which leads to vandalism of the facility.
7.9.2 Liquid Waste Management
Chikwawa District has registered tremendous improvement in terms of access to modern
toilets facilities. The District Council with support from non-governmental organizations has
been working tirelessly to advocate for improved toilet facilities at household level,
community as well as in market places. This partnership has proved to be fruitful as more
people are now opting to build modern toilet facilities.
12 National Statistical Office, 2017

CHIKWAWA DISTRICT PHYSICAL DEVELOPMENT PLAN
95
The district does not have a centralized sewer system. Septic tanks are planned and
constructed at the household level by private developers. The council does not have a
disposal site for sewer waste. In situations where septic tanks are full, residents engage the
Blantyre City Council sewer collection vehicle to empty the tanks. In addition, individuals at
the household level are only encouraged to utilize the waste for other uses like manure.
However, in cases where waste is toxic and cannot be used, it is normally buried or left in
ponds to evaporate.
Both PressCane and Illovo also generate liquid waste. PressCane disposes all its liquid waste
at Lauji Pond, depicted in Figure 36. The waste is transported through pipes to the licenced
pond for evaporation. The disposal pond was once fenced but the fence has been vandalized.
The main challenges faced in liquid management include, vandalism of property supporting
the area, encroachment and general accumulation of waste. The liquid waste (vinasse) is
used as liquid fertilizer by Illovo. There is an opportunity for the community to use the same
in farming with appropriate support of agricultural extension, on the dosage rates.
Figure 36: PressCane Waste Dumping Ponds at Lauji
Source: Physical Planning Department 2019
7.9.3 Gaseous Waste Management
Gaseous waste produced at PressCane is released in the atmosphere without any form of
treatment. This is contributing to increased levels of air pollution around Chikwawa District
Headquarters. Carbon dioxide, a gaseous waste, is the main by-product in the production
process. However, the CO2 produced can be used in the manufacturing industry as part of
carbonated soft drinks as a form of best practice to manage the environment.
7.9.4 Key Issues
The issue of waste management is very critical in Chikwawa District. The Council does not
have any form of organized and systematic collection and disposal of waste. There is
generally indiscriminate dumping of waste throughout the district as evidenced in the
Integrated Household Survey of 2016/17. Industries also have their own challenges in
managing waste. Communities around Lauji liquid waste dump site are complaining about
the waste being dumped by PressCane. The strong odour coming from the oxidation ponds
as one passes through Dyeratu is evidence of the magnitude of the problem. Illovo did not
allow the planning team to interview them on how they manage their waste.

CHIKWAWA DISTRICT PHYSICAL DEVELOPMENT PLAN
96
7.10 WATER SUPPY
7.10.1 Access to Potable Water
A household is considered to have access to safe drinking water if the source of water is
piped into the dwelling house, piped into the yard or plot, a communal standpipe, a protected
well in a yard or plot, protected public well, borehole only in rural areas, tanker truck or
bowser and bottled water.13 National standards for access to safe and potable water are based
on the average population recommended to be served by a water supply facility. A
communal water tap is ideal for 120 people; a borehole serves a population of 250 while a
shallow well is recommended to cater for 100 people.
The 2008 population and housing census revealed that 75% of the population in Chikwawa
District had access to safe drinking water in dry season while the percentage for wet season
was 74%. Access to safe drinking water is estimated to have gone up to 86% in 2017 with
boreholes as the main water source.
Major urban centres in Chikwawa are connected to piped water supply under Southern
Region Water Board and privately owned Illovo. Access to piped water in urban centres is
quite high particularly at Chikwawa District Headquarters, Nchalo and Ngabu. The table
below shows urban water supply schemes and their capacity.
Table 33: Urban Water Supply Schemes and their Capacity
Name Of
Water Supply
Scheme
Type Condition Capacity
(M3)
No. Of
Customers
No. Of
Water
Kiosks
District
Headquarters
Piped with borehole as source Good 180 2046 21
Nchalo Piped with Borehole as source Good 108 1653 18
Ngabu Piped with Borehole as source Good 411 1268 42
TOTAL 699 4,967 81
Source: Physical Planning Department 2019
For all the urban water supply schemes, water is pumped from underground into tanks and all
of them are in good condition. The Southern Region Water Board indicated that there are no
immediate plans to construct new schemes or expand the existing ones. As it is shown, all
Water Board services are concentrated on the western bank of Shire River. The Southern
Region Water Board’s Chikwawa pumping station complements its power needs with solar
electricity as shown in Figure 37 below.
13 National Statistical Office, 2017

CHIKWAWA DISTRICT PHYSICAL DEVELOPMENT PLAN
97
Figure 37: Solar Water Pumping at Chikwawa Boma
Source: Physical Planning Department, 2019
7.10.2 Rural Piped Water Projects
Chikwawa District has 6 rural water supply schemes but only two are working at full
capacity, while the remaining four are partially working. Five of the water schemes are
gravity-fed while only one is motorized. As seen from data below, Mmbadzi Scheme had a
larger target population but only 97 taps were installed. However, 95% of the total taps are
working, an indication that the scheme is well managed. Chapananga on the other hand, has
a very high non-functional taps as only 60 are working against a total of 238. Chapananga
Water Scheme has two sites where water is treated/purified and stored, namely Jasi and
Makina.
Table 34: Rural Piped Water Projects
Name of
scheme
Target
Pop.
Actual
Pop.
Served
Total
Taps
Taps
Working
Taps
Not
Working
Functionality
Rate Type
Capacity
(litres)
Mapelera 5,725 5520 120 74 46 61% Gravity 112
Limphangwe 13,691 7200 72 60 12 83% Gravity 130
Livunzu 15,645 3960 75 33 42 44% Gravity 104
Mmbadzi 20,151 11040 97 92 5 95% Gravity 195
Chapananga 28,560 7200 238 60 178 25% Gravity
Source: Physical Planning Department 2019
Miseu 4 also has a Rural Water Supply Scheme and it covers a radius of 2.5km. The tank has
a capacity of 140m3 and water is pumped from two boreholes into the tank using a motorized
pump. The entire water scheme has 1 commercial customer, 2 institutional customers, 282
individual customers and 11 communal water points. The scheme is in good conditions such
that it has a 100% working rate. Plans are underway to expand the network to reach more
customers. Figure 38 shows Miseu Folo Water Supply Scheme.
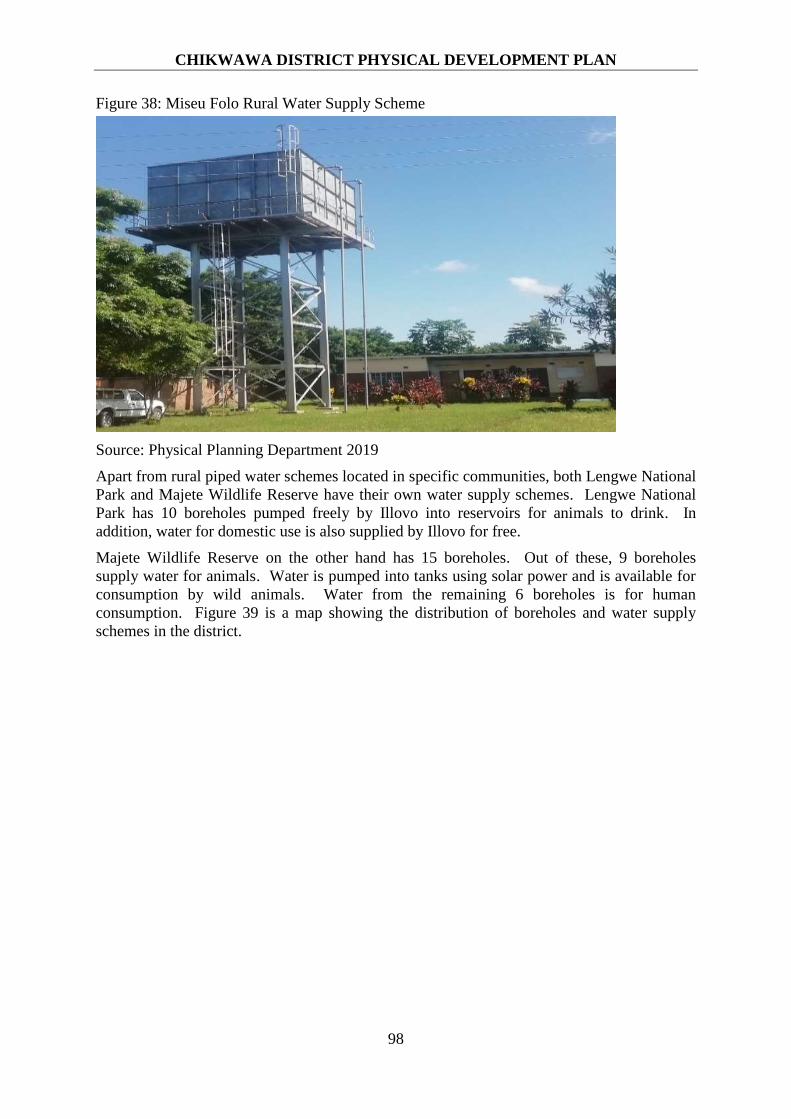
CHIKWAWA DISTRICT PHYSICAL DEVELOPMENT PLAN
98
Figure 38: Miseu Folo Rural Water Supply Scheme
Source: Physical Planning Department 2019
Apart from rural piped water schemes located in specific communities, both Lengwe National
Park and Majete Wildlife Reserve have their own water supply schemes. Lengwe National
Park has 10 boreholes pumped freely by Illovo into reservoirs for animals to drink. In
addition, water for domestic use is also supplied by Illovo for free.
Majete Wildlife Reserve on the other hand has 15 boreholes. Out of these, 9 boreholes
supply water for animals. Water is pumped into tanks using solar power and is available for
consumption by wild animals. Water from the remaining 6 boreholes is for human
consumption. Figure 39 is a map showing the distribution of boreholes and water supply
schemes in the district.
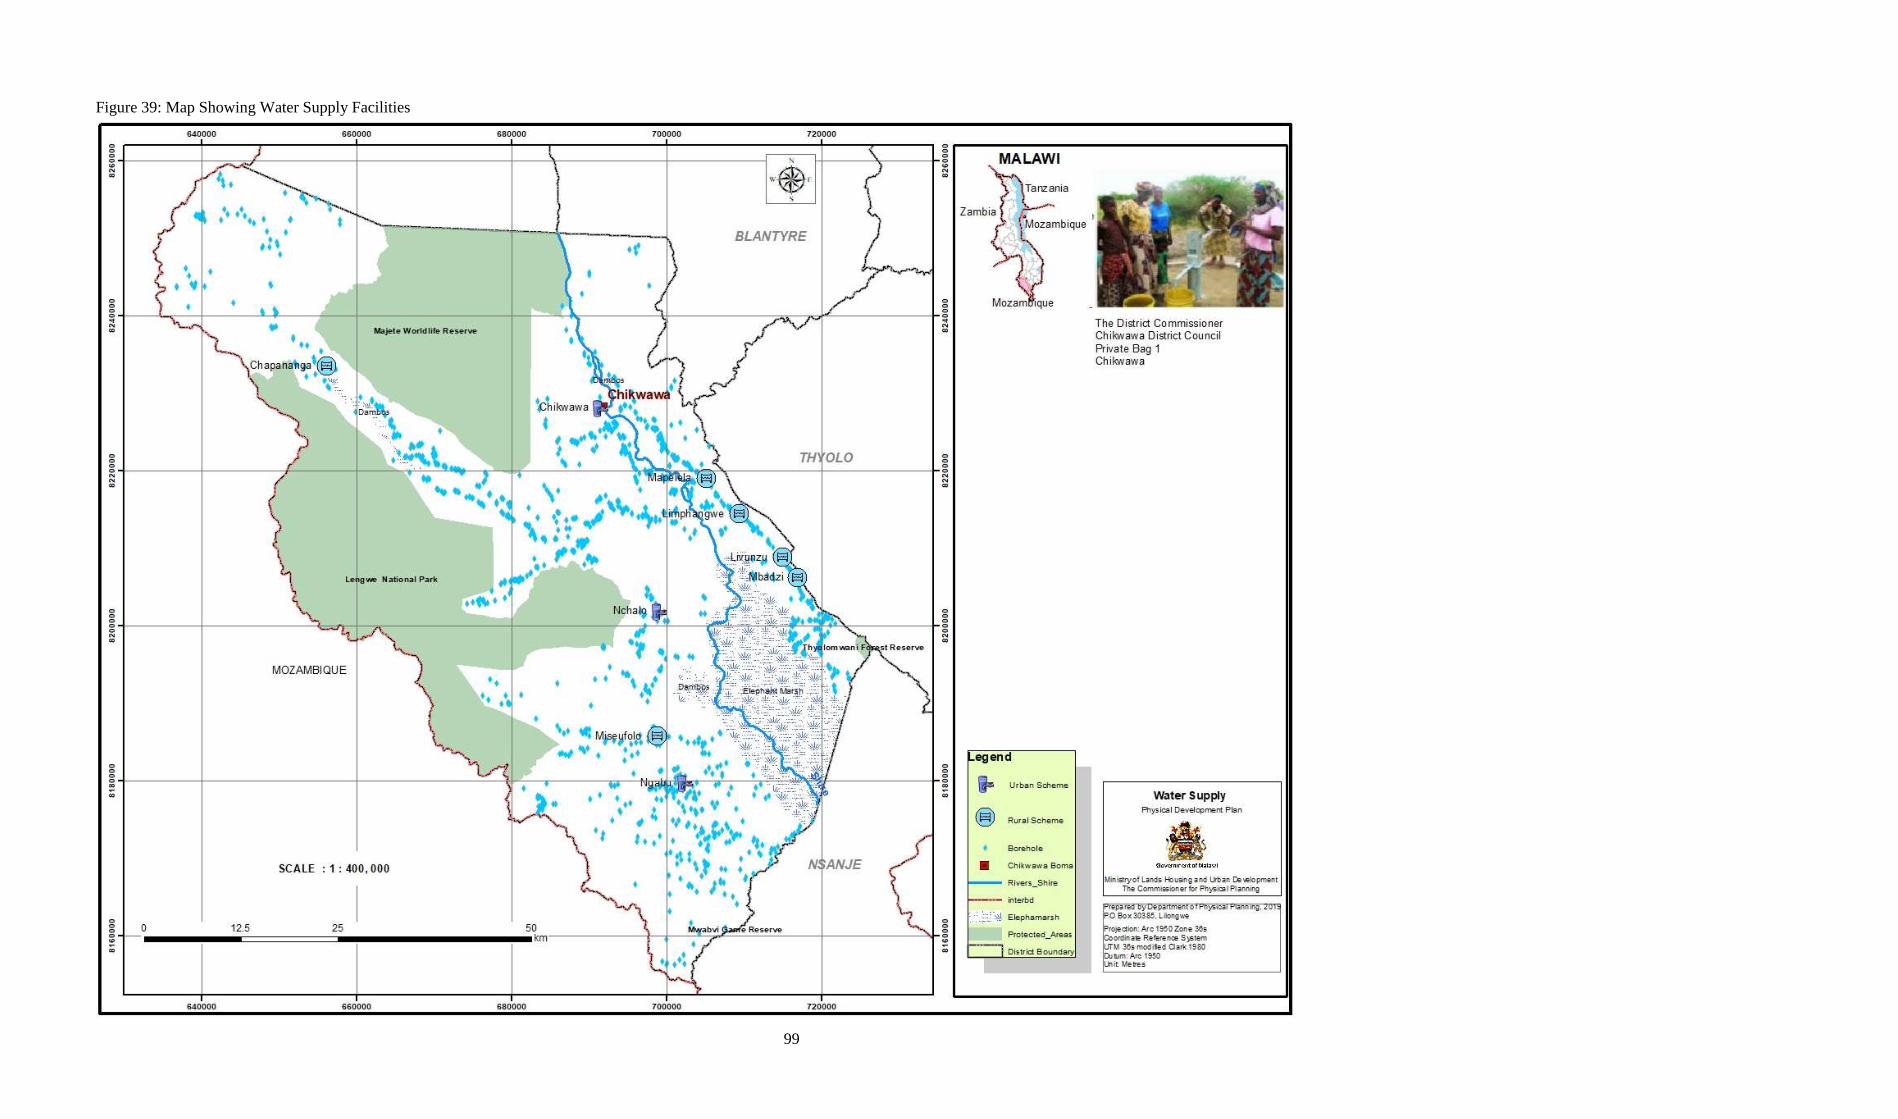
99
Figure 39: Map Showing Water Supply Facilities
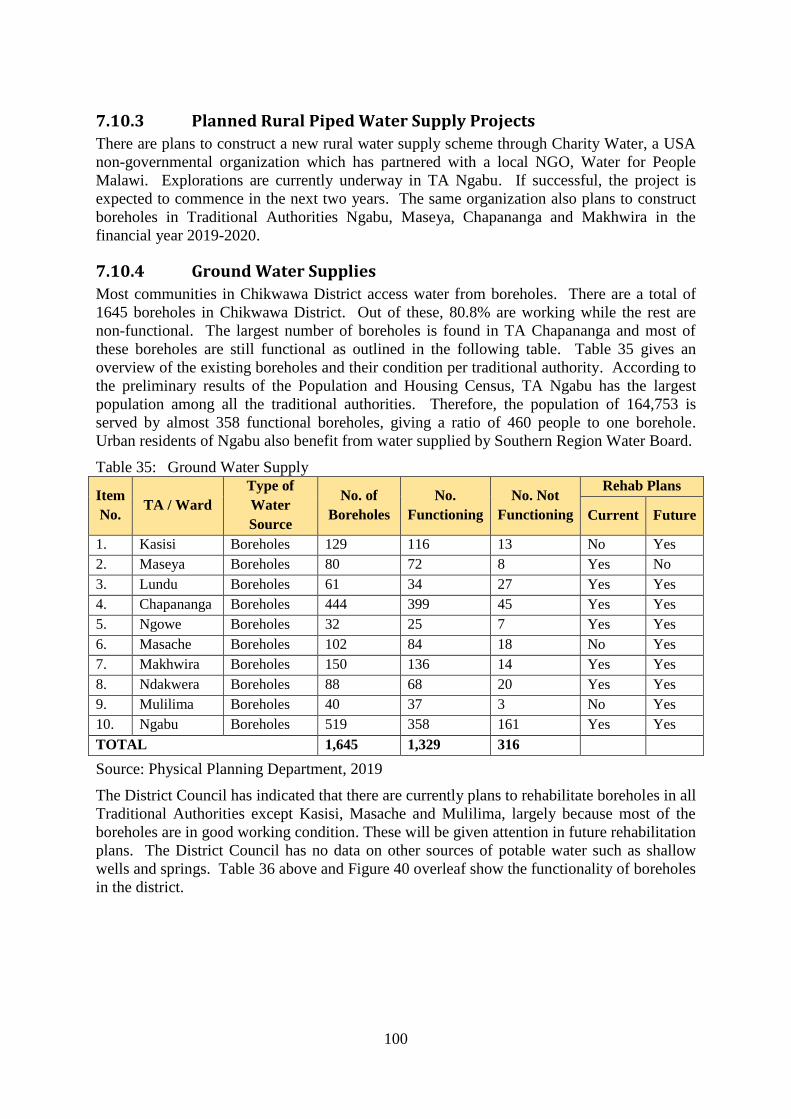
100
7.10.3 Planned Rural Piped Water Supply Projects
There are plans to construct a new rural water supply scheme through Charity Water, a USA
non-governmental organization which has partnered with a local NGO, Water for People
Malawi. Explorations are currently underway in TA Ngabu. If successful, the project is
expected to commence in the next two years. The same organization also plans to construct
boreholes in Traditional Authorities Ngabu, Maseya, Chapananga and Makhwira in the
financial year 2019-2020.
7.10.4 Ground Water Supplies
Most communities in Chikwawa District access water from boreholes. There are a total of
1645 boreholes in Chikwawa District. Out of these, 80.8% are working while the rest are
non-functional. The largest number of boreholes is found in TA Chapananga and most of
these boreholes are still functional as outlined in the following table. Table 35 gives an
overview of the existing boreholes and their condition per traditional authority. According to
the preliminary results of the Population and Housing Census, TA Ngabu has the largest
population among all the traditional authorities. Therefore, the population of 164,753 is
served by almost 358 functional boreholes, giving a ratio of 460 people to one borehole.
Urban residents of Ngabu also benefit from water supplied by Southern Region Water Board.
Table 35: Ground Water Supply
Item
No. TA / Ward
Type of
Water
Source
No. of
Boreholes
No.
Functioning
No. Not
Functioning
Rehab Plans
Current Future
1. Kasisi Boreholes 129 116 13 No Yes
2. Maseya Boreholes 80 72 8 Yes No
3. Lundu Boreholes 61 34 27 Yes Yes
4. Chapananga Boreholes 444 399 45 Yes Yes
5. Ngowe Boreholes 32 25 7 Yes Yes
6. Masache Boreholes 102 84 18 No Yes
7. Makhwira Boreholes 150 136 14 Yes Yes
8. Ndakwera Boreholes 88 68 20 Yes Yes
9. Mulilima Boreholes 40 37 3 No Yes
10. Ngabu Boreholes 519 358 161 Yes Yes
TOTAL 1,645 1,329 316
Source: Physical Planning Department, 2019
The District Council has indicated that there are currently plans to rehabilitate boreholes in all
Traditional Authorities except Kasisi, Masache and Mulilima, largely because most of the
boreholes are in good working condition. These will be given attention in future rehabilitation
plans. The District Council has no data on other sources of potable water such as shallow
wells and springs. Table 36 above and Figure 40 overleaf show the functionality of boreholes
in the district.

CHIKWAWA DISTRICT PHYSICAL DEVELOPMENT PLAN
101
Figure 40: Borehole Status by T/A
Source: Physical Planning Department 2019
7.10.5 Key Issues
The main problem in the water sector is that access to safe and potable water is still a
challenge in the district mostly because of unsustainable water sources, washed away
pipelines and non-functional boreholes. The Chapananga Rural Water Scheme had targeted a
population of 28,560 with 238 taps. The scheme is only 25% functional due to washing away
of pipes during rainy season and low water level at intake for Chapananga leading to supply
being restricted to about 4 months of the year (May to August). Similarly, Livunzu Water
Supply in the Eastern Bank is only 44% functional because of washed away pipes.
On boreholes, the main challenge is noted in TA Ngabu where only 69% are functional.
Ironically, TA Ngabu has the highest population in the district and this leaves a significant
population of the district without safe and potable water. The three TAs of Ngabu, Lundu
and Ngowe have a total population of 230,353 which is being served by 417 boreholes. On
average, 552 people are served by one functional borehole, which is way above the
recommended standard of 250 people per borehole. This puts a strain on the sustainability of
water supplies and durability of the boreholes. It should be noted that in some parts of
Paramount Chief Lundu and Traditional Authorities Ngabu, Ndakwera, Maseya and Katunga,
underground water is saline. Assessment of water from 4 boreholes at Ngabu was made.
Water from two boreholes located inside SOS School and Ngabu Secondary School was very
salty, the third one in the nearby settlement was moderately salty and the last one had lightly
salty water. A lot of resources are required to desalinize the water to make it safe and
potable. Therefore, investments in borehole drilling alone will not adequately address the
needs for potable water in the district. As such, the Department of Water Development has a
huge responsibility of ensuring that measures outlined in the policies/strategies are
implemented.
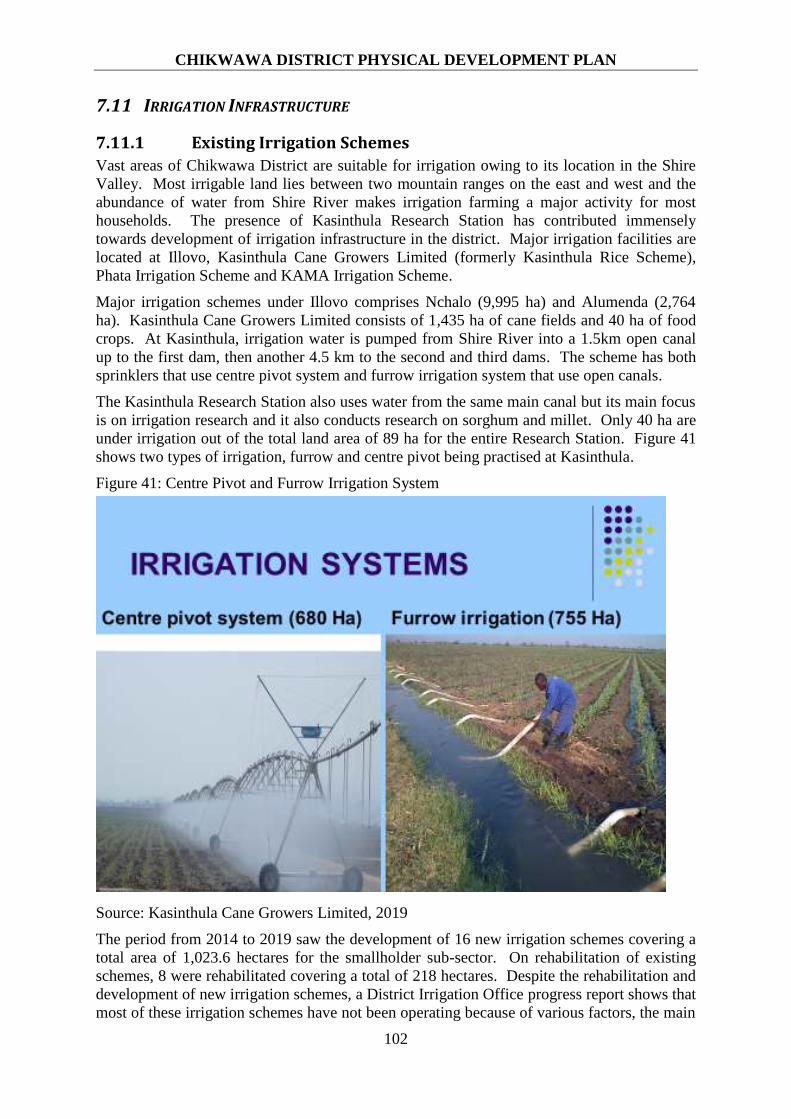
CHIKWAWA DISTRICT PHYSICAL DEVELOPMENT PLAN
102
7.11 IRRIGATION INFRASTRUCTURE
7.11.1 Existing Irrigation Schemes
Vast areas of Chikwawa District are suitable for irrigation owing to its location in the Shire
Valley. Most irrigable land lies between two mountain ranges on the east and west and the
abundance of water from Shire River makes irrigation farming a major activity for most
households. The presence of Kasinthula Research Station has contributed immensely
towards development of irrigation infrastructure in the district. Major irrigation facilities are
located at Illovo, Kasinthula Cane Growers Limited (formerly Kasinthula Rice Scheme),
Phata Irrigation Scheme and KAMA Irrigation Scheme.
Major irrigation schemes under Illovo comprises Nchalo (9,995 ha) and Alumenda (2,764
ha). Kasinthula Cane Growers Limited consists of 1,435 ha of cane fields and 40 ha of food
crops. At Kasinthula, irrigation water is pumped from Shire River into a 1.5km open canal
up to the first dam, then another 4.5 km to the second and third dams. The scheme has both
sprinklers that use centre pivot system and furrow irrigation system that use open canals.
The Kasinthula Research Station also uses water from the same main canal but its main focus
is on irrigation research and it also conducts research on sorghum and millet. Only 40 ha are
under irrigation out of the total land area of 89 ha for the entire Research Station. Figure 41
shows two types of irrigation, furrow and centre pivot being practised at Kasinthula.
Figure 41: Centre Pivot and Furrow Irrigation System
Source: Kasinthula Cane Growers Limited, 2019
The period from 2014 to 2019 saw the development of 16 new irrigation schemes covering a
total area of 1,023.6 hectares for the smallholder sub-sector. On rehabilitation of existing
schemes, 8 were rehabilitated covering a total of 218 hectares. Despite the rehabilitation and
development of new irrigation schemes, a District Irrigation Office progress report shows that
most of these irrigation schemes have not been operating because of various factors, the main
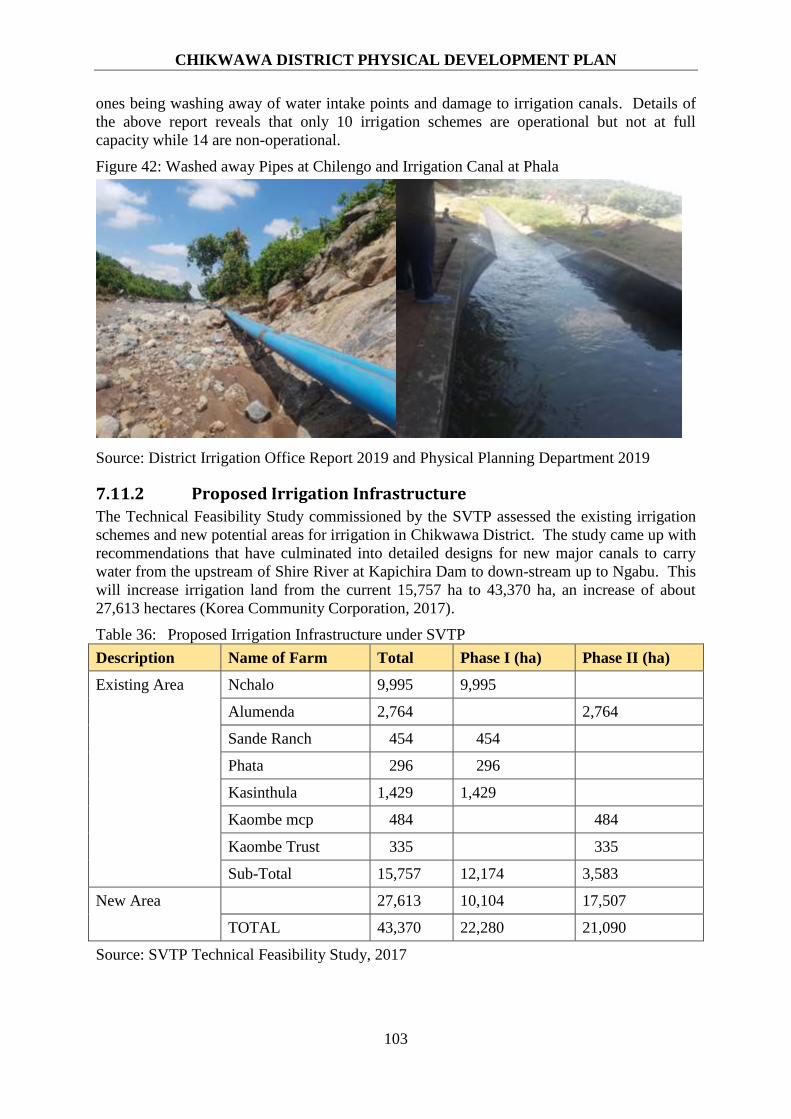
CHIKWAWA DISTRICT PHYSICAL DEVELOPMENT PLAN
103
ones being washing away of water intake points and damage to irrigation canals. Details of
the above report reveals that only 10 irrigation schemes are operational but not at full
capacity while 14 are non-operational.
Figure 42: Washed away Pipes at Chilengo and Irrigation Canal at Phala
Source: District Irrigation Office Report 2019 and Physical Planning Department 2019
7.11.2 Proposed Irrigation Infrastructure
The Technical Feasibility Study commissioned by the SVTP assessed the existing irrigation
schemes and new potential areas for irrigation in Chikwawa District. The study came up with
recommendations that have culminated into detailed designs for new major canals to carry
water from the upstream of Shire River at Kapichira Dam to down-stream up to Ngabu. This
will increase irrigation land from the current 15,757 ha to 43,370 ha, an increase of about
27,613 hectares (Korea Community Corporation, 2017).
Table 36: Proposed Irrigation Infrastructure under SVTP
Description Name of Farm Total Phase I (ha) Phase II (ha)
Existing Area Nchalo 9,995 9,995
Alumenda 2,764 2,764
Sande Ranch 454 454
Phata 296 296
Kasinthula 1,429 1,429
Kaombe mcp 484 484
Kaombe Trust 335 335
Sub-Total 15,757 12,174 3,583
New Area 27,613 10,104 17,507
TOTAL 43,370 22,280 21,090
Source: SVTP Technical Feasibility Study, 2017
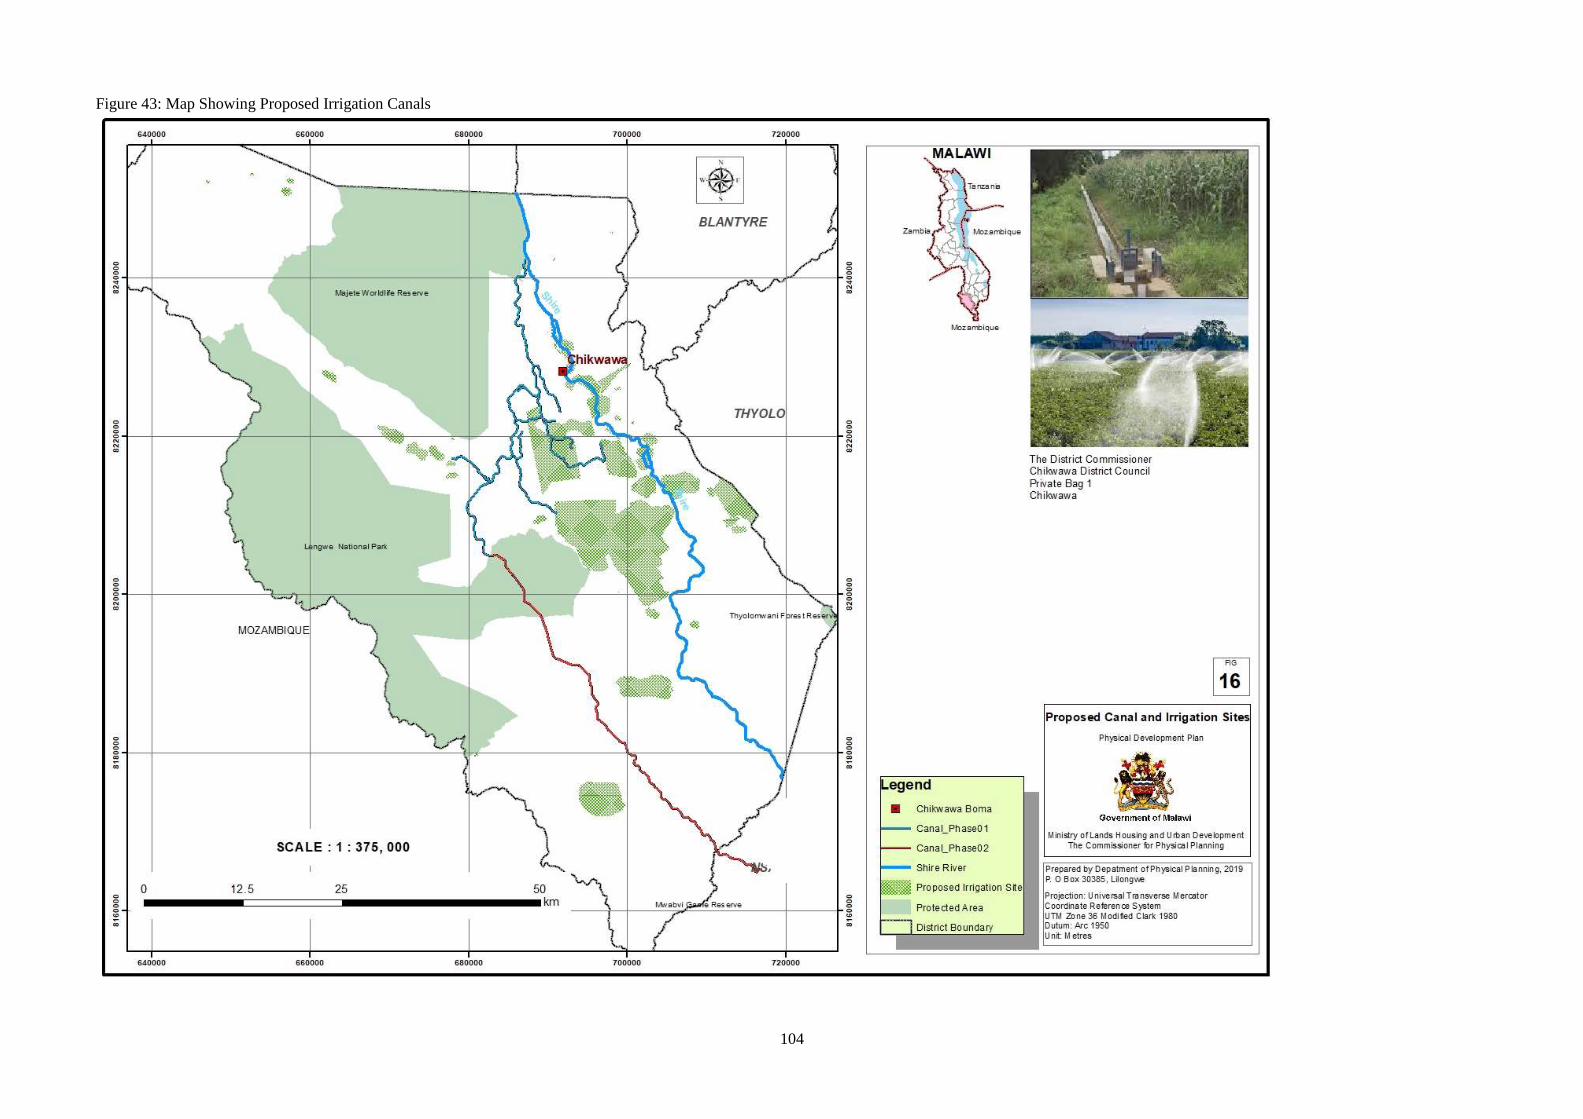
104
Figure 43: Map Showing Proposed Irrigation Canals
105
The study therefore has recommended construction of three main canals. The main canal
number one will be 33.7 km long; main canal number two will be 77.8 km and main canal
number three will have a length of 10.6 km. From main canals, water will be channelled
(siphoned) into secondary canals and into irrigation fields. All the existing irrigation schemes
on the western bank, (including Illovo) will benefit from this very important irrigation
infrastructure. Figure 43 shows a network of proposed irrigation canals to be constructed
under the Shire Valley Transportation Programme (SVTP).
7.11.3 Key Issues
Most irrigation schemes in Chikwawa District use pumps to take water from water sources to
the fields. Just like piped water supply, floods negatively affect canals and pipes during rainy
season. Inadequate power which is also expensive affects pumping of water for irrigation.
Irrigation infrastructure in Chikwawa will be boosted by projects proposed by Shire Valley
Transformation Programme. Project documents show that existing irrigated lands will benefit
from investments under the project. In addition, new irrigation schemes will also access
water from major canals to be constructed. A site visit to the eastern bank soon after the
March 2019 floods revealed that irrigation infrastructure had greatly been damaged and needs
huge investment to bring it to its operational state. Department of Irrigation should therefore
channel a large part of their resources towards rehabilitation programmes in the Eastern
Bank.
7.12 HEALTH
7.12.1 Introduction
Assessment of health infrastructure in Chikwawa District shows that both public and private
facilities are available. Access to health in the district is hampered by poor access roads,
especially during the rainy season and generally long distances people travel to nearest
facilities. Of all the diseases that people suffer from in Chikwawa, fever and malaria is the
most dominant at 50.3% compared to 45.2% for Malawi.14
7.12.2 Existing Health Facilities
There are different types of health facilities in the district and these operate at various levels
depending on their classes. These include 14 health centres, 5 dispensaries, 11 under five
clinics and 27 health posts and these are evenly distributed throughout the district. Some of
these health facilities are operating in permanent tailor-made structures while others are in
temporary buildings. There is also a rural hospital located at Ngabu. Health services in
Chikwawa are also offered at village level through village clinics. There are 154 village
clinics operating in the district under respective established health centres. Details of other
health facilities, catchment population and distance to the referral district hospital is shown in
Table 38.
7.12.3 District Hospital
Chikwawa District Hospital is the district’s referral hospital and it is located at the District
Headquarters. The hospital land is however slowly and steadily being reduced by landslides
along Shire River Bank. Attempts to relocate the hospital to a new site have not succeeded.
The land that was identified for the relocation of the hospital was however encroached. The
14 National Statistical Office, 2017
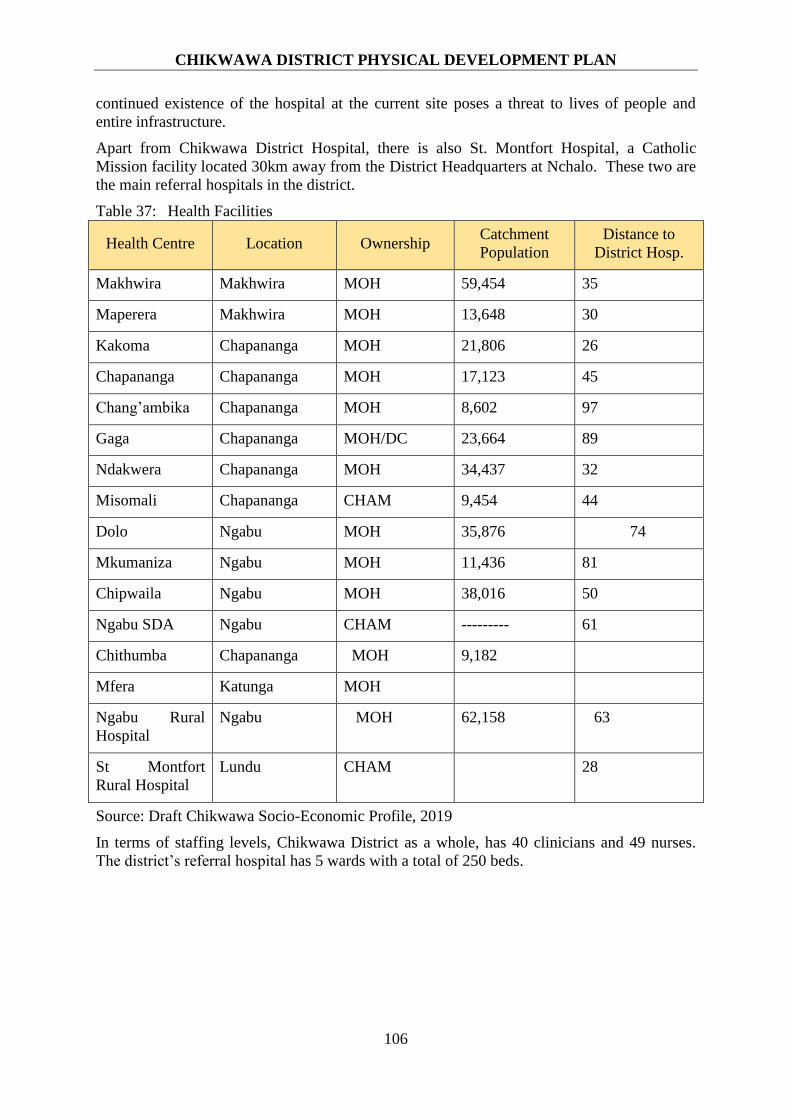
CHIKWAWA DISTRICT PHYSICAL DEVELOPMENT PLAN
106
continued existence of the hospital at the current site poses a threat to lives of people and
entire infrastructure.
Apart from Chikwawa District Hospital, there is also St. Montfort Hospital, a Catholic
Mission facility located 30km away from the District Headquarters at Nchalo. These two are
the main referral hospitals in the district.
Table 37: Health Facilities
Health Centre Location Ownership Catchment
Population
Distance to
District Hosp.
Makhwira Makhwira MOH 59,454 35
Maperera Makhwira MOH 13,648 30
Kakoma Chapananga MOH 21,806 26
Chapananga Chapananga MOH 17,123 45
Chang’ambika Chapananga MOH 8,602 97
Gaga Chapananga MOH/DC 23,664 89
Ndakwera Chapananga MOH 34,437 32
Misomali Chapananga CHAM 9,454 44
Dolo Ngabu MOH 35,876 74
Mkumaniza Ngabu MOH 11,436 81
Chipwaila Ngabu MOH 38,016 50
Ngabu SDA Ngabu CHAM --------- 61
Chithumba Chapananga MOH 9,182
Mfera Katunga MOH
Ngabu Rural
Hospital
Ngabu MOH 62,158 63
St Montfort
Rural Hospital
Lundu CHAM 28
Source: Draft Chikwawa Socio-Economic Profile, 2019
In terms of staffing levels, Chikwawa District as a whole, has 40 clinicians and 49 nurses.
The district’s referral hospital has 5 wards with a total of 250 beds.

CHIKWAWA DISTRICT PHYSICAL DEVELOPMENT PLAN
107
Figure 44 Makhwira Health Centre
Source: Physical Planning Department 2019
Individually owned health facilities are Chaphera and Masache in TA Lundu and Mitondo in
TA Makhwira. ESCOM and ILLOVO also have their own clinics at Kapichira and Nchalo
respectively, while Banja la Mtsogolo is running a clinic at Ngabu. Illovo Clinic caters for
about 1,234 people. There is also a government owned health centre at Masenjere, but it is
located on the Nsanje side of the urban centre. The health centre treats about 9,500 patients
per month; a figure which is high because it is accessible to population of both districts.
Figure 45 is a map showing the distribution of various health facilities.
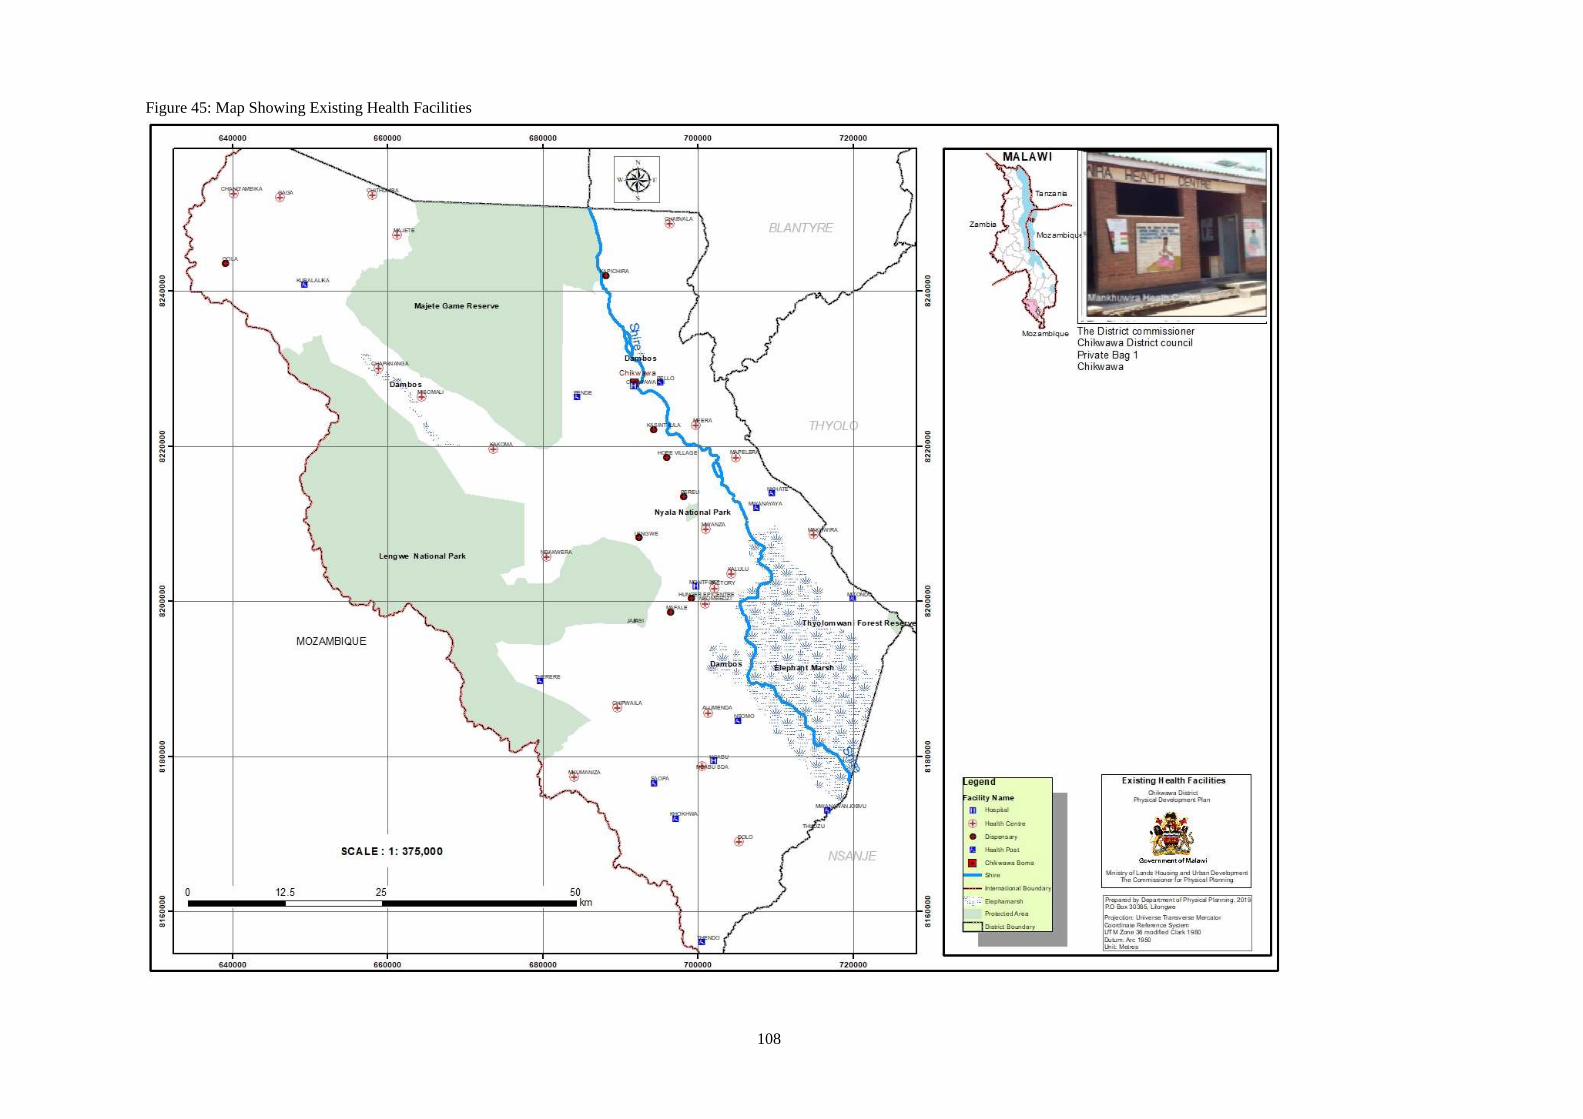
108
Figure 45: Map Showing Existing Health Facilities

109
7.12.4 Key Issues
The spatial distribution shows that some health facilities are located very far away from
referral hospitals. For example, Mkumaniza, Gaga and Chang’ambi are located over 80 km
from the district hospital. Of particular importance is the fact that Gaga and Chang’ambika
are located in remote parts of the district in TA Chapananga and the road condition is very
poor especially during the rainy season.
Secondly, the spatial distribution of population shows that there are some communities that
do not have access to reliable health services within an acceptable radius. For example, parts
of Gola do not have a health centre and are only served by a dispensary.
Analysis of health facilities has revealed that there are deficits in some areas. On one hand,
the available facilities are not adequate compared to the size of the population while on the
other hand, some areas do not have a facility within the acceptable distance. Yet in some
cases, the available facility is poorly staffed to handle medical conditions that are supposed to
be managed at that level. The Ministry of Health and Christian Health Association of Malawi
(CHAM) have a huge responsibility in ensuring that delivery of quality services is achieved.
In addition, improvement in road network will also contribute towards movement of patients
to access health services.
7.13 EDUCATION
7.13.1 Literacy Rates
Literacy, defined as the ability to read and write is one of the critical indicators of human
development in any country. The literacy rate for Chikwawa District for persons aged 15
years and above was 59.9% in 2017 compared to 48.6% in 2011, while at national level, the
rate was 73% in 2017 compared to 65.4% in 2011. Out of those who had never attended
school in 2011, the majority indicated lack of money (34.2%) and lack of interest (24.3%) as
the reasons for not attending school. In 2017 however, apart from lack of money (48.8%)
and lack of interest (19.8%), others were not allowed to go to school by parents (21%)15. The
sections below give an overview of availability of education facilities in Chikwawa District.
7.13.2 Early Childhood Development Centres
Data collected from the District Community Development Office shows that there are 62
early childhood development centres in the district, 48 of which are funded by the World
Food Programme while the rest are under MASAF. Details of location of these ECDC’s is
provided in Table 39 below.
Table 38: Early Childhood Development Centres
TRADITIONAL
AUTHORITY NUMBER OF ECD CENTRE
World Food Programme Funded Under MASAF
Kasisi Mbwemba, Sekela, Kandeu, Nyozerera,
Fombe, Mlambe, Mwanaalirenji,
Mpotazingwe and Kavalo
15 National Statistical Office, 2017
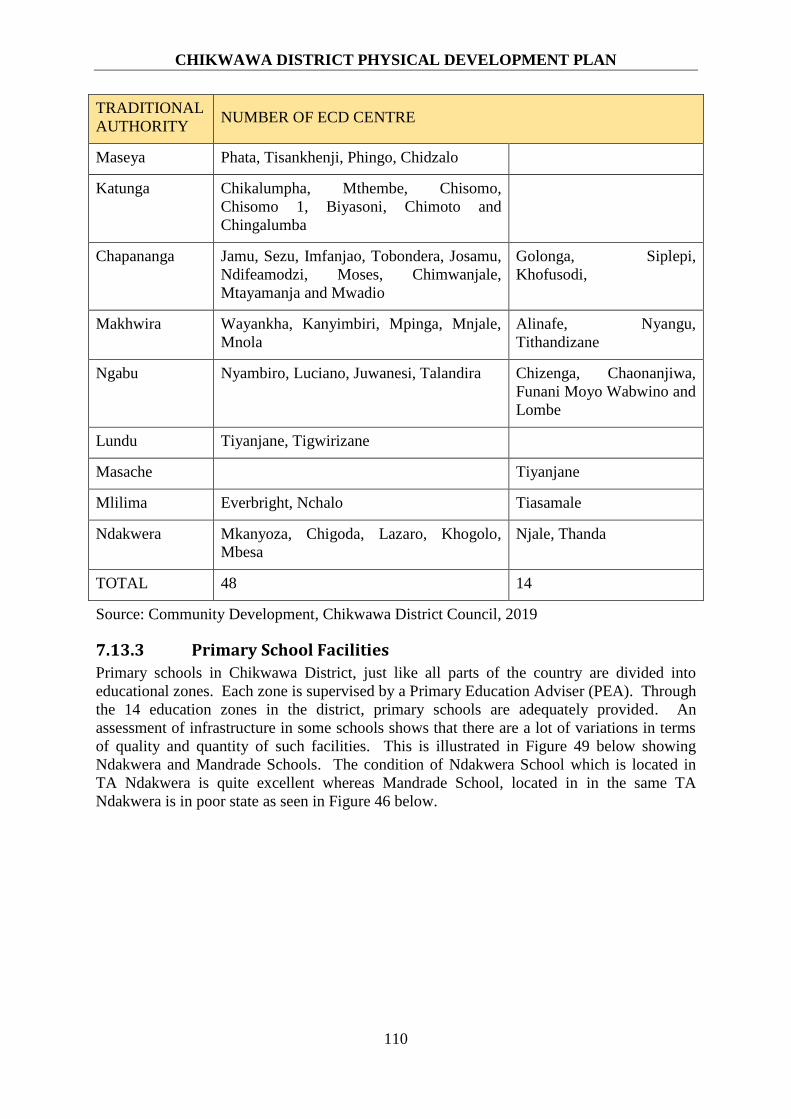
CHIKWAWA DISTRICT PHYSICAL DEVELOPMENT PLAN
110
TRADITIONAL
AUTHORITY NUMBER OF ECD CENTRE
Maseya Phata, Tisankhenji, Phingo, Chidzalo
Katunga Chikalumpha, Mthembe, Chisomo,
Chisomo 1, Biyasoni, Chimoto and
Chingalumba
Chapananga Jamu, Sezu, Imfanjao, Tobondera, Josamu,
Ndifeamodzi, Moses, Chimwanjale,
Mtayamanja and Mwadio
Golonga, Siplepi,
Khofusodi,
Makhwira Wayankha, Kanyimbiri, Mpinga, Mnjale,
Mnola
Alinafe, Nyangu,
Tithandizane
Ngabu Nyambiro, Luciano, Juwanesi, Talandira Chizenga, Chaonanjiwa,
Funani Moyo Wabwino and
Lombe
Lundu Tiyanjane, Tigwirizane
Masache Tiyanjane
Mlilima Everbright, Nchalo Tiasamale
Ndakwera Mkanyoza, Chigoda, Lazaro, Khogolo,
Mbesa
Njale, Thanda
TOTAL 48 14
Source: Community Development, Chikwawa District Council, 2019
7.13.3 Primary School Facilities
Primary schools in Chikwawa District, just like all parts of the country are divided into
educational zones. Each zone is supervised by a Primary Education Adviser (PEA). Through
the 14 education zones in the district, primary schools are adequately provided. An
assessment of infrastructure in some schools shows that there are a lot of variations in terms
of quality and quantity of such facilities. This is illustrated in Figure 49 below showing
Ndakwera and Mandrade Schools. The condition of Ndakwera School which is located in
TA Ndakwera is quite excellent whereas Mandrade School, located in in the same TA
Ndakwera is in poor state as seen in Figure 46 below.
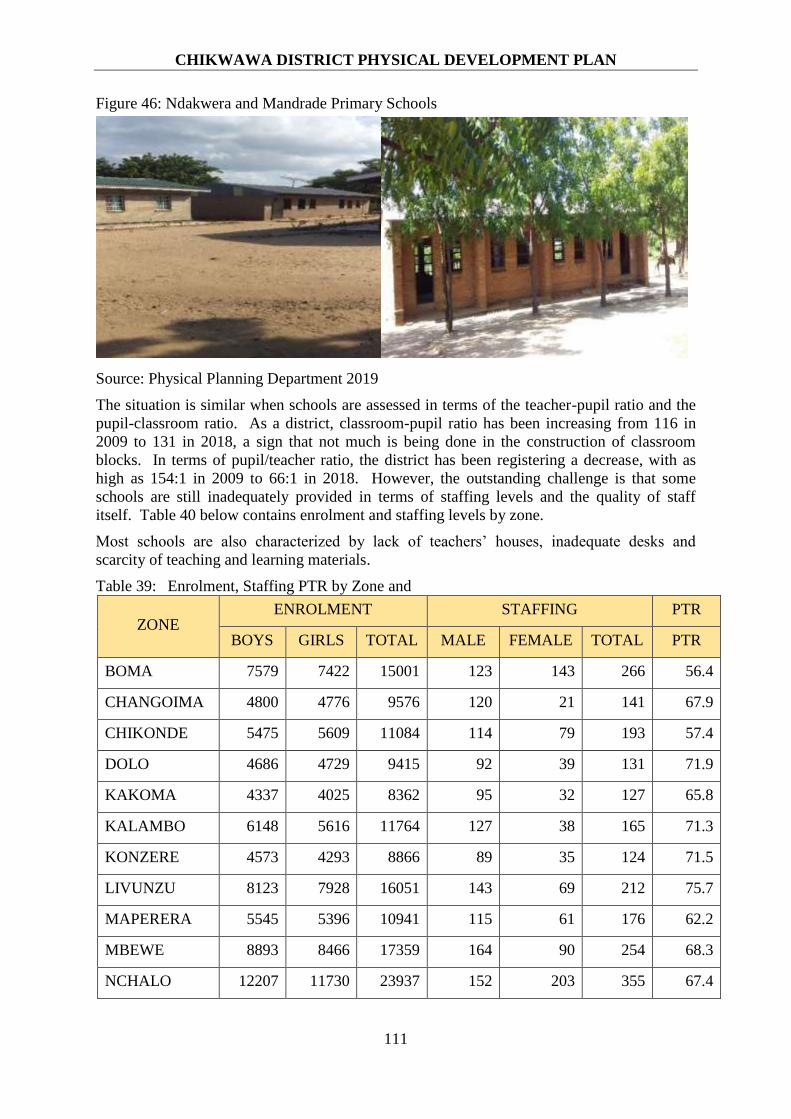
CHIKWAWA DISTRICT PHYSICAL DEVELOPMENT PLAN
111
Figure 46: Ndakwera and Mandrade Primary Schools
Source: Physical Planning Department 2019
The situation is similar when schools are assessed in terms of the teacher-pupil ratio and the
pupil-classroom ratio. As a district, classroom-pupil ratio has been increasing from 116 in
2009 to 131 in 2018, a sign that not much is being done in the construction of classroom
blocks. In terms of pupil/teacher ratio, the district has been registering a decrease, with as
high as 154:1 in 2009 to 66:1 in 2018. However, the outstanding challenge is that some
schools are still inadequately provided in terms of staffing levels and the quality of staff
itself. Table 40 below contains enrolment and staffing levels by zone.
Most schools are also characterized by lack of teachers’ houses, inadequate desks and
scarcity of teaching and learning materials.
Table 39: Enrolment, Staffing PTR by Zone and
ZONE ENROLMENT STAFFING PTR
BOYS GIRLS TOTAL MALE FEMALE TOTAL PTR
BOMA 7579 7422 15001 123 143 266 56.4
CHANGOIMA 4800 4776 9576 120 21 141 67.9
CHIKONDE 5475 5609 11084 114 79 193 57.4
DOLO 4686 4729 9415 92 39 131 71.9
KAKOMA 4337 4025 8362 95 32 127 65.8
KALAMBO 6148 5616 11764 127 38 165 71.3
KONZERE 4573 4293 8866 89 35 124 71.5
LIVUNZU 8123 7928 16051 143 69 212 75.7
MAPERERA 5545 5396 10941 115 61 176 62.2
MBEWE 8893 8466 17359 164 90 254 68.3
NCHALO 12207 11730 23937 152 203 355 67.4

CHIKWAWA DISTRICT PHYSICAL DEVELOPMENT PLAN
112
ZONE ENROLMENT STAFFING PTR
BOYS GIRLS TOTAL MALE FEMALE TOTAL PTR
NGABU 6895 6669 13564 116 98 214 63.4
NKUMANIZA 3159 3101 6260 72 33 105 59.6
NSENJERE 6920 6743 13663 143 48 191 71.5
TOTAL 89340 86503 175843 1665 989 2654 66.3
Source: Chikwawa District Education Office, 2018 Data Base
In terms of infrastructure in primary schools, the district has a total of 1,336 classrooms
against a total enrolment of 175,843. In addition, there are 646 staff houses against a total of
2,679 teachers. Therefore, most teachers are occupying temporary or substandard houses, a
development that is contributing to their unwillingness to be deployed in some schools
especially in rural areas where even privately owned houses are scarce.
The government through Education Infrastructure Management Unit with funding from
World Bank and Norway intends to construct classroom blocks and ancillary facilities in
selected primary schools as detailed in the table below. Figure 48 is a graphical presentation
of distribution of primary schools according to zones while Table 41 shows current plans by
government to improve provision of primary school infrastructure in the district.
Table 40: Current Plans for School Block Construction
EDUCATION ZONE NAME OF SCHOOL PLANNED
CONSTRUCTION
Dolo Mikombo 2 Classroom Blocks
Dolo Macheu 2 Classroom Blocks
Dolo Chindole 2 Classroom Blocks
Kalambo Gola 2 Classroom Blocks
Kalambo Chimwanjale 1 Classroom Block
Mkumaniza Finish 2 Classroom Blocks
Source: Education Infrastructure Management Unit, 2019
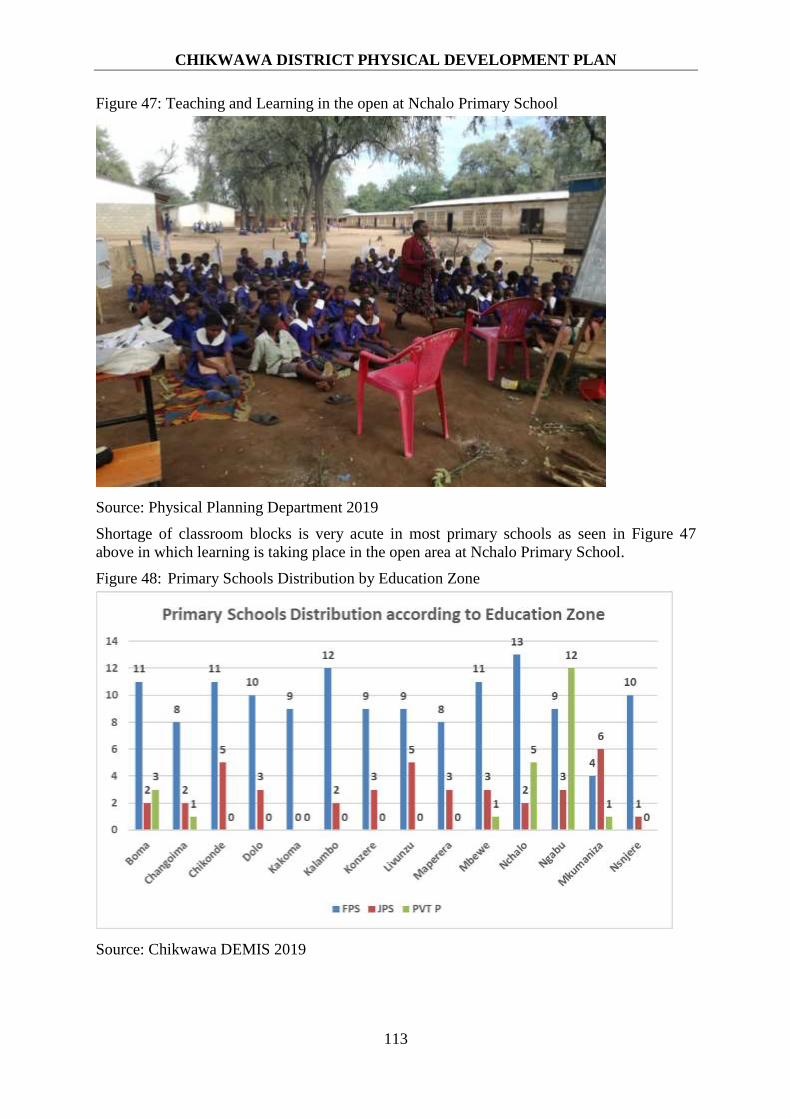
CHIKWAWA DISTRICT PHYSICAL DEVELOPMENT PLAN
113
Figure 47: Teaching and Learning in the open at Nchalo Primary School
Source: Physical Planning Department 2019
Shortage of classroom blocks is very acute in most primary schools as seen in Figure 47
above in which learning is taking place in the open area at Nchalo Primary School.
Figure 48: Primary Schools Distribution by Education Zone
Source: Chikwawa DEMIS 2019

CHIKWAWA DISTRICT PHYSICAL DEVELOPMENT PLAN
114
7.13.4 Secondary School Education
Chikwawa District has 42 secondary schools, 14 of which are privately owned. Their
distribution according to educational zones is shown in Figure 49. Overall, the district’s
enrolment for 2018/2019 shows that there were 5,339 girls and 5,743 boys, giving a total of
11,082 students. There were 293 teachers against 11,082 students, giving a student-teacher
ratio of 1:38, and the classroom-student ratio was 88:1 as there were 125 classrooms only.
The shortage of houses is also evident in secondary schools because almost half of the
teachers are not accommodated in staff houses. Just like in primary schools, there is an
apparent mismatch between the rate of infrastructure provision and demand in secondary
schools. As more learners are being admitted into secondary schools from primary schools,
this gap will keep on increasing. Figure 49 shows overall distribution of secondary schools in
the district according to Education Zone.
Figure 49: Secondary School Distribution by Zone
Source: Chikwawa DEMIS 2019
Figure 51 is a map showing the spatial distribution of education facilities in Chikwawa
District. It has to be noted that there is an overlap in terms of catchment areas because of
several factors, one of which is lack of thorough consultations before a facility is to be
constructed. In some cases, government authorities responsible for recommending location
of education facilities are not consulted by either the local community or influential
politicians when making decisions on the type and level of facility to be provided in a
particular community.
Secondary schools do not have specific sphere of influence. It is however assumed that
boarding secondary schools accommodate students from all parts of the district while
community day secondary schools are meant for students who can walk or cycle from
villages around the individual schools.
On-going rehabilitation projects for secondary schools in Chikwawa include construction of
girls’ hostels, kitchen, maize mill and 4 blocks at Chapananga Secondary School and a no
objection has been obtained for rehabilitation of the entire Chikwawa Secondary School.

CHIKWAWA DISTRICT PHYSICAL DEVELOPMENT PLAN
115
7.13.5 Tertiary Education
Chikwawa District has one village polytechnic at Mphungu, which was built by Government
in 2014. Its enrolment in 2017 was 20 girls and 50 boys. This is a community managed
facility whose objective is to offer skills to youths in trades like carpentry, bricklaying and
tailoring among others. However, lack of human resource and training materials has made
the facility to fail to fulfil its mandate. Efforts to link it with the Technical Entrepreneurial
Vocational Educational Training Authority (TEVETA) have not yielded any fruits with the
later promising to incorporate the institution in its programme but this has not materialized.
A community technical college is also nearing completion at Ngabu. See Figure 50 for a
pictorial view of the college under construction at the time of the survey in April 2019.
Under the Malawi University Development Programme, Chikwawa Distrct shall have a
Teacher Training College at Dyeratu whose core responsibility is to produce more teachers.
The Teachers Training College under construction in Chikwawa is located near Kasinthula
Research Station.
Figure 50: Ngabu Community College (under construction)
Source: Physical Planning Department 2019
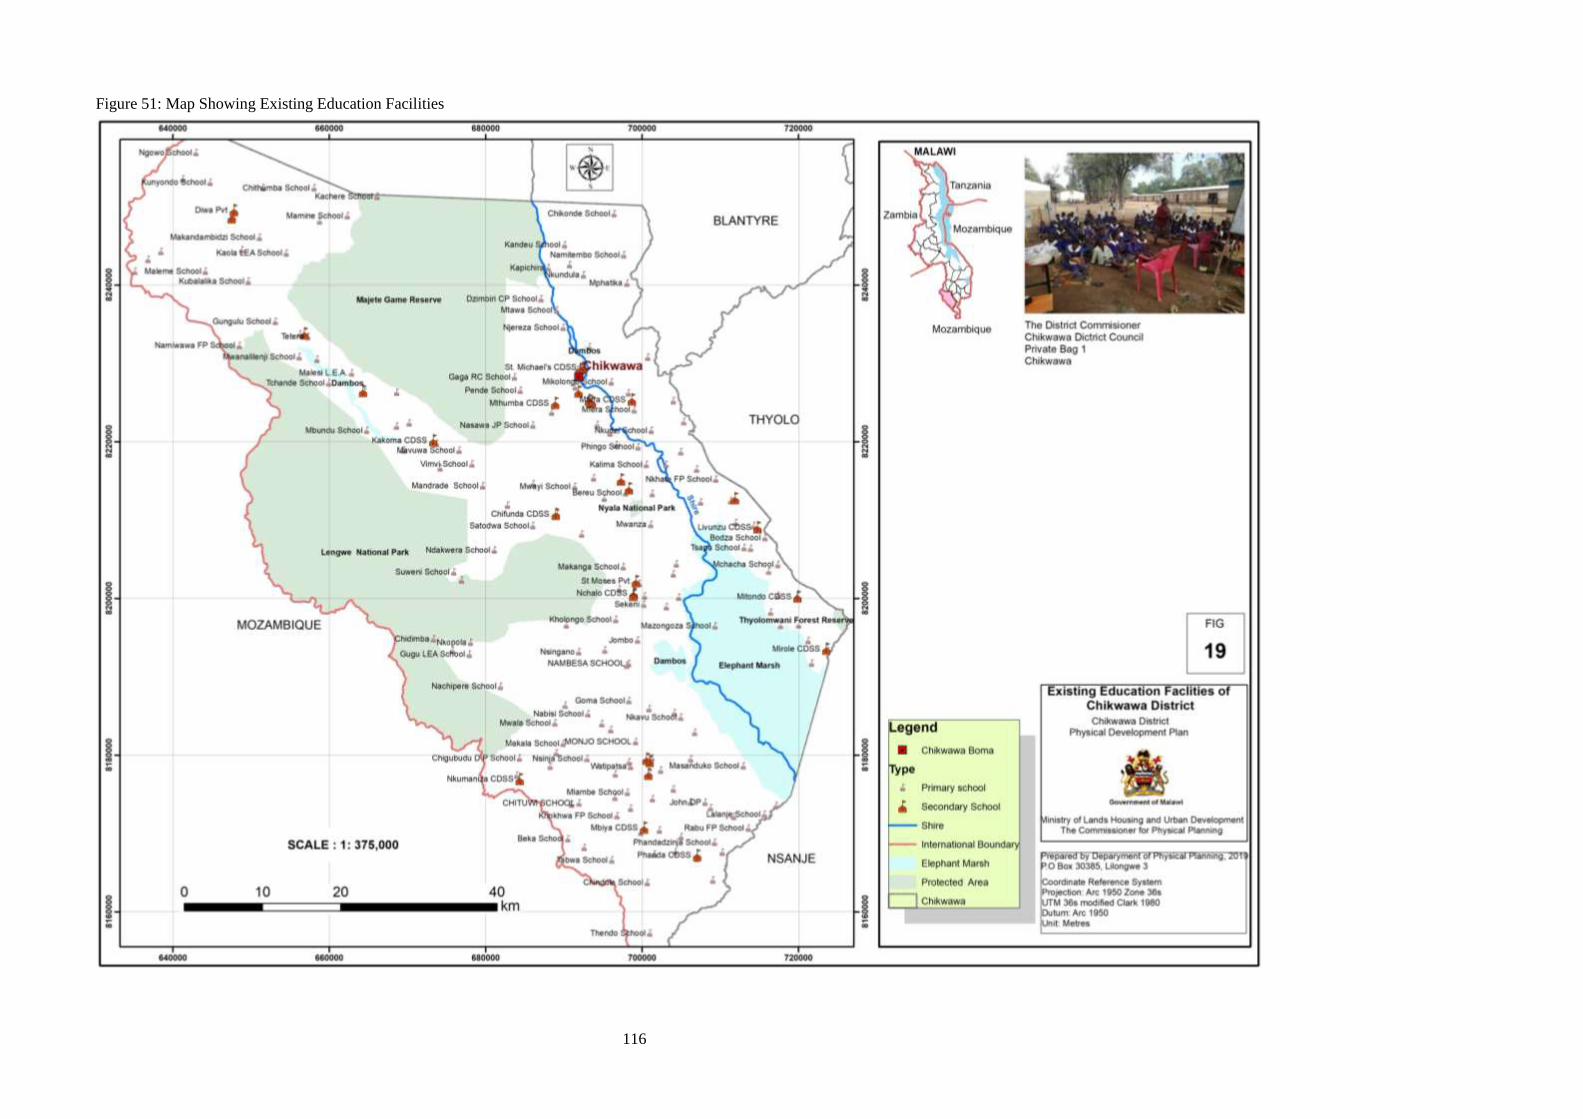
116
Figure 51: Map Showing Existing Education Facilities

117
7.13.6 Key Issues
The spatial distribution of primary schools is fairly good. The main challenges are
inadequate classroom blocks, staff houses and lack of teaching and learning materials.
Considering a standard criteria that pupils should not walk for more than 30 minutes to access
a school, it is observed that impassable roads especially during rainy season contribute to
drop outs in some schools. Among others, some parents deliberately discourage their
children from attending school while others drop out due to lack of school fees. The primary
school going population (5 – 16 years) for Chikwawa in 2018 was 191,419. This represents
about 34 % of the whole population of the district. It therefore means that provision of
primary school facilities is inadequate in the district as there are only 1336 classrooms.
Assuming that the above school going population is to be accommodated at a standard rate of
1 classroom per 60 pupils, the district will need a total of 3,190 classrooms. Therefore, it is
obvious that there is a need to provide 1,854 additional classrooms to meet the current
demand. It has to be noted however that private schools absorb a little percentage of school
going population. Some areas that have high population densities also do not have secondary
schools. As a result, learners cover long distances to reach nearest secondary schools.
Apart from the Ngabu Community Technical College, the district lacks formal
technical/skills development centres where the youth can access vocational training. As a
result, the youth who complete their secondary education have no realistic options of securing
off- farm employment.
7.14 POSTS AND TELECOMMUNICATION
7.14.1 Postal Services
The relevance of postal services has diminished over the years because of the emergence of
various communication technologies. There are post offices at major urban and rural centres
in the district such as Chikwawa District Headquarters, Nchalo, Ngabu, Chapananga and also
a postal agency at Makhwira in the Eastern Bank. Apart from mail delivery, post offices
have diversified their operations to include money transfers and sale of airtime. Almost all
post office facilities in the district are in very poor condition. Figure 52 below shows
Chapananga Post Office in its poor state.
Figure 52: Chapananga Post Office

CHIKWAWA DISTRICT PHYSICAL DEVELOPMENT PLAN
118
Source: Physical Planning Department 2019
7.15 COMMUNICATION SERVICES Chikwawa is connected to all the major communication service providers. The dominant
providers are Airtel, Telekom Networks Malawi (TNM) and Malawi Telecommunications
Limited (MTL). All these are communication services that mainly use transmitters and are
therefore wireless except MTL which relies on both underground and overhead cables. There
is no specific data on number of customers for the mobile/cell phone networks. As for MTL,
total number of customers in Chikwawa is 1,237 for telephones and 21 for internet.
The existing communication infrastructure comprises mainly transmitter towers and some
sales shops for both Airtel and TNM. Airtel has a total of 17 communication towers in
Chikwawa District and each transmitter has an average radius of 20 km. Illovo alone has 4
transmitters while the rest are distributed in other parts of the district. As seen in the table
below, these communication companies have entered into an agreement with each other for
the purpose of sharing usage of transmitters.
TNM has 15 communication towers whose radius is about 10km while MTL has 10. Some
areas such as Tomali and Nyasa are still not able to access TNM network. On the other hand,
MTL does not serve most parts of the East Bank and Chapananga. TNM’s main challenge is
the poor condition of roads in some areas, especially during the wet season which makes it
impossible to access their infrastructure. The main challenge for MTL is vandalism of cables
which has resulted in the reduction of the coverage area.
The details of the names and/or locations of these communication towers are given in the
Table 42 below.
Table 41: Communication Transmitters
NO. AIRTEL MTL TNM
1 District Headquarters (With MTL) Chikwawa Dyeratu (With Airtel)
2 Kapichira Nchalo Chikwawa (With MTL)
3 Jombo Ngabu Bereu
4 Nchalo Alumenda Lengwe
5 Dyeratu Bereu Sucoma
6 Illovo Factory Changoima Illovo
7 Illovo Club Kapichira Nyala (With Airtel)
8 Illovo Housing Lengwe Kapichira (With Airtel)
9 Ngabu Livunzu Phwazi
10 Bereu Phwadzi Hill Chapananga
11 Mphonde Nkhate
12 Alumenda
13 Chapananga
Source: Socio-Economic Survey March, 2019
Chikwawa District is partially connected to the national information highway. This national
information highway is the Government Wide Area Network (GWAN). GWAN uses the

CHIKWAWA DISTRICT PHYSICAL DEVELOPMENT PLAN
119
existing ESCOM power lines using optic fibre cables. Currently, it is only the office of the
DC that is connected and the rest of the government departments are expected to be
connected in the next phase.
The only internet available in the district is through radio links by MTL. The company plans
to expand their data network using radio system. The expansion will be done using Triangle
links, Nano beams and hot spots especially in Nchalo.
Figure 53 is a map of Chikwawa District showing the distribution of all communication
transmitters. It should be noted that MTL transmitters do not have designated radius.
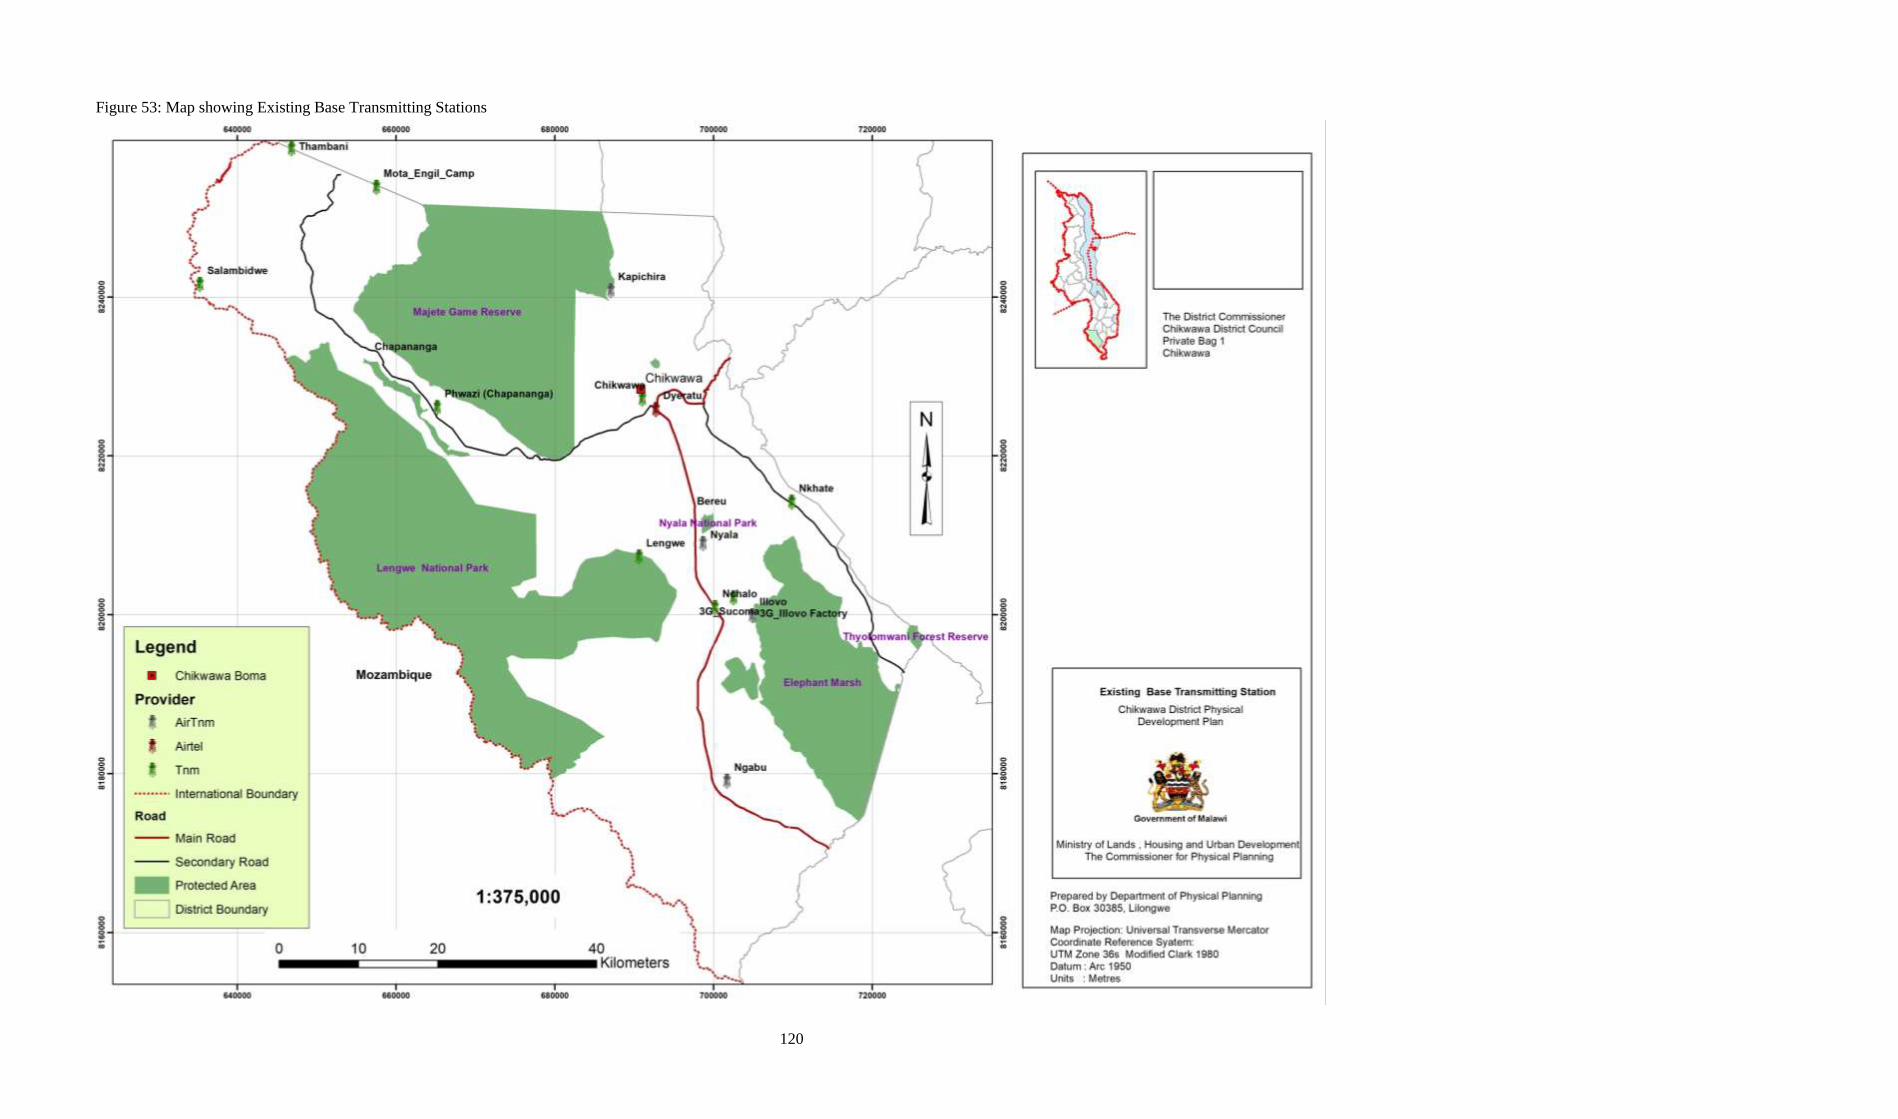
120
Figure 53: Map showing Existing Base Transmitting Stations
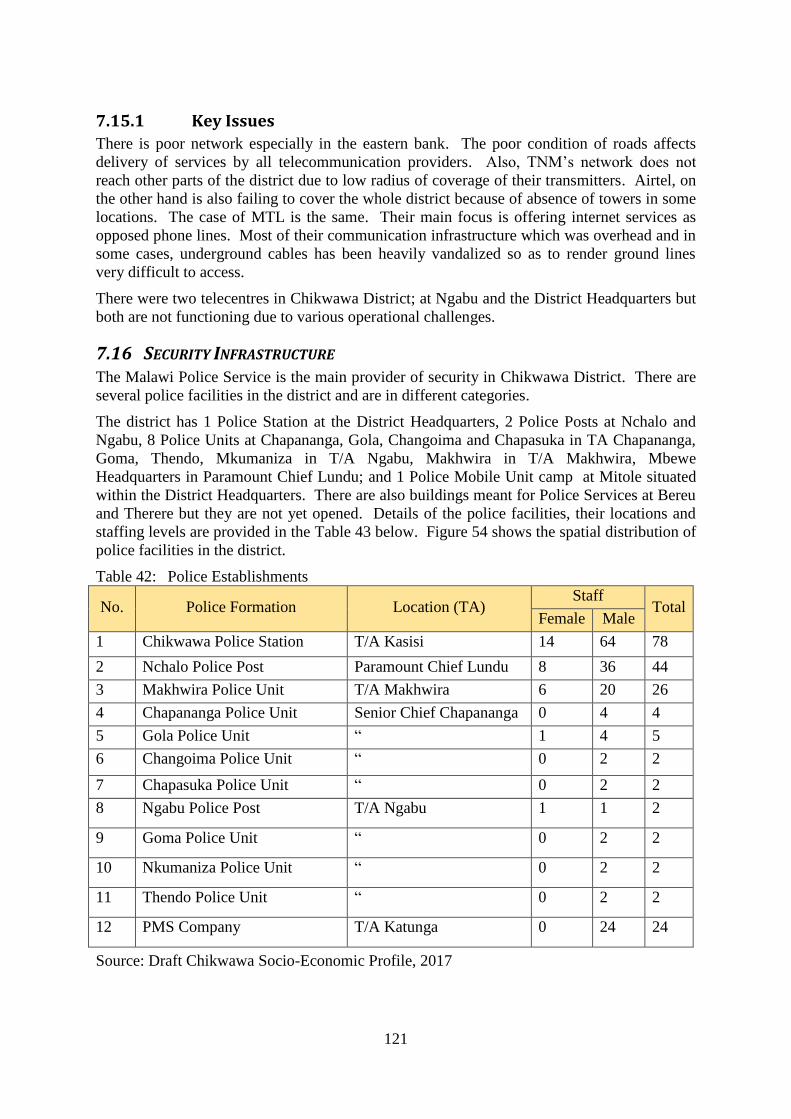
121
7.15.1 Key Issues
There is poor network especially in the eastern bank. The poor condition of roads affects
delivery of services by all telecommunication providers. Also, TNM’s network does not
reach other parts of the district due to low radius of coverage of their transmitters. Airtel, on
the other hand is also failing to cover the whole district because of absence of towers in some
locations. The case of MTL is the same. Their main focus is offering internet services as
opposed phone lines. Most of their communication infrastructure which was overhead and in
some cases, underground cables has been heavily vandalized so as to render ground lines
very difficult to access.
There were two telecentres in Chikwawa District; at Ngabu and the District Headquarters but
both are not functioning due to various operational challenges.
7.16 SECURITY INFRASTRUCTURE The Malawi Police Service is the main provider of security in Chikwawa District. There are
several police facilities in the district and are in different categories.
The district has 1 Police Station at the District Headquarters, 2 Police Posts at Nchalo and
Ngabu, 8 Police Units at Chapananga, Gola, Changoima and Chapasuka in TA Chapananga,
Goma, Thendo, Mkumaniza in T/A Ngabu, Makhwira in T/A Makhwira, Mbewe
Headquarters in Paramount Chief Lundu; and 1 Police Mobile Unit camp at Mitole situated
within the District Headquarters. There are also buildings meant for Police Services at Bereu
and Therere but they are not yet opened. Details of the police facilities, their locations and
staffing levels are provided in the Table 43 below. Figure 54 shows the spatial distribution of
police facilities in the district.
Table 42: Police Establishments
No. Police Formation Location (TA) Staff
Total Female Male
1 Chikwawa Police Station T/A Kasisi 14 64 78
2 Nchalo Police Post Paramount Chief Lundu 8 36 44
3 Makhwira Police Unit T/A Makhwira 6 20 26
4 Chapananga Police Unit Senior Chief Chapananga 0 4 4
5 Gola Police Unit “ 1 4 5
6 Changoima Police Unit “ 0 2 2
7 Chapasuka Police Unit “ 0 2 2
8 Ngabu Police Post T/A Ngabu 1 1 2
9 Goma Police Unit “ 0 2 2
10 Nkumaniza Police Unit “ 0 2 2
11 Thendo Police Unit “ 0 2 2
12 PMS Company T/A Katunga 0 24 24
Source: Draft Chikwawa Socio-Economic Profile, 2017
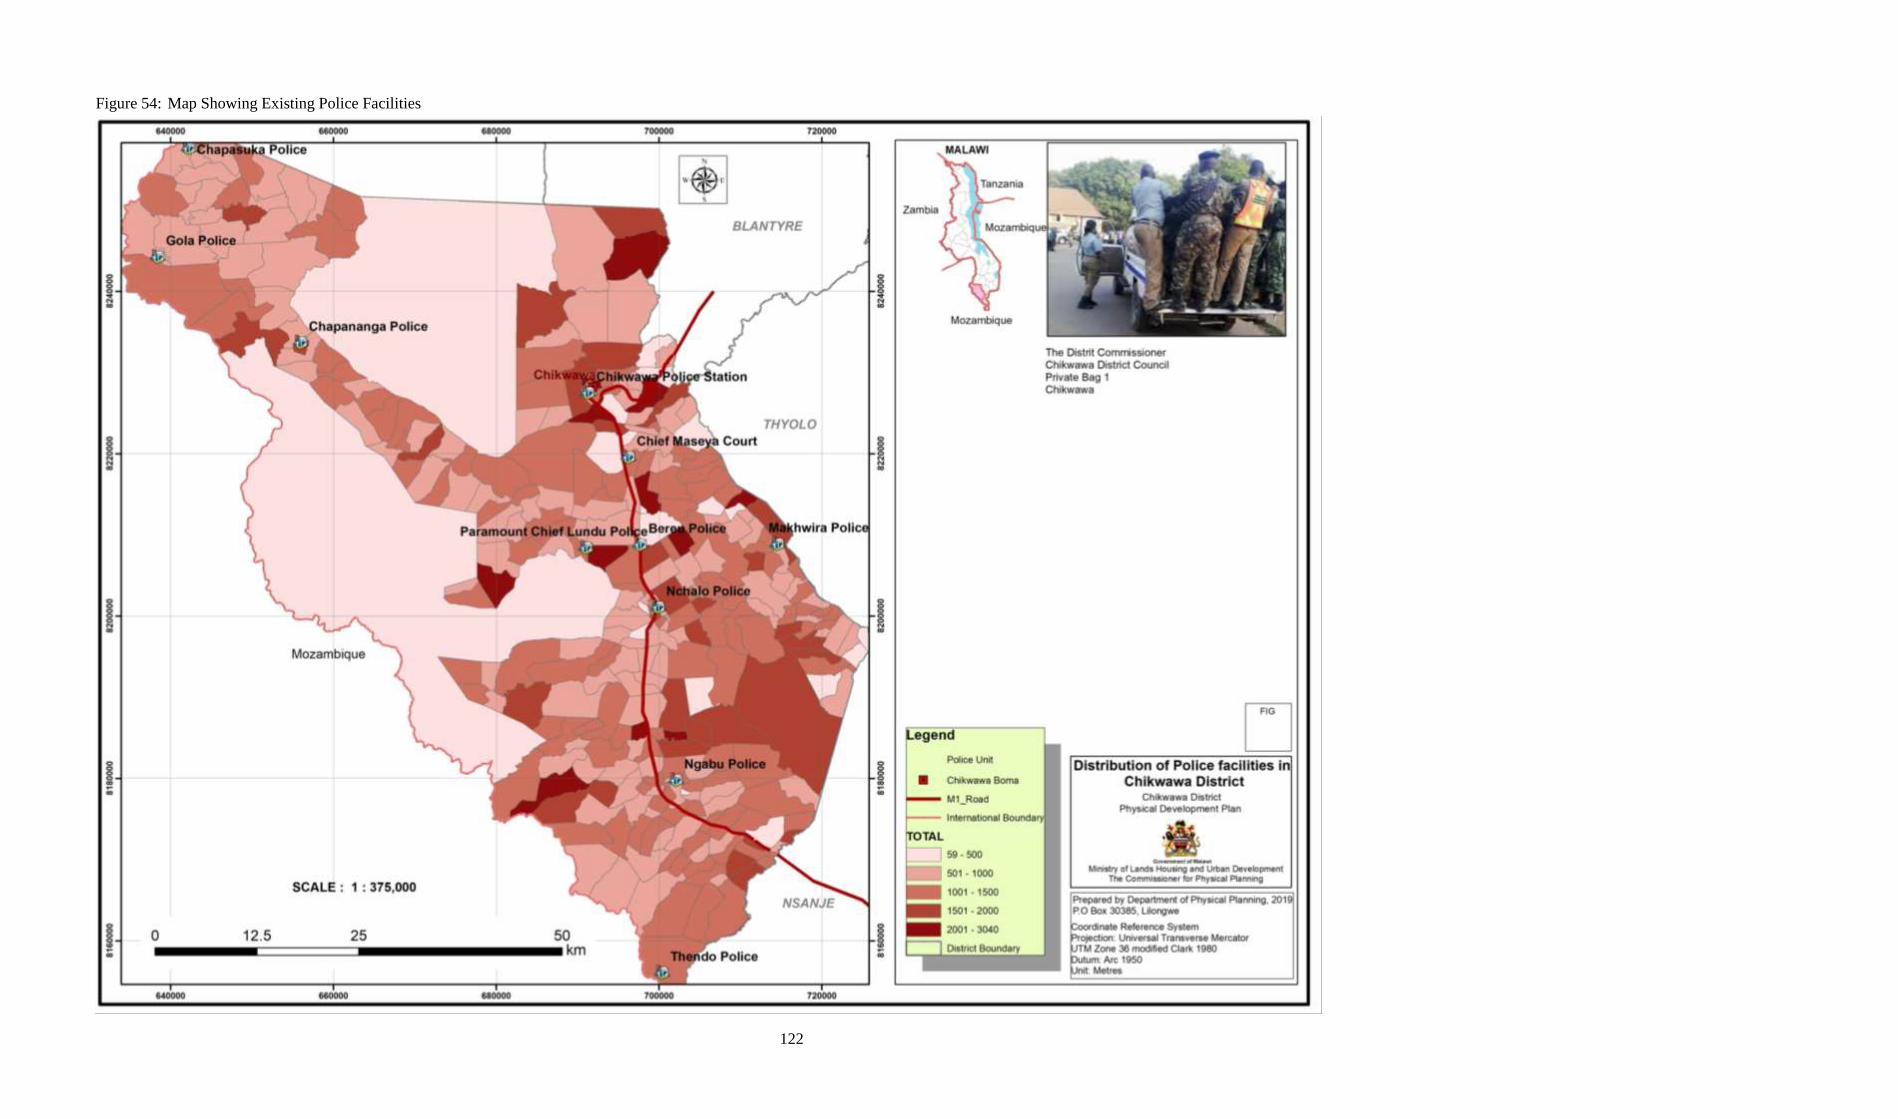
122
Figure 54: Map Showing Existing Police Facilities
123
7.16.1 Key Issues
The condition of all police facilities is poor. There are no adequate staff houses and even
office accommodation is inadequate to cater for all the available personnel. It is important
therefore that the public security organs should be given the necessary supporting
infrastructure so that they can perform their functions with dedication. The measures
outlined hereunder are intended to improve delivery of service for the benefit of the public.
The district has one prison facility, located at the District Headquarters.
The existence of wildlife reserves in Chikwawa District has also resulted in conflicts between
humans and wildlife. On one hand, wild animals pose a challenge to the security of human
beings while on the other hand, humans also threaten the existence of wild animals.
7.17 SPORTS AND RECREATION FACILITIES There are no formal public sports and recreation facilities in Chikwawa District. Sports
grounds are only available in schools. The general public use open spaces as playgrounds
spread in undesignated areas in urban and rural areas. Standard sports and recreation
facilities are found at Illovo in Nchalo, namely Kalulu Stadium, Golf Course, Hall and other
facilities for minor sports. However, these infrastructures are exclusively for private use.
Therefore, there is a great need to provide public facilities for sports and recreation in the
district.
7.18 LINKAGE OF PHYSICAL INFRASTRUCTURE AND URBANIZATION Results of a study on urbanization in Chikwawa District have led to a recommended
hierarchy of urban centres with each centre having a well-defined catchment area. According
to the National Physical Development Plan, the designated urban centres at each level are
expected to have a number and level of services and facilities commensurate with their status.
The hierarchy of urban centres in Chikwawa consists of main market centres, rural market
centres and village centres. Most of these urban centres have inadequate services and
facilities and are therefore functioning below their capacity. Nchalo has a sports stadium,
golf course and leisure club but all these are privately owned by ILLOVO. Therefore, all the
three main market centres of Chikwawa District Headquarters, Nchalo and Ngabu need
community and leisure facilities such as halls and sports and recreation facilities. Both
Ngabu and Nchalo also need low level district administration services. Location of these
facilities will be determined at Urban Structure Planning and Detailed Layout Planning levels
The rural market centres of Masenjere, Chapananga and Mkumaniza need specific
infrastructure and utilities to enable them function as recommended. These are contained in
Table 44 below. Service provision for each centre shall also be based on requirements shown
in Tables 54, 55 and 57.
Table 43: Infrastructure Required at Rural Market Centres
NO. RURAL MARKET
CENTRE INFRASTRUCTURE REQUIRED
1 Chapananga Community, banking and service station facilities
2 Mkumaniza Urban water supply, banking, postal, community and judicial
facilities
3 Masenjere Urban water supply, police, judicial and community facilities
Source: Physical Planning Department 2019

CHIKWAWA DISTRICT PHYSICAL DEVELOPMENT PLAN
124
It should be noted however, that each urban centre will be thoroughly assessed and
participatory local land use plans will be prepared to guide provision of physical
infrastructure and overall provision of services and facilities. For details, refer to Table 55.

CHIKWAWA DISTRICT PHYSICAL DEVELOPMENT PLAN
125
8 MAJOR LAND USES
8.1 INTRODUCTION One of the pre-requisite for the preparation of a District Physical Development Plan (DPDP)
is a good knowledge and understanding of the existing land use structure, trends in the major
land uses, natural or physical constraints to developments, usable vacant land, the rate at
which the vacant land is being utilized or becomes part of the man-made physical
environment and land for future uses. Map showing existing land uses in Chikwawa is
depicted in Figure 55 and the description of these categories of existing major land uses is
contained in the subsequent sections.
8.2 AGRICULTURE The District has a total area of 4,892 square kilometres. The total land area is 489,165
hectares of which 20, 118 hectares is dry arable land and 29,962 hectares is wet arable land
that can be used for agricultural purposes. Estates cover 19,000 hectares while public land
covers 211,788 hectares. Non arable land covers 191,089 hectares. Chikwawa District also
has potential irrigable area of 38,000 ha. Existing irrigated area for the district is at 15, 557
ha and this include; Nchalo, Sande, Phata, Kasinthula, Alumenda, and Kaombe.
8.3 SHIRE VALLEY TRANSFORMATION PROJECT (SVTP) AREA Shire Valley Transformation Project (SVTP) is also one of the major projects taking a leading
role in promoting agricultural production in the district. SVTP is embarking on developing
43, 380 ha of land under gravity irrigation. The project aims at improving agricultural
production in a sustainable manner thus leading to economic growth and reduction of rural
poverty in lower shire valley through establishment of rural-linked market for smallholder
farming ventures and professionally operated irrigation services.
The project has also proposed a land use plan model of about 500 ha per estate that will
include the following uses; settlements/villages, irrigable land, grazing areas, demarcation of
floodplains, forests and woodlots on every estate.
8.4 ESTATES AND LARGE SCALE HOLDINGS Large scale estates in the district cover about 16,221 ha and these include: Illovo, Phata and
Kasinthula cane growers, Nchalo Greenbelt Limited focusing on cotton and KAMA. The
Estates and Large scale holdings in the District are shown on Table 44:
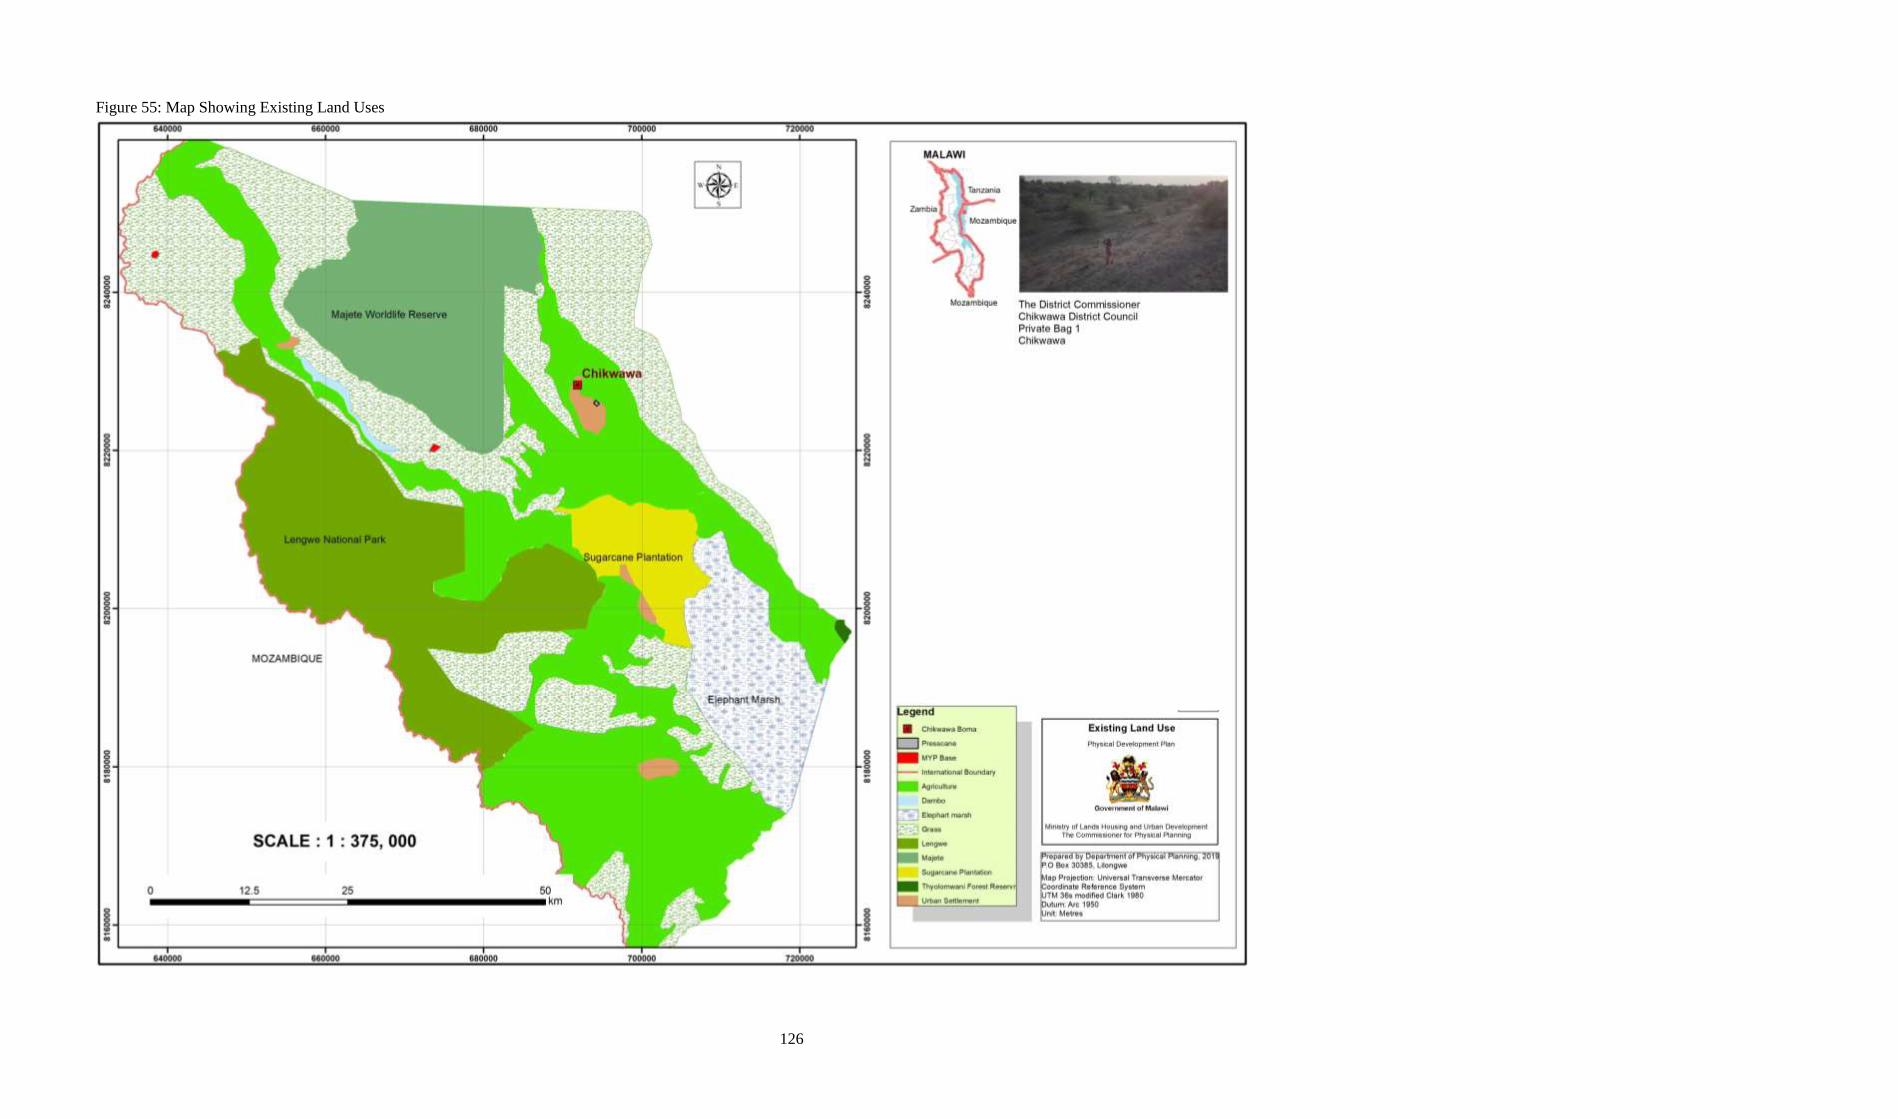
126
Figure 55: Map Showing Existing Land Uses
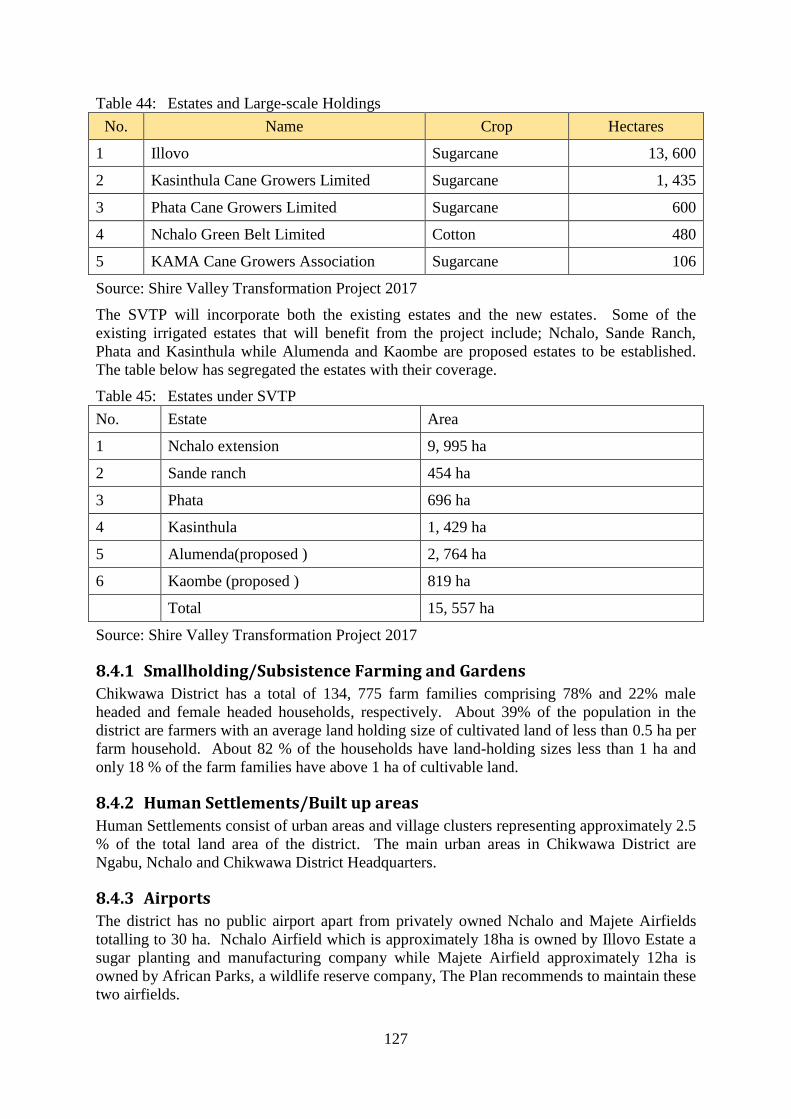
127
Table 44: Estates and Large-scale Holdings
No. Name Crop Hectares
1 Illovo Sugarcane 13, 600
2 Kasinthula Cane Growers Limited Sugarcane 1, 435
3 Phata Cane Growers Limited Sugarcane 600
4 Nchalo Green Belt Limited Cotton 480
5 KAMA Cane Growers Association Sugarcane 106
Source: Shire Valley Transformation Project 2017
The SVTP will incorporate both the existing estates and the new estates. Some of the
existing irrigated estates that will benefit from the project include; Nchalo, Sande Ranch,
Phata and Kasinthula while Alumenda and Kaombe are proposed estates to be established.
The table below has segregated the estates with their coverage.
Table 45: Estates under SVTP
No. Estate Area
1 Nchalo extension 9, 995 ha
2 Sande ranch 454 ha
3 Phata 696 ha
4 Kasinthula 1, 429 ha
5 Alumenda(proposed ) 2, 764 ha
6 Kaombe (proposed ) 819 ha
Total 15, 557 ha
Source: Shire Valley Transformation Project 2017
8.4.1 Smallholding/Subsistence Farming and Gardens
Chikwawa District has a total of 134, 775 farm families comprising 78% and 22% male
headed and female headed households, respectively. About 39% of the population in the
district are farmers with an average land holding size of cultivated land of less than 0.5 ha per
farm household. About 82 % of the households have land-holding sizes less than 1 ha and
only 18 % of the farm families have above 1 ha of cultivable land.
8.4.2 Human Settlements/Built up areas
Human Settlements consist of urban areas and village clusters representing approximately 2.5
% of the total land area of the district. The main urban areas in Chikwawa District are
Ngabu, Nchalo and Chikwawa District Headquarters.
8.4.3 Airports
The district has no public airport apart from privately owned Nchalo and Majete Airfields
totalling to 30 ha. Nchalo Airfield which is approximately 18ha is owned by Illovo Estate a
sugar planting and manufacturing company while Majete Airfield approximately 12ha is
owned by African Parks, a wildlife reserve company, The Plan recommends to maintain these
two airfields.

CHIKWAWA DISTRICT PHYSICAL DEVELOPMENT PLAN
128
8.5 CONSERVATION AREAS IN CHIKWAWA DISTRICT Conservation area covers a total of 2,847 ha. These areas are managed by local communities,
NGOs, and government especially the Department of Forestry. The aim of the forest sites is
to protect the environment from degradation and soil erosion that might lead to natural
disasters such as flooding. The table below illustrates the conservation catchment sites within
the district and their land sizes.
Table 46: Chikwawa District Consolidated Catchment Conservation Areas
No. Catchment Name Forest (Ha) Land Resource (Ha) Total (Ha)
1. Nkhate 41 70 111
2. Mpokonyola 7 17 24
3. Mphonde 38 79 117
4. Dulansanje 41 34 75
5. Mikalango 93 42 135
6. Nyamphota 19 9 28
7. Dongamiyala 28 85 113
8. Mkombezi 7 22 29
9. Nyamatope Hills 79 40 119
10. Tambokamwa 34 31 65
11. Nyakamba 61 102 163
12. Chithumba 89 64 153
13. Kasupe Hills 33 114 147
14. Bereu 13 34 47
15. Likhubula 37 23 60
16. Mazira 63 60 123
17. Phwazi 66 96 162
18. Zalera 167 249 416
19. Ng’ombe 85 106 191
20. Nyambiro-Lombe 51 65 116
21. Nanzolo 35 31 66
22. Mthumba 25 97 122
23. Mkudzi 23 21 44
24. Mwanza River Tributaries 44 177 221
Grand Total 1179 1668 2847
Source: MASAF 4 Revised Consolidated Catchment Safety Net Plan, 2018
CHIKWAWA DISTRICT PHYSICAL DEVELOPMENT PLAN
129
8.6 NATIONAL PARKS, GAME AND WILD LIFE RESERVES The total area for national parks, game reserves and conservation areas in the district is about
219,050 ha. Majete is made up of 69, 000 ha of land and shares boundary with Mwanza,
Blantyre, and Mozambique. Lengwe National Park was established in 1928 by Malawi
Government and it is mainly a wetland and experiencing land pressure from locals and
comprise 88, 700 ha of land including extension area to the north. Elephant Marsh covers 60,
000 ha and is located within the floodplains of the lower Shire River. Nyala Park is a
privately owned park under Illovo Sugar Group and covers about 350 ha.
8.6.1 Forest Reserves
Chikwawa is one of the districts with vast areas under National Parks and Game Reserves.
Most of the natural forests are under traditional leaders under customary land. However,
deforestation is rampant mainly due to charcoal production and brick curing. According to
FAO 1993 statistics, forests, indigenous and plantations occupy 180,182 ha of land
representing 36% of Chikwawa land area.
8.6.2 Infrastructure and Utilities
Infrastructure in Chikwawa is moderately developed as compared with other districts in
Malawi due to the fact that the district is largely within a flood prone and protected areas as
well as steep hilly areas. Road infrastructure covers a total of 1,795 ha including all
designated roads and road reserves. Electricity way leaves in Chikwawa District cover 2,586
ha.
8.7 NATURAL PHYSICAL DEVELOPMENT CONSTRAINTS AND POTENTIALS Natural physical development constraints and potentials in Chikwawa have a very big
influence in the current and future development of the district.
8.7.1 Physical Development Constraints
8.7.1.1 Swamps and Flood Plains
The land in these flood plains is flooded every year and during this period the land is not
usable until the floods subside.
8.7.1.2 The Rift Valley Steep Slopes
Most of the eastern bank of Shire River is too steep and usually have rock outcrops and is not
recommended for cultivation and human settlements but as forest reserves and animal
reserves. However, some parts of this type of land are settled and farmed leading to very
heavy erosions, landslides and environmental and natural resource depletion and degradation.
8.7.2 Physical Development Potentials
Chikwawa District is blessed with some physical development potentials that provide
favourable conditions for socio-economic development. Some of these opportunities are;
8.7.2.1 Fertile alluvial soils
The district has very fertile alluvial soils that are good for different types of crop production.
These fertile soils are available along Shire River plains.
8.7.2.2 Abundance of Water Resources
Chikwawa has abundant water resources since Shire River is the natural outlet for Lake
Malawi. This means that huge amounts of water pass through this area all the time of the

CHIKWAWA DISTRICT PHYSICAL DEVELOPMENT PLAN
130
year and can be harvested and used for large-scale commercial agriculture to ensure food
security in the district and the nation at large.
8.7.2.3 Favourable Weather for Crops and Livestock
The hot and humid weather for the area is good for intensive crop and animal production. In
addition, the availability of perennial water bodies such as Shire River provide enough
drinking water for the animals as well as facilitating the growth of pasture for the animal to
feed on. Currently value addition in animals and crops is not maximized. These products are
taken out raw and unprocessed.
8.7.2.4 Availability of Large Scale Holdings and Nature Reserves
Chikwawa is also a district with large scale holdings at industrial scale and huge game
reserves. Such enterprises are Illovo Sugar, PressCane Industries, Lengwe National Park,
Majete Wildlife reserve, Elephant marsh, and Nyala Park. These enterprises provide socio-
economic development opportunities for the district as they attract foreign exchange through
international trade and tourism.
8.7.3 Land for Future Uses
Considering the current population carrying capacity of the land in Chikwawa District as a
whole, there is no sufficient land to meet the requirements of the future population to year
2040. Refer to table 48 showing Existing and Proposed Major Land Uses.
Land for future fuelwood forests will not be enough by 2040 and will require some land to be
reserved for this purpose. If no land is available in future consequences will be serious and
destruction of woodlands will have disruptive impact on water catchments areas and steep
slopes and resulting in increase in erosion and floods. Urban areas will be the first and worst
affected by the fuelwood shortages. The following table depicts designated land uses.
Table 47: Existing Major Land Uses
Land use category Land Area (ha) % of total district
land area
% of national
land area
Lengwe National Park 88,700.00 19% 0.82
Elephant Marsh 27,367.00 6% 0.20
Illovo 19,000.00 4% 0.70
Shire Valley Transformation project 7,843.00 2% 0.08
Majete Wildlife Reserve 69,100.00 15% 0.60
Forest Reserves 17,000.00 4% 0.18
Arable Dry Land (Cultivated Agriculture) 212,153.00 45% 2.10
Arable Wet Land (Cultivated Agriculture) 30,253.47 6% 0.30
Conserved Area 1,515.16 0% 0.02
Grand total 472,931.63 100% 5.00
Source: Physical Planning Department 2019
Table 48: Summary of Existing and Proposed Major Land Uses
Existing Land Use Proposed Land Use Decrease Increase
Agriculture 147,995.17 Agriculture 132,525.76 15,469.41
PressCane 25.77
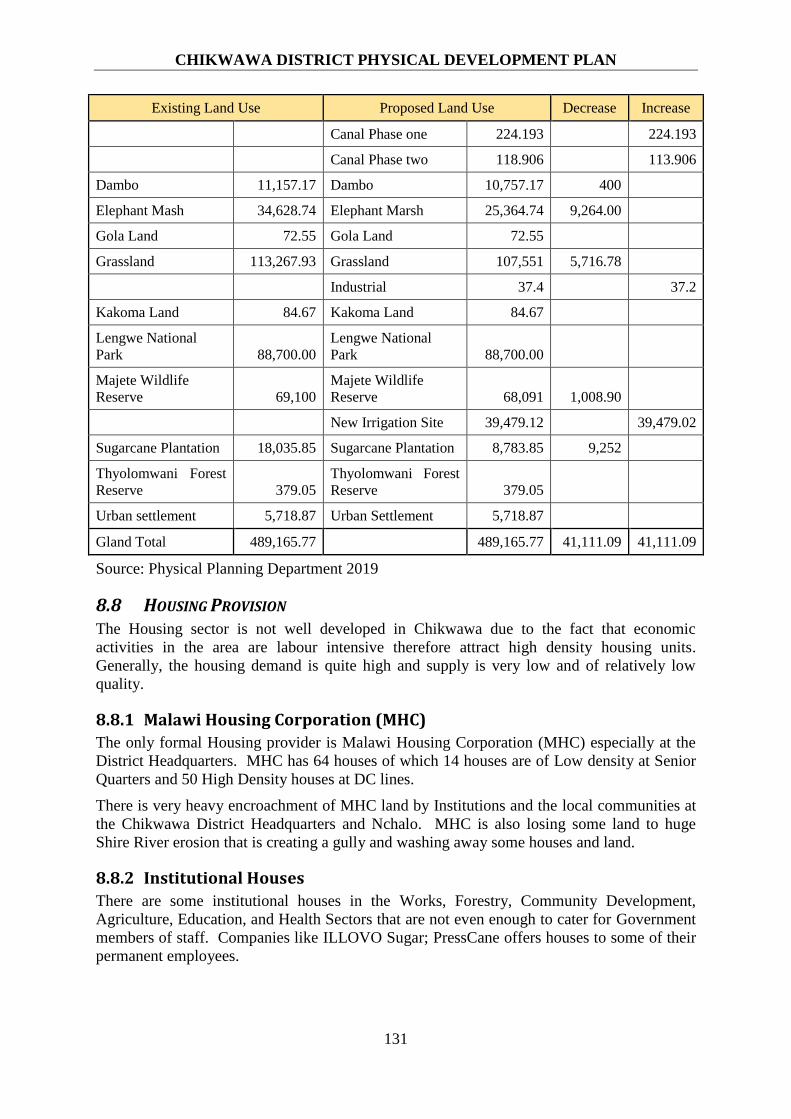
CHIKWAWA DISTRICT PHYSICAL DEVELOPMENT PLAN
131
Existing Land Use Proposed Land Use Decrease Increase
Canal Phase one 224.193 224.193
Canal Phase two 118.906 113.906
Dambo 11,157.17 Dambo 10,757.17 400
Elephant Mash 34,628.74 Elephant Marsh 25,364.74 9,264.00
Gola Land 72.55 Gola Land 72.55
Grassland 113,267.93 Grassland 107,551 5,716.78
Industrial 37.4 37.2
Kakoma Land 84.67 Kakoma Land 84.67
Lengwe National
Park 88,700.00
Lengwe National
Park 88,700.00
Majete Wildlife
Reserve 69,100
Majete Wildlife
Reserve 68,091 1,008.90
New Irrigation Site 39,479.12 39,479.02
Sugarcane Plantation 18,035.85 Sugarcane Plantation 8,783.85 9,252
Thyolomwani Forest
Reserve 379.05
Thyolomwani Forest
Reserve 379.05
Urban settlement 5,718.87 Urban Settlement 5,718.87
Gland Total 489,165.77 489,165.77 41,111.09 41,111.09
Source: Physical Planning Department 2019
8.8 HOUSING PROVISION The Housing sector is not well developed in Chikwawa due to the fact that economic
activities in the area are labour intensive therefore attract high density housing units.
Generally, the housing demand is quite high and supply is very low and of relatively low
quality.
8.8.1 Malawi Housing Corporation (MHC)
The only formal Housing provider is Malawi Housing Corporation (MHC) especially at the
District Headquarters. MHC has 64 houses of which 14 houses are of Low density at Senior
Quarters and 50 High Density houses at DC lines.
There is very heavy encroachment of MHC land by Institutions and the local communities at
the Chikwawa District Headquarters and Nchalo. MHC is also losing some land to huge
Shire River erosion that is creating a gully and washing away some houses and land.
8.8.2 Institutional Houses
There are some institutional houses in the Works, Forestry, Community Development,
Agriculture, Education, and Health Sectors that are not even enough to cater for Government
members of staff. Companies like ILLOVO Sugar; PressCane offers houses to some of their
permanent employees.

CHIKWAWA DISTRICT PHYSICAL DEVELOPMENT PLAN
132
8.8.3 Private Real Estate Enterprises
There is also a well-developed private sector real estate market at the District Headquarters,
Nchalo Trading centre and Ngabu Trading centre. These private land lords offer relatively
high quality houses but more expensive than MHC and Institutional houses.
8.8.4 Rural Housing Project
Rural Housing Project is under the Department of Housing in the Ministry of Lands, Housing
and Urban Development. Chikwawa district is one of the districts that has benefited from the
project. The main objective of the project is to ensure improved access to safe and quality
shelter for the rural people. The target for the district from 2014 to 2019 was to construct
1,558 houses. The table below illustrates the progress of the project and beneficiaries.
Table 49: Progress and the Beneficiaries of the Project
No Constituency
Beneficiaries
Total Houses Under
Construction
Houses
Completed
Houses
not yet
Started Male Female
1. Chikwawa Central 76 26 102 47 36 19
2. Chikwawa South 103 31 134 35 88 8
3. Chikwawa East 124 36 160 30 105 25
4. Chikwawa North 84 35 119 46 41 31
5. Chikwawa West 88 45 133 39 81 21
6. Chikwawa Mkombezi 106 23 129 40 64 25
Total 581 196 777 237 415 129
Source: Chikwawa Rural Housing Office 2019
8.9 FORMER MALAWI YOUNG PIONEERS (MYP) BASES LAND Chikwawa District is one of the districts that had the Malawi Young Pioneer (MYP) bases in
Malawi, stationed at Kakoma and Gola sites within T/A Chapananga. The land in these sites
is very fertile and suitable for crop production. MYP used to commercially produce maize
and vegetables sold at Chikwawa Boma Market and to the surrounding communities.
8.9.1 Kakoma Former MYP Base
Kakoma is about 24 Km from Chikwawa District Headquarters and covers 84.76 ha. Some
of the former MYP structures are still in use to-date. These include a hostel block for the
pioneers which is currently being used as a girls’ hostel for Kakoma Community Day
Secondary School and two MYP staff houses currently used as teacher’s houses for the same.
The area also has new structures that have been recently developed which include Kakoma
Community Day Secondary School’s school blocks and teachers’ houses, Police unit, and a
Community Based Organization (CBO) Office. The other part of the land is being used for
settlement while a larger part is under cultivation.
8.9.2 Gola former MYP Base
Gola is 67 Km from Chikwawa District Headquarters and covers 22.71 ha. The structures at
Gola are dilapidated with no new developments.. However, part of the land is now used for
cultivation by surrounding communities with permission from their local chief.

CHIKWAWA DISTRICT PHYSICAL DEVELOPMENT PLAN
133
8.9.3 Proposed Uses for Kakoma and Gola ex MYP Bases.
The Plan proposes that the remaining land at Kakoma be returned back to agricultural use.
This is so because the land is deemed as very fertile, hence would be crucial for increased
agricultural production. Furthermore, the land at Gola has not been encroached much. As
such the Plan proposes to revert this land back to agricultural use. The land can be used for
integrated ecotourism and the production of high end vegetables, fruits, bee farming in the
heavily forested hilly areas and any high end horticultural production. The land at Gola is
very fertile with perennial rivers but mountainous as such still needs to maintain some of its
forest areas to avoid environmental degradation.
8.10 DISASTER ISSUES MANAGEMENT SYSTEMS Historically, Chikwawa District has experienced disasters and there is a well-developed
disaster management system at the District Commissioner’s Offices. The main cause of these
disasters is due to negative effects of human activity and climatic changes. Examples of
these human and natural causes are, deforestation, poor farming methods, and natural
climatic changes leading to too much or too little rain which culminate into flooding or
droughts.
The district is prone to a number of hazards. These include: geological hazards such as
earthquakes and landslides; hydro-meteorological hazards such as strong winds, floods,
droughts, extreme temperatures, severe storms and hailstorms; health-ecological hazards such
as air pollution, water pollution, soil contamination, and extinction of flora and fauna species.
8.10.1 Disasters in Chikwawa
The types of disasters in Chikwawa District are; floods, dry spells/drought and strong winds.
Other disasters that have occurred or may occur include; HIV and AIDS, cholera, army
worms, foot and mouth disease. Chikwawa District has been experiencing disasters for so
many years but the most disastrous one are the 2015 and 2019 flood disasters were many
people lost their lives. Flooding in Chikwawa occurs almost every year. Some rivers
originating from the four districts of Blantyre, Mwanza, Thyolo and Neno contribute to the
flooding in Chikwawa District.
8.10.2 Disaster Mitigation Measures
There has been some deliberate efforts in mitigating disasters in the district such as the
construction of Dykes by Illovo and Government. However, the dykes have been damaged
by the recent floods and they need heavy repairs. Some efforts have also been made in the
training of communities on how they can protect river banks through planting of trees and
avoid cultivating in the river banks in order to reduce and minimize erosion and flooding.
8.10.3 Disaster Resilience System
In order to reduce flooding in some rivers, Government has been doing some river catchment
area conservation projects in Chikwawa. This has been done through tree regeneration,
planting of vertiva grass, and creation of contour terraces. Efforts have been done in the
sensitization of the local people in the construction of safer houses based on the design by the
Department of Housing.
8.10.4 Early Warnings Measures
Early warning systems in Chikwawa comprise water level monitoring by the local
communities and hydro gauge stations along major flood prone rivers such as Mkombezi and

CHIKWAWA DISTRICT PHYSICAL DEVELOPMENT PLAN
134
Mwanza; Using announcements on radios and television stations; and means of
communication during disasters are, call persons (kafuule), mobile phones, walking /riding,
letters, megaphones, VHS radios by Chikwawa Police and District Hospital.
Rescue operations are done through the use of dugout canoes, engine boats, government
vehicles and in special cases, helicopter. Generally, there are no specific disaster evacuation
centres where people can escape to and people mainly use schools and churches as
evacuation centres.
8.10.5 Disaster Management System
Disaster issues in Malawi are handled by DODMA which is under the OPC. At the local
level, the District Commissioner through the Disaster Officer manages disasters through the
District Civil Protection Committee and Area Civil Protection Committee. Refer to Figure
56, Map Showing Disaster Flood Risk Areas.

135
Figure 56: Map Showing Disaster Flood Risk Areas

136
8.10.6 Key Issues
Shortage of land for development in the district is a challenge due to wanton encroachments
by local people on government land. For instance there was a proposal to move the District
hospital from Chikwawa District headquarters to alternative area due to flooding effects
however despite availability of funds to undertake the development it failed because there
was no land. The only land that was available for the council has been encroached.
The district is prone to disasters which are caused by strong winds and floods. Due to the
occurrence of strong winds in 2019 the roof of the District Council Offices was brown off
and many houses in the district were also affected.
There is no formal development control mechanism in the district due to unavailability of
physical planners which has resulted in haphazard, low quality and unsafe structures.
Idle land and underutilization of land by estate holders is also a challenge to the development
of the district. Despite shortage of land in the district large parcels of the land under private
ownership are not used and some have been abandoned by absentee land lords.
Poor environmental planning and management is another challenge. There are no waste
management sites for large companies, market centres and households as a result there is no
proper waste disposal and an increase in both water and air pollution in the district.
There have been on-going encroachments in hazardous areas. There is an increase in
settlement of local people in the disaster prone areas such as along Shire River banks which
has posed serious damages to property and loss of lives in times of disasters
Tenure insecurity is a major issue in the district. Although land tenure security has been
prioritized in government policies and strategies. The National Land Policy is one of the
policies which seeks to ensure tenure security and equitable access to land for all, Theme One
Sub Theme Five of the Malawi Growth & Development Strategy (MGDS) also seeks to
ensure tenure security and equitable access to land as one of its long term goal for achieving
sustainable economic growth.
Chikwawa District is one of the districts with a highest rate of tenure insecurity since most of
the land holders have no land titles. Land is an asset for economic growth and land that has
no title is “dead capital”.16 This highlights that lack of tenure security is one of the factors
that has affected economic growth of the district.
Lack of industrial land is also an issue in the district. The district is very productive in terms
of agriculture, livestock production and suitable for industries. Despite its potential in
production there are no proper sites that were designated for industrial use.
16 De Soto; 2000, p. 275
CHIKWAWA DISTRICT PHYSICAL DEVELOPMENT PLAN
137
9 INSTITUTIONAL FRAMEWORK FOR PLANNING AND IMPLEMENTATION
9.1 INTRODUCTION This chapter outlines the roles of some institutions involved in the process of preparing and
implementing the Chikwawa District Physical Development Plan. It also identifies
institutions in various sectors to spearhead implementation, monitoring and evaluation of the
Plan.
9.2 DEPARTMENT OF PHYSICAL PLANNING Although the Department of Physical Planning has been assigned the responsibility to prepare
the Plan, its specific legal mandate under the Physical Planing Act is to approve the district
physical development plans prepared by the Council and ensure that the district councils are
carrying out development control effectively and efficiently and that all physical
developments in the districts are being implemented according to the Plans. Thus the
Department of Physical Planning is further responsible for monitoring of the implementation
of the Plan and making recommendations for plan review where necessary.
9.3 DEPARTMENT OF HOUSING This will be responsible for providing ‘Safer Construction Guidelines and Building Standards
and monitoring infrastructure development in the district.
9.4 LOCAL GOVERNMENT AUTHORITIES
9.4.1 Chikwawa District Council
The councils are mandated to formulate by-laws for governing their operations. The term
council refers to councillors as elected representative members of wards, elected
parliamentarians, traditional authorities, five nominated members representing interest groups
namely the disabled, women, youth, faith groups and business persons. The District
Commissioner heads the district council’s secretariat and is supported by professional heads
of various Government Departments or sectors.
The district councils have the following functions:
To make policies and decisions on local government and development
To promote infrastructural, economic and social development through approval and
execution of district development plans
To mobilize resources for development
According to Physical Planning Act 2016, it is the responsibility of the Local Government
authorities to prepare district physical development plans and local physical development
plans in their areas of jurisdiction. They are also mandated to execute development control
and enforcement. However, the Department of Physical Planning has been entrusted with the
Chikwawa District Physical Development Plan preparation due to lack of physical planning
capacity at Chikwawa District Council just as it is the case with all district councils in the
country.
CHIKWAWA DISTRICT PHYSICAL DEVELOPMENT PLAN
138
9.4.2 District Executive Committee/Council’s Secretariat (DEC/CS
District Executive Committee is composed of all heads of Government Departments or
sectors, non-state actors and NGOs. Its main role is to give technical advice to the council.
However, some Government Departments have not yet devolved to the district council level.
This creates capacity challenges.
9.4.3 ADCs and VDCs
There are 11 area development committees in Chikwawa District which are operational and
chaired by selected elected members and supervised by Chiefs/TAs. Their main roles are to
mobilize community resources and determine interventions in the traditional authority area.
The ADCs are given technical advice on local aspects of development by area executive
committees comprising extension workers of Government agencies and NGOs in a TAs area.
Figure 57, is a Map Showing TA Boundaries in Chikwawa District. There are also 220
village development committees (VDCs) in the district which are representative bodies from
groups of villages. The roles of a VDC are to identify the needs of the local communities and
to facilitate the Planning and development of the same.

139
Figure 57: Map Showing Boundary of Traditional Authority
140
9.4.4 Issues and Planning Implication
There is lack of physical planning capacity at the council. The Department of Physical
Planning should devolve some of its functions to the district council and Ministry of Local
Government and the District Council should deploy or employ physical planners for the Plan
to achieve its goals.
9.4.5 District Agriculture Development Office
The Chikwawa District Agricultural Development Office has the responsibility to develop the
agriculture sector through its crop, irrigation and livestock departments. It provides its
services to farmers in the following Extension Planning Areas (EPAs): Livunzu, Dolo,
Kalambo, Mikalango, Mbewe and Mitole. The services include dissemination of
technologies for crop husbandry, animal husbandry and irrigation farming. The farmers are
accessed through Village Development Committees (VDCs), Village Agriculture Committees
(VACs), Area Development Committees (ADCs), Agriculture Stakeholders Panel (ASP),
District Agriculture Executive Committee (DAEC), the technocratic District Agriculture
Extension Coordinating Committee (DAECC) and District Agriculture Committee (DAC).
The division also advises the agro-dealers in the district on suitable agricultural inputs and
equipment.
9.5 ISSUES AND PLANNING IMPLICATIONS The district is supposed to be manned by 124 agriculture extension workers but only 55 of
them are on the ground. Hence; there is need for the Ministry responsible for agriculture to
fill the vacant posts of extension workers. The Eastern Bank (Livunzu and Kalambo EPAs)
is considered as focal point for irrigation farming in Chikwawa due to many rivers flowing
and its gradient is high there whilst the West Bank (Dolo, Mikalango, Mbewe and Mitole) is
taken as dry land due to lack of flowing rivers and has low gradient with lots of land with
limited agricultural production due to unreliable rainfall. Hence, there is need to implement
Shire River canal irrigation which will be powered by gravity hence affordable to many
farmers. The canal will also make the dry land more productive through irrigation farming.
141
9.6 ROLES OF ADMARC AND OTHER SIMILAR BODIES
9.6.1 Challenges
The Agricultural Development and Marketing Corporation (ADMARC) is a parastatal
organization established by Act of Parliament in 1977. ADMARC is faced with the following
challenges:
Stiff competition from other traders and vendors;
Natural disasters such as wind storm in 2015 which damaged former premises at the
District Headquarters/Dyeratu;
Inadequate resources;
Untimely disbursements of resources;
High demand versus limited supplies; and
Poor premises.
9.6.2 Issues and Implications
ADMARC has interest in areas of agricultural production, land use, population and
employment. Hence, its roles and interests necessitate its involvement in the Chikwawa
District Physical Development Plan formulation process. However, it is apparently Ngabu
ADMARC station and a few other stations that are fully functioning in the district. It has
already located a cotton ginning factory at Ngabu. ADMARC has partnered with the Green
Belt Authority - an example of partnerships that other farming players in the district might
emulate in the quest to commercialise agriculture in the district.
There is need to sensitise developers in the district to embark on erecting disaster resilient
physical structures to minimize the disaster risk in the district. The Housing Department
should support with specifications on disaster resilient building construction.
9.7 DEPARTMENT OF WILDLIFE AND PARKS Chikwawa District has a number of wildlife protected areas like Lengwe National Park
covering 89,700ha, Majete Wildlife Reserve covering 69,100ha, Nyala Park covering 400ha
and the Elephant Marsh covering 400ha. These areas have lots of rare fauna and flora. The
wild animals include elephants and rhinos which are often a target by poachers for the
notorious illegal ivory and horn trade. The rare tree species include Phingo and Mitsipi
which are hardwood liked by the curios and timber industries. There are also cases of stray
lions crossing border from Mozambique into these protected areas and this threatens the local
communities surrounding the areas. These protected areas are susceptible to both local and
international illegal logging thereby risking extinction of the rare species. Considering the
huge size and shear number of the protected areas in one district, the Department of Wildlife
and Parks has a tremendous responsibility to conserve them.
9.8 ISSUES AND PLANNING IMPLICATIONS i. Abrupt boundaries with local communities and encroachment, hence no room for
expansion of some protected areas;
ii. Local and international illegal logging;
iii. Inaccessible park roads in wet season and water logged conditions; and
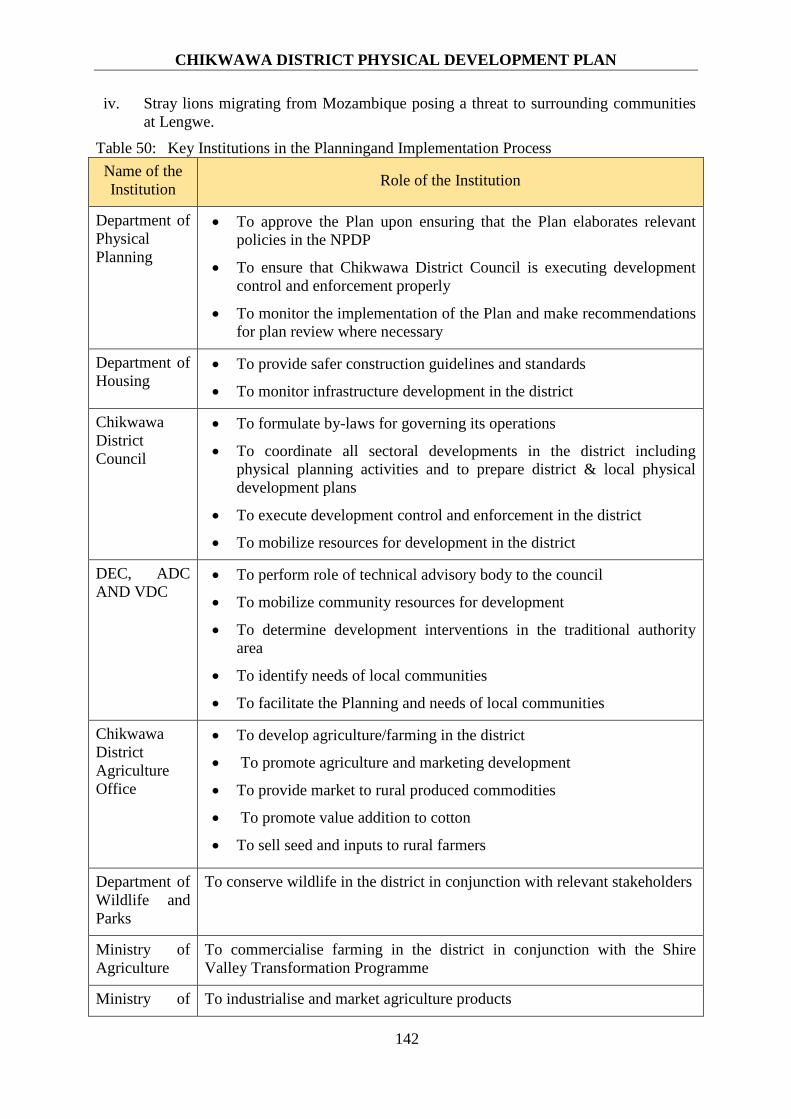
CHIKWAWA DISTRICT PHYSICAL DEVELOPMENT PLAN
142
iv. Stray lions migrating from Mozambique posing a threat to surrounding communities
at Lengwe.
Table 50: Key Institutions in the Planningand Implementation Process
Name of the
Institution Role of the Institution
Department of
Physical
Planning
To approve the Plan upon ensuring that the Plan elaborates relevant
policies in the NPDP
To ensure that Chikwawa District Council is executing development
control and enforcement properly
To monitor the implementation of the Plan and make recommendations
for plan review where necessary
Department of
Housing To provide safer construction guidelines and standards
To monitor infrastructure development in the district
Chikwawa
District
Council
To formulate by-laws for governing its operations
To coordinate all sectoral developments in the district including
physical planning activities and to prepare district & local physical
development plans
To execute development control and enforcement in the district
To mobilize resources for development in the district
DEC, ADC
AND VDC To perform role of technical advisory body to the council
To mobilize community resources for development
To determine development interventions in the traditional authority
area
To identify needs of local communities
To facilitate the Planning and needs of local communities
Chikwawa
District
Agriculture
Office
To develop agriculture/farming in the district
To promote agriculture and marketing development
To provide market to rural produced commodities
To promote value addition to cotton
To sell seed and inputs to rural farmers
Department of
Wildlife and
Parks
To conserve wildlife in the district in conjunction with relevant stakeholders
Ministry of
Agriculture
To commercialise farming in the district in conjunction with the Shire
Valley Transformation Programme
Ministry of To industrialise and market agriculture products

CHIKWAWA DISTRICT PHYSICAL DEVELOPMENT PLAN
143
Name of the
Institution Role of the Institution
Industry and
Trade
DoDMA To coordinate disaster risk management activities including risk reduction,
disaster mitigation and resilience in the district
CHIKWAWA DISTRICT PHYSICAL DEVELOPMENT PLAN
144
10 INSTITUTIONAL FRAMEWORK FOR PLAN IMPLEMENTATION
10.1 INTRODUCTION Implementation of the Chikwawa District Physical Development Plan calls for a coherent,
systematic and coordinated approach given multiple sector actors. Furthermore, to ensure
smooth implementation, there is need for human resource, financial and institutional capacity
building at Council. Using the legal, regulatory and institutional framework, the Plan intends
to promote improved land use planning and management for orderly, coordinated and
sustainable socio-economic development.
10.2 LEGAL AND REGULATORY FRAMEWORK The Physical Planning Act 2016 is the principle statutory instrument governing physical
planning in Malawi. The Malawi National Land Policy (MNLP) stipulates that the
application of the physical planning law should extend land use and development control to
all rural and urban areas. In essence, the policy provision declared the whole country to be a
planning area. This implies that all land owners and custodians are required to comply with
land use planning and management policies, legal instruments and practices.
The Physical Planning Act 2016 gives the Local Government Authorities responsibility to
prepare district physical development plan. Sections 29-32 of the Act stipulate the Plan’s
content, preparation and approval process. Section 32(1) of the Act provides that once a
district physical development plan has been approved by the Commissioner for Physical
Planning, all plans, programmes and projects of development proposed for the district, shall,
as far as practicable, be so formulated and prepared as to have regard to, and take into
account, the district physical development plan. Subsidiary Physical Planning Act 2016
regulations clarify implementation modalities of the Act and ensure smooth implementation
of the same.
Other land related laws which are critical for the implementation of the Plan and the existing
development programmes include the following: The Land Act, 2016; Customary Land Act,
2016; Registered Land (Amendment) Act, 2016, Land Survey Act 2016; the Forestry
(Amendment) Act, 2016; and the Local Government (Amendment) Act, 2010.
10.3 IMPLEMENTATION AND MONITORING Establishment of a District Planning Committee, processing of development plans and
monitoring and evaluation of the physical development plan implementation to ensure
compliance, will be some of the key activities. Section 19(1) of the Physical planning Act
empowers a local government authority to appoint a planning committee for its area of
jurisdiction which is charged with the responsibility for preparation of a district physical
development plan, local physical development plans and development control and
enforcement. Development control will be enforced through the development application
approval process in accordance with Section 46(1) of the Physical Planning Act which makes
it mandatory for all nature of development, except for permitted development, to obtain
development permission from the Planning committee prior to the commencement of the
development. Section 50(1) of the Physical Planning Act stipulates that in considering any
application for development permission, the responsible authority shall, subject to the Act, or
any other written law, take into account all matters deemed to be material to the proposed
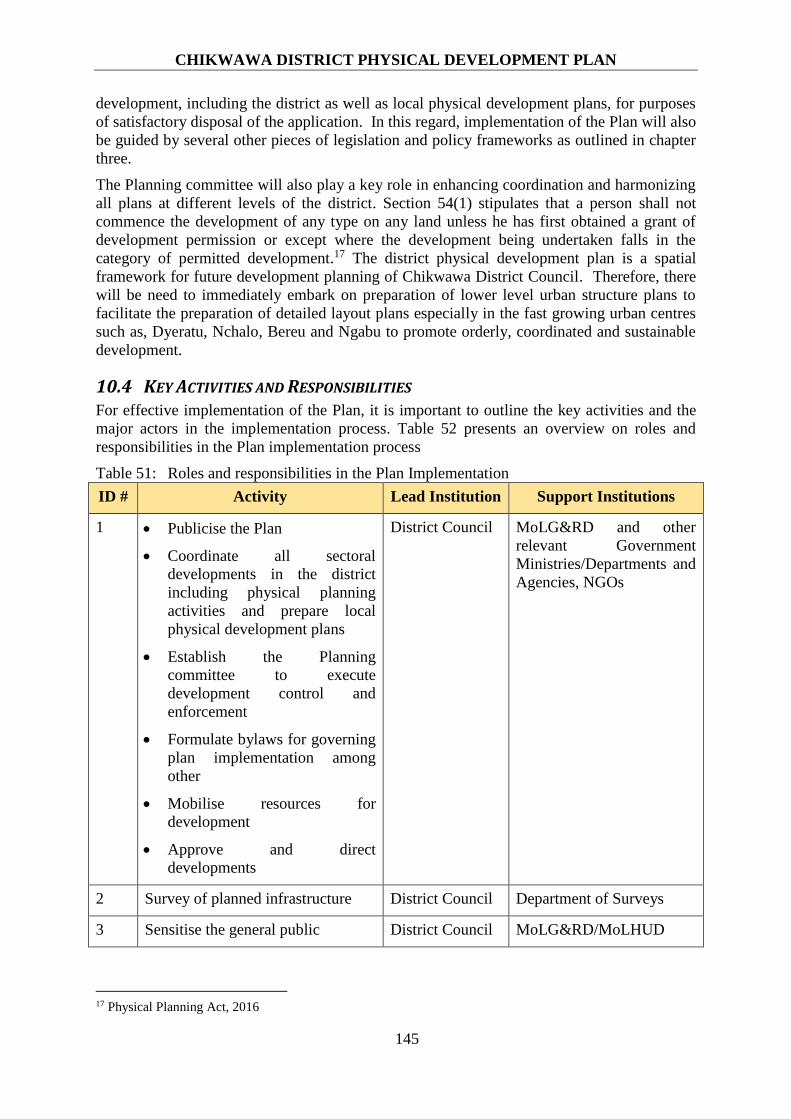
CHIKWAWA DISTRICT PHYSICAL DEVELOPMENT PLAN
145
development, including the district as well as local physical development plans, for purposes
of satisfactory disposal of the application. In this regard, implementation of the Plan will also
be guided by several other pieces of legislation and policy frameworks as outlined in chapter
three.
The Planning committee will also play a key role in enhancing coordination and harmonizing
all plans at different levels of the district. Section 54(1) stipulates that a person shall not
commence the development of any type on any land unless he has first obtained a grant of
development permission or except where the development being undertaken falls in the
category of permitted development.17 The district physical development plan is a spatial
framework for future development planning of Chikwawa District Council. Therefore, there
will be need to immediately embark on preparation of lower level urban structure plans to
facilitate the preparation of detailed layout plans especially in the fast growing urban centres
such as, Dyeratu, Nchalo, Bereu and Ngabu to promote orderly, coordinated and sustainable
development.
10.4 KEY ACTIVITIES AND RESPONSIBILITIES For effective implementation of the Plan, it is important to outline the key activities and the
major actors in the implementation process. Table 52 presents an overview on roles and
responsibilities in the Plan implementation process
Table 51: Roles and responsibilities in the Plan Implementation
ID # Activity Lead Institution Support Institutions
1 Publicise the Plan
Coordinate all sectoral
developments in the district
including physical planning
activities and prepare local
physical development plans
Establish the Planning
committee to execute
development control and
enforcement
Formulate bylaws for governing
plan implementation among
other
Mobilise resources for
development
Approve and direct
developments
District Council MoLG&RD and other
relevant Government
Ministries/Departments and
Agencies, NGOs
2 Survey of planned infrastructure District Council Department of Surveys
3 Sensitise the general public District Council MoLG&RD/MoLHUD
17 Physical Planning Act, 2016

CHIKWAWA DISTRICT PHYSICAL DEVELOPMENT PLAN
146
ID # Activity Lead Institution Support Institutions
4 Develop Capacity for plan making
and implementation
District Council MoLG&RD, MoLHUD and
other relevant Ministries
5 Carry out Monitoring and
Evaluation exercises
District Council MoLG&RD and
Department of Physical
Planning
6 Provide technical advice to the
council
Mobilise community resources
for development
Determine development
interventions in the traditional
authority areas
Identify needs of local
communities
Facilitate the Planning and
needs of local communities
DEC, ADC
AND VDC
Relevant Government
Ministries/Departments and
Agencies, NGOs
7 Develop agriculture/farming in
the district
Promote agriculture and
marketing development
Provide market to rural
produced commodities
Promote value addition to
cotton
Sell seed and inputs to rural
farmers
Shire Valley
Agricultural
Development
Division
Relevant Government
Ministries/Departments and
Agencies, NGOs
8 Conserve wildlife in the district in
conjunction with relevant
stakeholders
Department of
Wildlife and
Parks
Relevant Government
Ministries/Departments and
Agencies, NGOs/CBOs
9 Commercialise farming in the
district in conjunction with the
Shire Valley Transformation
Programme
Ministry of
Industry and
Trade
Relevant Government
Ministries/Departments and
Agencies, NGOs
10 Coordinate disaster risk
management activities including
risk reduction, disaster mitigation
and resilience in the district
Department of
Disaster
Management
Affairs
(DoDMA)
Relevant Government
Ministries/Departments and
Agencies, NGOs
11 Promote delivery of adequate Department of Relevant Government
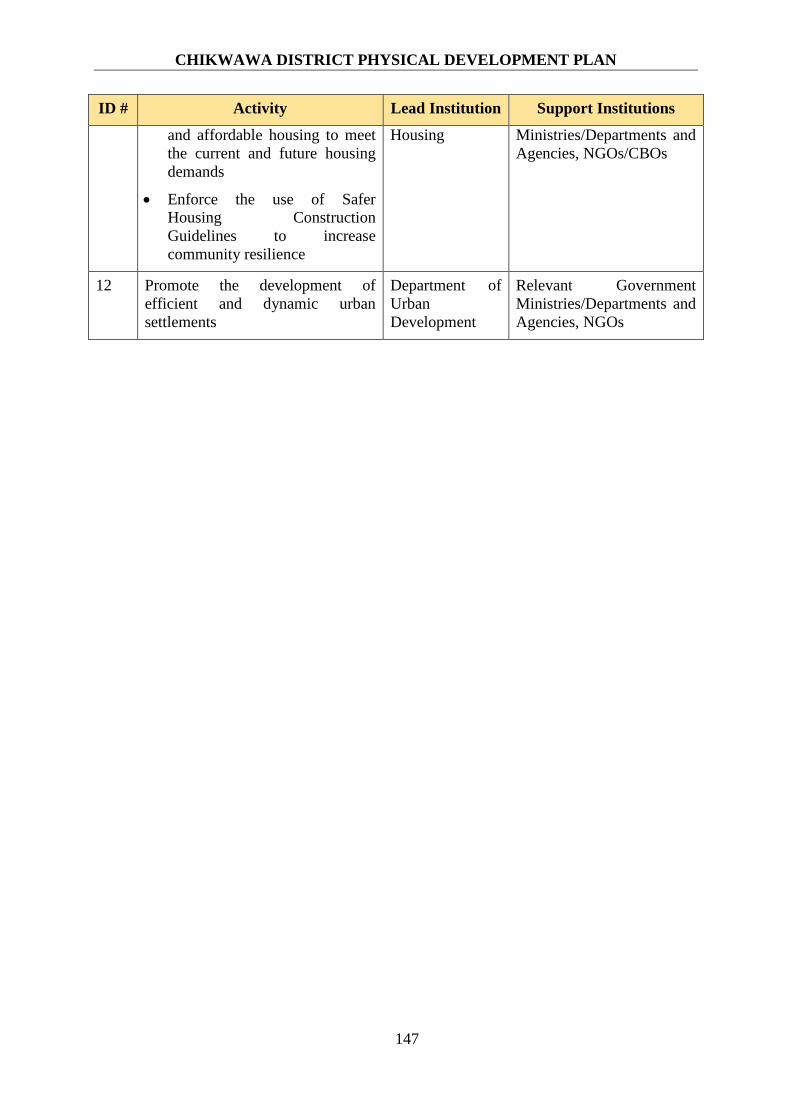
CHIKWAWA DISTRICT PHYSICAL DEVELOPMENT PLAN
147
ID # Activity Lead Institution Support Institutions
and affordable housing to meet
the current and future housing
demands
Enforce the use of Safer
Housing Construction
Guidelines to increase
community resilience
Housing Ministries/Departments and
Agencies, NGOs/CBOs
12 Promote the development of
efficient and dynamic urban
settlements
Department of
Urban
Development
Relevant Government
Ministries/Departments and
Agencies, NGOs
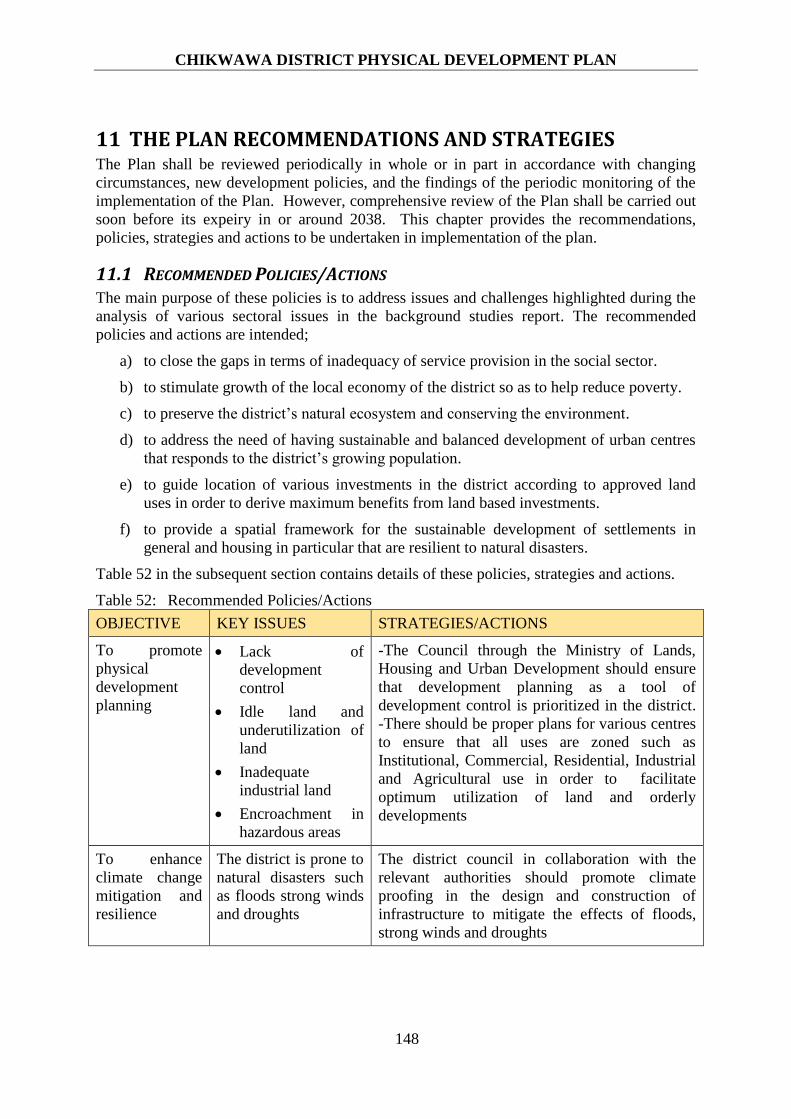
CHIKWAWA DISTRICT PHYSICAL DEVELOPMENT PLAN
148
11 THE PLAN RECOMMENDATIONS AND STRATEGIES The Plan shall be reviewed periodically in whole or in part in accordance with changing
circumstances, new development policies, and the findings of the periodic monitoring of the
implementation of the Plan. However, comprehensive review of the Plan shall be carried out
soon before its expeiry in or around 2038. This chapter provides the recommendations,
policies, strategies and actions to be undertaken in implementation of the plan.
11.1 RECOMMENDED POLICIES/ACTIONS The main purpose of these policies is to address issues and challenges highlighted during the
analysis of various sectoral issues in the background studies report. The recommended
policies and actions are intended;
a) to close the gaps in terms of inadequacy of service provision in the social sector.
b) to stimulate growth of the local economy of the district so as to help reduce poverty.
c) to preserve the district’s natural ecosystem and conserving the environment.
d) to address the need of having sustainable and balanced development of urban centres
that responds to the district’s growing population.
e) to guide location of various investments in the district according to approved land
uses in order to derive maximum benefits from land based investments.
f) to provide a spatial framework for the sustainable development of settlements in
general and housing in particular that are resilient to natural disasters.
Table 52 in the subsequent section contains details of these policies, strategies and actions.
Table 52: Recommended Policies/Actions
OBJECTIVE KEY ISSUES STRATEGIES/ACTIONS
To promote
physical
development
planning
Lack of
development
control
Idle land and
underutilization of
land
Inadequate
industrial land
Encroachment in
hazardous areas
-The Council through the Ministry of Lands,
Housing and Urban Development should ensure
that development planning as a tool of
development control is prioritized in the district.
-There should be proper plans for various centres
to ensure that all uses are zoned such as
Institutional, Commercial, Residential, Industrial
and Agricultural use in order to facilitate
optimum utilization of land and orderly
developments
To enhance
climate change
mitigation and
resilience
The district is prone to
natural disasters such
as floods strong winds
and droughts
The district council in collaboration with the
relevant authorities should promote climate
proofing in the design and construction of
infrastructure to mitigate the effects of floods,
strong winds and droughts

CHIKWAWA DISTRICT PHYSICAL DEVELOPMENT PLAN
149
OBJECTIVE KEY ISSUES STRATEGIES/ACTIONS
To protect and
conserve
wildlife, forest
reserves and
forestry
products
Inadequate funding to
manage Lengwe
National Park and
other reserves
The Department of National Parks and Wildlife
in collaboration with ancillary authorities should
explore possibilities of using Public Private
Partnerships (PPPs) arrangements in the
management of Lengwe National Park and other
reserves to enhance investments and efficiency
Weak conservation
efforts by council
The Department of Forestry in collaboration with
other stakeholders to intensify capacity building
to strengthen conservation efforts
Inadequate integrated
community
management
initiatives
The Department of National Parks and Wildlife
should implement integrated community
management initiatives to improve management
of Elephant Marsh
Poor road
infrastructure
Poor accommodation
facilities
The Department of National Parks and Wildlife
should improve road infrastructure and construct
a modern and standard lodge at Lengwe National
Park
Encroachments,
poaching, bushfires,
illegal logging, and
illegal charcoal
production
The Department of National Parks and Wildlife
should intensify patrols and ensure that offenders
are punished to reduce encroachments, poaching,
bushfires, illegal logging, and illegal charcoal
production
Human-wildlife
conflict at Majete,
Lengwe, and Elephant
Marsh reserves
The Department of National Parks and Wildlife
in collaboration with the community and other
stakeholders should reduce human-wildlife
conflict at Majete, Lengwe, and Elephant Marsh
reserves by fortifying the electric fences
Human-wildlife
conflict
Reconstruct and rehabilitate the fence around
Lengwe National Park
High concentration of
animals at Majete
The Department of National Parks and Wildlife
in liaison with African Parks should explore the
possibility of relocating the animals to other
game reserves
Low report rate of
wildlife crimes
The Department of National Parks and Wildlife
in liaison with African Parks should introduce
incentives for people who report wildlife crimes
-Community
involvement in
forestry management
-Integrated forestry
management
-Lack of compliance
to regulations
The Department of Forestry should: Involve local
communities in forestry management; Intensify
bee-keeping as an alternative source of
livelihood; Establish nurseries and woodlots;
Introduce eco-tourism facilities in existing forest
reserves; and formulate enforceable and non-
discriminatory regulations for forestry products
harvesting.

CHIKWAWA DISTRICT PHYSICAL DEVELOPMENT PLAN
150
OBJECTIVE KEY ISSUES STRATEGIES/ACTIONS
-High vacancy rate -The Department of Forestry should recruit more
extension workers
-Human-wildlife
conflict
-Poaching
- The Department of National Parks and Wildlife
should construct an electric fence in the
remaining sections of Lengwe National Park
-Weak institutional
framework for forestry
management
- The Department of Forestry should ensure
functional Village Natural Resources
Management Committees
-Deforestation - The Department of Forestry should promote the
use of cost-effective fuel technologies and
afforestation programmes
-Deforestation of
catchment areas
- The council in liaison with the Department of
Forestry, Ministry of agriculture and other
stakeholders should undertake catchment area
conservation and restoration projects
Overdependence on
forests for fuelwood
- The Department of Forestry in collaboration
with key stakeholders should identify alternative
energy sources
Poor accommodation
and inadequate
equipment to
extension workers and
forest guards
The Department of Forestry should provide
adequate accommodation and equipment to
extension workers and forest guards
Inadequate water
availability for
animals
-The Plan endorses that Shire Valley
Transformation Programme should construct a
canal through Majete to Lengwe to enhance
water availability for animals
To promote
agricultural
production and
productivity
-Encroachment into
agricultural land
-The Plan recommends promotion of most
efficient use of land. In particular, ensure that
arable land is kept for agricultural uses to meet
the demands of the future population
Land tenure insecurity -The Plan proposes strengthening land tenure
security through implementation of new land
laws
-Irrigation
intensification
-Droughts
-The Plan endorses that Shire Valley
Transformation Programme should construct the
irrigation canal from the Shire River in the West
Bank to introduce viable irrigation farming and
piloting of the Land Reform Agenda
-Irrigation
intensification
-Droughts
-The Ministry of Agriculture, Irrigation and
Water Development should implement
interventions to intensify irrigation farming given
the vulnerability of the district to droughts and
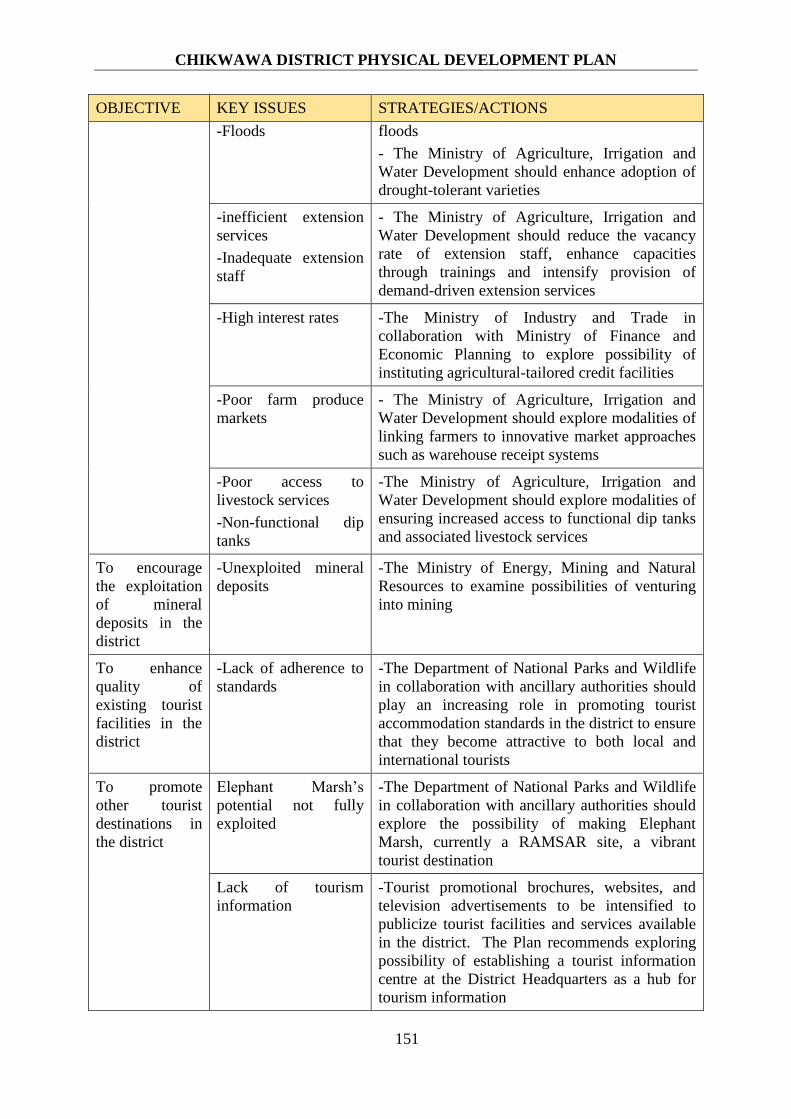
CHIKWAWA DISTRICT PHYSICAL DEVELOPMENT PLAN
151
OBJECTIVE KEY ISSUES STRATEGIES/ACTIONS
-Floods floods
- The Ministry of Agriculture, Irrigation and
Water Development should enhance adoption of
drought-tolerant varieties
-inefficient extension
services
-Inadequate extension
staff
- The Ministry of Agriculture, Irrigation and
Water Development should reduce the vacancy
rate of extension staff, enhance capacities
through trainings and intensify provision of
demand-driven extension services
-High interest rates -The Ministry of Industry and Trade in
collaboration with Ministry of Finance and
Economic Planning to explore possibility of
instituting agricultural-tailored credit facilities
-Poor farm produce
markets
- The Ministry of Agriculture, Irrigation and
Water Development should explore modalities of
linking farmers to innovative market approaches
such as warehouse receipt systems
-Poor access to
livestock services
-Non-functional dip
tanks
-The Ministry of Agriculture, Irrigation and
Water Development should explore modalities of
ensuring increased access to functional dip tanks
and associated livestock services
To encourage
the exploitation
of mineral
deposits in the
district
-Unexploited mineral
deposits
-The Ministry of Energy, Mining and Natural
Resources to examine possibilities of venturing
into mining
To enhance
quality of
existing tourist
facilities in the
district
-Lack of adherence to
standards
-The Department of National Parks and Wildlife
in collaboration with ancillary authorities should
play an increasing role in promoting tourist
accommodation standards in the district to ensure
that they become attractive to both local and
international tourists
To promote
other tourist
destinations in
the district
Elephant Marsh’s
potential not fully
exploited
-The Department of National Parks and Wildlife
in collaboration with ancillary authorities should
explore the possibility of making Elephant
Marsh, currently a RAMSAR site, a vibrant
tourist destination
Lack of tourism
information
-Tourist promotional brochures, websites, and
television advertisements to be intensified to
publicize tourist facilities and services available
in the district. The Plan recommends exploring
possibility of establishing a tourist information
centre at the District Headquarters as a hub for
tourism information
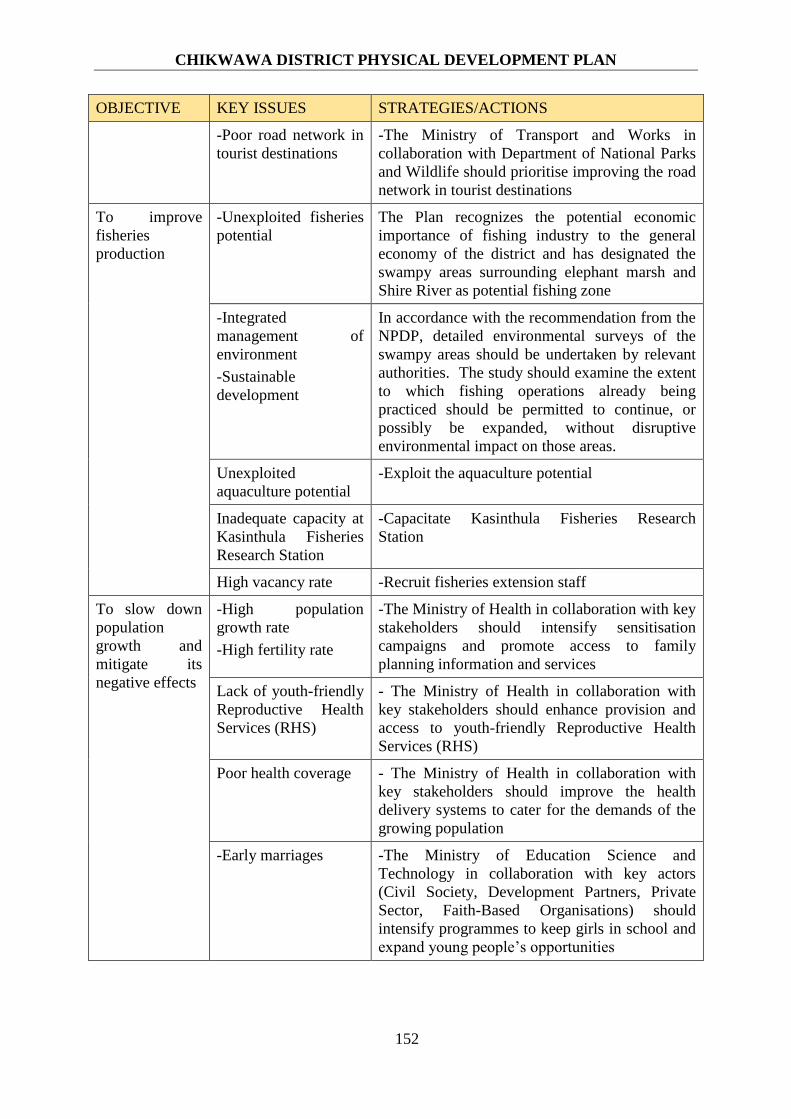
CHIKWAWA DISTRICT PHYSICAL DEVELOPMENT PLAN
152
OBJECTIVE KEY ISSUES STRATEGIES/ACTIONS
-Poor road network in
tourist destinations
-The Ministry of Transport and Works in
collaboration with Department of National Parks
and Wildlife should prioritise improving the road
network in tourist destinations
To improve
fisheries
production
-Unexploited fisheries
potential
The Plan recognizes the potential economic
importance of fishing industry to the general
economy of the district and has designated the
swampy areas surrounding elephant marsh and
Shire River as potential fishing zone
-Integrated
management of
environment
-Sustainable
development
In accordance with the recommendation from the
NPDP, detailed environmental surveys of the
swampy areas should be undertaken by relevant
authorities. The study should examine the extent
to which fishing operations already being
practiced should be permitted to continue, or
possibly be expanded, without disruptive
environmental impact on those areas.
Unexploited
aquaculture potential
-Exploit the aquaculture potential
Inadequate capacity at
Kasinthula Fisheries
Research Station
-Capacitate Kasinthula Fisheries Research
Station
High vacancy rate -Recruit fisheries extension staff
To slow down
population
growth and
mitigate its
negative effects
-High population
growth rate
-High fertility rate
-The Ministry of Health in collaboration with key
stakeholders should intensify sensitisation
campaigns and promote access to family
planning information and services
Lack of youth-friendly
Reproductive Health
Services (RHS)
- The Ministry of Health in collaboration with
key stakeholders should enhance provision and
access to youth-friendly Reproductive Health
Services (RHS)
Poor health coverage - The Ministry of Health in collaboration with
key stakeholders should improve the health
delivery systems to cater for the demands of the
growing population
-Early marriages -The Ministry of Education Science and
Technology in collaboration with key actors
(Civil Society, Development Partners, Private
Sector, Faith-Based Organisations) should
intensify programmes to keep girls in school and
expand young people’s opportunities
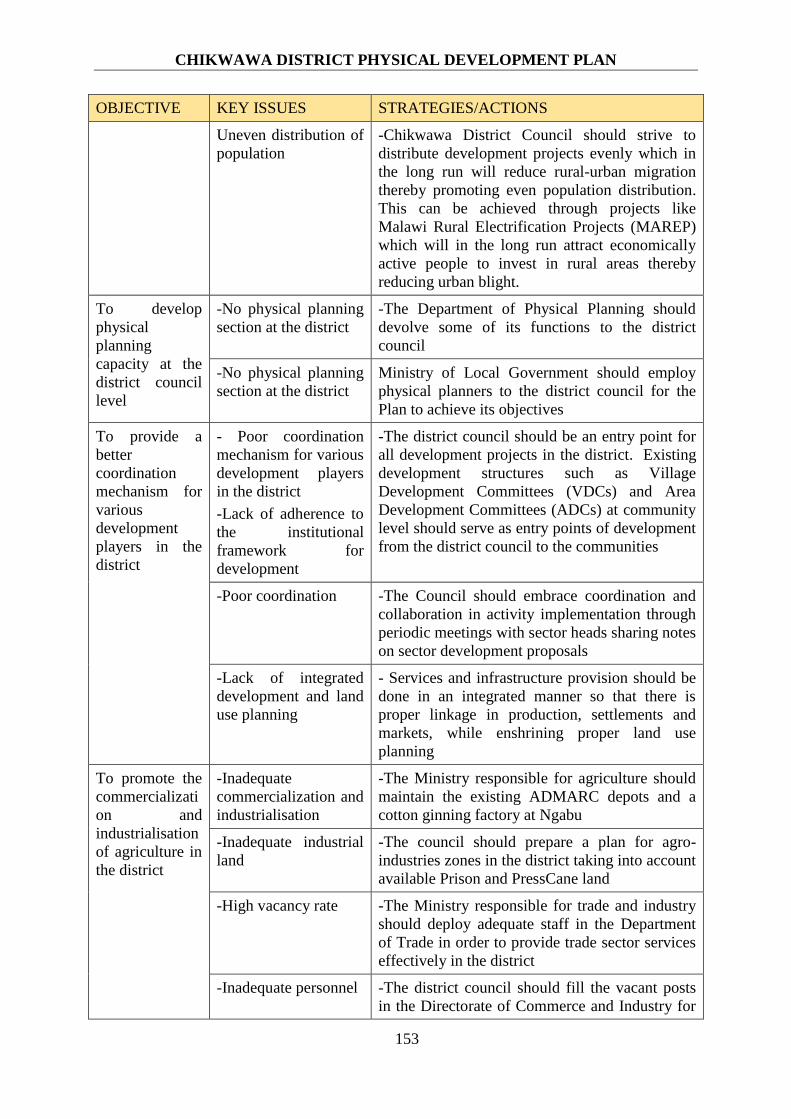
CHIKWAWA DISTRICT PHYSICAL DEVELOPMENT PLAN
153
OBJECTIVE KEY ISSUES STRATEGIES/ACTIONS
Uneven distribution of
population
-Chikwawa District Council should strive to
distribute development projects evenly which in
the long run will reduce rural-urban migration
thereby promoting even population distribution.
This can be achieved through projects like
Malawi Rural Electrification Projects (MAREP)
which will in the long run attract economically
active people to invest in rural areas thereby
reducing urban blight.
To develop
physical
planning
capacity at the
district council
level
-No physical planning
section at the district
-The Department of Physical Planning should
devolve some of its functions to the district
council
-No physical planning
section at the district
Ministry of Local Government should employ
physical planners to the district council for the
Plan to achieve its objectives
To provide a
better
coordination
mechanism for
various
development
players in the
district
- Poor coordination
mechanism for various
development players
in the district
-Lack of adherence to
the institutional
framework for
development
-The district council should be an entry point for
all development projects in the district. Existing
development structures such as Village
Development Committees (VDCs) and Area
Development Committees (ADCs) at community
level should serve as entry points of development
from the district council to the communities
-Poor coordination -The Council should embrace coordination and
collaboration in activity implementation through
periodic meetings with sector heads sharing notes
on sector development proposals
-Lack of integrated
development and land
use planning
- Services and infrastructure provision should be
done in an integrated manner so that there is
proper linkage in production, settlements and
markets, while enshrining proper land use
planning
To promote the
commercializati
on and
industrialisation
of agriculture in
the district
-Inadequate
commercialization and
industrialisation
-The Ministry responsible for agriculture should
maintain the existing ADMARC depots and a
cotton ginning factory at Ngabu
-Inadequate industrial
land
-The council should prepare a plan for agro-
industries zones in the district taking into account
available Prison and PressCane land
-High vacancy rate -The Ministry responsible for trade and industry
should deploy adequate staff in the Department
of Trade in order to provide trade sector services
effectively in the district
-Inadequate personnel -The district council should fill the vacant posts
in the Directorate of Commerce and Industry for

CHIKWAWA DISTRICT PHYSICAL DEVELOPMENT PLAN
154
OBJECTIVE KEY ISSUES STRATEGIES/ACTIONS
proper coordination of trade matters in the
district.
To encourage
formation of
cooperatives,
associations and
partnerships
among various
players in the
agriculture
sector
-Lack of partnerships
in investment
-ADMARC should maintain its existing
partnership with the Green Belt Authority, an
example of partnerships in the agriculture
industry
-Lack of partnerships
in investment
-Other farming players in the district should also
be encouraged to form partnerships that stimulate
agricultural commercialization
To mainstream
disaster risk
management in
physical
development of
the district
-The district is prone
to disasters such as
floods and drought
-The district council in collaboration with key
stakeholders should sensitise developers in the
district to embark on erecting disaster resilient
physical structures
-High disaster risks - The district council in collaboration with key
stakeholders should strengthen existing disaster
risk mitigation measures in the district
-High disaster risks -The district council through Department of
Disaster Management Affairs (DoDMA) and
Physical Planning should ensure proper planning
of various development projects and enhance
mitigation, resilience and disaster management
measures in the district
- High disaster risks - The district council in collaboration with key
stakeholders should strengthen early warning
systems existing in the district
-Erosion of Shire
River banks
-Floods
-Regarding landslides eroding Shire River banks
and floods destroying M1 road, the Plan proposes
a detailed study to find implementable long term
solutions
-The Plan recommends that studies have to be
undertaken to assess the construction of dykes in
order to prevent flooding
-High disaster risks - The district council in collaboration with key
stakeholders should strengthen existing disaster
resilience measures in the district
To improve
road access to
social services
-Majority of the roads
are earth surfaced and
in the wet season they
are in poor condition
therefore impassable
Non-existence of
feeder roads in some
-The National Roads Authority in liaison with
related authorities should take the following
appropriate actions:
-Rehabilitate the Mlomba – Tomali Road
-Construct the Mwanza River Bridge along the
Mlomba – Tomali Road
-Fast-track the rehabilitation of Thabwa –

CHIKWAWA DISTRICT PHYSICAL DEVELOPMENT PLAN
155
OBJECTIVE KEY ISSUES STRATEGIES/ACTIONS
parts of the district
renders some areas
inaccessible
Masenjere Road
-Construct a bridge across Likhubula River to
connect Sankhulani village
-Construct bridges at appropriate sites to connect
Kapichira and Chavala
To promote
inter-settlement
linkages
-Poor road
infrastructure
-The National Roads Authority in liaison with
related authorities should take the following
appropriate actions:
-Upgrade the M1 – Dolo Road to District Road
Status (7.5 km of the road is bituminized)
-Rehabilitate Jombo-Mtowe-Mphungu Road
Rehabilitate and upgrade Mphungu-Mkumaniza
Road to District Road status
-Upgrade M1 junction to Tomali Road to District
Road status
-Upgrade and rehabilitate the Tomali –
Dzikolatha road via Ndakwera to District road
status
-Upgrade the Tomali-Chafudzika Road to
District Road status
-Upgrade Ngabu-Mkumaniza-Kunyinda Road to
District Road status
-Rehabilitate and upgrade the Mitondo- Savala-
Kanyimbiri Road to District Road status
To improve
flow of goods
and services
between areas
of production
and markets
-Poor road
infrastructure
-Rehabilitate and upgrade the road connecting
Gola and Changoima to District Road status
-Rehabilitate Miseu Folo- Nsomo-Ngabu Road
To facilitate
connection
between
Chikwawa
District and
other major
urban centres
and surrounding
districts
-Poor transport
infrastructure
-The Ministry of Transport and Public Works
should:
-Carry out studies of the flow of water in Shire
River near Chikwawa District Headquarters and
determine the strength of Kamuzu Bridge
-Raise the height of M1 Road from Dyeratu to
Thabwa to prevent it from submerging during
heavy floods
-Consider opening other outlets of Shire River as
it approaches Kamuzu Bridge from Blantyre
-Upgrade Chapananga-Thambani (Mwanza)
Road to Secondary Road status
To introduce
formal transport
-There is no organized
water transport along
-The Ministry of Transport and Public

CHIKWAWA DISTRICT PHYSICAL DEVELOPMENT PLAN
156
OBJECTIVE KEY ISSUES STRATEGIES/ACTIONS
along Shire
River
Shire River Infrastructure should:
Identify potential sites for docking of boats
Assess the potential of introducing motorized
boats along Shire River
To regulate
movement of
people and
goods by canoes
Movement of people
and goods by canoes
not regulated
-Ministry of Transport and Public Infrastructure
should regulate and certify all boats/canoes that
transport goods and people between Eastern and
Western Banks
To introduce
Railway
transport to
economically
productive areas
in the district
High cost of
transporting cargo by
road
-Rehabilitate the Limbe-Bangula railway line
-Construct Nchalo-Chikwawa Boma-Changoima
railway line to link with Tete-Nacala Railway
line
-Construct Bangula-Nchalo railway line
-Rehabilitate and upgrade the Bangula-Marka
railway line
To introduce
formal air travel
in the district
and facilitate
use of private
airdromes for
emergency
operations
-Non-existence of
formal air transport
-Department of Civil Aviation should explore the
option of constructing an airfield at Nchalo or
Ngabu
- Non-existence of
public airfields
-Department of Civil Aviation should negotiate
with Illovo to open up their private airfield for
emergencies
To ensure
efficient and
reliable power
supply
-Reliance on 132kv
transmission line and
any damage to this
line cuts off power
supply to the whole of
Chikwawa and Nsanje
-ESCOM should construct an additional feeder
line to complement the existing line
-Encroachment into
way leaves and
vandalism to the
equipment
-ESCOM in collaboration with stakeholders must
sensitize communities along major power lines
on issues of way leaves
-Wooden poles are not
adequately and
properly treated hence
they are easily
attacked by termites
-ESCOM should replace wooden poles with steel
poles.
-Inadequate power
supply
-EGENCO and other independent power
producers should invest in mini grid electricity
generation to cater for localized urban centres
such as Therere, Chavala and Chafudzika
Increased energy
demand due to
Ministry of Natural Resources, Energy and
Mines should assess future energy needs in the

CHIKWAWA DISTRICT PHYSICAL DEVELOPMENT PLAN
157
OBJECTIVE KEY ISSUES STRATEGIES/ACTIONS
planned industrial
development
district
To facilitate
generation of
solar energy in
isolated rural
centres/commun
ities
-Diversification,
complementarity,
monopoly
-Ministry of Finance (Revenue Department) in
collaboration with Ministry of Energy should
explore incentives to increase demand for solar-
related equipment
-Solar energy is
expensive to access as
the initial capital
outlay is very high
-Ministry of Energy should create a conducive
environment for solar power generation by
individuals/firms (independent power producers)
To ensure
provision of
safe and potable
water
-Access to safe and
potable water is a
challenge in the
district mostly because
of unsustainable water
sources, washed away
pipelines and non-
functional boreholes
-The Department of Water Development in
collaboration with various stakeholders should
undertake the following:
-Rehabilitate and expand Chapananga, Mapelera
and Livunzu Rural Water Supply Schemes
-Expand the Miseu-Folo Rural Water Supply
Scheme to serve bigger population
-Southern Region Water Board to expand its
network around Ngabu and Nchalo
-Rehabilitate non-functional boreholes in Ngabu,
Lundu and Chapananga as an interim measure
Sink additional boreholes in TA Chapananga
To promote
sustainable
access to safe
and clean water
-Poor access to safe
and clean water
-Southern Region Water Board should consider
using alternative energy sources for pumping
water as is the case with the scheme at Chikwawa
District Headquarters which uses both ESCOM
power and solar energy
-Poor access to safe
and clean water
-Department of Water Development should
construct new boreholes in the western part of
TA Ngabu as an interim solution
-The Department of Water Development should
carry out studies to assess the potential of
establishing new water supply schemes in areas
where there are nucleated settlements as follows:
Mkumaniza, Mphungu, Saopa, Therere,
Ndakwera and Masenjere Trading Centres
To improve
irrigation
infrastructure in
the Eastern
Bank
-Inadequate power
which is also
expensive affects
pumping of water for
irrigation and also
frequent floods during
rainy season affect
canals and pipes
The Department of Irrigation should implement
the following:
-Identify funds for the rehabilitation of irrigation
schemes
-Engage beneficiary communities to participate
in the rehabilitation of damaged canals
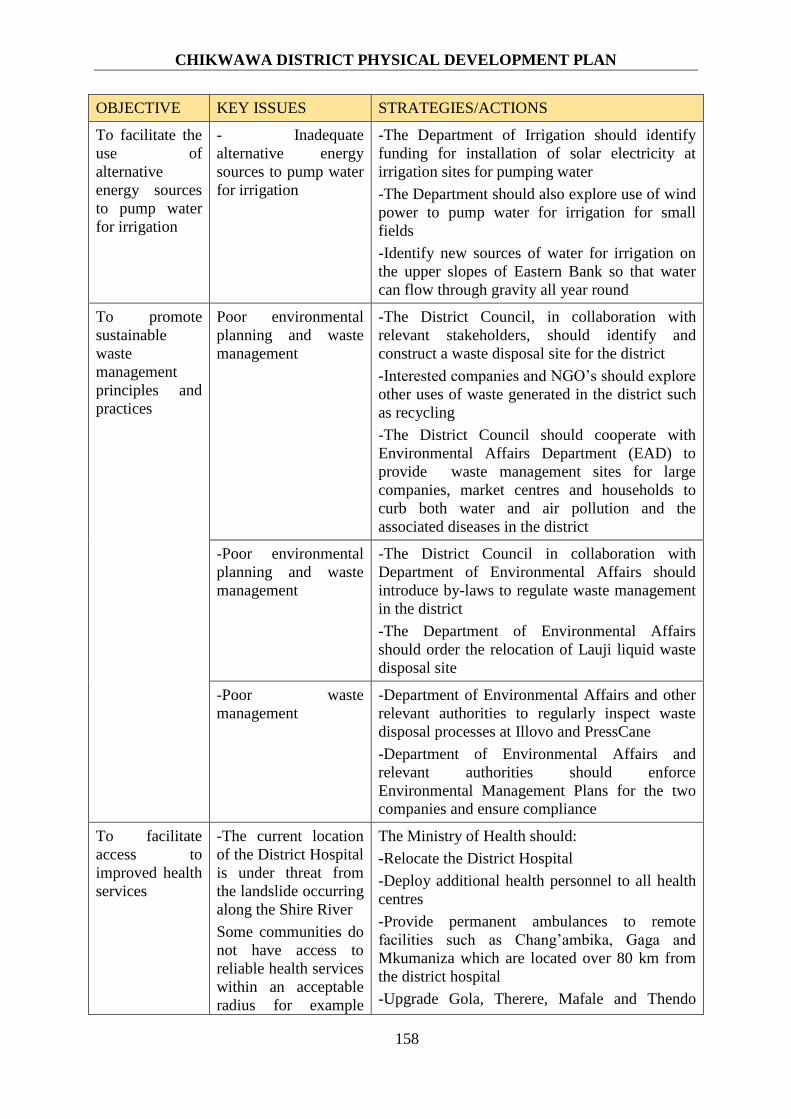
CHIKWAWA DISTRICT PHYSICAL DEVELOPMENT PLAN
158
OBJECTIVE KEY ISSUES STRATEGIES/ACTIONS
To facilitate the
use of
alternative
energy sources
to pump water
for irrigation
- Inadequate
alternative energy
sources to pump water
for irrigation
-The Department of Irrigation should identify
funding for installation of solar electricity at
irrigation sites for pumping water
-The Department should also explore use of wind
power to pump water for irrigation for small
fields
-Identify new sources of water for irrigation on
the upper slopes of Eastern Bank so that water
can flow through gravity all year round
To promote
sustainable
waste
management
principles and
practices
Poor environmental
planning and waste
management
-The District Council, in collaboration with
relevant stakeholders, should identify and
construct a waste disposal site for the district
-Interested companies and NGO’s should explore
other uses of waste generated in the district such
as recycling
-The District Council should cooperate with
Environmental Affairs Department (EAD) to
provide waste management sites for large
companies, market centres and households to
curb both water and air pollution and the
associated diseases in the district
-Poor environmental
planning and waste
management
-The District Council in collaboration with
Department of Environmental Affairs should
introduce by-laws to regulate waste management
in the district
-The Department of Environmental Affairs
should order the relocation of Lauji liquid waste
disposal site
-Poor waste
management
-Department of Environmental Affairs and other
relevant authorities to regularly inspect waste
disposal processes at Illovo and PressCane
-Department of Environmental Affairs and
relevant authorities should enforce
Environmental Management Plans for the two
companies and ensure compliance
To facilitate
access to
improved health
services
-The current location
of the District Hospital
is under threat from
the landslide occurring
along the Shire River
Some communities do
not have access to
reliable health services
within an acceptable
radius for example
The Ministry of Health should:
-Relocate the District Hospital
-Deploy additional health personnel to all health
centres
-Provide permanent ambulances to remote
facilities such as Chang’ambika, Gaga and
Mkumaniza which are located over 80 km from
the district hospital
-Upgrade Gola, Therere, Mafale and Thendo

CHIKWAWA DISTRICT PHYSICAL DEVELOPMENT PLAN
159
OBJECTIVE KEY ISSUES STRATEGIES/ACTIONS
Gola does not have a
health centre and
another issue is some
health facilities are
located very far away
from referral hospitals
-Some health facilities
are poorly staffed to
handle medical
conditions that are
supposed to be
managed at that level
for example
dispensary
health posts to Health Centres
-Construct health centres at Tomali and
Nkhalamba (after Chafudzika)
To improve
access to
secondary
education
facilities in the
district
Long distances to
access secondary
schools
-Ministry of Education should assess
infrastructure requirements for all public primary
schools
-Ministry of Education should construct
secondary schools at Gola, Nkhalamba (after
Chafudzika), Mandirade, Supuni, Ndakwera,
Kandeu, Therere and Singano (Near Mitondo).
Note that Supuni and Mandirade are separated by
Mwanza River and crossing is impossible during
rainy season.
-Ministry of Education should upgrade Chifunda,
Nchalo and Milole CDSS’s to conventional ones
To improve
access to
vocational
training in the
district
Lack of vocational
training centres
-Ministry of Labour to construct community
technical colleges in Chapananga and Livunzu
-Ministry of Agriculture should organize tailor
made courses in modern irrigation farming
targeting farmers in the district
To improve
communication
among the
district’s
population
-Poor network
especially in the
eastern bank
-Overhead and
underground cables
have been heavily
vandalized making the
lines difficult to access
-Service providers should explore use of green
towers
-Service providers should assess the possibility
of increasing bandwidth of existing transmitters
to cover wider areas
-Airtel and TNM should construct towers at
Chavala, Chitsa (near Masenjere), Kubalalika,
Mkumaniza, Mandirade, Thendo and Therere
To facilitate
internet access
to remote parts
of the district
-The only two tele-
centres in Chikwawa
District are not
functioning due to
various operational
challenges
The Department of Information should:
-Construct telecentres at Chapanganga, Kakoma,
Ndakwera, Thabwa, Livunzu and Masenjere
-Revive the operations of abandoned telecentres
at Ngabu and Chikwawa District Headquarters
Extend data connectivity in the district to cover
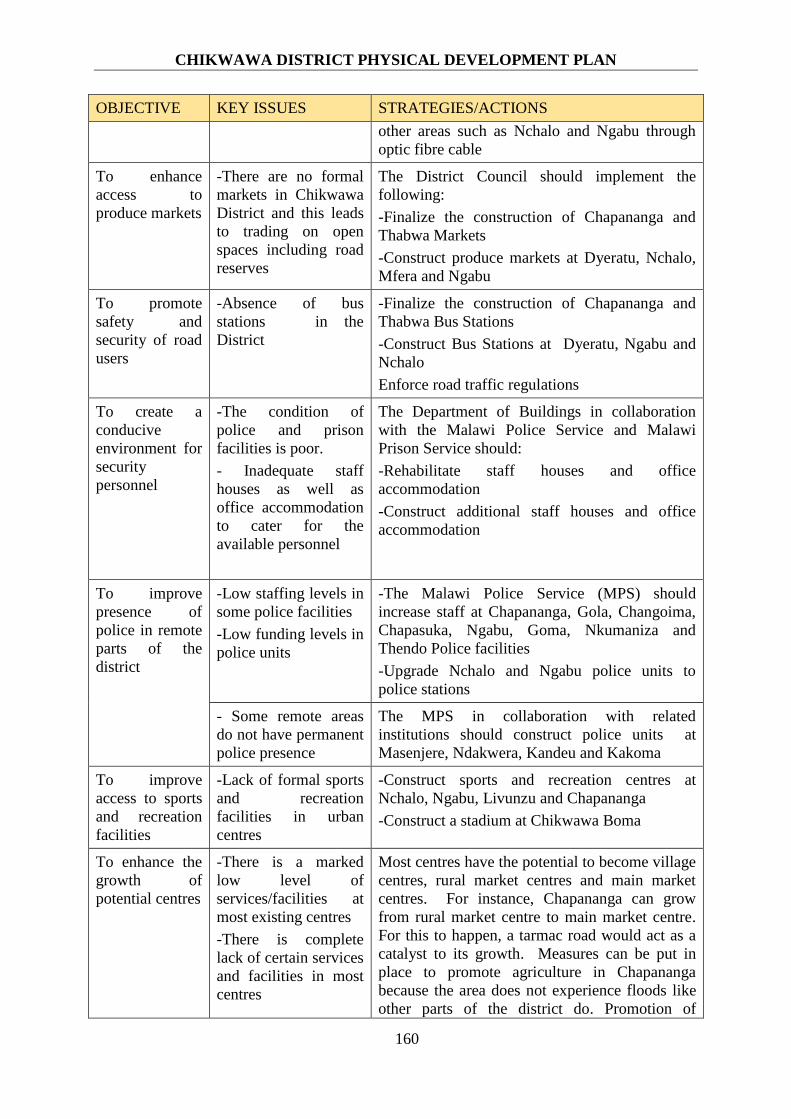
CHIKWAWA DISTRICT PHYSICAL DEVELOPMENT PLAN
160
OBJECTIVE KEY ISSUES STRATEGIES/ACTIONS
other areas such as Nchalo and Ngabu through
optic fibre cable
To enhance
access to
produce markets
-There are no formal
markets in Chikwawa
District and this leads
to trading on open
spaces including road
reserves
The District Council should implement the
following:
-Finalize the construction of Chapananga and
Thabwa Markets
-Construct produce markets at Dyeratu, Nchalo,
Mfera and Ngabu
To promote
safety and
security of road
users
-Absence of bus
stations in the
District
-Finalize the construction of Chapananga and
Thabwa Bus Stations
-Construct Bus Stations at Dyeratu, Ngabu and
Nchalo
Enforce road traffic regulations
To create a
conducive
environment for
security
personnel
-The condition of
police and prison
facilities is poor.
- Inadequate staff
houses as well as
office accommodation
to cater for the
available personnel
The Department of Buildings in collaboration
with the Malawi Police Service and Malawi
Prison Service should:
-Rehabilitate staff houses and office
accommodation
-Construct additional staff houses and office
accommodation
To improve
presence of
police in remote
parts of the
district
-Low staffing levels in
some police facilities
-Low funding levels in
police units
-The Malawi Police Service (MPS) should
increase staff at Chapananga, Gola, Changoima,
Chapasuka, Ngabu, Goma, Nkumaniza and
Thendo Police facilities
-Upgrade Nchalo and Ngabu police units to
police stations
- Some remote areas
do not have permanent
police presence
The MPS in collaboration with related
institutions should construct police units at
Masenjere, Ndakwera, Kandeu and Kakoma
To improve
access to sports
and recreation
facilities
-Lack of formal sports
and recreation
facilities in urban
centres
-Construct sports and recreation centres at
Nchalo, Ngabu, Livunzu and Chapananga
-Construct a stadium at Chikwawa Boma
To enhance the
growth of
potential centres
-There is a marked
low level of
services/facilities at
most existing centres
-There is complete
lack of certain services
and facilities in most
centres
Most centres have the potential to become village
centres, rural market centres and main market
centres. For instance, Chapananga can grow
from rural market centre to main market centre.
For this to happen, a tarmac road would act as a
catalyst to its growth. Measures can be put in
place to promote agriculture in Chapananga
because the area does not experience floods like
other parts of the district do. Promotion of
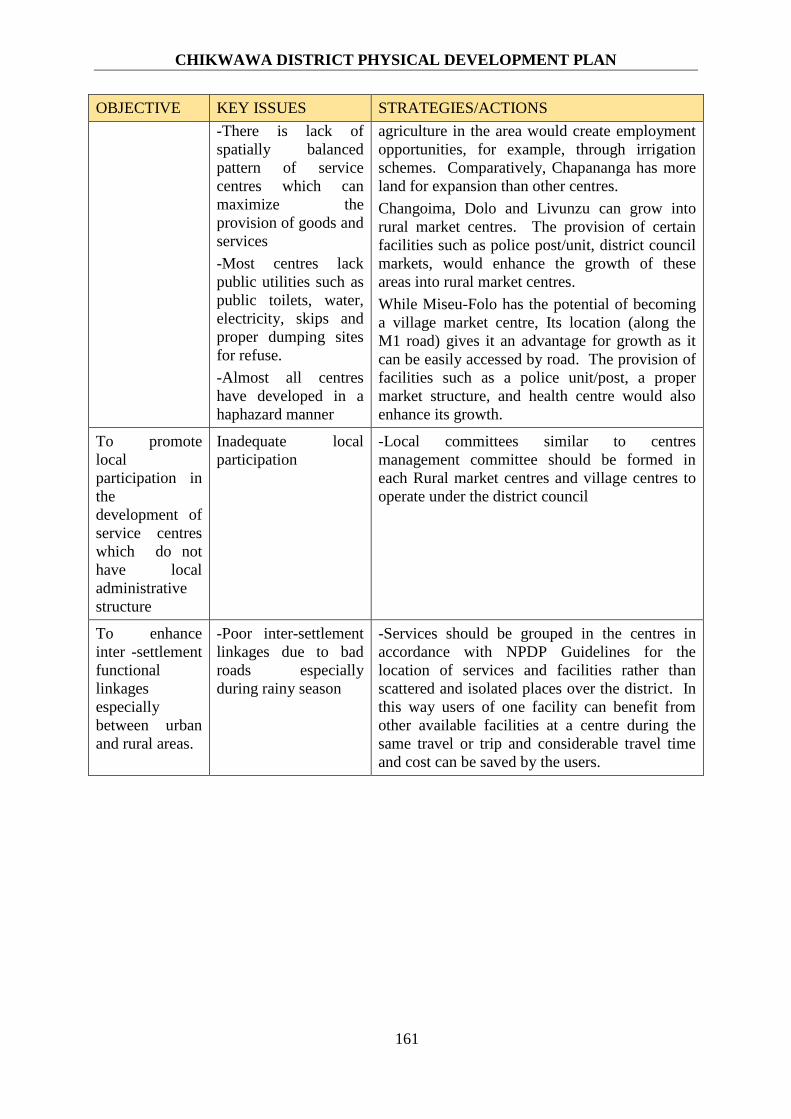
CHIKWAWA DISTRICT PHYSICAL DEVELOPMENT PLAN
161
OBJECTIVE KEY ISSUES STRATEGIES/ACTIONS
-There is lack of
spatially balanced
pattern of service
centres which can
maximize the
provision of goods and
services
-Most centres lack
public utilities such as
public toilets, water,
electricity, skips and
proper dumping sites
for refuse.
-Almost all centres
have developed in a
haphazard manner
agriculture in the area would create employment
opportunities, for example, through irrigation
schemes. Comparatively, Chapananga has more
land for expansion than other centres.
Changoima, Dolo and Livunzu can grow into
rural market centres. The provision of certain
facilities such as police post/unit, district council
markets, would enhance the growth of these
areas into rural market centres.
While Miseu-Folo has the potential of becoming
a village market centre, Its location (along the
M1 road) gives it an advantage for growth as it
can be easily accessed by road. The provision of
facilities such as a police unit/post, a proper
market structure, and health centre would also
enhance its growth.
To promote
local
participation in
the
development of
service centres
which do not
have local
administrative
structure
Inadequate local
participation
-Local committees similar to centres
management committee should be formed in
each Rural market centres and village centres to
operate under the district council
To enhance
inter -settlement
functional
linkages
especially
between urban
and rural areas.
-Poor inter-settlement
linkages due to bad
roads especially
during rainy season
-Services should be grouped in the centres in
accordance with NPDP Guidelines for the
location of services and facilities rather than
scattered and isolated places over the district. In
this way users of one facility can benefit from
other available facilities at a centre during the
same travel or trip and considerable travel time
and cost can be saved by the users.
162
APPENDIX 1: INTER-SETTLEMENT FUNCTIONAL LINKAGES: METHODOLOGY In determining the catchment areas of the various centres, a large number of people were
asked to indicate the place they went to purchase or obtain goods and services. The analysis
of the survey was based on two factors: “functions” and “votes”. The functions are purchase
of clothes, purchase of bicycle, visit to a produce market, post office, administration, a
hospital, dispensary, and the presence of non-farm employment and place of worship. The
function of a place was considered to exert attraction when at least 5% of those interviewed
indicated they visited that place when they wished to purchase a commodity or obtain a
service. Since 8 functions were involved, a place could score a maximum of 8 on the
variable function.
Whenever a respondent mentioned a place, this counted as a “vote” for that place. Since 8
functions were considered the potential number of votes was x the number of interviewees.
Thus, the 900 interviewees in Chikwawa District could supply a total number of possible
answers (votes) of 8 x 900= 7,200.
The actual number of “votes” received by a place, expressed as a percentage, indicates the
strength of the attraction of the place. The number of answers received for each function
exceeds the 5% threshold (5% of 900=45) for clothes, bicycles, produce market, post office,
and hospital. Thus Chikwawa District Headquarters, Nchalo and Ngabu scored 5 each on
their respective functions. In theory, a place may score 8 functions and 100% on the strength
of attraction. In practice this never happened for the following reasons:
FUNCTION- Non- farm employment virtually never reached the 5% threshold to qualify to
be counted as a function. Also an administration and post office were rarely mentioned by
more than 5% of the interviewees. Bicycles were often purchased outside the study area in a
regional or national centre. Thus in this case, the threshold value was rarely superseded.
People often failed to distinguish between a hospital and a dispensary. Then first normally
included the latter, but there may be an independent dispensary next to a hospital. Since no
register has been prepared for all functions actually surveyed in the field, the correctness of
the answers cannot be checked. By introducing threshold value of 5%, however, most of the
“noise” will have been filtered out of the data as far as the number of functions is concerned.
STRENGTH- When one place was mentioned by all interviewees for all functions, its
strength of attraction was to be raised as 100%. This never happened as no place had all
eight functions. The most important reason, however, why no place reached 100% of
strength attraction, is that not all interviewees had actually indicated a place for each
function. Thus, sizeable amount of “votes” had simply not been cast. When someone had
never bought a bicycle, for example, no place for buying bicycles had been indicated.
Only a very small proportion of the interviewees indicated a place for non-farm employment.
It should be noted that places which did not attract 5% of votes or at least on function have
been excluded from the analysis.

CHIKWAWA DISTRICT PHYSICAL DEVELOPMENT PLAN
163
APPENDIX 2: Deficits in the Provision of Services and Facilities in Service Centres Whilst the National Physical Development Plan has given guidelines for the location of
services and facilities, the District Plan identifies the disparities in the provision of services
and facilities at the centres. The description of the deficits is based on a survey carried out in
2019 by the department of physical planning under the ministry of lands, housing and urban
development. Depending on the hierarchical level of the centres, the deficit analysis deals
with a wide range of individual services and facilities other than water and electricity
supplies, education, health, transportation and post and telecommunications which are dealt
with separately in this plan. The following deficit analysis should, therefore, be considered
closely in the objectives of this plan.
1. Service Provision Deficit in Bangula Sub- Regional Centre
The NPDP has designated Bangula, located in Nsanje, as a sub-regional centre. Its influence
area extends as far as Chikwawa and Southern part of Thyolo District. Table 53 shows
however, that the existing facilities and services are inadequate and therefore, Bangula fails
to function fully as a sub-regional centre. Additional facilities such as a post office, technical
school and a motel among others are required and improvements to the existing facilities are
needed.
On the basis of the guidelines, Bangula has adequate facilities in the following fields:
Local Authority
The Centre has a District council, Area Development committee but not a municipal council
as stipulated in the Guidelines for the location/ services and facilities by Hierarchy for
settlements.
Political
Although there is a district party chairman, he occupies an office which is in dilapidated state.
Marketing
The guidelines in the NPDP require at least a “Superette” type of a general store at a Sub-
Regional centre. At Bangula this type service is not available but there is a general store
which provides a variety of food and non-food items. There are specialized shops, slaughter
house, grocery stores, wholesale shops and small retail shops with a variety of goods.
The present wholesale shop, however does not provide high-level goods. The centre does not
have adequate building facilities for a produce and consumer market. A number of
improvements are required especially in private sector facilities (retail and wholesale stores).
Production Inputs
Production inputs for agriculture are seasonally available at ADMARC depot for agro-inputs.
Other inputs for the manufacturing industry can be made available due to the road connection
that is present.
Banking and Finance
The requirement at a Sub-Regional centre is a full scale (bank) branch. The centre has one
commercial bank available. In addition, a post office is available. However, essential
services such as housing finance representative are not provided at the centre.
CHIKWAWA DISTRICT PHYSICAL DEVELOPMENT PLAN
164
Education
Of the required education facilities, a Primary and a Secondary School are available. There
are no vocational schools for grade I classes at Bangula.
Transportation Services
Bangula does not have a freight agency where goods can be processed. The centre has an
airstrip which is not functional. The centre has a long-distance bus service which is of low
class.
Extension Service centres
Extension services required at the centre are not available.
Energy Supply
In terms of energy supply, Bangula is connected to the national grid. There is also a back-up
generator at Bangula due to the unreliability of electricity. A petrol station and a paraffin
pump are available at the centre as suggested by the NPDP guidelines.
Culture
The community hall does not meet standards required for a sub-regional centre. In addition,
the centre does not have a public library.
Urban Roads
The centre is accessible by a good condition urban road network although there are no streets
lights.
Water Supply
Piped water supply exist at the centre but it is far from being reliable. The most reliable
source of water are boreholes.
Solid Waste Disposal and Sewage
A high percentage of people use pit latrines and there is no refuse collection service by the
council.
Fire Protection
The centre does not have a fire brigade service.
2. Service provision deficits at Chikwawa District Headquarters, Nchalo and
Ngabu Main Market Centres
Table 54 indicates the deficits in services and facilities at Chikwawa District Headquarters,
Nchalo and Ngabu. At present there are deficits in the following service areas: police,
political party machinery, road networks, banking and finance, post and telecommunications,
accommodation, transportation services, maintenance and repair of appliances, urban roads
and water supply. On other hand there are total or partial deficits in the following:
Administration
Chikwawa District Headquarters, Nchalo and Ngabu do not have a sub- district administrator
as recommended by the NPDP, however the centres are administered by the present District
Council at Chikwawa District Headquarters.
Justice

CHIKWAWA DISTRICT PHYSICAL DEVELOPMENT PLAN
165
There is a Magistrate Court at Chikwawa District Headquarters and Ngabu. In every
Tradition Authority there is a traditional court present.
Fire Protection
There is no fire brigade service at any of the three main market centres of Chikwawa District
Headquarters, Nchalo and Ngabu.
Marketing
All Main market centres have grocery shops, wholesale shops of day to day goods and
permanent ADMARC markets but they do not have specialized retail shops, large or small
general store, and slaughter slab. In addition, their produce markets do not have adequate
facilities.
Industry
Agro-based and small footloose industries and small-scale contractors exist at all main
market centres.
Health
All centres have got health centres though they fail to meet the present and future demand of
the population. The District Hospital is located at Chikwawa District Headquarters.
Transportation
All centres are serviced by the M1 road which is an all-weather road. As acquired by the
NPDP guidelines, an airstrip is present at Ngabu although it is not functional at present. In
Nchalo, ILLOVO group of companies has an airstrip that is only used by the company.
Banking and Finance
Static commercial bank infrastructure are present and fully operational at Chikwawa District
Headquarters and Nchalo. Ngabu does not have a fully operational bank service.
Education
There are Secondary Schools in all centres. However, vocational grade II institutions are not
present in all centres.
Water Supply, Solid Waste Disposal and Sewage
There is piped water supply system and boreholes in all centres. There is a deficit of a sewer
system in all centres. Refuse collection and sanitary land filling is not done in all centres.
Extension Services
All centres have an EPA centre, but there is neither a DEMATT agent nor SEDOM industrial
extension worker.
Energy Supply
There is no regular electricity supply at all main market centres (District Headquarters,
Ngabu and Nchalo).
Culture
The community halls do not have libraries.

CHIKWAWA DISTRICT PHYSICAL DEVELOPMENT PLAN
166
Table 53: Service and Facilities in District and/ Main Market Centre
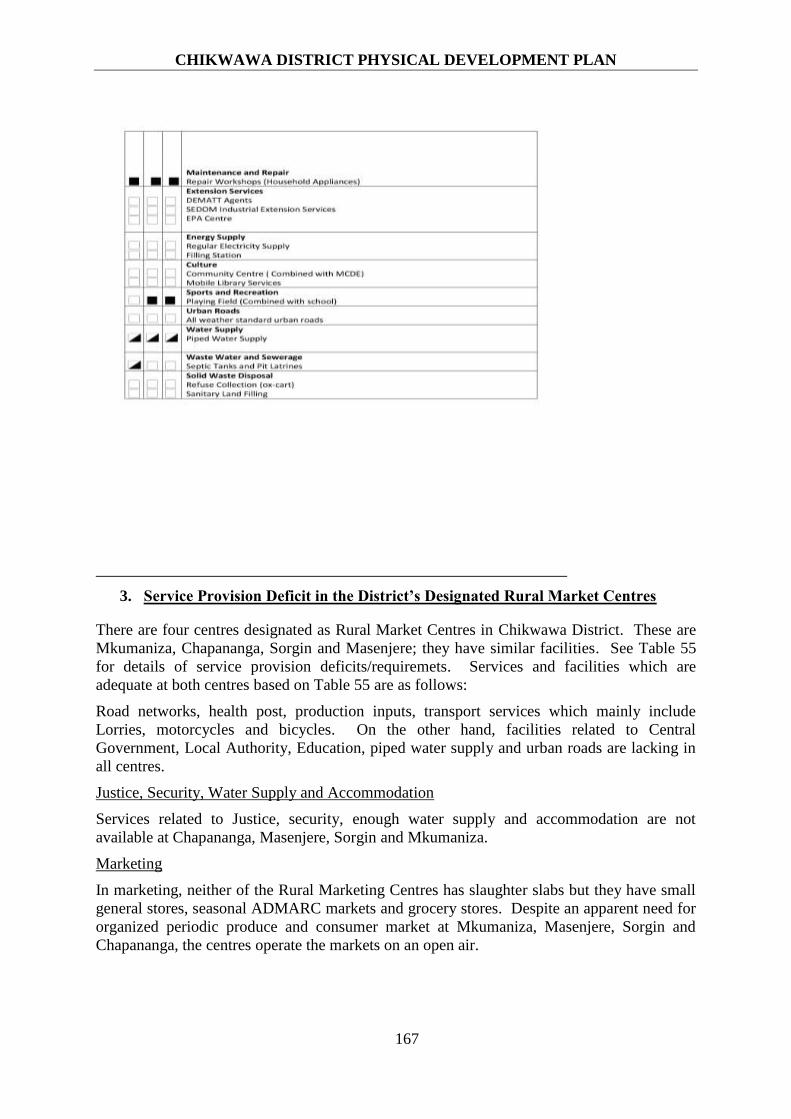
CHIKWAWA DISTRICT PHYSICAL DEVELOPMENT PLAN
167
3. Service Provision Deficit in the District’s Designated Rural Market Centres
There are four centres designated as Rural Market Centres in Chikwawa District. These are
Mkumaniza, Chapananga, Sorgin and Masenjere; they have similar facilities. See Table 55
for details of service provision deficits/requiremets. Services and facilities which are
adequate at both centres based on Table 55 are as follows:
Road networks, health post, production inputs, transport services which mainly include
Lorries, motorcycles and bicycles. On the other hand, facilities related to Central
Government, Local Authority, Education, piped water supply and urban roads are lacking in
all centres.
Justice, Security, Water Supply and Accommodation
Services related to Justice, security, enough water supply and accommodation are not
available at Chapananga, Masenjere, Sorgin and Mkumaniza.
Marketing
In marketing, neither of the Rural Marketing Centres has slaughter slabs but they have small
general stores, seasonal ADMARC markets and grocery stores. Despite an apparent need for
organized periodic produce and consumer market at Mkumaniza, Masenjere, Sorgin and
Chapananga, the centres operate the markets on an open air.
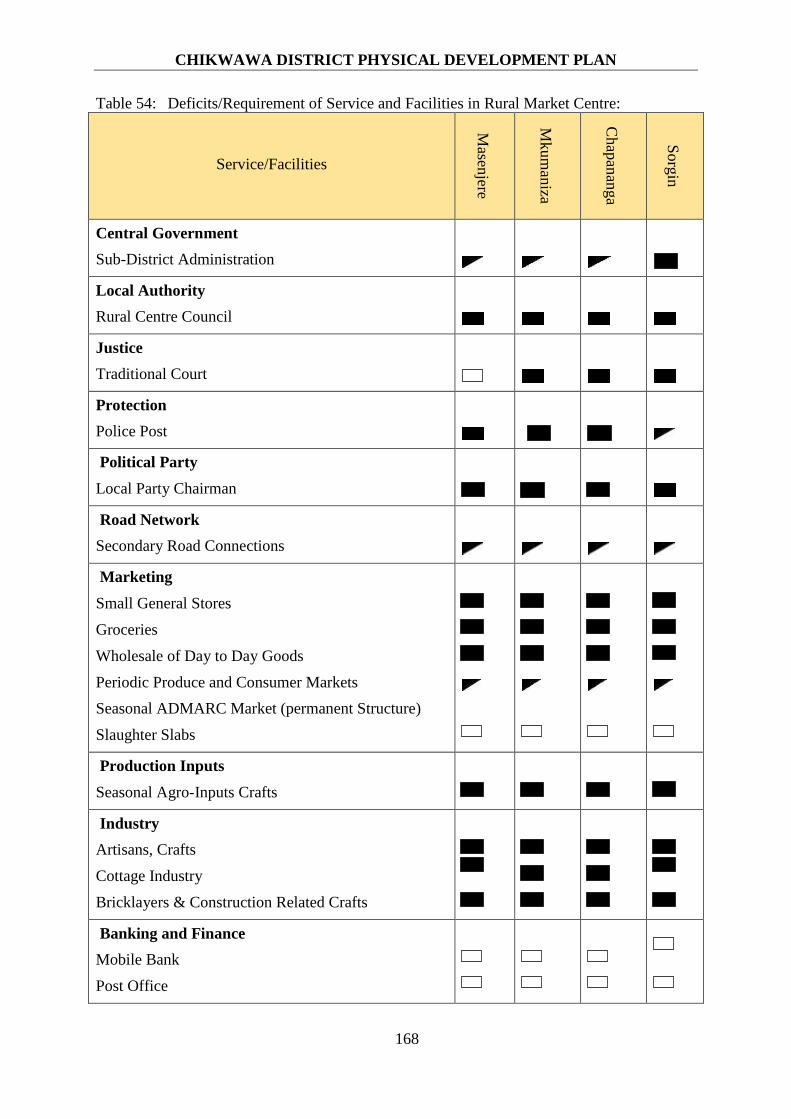
CHIKWAWA DISTRICT PHYSICAL DEVELOPMENT PLAN
168
Table 54: Deficits/Requirement of Service and Facilities in Rural Market Centre:
Service/Facilities
Masen
jere
Mkum
aniza
Chap
anan
ga
Sorg
in
Central Government
Sub-District Administration
Local Authority
Rural Centre Council
Justice
Traditional Court
Protection
Police Post
Political Party
Local Party Chairman
Road Network
Secondary Road Connections
Marketing
Small General Stores
Groceries
Wholesale of Day to Day Goods
Periodic Produce and Consumer Markets
Seasonal ADMARC Market (permanent Structure)
Slaughter Slabs
Production Inputs
Seasonal Agro-Inputs Crafts
Industry
Artisans, Crafts
Cottage Industry
Bricklayers & Construction Related Crafts
Banking and Finance
Mobile Bank
Post Office
c
c c c c
`
c
c c
c
c
c
c
c
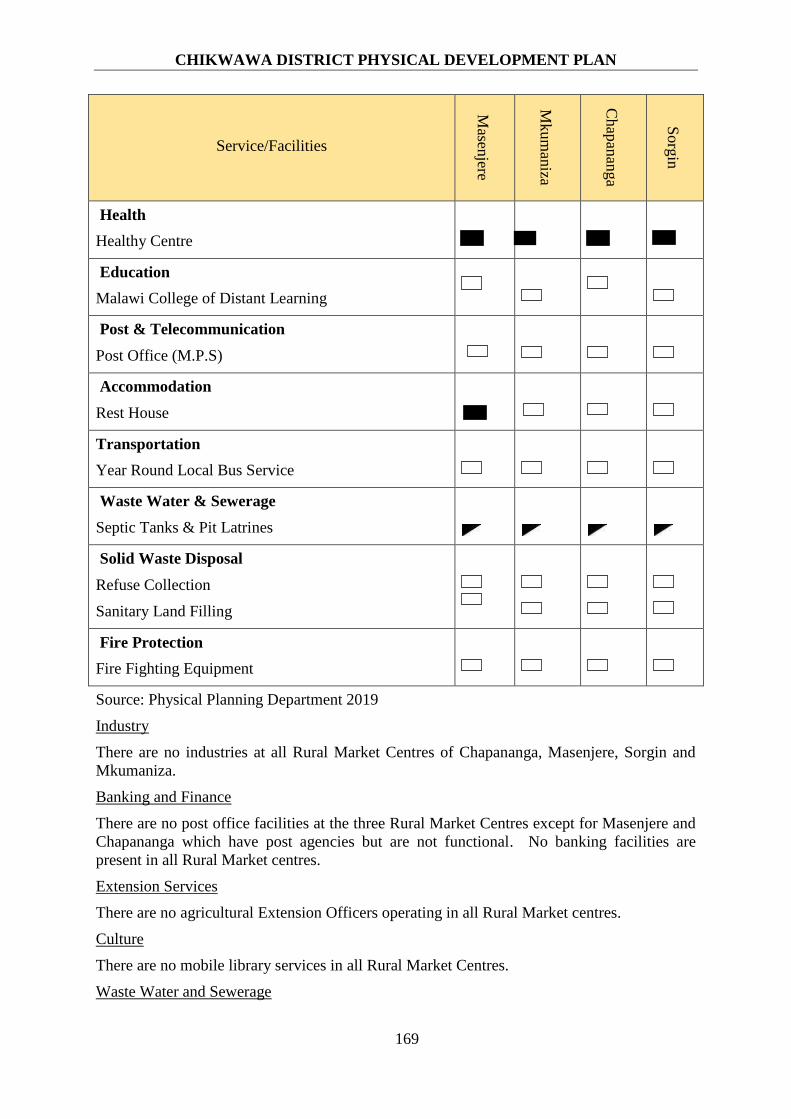
CHIKWAWA DISTRICT PHYSICAL DEVELOPMENT PLAN
169
Service/Facilities
Masen
jere
Mkum
aniza
Chap
anan
ga
Sorg
in
Health
Healthy Centre
Education
Malawi College of Distant Learning
Post & Telecommunication
Post Office (M.P.S)
Accommodation
Rest House
Transportation
Year Round Local Bus Service
Waste Water & Sewerage
Septic Tanks & Pit Latrines
Solid Waste Disposal
Refuse Collection
Sanitary Land Filling
Fire Protection
Fire Fighting Equipment
Source: Physical Planning Department 2019
Industry
There are no industries at all Rural Market Centres of Chapananga, Masenjere, Sorgin and
Mkumaniza.
Banking and Finance
There are no post office facilities at the three Rural Market Centres except for Masenjere and
Chapananga which have post agencies but are not functional. No banking facilities are
present in all Rural Market centres.
Extension Services
There are no agricultural Extension Officers operating in all Rural Market centres.
Culture
There are no mobile library services in all Rural Market Centres.
Waste Water and Sewerage
c c
c c
c c c c
c c
c
c
c
c
c
c c
c
c
c
c
c
c
c c c c
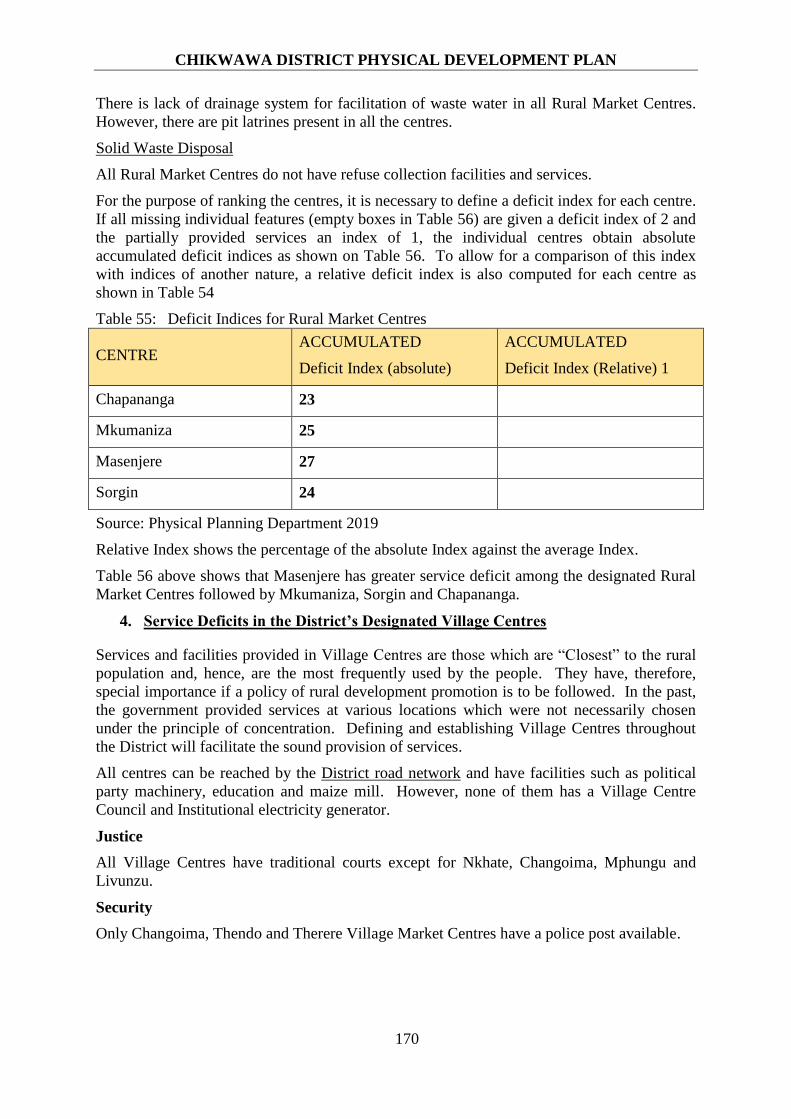
CHIKWAWA DISTRICT PHYSICAL DEVELOPMENT PLAN
170
There is lack of drainage system for facilitation of waste water in all Rural Market Centres.
However, there are pit latrines present in all the centres.
Solid Waste Disposal
All Rural Market Centres do not have refuse collection facilities and services.
For the purpose of ranking the centres, it is necessary to define a deficit index for each centre.
If all missing individual features (empty boxes in Table 56) are given a deficit index of 2 and
the partially provided services an index of 1, the individual centres obtain absolute
accumulated deficit indices as shown on Table 56. To allow for a comparison of this index
with indices of another nature, a relative deficit index is also computed for each centre as
shown in Table 54
Table 55: Deficit Indices for Rural Market Centres
CENTRE ACCUMULATED
Deficit Index (absolute)
ACCUMULATED
Deficit Index (Relative) 1
Chapananga 23
Mkumaniza 25
Masenjere 27
Sorgin 24
Source: Physical Planning Department 2019
Relative Index shows the percentage of the absolute Index against the average Index.
Table 56 above shows that Masenjere has greater service deficit among the designated Rural
Market Centres followed by Mkumaniza, Sorgin and Chapananga.
4. Service Deficits in the District’s Designated Village Centres
Services and facilities provided in Village Centres are those which are “Closest” to the rural
population and, hence, are the most frequently used by the people. They have, therefore,
special importance if a policy of rural development promotion is to be followed. In the past,
the government provided services at various locations which were not necessarily chosen
under the principle of concentration. Defining and establishing Village Centres throughout
the District will facilitate the sound provision of services.
All centres can be reached by the District road network and have facilities such as political
party machinery, education and maize mill. However, none of them has a Village Centre
Council and Institutional electricity generator.
Justice
All Village Centres have traditional courts except for Nkhate, Changoima, Mphungu and
Livunzu.
Security
Only Changoima, Thendo and Therere Village Market Centres have a police post available.

CHIKWAWA DISTRICT PHYSICAL DEVELOPMENT PLAN
171
Table 56: Service Facilities in Village Market Centre: Deficits/Requirement
Marketing
All village centres have grocery stores, they all also have periodic produce markets but they
do not have consumer markets apart from Bereu, Livunzu and Nkhate though they are
markets with poor facilities. Bereu, Livunzu, Nkhate, Dolo, Thendo and Tomali have
ADMARC market facilities while the rest do not have any. There are no slaughter slabs at
any of the village centres.
Production Inputs
Seasonal agro-Input stores are available at all village centres.
Industry
All village centres have cottage industries.
Health
Health centres are available at all village centres apart from Thendo and Kakoma.
Postal services
Almost all centres do not have postal services.

CHIKWAWA DISTRICT PHYSICAL DEVELOPMENT PLAN
172
Transportation Services
Whole year-round local bus services are not available at all centres due to poor condition of
the roads especially during rainy season.
Culture
All village centres has no mobile library services.
Water Supply
Piped water supply is not available in all village centres except for boreholes.
Waste Water and Sewerage
All centres rely on pit latrines and there is no waste water drainage system.
Solid Waste Disposal
None of the centres has refuse collection facility nor sanitary land filling facility.
CHIKWAWA DISTRICT PHYSICAL DEVELOPMENT PLAN
173
APPENDIX 3: Locational Analysis of Centres The NPDP has established the definitions and guidelines for the provision of services at
various levels of centres. Whilst the locations of centres at the first three levels (Sub-
Regional, Main Market Centre and Rural Market centres) have been established, this plan has
also to establish sites of Village Centres.
1. District and/or Main Market Centres
The NPDP identified a gap in the coverage of the already established District and/or
Main Market Centres in the North of the District. Based on the accessibility standard,
and the analysis of the existing centres in the area, the Plan recommends that
Chapananga be promoted to a Main Market Centre. With the inclusion of
Chapananga, all inhabited parts of the district are covered by this level of centres.
The centres operating at this level at the moment are Chikwawa District Headquarters,
Nchalo and Ngabu.
2. Rural Market Centres
The NPDP has designated Rural Market Centres which have been incorporated in this
District Plan (See Fig.). These, in addition to Bangula (SRC), Nchalo (MMC), Ngabu
(MMC) and Chikwawa District Headquarters (MMC) acting also as RMC’s are
Nkumaniza, Sorgin, Chapananga and Masenjere. The area coverage of these centres
leaves a gap around; Dolo which is in T/A Ngabu with a population of 164 753 and
has only four designated centres. A gap has also been identified in the East Bank of
Chikwawa District T/A Mankhwira, named Livunzu with neighboring centres of
Nkhate and Mitondo as village centres. This centre has the potential to grow into a
rural market centre with its high number of population and a good number of goods
and services provided. The inhabitants from Nkhate (VC) to Livunzu travel a distant
of approximate 1hour 30 minutes on foot, 30-45 minutes by motorcycle.
Furthermore, the inhabitants of Mitondo travel a distance of less than 30-45 minutes
on foot, 15 minutes on motorcycle. Mitondo and Nkhate village centres are in the
proximity of 5km and 8km radii of Livunzu. Another gap has been identified in the
North West of Chikwawa District, Changoima in TA Chapananga with a population
of 88,641 and has only one main centre Chapananga. Therefore, the Plan
recommends that Dolo, Livunzu and Changoima be promoted to rural market centres.
3. Village centres
The criterion for selecting locations for village centres is as follows:-
a) Maximum accessibility standard of 8 km,
b) Area coverage of all populated areas in a district, and
c) All higher order centres, such as Rural Market Centres and upwards, functions
also as village Centres.
Based on these three criteria, village centres have been identified and their influence area
shown in Figure 63. Eleven centres have been assigned to this level, bringing the total
number of centres at all hierarchical levels in the District to 18. The areas not covered by an
existing or proposed village centre are due to sparse population while others lack basic
infrastructures and services and have physical development constraint such as poor road
networks.
CHIKWAWA DISTRICT PHYSICAL DEVELOPMENT PLAN
174
Miseu Folo has the potential of becoming a village market centre. Its location (along the M1
road) gives it an advantage for growth as it can be easily accessed by road. The provision of
facilities such as a police unit/post, a proper market structure, and health centre would also
enhance its growth.
The detailed locational planning for lower-level centres follows the same basic criteria as the
Planning carried out for higher level centres at the national level. At this level, the Plan aims
at a distribution of centres which guarantees, for almost all inhabitants of the District, at least
a tolerable maximum time/distance to the respective centres; for Rural Market centres, a
maximum travel distance of 15km and for Village Centres 8km maximum travel distance.
This planning principle requires full area and population coverage at all levels of centres. On
the other hand, locational planning also has to consider that the services provided at the
centres require certain minimum catchment population in order to allow for an efficient
operation and proper utilization of facilities. For Rural Market Centres an influence area
population is 25,000 (in 1985 terms) whereas at Village Centre level, the threshold
population is between 10, 000 and 20, 000.
Once the location of all centres is determined, it is necessary to know which centres should
be given preference in a promotional programme and which centres should be given low
priority. Therefore, for both Rural Market Centres and Village Centres a ranking list is being
provided in this Plan.
Priority Ranking of Rural Market Centres and Village Centres
To give a guide so that some preferences should be given in the promotion of centres, the
proposed Rural Market Centres and Village Centres are ranked in the order of their
importance. The ranking criteria are basically the same as those established in the National
Physical Development Plan and the subsequent District Plans i.e.
1. Present level/deficit of service provision
2. Catchment or influence area population currently served
3. Population carrying capacity and increase capacity of the land.
Following the designation of service centre, it is necessary to know which centres should be
given preference in development promotion because of limited financial resources.
Therefore, for both Rural Market Centres and Village Centres a ranking list has been
provided. It should be taken in mind that unforeseen development could influence the
importance of centre. Periodic review of the Plan will take into consideration such
developments and the priorities will be amended accordingly.
Priority ranking of Sub-Regional Centres and District/Main Market Centres has already been
established in the NPDP as part of national priorities. Within the District, however, priorities
are Bangula, Sub-Regional Centre and Main Market Centres (Chikwawa District
Headquarters, Ngabu and Nchalo).
The non-agricultural job creation potential which is taken as one of the ranking criteria for
Sub-Regional Centres and District/Main Market Centres in the National Plan is not relevant
for the Rural Market and Village Market Centres dealt with in this District Plan. Although
ranking order is already given for Rural Market Centres in the National Plan, a new order is
given here, as the accuracy of the data base referring to the individual influence area is much
higher. Changes in the ranking order may therefore well occur.
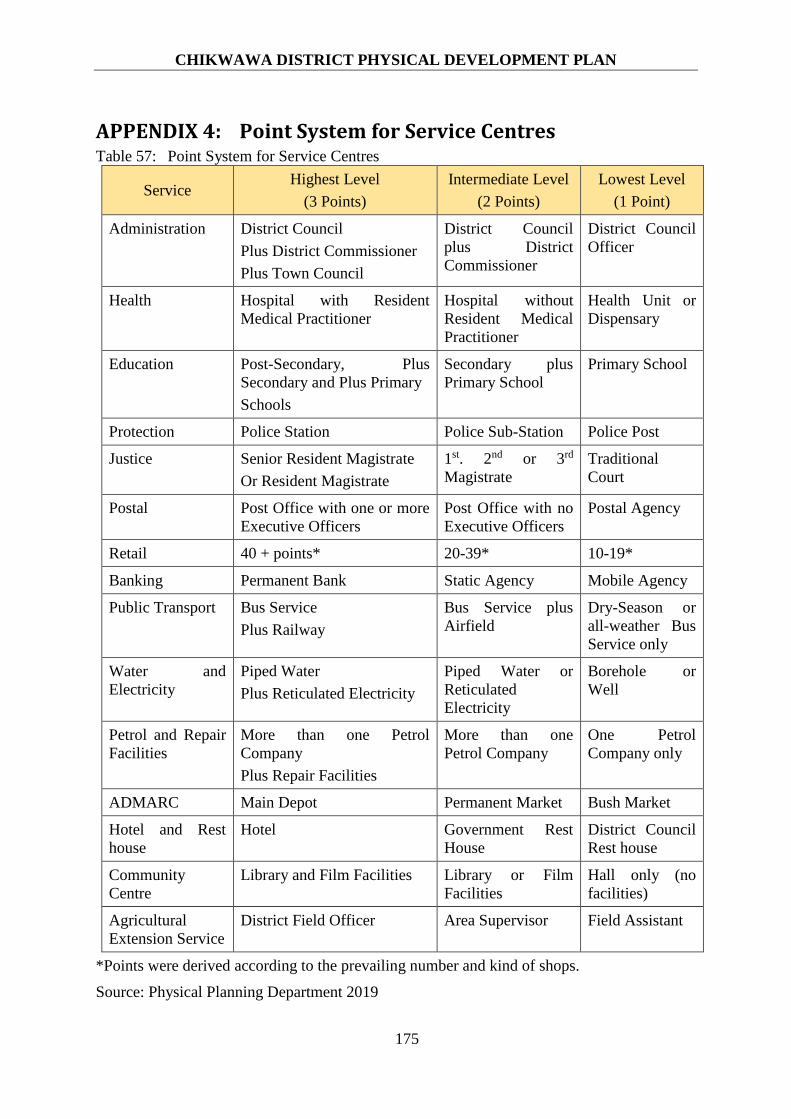
CHIKWAWA DISTRICT PHYSICAL DEVELOPMENT PLAN
175
APPENDIX 4: Point System for Service Centres Table 57: Point System for Service Centres
Service Highest Level
(3 Points)
Intermediate Level
(2 Points)
Lowest Level
(1 Point)
Administration District Council
Plus District Commissioner
Plus Town Council
District Council
plus District
Commissioner
District Council
Officer
Health Hospital with Resident
Medical Practitioner
Hospital without
Resident Medical
Practitioner
Health Unit or
Dispensary
Education Post-Secondary, Plus
Secondary and Plus Primary
Schools
Secondary plus
Primary School
Primary School
Protection Police Station Police Sub-Station Police Post
Justice Senior Resident Magistrate
Or Resident Magistrate
1st. 2nd or 3rd
Magistrate
Traditional
Court
Postal Post Office with one or more
Executive Officers
Post Office with no
Executive Officers
Postal Agency
Retail 40 + points* 20-39* 10-19*
Banking Permanent Bank Static Agency Mobile Agency
Public Transport Bus Service
Plus Railway
Bus Service plus
Airfield
Dry-Season or
all-weather Bus
Service only
Water and
Electricity
Piped Water
Plus Reticulated Electricity
Piped Water or
Reticulated
Electricity
Borehole or
Well
Petrol and Repair
Facilities
More than one Petrol
Company
Plus Repair Facilities
More than one
Petrol Company
One Petrol
Company only
ADMARC Main Depot Permanent Market Bush Market
Hotel and Rest
house
Hotel Government Rest
House
District Council
Rest house
Community
Centre
Library and Film Facilities Library or Film
Facilities
Hall only (no
facilities)
Agricultural
Extension Service
District Field Officer Area Supervisor Field Assistant
*Points were derived according to the prevailing number and kind of shops.
Source: Physical Planning Department 2019

CHIKWAWA DISTRICT PHYSICAL DEVELOPMENT PLAN
176
APPENDIX 5: Spatial Distribution of Development Planning Proposals This Section contains plans showing public services and facilities that have been proposed to
be constructed and/or upgraded in various parts of the district. The details of these plans are:
Proposed Village Centres
Proposed Roads to be upgraded
Proposed Base Transmitting Stations
Proposed Secondary Schools
Proposed Health Centres
Proposed Police facilities
Proposed Markets and Bus Depots
Proposed Telecentres
Proposed Land Uses Zones

177
Plan 1: Proposed Village Centres
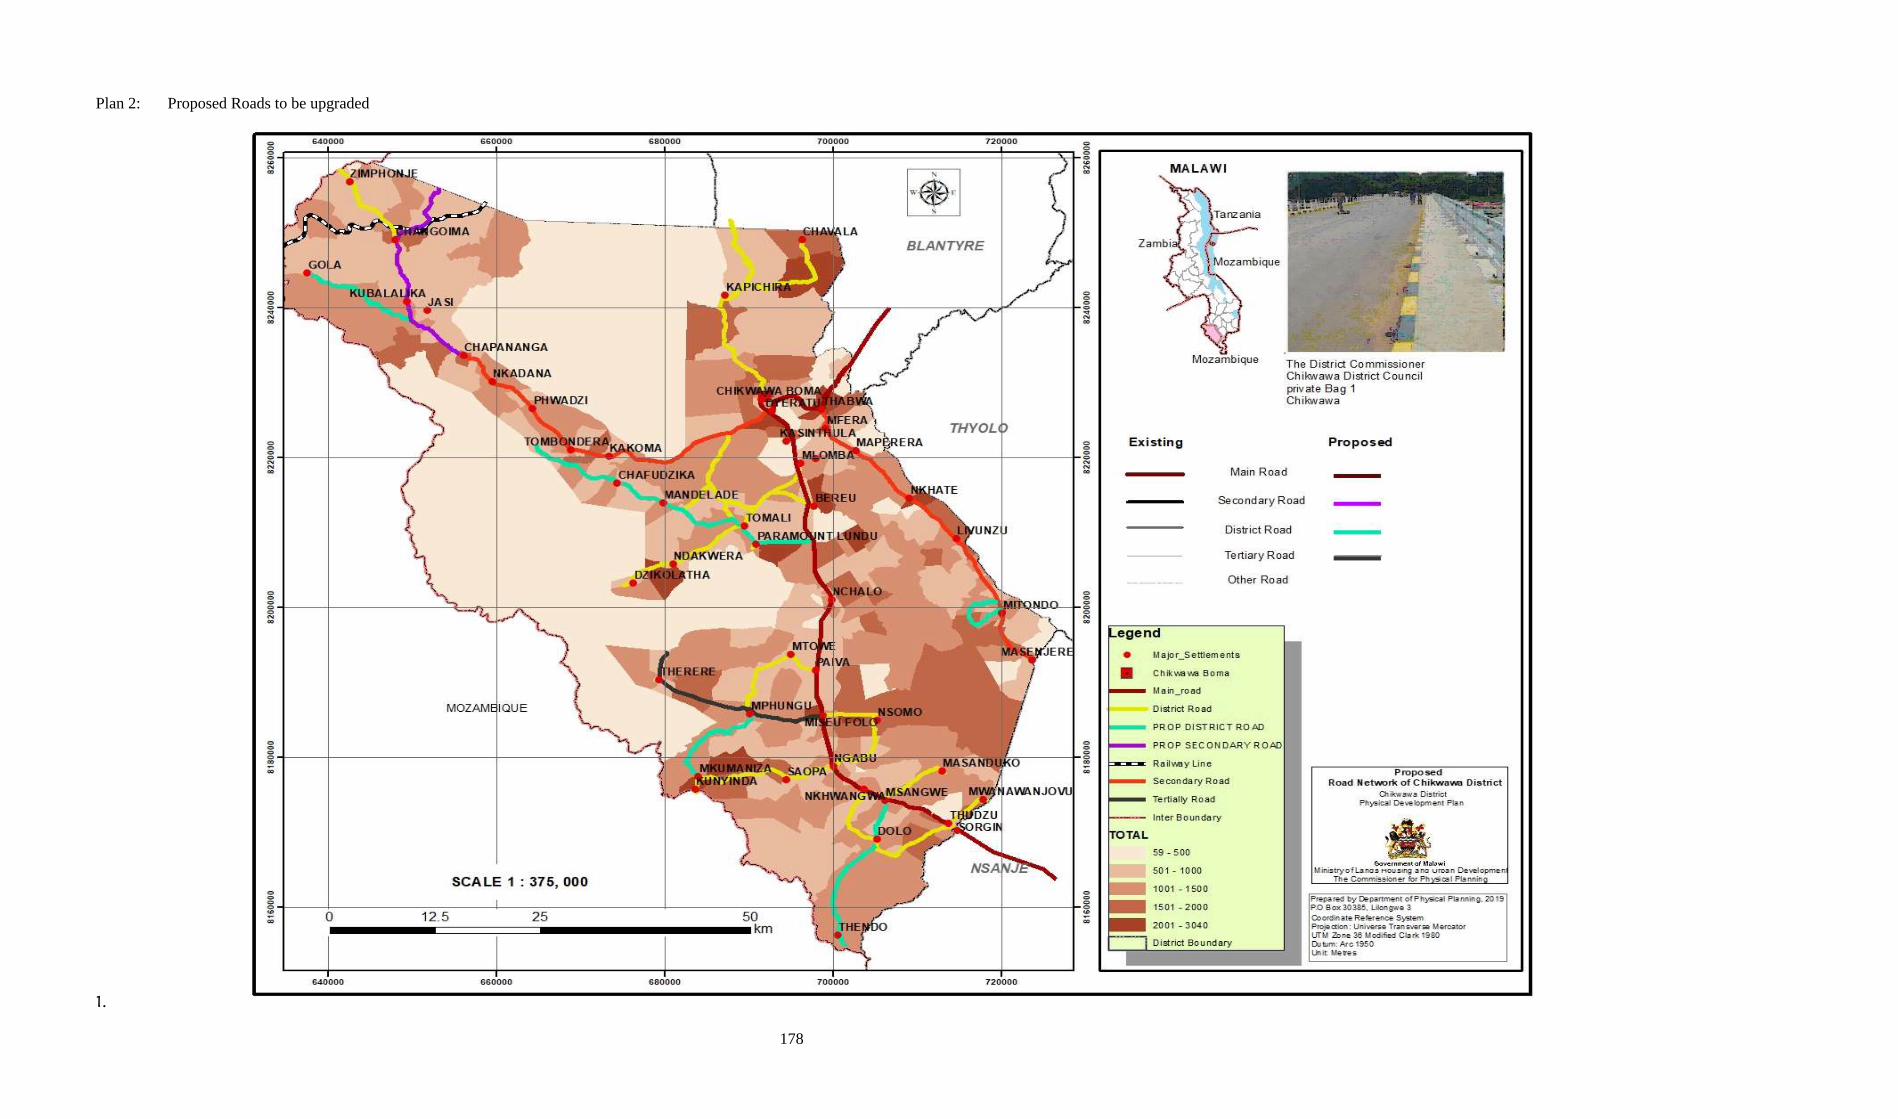
178
Plan 2: Proposed Roads to be upgraded
1.
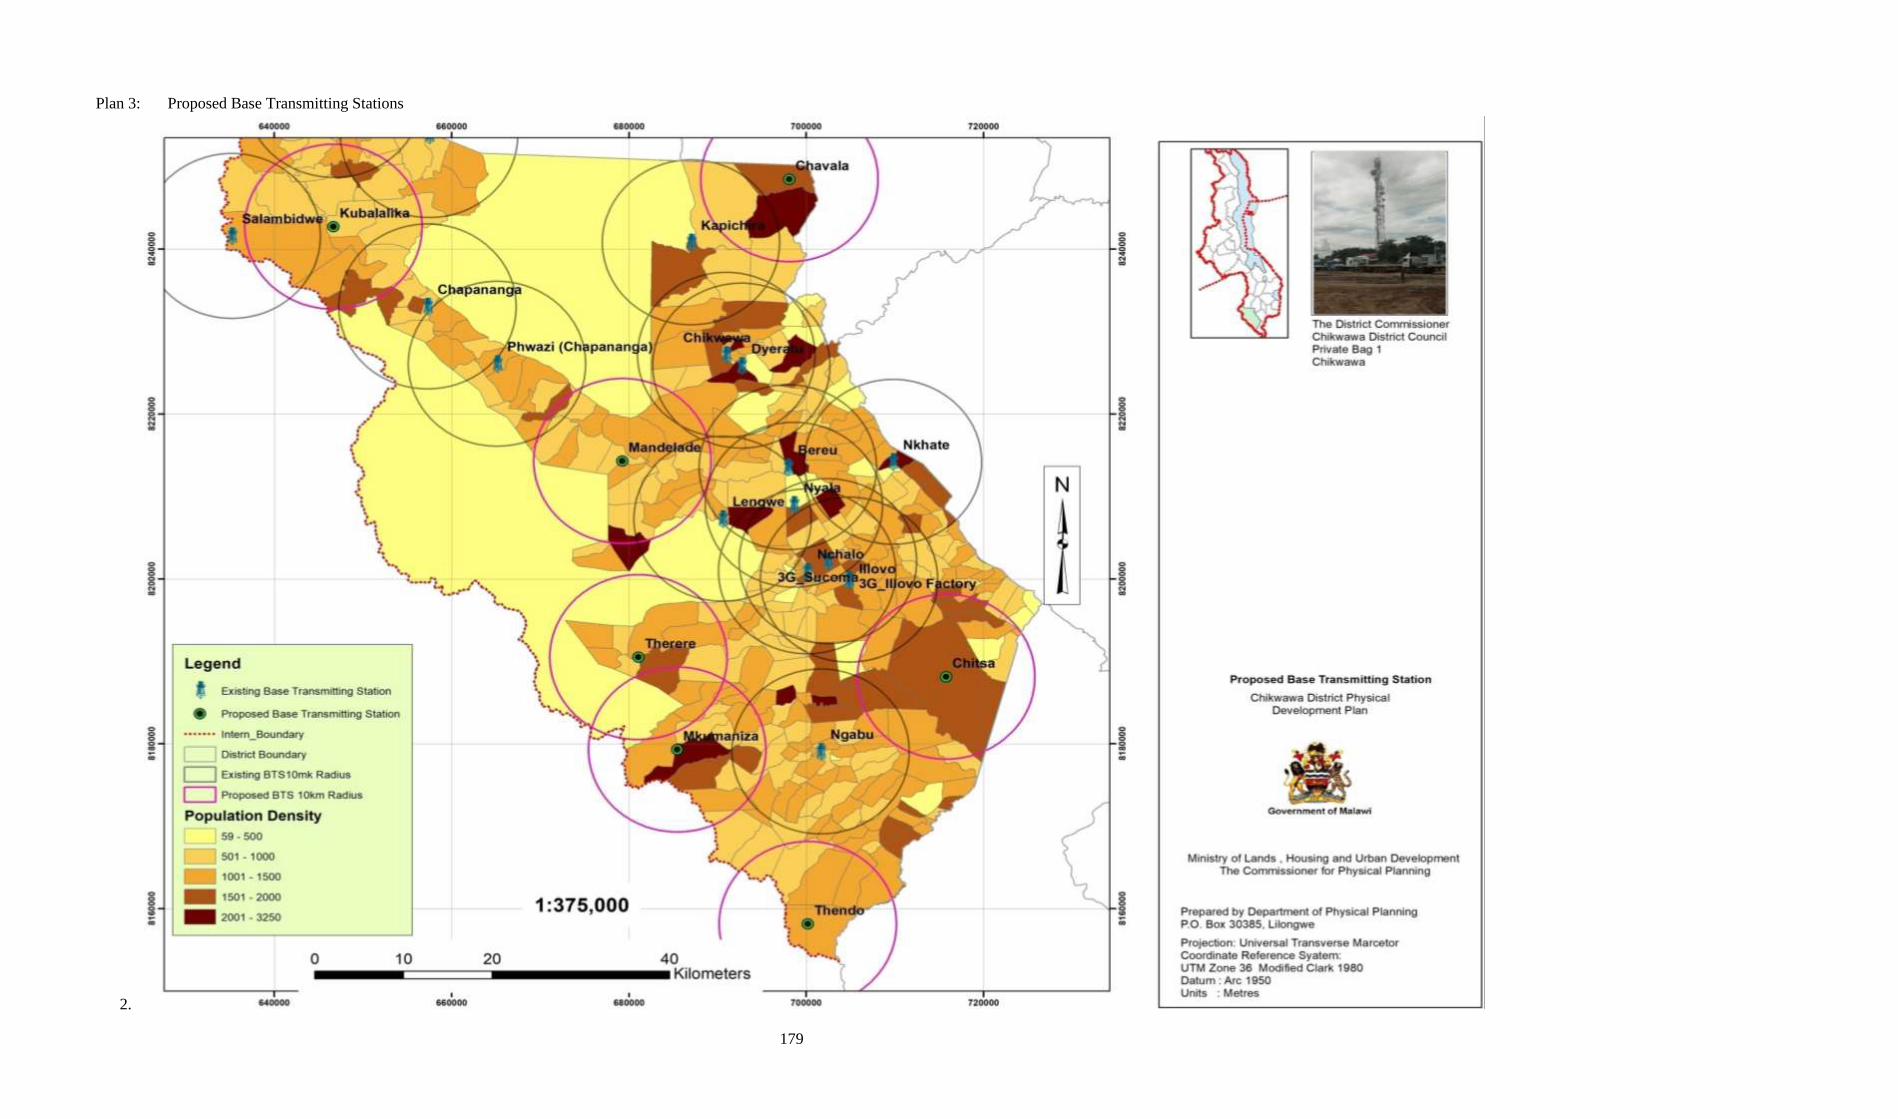
179
Plan 3: Proposed Base Transmitting Stations
2.
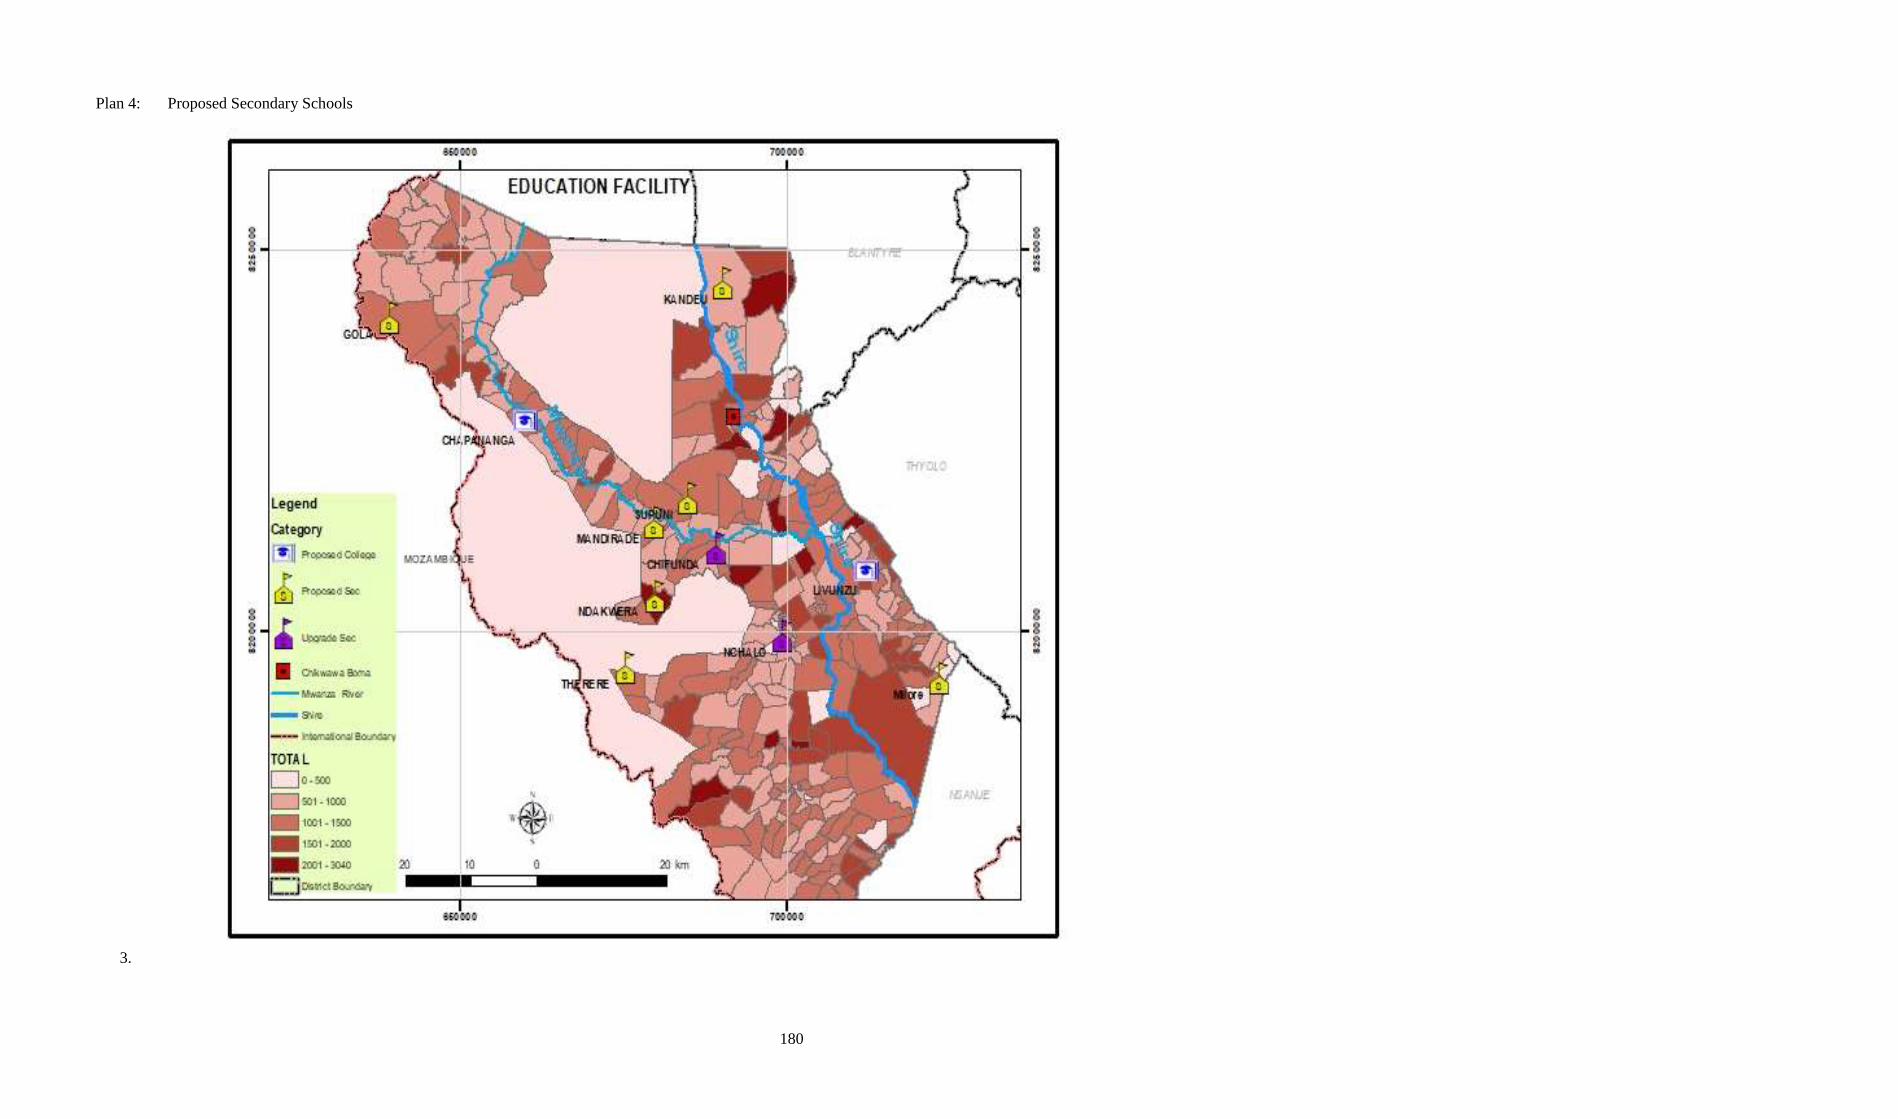
180
Plan 4: Proposed Secondary Schools
3.
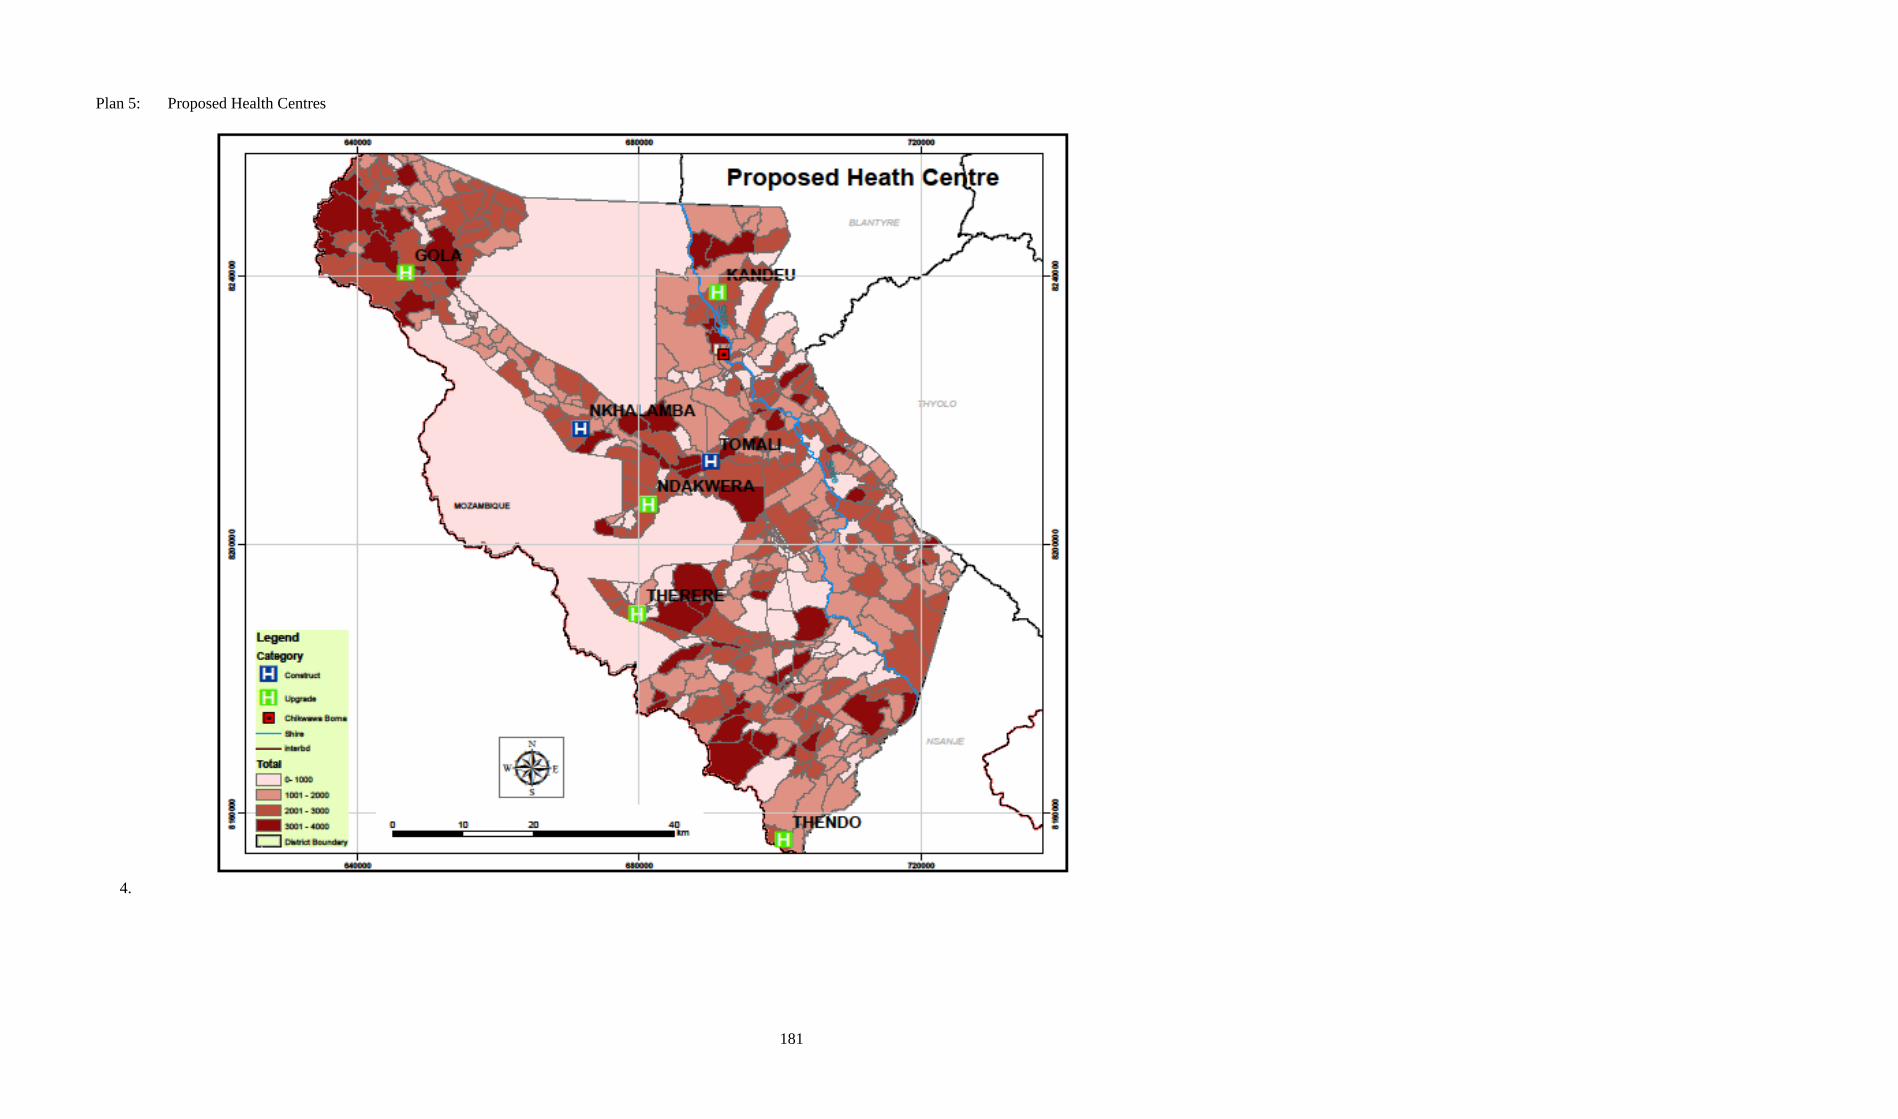
181
Plan 5: Proposed Health Centres
4.
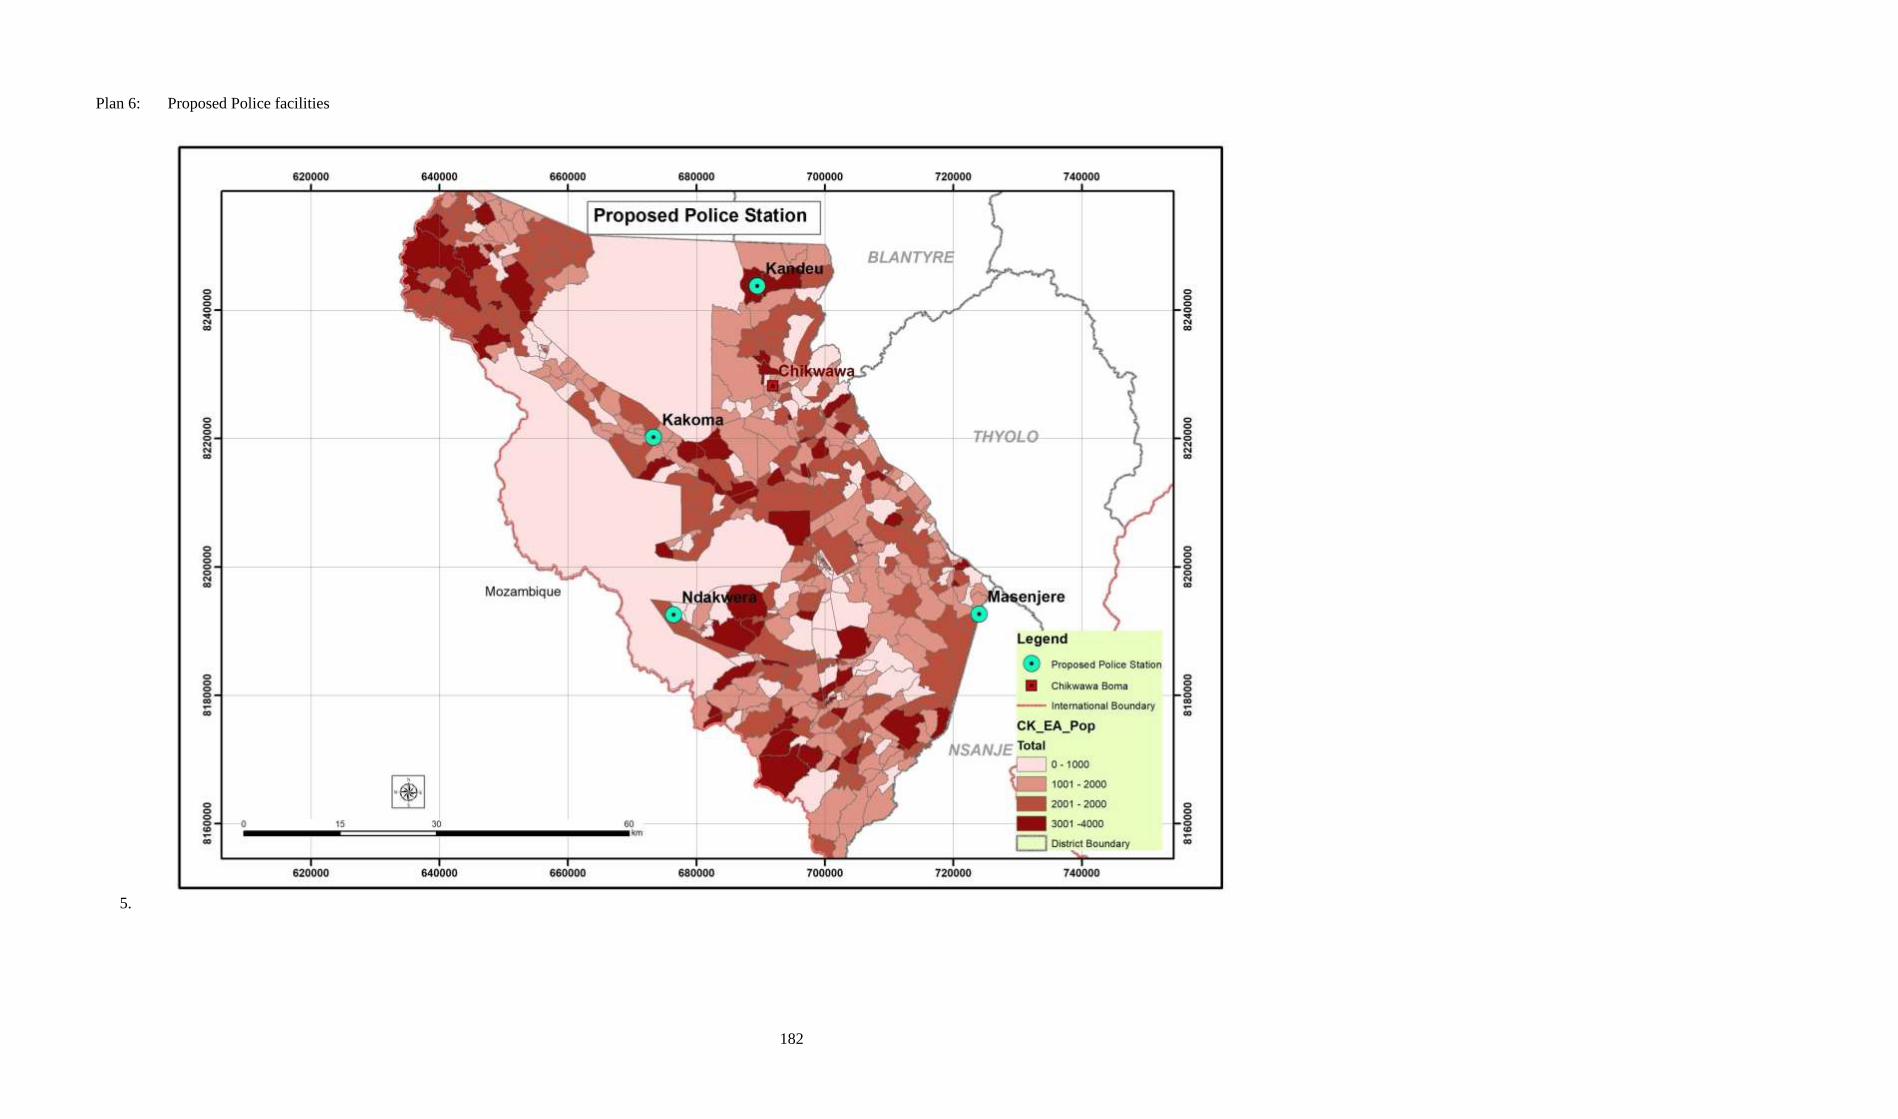
182
Plan 6: Proposed Police facilities
5.
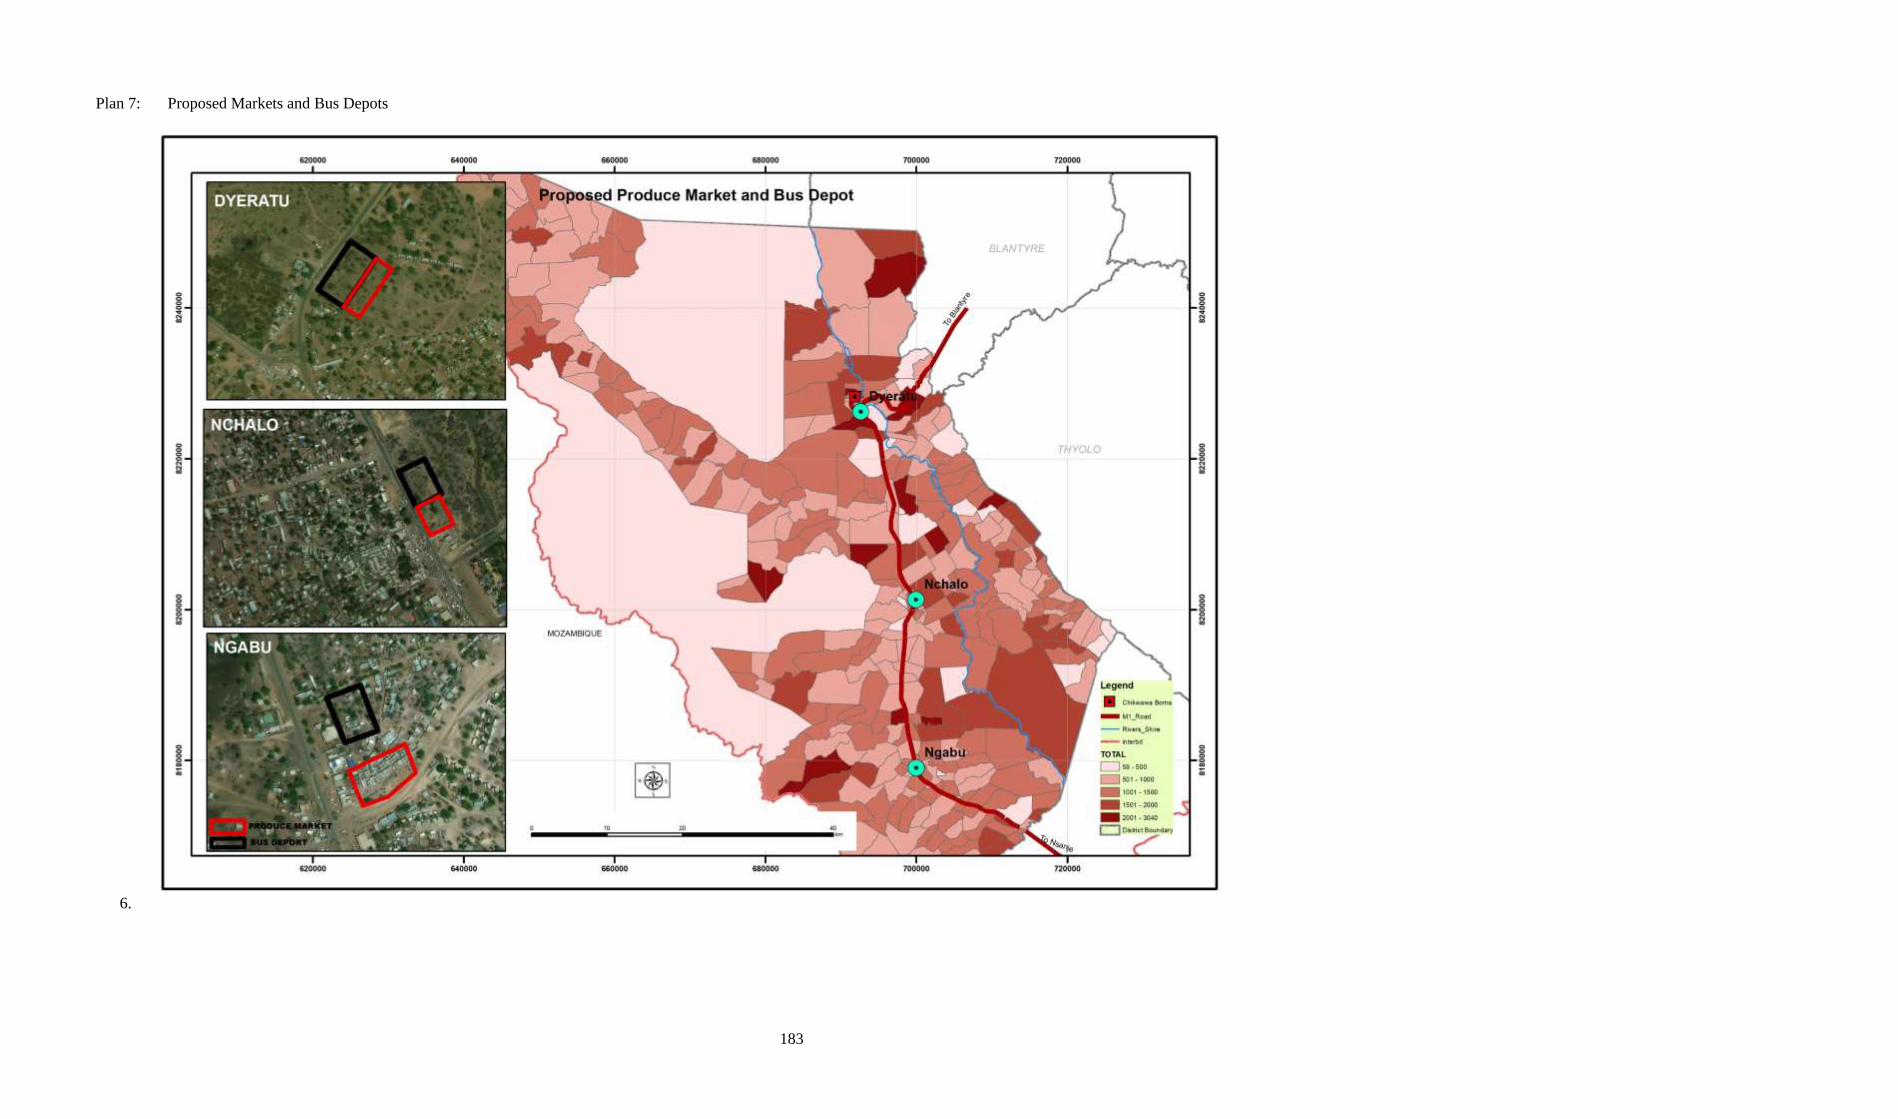
183
Plan 7: Proposed Markets and Bus Depots
6.
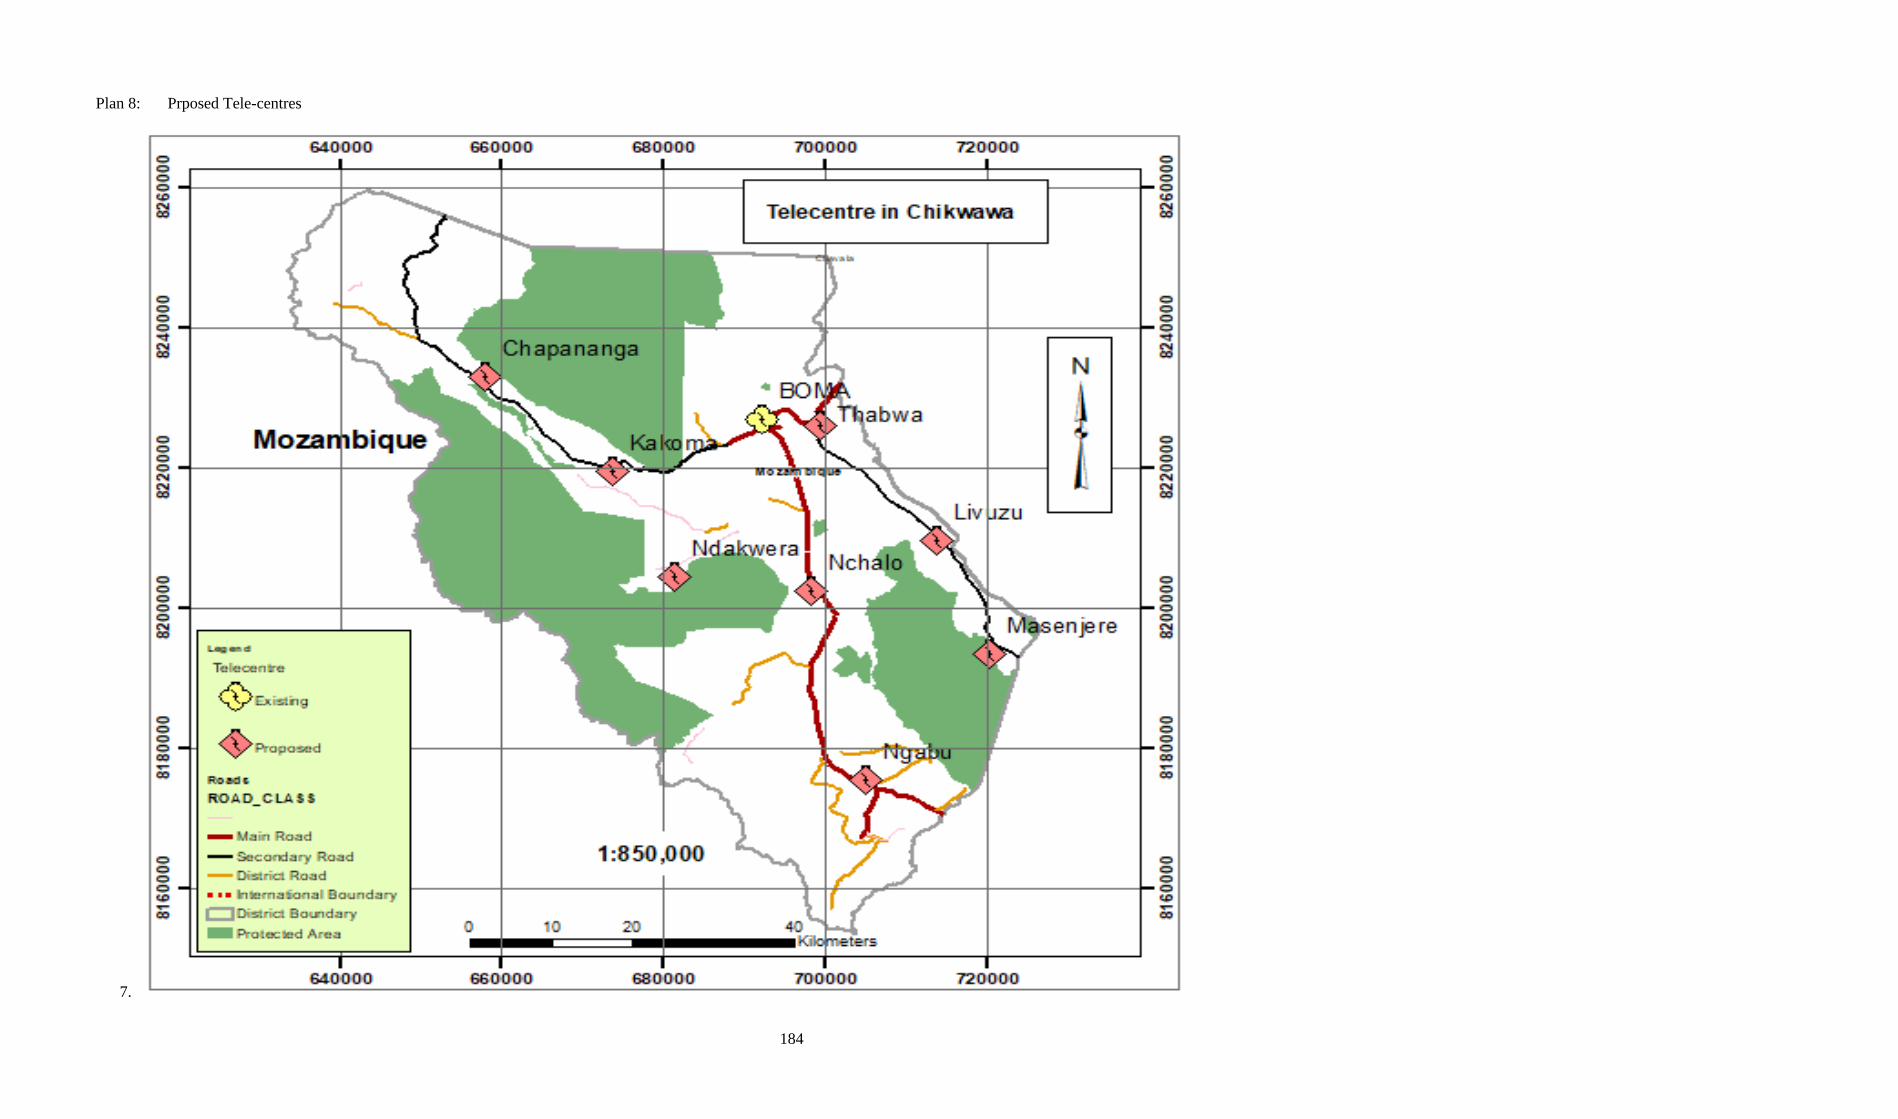
184
Plan 8: Prposed Tele-centres
7.
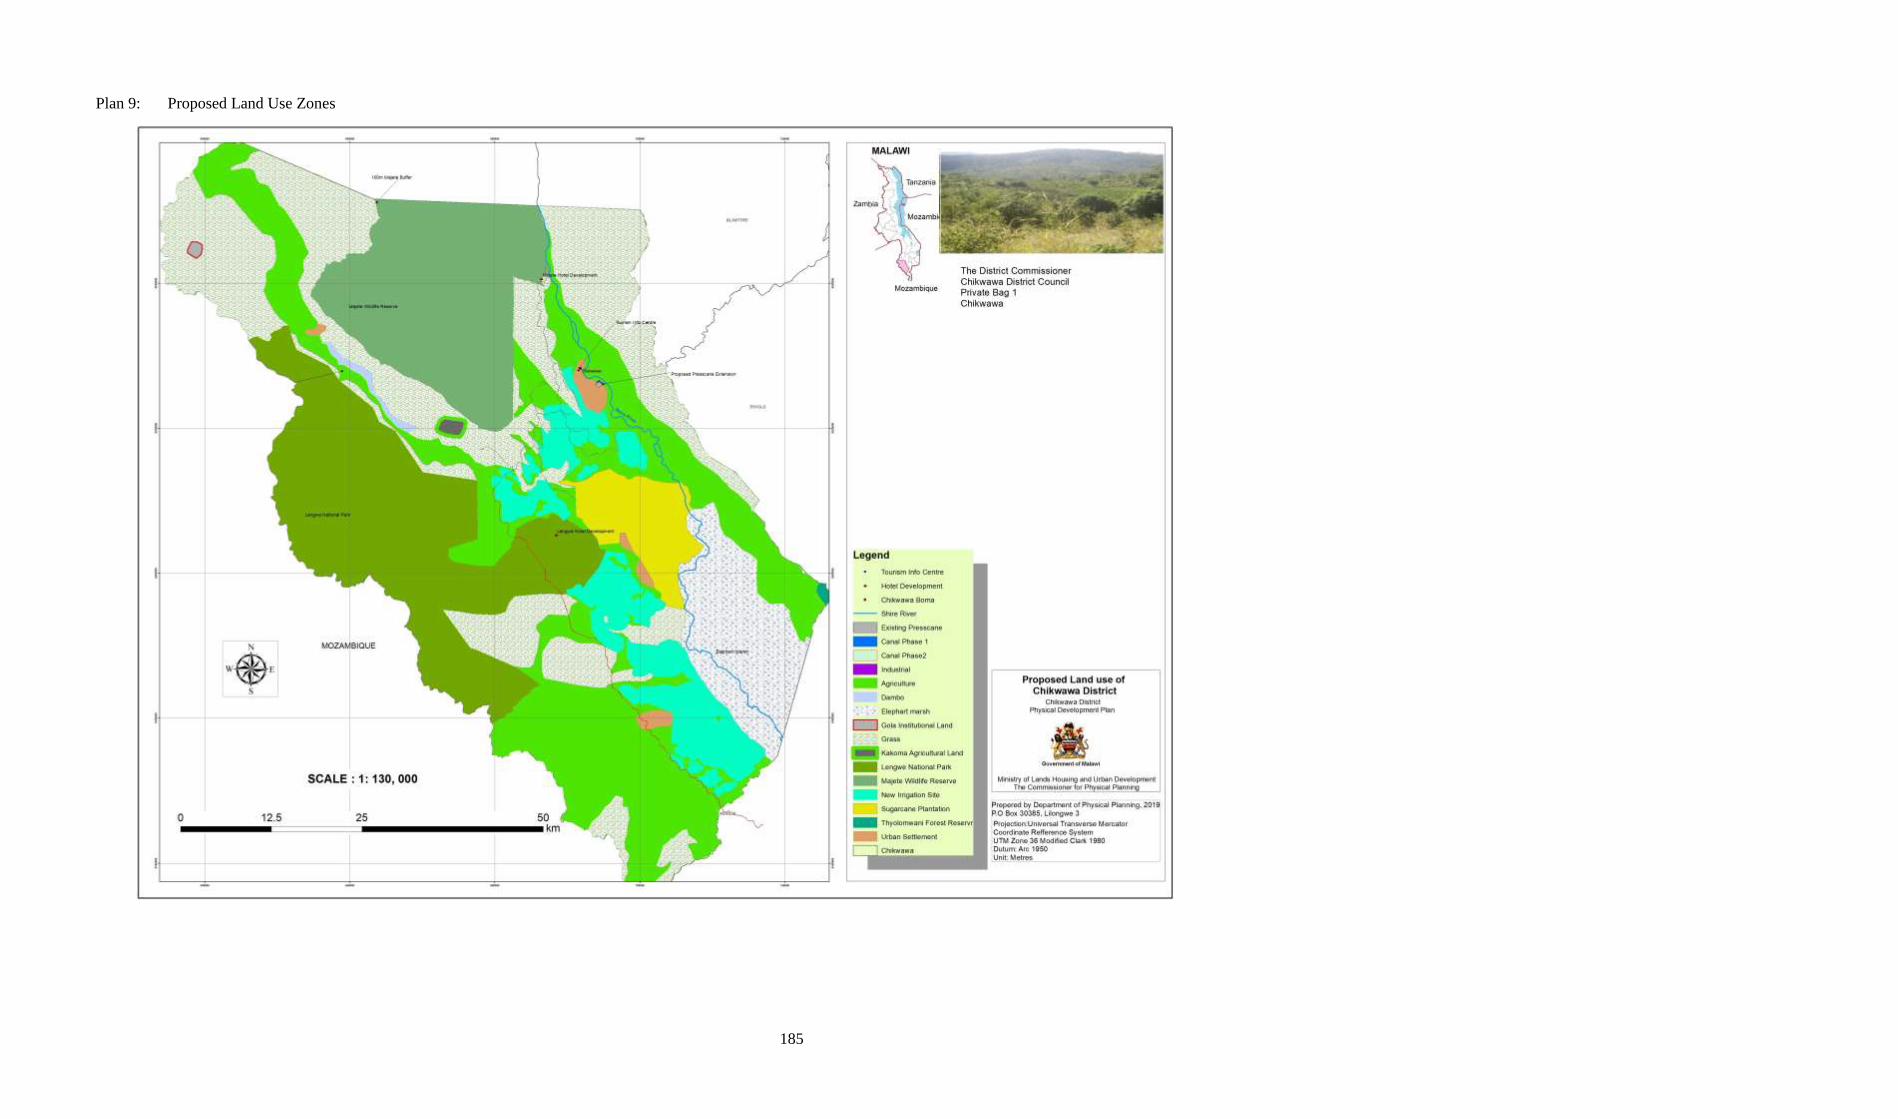
185
Plan 9: Proposed Land Use Zones
186
APPENDIX 6: THE PROJECT TEAM The Project Team which prepared the Plan consisted of the following professional and technical personnel:
A. Professional Personnel
1. F.C. Tukula Commissioner for Physical Planning
2. D. Chilonga Land Reform Programme Team Leader (LRPIU)
3. G.K. Mchoma Deputy Commissioner for Physical Planning – Development Planning
4. L.P.H. Longwe Deputy Commissioner for Physical Planning – Development Management
5. J. Lungu Chief Physical Planning Officer – Quality Assurance
6. R.B.C. Lukasi Chief Physical Planning Officer – Land Use Planning
7. K. N’gambi Chief Economist
8. A.K.W. Mkundika Acting Regional Commissioner for Physical Planning (E)
9. G. Kamtsalira Acting Regional Commissioner for Physical Planning (S)
10. J. Chilale Principal Physical Planning Officer (HQ)
11. M. Mkandawire Principal Physical Planning Officer (HQ)
12. L. Khembo Principal Physical Planning Officer (S)
13. H. Ngwale Senior Photogrammetry Officer (C)
14. L. Manda Physical Planning Officer (E)
15. M.G. Bazale Physical Planning Officer (HQ)
16. H.C. Mandalasi Physical Planning Officer (HQ)
17. C. Nyirenda Physical Planning Officer (HQ)
18. T.D. Kasakula Physical Planning Officer (C)
19. L. Madula Mchilikizo Physical Planning Officer (C)
20. Z. Nyirenda Physical Planning Officer (HQ)
21. N.S. Nyasulu Chimera Physical Planning Officer (S)
22. I. Fatchi Physical Planning Officer (S)
B. Technical Personnel
1. Y.O Kaunde Senior Assistant Physical Planning Technician (S)
2. T.A.K Mwafulirwa Assistant Physical Planning Technician (HQ)
3. L. Meya Assistant Physical Planning Technician (HQ)
4. M.Dimu Assistant Land Surveyor
CHIKWAWA DISTRICT PHYSICAL DEVELOPMENT PLAN
187
BIBLIOGRAPHY 1. Bernd, Jenssen. (1989). ‘Planning Dialogue’ in District Development Planning and Management in Developing Countries. Dortmund:
Dortmund University
2. Chikwawa District Council. (2017). Draft Chikwawa District Socio-Economic Profile. Chikwawa.
3. De Soto, H. (2000). ‘The five mysteries of capital’. In The Mystery of Capital: Why capitalism triumphs in the West and fails
everywhere else Basic Books, London, U.K. pp. 20.
4. Dhivya, T. A. (2008). Measuring Heterogenous Traffic Density. International Journal of Civil and Environmental Engineering Vol: 2.
5. ESCOM. (2018). Base Tariff Application for the Functions of Transmission, Distribution and System Market Operator. Blantyre:
ESCOM.
6. Illovo Sugar (Malawi) Plc. (2018). 2018 Annual Report. Blantyre.
7. Korea Community Corporation. (2017). Technical Feasibility Study on Shire Valley Irrigation Project. Lilongwe: Malawi Government.
8. M. Roux, S. R. (2014). Baseline Axle Load Survey in Malawi. Pretoria: CSIR Built Environment.
9. Malawi Goverment. (2006). Roads Fund Administration Act. Zomba: Goverment Printer.
10. Malawi Government. (1987). National Physical Development Plan. Zomba: Government Printer.
11. Malawi Government. (1987). National Physical Development Plan. Lilongwe: Government Printer.
12. Malawi Government. (2006). Roads Authority Act. Zomba: Goverment Printer.
13. Malawi Government. (2015). National Education Standards for Primary and Secondary Education. Lilongwe: Government printer.
14. Malawi Government. (2017). Health Sector Strategic Plan II (2017 - 2020). Lilongwe: Government Printer.
15. Millennium Challenge Account. (2011). Concept Paper for the Energy Sector, Public Private Partnerships on Electricity Generation
for Rural Areas 2011-2016. Millennium Challenge Account.
16. Millennium Challenge Account. (2011). Public Private Partnerships on Electricity Generation for Rural Areas.
17. Millennium Challenge Account. (2011-2016). Concept Paper for the Energy Sector, Public Private Partnerships on Electricity
Generation for Rural Areas. Washington: Millennium Challenge Account.
18. National Statistical Office. (2008). 2008 Chikwawa District Population Characteristics. Zomba: National Statistical Office.
19. National Statistical Office. (2012). 2008 Malawi Population and Housing Census Report. Zomba: NSO.
20. National Statistical Office. (2012). Integrated Household Survey 2011-12. Zomba: NSO.
21. National Statistical Office. (2017). Integrated Household Survey 2016-17. Zomba: NSO.
22. National Statistical Office. (2019). 2018 Population and Housing Census. Zomba: National Statistical Office.
23. OECD. (2006). Infrastructure to 2030. Paris: OECD.
24. University of Glasgow and Washted. (2018). Sustainable Off-Grid Electrification of Rural Villages: Policy Brief. Glasgow: University
of Strathclyde.
25. World Bank. (2017). Malawi National Transport Master Plan. Washington: World bank.
26. World Bank Group. (2016). New Rural Access Index, Policy Research paper. Washington: World Bank Group.
27. Zimalirana, G. & House, W. (1992). ‘Rapid Population Growth and its Implication for Malawi’. Malawi Medical Journal, Vol.8, No.2