Chickens by Modulating the Gut Microbiome Antibiotics as a ...
31
Page 1/31 Antibiotics as a Feed Additive Promote Growth of Chickens by Modulating the Gut Microbiome Xiangkai Li ( [email protected] ) Lanzhou University https://orcid.org/0000-0002-5704-9791 Ying Wu Lanzhou University Liang Peng Lanzhou University Rong Han Lanzhou University pengya Feng Lanzhou University Aman Khan Lanzhou University Pu Liu Lanzhou University Research Keywords: Antibiotic, Gut microbiota, Metabonomic, Lipid and amid acid metabolism, Immune response Posted Date: June 7th, 2021 DOI: https://doi.org/10.21203/rs.3.rs-571302/v1 License: This work is licensed under a Creative Commons Attribution 4.0 International License. Read Full License
Transcript of Chickens by Modulating the Gut Microbiome Antibiotics as a ...
Page 1/31
Antibiotics as a Feed Additive Promote Growth ofChickens by Modulating the Gut MicrobiomeXiangkai Li ( [email protected] )
Lanzhou University https://orcid.org/0000-0002-5704-9791Ying Wu
Lanzhou UniversityLiang Peng
Lanzhou UniversityRong Han
Lanzhou Universitypengya Feng
Lanzhou UniversityAman Khan
Lanzhou UniversityPu Liu
Lanzhou University
Research
Keywords: Antibiotic, Gut microbiota, Metabonomic, Lipid and amid acid metabolism, Immune response
Posted Date: June 7th, 2021
DOI: https://doi.org/10.21203/rs.3.rs-571302/v1
License: This work is licensed under a Creative Commons Attribution 4.0 International License. Read Full License

Page 2/31
AbstractBackground: Antibiotics widely used as growth promoters in the agricultural industry, but theirmechanisms have not been fully explored. Antibiotics has a connection effect on the gut microbiomewhich plays a vital role in host metabolism and immune response. Here, we investigated the associationof antibiotic and gut microbiome in broiler chicken.
Methods: Polymyxin (PMX) and amoxicillin (AMX) were selected as feed additives in broiler chicken, andgut bacterial composition assessed by quantitative real-time PCR and high-throughput sequencing ofbacterial 16S rRNA. Metabolome and lipidomic of feces and serum samples were analyzed using liquidchromatograpy-tandem mass spectrometry (LC-MS). We further assessed changes in the microbiota andmetabolism which underwent antibiotics treatment.
Results: The administration of antibiotic increasing, the average weight of chickens by up to 4.9% andaltered number and structure of the intestinal micro�ora compared to the un-treated group. The bacterialcomponent of gut microbiota in antibiotic groups was showed a lower prevalence of Firmicutes andBacteroidetes phyla and higher prevalence of a high diversity (Proteobacteria). In metabolome of fecesand serum, amino acid such as phenylalanine, valine, methionine and aspartic acid, and lipid metabolic(Lysolecithin, Oxalosuccinic acid and phosphatidylcholine) were all higher among obese chicks inantibiotics groups. Serum IgG (18.2%–32.7%) and intestinal secretory IgA (27.5%–28.6%) were decreasedcompared with control group, and immune associated metabolome in serum lipidomic were also�uctuated with the concentration of AMX and PMX.
Conclusions: The data suggested that the structure and quantity of intestinal �ora has to affect aminoacid and lipid metabolic homeostasis, and immune response, which can serve as a target in theprevention and treatment of metabolic disorders.
1. Background:Antibiotic has been applied to animal husbandry which is rising globally at an unprecedented rate withthe emergence and spread of antimicrobial resistance [1, 2]. The antibiotics used in livestock productionwere estimated to be 93,309 tons in 2017 and are expected to increase to 104,079 tons in 2030 globally,and about 73% of all antimicrobials used in animals were raised for food [3, 4]. The initial purpose ofantibiotic used in animal husbandry is for livestock diseases including gastrointestinal and respiratorytract infections with low cost and high cure e�ciency [5, 6]. However, low doses of antibiotics have beenfed to large numbers of animals used for food production to increase weight gain [7]. For example,chlortetracycline can increase the growth rate of animal as much as 15% [8]. Avoparcin, efrotomycin,lincomycin, penicillin G procaine, and virginiamycin have also improved the performance of animals inthe farm, which contributed to large �nancial pro�ts for producers and low cost for consumers [9, 10].Consequently, farmers prefer to use antibiotics, although many countries have banned the use ofagricultural antibiotics [11]. The use of antibiotics is still in an upward trend in the future [12]. However,the mechanism that antibiotics can lead to obesity growth of animals is not very clear [13].
Page 3/31
Gut microbiota has been recognized as an important factor in the maintenance of energy homeostasisand host immunity, contributing to the improved performance of the body [14]. Research showed thatconventional mice had 40% more body fat than germ-free mice, regardless of food intake [15]. Meanwhile,colonization of germ-free mice with gut microbiota from conventional mice produced a signi�cantincrease in body weight and a 60% increase in body fat [16]. Besides, culture-based studies haveindicated that intestinal bacteria tend to compete with the host for energy and amino acids [17]. As muchas 6% of the net energy in pig diets can be lost due to bacterial utilization of glucose in the small intestinewhich reduces the energy available to the host epithelium [18]. Although the intestinal �ora consumespart of the energy, it also synthesizes a variety of vitamins necessary for growth and development, suchas vitamins, nicotinic acid and pantothenic acid [19, 20]. Thus, a depleted microbiome could decrease thenumber of calories available for microbiome absorption and induce a hypoglycemic state, which maybethe potential role in energy storage [21]. For example, SCFA valerate, which is the main metabolic produceof microbiota, decreased 66-fold after antibiotic treatment [22, 23]. However, the basic questions relatingto the effects of microbial production of intestine catabolites after quick antibiotics intervention remainmostly unanswered [16, 24].
Antibiotics are well known to result in the compositional and diversity changes of gut microbiota inanimals [25]. The total bacterial community has induced a pronounced drop (−90%) during antibiotictreatment per gram of intestinal content and has reached a minimum value after 11 days [26, 27].Evidence has also suggested that the antibiotic intervention �ora in microbiota construction is ine�cient.The prevalence of Bacteroidetes and Firmicutes were signi�cantly reduced, while Proteobacteria wasgreatly increased in the guts of rats after antibiotic treatment, which is coincident with the development ofobesity [28, 29, 30]. The major probiotic genera of gut microbiota is also changed,including Lactobacillus, Bi�dobacterium and Helicobacter [31]. Besides, it is interesting to note that thegrowth-promoting effect of probiotics in livestock is less consistent than that observed with antibioticsupplementation, which may promote growth under the present of certain pathogens are presence [32].For example, the Gram-positive facultative anaerobes, which are oxygen-tolerant and predominant in thesmall intestine, often contribute more than one toxic catabolite [33]. Hence, the depletion of gutmicrobiota rendered mice resistant to body weight loss, accompanied by the increase in fat mass [34]. So,whether antibiotics will reduce the energy consumption by changing intestinal �ora is still unclear.
Based on abovementioned information, this study hypothesized that antibiotics can decrease the contentand destroy the structure of intestinal �ora to reduce energy consumption, making the host grow rapidly.But simultaneously, some bene�cial factors also decrease, which are produced by gut microbiome,putting the host in an unhealthy growth state. Five broad-spectrum antibiotics, including Tylenol-tartrate,sulfadimidine, polymyxin, oxytetracycline and amoxicillin, were selected as feed additives in whitefeathered broilers as feed in normal-chow feed, which is widely used in animal husbandry [35, 36, 37]. Inthis model, the alteration of chicken metabolism has been demonstrated in different gut microbiotathrough short term antibiotic manipulation in high-dose doses. The results showed that the microbiomeof chicken with antibiotic is depleted of all major bacterial phyla, as evidenced by decrease in cecummicrobes. Antibiotic intervention has changed the vitamin digestion and absorption. In lipidomic, the

Page 4/31
insulin resistance, fat digestion and absorption, and cholesterol metabolism have been altered throughthe gut microbiota. Besides, some disease-related pathways are partly upregulated in the group with 800mg/kg of AMX+PMX. It reveals that antibiotic can change the deeply intertwined relationship among thegut microbiome through amino acid and fat metabolism and immune system, promoting energyaccumulation.
2. Results And Discussion2.1 Antibiotics increased the growth of chicken
The average daily gain (ADG = (the weight of day 42nd- the weight of day 1nd) / 41) in AMX + PMX groups(up to 25.9%) were highest among other antibiotic groups (14.3-23.4%) within 42 days (SupplementalFigure 1A). For feed conversion ratio (FCR = Live gain / feed consumption), the antibiotic groupsespecially AMX + PMX1 group showed a marked increased (17.8-34.2%) compared with the control group(P < 0.01) (Supplemental Figure 1C). No signi�cant has been observed in food intake among all groups(3.2%–21.1%) (Supplemental Figure 1B). Therefore, the combination of AMX + PMX was employed tofurther experiment (Figure 1A). The results showed that at 400 mg/kg of concentration, the growth ofchickens reached to the maximum compared with that of the control group (4.9%). However, after 800mg/kg of AMX + PMX intervention, the weight was signi�cantly decreased 2.5% than that in the controlgroup (Figure 1B). It showed that the weight gain was increased with a certain dose of antibioticintervention.
Antibiotics have been used as growth promoters at a subtherapeutic concentration in animals [38, 39].Chlortetracycline and salinomycin (500 g/ton) produced a 9.8 % higher ADG than the control [40].Oxytetracycline (100 mg/kg) and �orfenicol (5 mg/kg) also showed signi�cant increase in the �nal bodyweight, which is consistent with obtained results [41]. However, the antibiotic group exhibit 10.6 higherADG than control, low FCR than the control, which are unsimilar with early report [40]. These dataindicated that AMX and PMX consider as a growth promoter for chicken broiler. The attribution ofimprovement of growth and feed e�ciency as a result of dietary antibiotic supplementation is not clear,and needs further investigation [42].
2.2 Health index, in�ammation markers and oxidative stress indicators on chicken decreased withantibiotics
The levels of AST, ALT, MDA, CAT and T-SOD were tested, which were similar with the control group (P <0.01) (Figure 2A-E, Supplemental Figure 1). Histopathological analysis showed that a slight nuclearshrinkage in the liver of chicks were observed after being treated with 400 g/kg of AMX + PMX (Figure2F). Furthermore, under microscopical examination, hematoxylin-eosin staining of the adipose tissuesections in the antibiotic-treated chicken revealed that the distribution of mast cells was signi�cantlymore than that of the control group (Figure 2 G). The results showed that in the 35 days, both the 200 and400 groups produced a 19.0 and 16.3% lower the ratio of liver/body weight than the control. There was no

Page 5/31
signi�cant difference in the immune organ indexes of thymus, bursa and spleen (control group) ascompared to the groups, only a slight decrease in chicken treated with 200 and 400 mg/kg of AMX andPMX (Figure 2I). The expression levels of IgG and IgA in the 200 group were remarkable lower (30%, 10%)than those in the control group, (Figure 2J-K).
Oxidative stress indicators (AST, ALT, T-SOD, MDA and CAT), which indicated tissue impairment caused bystress, toxicity and liver damage produced by antibiotics, revealed no signi�cant effects occurring [25, 43,44]. The biochemical results corroborated the demonstration to the histopathological �nding of both liverand adipose tissue, which further showed that an increase in mast cells in visceral fat obesity wasaccompanied with antibiotics [45]. Antibiotic-treated mice were decreased liver/body weight, which issimilar with ours [46]. Induction and maintenance of an appropriate level of immunological activity andin�ammation markers is crucial for healthy broiler growth in poultry farms [47]. Serum IgG and intestinalsecretory IgA were compared between groups (Serum IgG re�ected the immune state of the system, andintestinal secretory IgA re�ected the immune state of the system and the intestine, respectively) [48]. TheAMX + PMX decreased colon mucosal secretory IgA (27.5%–28.6%) and serum IgG (18.2%–32.7%)concentration, which is similar with the chlortetracycline and salinomycin effect on IgA and serum IgG(15.7%)[40]. Moreover, the immune organ indices of the thymus gland and bursa indicated a weakenimmunity, which was decreased 12.5% and 5.3% in 200 group and–0.57% and 4.8% in the 400 group. Forexample, salmonid speci�c and nonspeci�c immune responses were also depressed by theadministration of tetracycline at 10 mg/ kg diet [49]. It indicated that under antibiotics, which is perhapsvia reducing the nutrient consumption required for maintaining immunological activity [50, 51].
2.3 Antibiotics decreased the number and changed the structure of the intestinal micro�ora
The fecal �ora of chicken was detected in 1, 9, 16 and 23 days (Figure 3A-D). The result showed that withthe increase of antibiotic concentration, the number of gut microbiota formed a concentration gradient,and it researched the lowest level on the 400 and 800 mg/kg. Simultaneously, qRT-PCR quantitation ofchickens’ colonic micro�ora on the 35nd day showed that the content of gut microbiome was declinedwith the increase of antibiotic concentration, and the change was similar with fecal �ora (Figure 3E). 16SrRNA gene sequencing was performed using the chicken feces collected after 35 days of antibiotictreatment. By signi�cance tests for differences in α diversity, the gut microbiota of antibiotic micefeatured an increase in Shannon index (Figure 3F). This may be due to the antibacterial effect ofantibiotics, which promotes the reproduction of some nonmajor bacteria in the intestinal tract. PCoAshowed that with the increase of antibiotic concentration, the distance between the intestinal �oradistribution and the control group increased gradually (Figure 3G).
The antibiotic-induced difference in microbiota composition was illustrated in Figure 3. Firmicutes,Proteobacteria and Bacteroidetes species were dominant in treatment groups, as was the microbiomefrom the control group. It had far fewer sequences from the Firmicutes and Bacteroidetes phyla, and themicrobiome of antibiotic chicken had a compositional shift to Proteobacteria (Figure 3I). The ratio ofFirmicutes to Bacteroidetes (Firm/Bac ratio) was decreased upon antibiotic exposure (Figure 3H). A few
Page 6/31
bacterial genera have been identi�ed that were signi�cantly different in between antibiotic and controlgroups (Figures 3J). Lactobacillus and Bi�dobacterium are widely approved probiotic genera withextensive health-promoting and immunomodulatory properties[52, 53]. Lactobacillus, Enterococcus andRomboutsia showed lower community than those in the control group (20%), while the contents ofBacteroides was signi�cantly higher in the group treatment with 800 mg/kg of AMX+PMX as comparedto that in the control group (354.67%). Additionally, few other genera including Lachnospiraceae,Clostridiales, Oscillibacter and Roseburia were altered by calorie absorption. Together, these datasuggested that the total and architecture of gut microbiota had a slight altered by antibiotic intervention,likely contributing to the metabolic bene�ts of calorie absorption.
The chicken gastrointestinal tract is home to an ecosystem rich in microbial biodiversity, playing home to≥ 500 phylotypes or ~1 million bacterial genes, which is integral in multiple physiological processes ofthe host, including being a key factor involved in host metabolism, body weight and energy homeostasis[54, 55]. Symbiotic microbes that receive their nutrition from animal and, in turn, contribute essentialnutrients and play a role in immune defense [56]. Increasing evidence showed that the nutritional value offood is in�uenced by the structure and operation of the gut microbial community [57]. Firmicutes (Grampositive), Bacteroidetes (Gram negative), and Actinobacteria (Gram positive) represent over 90% of thephyla and dominate the gut microbiota [58]. The alteration of the proportion of Firmicutes andBacteroidetes changes the nutrient load in the gastrointestinal tract [59]. For example, vancomycintreatment reduced the relative abundance of Firmicutes from 37% to 50% and increased in the relativeabundance of Proteobacteria which is consistent with our previous results [60]. A research found thatthere is a positive correlation between ratios of Bacteroidetes to Firmicutes and the plasma glucoseconcentration [61]. The conversation of Firmicutes and Proteobacteria phyla was decreased 29.5%-83.4%,which accelerate catalyze the conversion of choline and the progression of T2D [62]. Additionally,antibiotic such as avilamycin, reduced overall community diversity and certain bacterial species(Lactobacillus and Bi�dobacterium) and predominantly alter the ileal microbiota (lactobacilli dominant)[63, 64]. The growth of Bi�dobacterium is able to increase probiotic genera such as Kurthia, Lactobacillusand Bifdobacterium and meanwhile decrease harmful bacteria such as Pseudomonas (Supplemental�gure 2). Lactobacillus species in the colon is crucial to produce speci�c fermentation products (i.e.,short-chain fatty acids, predominantly acetate, propionate and butyrate) to mediate the host metabolichealth [65].
2.4 The role of antibiotic and metabolomic correlation of intestinal microbiota
The fecal metabolite levels in chicken administered with different concentrations of AMX+PMX or wereuntreated (control) have been investigated. About 14,957 metabolic features was observed afteruntargeted LC-MS analysis and 5,861 features were annotated by following the standard �lter criteria(features detected in < 70% of the QC samples were removed). PCA and PLS-DA indicated that theantibiotic treatment group and the control group could be separated with the increase of antibioticconcentration, and the metabolites of the group with 800 mg/kg of AMX+PMX and the control group weresigni�cantly different (Figure 4A, B). Proteobacteria, Actinobacteria, Firmicutes, and Acidobacteria were

Page 7/31
primary bacteria of gut microbioma. Regulatory 44 metabolisms were classi�ed to phylum, among them10 were related to Deinococcus-Thermus, 1 was related to Bacteroidetes, 1 was related to Actinobacteria,and 32 were related to Opisthokonta (Figure 5, Supplemental �le 2).
The gastrointestinal tract represents the interface between ingested nutrients and the host where energyis effectively extracted [66]. In healthy individuals, indigestible carbohydrates and proteins that enter thecolon represent between 10% and 30% of total ingested energy and were digested by colonicmicrobiota[66, 67]. Meanwhile, it could be expected to contribute anywhere from 6% to 22% of dailycaloric turnover[68]. A large remove of colonic microbiota can bring down the metabolic rate and loss ofthe “metabolic buffering” function of the gut microbiota, leading to abrogation of CR-mediated bodyweight loss [69]. Proteobacteria and Actinobacteria were abundant in liver injury animals[70].Bacteroidetes are among the major members of the microbiota of animals, which are increasinglyregarded as specialists for the degradation of high molecular weight organic matter, proteins andcarbohydrates [71]. Some Lactobacilli possessing lipolytic activities produce signi�cant amounts of fattyacids with antimicrobial potential under speci�c conditions[72, 73]. Hence, the effect of antibiotics on theintestinal �ora structure and quantity may change the produces and releases an enormous array ofcompounds which may further act upon host tissues modulating appetite, gut motility, energy uptake andstorage, and energy expenditure.
2.5 Antibiotic treatment enhanced lipid and amino acid metabolism pathways of gut microbiomeassociated with obesity
Compared with the control group, 794 differential metabolites were screened in the antibiotic groups, ofwhich 235 metabolites were signi�cantly downregulated (P < 0.05), and 559 metabolites weresigni�cantly upregulated (P < 0.05) (Supplemental �gure). According to the material information,signi�cant differences have been observed in the top 10 pathways of different metabolites using theKEGG (P < 0.05) (Figure 4C). The top 5 as regards impact are tryptophan metabolism, ABC transporters,aminoacyl-tRNA biosynthesis, vitamin digestion and absorption, protein digestion and absorption andthose linked to the immune system. Some unique metabolites, 7 amino acids (D L-(-)-Threonine, L-Phenylalanine, DL-Lysine, L-Isoleucine, Valine, Amidinoproline and Hydroxylysine), 3 steroids (tyraminesulfate and 3-(2-Acetamidoethyl)-1H-indol-5-yl hydrogen sulfate), 3 hormones (adrenaline, hexoprenalineand kinetin) and some metabolites, including 5-Hydroxy-DL-tryptophan, Fructoselysine, N6-Capryloyllysine, dihydroxyphenylalanine, indole, Dimethyl 22'-azobis(2-methylpropionate), threonylphenylalanine,carbobenzoxyglycylphenylalanine, 2-methylhippuric Acid and methylhippuric acid overlapped among 5groups (p < 0.05). Most of amino acids were increased in the antibiotic groups, including DL-(-)-Threonine(57.7%-141.0%), L-Phenylalanine (264.3%-149.1%), 5-Hydroxy-DL-tryptophan (196.8%-269.7%),Fructoselysine (250.3%-519.7%), DL-Lysine (49.8%-187.9%), L-Isoleucine (24.3%-64.7%). Most of themincreased in the 400 group, but came close to the control group which were treated with 800 mg/kg(Figure 6).

Page 8/31
In serum metabolism, the differential metabolites were screened using hierarchical cluster analysis(Supplemental �gure 5). The KEGG enrichment analysis of the differential metabolites showed that thein�uence was related to the biosynthesis of unsaturated fatty acids, glycerophospholipid metabolism,retinol metabolism pathways and choline. Moreover, products including 1-arachidonoyl-sn-glycero-3-phosphocholine, 19-hydroxycholest-5-en-3-yl acetate, Vitamin A, were signi�cantly decreased in the 400group (Figure 7). The lipidomic further veri�ed the effects of antibiotics in lipid metabolism. The keymetabolism productions of these pathways, such as Lipolysis, TAG and cholecalciferol (Vitamin D) werechanged in antibiotic group, especially in 400 group. Speci�c metabolites related to lipid metabolismincreased when antibiotic intervention, including palmitoylcarnitine and octyl phosphate. The insulinresistance pathway was also regulated by antibiotic intervention (Supplemental Figure 6). Besides,antibiotics induced a lower fasting blood glucose level compared to that in the control group with a 16-hfast blood glucose level. However, there is a signi�cant difference was found between fasting and fedglucose in 200 and 400 groups an hour after eating (Figure 7E, F).
The microorganisms in the gastrointestinal tract play a signi�cant role in nutrient uptake, vitaminsynthesis, energy harvest, in�ammatory modulation, and host immune response [74]. For example, theweight gain occurs even when energy intake decreasd by 30% compared to common mice whichremained germ-free [75]. Dysregulated fatty acid and amino acid metabolism are reported in adults withtype 2 diabetes [76]. Hydroxytryptophan can help the body balance on weight, which is at a low level inobesity [77, 78]. Diabetic rats increased the content of phenylalanine (65.6%), valine (29.8%), methionine(29.6%) and aspartic acid (44.6%), but tyrosine (48.6%), alanine (16.8%), lysine (13.2%), threonine (41.4%)and histidine (19.1%) content were reduced, which is similar with our research [79]. Tryptophan /kynurenine which could confer bene�ts of feed utilization, body composition and antioxidative capacity,showed an upward trend (26.6%) in weight in 200 group. However, it began to decrease (64.4%) when theconcentration of AMX+PMX reached 400 mg/kg [80]. It showed that amino acid levels with a signi�cantchange in body adiposity, which may be due to increased utilization of host or decreased production ofamino acids by bacteria [81]. Meanwhile, some metabolites associated with the digestion and absorptionof nutrients have similar response with obesity. Lysolecithin could confer bene�ts of feed utilization, bodycomposition and antioxidative capacity of the channel [80]. Oxalosuccinic acid and phosphatidylcholinewere reduced in serum levels of diabetes [82]. Decreased levels of 2-methylhippuric Acid andmethylhippuric acid have also been related to obesity [83]. Acetyl-L-carnitine, as a long-chain fatty acidderivative, reversed the inhibition mediated by carnitine to slow the transport of fatty acids into themitochondrial matrix where they are used for energy production [84].
Another feature of the dysbiosis in the microbiota metabolism was the levels of some health-relatedhormones and purine metabolites. Uric acid and hypoxanthine, as the products of the microbialmetabolism of xanthines to alter gut microbiota in the presence of insulin resistance, showed an increase(41.7%-54.7% and 22.2%-120.0%, respectively) [85]. Adrenaline, the main effectors of the sympatheticnervous system, are thought to control adiposity and energy balance through several mechanisms.Kinetin induced mitotic divisions throughout the digestive tract. Both of them were high expressed in the400 group (241.9%, 87.5%), which is different from hexoprenaline (16.1%), which may play a role in
Page 9/31
chicken weight gain. All these �uctuated were similar with the obesity, indicating that antibiotic treatmenton gut microbiota largely abolishes the regulation of metabolism [86].
2.6 Antibiotic intervention altered the immune response of chicken
The alterations in the serum associated with immunity have been compared. In serum, phosphocholineschanged signi�cantly in the antibiotic groups (P 0.01). The results revealed an increase inphosphocholines concentration at a concentration of 200 mg/kg, returning to the lowest level at 800mg/kg concentration, and its related derivatives (lysophosphatidylcholine and 1-arachidonoyl-sn-glycero-3-phosphocholine) have also changed (Figure 7B, H). Some unsaturated fatty acids, such as 4-phenylbutyric acid, docosahexaenoic acid, elaidolinolenic acid, pinolenic acid, L-pipecolic acid andricinoleic acid, were �uctuated with the concentration of AMX+PMX, especially in the 800 group (Figure8).
The immune system restricts the overgrowth of symbiotic bacteria and prevents external bacteria fromentering the host internal organs[87]. Gut microbiota is necessary for the proper immunologicaldevelopment of the intestine and the host which is associated with proin�ammatory and host immuneresponses that are alter the growth performance, and the change trend of metabolites is conducive toweight gain [51]. As shown in germ-free animals, which have underdeveloped mucosal immunologicaltissues compared to conventional animals [88]. The kynurenine pathway is the major route for tryptophanmetabolism. The rate of Tryptophan/kynurenine is an important factor in the disease development, suchas cardiovascular, which is signi�cant increase with 400mg/kg of AMX+PMX (27.5%). Meanwhile,oxidative stress and immune activation as in�ammation factors, showing that after antibioticintervention, the immune response of chicken was inhibited. The changes in lipid metabolome found heredisplay dissimilarities to some other systems involving viral infection and in�ammation. For example,lysophosphocholines as a factor in immunoregulation, originate primarily in the liver and are releasedfrom larger lipids [89]. Betaine protects cells, proteins, and enzymes from environmental stress, whichparticipates in the methionine cycle and is an important nutrient for the prevention of chronic diseases[90]. Sphingosine and sphinganine N-acyltransferase plays an important role in the pathogenesis ofanimal diseases showed no signi�cant difference in treatment groups and control group (Figure 8B-D)[91].
Signi�cant amounts of fatty acids with antimicrobial potential under speci�c conditions were produced[72, 73]. For example, 4-phenylbutyric acid can suppress oxidative stress by attenuating endoplasmicreticulum stress to provide renoprotection [92]. Docosahexaenoic acid is a long-chain polyunsaturatedfatty acid that worked as a ligand for the retinoid X receptor in brain [93]. Pinolenic acid, a naturally-occurring polyunsaturated fatty acid, inhibited cell metastasis by suppressing cell invasiveness andmotility [94]. L-pipecolic acid was accumulated by Escherichia coli cells and protected them whilegrowing at inhibitory osmolarity, which is able to bind the periplasmic protein, while this protein wasnecessary for their uptake [95]. Ricinoleic acid is the compound of antineoplastic and immunomodulatorycharacteristics [96]. With the increase of antibiotics, the content of all these unsaturated fatty acids
Page 10/31
showed a downward trend, which is coincident with the decrease of acidogenic bacteria (Lactobacilli etal), as shown in obesity [97]. Antibiotics restrain gut microbiota, resulting in reduced selective pressure onthe host’s immune system, thus leading to the excessive growth of chickens[87]. Therefore, in the presentstudy, the weight alteration might be due to the changes in the intestinal community and impaired hostimmunity.
Childhood adiposity has increased signi�cantly over the past several decades, which has become a majorchallenge to public health worldwide[98]. An obvious relationship was found between antibiotic exposurein early life with a 6% increment in the risk of obesity[46]. The growth of broiler growth with the earlyintervention of antibiotics is the combination of the following three effects here (suppressing the growthof gut bacteria, inhibiting host immune response and regulation the metabolic pathway of intestinal�ora): (i) suppressing the growth of indigenous gut bacteria and reducing its energy consumption, whichresults in more nutrients for chicken for greater weight gain [99], (ii) inhibiting the health-bene�cial effectof the gut microbiota and host immune response by reducing the content of immunoglobulin andin�ammation related factors [100, 101], and (iii) regulation of the metabolic pathway of intestinal �oraincluding lipid , amino acid metabolism and immunity [25]. The intestinal �ora is likely to have asigni�cant impact on host physiological processes with early intervention of antibiotics, which may besimilar to the factors of early childhood obesity, and it can provide a theoretical reference for the earlyobesity exploration of humans.
3. Conclusion:Antibiotics as feed additive in the poultry industry play a key role by mediating gut microbiota in calorieabsorption. The maturation of intestinal microbiota was signi�cantly retarded and eventually delayed bydifferent concentrations of antibiotics, with a high level of growth performance and low level of immunityresponse. Meanwhile, the bene�cial factors produced by gut microbiota are relatively less, showing that amoderate mature gut microbiota is more inclined to increase the weight of chickens. Gut microbiota hasbeen suggested to serve as a target in the prevention and treatment of metabolic disorders.
4. Materials And Methods
4.1 Animal experiment designThe white-feather broilers were purchased from a poultry farm in Yuzhong County, Lanzhou. A total of 84broilers (1 day old) with similar weight and healthy feathers were randomly split into 7 groups (6 chickensper cage). The polymyxin and amoxicillin (0, 20, 50, 100, 200, 400, 800 mg/kg) were selected according tothe pretreatment experiment (Supplementary �le 1). The standard chicken feed was bought fromZhengda Co., LTD (Lanzhou, China). For the experimental procedures, six chickens in a cage housed at22°C ± 1°C and 60–75% relative humidity. The care and use of laboratory animals in our study wasapproved by Lanzhou University Animal Ethics Committee, and all the relevant ethical regulations havebeen followed. All broiler chickens in each group were weighed individually at each week during the full
Page 11/31
trial. The feed consumed for one group was monitored on a day basis. During the 35nd day of treatment,all chickens in each group were moved into a clean and empty cage every 7 days for an hour, and fecalsamples were collected. Blood was collected from the vein and was left undisturbed for 30 min. Thecollected blood samples were centrifuged at 4,000 rpm for 20 minutes to get the serum. Later on, thechicken was anesthetized by water �ooding. Also, liver, adipose and intestine samples were gathered forall the respective groups. The collected samples were washed with saline, and were then collected in pre-weighted tubes with 1 mL phosphate buffer saline (PBS) diluent and were stored at − 20°C for future use.All samples were preserved at − 80°C until analysis, except those used for histopathology, which werestored in 4% paraformaldehyde.
4.2 Tissue collection and biomarker measurementsThe liver and adipose tissue were rinsed with PBS with a volume of 0.8cm×0.8cm. Samples were �xedwith 4% paraformaldehyde solution at room temperature for more than 1 day. Later, the samples weresent to Huapu Biotechnology Co., Ltd. (Lanzhou) for immunohistochemistry analysis. Intestinal content(15 ml) was collected and mixed with an equal volume of PBS (pH 7.14) and was centrifuged at 800 g for15 min. The supernatant was used for SIgA (ELISA). Serum total IgG was detected using enzyme-linkedimmunosorbent assay (ELISA). Their concentrations were then calculated from the standard curves. Thethymus gland (on the right side), bursal and spleen tissues were collected simultaneously and weighedfor each chicken. The immune organ index (g/100 g) was calculated for each of the organs as WO/WB ×100, with WO being weight of the immune organ and WB weight of the chicken [40].
To determine the effects of antibiotics on the oxidative stress system, fresh liver and blood were taken onthe 35nd day. At �rst, liver samples were grinded using a handheld grinder (Jingxin, Shanghai, China) onice. The suspension of samples was obtained with low-speed centrifugation (8000 rpm, 10 min). Thelevels of the total protein, malondialdehyde (MDA), catalase (CAT), and total superoxide dismutase (T-SOD) in serum samples and the ALT and AST levels in livers were all detected using commercial kits(Jiancheng, Nanjing, China) according to the protocols provided and the results were calculatedaccording to the curve of different indexes [102].
4.3 DNA extraction and qPCRIn each group, fecal samples were randomly collected from the different group chicks with six copies onday 1, day 9, day 16, and day 23 respectively. After that, fecal samples were collected aseptically andstored quickly on ice, then transferred to − 80°C. The DNA from feces and colon content samples wereextracted according to the manufacturer’s instruction using TIANamp Stool DNA Kit (Tiangen, China). Toquantify the total bacteria in the samples, primers tot-F and tot-R (F-tot: GCAGGCCTAACACATGCAAGTC;R-tot: CTGCTGCCTCCCGTAGGAGT) were used to amplify the 16S rDNA [103]. qPCR was run on a Bio-RAD CFX96 (USA). It was performed in a total volume of 10 µL using SYBR Premix Ex Taq II (Takara) onreal-time quanti�cation PCR instrument (Bio-RAD CFX96, USA). All measurements were in triplicates.Standard curves were constructed using PCR product of the 16S rRNA gene of E. coli. The obtained PCRproducts were cloned into T vector (Takara, Dalian, China) and were transferred into DH-5α, which was

Page 12/31
then incubated at 37oC for 6 h (100–140rpm) using Plasmid Mini Kit I (E.Z.N.A., Omega, USA) as thestandard sample. The recombinant plasmids were used for qPCR, with 103, 104, 105, 106, 107, 108, 109,and 1010 copies of the plasmids per reaction, which were used for calibration. The target copy numbers(T) were estimated by the equation: T = (D/(PL × 660)) × 6.022 × 1,023,133, where D (g/l) and PL (inbasepairs) were the plasmid DNA concentration and length, respectively. Each standard curve was generatedfrom at least �ve tenfold plasmid dilutions in triplicate. The content of the whole bacterial community indifferent samples were calculated based on the standard curve [104, 105].
4.4 16S rRNA gene sequencing analysisDNA extraction from the 35nd broiler fecal samples were examined using 1% agarose gel electrophoresis.All samples were quanti�ed on a Qubit 2.0 Fluorometer (Thermo Fisher Scienti�c, USA). Then, the V3-V4hypervariable region of the 16S rRNA gene was ampli�ed using PCR, which used 338F forward primer (5’-ACTCCTACGGGAGGCAGCA-3’) and the 806R reverse primer (5’- GGACTACHVGGGTWTCTAAT-3’). The PCRcycle was denatured at 94 oC for 3min (1 cycle); followed by 94oC for 45 s, annealed at 50oC for 60 s, andextended at 72oC for 90 s (25 cycles), with the �nal extension step of 72oC for 10 min. The ampliconproducts were puri�ed using AMPure XP beads (Beckman Coulter, USA). Sequencing libraries weregenerated using the TruSeq® DNA PCR-Free Sample Preparation Kit (Illumina, USA) following themanufacturer’s recommendations. Then library quality was assessed using the Agilent Bioanalyzer 2100system (Agilent Technologies, USA). The quality libraries were �nally sequenced on an Illumina HiSeq2500 platform with 250 bp of paired-end reads. Sequencing libraries were generated using the TruSeq®DNA PCR-Free Sample Preparation Kit (Illumina, USA) following the manufacturer’s recommendations.Then library quality was assessed using the Agilent Bioanalyzer 2100 system (Agilent Technologies,USA). The quality libraries were �nally sequenced using an Illumina HiSeq 2500 platform with 250 bp ofpaired-end reads [106].
The raw paired-end reads were overlapped and merged to get raw tags (SUB9686300) using the FLASHsoftware (v1.2.7) [107]. Trimmomatic (v0.33) is utilized to �lter low-quality raw tags and to keep high-quality clean tags. Moreover, clean tags were imported into the software package Quantitative InsightsInto Microbial Ecology 2 (QIIME2 version 2018-8) [108, 109]. Taxonomy was assigned using the 99%identity SILVA (release 132) V3-V4 classi�er. All the ribosomal sequence variants (RSVs) were identi�edas unique features across all samples without clustering. The feature table, rooted phylogenetic tree,representative sequences and metadata from QIIME2 were then exported for further analysis in R(V3.3.1). R package ade4 has been ordinated in explanatory matrices using principal component analysis(PCA) including infection time course as explanatory variables. Alpha and beta diversity were computedusing a rarefaction depth of sequences. Differences in bacterial alpha diversity (Shannon’s index,observed features and evenness index) between each study group were evaluated based on the rare�eddata and were tested using the Wilcox rank-sum method. Beta diversity was calculated using the Bray-Curtis distance, Jaccard distance, unweighted UniFrac distance and weighted UniFrac distance by the Rpackage VEGAN (V2.5-3), respectively [110]. Differences in beta diversity were identi�ed using analysis ofsimilarity (ANOSIM) and effect size indicated by an R-value (between − 1 and + l, with a value of 0
Page 13/31
representing the null hypothesis). Community structure difference based on beta diversity was visualizedusing nonmetric Multidimensional Scaling (NMDS) method by R package VEGAN. Resulting abundancetables were analyzed using the LefSe pipeline to �nd out representing differential bacterial taxon amongmultiple sample groups (Segata, et al., 2011). The threshold logarithmic linear discriminant analysis(LDA) score was set for biomarker detection of microbiota composition and community function. Thetool PICRUSt (Langille et al., 2013) was applied to predict potential functional changes of the microbiomeby inferring the metagenomes from 16S sequences [111].
4.5 Feces and serum samples preparation for metabonomicanalysisFecal samples were stored at − 80°C until processing. Preparation was carried out as described previouslyat Metabolon, Inc [112]. Lyophilized fecal samples were extracted at a constant per-mass basis. Tosuspend 1g feces, 1 ml of ddH2O was suspend centrifuged for 10 min with 3,000 × g, and the supernatantwas removed. Moreover, 500 µL ddH2O was added into the precipitate again, and the feces weresuspended again, and was centrifuged for 5 min with 10,000 g. The supernatant was taken andcombined. Aacetonitrile was added to the �nal concentration of 1%, while formic acid was added to the�nal concentration of 0.5%. After mixing, 13,000g was centrifuged for 15 min, the supernatant was putinto an ultra�ltration tube, 4,500g was taken, and the liquid in the tube was taken after 50 min. Then, 200µL of each liquid was evaporated to dryness by centrifugal concentrator and stored in − 80°C refrigerator.After all the samples were processed, 200 µL was added to each dry sample for dissolution and wasplaced at 4°C for 8 h. The supernatant was extracted and detected by LC-MS [113].
For metabolomics analysis, a volume of 50 mL from each serum sample was thawed at 4°C. Serumproteins were precipitated using 200 µL ice-cold methanol, which contained 9-�uorenylmethoxycarbonyl-glycine (10 µg/mL) as an internal standard. After vortexing, the mixture was centrifuged at 16,000 rpm for10 min at 4°C, and the supernatant was divided into two parts, one for liquid chromatography/massspectrometry (LC-MS) analysis. All samples were kept at 4°C and were analyzed within 48 h. In order toprevent batch effect, the assays were conducted in a random manner.
For lipidomics analysis, lipids were extracted from the serum using a modi�ed Bligh and Dyer method.Brie�y, 900 µL of chloroform-methanol, 1:2 (v/v) was added to 100 µL serum. After 20 min vortexing andincubation at 4°C, 300 µL of chloroform and 300 µL of ddH2O were added to the mixture and werecentrifuged at 9,000 rpm, 4°C for 2 min. Lipids were then recovered from the lower organic phase aftercentrifugation. Subsequently, 500 µL of chloroform was added and was vortexed at 4°C for 20 min. Aftercentrifugation, lipids were recovered from the organic phase and were combined with the previousfraction. The lipid extracts were vacuum-dried, stored at − 80°C and analyzed within a week [114].
4.6 Metabolomics analysis by LC-MSThe supernatant fraction from the sample preparation step was analyzed using liquid chromatograpy-tandem mass spectrometry (LC-MS/MS) analysis on a Thermo Scienti�c Dionex UltiMate 3,000 ultrahigh
Page 14/31
pressure liquid chromatography system (Thermo�sher, USA) equipped with a Thermo Orbitrap FusionLumos mass spectrometer detector managed using a Thermo Xcalibur workstation. The column used forthe separation was a Thermo Scienti�c™ Hypersil GOLD™ C18 (2.1mm, 1.9 um; Thermo Scienti�c™; USA).The oven temperature was set at 35°C. The gradient elution involved a mobile phase consisting of 0.1%formic acid in water and methanol. The initial condition was set at 2% B. A linear gradient for 30 min wasapplied to 30% B, followed by 8 min gradient to 60% B and then by a 2min gradient to 100% and held 5min. then returned to starting conditions over 1 min. Flow rate was set at 0.3 ml/min, and 8 uL of sampleswas injected. The electrospray ionization mass spectra were acquired in positive ion mode. Mass datawere collected between 100 and 1,000 m/z at a rate of two scans per second. The ion spray voltage wasset at 3,500 V, the ion transfer tube temperature was maintained at 320°C, and the vaporize temperature is400°C. The instrument method consisted of one full MS scan from 100–1000 m/z with orbitrap detector,the detector resolution is 120,000 and the maximun injection time is 50 ms. The sheath gas and aux gas�ow rates were 40 Arb and 50 Arb, respectively. The MS2 scan range mode is Auto : m/z Normal withOrbitrap detector, �rst mass is 50m/z; and the resolution is 15000.
The stability of the LC-MS method was examined and evaluated using a subset of peaks covering a rangeof masses, intensities, and retention times across the QC samples. The original total ion current (TIC)chromatogram of the quality control samples was observed, the retention time reproducibility of thepreliminary analysis instrument and the number of peaks measured were analyzed, and the detectionsituation of the compounds was judged. The reproducibility of the internal standard for quality control ofdata was analyzed by using a blank sample, one-dimensional PCA diagram of QC sample, and acorrelation of QC sample, which showed that the system was stable [114, 115].
4.7 Data analysisAll data were recorded using the Xcalibur software and were exported as a raw format for furtheranalysis. Mass spectra were digitally analyzed using the Compounds discoverer 3.2 (Thermo Fisher Ltd,USA). The statistical calculation was performed using the maximum intensity of the metabolite ionpeaks. The date was combined into a single matrix by aligning peaks with the same mass-retention timepaired together from each date �le in the data set. The intensities for each peak were normalized to thesum of the peak intensity for each data set [116]. To support the metabolite identi�cation, the followingdatabases have been used: KEGG (http://www.kegg.com/), LipidMAPS database(http://www.lipidmaps.org/data/strycture/), PubChem compound database (http://ncbi.nim.nih.gov/)and the human metabolite data base (http://www.hmdb.ca/) [117].
4.8 Compound identi�cation and pathways analysisThe original data were analyzed by R Software (V3.5.1), including PCA of unsupervised pattern andorthogonal partial least squares discriminant analysis (OPLS-DA) of supervised pattern, respectively. Theinterpretation rate of experimental interventions (principal components) or models was obtained, and themodeling effect of antibiotics exposure in chicken was evaluated. Compared with PCA, OPLS-DA can usethe classi�cation information of samples for modeling, so as to enlarge the differences between groups,
Page 15/31
eliminate the variables irrelevant to classi�cation, reduce noise interference, highlight important variables,and facilitate the identi�cation of marker metabolites. The PLS loading plot was used to identifymetabolites with major in�uence on the group membership. All the compounds detected in the all groupswere screened using the KEGG database, and the screening criteria were set to meet the following threeconditions: (1) the contribution value of different metabolites to this group was greater than 1; (2) thesimilarity with the corresponding substances in KEGG database was greater than 1; (3) a signi�cantdifference in the content of metabolites was found between the night light exposure group and the controlgroup (P < 0.05). The selected differential metabolites were introduced into analyst(https://www.metaboanalyst.ca.). The path analysis module in the software automatically generatesmetabolic pathway map after matching with the name of metabolite in the KEGG database[117, 118].
4.9 Co-occurrence network analysisThe R package was used for calculating the Poisson correlation coe�cient of metabolites andcommunity. If P < 0.05 and the absolute value of correlation coe�cient > 0.4, it is considered that there iscorrelation. The correlation relationship after �ltering was obtained, and r-packet iGraph was used to plot.In each group, 16S amplicon sequencing and metabolomic data on day 35 was �rst pooled together tocreate the global network patterns, and then separately analyzed to illustrate the change of networkdensity and network centralization.
4.10 Statistical analysisStatistical analysis was performed using the SPSS 17.0 software. A P-value of < 0.05 was regarded as asigni�cant difference criterion. Duncan’s multiple range tests for statistical differences at a con�dencelevel of 95% (p < 0.05) was applied. Graph-pad Prism 8.0 and Origin 8.0 were used as graphics-renderingsoftware.
AbbreviationsADG Average daily gain
ANOSIM Analysis of similarity
LDA Linear discriminant analysis
NMDS Nonmetric multidimensional scaling
PBS Phosphate buffer saline
PCA Principal component analysis
PCoA Principal coordinate analysis
RSV Ribosomal sequence variants

Page 16/31
TIC Total ion current
DeclarationsAcknowledgment
We thank all participants of the study and the Central Lab of School of Life Sciences, Lanzhou Universityfor providing all necessary equipment.
Availability of data and materials
Sequence data used in the study is available at National Center for Biotechnology Information Searchdatabase (SUB9686300).
Authors’ contributions
Ying Wu designed the experiment, analyzed the data and wrote the manuscript. Liang Peng guided thebioinformatic analyses and data curation. Rong Han, Pengya Feng and Aman Khan provided advice andreview this manuscript. Pu Liu and Xiangkai Li provided advice, supervision and revised this manuscript.All authors read and approved the �nal manuscript.
Funding
The work was supported by Gansu Province Major Science and Technology Project (Grant No:17ZD2WA017), National Natural Science Foundation of China (Grant No: 31870082) and FundamentalResearch Funds for the Central Universities (Grant No: lzujbky-2020-83).
Ethics approval and consent to participate
Not applicable.
Consent for publication
Not applicable.
Competing interests
The authors declare that they have no known competing financial interests or personal relationships thatcould have appeared to influence the work reported in this paper. Author declare no con�ict of interest.
Author details
1Gansu Key Laboratory of Biomonitoring and Bioremediation for Environmental Pollution, School of LifeSciences, Lanzhou University, Lanzhou, China.
Page 17/31
2Ministry of Education Key Laboratory of Cell Activities and Stress Adaptations, School of Life Science,Lanzhou University, Lanzhou, China.
References1. Mana� M. Comparison Study of a Natural Non-Antibiotic Growth Promoter and a Commercial
Probiotic on Growth Performance, Immune Response and Biochemical Parameters of Broiler Chicks.Journal of Poultry Science 2015;52:S27.
2. Pagel SW, Gautier P. Use of antimicrobial agents in livestock. Revue Scienti�que Et Technique2012;31:145.
3. Tiseo K, Huber L, Gilbert M, Robinson TP, Boeckel TPV. Global Trends in Antimicrobial Use in FoodAnimals from 2017 to 2030. Antibiotics 2020;9:918.
4. Reducing antimicrobial use in food animals. Science 2017;357:1350-2.
5. Bai Y, Xu R, Wang QP, Zhang YR, Yang ZH. Sludge anaerobic digestion with high concentrations oftetracyclines and sulfonamides: Dynamics of microbial communities and change of antibioticresistance genes. Bioresource technology 2019;276:51-9.
�. Su S, Zhang M, Li B, Zhang H, Dong X. HPLC determination of sulfamethazine in milk using surface-imprinted silica synthesized with iniferter technique. Talanta 2008;76:1141-6.
7. Cho I, Yamanishi S, Cox L, Methé BA, Zavadil J, Li K, et al. Antibiotics in early life alter the murinecolonic microbiome and adiposity. Nature.
�. Ozawa E. Studies on growth promotion by antibiotics. I. Effects of chlortetracycline on growth.Journal of Antibiotics 1955;8:205.
9. Mana� M, Hedayati M, Pirany N, Akwu OA. Comparison of performance and feed digestibility of thenon-antibiotic feed supplement (Novacid) and an antibiotic growth promoter in broiler chickens.Poultry Science 2018.
10. Feighner SD, Dashkevicz MP. Subtherapeutic levels of antibiotics in poultry feeds and their effects onweight gain, feed e�ciency, and bacterial cholytaurine hydrolase activity. Appl. Environ. Microbiol.,53, 331-6. Applied & Environmental Microbiology 1987;53:331-6.
11. Maron DF, Smith TJ, Nachman KE. Restrictions on antimicrobial use in food animal production: aninternational regulatory and economic survey. Globalization and Health 2013;9.
12. Lhermie G, Tauer LW, Grhn YT. The farm cost of decreasing antimicrobial use in dairy production.PLoS ONE 2018;13:e0194832.
13. Martínez-Carballo E, González-Barreiro C, Scharf S, Gans O. Environmental monitoring study ofselected veterinary antibiotics in animal manure and soils in Austria. Environmental Pollution2007;148:570-9.
14. Wong CB, Odamaki T, Xiao J-z. Bene�cial effects of Bi�dobacterium longum subsp. longum BB536on human health: Modulation of gut microbiome as the principal action. Journal of functional foods2019;54:506-19.

Page 18/31
15. Yamanaka M, Nomura T, Kametaka M. Role of intestinal microbes in body composition in germ-free,gnotobiotic and conventional mice. Journal of Nutritional Science & Vitaminology 1977;23:211.
1�. Mahana D, Trent CM, Kurtz ZD, Bokulich NA, Battaglia T, Chung J, et al. Antibiotic perturbation of themurine gut microbiome enhances the adiposity, insulin resistance, and liver disease associated withhigh-fat diet. Genome Medicine 2016;8:48.
17. Hedde RD, Lindsey TO. Virginiamycin: a nutritional tool for swine production. Agri-Practice (USA)1986;7:70-2.
1�. Saunders DR, Sillery J. Effect of lactate and H+ on structure and function of rat intestine.Implications for the pathogensis of fermentative diarrhea. Digdissci 1982;27:33-41.
19. Pirofski LA, Casadevall A. The Damage-Response Framework of Microbial Pathogenesis andInfectious Diseases. Advances in Experimental Medicine & Biology 2008;635:135-46.
20. Bremener SM, Alferova VA, Zgurskaja GN, Zubkova EI, Pipko AS, Rogova KP. Changes in themetabolism of vitamins B6 and B12, nicotinic acid, pantothenic acid and vitamin C in patients withchronic colitis of different causes and treated with tetracycline. Antibiotiki 1967.
21. Selwyn FP, Csanaky IL, Zhang Y, Klaassen CD. Importance of Large Intestine in Regulating Bile Acidsand GLP-1 in Germ-free Mice. Drug metabolism and disposition: the biological fate of chemicals2015;43:1544.
22. Theriot CM, Koenigsknecht MJ, Carlson Jr PE, Hatton GE, Nelson AM, Li B, et al. Antibiotic-inducedshifts in the mouse gut microbiome and metabolome increase susceptibility to Clostridium di�cileinfection. Nature communications 2014;5:3114.
23. Natividad JM, Allison A, Julien P, Bruno L, Charlotte JA, Rebeca M, et al. Impaired Aryl HydrocarbonReceptor Ligand Production by the Gut Microbiota Is a Key Factor in Metabolic Syndrome. CellMetabolism 2018;28:S1550413118304443-.
24. Choi HK, Atkinson K, Karlson EW, Willett W, Curhan G. Purine-rich foods, dairy and protein intake, andthe risk of gout in men. 2004;350:1093-103.
25. Zarrinpar A, Chaix A, Xu ZZ, Chang MW, Marotz CA, Saghatelian A, et al. Antibiotic-inducedmicrobiome depletion alters metabolic homeostasis by affecting gut signaling and colonicmetabolism. Nature communications 2018;9:2872.
2�. Pérez-Cobas AE, Gosalbes MJ, Friedrichs A, Knecht H, Artacho A, Eismann K, et al. Gut microbiotadisturbance during antibiotic therapy: a multi-omic approach. Gut Microbes 2013;5:64-70.
27. Morgun A, Dzutsev A, Dong X, Greer RL, Sexton DJ, Ravel J, et al. Uncovering effects of antibiotics onthe host and microbiota using transkingdom gene networks. Gut 2015:1732-43.
2�. Yerevanian A, Soukas AA. Metformin: Mechanisms in Human Obesity and Weight Loss. CurrentObesity Reports 2019.
29. Kelly CJ, Colgan SP, Frank DN. Of microbes and meals: the health consequences of dietaryendotoxemia. Nutrition in Clinical Practice 2012;27:215-25.
Page 19/31
30. Vrieze A, Out C, Fuentes S, Jonker L, Reuling I, Kootte RS, et al. Impact of oral vancomycin on gutmicrobiota, bile acid metabolism, and insulin sensitivity. Journal of Hepatology 2014.
31. Hu X, Wang T, Liang S, Li W, Wu X, Jin F. Antibiotic-induced imbalances in gut microbiota aggravatescholesterol accumulation and liver injuries in rats fed a high-cholesterol diet. AppliedMicrobiology&Biotechnology 2015.
32. Pupavac S, Trifunovic´ M, Sinovec Z. Use of antibiotics and probiotics for stimulative purposes in pigdiet. Veterinarski Glasnik 2000.
33. Pelicano E, Souza P, Souza H, Figueiredo D, Boiago M, Carvalho S, et al. Intestinal mucosadevelopment in broiler chickens fed natural growth promoters. Revista Brasileira De Ciência Avícola2005;7:221-9.
34. Shuo W, Meiqin H, Xue Y, Jingyu Z, Lanlan C, Lin W, et al. Gut microbiota mediates the anti-obesityeffect of calorie restriction in mice. Scienti�c Reports 2018;8:13037-.
35. Zhu YG, Johnson TA, Su JQ, Qiao M, Guo GX, Stedtfeld RD, et al. Diverse and abundant antibioticresistance genes in Chinese swine farms. Pnas 2013;110:3435-40.
3�. Roth FX, Gotterbarm GG, Windisch W, Kirchgessner M. Whole-body protein turnover and nitrogenbalance in growing pigs supplied with an antibiotic feed additive (Avilamycin). Journal of AnimalPhysiology & Animal Nutrition 2010;82:88-93.
37. Le T, Sun Q, Xie Y, Shu L, Cao X. A Highly Sensitive Aptasensor for Sulfamethazine Detection Usingan Enzyme-Linked Aptamer Assay. Food Analytical Methods 2018;11.
3�. Broom, Leon J. The sub-inhibitory theory for antibiotic growth promoters. Poult 2017.
39. Barton MD. Antibiotic use in animal feed and its impact on human healt. Nutrition research reviews2000;13:279-99.
40. Gao P, Ma C, Sun Z, Wang L, Huang S, Su X, et al. Feed-additive probiotics accelerate yet antibioticsdelay intestinal microbiota maturation in broiler chicken. Microbiome 2017;5:91.
41. Reda RM, Ibrahim RE, Ahmed E, El-Bouhy ZM. Effect of oxytetracycline and �orfenicol as growthpromoters on the health status of cultured Oreochromis niloticus. Egyptian Journal of AquaticResearch 2013;39:241–8.
42. Jukes HG, Hill DC, Branion HD. Effect of Feeding Antibiotics on the Intestinal Tract of the Chick.Poultry Science 1956;35:716-23.
43. Rouf MA, Das AK, Mitu NL, Shahriar M, Mitu L. Evaluation of hepatoprotective effects ofarogyavardhini against D-galactosamine-induced hepatotoxicity in rats. Journal of Pharmacognosyand Phytochemistry 2021;10:12-9.
44. Brandtzaeg P. Role of secretory antibodies in the defence against infections. International Journal ofMedical Microbiology 2003;293:3-15.
45. Altintas MM, Azad A, Nayer B, Contreras G, Nayer A. Mast cells, macrophages, and crown-likestructures distinguish subcutaneous from visceral fat in mice. Journal of Lipid Research 2011;52.
Page 20/31
4�. Shao X, Ding X, Wang B, Ling L, An X, Yao Q, et al. Antibiotic Exposure in Early Life Increases Risk ofChildhood Obesity: A Systematic Review and Meta-Analysis. Frontiers in Endocrinology 2017;8:170-.
47. Smit LAM, Femke SDB, Opstal-Van WAWJ, Mari?Tte H, Johan B, Wouters IM, et al. Q Fever andPneumonia in an Area with a High Livestock Density: A Large Population-Based Study. Plos One2012;7.
4�. Pascal, Pierre, and, Agnes, Langendries, and, et al. Cholera toxin neutralization: a comparison ofpuri�ed serum IgG and biliary secretory IgA antibodies - ScienceDirect. Immunology Letters1988;18:51-5.
49. Siwicki AK, Anderson DP, Dixon OW. Comparisons of nonspeci�c and speci�c immunomodulation byoxolinic acid, oxytetracycline and levamisole in salmonids. Veterinary Immunology &Immunopathology 1989;23:195-200.
50. Lin J, Hunkapiller AA, Layton AC, Chang YJ, Robbins KR. Response of intestinal microbiota toantibiotic growth promoters in chickens. Foodborne Pathogens & Disease 2013;10:331-7.
51. Niewold TA. The nonantibiotic anti-in�ammatory effect of antimicrobial growth promoters, the realmode of action? A hypothesis. Poultry Science 2007;86:605.
52. Delzenne, Nathalie M, Neyrinck, Audrey M, Bäckhed, Fredrik, et al. Targeting gut microbiota in obesity:effects of prebiotics and probiotics. Nature Reviews Endocrinology 2011.
53. Shinji, Fukuda, Hidehiro, Toh, Todd, D., et al. Acetate-producing bi�dobacteria protect the host fromenteropathogenic infection via carbohydrate transporters. Gut Microbes 2012;3:449-54.
54. Jiangrang, Lu, Umelaalim, Idris, Barry, Harmon, et al. Diversity and Succession of the IntestinalBacterial Community of the Maturing Broiler Chicken. Applied and Environmental Microbiology2003;69:6816-24.
55. Kogut MH. The gut microbiota and host innate immunity: Regulators of host metabolism andmetabolic diseases in poultry? Journal of Applied Poultry Research 2013;22:637-46.
5�. Chow J, Mazmanian SK. A Pathobiont of the Microbiota Balances Host Colonization and IntestinalIn�ammation. Cell host & microbe 2010;7:265-76.
57. Kau AL AP, Gri�n NW, Goodman AL, Gordon JI. Human nutrition, the gut microbiome and theimmune system. Nature 2011;474:327-36.
5�. Ley RE, Backhed F, Turnbaugh P, Lozupone CA, Knight RD, Gordon JI. Obesity alters gut microbialecology. Proceedings of the National Academy of Sciences of the United States of America2005;102:11070-5.
59. Reiner J, Duc Son L, Turnbaugh PJ, Cathy T, Clifton B, Gordon JI, et al. Energy-balance studies revealassociations between gut microbes, caloric load, and nutrient absorption in humans. The Americanjournal of clinical nutrition 2018;2011 94 1 :58-65 .
�0. Fujisaka S, Ussar S, Clish C, Devkota S, Kahn CR. Antibiotic effects on gut microbiota andmetabolism are host dependent. Journal of Clinical Investigation 2016;126:4430.

Page 21/31
�1. Larsen N, Vogensen FK, Van dB, Frans W. J., Nielsen DS, Andreasen AS, Pedersen BK, et al. GutMicrobiota in Human Adults with Type 2 Diabetes Differs from Non-Diabetic Adults. Plos One2010;5:e9085.
�2. Guan M, Xie L, Diao C, Wang N, Hu W, Zheng Y, et al. Systemic Perturbations of Key Metabolites inDiabetic Rats During the Evolution of Diabetes Studied by Urine Metabonomics. Plos One2013;8:132-.
�3. La-Ongkhum O, Pungsungvorn N, Amornthewaphat N, Nitisinprasert S. Effect of the antibioticavilamycin on the structure of the microbial community in the jejunal intestinal tract of broilerchickens. Poultry Science 2011;90:1532-8.
�4. Luthold RV, Fernandes GR, Moraes A, Folchetti L, Ferreira S. Gut microbiota interactions with theimmunomodulatory role of vitamin D in normal individuals. Metabolism: clinical and experimental2017;69:76-86.
�5. Venema K. Role of gut microbiota in the control of energy and carbohydrate metabolism. CurrentOpinion in Clinical Nutrition & Metabolic Care 2010;13:432-8.
��. Krajmalnik-Brown, R., Ilhan, Z.-E., Kang, D.-W., et al. Effects of Gut Microbes on Nutrient Absorptionand Energy Regulation. NUTRITION IN CLINICAL PRACTICE 2012.
�7. Bergman EN. Energy contributions of volatile fatty acids from the gastrointestinal tract in variousspecies. Physiological Reviews 1990;70:567-90.
��. Riedl RA, Atkinson SN, Burnett C, Grobe JL, Kirby JR. The Gut Microbiome, Energy Homeostasis, andImplications for Hypertension. Current Hypertension Reports 2017;19:27.
�9. Lindsay EC, Metcalfe NB, Llewellyn MS. The potential role of the gut microbiota in shaping hostenergetics and metabolic rate. Journal of Animal Ecology 2020.
70. Kirpich IA, Petrosino J, Ajami N, Feng W, Wang Y, Liu Y, et al. Saturated and Unsaturated Dietary FatsDifferentially Modulate Ethanol-Induced Changes in Gut Microbiome and Metabolome in a MouseModel of Alcoholic Liver Disease. American Journal Of Pathology 2016;186:765-76.
71. Thomas F, Hehemann JH, Rebuffet E, Czjzek M, Michel G. Environmental and Gut Bacteroidetes: TheFood Connection. Frontiers in Microbiology 2011;2:93.
72. Eagle, H. Amino Acid Metabolism in Mammalian Cell Cultures. Science 1959;130:432-7.
73. Ghosh AR. Appraisal of Probiotics and Prebiotics in Gastrointestinal Infections. 2012.
74. Mohr AE, Jger R, Carpenter KC, Kerksick CM, Antonio J. The athletic gut microbiota. Journal of theInternational Society of Sports Nutrition 2020;17.
75. The gut microbiota as an environmental factor that regulates fat storage. Proceedings of theNational Academy of Sciences of the United States of America 2004.
7�. Mihalik, S. J, Michaliszyn, S. F, DeLasHeras, J., et al. Metabolomic pro�ling of fatty acid and aminoacid metabolism in youth with obesity and type 2 diabetes: Evidence for enhanced mitochondrialoxidation. Diabetes Care 2012.
Page 22/31
77. Blundell JE, Latham CJ. Sensitivity of the behavioural assay for measuring the action of drugs onfeeding: effects of tryptophan and 5-hydroxy-tryptophan [proceedings]. British Journal ofPharmacology 1979;66:482P.
7�. Hinz MC. Comprehensive pharmacologic therapy for treatment of obesity. US, 2002.
79. Liu JT, Xiao XJ, Lan YU, TabusiManaer, XinhuaNabi, University XM, et al. Effect of Xinjiang fermentedcamel milk on serum amino acid metabolism in diabetic rats. Science and Technology of FoodIndustry 2015.
�0. Liu G, Ma S, Chen F, Gao W, Zhang W, Mai K. Effects of dietary lysolecithin on growth performance,feed utilization, intestinal morphology and metabolic responses of channel cat�sh (Ictaluruspunctatus). Aquaculture Nutrition 2020;26.
�1. Gross MM, Hecker H, Frömke C, Ayerle G, Hillemanns P. Ghrelin Treatment Increases Receptor-boundLeptin in Healthy and Endotoxemic Obese Lewis Rats. Experimental & Clinical Endocrinology &Diabetes 2009;117:473-9.
�2. Oresic M, Simell S, Sysi-Aho M, Nanto-Salonen K, Seppanen-Laakso T, Parikka V, et al. Dysregulationof lipid and amino acid metabolism precedes islet autoimmunity in children who later progress totype 1 diabetes. Journal of Experimental Medicine 2008;205:2975-84.
�3. Zhao X, Fritsche J, Wang J, Chen J, Rittig K, Schmitt-Kopplin P, et al. Metabonomic �ngerprints offasting plasma and spot urine reveal human pre-diabetic metabolic traits. Metabolomics 2010;6:362-74.
�4. Regulation of the activity of caspases by L-carnitine and palmitoylcarnitine. FEBS Letters2000;478:19-25.
�5. Palau-Rodriguez M, Tulipani S, Queipo-Ortuo MI, Urpi-Sarda M, Andres-Lacueva C. Metabolomicinsights into the intricate gut microbial–host interaction in the development of obesity and type 2diabetes. Frontiers in Microbiology 2015;6.
��. Shuo, Wang, Meiqin, Huang, Xue, You, et al. Gut microbiota mediates the anti-obesity effect of calorierestriction in mice. Scienti�c Reports 2018.
�7. Hooper LV, Dan RL, Macpherson AJ. Interactions Between the Microbiota and the Immune System.Science 2012;336:1268-73.
��. Berg RD, Savage DC. Immune responses of speci�c pathogen-free and gnotobiotic mice to antigensof indigenous and nonindigenous microorganisms. Infection and Immunity 1975;11:320-9.
�9. Wikoff WR, Kalisak E, Trauger S, Manchester M, Siuzdak G. Response and recovery in the plasmametabolome tracks the acute LCMV-induced immune response. Journal of proteome research2009;8:3578-87.
90. Craig Stuart AS. Betaine in human nutrition. American Journal of Clinical Nutrition 2004:539-49.
91. Riley RT, An NH, Showker JL, Yoo HS, Norred WP, Chamberlain WJ, et al. Alteration of tissue andserum sphinganine to sphingosine ratio: an early biomarker of exposure to fumonisin-containingfeeds in pigs. Toxicology & Applied Pharmacology 1993;118:105-12.
Page 23/31
92. Luo ZF, Feng B, Mu J, Qi W, Wei Z, Guo YH, et al. Effects of 4-phenylbutyric acid on the process anddevelopment of diabetic nephropathy induced in rats by streptozotocin: Regulation of endoplasmicreticulum stress-oxidative activation. Toxicology & Applied Pharmacology 2010;246:49-57.
93. Urquiza A, Liu S, Sjoberg M, Zetterstrom RH, Gri�ths W, Sjovall J, et al. Docosahexaenoic Acid, aLigand for the Retinoid X Receptor in Mouse Brain. Science 2000;290:2140-4.
94. Chen SJ, Hsu CP, Li CW, Lu JH, Chuang LT. Pinolenic acid inhibits human breast cancer MDA-MB-231cell metastasis in vitro. Food Chemistry 2011;126:1708-15.
95. Gouesbet G, Jebbar M, Talibart R, Bernard T, Blanco C. Pipecolic acid is an osmoprotectant forEscherichia coli taken up by the general osmoporters ProU and ProP. Microbiology 1994;140 ( Pt9):2415.
9�. Witt MR, Nielsen M. Differential modulation of brain benzodiazepine receptor subtypes by ricinelaidicacid in vitro. Biochemical Pharmacology 1994;47:742.
97. Pamela M, Jerusa B, Martín G. La microbiota intestinal: Un nuevo actor en el desarrollo de laobesidad. Revista Médica De Chile 2010;138:1020-7.
9�. M., Fleming, T., Robinson, Thomson, B., et al. Global, regional, and national prevalence of overweightand obesity in children and adults during 1980–2013: a systematic analysis for the Global Burden ofDisease Study 2013. LANCET -LONDON- 2014.
99. Dibner, J., J., Richards, J., D. Antibiotic Growth Promoters in Agriculture: History and Mode of Action.Poultry Science 2005;84:634-43.
100. Kabploy K, Bunyapraphatsara N, Morales NP, Paraksa N. Effect of Antibiotic Growth Promoters onAnti-oxidative and Anti-in�ammatory Activities in Broiler Chickens. The Thai veterinary medicine2016;46:89-95.
101. Genovese K. COMPETITIVE EXCLUSION AND COLONIZATION RESISTANCE AS ALTERNATIVES TOANTIBIOTIC USE IN FOOD ANIMALS. Fish Physiology & Biochemistry 2010;36:637-45.
102. A RL, B TZ, B AK, B ZL, B MS, B PF, et al. Feed-additive of bioengineering strain with surface-displayed laccase degrades sulfadiazine in broiler manure and maintains intestinal �ora structure -ScienceDirect. Journal of Hazardous Materials 2020.
103. Matsuda K, Tsuji H, Asahara T, Matsumoto K, Takada T, Nomoto K. Establishment of an analyticalsystem for the human fecal microbiota, based on reverse transcription-quantitative PCR targeting ofmulticopy rRNA molecules. Appl Environ Microbiol 2009;75:1961-9.
104. Ornellas RMS, Santos TT, Arcucio LB, Sandes SHC, Oliveira MM, Dias CV, et al. Selection of lacticacid bacteria with probiotic potential isolated from the fermentation process of“Cupuaçu”(Theobroma grandi�orum). Advances in Microbiology, Infectious Diseases and PublicHealth: Springer, 2017:1-16.
105. A MC, a SMM-O, A EGM, B IB, a MM, A JG. Quanti�cation of total bacteria, enterobacteria andlactobacilli populations in pig digesta by real-time PCR - ScienceDirect. Veterinary Microbiology2006;114:165-70.

Page 24/31
10�. Anthony, Bolger, Marc, Lohse, Bjoern, Usadel. Trimmomatic: a �exible trimmer for Illumina sequencedata. Bioinformatics 2014.
107. Mago T, Salzberg SL. FLASH: Fast Length Adjustment of Short Reads to Improve GenomeAssemblies. Bioinformatics 2011;27:2957-63.
10�. QIIME allows analysis of high-throughput community sequencing data. Nature Methods 2010.
109. Benjamin J, Callahan, Paul J, McMurdie, Michael J, Rosen, et al. DADA2: High-resolution sampleinference from Illumina amplicon data. Nature methods 2016.
110. Kindt R. BiodiversityR: Graphical User Interface for biodiversity and community ecology analysis. Rpackage version 2.3 (2013-01-31). 2014.
111. Langille MGI, Zaneveld J, Caporaso JG, Mcdonald D, Knights D, Reyes JA, et al. Predictive functionalpro�ling of microbial communities using 16S rRNA marker gene sequences. Nature Biotechnology2013;31:814-21.
112. Evans A, Bridgewater B, Liu Q, Mitchell MW, Miller L. High Resolution Mass Spectrometry ImprovesData Quantity and Quality as Compared to Unit Mass Resolution Mass Spectrometry in High-Throughput Pro�ling Metabolomics. Metabolomics 2014;4.
113. Jonas Z, Jackson MA, Gabi K, Massimo M, Tao L, Amalio T, et al. The fecal metabolome as afunctional readout of the gut microbiome. Nature Genetics 2018;50:790-5.
114. Cui L, Lee YH, Kumar Y, Xu F, Lu K, Ooi EE, et al. Serum metabolome and lipidome changes in adultpatients with primary dengue infection. PLoS neglected tropical diseases 2013;7:e2373.
115. Bar N, Korem T, Weissbrod O, Zeevi D, Segal E. A reference map of potential determinants for thehuman serum metabolome. Nature 2020;588:135-40.
11�. Wold V, Antti H, Lindgren F, Öhman J. Orthogonal signal correction of near-infrared spectra.Chemometrics and Intelligent Laboratory Systems 1998.
117. Chen J, Zhao X, Fritsche J, Yin P, Schmitt-Kopplin P, Wang W, et al. Practical approach for theidenti�cation and isomer elucidation of biomarkers detected in a metabonomic study for thediscovery of individuals at risk for diabetes by integrating the chromatographic and massspectrometric information. Analytical Chemistry 2008;80:1280-9.
11�. Lazar AG, Romanciuc F, Socaciu MA, Socaciu C. Bioinformatics Tools for Metabolomic DataProcessing and Analysis Using Untargeted Liquid Chromatography Coupled With Mass Spectrometry.Bulletin of University of Agricultural Sciences & Veterinary Medicine Cluj Napoca Animal Science &Biotechnologies 2015;72.
Figures
Page 25/31
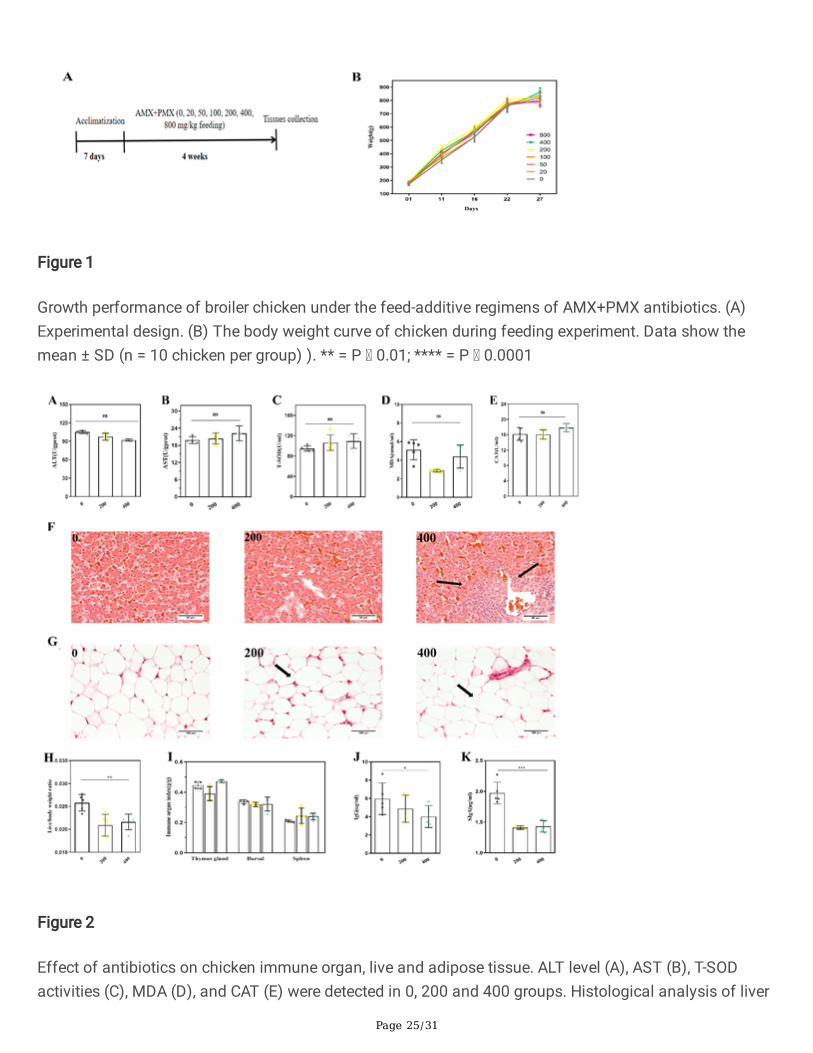
Figure 1
Growth performance of broiler chicken under the feed-additive regimens of AMX+PMX antibiotics. (A)Experimental design. (B) The body weight curve of chicken during feeding experiment. Data show themean ± SD (n = 10 chicken per group) ). ** = P 0.01; **** = P 0.0001
Figure 2
Effect of antibiotics on chicken immune organ, live and adipose tissue. ALT level (A), AST (B), T-SODactivities (C), MDA (D), and CAT (E) were detected in 0, 200 and 400 groups. Histological analysis of liver

Page 26/31
(F) and adipocyte (G) under a microscope has been shown. (H) Comparison of three immune organindexes from the thymus gland, bursa, and spleen. (I, J) Comparison of serum IgG and intestinal SIgAlevels among the three groups. (K) Liver/body weight mass ratio in different groups. For A–E and H-Kvalues are expressed as the mean ± SD (n = 5). For F–G, n = 3. Statistical analyses were conducted usingthe one-way ANOVA. *p < 0.05, **p < 0.01, ***p < 0.001, ****p < 0.0001; ns: not signi�cant.
Figure 3
Effects of AMX+PMX antibiotics treatment on gut microbiota of chicken. (A-D) The number of gutmicrobes in feces determined by QRT-PCR on day 1, 9, 16 and 23. (E) The proportion of gut microbes inthe colon determined by RT-PCR on day 35th. (F) Bacterial diversity as assessed by the Shannon index.(G) Scatter plot of the principal coordinate analysis (PCoA) scores depicting variance in broiler intestinal

Page 27/31
micro�ora. (H) The Firmicutes/Bacteroidetes ratio in the different groups. (I) Comparison of phylumrelative abundance in different groups. (J) The relative abundance of the most abundant bacteria generain the four groups. Different colors indicate the biomarkers identi�ed in different groups. Bars show themean ± SD (n = 5 chicken per group). **=P 0.01; **** =P 0.0001.
Figure 4
Microbiome metabolome of chicken feces. (A) PCA of all groups based on metabolomics data. (B)Drawing of evolutionary tree based on sample normalization abundance. (C) KEGG analysis ofmetabolites according to the selected differential metabolites and KEGG annotation ID. The abscissa isthe proportion of metabolites and the ordinate is the pathway. The red the dot is the P value, and the sizeof the dot is the mount of metabolites. (D) Tryptophan metabolism pathway illustration using KEGG. Thered dot is showed the site of different substances.

Page 28/31
Figure 5
Network revealed the role of antibiotic and bacterial metabolomic correlation in intestinal microbiota.

Page 29/31
Figure 6
Metabolic alterations observed in fecal samples. (A) D L-(-)-Threonine, L-Phenylalanine, 5-Hydroxy-DL-tryptophan, Fructoselysine. (B)DL-Lysine. (C) L-Isoleucine. (D) Valine. (E) Amidinoproline. (F) N6-Capryloyllysine, dihydroxyphenylalanine, hydroxylysine, kynurenine. (G) Indole. (H) Dimethyl 22'-azobis(2-methylpropionate). (I) Threonylphenylalanine, Carbobenzoxyglycylphenylalanine. (J) 2-methylhippuricacid, methylhippuric acid. (K) tyramine sulfate, 3-(2-Acetamidoethyl)-1H-indol-5-yl hydrogen sulfate. (L)Adrenaline. (M) Hexoprenaline. (N) Kinetin. (O) 6-Aminooctahydro-1-indolizinyl acetate, methyl 2-[(2-methoxy-2-oxoethyl) amino] acetate, hydrocortisone butyrate (JP15/USP). (P) Tryptophan. (Q)Tryptophan/kynurenine. Bars show the mean ± SEM (n = 4 chicken per group). **=P 0.01; **** =P 0.0001.
Page 30/31
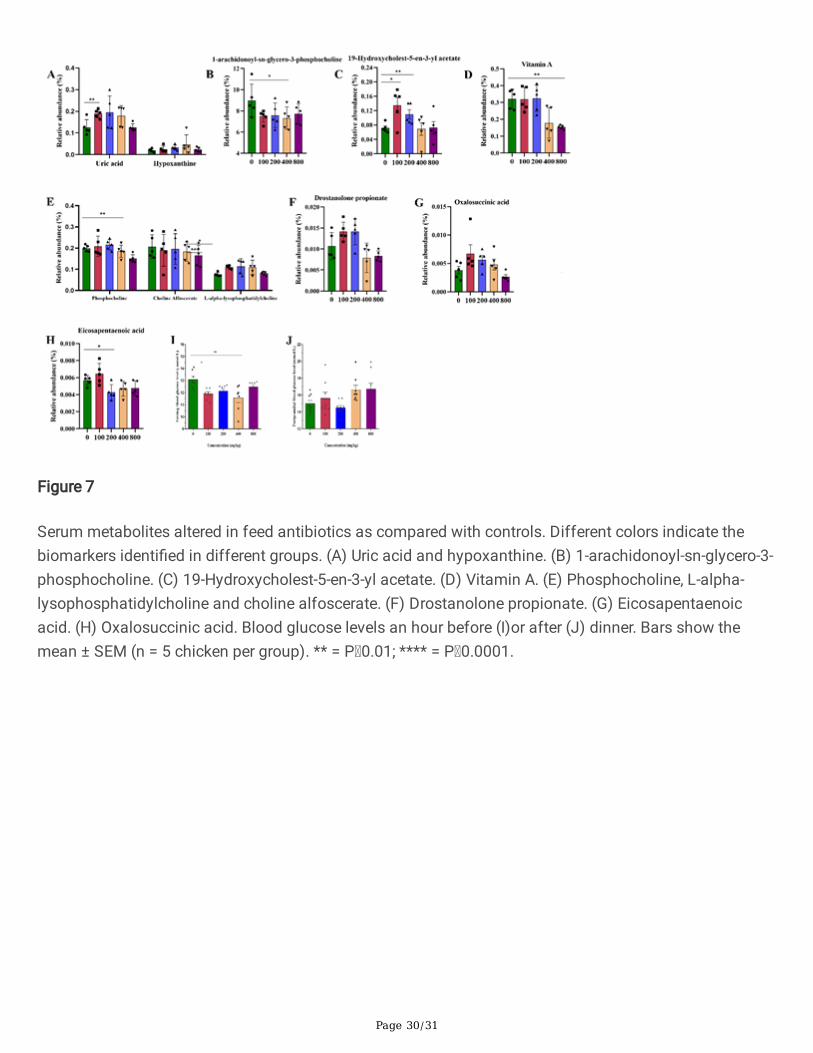
Figure 7
Serum metabolites altered in feed antibiotics as compared with controls. Different colors indicate thebiomarkers identi�ed in different groups. (A) Uric acid and hypoxanthine. (B) 1-arachidonoyl-sn-glycero-3-phosphocholine. (C) 19-Hydroxycholest-5-en-3-yl acetate. (D) Vitamin A. (E) Phosphocholine, L-alpha-lysophosphatidylcholine and choline alfoscerate. (F) Drostanolone propionate. (G) Eicosapentaenoicacid. (H) Oxalosuccinic acid. Blood glucose levels an hour before (I)or after (J) dinner. Bars show themean ± SEM (n = 5 chicken per group). ** = P 0.01; **** = P 0.0001.
Page 31/31
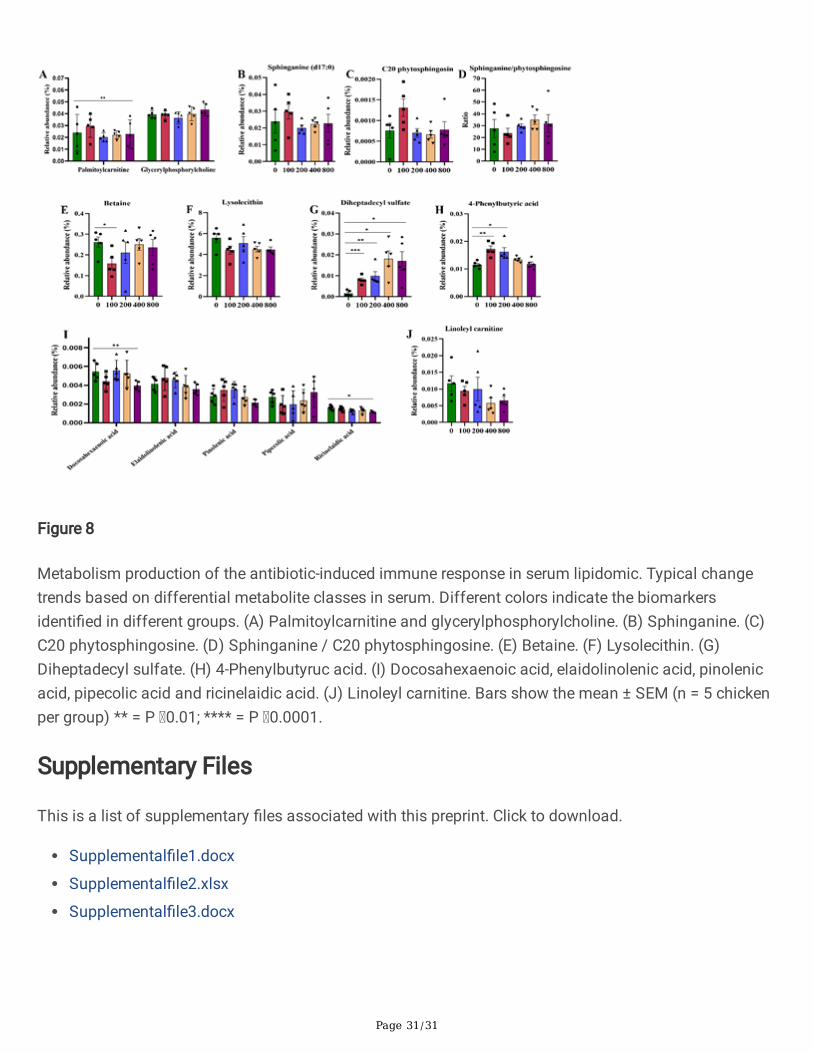
Figure 8
Metabolism production of the antibiotic-induced immune response in serum lipidomic. Typical changetrends based on differential metabolite classes in serum. Different colors indicate the biomarkersidenti�ed in different groups. (A) Palmitoylcarnitine and glycerylphosphorylcholine. (B) Sphinganine. (C)C20 phytosphingosine. (D) Sphinganine / C20 phytosphingosine. (E) Betaine. (F) Lysolecithin. (G)Diheptadecyl sulfate. (H) 4-Phenylbutyruc acid. (I) Docosahexaenoic acid, elaidolinolenic acid, pinolenicacid, pipecolic acid and ricinelaidic acid. (J) Linoleyl carnitine. Bars show the mean ± SEM (n = 5 chickenper group) ** = P 0.01; **** = P 0.0001.
Supplementary Files
This is a list of supplementary �les associated with this preprint. Click to download.
Supplemental�le1.docx
Supplemental�le2.xlsx
Supplemental�le3.docx