Chickasaw National Recreation Area, 2012psu.sesrc.wsu.edu/vsp/economics/251_CHIC_MGM2.pdf ·...
34
National Park Service U.S. Department of the Interior Natural Resource Stewardship and Science Impacts of Visitor Spending on the Local Economy Chickasaw National Recreation Area, 2012 Natural Resource Report NPS/NRSS/EQD/NRR—2013/666
Transcript of Chickasaw National Recreation Area, 2012psu.sesrc.wsu.edu/vsp/economics/251_CHIC_MGM2.pdf ·...

National Park Service U.S. Department of the Interior
Natural Resource Stewardship and Science
Impacts of Visitor Spending on the Local Economy Chickasaw National Recreation Area, 2012
Natural Resource Report NPS/NRSS/EQD/NRR—2013/666

ON THE COVER Travertine Creek at Chickasaw National Recreation Area Photograph by Park Studies Unit staff

Impacts of Visitor Spending on the Local Economy Chickasaw National Recreation Area, 2012
Natural Resource Report NPS/NRSS/EQD/NRR—2013/666
Philip S. Cook Visitor Services Project Park Studies Unit University of Idaho Moscow, ID 83844-1139
June 2013
U.S. Department of the Interior National Park Service Natural Resource Stewardship and Science Fort Collins, Colorado

ii
The National Park Service, Natural Resource Stewardship and Science office in Fort Collins, Colorado, publishes a range of reports that address natural resource topics. These reports are of interest and applicability to a broad audience in the National Park Service and others in natural resource management, including scientists, conservation and environmental constituencies, and the public.
The Natural Resource Report Series is used to disseminate high-priority, current natural resource management information with managerial application. The series targets a general, diverse audience, and may contain NPS policy considerations or address sensitive issues of management applicability.
All manuscripts in the series receive the appropriate level of peer review to ensure that the information is scientifically credible, technically accurate, appropriately written for the intended audience, and designed and published in a professional manner.
Data in this report were collected and analyzed using methods based on established, peer-reviewed protocols and were analyzed and interpreted within the guidelines of the protocols.
Views, statements, findings, conclusions, recommendations, and data in this report do not necessarily reflect views and policies of the National Park Service, U.S. Department of the Interior. Mention of trade names or commercial products does not constitute endorsement or recommendation for use by the U.S. Government.
This report is available from the Social Science Division (http://www.nature.nps.gov/ socialscience/index.cfm) and the Natural Resource Publications Management website (http://www.nature.nps.gov/publications/nrpm/).
This report and other reports by the Visitor Services Project (VSP) are available from the VSP website (http://www.psu.uidaho.edu/c5/vsp/vsp-reports/) or by contacting the VSP office at (208) 885-7863.
Please cite this publication as:
Cook, P. S. 2013. Impacts of visitor spending on the local economy: Chickasaw National Recreation Area, 2012. Natural Resource Report NPS/NRSS/EQD/NRR—2013/666. National Park Service, Fort Collins, Colorado.
NPS 107/121235, June 2013

iii
Contents
Page
Figures............................................................................................................................................. v
Tables .............................................................................................................................................. v
Appendices ...................................................................................................................................... v
Executive Summary ...................................................................................................................... vii
Acknowledgments........................................................................................................................ viii
Introduction ..................................................................................................................................... 1
Methods........................................................................................................................................... 3
Results ............................................................................................................................................. 5
Visits ........................................................................................................................................ 5
Visitor Spending ...................................................................................................................... 6
Economic Impacts of Visitor Spending ................................................................................... 9
Impacts of All Visitor Spending ......................................................................................... 9
Impacts of Visitor Spending Attributed to the Park.......................................................... 10
Economic Impacts of the NPS Park Payroll .......................................................................... 11
Combined Economic Impacts ................................................................................................ 11
Study Limitations and Errors ........................................................................................................ 13
Literature Cited ............................................................................................................................. 15


v
Figures Page
Figure 1. Chickasaw NRA visitor spending by category ............................................................... 8
Tables
Page
Table 1. Recreation visits and overnight stays, Chickasaw NRA, 2012. ....................................... 1
Table 2. Selected visit/trip characteristics by segment, 2012 ........................................................ 5
Table 3. Recreation visits and visitor group trips by segment, 2012 ............................................. 5
Table 4. Average spending by segment (dollars per visitor group per trip) ................................... 6
Table 5. Average spending per night for visitor groups on overnight trips (dollars per visitor group per night) ................................................................................................................... 7
Table 6. Total visitor spending by segment, 2012 (thousands of dollars) ..................................... 7
Table 7. Total spending attributed to park visits, 2012 (thousands of dollars) .............................. 8
Table 8. Impacts of all visitor spending on the local economy, 2012 .......................................... 10
Table 9. Economic impacts of visitor spending attributed to the park, 2012 ............................... 11
Appendices
Page
Appendix A: Glossary................................................................................................................... 17
Appendix B: Expenditure Sector Assignments ............................................................................. 19
Appendix C: Economic Ratios and Multipliers ............................................................................ 21


vii
Executive Summary
Chickasaw National Recreation Area hosted 1,656,240 recreation visits in 2012. Adjustments for visitor group size and re-entries resulted in 315,174 visitor group trips to the park in 2012. Based on a 2012 Visitor Services Project survey conducted June12–18, 83% of these visitor group trips were made by local residents or non-locals on day trips, not including an overnight stay within 50 miles of the park.1 Four percent of visitor group trips involved an overnight stay in a lodge, hotel, motel, cabin, B&Bs, etc. in the local area, and 3% were overnight camping stays either in the park or local area. Visitors reported their group’s expenditures in the park and within 50 miles of the park. The average visitor group size was 4.1 people, and they spent an average of $70.50 in the park and local area. Total visitor spending in 2012 in the park and within 50 miles of the park was $22.2 million. The greatest proportions of expenditures were for gas and oil (34%) and groceries and takeout food (24%). Local residents accounted for 36% of total spending. Seventy-four percent of visitor groups indicated the park visit was the primary reason for their trip to the area. Counting only a portion of visitor expenses if the park visit was not the primary reason for the trip yields $12.4 million in spending attributed directly to the park. The economic impact of park visitor spending was estimated by applying the spending to an input-output model of the local economy. The local region was defined as a fourteen-county region including Murray, Carter, Johnston, Pontotoc, Garvin, Atoka, Bryan, Coal, Hughes, Love, Marshall, McClain, Pottawatomie, and Seminole counties, Oklahoma. This region roughly coincides with the 50-mile radius around the park for which expenditures were reported. Including direct and secondary effects, the $12.4 million in visitor spending attributed to the park generated $11.3 million in direct sales in the region, which supported 172 jobs. These jobs paid $3.5 million in labor income, which was part of $6.3 million in value added to the region.2 A separate study estimated impacts of the park employee payroll on the local economy in FY 2010.3 The park itself employed 76 people with a total payroll including benefits of $3.8 million. Including secondary effects, the local impacts of the park payroll in FY 2010 were $1.4 million in sales, supporting 91 jobs, $4.2 million in labor income, and $4.6 million in value added.
1 Results in this study sometimes differ from those reported in the VSP study report (Begly et al. 2013) because of the omission of cases considered to be outliers in the current analysis. See Study Limitations and Errors section. 2 Jobs include fulltime and part-time jobs. Labor income consists of wages and salaries, payroll benefits and income of sole proprietors. Value added includes labor income as well as property income (dividend, royalties, interest and rents) to area businesses and indirect business taxes (sales, property, and excise taxes). 3 Stynes (2011).
Local Economic Impacts of Chickasaw National Recreation Area Sales Jobs Labor Income Value Added Park Visitor Spending $11.3M 172 $3.5M $6.3M Park Payroll +$1.4M + 91 + $4.2M + $4.6M Park Visitor Spending + Payroll $12.7M 263 $7.7M $10.9M

viii
Acknowledgments
The author thanks Margaret Littlejohn, National Park Service Social Science Specialist, for her review of an early draft of this report.

1
Introduction
Chickasaw National Recreation Area (NRA) encompasses the former Platt National Park established in 1906 and Lake of the Arbuckles built in 1966 by the Bureau of Reclamation. The park is located in south-central Oklahoma near the town of Sulphur in Murray County. Chickasaw NRA received 1,656,240 recreation visits in 2012 including 72,363 overnight stays (Table 1).
Table 1. Recreation visits and overnight stays, Chickasaw NRA, 2012
Overnight (OVN) stays
Month Recreation
visits Tent and RV
campers Group
campers Total OVN stays January 51,944 180 0 180
February 66,029 296 139 435
March 121,594 5,197 1,548 6,745
April 99,136 2,698 1,452 4,150
May 165,133 9,696 3,056 12,752
June 196,902 11,520 3,388 14,908
July 175,871 10,601 1,796 12,397
August 112,416 4,570 2,938 7,508
September 129,252 4,040 980 5,020
October 281,963 3,180 2,328 5,508
November 195,217 1,507 1,136 2,643
December 60,783 117 0 117
Total 1,656,240 53,602 18,761 72,363
Source: NPS Public Use Statistics 2012.
The purpose of this study is to estimate the annual, local economic impacts of visitors to Chickasaw NRA in 2012. Economic impacts were measured as the direct and secondary sales, income, and jobs in the local region resulting from spending by park visitors. (See Appendix A: Glossary for definitions of terms.) A separate study previously estimated the impacts of the NPS park payroll on the local region (Stynes 2011), and those results are reported herein. Neither study estimated the economic impacts of park operations or construction spending on the local region.
The local economic region defined for this study included Murray, Carter, Johnston, Pontotoc, Garvin, Atoka, Bryan, Coal, Hughes, Love, Marshall, McClain, Pottawatomie, and Seminole counties, Oklahoma. This fourteen-county region had a population of 368,289 (USCB 2012), gross regional product of $10.5 billion (MIG, Inc. 2008), median household income of $39,857, and family poverty rate of 13.6% (USCB 2011). State and local governments, including education, were the major employers in the region (MIG, Inc. 2008), and the region experienced a 4.7% unemployment rate in 2012 (BLS 2012).

3
Methods
The economic impact estimates were produced using the Money Generation Model 2 (MGM2) (Stynes et al. 2007). The three main inputs to the model were:
1. number of visits broken down by lodging-based segments; 2. spending averages for each segment; and 3. economic multipliers for the local region.
Inputs were estimated from the Chickasaw NRA Visitor Services Project (VSP) survey data (Begly et al. 2013), National Park Service Public Use Statistics (2012), and IMPLAN input-output modeling software (MIG, Inc. 2008). The MGM2 model provides a spreadsheet template for combining park use, spending, and regional multipliers to compute changes in sales, labor income, jobs, and value added in the region. The VSP visitor survey was conducted at Chickasaw NRA from June 12–18, 2012.4 The VSP survey measured visitor demographics, activities, and travel expenditures. Questionnaires were distributed to a systematic, random sample of 687 visitor groups. Visitors returned 279 questionnaires resulting in a response rate of 40.6%. Spending and economic impact estimates for Chickasaw NRA are based in part on the 2012 VSP survey data. Visitors were asked to report expenditures inside the park and within 50 miles of the park. The local region for determining economic impact was defined as a fourteen-county area around the park including Murray, Carter, Johnston, Pontotoc, Garvin, Atoka, Bryan, Coal, Hughes, Love, Marshall, McClain, Pottawatomie, and Seminole counties, Oklahoma, which roughly coincided with the 50-mile radius for which visitor spending was reported. The MGM2 model divides visitors into segments to help explain differences in spending across distinct user groups. Five segments were established for Chickasaw NRA visitors based on reported trip characteristics and lodging expenditures:
Local: Visitors that were residents of the local region, i.e., within 50 miles of the park. Day trip: Visitors from outside the local region, that did not stay overnight in the local
region. Camping: Visitors who reported camping expenses inside the park or in the local
region.5 Motel: Visitors who reported motel expenses in the local region.6
4 Results in this study sometimes differ from those reported in the VSP study report (Begly et al. 2013) because of the omission of cases considered to be outliers in the current analysis. See Study Limitations and Errors section. 5 Only four respondents reported camping expenses in the local region outside the park. Due to the small sample size, these cases were assigned to the same segment as respondents reporting camping expenses inside the park. 6 The questionnaire asked about expenditures for “Lodge, hotel, motel, cabin, B&B, etc.” For convenience, these expenditures are referred to as “motel” in this report.

4
Other overnight (Other OVN): Non-local visitors who stayed overnight in the local region, but did not report any lodging expenses. This segment included visitors who stayed in private homes, with friends or relatives, or in other unpaid lodging.7
The VSP survey data were used to estimate the percentage of visitors from each segment as well as spending averages, lengths of stay, and visitor group sizes for each segment.
7 Visitors reporting multiple lodging types and expenditures were classified based on the greatest reported lodging expense. Some visitors listing motels or campgrounds as lodging types did not report any lodging expenses and were classified in the other overnight (Other OVN) category.

5
Results
Visits
Based on VSP survey data, 70% of park entries were classified as day visits by either residents or visitors from outside the region, and the remaining 30% were classified as overnight visits including an overnight stay in the local region (Table 2). The average visitor group size ranged from 3.7 to 4.8 people across the five segments with an average visitor group of 4.1 people.8 The average length of stay in the local region on overnight trips was 2.2 nights. Seventy-four percent of visitor groups indicated that visiting the park was the primary reason for their trip to the area.
Table 2. Selected visit/trip characteristics by segment, 2012
Characteristic
Segment
Local Day trip Camping Motel Other OVN
All visitors
Visitor segment share (park entries) 40% 30% 6% 5% 19% 100%
Average visitor group size 3.7 3.8 4.8 3.9 4.4 4.1
Length of stay (days or nights) 1.0 1.0 2.4 1.5 2.3 2.2
Re-entry rate (park entries per trip) 1.2 1.2 2.2 1.6 2.3 1.5
Percent primary purpose trips 100% 55% 86% 57% 40% 74%
The 1,656,240 recreation visits in 2012 were allocated to the five segments using the visit segment shares in Table 2. Because spending was reported for the stay in the area, recreation visits were converted to visitor group trips to the area by dividing recreation visits by the average number of times each visitor entered the park during their stay and the average visitor group size. The 1,656,240 recreation visits represented 315,174 visitor group trips (Table 3).
Table 3. Recreation visits and visitor group trips by segment, 2012
Measure
Segment
Local Day trip Camping Motel Other OVN All visitors
Recreation visits 662,496 496,872 99,374 82,812 314,686 1,656,240
Visitor group trips 151,957 109,188 9,571 12,867 31,592 315,174
Percent of visitor group trips 48% 35% 3% 4% 10% 100%
8 Visitor group size reported herein is based on the number of people covered by expenditures reported in the VSP survey.
6
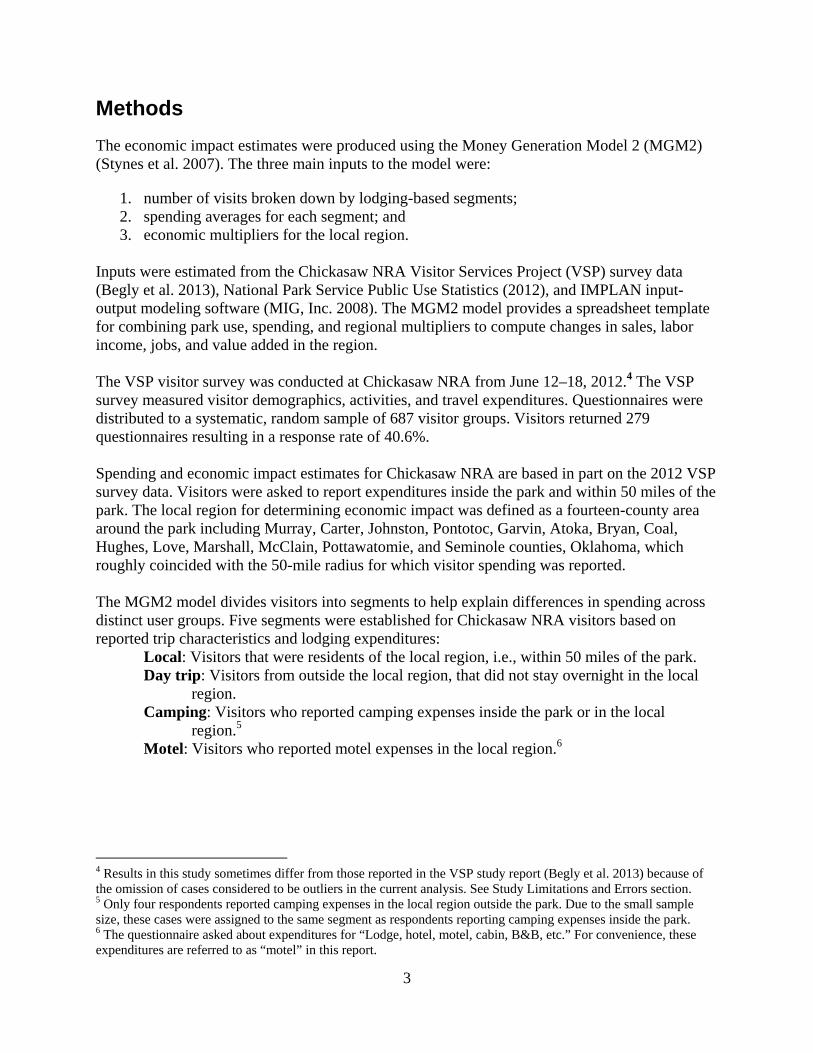
Visitor Spending
The VSP survey collected data about expenditures of visitor groups inside the park and within 50 miles of the park.9 Spending averages were computed on a visitor group trip basis for each segment. The average visitor group spent $70.50 on the trip, including expenditures inside the park and within 50 miles of the park (Table 4). On a visitor group trip basis, average spending was $52.94 for day trips by local residents and $39.97 for day trips by non-local visitors. Visitor groups staying in motels spent an average of $484.43 on their trips, and those camping spent an average of $156.73 on their trips. Visitor groups spent about 90% of their total spending outside the park.
Table 4. Average spending by segment (dollars per visitor group per trip)
Expenditures
Segment
Local Day trip Camping Motel Other OVN All
visitors*
Inside Park
Camping fees 0.00 0.00 44.57 0.00 0.00 1.35
Restaurants & bars 0.92 1.50 2.40 19.67 0.00 1.84
Groceries 1.66 0.00 11.44 13.11 1.34 1.82
Admission & fees 1.51 0.95 1.58 1.97 0.78 1.27
Souvenirs & other expenses 0.14 1.19 3.25 3.03 0.00 0.70
Total Inside Park 4.24 3.65 63.24 37.79 2.12 6.98
Outside Park
Motels 0.00 0.00 0.00 259.84 0.00 10.61
Camping fees 0.00 0.00 2.64 0.00 0.00 0.08
Restaurants & bars 6.31 12.08 10.54 52.46 7.97 10.49
Groceries & takeout food 15.21 5.97 42.10 45.49 26.80 15.22
Gas & oil 25.79 17.22 30.20 67.62 21.23 24.21
Local transportation 0.00 0.00 2.06 0.00 0.00 0.06
Admission & fees 0.65 0.50 0.60 3.61 3.86 1.04
Souvenirs & other expenses 0.74 0.55 5.35 17.62 3.83 1.81
Total Outside Park 48.70 36.33 93.50 446.64 63.70 63.52
Total Inside & Outside Park 52.94 39.97 156.73 484.43 65.82 70.50 *Weighted by percent visitor group trips.
The relative standard error at a 95% confidence level for the overall spending average was 20%. A 95% confidence interval for the overall visitor group spending average was therefore $70.50 plus or minus $14.22 or between $56.28 and $84.72.
On a per night basis, visitor groups staying in motels spent $322.95 in the local region, and campers spent $66.61 (Table 5). The average reported per-night lodging expense was $173.22 for motels and $20.06 for camping fees.
9 Some expenditure categories in the VSP questionnaire were combined for reporting herein and MGM2 analysis. See Appendix B.

7
Table 5. Average spending per night for visitor groups on overnight trips (dollars per visitor group per night)
Expenditures
Segment
Camping Motel Other OVN Motels 0.00 173.22 0.00
Camping fees 20.06 0.00 0.00
Restaurants & bars 5.50 48.09 3.46
Groceries & takeout food 22.75 39.07 12.23
Gas & oil 12.84 45.08 9.23
Local transportation 0.87 0.00 0.00
Admission & fees 0.93 3.72 2.02
Souvenirs & other expenses 3.66 13.77 1.67 Total per visitor group per night 66.61 322.95 28.62
Total spending was estimated by multiplying the number of visitor group trips for each segment by the average spending per trip and summing across segments. Chickasaw NRA visitors spent a total of $22.2 million in the local region in 2012 (Table 6). Local residents accounted for 36% of the total spending, and visitors who stayed in motels accounted for 28%. Gas and oil expenses represented 34% of total spending and groceries and takeout food expenses represented 24% (Figure 1).
Table 6. Total visitor spending by segment, 2012 (thousands of dollars)
Expenditures
Segment
Local Day trip Camping Motel Other OVN
All visitors
Inside Park Camping fees 0 0 427 0 0 427 Restaurants & bars 140 164 23 253 0 580 Groceries & takeout food 252 0 109 169 42 573 Admission & fees 230 104 15 25 25 399 Souvenirs & other expenses 21 130 31 39 0 221 Total Inside Park 644 398 605 486 67 2,200 Outside Park Motels 0 0 0 3,343 0 3,343 Camping fees 0 0 25 0 0 25 Restaurants & bars 959 1,318 101 675 252 3,305 Groceries & takeout food 2,311 652 403 585 847 4,798 Gas & oil 3,920 1,881 289 870 671 7,630 Local transportation 0 0 20 0 0 20 Admission & fees 98 55 6 46 122 327 Souvenirs & other expenses 112 60 51 227 121 571
Total Outside Park 7,400 3,966 895 5,747 2,012 20,020
Total Inside & Outside Park 8,044 4,364 1,500 6,233 2,079 22,220 Segment Percent of Total 36% 20% 7% 28% 9% 100%

8
Figure 1. Chickasaw NRA visitor spending by category
Because visitors would come to the region whether or not the park existed, not all visitor spending can be attributed to the park. Twenty-six percent of visitor groups did not make the trip primarily to visit Chickasaw NRA. Spending directly attributed to park visits was estimated by counting all spending on trips for which the park was the primary reason for the trip. If the park was not the primary trip purpose, one night of spending was counted for overnight trips and half of the spending in the region was counted for day trips. With these assumptions, a total of $12.4 million in visitor spending was attributed to the park visit (Table 7). This represented 56% of the overall visitor spending total.
Table 7. Total spending attributed to park visits, 2012 (thousands of dollars)
Expenditures
Segment
All visitors Local Day trip Camping Motel
Other OVN
Motels 0 0 0 2,866 0 2,866 Camping fees 0 0 450 0 0 450 Restaurants & bars 140 1,188 116 832 166 2,442 Groceries & takeout food 252 506 479 670 602 2,510 Gas & oil 0 1,460 265 746 443 2,914 Local transportation 0 0 18 0 0 18 Admission & fees 230 146 20 65 105 567 Souvenirs & other expenses 21 177 78 233 80 589 Total Attributed to Park 644 3,477 1,427 5,412 1,397 12,356
Percent of Spending Attributed to the Park 8% 80% 95% 87% 67% 56%
Percent of Attributed Spending 5% 28% 12% 44% 11% 100%

9
Economic Impacts of Visitor Spending
The economic impacts of Chickasaw NRA visitor spending on the local economy were estimated by applying visitor spending to a set of economic ratios and multipliers in MGM2 representing the economy of the fourteen-county region—Murray, Carter, Johnston, Pontotoc, Garvin, Atoka, Bryan, Coal, Hughes, Love, Marshall, McClain, Pottawatomie, and Seminole counties in Oklahoma.10 Economic ratios and multipliers for the region were estimated using the Impact Analysis for Planning (IMPLAN) Professional software (version 3, MIG, Inc. 2008) with 2010 data.11 Multipliers were adjusted to 2012 based on price changes between 2010 and 2012 (see Study Limitations and Errors section below).
Not all visitor spending was counted as direct sales to the region. The amount a visitor spends for a retail good is made up of the cost of the good from the producer, a markup by a wholesaler, and a markup by a retailer. In MGM2, retail and wholesale margins for grocery & takeout food, gas & oil, and souvenirs & other expenses were applied to visitor spending to account for mark-ups by retailers and wholesalers. The retail margins for the three sectors were 25.3%, 22.3%, and 50.0%, respectively, and the wholesale margins were 12.3%, 8.3%, and 11.4%. In addition, regional purchase coefficients from IMPLAN for all sectors were used to account for the proportion of demand within the region satisfied by imports into the region.
The tourism output sales multiplier for the region is 1.38. Every dollar of direct sales to visitors generated another $0.38 in secondary sales through indirect and induced effects.12 (See Appendix A: Glossary for further explanation of terms.)
The economic impacts to the local region are presented in two ways: (1) based on all visitor spending and (2) based only on visitor spending attributable to the park. The first estimate— including all visitor spending—shows the overall contribution park visitors make to the local region. The second estimate—including only visitor spending attributable to the park—shows the impact or contribution the park makes to the economy of the local region.
Impacts of All Visitor Spending
Using all visitor spending and including direct and secondary effects, the $22.2 million spent by park visitors generated $17.2 million in sales, which supported 261 jobs in the local region (Table 8). These jobs paid $5.5 million in labor income, which was part of $9.8 million in value added to the region.13
10 Economic ratios convert between various economic measures, e.g., direct spending to the directly associated jobs, labor income, and value added in each sector. Economic multipliers capture the secondary effects of economic measures. 11 See Appendix C: Economic Ratios and Multipliers for the region. 12 Indirect effects result from tourism businesses buying goods and services from local firms, while induced effects stem from household spending of income earned from visitor spending. 13 Jobs include full and part time jobs. Labor income consists of wages and salaries, payroll benefits and income of sole proprietors. Value added includes labor income as well as profits and rents to area businesses and sales and excise taxes.

10
Table 8. Impacts of all visitor spending on the local economy, 2012
Sector/Expenditure category
Sales (thousands of
dollars) Jobs
Labor Income (thousands of
dollars)
Value Added (thousands of
dollars) Direct Effects
Motels 3,343 50 842 1,713 Camping fees 452 6 145 200 Restaurants & bars 3,885 77 1,296 2,033 Groceries & takeout food 1,359 26 663 980 Gas & oil 1,702 27 627 1,154 Local transportation 20 1 11 14 Admission & fees 726 16 216 430 Souvenirs & other expenses 396 7 200 306 Wholesale trade 512 4 191 385 Local production of goods14 68 0 3 25 Total Direct Effects 12,463 215 4,194 7,241 Secondary Effects 4,688 47 1,347 2,580
Total Effects 17,151 261 5,541 9,821
Note: Impacts of $22.2 million in visitor spending reported in Table 6. Totals may not equal sum of individual categories due to rounding.
Value added is the preferred measure of the contribution of visitors to the local economy as it includes all sources of income to the area—payroll benefits to workers, profits and rents to businesses, and sales and other indirect business taxes that accrue to government units. Value added impacts are also comparable to Gross Regional Product, the broadest measure of total economic activity in a region. The largest direct effects are in restaurants & bars and motels.
Impacts of Visitor Spending Attributed to the Park
Using only visitor spending attributable to the park by including only some spending on trips where the primary trip purpose was not to visit Chickasaw NRA reduced the overall impacts by about 34% (Table 9; see spending inclusion assumptions in previous section). Including direct and secondary effects, the $12.4 million spent by park visitors and attributable to the park generated $11.3 million in sales, which supported 172 jobs in the local region. These jobs paid $3.5 million in labor income, which was part of $6.3 million in value added to the region.
14 Although the impacts for “local production of goods” may appear low compared to visitor spending for the categories grocery & takeout food, gas & oil, and souvenirs & other expenses, they reflect the retail and wholesale margins in MGM2 described on the previous page (p. 9, paragraph 2). In addition, the regional purchase coefficients—the proportions of local demand supplied by local producers—for the manufacturing sectors associated with those expenditure categories are low, ranging from 1.1 to 2.8 percent. In other words, most of the dollars spent locally by visitors on retail items are not spent on items made locally.

11
Table 9. Economic impacts of visitor spending attributed to the park, 2012
Sector/Expenditure category
Sales (thousands of
dollars) Jobs
Labor Income (thousands of
dollars)
Value Added (thousands of
dollars) Direct Effects
Motels 2,866 43 722 1,468
Camping fees 450 6 144 199
Restaurants & bars 2,442 48 814 1,278 Groceries & takeout food 635 12 310 458 Gas & oil 650 10 239 441 Local transportation 18 1 10 13 Admission & fees 567 13 169 336 Souvenirs & other expenses 295 6 149 227 Wholesale trade 229 2 85 172 Local production of goods15 29 0 2 11 Total Direct Effects 8,179 141 2,644 4,603 Secondary Effects 3,108 31 895 1,708
Total Effects 11,287 172 3,540 6,311
Note: Impacts of $12.4 million in visitor spending attributed to park reported in Table 7. Totals may not equal sum of individual categories due to rounding.
Economic Impacts of the NPS Park Payroll
In addition to visitor spending, spending by park employees also impacts the local region. For FY 2010, a separate study estimated the impacts of park payroll by applying economic multipliers to wage and salary data to capture the induced effects of NPS employee spending on local economies (Stynes 2011). Chickasaw NRA itself employed 76 people in FY 2010 with a total payroll including benefits of $3.8 million.16 Including secondary effects, the local impacts of the park payroll in FY 2010 were $1.4 million in sales, 91 jobs, $4.2 million in labor income, and $4.6 million value added (Stynes 2011).
Combined Economic Impacts
The combined impacts to the region of visitor spending attributable to the park and NPS payroll were $12.7 million in sales, which supported 263 jobs with labor income of $7.7 million, which was part of a total value added of $10.9 million.
15 See footnote 14. 16 Stynes (2011) described his method for estimating park employment as follows: “The number of employees for each park was estimated by totaling the number of distinct social security numbers in each pay period and dividing by the number of pay periods. The figure is therefore an annual average. Four seasonal jobs for three months count as one job. No distinction is made between part-time and full-time employees. Jobs, salary, and payroll benefits are assigned to the park where the employee’s time was charged, which may differ from their duty station” (p. 11).

13
Study Limitations and Errors
The accuracy of the MGM2 estimates rests on the accuracy of three inputs: visits, spending averages, and multipliers. Visits were taken from NPS Public Use Statistics (2012). Recreation visit estimates rely on counting procedures at the park, which may miss some visitors and count others more than once during their visit. Re-entry rates are important to adjust the park visit counts to reflect the number of visitor group trips to the region rather than park entries. Re-entry rates were based on visitor responses to a VSP survey question about the number of entries they made into the park.
Spending averages outside the park were derived from the 2012 Chickasaw NRA VSP survey data (Begly et al. 2013). Estimates from the survey are subject to sampling errors, measurement errors, and potential seasonal biases. The overall spending average is subject to sampling error of 20%.
Spending averages are also sensitive to decisions about outliers and treatment of missing data. In order to estimate spending averages, incomplete spending data were filled with zeros. Visitor groups of more than 10 people (14 cases), visiting the local region for more than 12 nights (4 cases), or spending greater than $1,050 (the mean plus two times the standard deviation of the mean for spending, 8 cases) were omitted from the analysis. These are conservative assumptions about outliers and likely result in conservative estimates of economic impacts.
The sample only covers visitors during a week in June. To extrapolate to annual totals, it was assumed that this sample represented visitors throughout the year.
Multipliers were derived from an input-output model of the local economy using IMPLAN (MIG, Inc. 2008). The basic assumptions of input-output models are that sectors have homogeneous, fixed and linear production functions, that prices are constant, and that there are no supply constraints. The IMPLAN system uses national average production functions for each of 440 sectors based on the NAICS system (see Appendix B, Table B2). The most recent local IMPLAN datasets available for this analysis were 2010. Local employment multipliers were updated to 2012 based on changes in consumer price indices.
Sorting out how much spending to attribute to the park when the park is not the primary reason for the trip is somewhat subjective. Because 26% of visitors to Chickasaw NRA did not make the trip primarily to visit the park and all spending occurs outside the park, adjustments for non-primary purpose trips have a significant effect on the overall spending and impact estimates.


15
Literature Cited
BLS (U.S. Bureau of Labor Statistics). 2012. Local Area Unemployment Statistics. http://www.bls.gov/lau/. Data retrieved on February 5, 2013.
Begly, A., P.S. Cook, L. Le, S.J. Hollenhorst. 2013. Chickasaw National Recreation Area Visitor Study: Summer 2012. Natural Resource Report NPS/NRSS/EQD/NRR—2013/652. National Park Service, Fort Collins, Colorado.
MIG, Inc. 2008. IMPLAN Professional Version 3.0. Minnesota IMPLAN Group: Stillwater, MN.
National Park Service Public Use Statistics Office. 2012. Visitation Database. http://www2.nature.nps.gov/stats/. Data retrieved on February 5, 2013.
Stynes, D. J. 2011. Economic Benefits to Local Communities From National Park Visitation and Payroll, 2010. Natural Resource Report NPS/NRPC/SSD/NRR—2011/481. National Park Service, Fort Collins, Colorado.
Stynes, D. J., D.B. Propst, W. Chang, and Y. Sun. 2007. NPS Money Generation Model – Version 2 (MGM2). http://mgm2impact.com. (with price indices updated thru 2012).
USCB (U.S. Census Bureau). 2012. 2010 Decennial Census. http://www.factfinder2.census.gov/. Data retrieved on February 5, 2013.
USCB (U.S. Census Bureau). 2011. 2007-2011 American Community Survey 5-Year Estimates. http://www.factfinder2.census.gov/. Data retrieved on February 5, 2013.

17
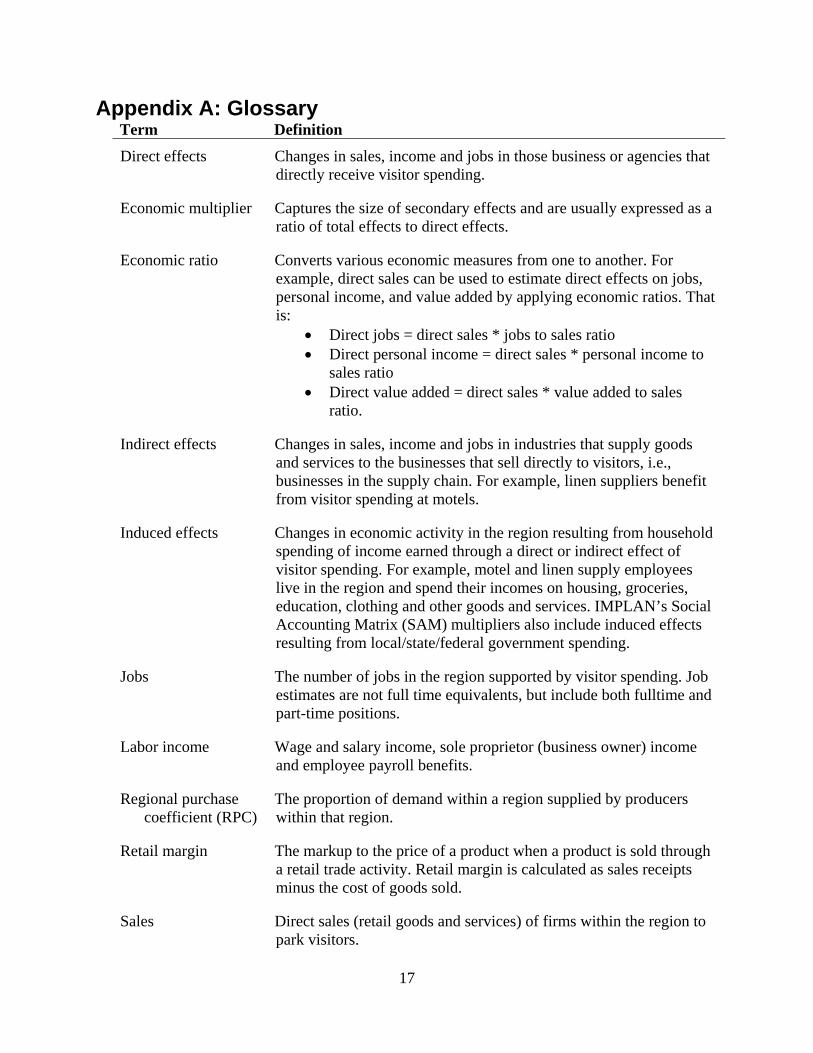
Appendix A: Glossary Term Definition
Direct effects
Changes in sales, income and jobs in those business or agencies that directly receive visitor spending.
Economic multiplier Captures the size of secondary effects and are usually expressed as a ratio of total effects to direct effects.
Economic ratio Converts various economic measures from one to another. For example, direct sales can be used to estimate direct effects on jobs, personal income, and value added by applying economic ratios. That is:
Direct jobs = direct sales * jobs to sales ratio Direct personal income = direct sales * personal income to
sales ratio Direct value added = direct sales * value added to sales
ratio.
Indirect effects
Changes in sales, income and jobs in industries that supply goods and services to the businesses that sell directly to visitors, i.e., businesses in the supply chain. For example, linen suppliers benefit from visitor spending at motels.
Induced effects
Changes in economic activity in the region resulting from household spending of income earned through a direct or indirect effect of visitor spending. For example, motel and linen supply employees live in the region and spend their incomes on housing, groceries, education, clothing and other goods and services. IMPLAN’s Social Accounting Matrix (SAM) multipliers also include induced effects resulting from local/state/federal government spending.
Jobs
The number of jobs in the region supported by visitor spending. Job estimates are not full time equivalents, but include both fulltime and part-time positions.
Labor income
Wage and salary income, sole proprietor (business owner) income and employee payroll benefits.
Regional purchase coefficient (RPC)
The proportion of demand within a region supplied by producers within that region.
Retail margin The markup to the price of a product when a product is sold through a retail trade activity. Retail margin is calculated as sales receipts minus the cost of goods sold.
Sales Direct sales (retail goods and services) of firms within the region to park visitors.
18
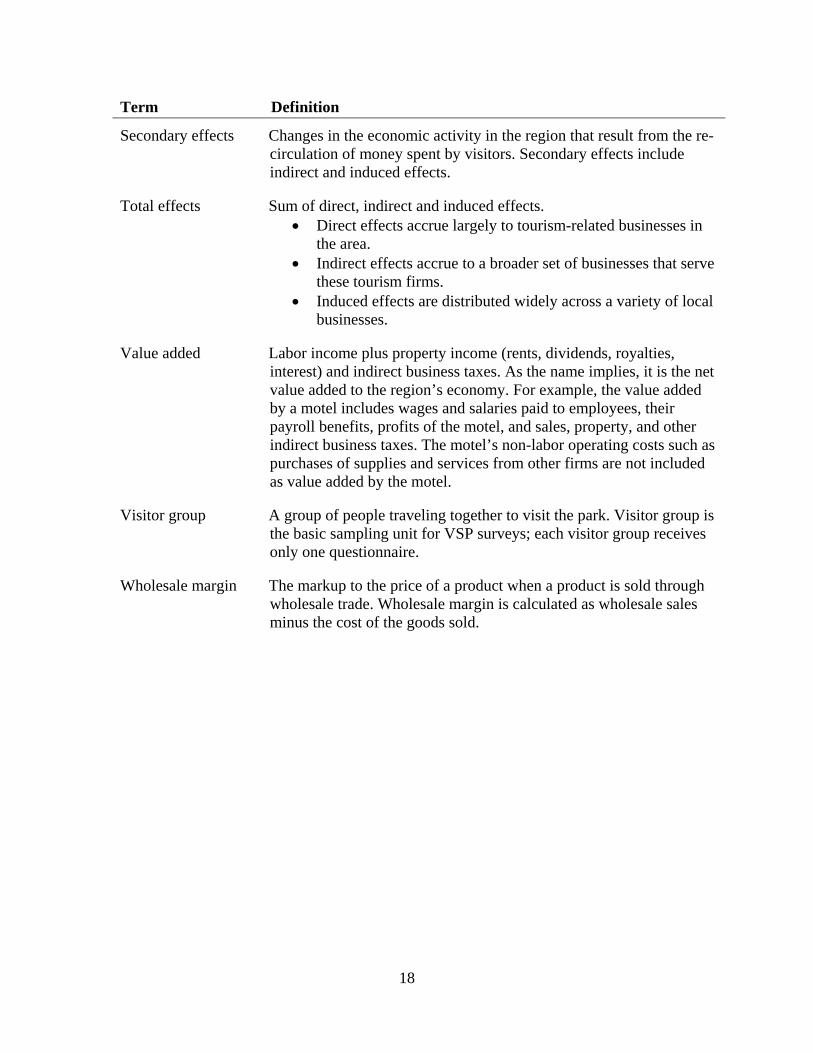
Term Definition
Secondary effects
Changes in the economic activity in the region that result from the re-circulation of money spent by visitors. Secondary effects include indirect and induced effects.
Total effects
Sum of direct, indirect and induced effects. Direct effects accrue largely to tourism-related businesses in
the area. Indirect effects accrue to a broader set of businesses that serve
these tourism firms. Induced effects are distributed widely across a variety of local
businesses.
Value added
Labor income plus property income (rents, dividends, royalties, interest) and indirect business taxes. As the name implies, it is the net value added to the region’s economy. For example, the value added by a motel includes wages and salaries paid to employees, their payroll benefits, profits of the motel, and sales, property, and other indirect business taxes. The motel’s non-labor operating costs such as purchases of supplies and services from other firms are not included as value added by the motel.
Visitor group A group of people traveling together to visit the park. Visitor group is the basic sampling unit for VSP surveys; each visitor group receives only one questionnaire.
Wholesale margin The markup to the price of a product when a product is sold through wholesale trade. Wholesale margin is calculated as wholesale sales minus the cost of the goods sold.

19
Appendix B: Expenditure Sector Assignments
Table B1 shows expenditure categories visitors were asked to estimate in the Chickasaw NRA VSP questionnaire. Some expenditure categories were combined and renamed for MGM2 analysis.
Table B1. Expenditure categories in Chickasaw NRA questionnaire and MGM2 sector assignment
Questionnaire expenditure categories Inside park
Outside park MGM2 sector
Lodge, hotel, motel, cabin, B&B, etc. X Motels
Camping fees and charges X X Camping fees
Guide fees and charges X Admissions & fees
Restaurants and bars X X Restaurants & bars
Groceries and takeout food X X Groceries & takeout food
Gas and oil (auto, RV, boat, etc.) X Gas & oil Other transportation expenses (rental cars,
taxis, auto repairs, but NOT airfare) X Local transportation
Boat, kayak, canoe rental & launch fees X X Admissions & fees
Admission, recreation, entertainment fees X X Admissions & fees All other expenditures (souvenirs, books,
post cards, sporting goods, clothing, donations, etc.) X X Souvenirs & other expenses
X = category included in questionnaire.
MGM2 sectors names correspond to similar sector names and numbers in IMPLAN (Table B2). IMPLAN sectors also correspond to 2007 North American Industry Classification System (NAICS) sectors. Table B2. MGM2 sector correspondence to IMPLAN and 2007 NAICS sectors
MGM2 sector
IMPLAN
2007 NAICSNo. Name Motels 411 Hotels and motels, including casino hotels 72111-2
Camping fees 412 Other accommodations 72119, 7212-3
Restaurants & bars 413 Food services and drinking places 722
Groceries & takeout food 324 Retail - Food and beverage 445
Gas & oil 326 Retail - Gasoline stations 447
Local transportation 336 Transit and ground passenger transportation 485
Admissions & fees 410 Other amusement and recreation industries 71391-3, 71399 Souvenirs & other expenses 329 Retail - General merchandise 452 Local production of goods 69
88
115 311 317
All other food manufacturing Men's and boys' cut and sew apparel
manufacturing Petroleum refineries Sporting and athletic goods manufacturing All other miscellaneous manufacturing
31199
31522 32411 33992
339993, 339995, 339999
Wholesale trade 319 Wholesale trade 42
Source: IMPLAN (MIG, Inc. 2008).


21
Appendix C: Economic Ratios and Multipliers
Table C1. Economic ratios and multipliers for selected tourism-related sectors, Chickasaw NRA region, 2011
Direct effects Total effects multipliers
Sector
Jobs/ $MM sales
Income/ sales
Value added/sales Sales I
Sales SAM
Job II/ $MM sales
Income II/
sales
Value added II/
sales Motel, hotel, cabin or B&B 14.38 0.25 0.51 1.23 1.40 18.37 0.37 0.74 Camping fees 13.50 0.32 0.44 1.27 1.49 18.54 0.48 0.73 Restaurants & bars 18.83 0.33 0.52 1.15 1.35 22.22 0.44 0.73 Groceries & takeout food 17.54 0.49 0.72 1.14 1.41 21.64 0.61 0.96 Gas & oil 12.15 0.37 0.68 1.16 1.38 15.90 0.48 0.90 Local transportation 30.57 0.56 0.74 1.08 1.39 34.47 0.68 0.96 Admission & fees 21.74 0.30 0.59 1.16 1.34 25.24 0.40 0.79 Souvenirs & other expenses 17.74 0.51 0.77 1.11 1.39 21.63 0.62 1.00 Local production of goods 3.96 0.13 0.38 1.09 1.16 5.43 0.17 0.46 Wholesale trade 7.87 0.37 0.75 1.11 1.32 11.12 0.47 0.94
Source: IMPLAN (MIG, Inc. 2008), 2010 county data updated to 2012.
Explanation of table
Direct effects are economic ratios to convert sales in each sector to jobs, income and value added.
Jobs/$MM sales is jobs per million dollars in sales. Income/sales is the percentage of sales going to wages, salaries, and employee benefits. Value added/sales is the percentage of sales that is value added (Value added covers all
income, rents and profits and indirect business taxes).
Total effects are multipliers that capture the total effect relative to direct sales. Sales I captures only direct and indirect sales. Sales SAM is the SAM sales multiplier = (direct + indirect + induced sales) /direct sales. Job II/$MM sales = total jobs (direct + indirect + induced) per $ million in direct sales. Income II /sales = total income (direct + indirect + induced) per $ of direct sales. Value added II/sales = total value added (direct + indirect + induced) per $ of direct sales.
Using the motels sector row to illustrate
Direct Effects: Every million dollars in motel sector sales (i.e., short-term lodging room rentals) creates 14.4 jobs in the motel sector. Fifty-one percent of motel sector sales are value added, including 25% that goes to wages and salaries of motel employees. That means 49% of motel sector sales goes to purchase inputs by motels (e.g., linens, cleaning supplies). The wage and salary income creates the induced effects, and the 49% of sales spent on purchases by motels starts the rounds of indirect effects.
Multiplier effects: There is an additional 23 cents of indirect sales in the region for every dollar of direct motel sector sales (type I sales multiplier = 1.23). Total secondary sales are 40 cents per dollar of direct sales, which means 23 cents in indirect effects and 17 cents in induced effects.

22
An additional 4.0 jobs are created from secondary effects of each million dollars in motel sector sales (18.4 total jobs – 14.4 direct jobs per $million). These jobs are distributed across other sectors of the local economy. Similarly, the secondary effects on income for each dollar of motel sector sales are 12% (37%-25%), and the secondary effects on value added for each dollar of motel sector sales are 23% (74%-51%). Including secondary effects, every million dollars of motel sector sales in the region yields $1.40 million in sales, $370,000 in income, and $740,000 in value added.

The Department of the Interior protects and manages the nation’s natural resources and cultural heritage; provides scientific and other information about those resources; and honors its special responsibilities to American Indians, Alaska Natives, and affiliated Island Communities. NPS 107/121235, June 2013

National Park Service U.S. Department of the Interior
Natural Resource Stewardship and Science 1201 Oakridge Drive, Suite 150 Fort Collins, CO 80525 www.nature.nps.gov
EXPERIENCE YOUR AMERICA TM